Increase in the Surface Catalytic Ability by Addition of Palladium in C14 Metal Hydride Alloy


1
Department of Chemical Engineering and Materials Science, Wayne State University, Detroit, MI 48202, USA
2
BASF/Battery Materials—Ovonic, 2983 Waterview Drive, Rochester Hills, MI 48309, USA
3
Department of Mechanical Engineering, Wayne State University, Detroit, MI 48202, USA
*
Author to whom correspondence should be addressed.
Batteries 2017, 3(3), 26; https://doi.org/10.3390/batteries3030026
Submission received: 6 June 2017
/
Revised: 3 August 2017
/
Accepted: 9 August 2017
/
Published: 9 September 2017
(This article belongs to the Special Issue Nickel Metal Hydride Batteries 2017)
Abstract
:A combination of analytic tools and electrochemical testing was employed to study the contributions of Palladium (Pd) in a Zr-based AB2 metal hydride alloy (Ti12Zr22.8V10 Cr7.5Mn8.1Co7Ni32.2Al0.4). Pd enters the A-site of both the C14 and C15 Laves phases and shrinks the unit cell volumes, which results in a decrease of both gaseous phase and electrochemical hydrogen storage capacities. On the other hand, the addition of Pd benefits both the bulk transport of hydrogen and the surface electrochemical reaction. Improvements in high-rate dischargeability and low-temperature performances are solely due to an increase in surface catalytic ability. Addition of Pd also decreases the surface reactive area, but such properties can be mediated through incorporation of additional modifications with rare earth elements. A review of Pd-addition to other hydrogen storage materials is also included.
1. Introduction
Zr-based AB2 metal hydride (MH) alloy is an important research subject since it provides a possible improvement to the relatively low gravimetric energy density of nickel/metal hydride batteries [1,2]. Work regarding substitution of C14 Laves phase MH alloys started at the first row of transition metals [3,4,5,6] and proceeded to several non-transition metals (for example, Mg [7], La [8], Ce [9], and Nd [10]). Palladium (Pd), one of the two elements (the other is Vanadium (V)) with hydrogen-storage (H-storage) capabilities at room temperature (the heats of hydride formation for Pd and V are −20 [11] and −33.5 kJ·mol−1 [12], respectively), is very special among all possible substitution candidates. Pd’s ability to absorb a large volume of hydrogen was first reported more than 150 years ago by Thomas Graham in 1866 [13], which built the foundation for modern MH research work [14,15,16]. In addition to use as a pure material, Pd also participates in H-storage research in many ways, such as a main ingredient in Pd-based alloys [17,18,19,20], an additive in the form of a nanotube [21], nanoparticle [22,23,24,25], or polycrystalline powder [26,27], a component in Pd [28,29,30,31,32,33,34,35,36,37,38,39,40,41,42] and Pd-containing thin films [43,44,45,46], and an alloying ingredient [41,42,43,44,45,46,47,48,49,50,51,52,53,54,55,56,57,58,59,60,61,62,63,64,65,66,67,68,69,70,71,72,73,74,75,76,77,78,79,80,81,82,83,84,85,86,87,88,89,90,91,92,93,94,95,96,97,98,99,100,101]. The major results accomplished by incorporating Pd in MH alloys are summarized in Table 1, and consist mainly of improvements in gaseous hydrogen absorption and desorption kinetics, electrochemical discharge capacity, high-rate dischargeability (HRD), activation, and cycle life performance in several MH alloy systems, including Mg, C, A2B, AB, AB2, AB5, and body-centered-cubic solid solutions. In the two papers dealing with Pd alloyed in AB2 MH alloys, one only discussed the HRD performance [56,79] and the other one is focused on the C15-dominated MH alloy [54]. Therefore, it is important to further investigate the influences of Pd-addition to the structural, gaseous phase, electrochemical properties, and their correlations in the C14-based AB2 MH alloys.
In order to improve the electrochemical performance of C14-based MH alloy, especially at an ultra-low temperature (−40 °C), effects of Pd-incorporation were investigated. We fabricated the alloys, analyzed their microstructures with X-ray diffractometer (XRD) and scanning electron microscope (SEM) studied the gaseous phase reaction with hydrogen by pressure-concentration-temperature (PCT) isotherms, measured the electrochemical and magnetic properties, and correlated the results.
2. Experimental Setup
Arc melting under a 0.08 MPa Ar protective atmosphere was employed to prepare the sample ingots. To improve the homogeneity of the composition, the samples were flipped five times during the melting/cooling procedure. After cooling, each sample went through a hydriding/dehydriding process to created fissures and cracks to facilitate the later grinding process. The final product was a −200 mesh powder ready for the electrochemical testing. A Varian Liberty 100 inductively coupled plasma optical emission spectrometer (ICP-OES, Agilent Technologies, Santa Clara, CA, USA) was used to examine the chemical composition of each sample. For the structural analysis, a Philips X’Pert Pro XRD (Philips, Amsterdam, The Netherlands) and a JEOL-JSM6320F SEM (JEOL, Tokyo, Japan) with energy dispersive spectroscopy (EDS) were used. Since EDS analysis is only semi-qualitative in nature, results were used only for comparison purpose. For the gaseous phase H-storage study, a multi-channel PCT (Suzuki Shokan, Tokyo, Japan) was used. PCT measurements were performed at 30, 60, and 90 °C after a 2-h thermal cycle between room temperature and 300 °C under 2.5 MPa H2 pressure. Electrode and cell preparations, as well as the electrochemical measurement methods, used for the experiments in the current study were the same as the ones used in our previous studies on the AB2 MH alloys [103,104]. Electrochemical testing was performed in an open-to-air flooded cell configuration against a partially pre-charged sintered Ni(OH)2 counter electrode at room temperature. A test electrode was made by dry compacting the MH powder directly onto an expanded Ni substrate (1 cm × 1 cm) without the use of any binder or conductive powder, and the average weight of active material per electrode was approximately 50 mg. The electrolyte used for testing was 30 wt. % KOH solution. Each electrode was charged with a current of 50 mA·g−1 for 10 h and then discharged at the same rate until a cut-off voltage of 0.9 V was reached. Two more pulls at 12 and 4 mA·g−1 then followed. For the surface reaction exchange current measurement (Io), linear polarization was performed by first fully charging the system, then discharging to 50% of depth-of-discharge, and followed by scanning the current in the potential range of −20 to +20 mV of the open circuit voltage at a rate of 0.1 mV s−1. For the bulk hydrogen diffusion coefficient (D) measurement, the system in a fully charged state was polarized at 0.6 V for 7200 s. All electrochemical measurements were performed on an Arbin Instruments BT-2143 Battery Test Equipment (Arbin Instruments, College Station, TX, USA). A Solartron 1250 Frequency Response Analyzer (Solartron Analytical, Leicester, UK) with a sine wave amplitude of 10 mV and a frequency range of 0.5 mHz to 10 kHz was used to conduct the AC impedance measurements. A Digital Measurement Systems Model 880 vibrating sample magnetometer (MicroSense, Lowell, MA, USA) was used to measure the magnetic susceptibility (M.S.) of the activated alloy surface (activation was performed by immersing the sample powder in 30 wt. % KOH solution at 100 °C for 4 h).
3. Results and Discussions
3.1. Properties of Pd
Several key physical properties of Pd are compared with those of transition metal elements commonly used in AB2 MH alloys in Table 2. Pd is the heaviest among the reported elements (i.e., the highest atomic number) and thus does not have a significant weight advantage in H-storage applications. Moreover, Pd is in the same column and has the same number of outer-shell electrons as Ni (10), but it is located a row below in the periodic table (4d instead of 3d for Ni). Table 2 also shows the scarcity of Pd, which makes it very expensive, with a cost more than 2000 times higher than Ni (US$20,580 kg−1 for Pd [105] vs. US$10.4 kg−1 for Ni [106]). Furthermore, the atomic radius of Pd in the Laves phase is between those of the conventional A-site (Zr and Ti) and B-site elements (other elements in Table 2). The preferred ratio of average atomic radius of the A-site atoms to that of the B-site atoms in the Laves phase is approximately ≈ 1.225 [107]. A Laves phase alloy with Pd in the A-site must incorporate a B-site element with an atomic radius of approximately 1.242 Å (1.521/1.225), which is too small for the commonly used B-site elements (Table 2). Besides Pd has a very high electronegativity value, which indicates that Pd attracts electrons, and is expected to occupy the B-site in intermetallic compounds like other commonly used modifying elements. Therefore, a Laves phase with Pd in the A-site is unlikely to happen. The only known Pd-containing Laves phase binary alloys are CaPd2, SrPd2, and BaPd2 (all C15 structures) when alloyed with large alkaline earth elements [108,109]. It is also known that Pd, together with Cr, Mn, and Co, form a solid solution with Ni, indicating that a high solubility of Pd in Ni-based phases (TiNi and AB2 for battery application) can be expected. The heat of hydride formation (ΔHh), an indication of the metal-to-hydrogen bond strength, for Pd is slightly higher than that of V, meaning the hydride of Pd is more stable than that of V and causing the H-storage capacity of Pd to be lower than that of V (PdH0.75 [110] vs. VH). Finally, due to its superior H2 dissociative properties, Pd serves as a common catalyst in facilitating hydrogen absorption and desorption for MH alloys [111].
3.2. Chemical Composition
Six alloys (Pd0, Pd1, Pd2, Pd3, Pd4, and Pd5) with compositions of Ti12Zr22.8−xV10Cr7.5Mn8.1Co7Ni32.2Al0.4Pdx (x = 0, 1, 2, 3, 4, and 5) were prepared by arc melting within a water-cooled Cu crucible. The Pd-free Pd0 alloy was also the base alloy used previously in studies of La- [8], Ce- [9], and Nd-substituted [10] AB2 MH alloys, and was selected due to its balanced electrochemical performances with regard to capacity, rate, and cycle stability. In the composition design, Pd was assumed to occupy the A-site, due to its relatively large size (Table 2), and therefore the Zr-content was reduced to maintain the slightly hypo-stoichiometry (B/A = 1.87). ICP results are compared with the design compositions in Table 3. Only small deviations in the Mn-content were found, due to the Mn overcompensation in the case of evaporation loss. The average electron density (e/a), an important factor determining the ratio of C14 to C15 phase abundances [116,117,118,119,120], is calculated from the constituent elements’ numbers of outer-shell electrons. Since Pd has more outer-shell electrons (10), compared to the replaced Zr (4), e/a increases with increasing Pd. While the observed e/a is very close to the designed e/a, the B/A ratios determined by the ICP results of the Pd-containing alloys are slightly higher than those determined by the design compositions, due to the slight loss of Pd and correspondingly increased in the Mn-content.
3.3. XRD Analysis
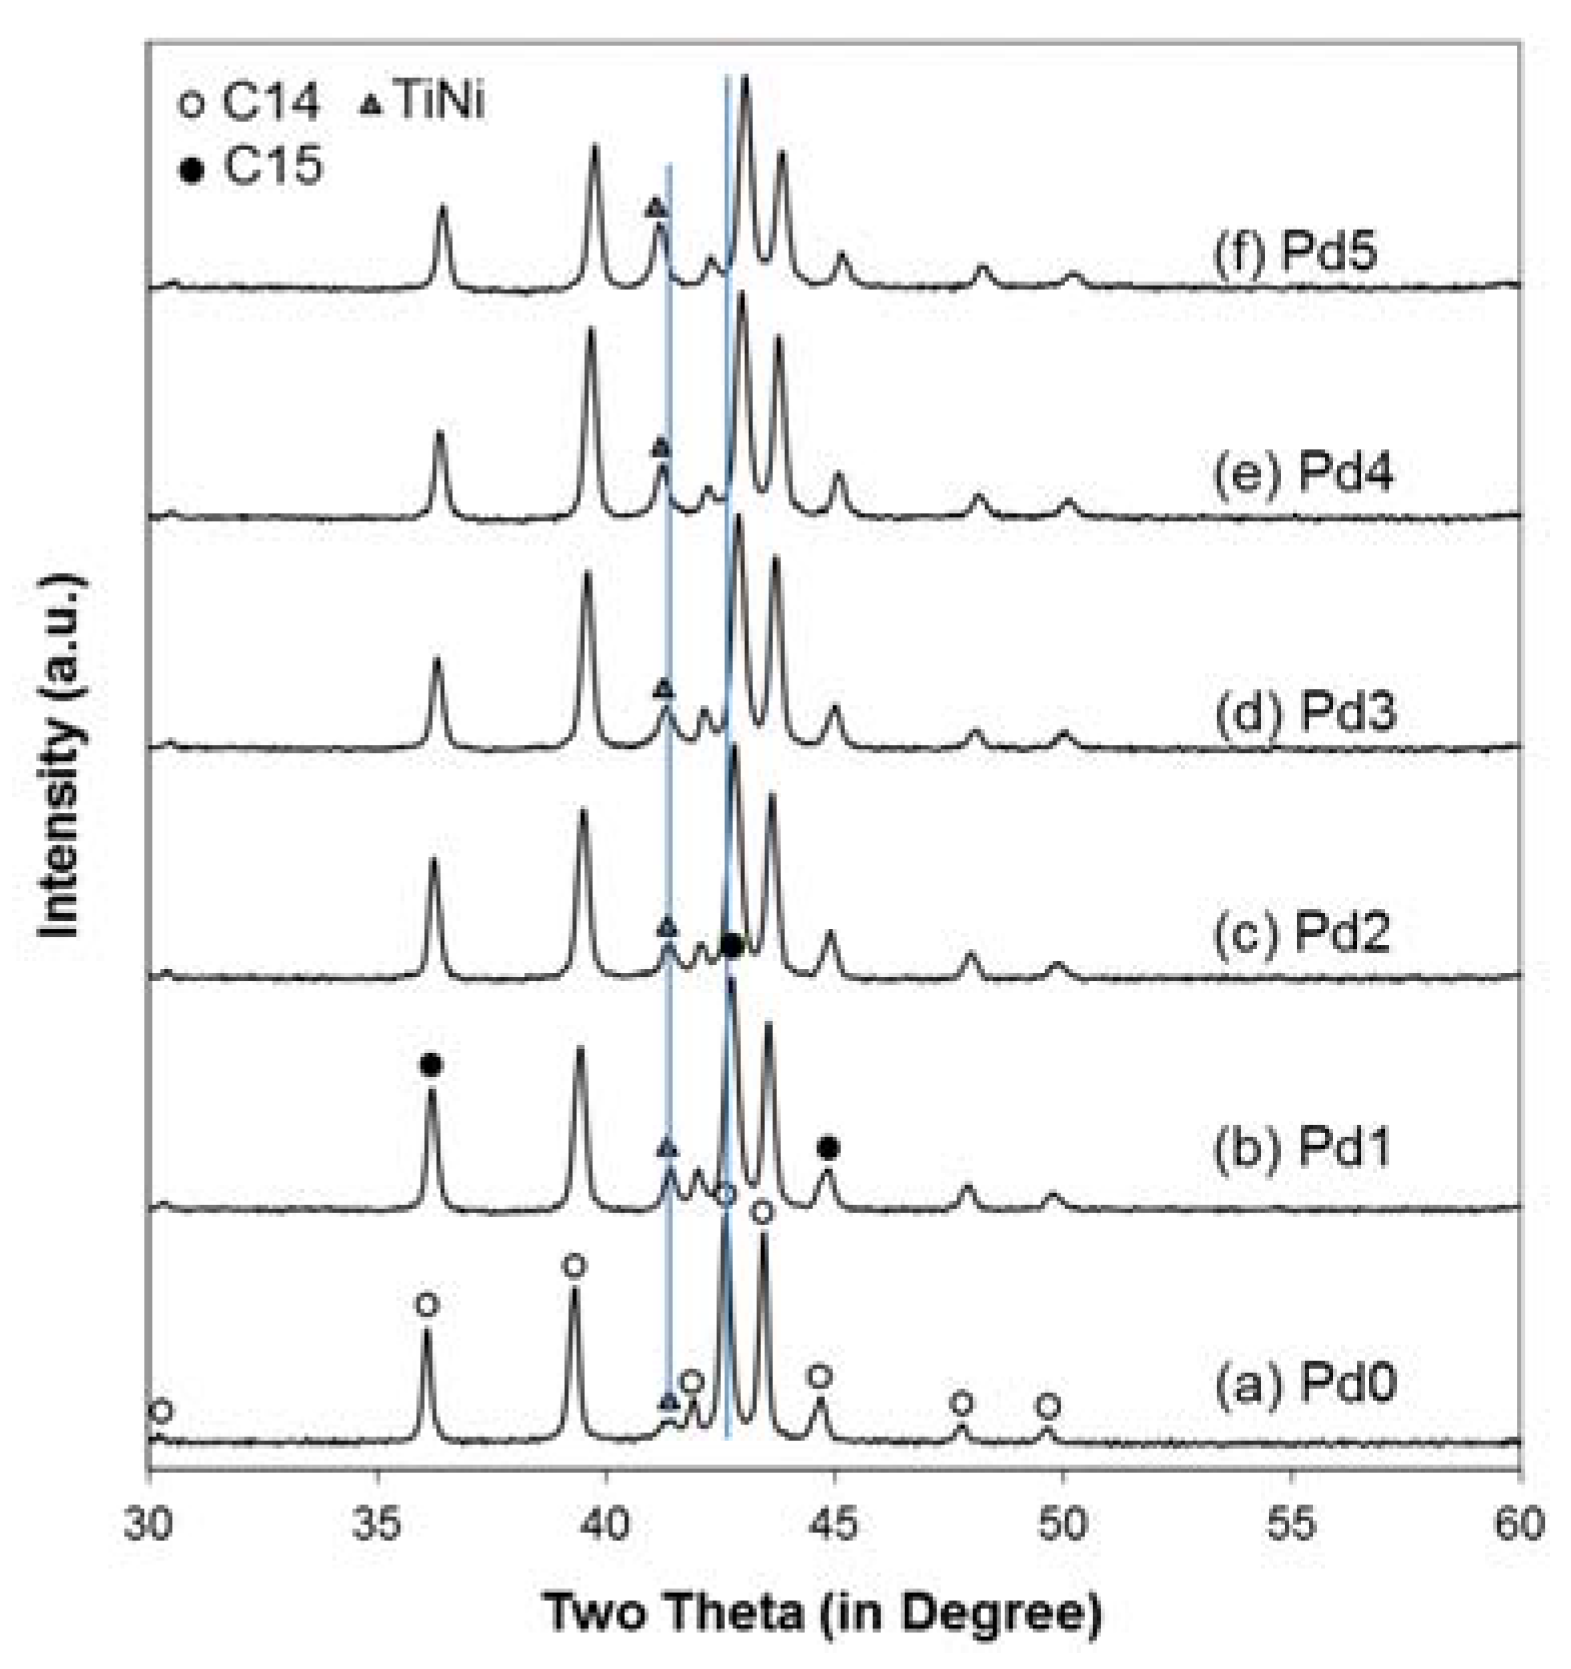
Alloy structures were studied using XRD, and the resulting patterns are shown in Figure 1. Besides the C14 (MgZn2-type, hexagonal, hP12 with a space group of P63/mmc) and overlapped C15 (MgCu2-type, cubic, cF24, with a space group of Fdm) peaks, a small peak at around 41.5° was identified and assigned as a TiNi-based cubic phase (with a B2 structure, cubic, cI2, a space group of Pm3m). With the increased Pd-content, the Laves phase peaks shift to higher angles (indicating a decrease in the lattice constants), and the TiNi peak moves in the opposite direction. Through a full-pattern analysis using the Jade 9.0 software (MDI, Livermore, CA, USA), the lattice constants and abundances of the C14, C15, and TiNi phases were calculated, and the results are listed in Table 4. In the C14 phase, both the lattice constants a and c decrease, and the a/c ratio increases with increasing Pd-content. Since the size of Pd is between those of the A-atoms (Ti, Zr) and those of the B-atoms (except for Al), the lattice constants increase if Pd occupies the B-site and decrease if Pd sits in the A-site. Thus, the evolution of the C14 lattice constants clearly indicates that Pd occupies the A-site, despite its relatively high electronegativity (Table 2). V, with a slightly smaller size than Pd, was shown to occupy the B-site in the C14 structure [121]. However, size is apparently not the only determining factor in site selection because Al, which is larger than Pd, was found to occupy the B-site in the C14 structure [122] and Sn, with a much larger size compared to Pd, first occupies the A-site when its concentration is less than or equal to 0.1 at %, but then moves to the B-site at higher concentrations [123]. The lattice constant of the C15 phase also decreases with increasing Pd-content, suggesting that Pd is also in the A-site in C15. We will continue this discussion with the phase compositions revealed by EDS in the next section. Different from the observations made in the Laves phases, the lattice constant of the cubic TiNi phase increases with increasing Pd-content (as indicated by the shift of peak at around 41.5° to lower angles), which shows that Pd is in the B-site (Ni-site) in the TiNi (B2) structure. TiNi and TiPd, which share the same B2 structure, form a continuous solid solution, as demonstrated in the Ni-Pd-Ti ternary phase diagram [124,125]. Therefore, it is not surprising to observe that Pd partially replaces Ni in the TiNi phase. The partial replacement of Fe by Pd in TiFe (with the B2 structure) also leads to an expansion in the unit cell [52]. Evolution of the lattice constants from the C14, C15, and TiNi phases are plotted in Figure 2 and illustrate the linear dependencies on Pd-content in the design. The phase abundances obtained from the XRD analysis are plotted in Figure 3. Since the major peaks of C15 overlap with several peaks of C14, the C14 and C15 phase abundances were calculated from the integration of diffraction peaks using a calibration with previous samples performed by the Rietveld method. With increasing Pd-content, the C14 phase abundance experiences an initial drop, followed by a flat plateau, and finally another drop; the C15 phase abundance increases slightly in the beginning, then decreases, and finally increases at the highest Pd-content; the TiNi phase abundance continues to increase. Evolution of the C14 and C15 phase abundances are not monotonic as the evolution of e/a (Table 3) since Pd has a much higher chemical potential, which increases the e/a value at the C14/C15 threshold (C14:C15 = 1:1) [120]. Therefore, a higher e/a value does not necessarily correlate to a higher C15 phase abundance in Pd-containing alloys. Furthermore, the impact of adding Pd at different concentrations to the C14 crystallite size is insignificant, suggesting that all the alloys have very similar liquid-solid compositions at elevated temperatures, due to the high affinity between Pd and Ni.
3.4. SEM/EDS Analysis
The distribution and composition of the constituent phases in all the alloys were studied by SEM/EDS. Representative SEM backscattering electron images (BEI) of alloys Pd1 to Pd5 are shown in Figure 4, while that of the base alloy Pd0 was previously published (Figure 3a in [8]). The composition of the numbered spots in each micrograph was further analyzed by EDS, and the results are listed in Table 5. Areas with the brightest contrast have a B/A ratios between 0.9 and 1.1 and are identified as the cubic TiNi phase. It should be noted that for the B/A ratio calculation of TiNi, Pd is treated as a B-site element since TiNi and TiPd share the same structure and form a continuous solid solution in the Ni-Pd-Ti ternary phase diagram [124]. Among the constituent phases, Pd has the highest solubility in TiNi, which explains the increase in TiNi phase abundance with increasing Pd-content (Figure 3). Concentrations of the major elements (Ti, Zr, Ni, and Pd) in the TiNi phase are plotted in Figure 5a as functions of Pd-content in design. The observed replacement of the smaller Ni with the larger Pd enlarges the TiNi unit cell, as shown by XRD analysis. Moreover, the main matrix with a B/A ratio between 2.1 and 2.3 and a relatively low e/a value (6.7 to 6.9) was assigned to a slightly hyper-stochiometric C14 phase with Pd residing in the A-site. Pd resides in the A-site for the C14 phase, or the B/A ratio would be even higher and beyond the practical range [126]. The dilemma of site selection for Pd is the same as for the case of V, which resides in the A- and B- sites in AB and AB2 phases, respectively [127,128]. Concentrations of the major elements (Ti, Zr, Ni, and Pd) in the C14 phase are plotted in Figure 5b as functions of Pd-content in design. The major changes observed with increasing Pd-content in the design include a decrease in Zr and an increase in Pd. Pd is smaller than Zr and consequently causes a shrinkage in the C14 unit cell, as indicated by XRD analysis (Figure 2a). Although Pd and V have similar atomic radii (Table 2), they act differently in the multi-phase MH alloy; while Pd occupies the A-site in C14 and the B-site in TiNi, V does the opposite [10,121]. The large differences in numbers of outer-shell electron and electronegativities of Pd and V must play an important role in their site-selecting outcomes. One additional thing worth mentioning is the increase in lattice constant ratio a/c with increasing Pd-content (Table 4). This has been reported previously that the occupancy of B-site atoms (2a and/or 6h—Wykoff notation—in Figure 6) has an impact on the a/c ratio [128,129,130]. However, the correlation between where the A-site occupancy and the a/c ratio has not been reported, since only one possible site is available for the A-atoms (4f in Figure 6). When the a/c ratios of alloys in the current study and those of alloys in a previous Ti/Zr study [103] are plotted against the Zr-contents in C14 in Figure 7, we found that the a/c ratio increases with increasing Zr-content, except for when the Zr-content is greater than 15.5% in the Ti/Zr study. Therefore, the A-site arrangement on the A2B plane must affect the a/c ratio, which warrants further computational studies.
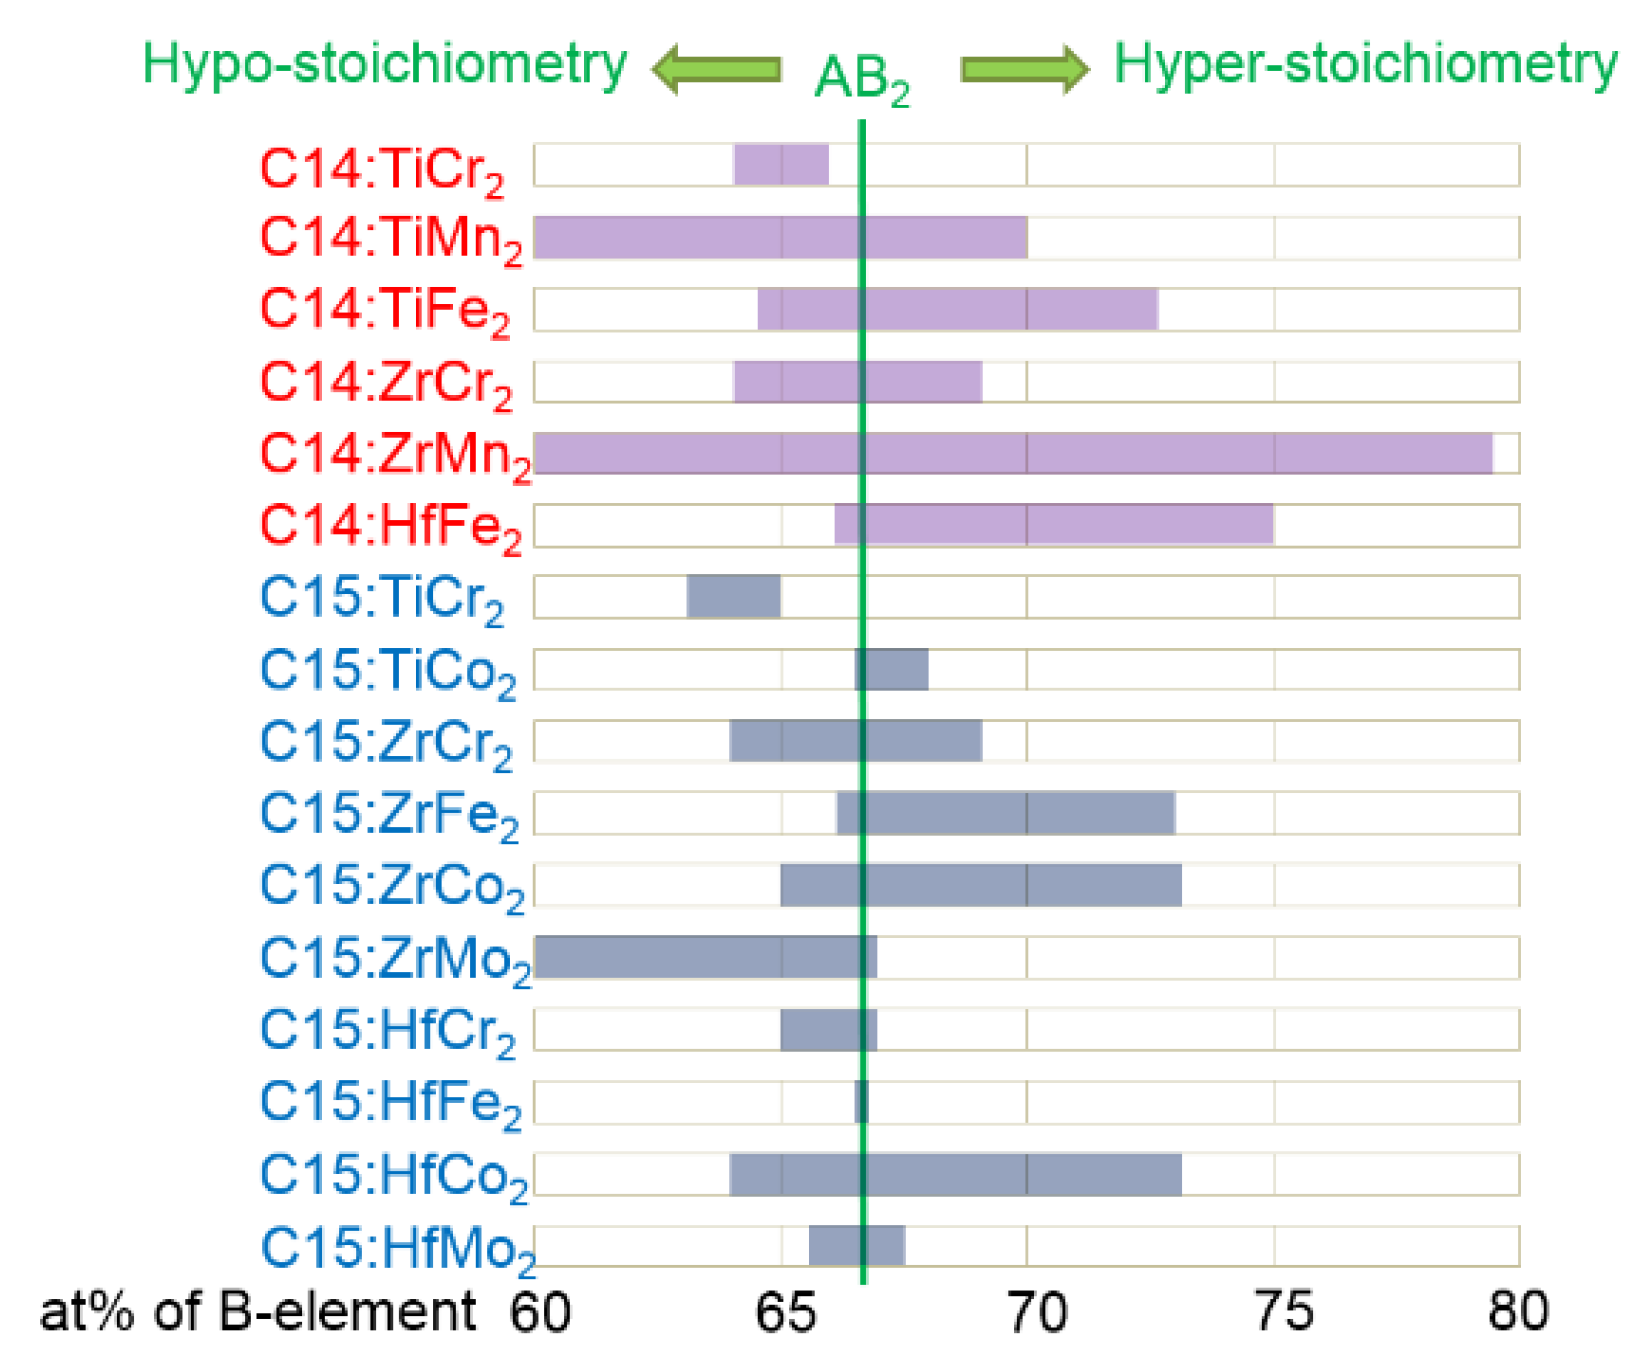
The region between the main C14 matrix and TiNi secondary phase shows a contrast between C14 and TiNi and has been assigned as the C15 phase, due to its relatively high e/a (6.9–7.4) [118,120]. Transmission electron microscopy [131,132] and electron backscattering diffraction [133] confirmed that the C15 phase solidifies between the formations of the C14 and B2 phases in the multi-phase MH alloys. Unlike the C14 phase, the C15 phase is hypo-stoichiometric with the B/A ratio between 1.7 and 1.8. Solubility of the off-stoichiometric phase is caused by either the anti-site defect or vacancy [134]. Figure 8 provides a comparison of solubilities for the C14 and C15 alloys with Ti, Zr, or Hf as the A-site element. While the C14 alloy leans slightly toward being hyper-stoichiometric, the C15 alloy has an approximately equal opportunity to become either hyper- or hypo-stoichiometric. Therefore, we do not have a clear explanation for the stoichiometry preferences of the Laves phases in the current study. Furthermore, a shift in the C14/C15 threshold with increasing Pd-content is observed in Figure 9 and is thought to be due to the high chemical potential of Pd in the A-site, as predicted previously [120]. Compared to the C14 phase, the C15 phase has a higher solubility of Pd and Ni (Table 5), which have the highest number of outer-shell electrons (10) and consequently contribute to a higher e/a value. Lastly, areas with the darkest contrast consist of ZrO2, which is the product of oxygen scavenging commonly seen in the Zr-based AB2 MH alloys [130,135,136].
3.5. PCT Analysis
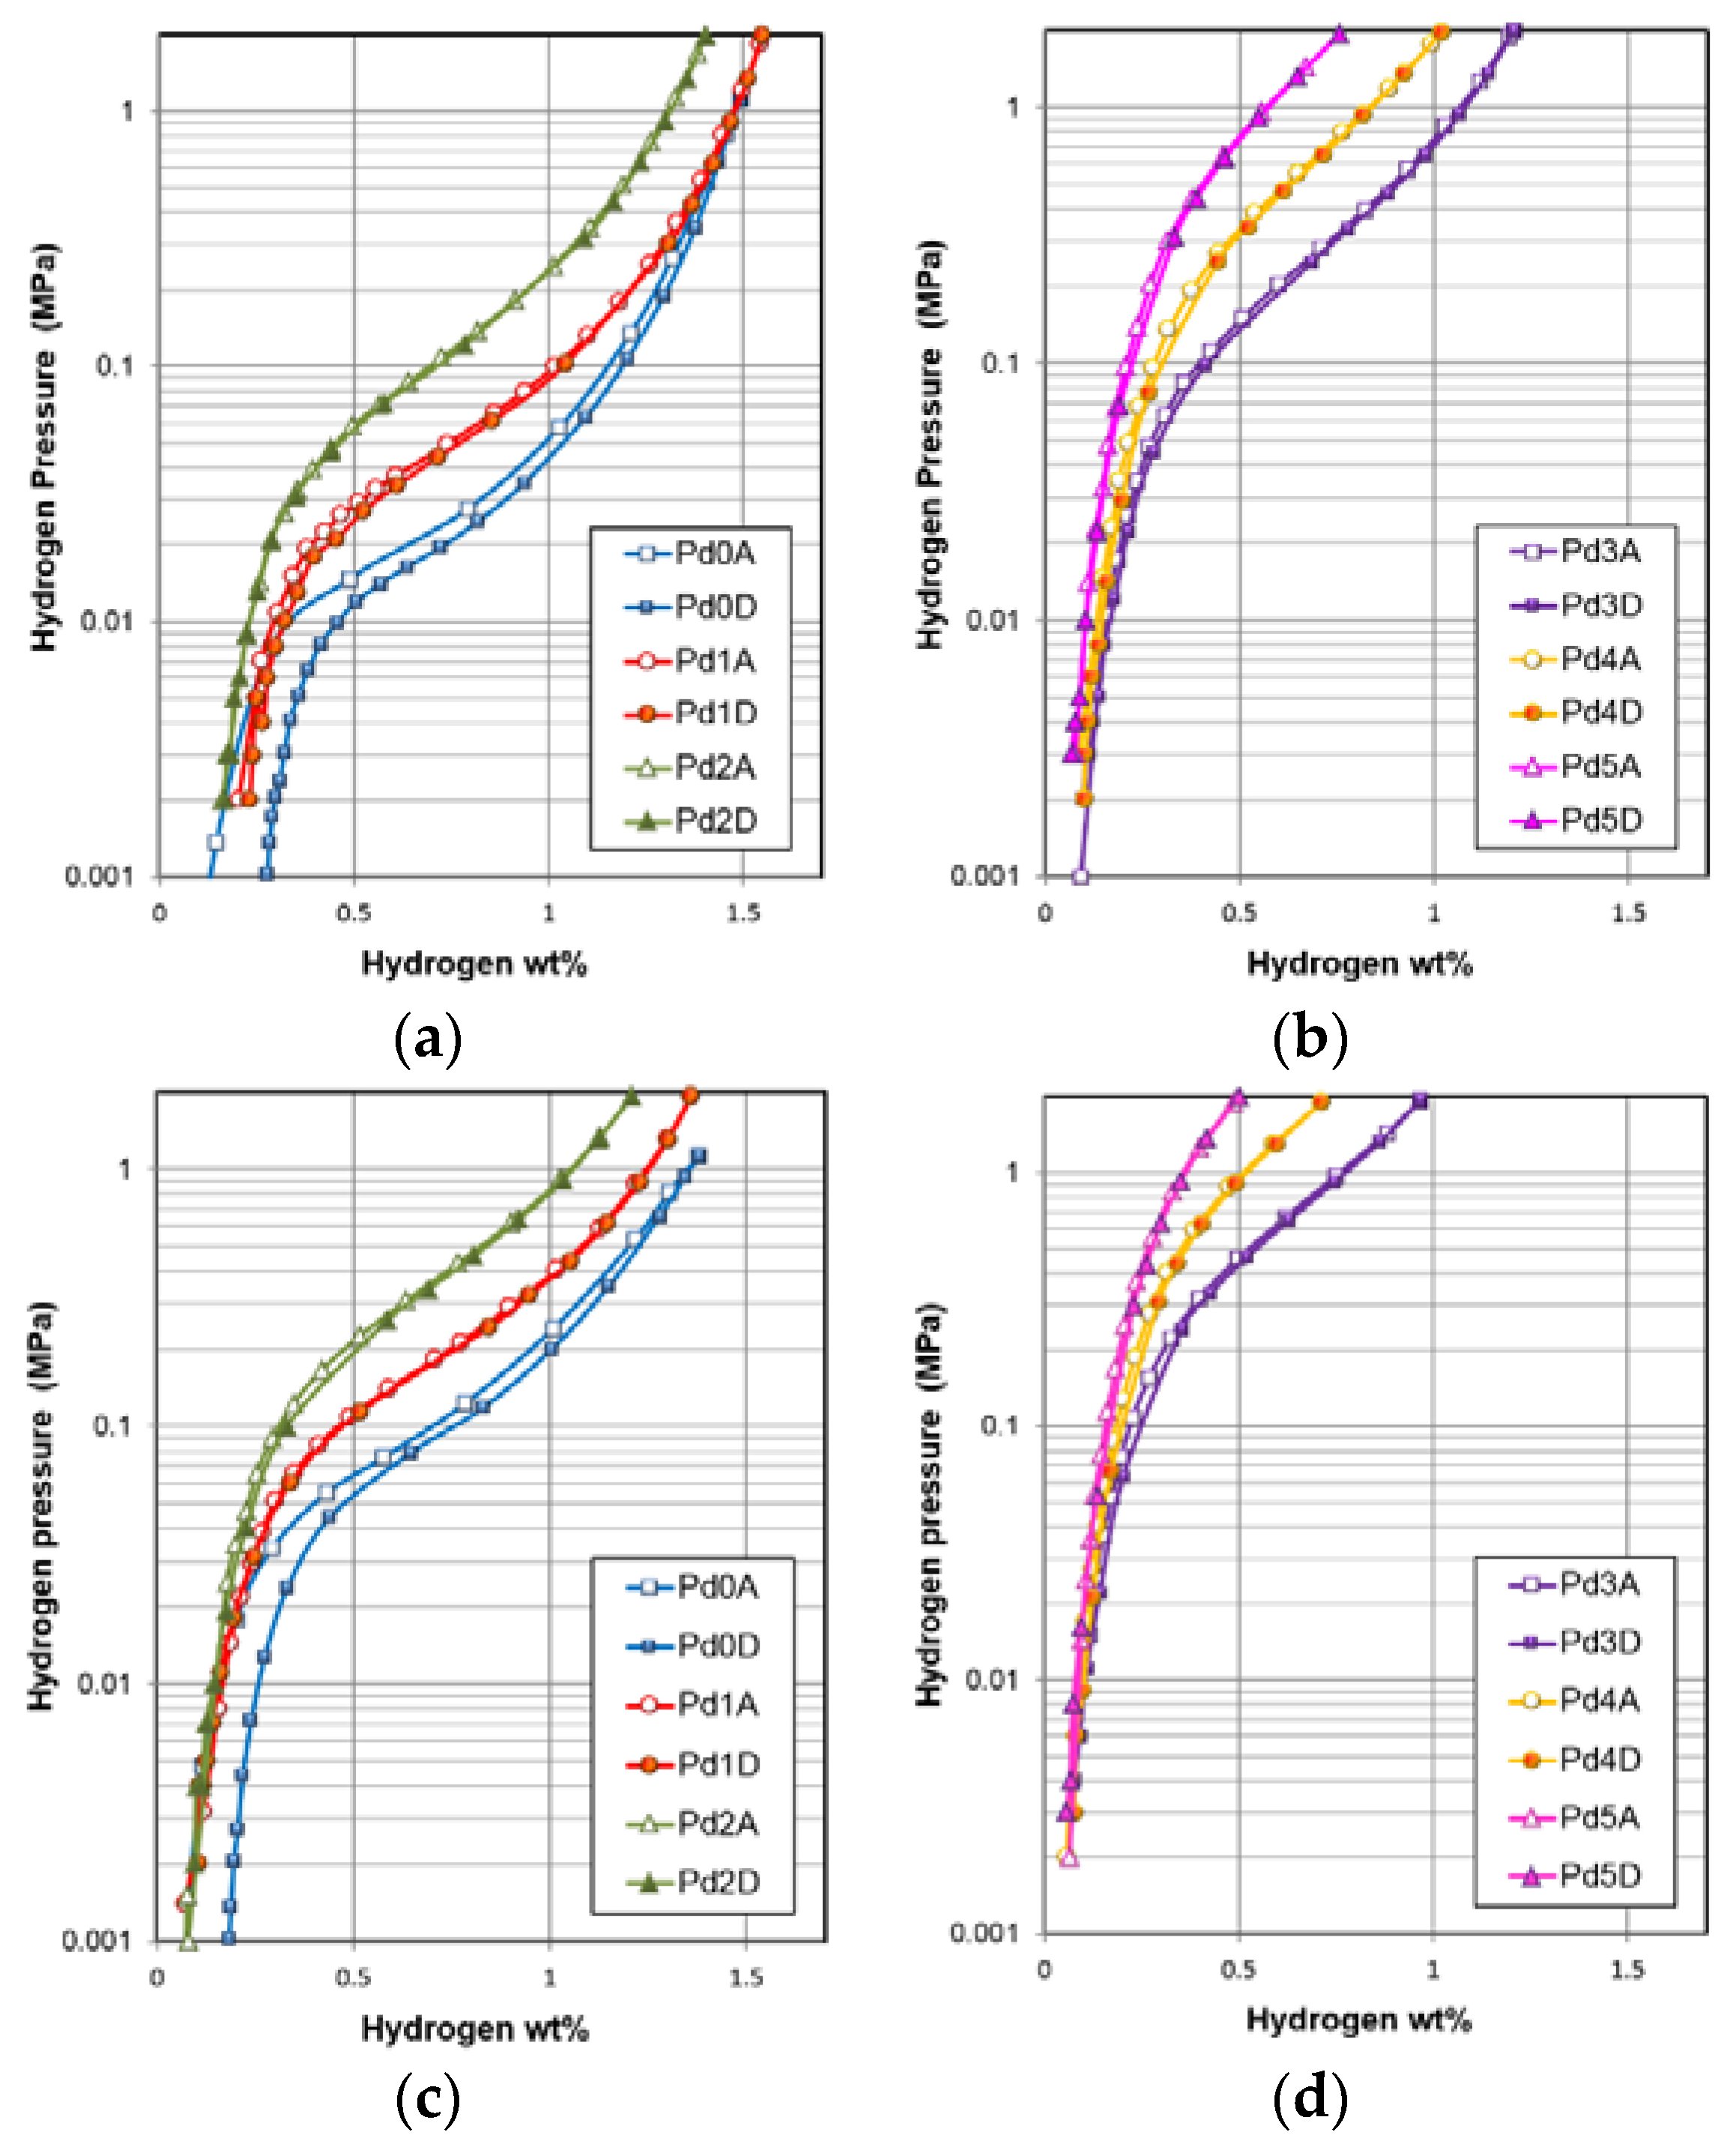
PCT isotherms were used to study the interaction between the alloys and hydrogen gas. Both the 30 and 60 °C isotherms for each alloy are plotted in Figure 10. These PCT curves lack an appreciable amount of plateau and are similar to those of the multi-phase MH alloys due to the synergetic effects between the main working phase and catalytic secondary phase(s) [137]. In general, plateau pressure increases and the storage capacity and absorption/desorption hysteresis decrease as Pd-content increases. The gaseous phase H-storage properties obtained from the PCT isotherms are summarized in Table 6. As the Pd-content increases, both the maximum and reversible capacities first increase slightly with 1 at % Pd but then decrease. The desorption pressure at 0.75 wt. % (plateau pressure) H-content shows a monotonically increasing trend. This reduction in hydride stability by adding Pd was also observed in the AB5 alloy previously [83]. Moreover, both the maximum capacity and log (desorption pressure at 0.75 wt. %) show linear dependencies on the C14 unit cell volume for all Pd-containing alloys, as demonstrated in Figure 11. Therefore, we believe that the gaseous H-storage characteristics are mainly determined by the main C14 phase. One point that does not follow the trend seen in Figure 11 is from alloy Pd1. Although alloy Pd1 has a smaller C14 unit cell and a lower C14 abundance compared to the Pd-free base alloy Pd0, its capacity increases slightly due to a large increase in the TiNi phase abundance. However, when prepared as an alloy, Ti1.04Ni0.86Pd0.1 exhibits a mixed B19′/R/B2/Ti2Ni structure and yields a discharge capacity of only 148 mAh·g−1 at C/5 rate [82]. Therefore, the direct influence of the TiNi phase on H-storage capacity should be minimal. The contribution from the TiNi phase most likely occurs through the synergetic effects that arise from TiNi and other phases, as observed previously [104,137,138]. The remaining capacities during desorption at 0.002 MPa of each alloy are listed in the third row in Table 6 and decrease with increasing Pd-content. Raising the plateau pressure would not necessary decrease the remaining capacity, as seen from a study on a series of pure Zr1−xTixMnFe C14 MH alloys [139]. Therefore, we believe the decrease in remaining capacity during desorption (that correlates to a more complete desorption) results from the presence of the catalytic TiNi phase (either through an increase in abundance or an increase in the Pd-content in TiNi). Similar phenomenon has also been found in the study of the Mg-incorporated C14-predominated alloys [7]. Slope factor is defined as the ratio of desorption capacity between 0.01 and 0.5 MPa to total desorption capacity, and a higher slope factor corresponds to a flatter PCT isotherm. From the data listed in Table 6, slope factor in this series of alloys decreases with increasing Pd-content in design, which means the isotherm becomes more slanted—an indication of increased synergetic effects between the main storage phase and catalytic secondary phase(s) [10]. Due to the lack of an identifiable plateau in the PCT isotherm, hysteresis is defined as log (ratio of absorption to desorption pressures at 0.75 wt. % H-storage) and listed in Table 6. PCT hysteresis is commonly accepted as correlating to the energy needed to overcome the reversible lattice expansion in the metal (the αphase)/MH (the βphase) phase boundary during hydrogen absorption [119]. The catalytic TiNi phase facilitates the hydrogen absorption in the storage phase by pre-expanding the lattice near the interface and thus decreasing the energy needed to propagate hydrogen through the bulk [133]. Finally, the thermodynamic properties specifically changes in hydride enthalpy (ΔHh) and entropy (ΔSh), were calculated using the equilibrium pressures at 0.75 wt. % H-storage and the Van’t Hoff equation,
where T and R are the absolute temperature and ideal gas constant, respectively. The calculated values for alloys Pd0 to Pd4 are listed in the last two rows of Table 6. Those for alloy Pd5 are not available since its high hydrogen equilibrium pressure is beyond the limit of our PCT apparatus (>2 MPa) and therefore cannot be measured. With increasing Pd-content in design, both ΔHh and ΔSh increase. While the increase in ΔHh is due to shrinkage of the C14 unit cell, the increase in ΔSh is caused by an increase in disorder in the hydride, correlating well with the observed decrease in slope factor.
ΔG = ΔHh − TΔSh = R T ln P,
3.6. Electrochemical Analysis
Electrochemical testing was performed in an open-to-air flooded cell configuration against a partially pre-charged sintered Ni(OH)2 counter electrode at room temperature. Each electrode was charged with a current of 50 mA·g−1 for 10 h and then discharged at the same rate until a cut-off voltage of 0.9 V was reached. The capacity obtained at this rate is assigned as the high-rate discharge capacity. Two more pulls at 12 and 4 mA·g−1 then followed. The capacities at the three different rates were summed, and the sum is designated as the full capacity. The ratio of the high-rate to full capacities is reported as HRD. The activation behaviors in the electrochemical environment of alloys in the current study are compared in Figure 12. Judging from the full capacities and HRD in the first 13 cycles, the addition of Pd improves the activation performances of both properties. While the degradation in full capacity was negligible for all alloys, degradations in HRD are obvious and become more severe with increasing Pd-content. The deterioration in HRD with cycling is due to the formation of a passive layer on the surface of TiNi, whose abundance also increases as Pd-content increases. The Pd-addition in many MH alloys results in improvement in cycle stability (Table 1), a positive contribution from the dense nature of TiO2 [140] and stability of Pd/PdO in alkaline solution [141].
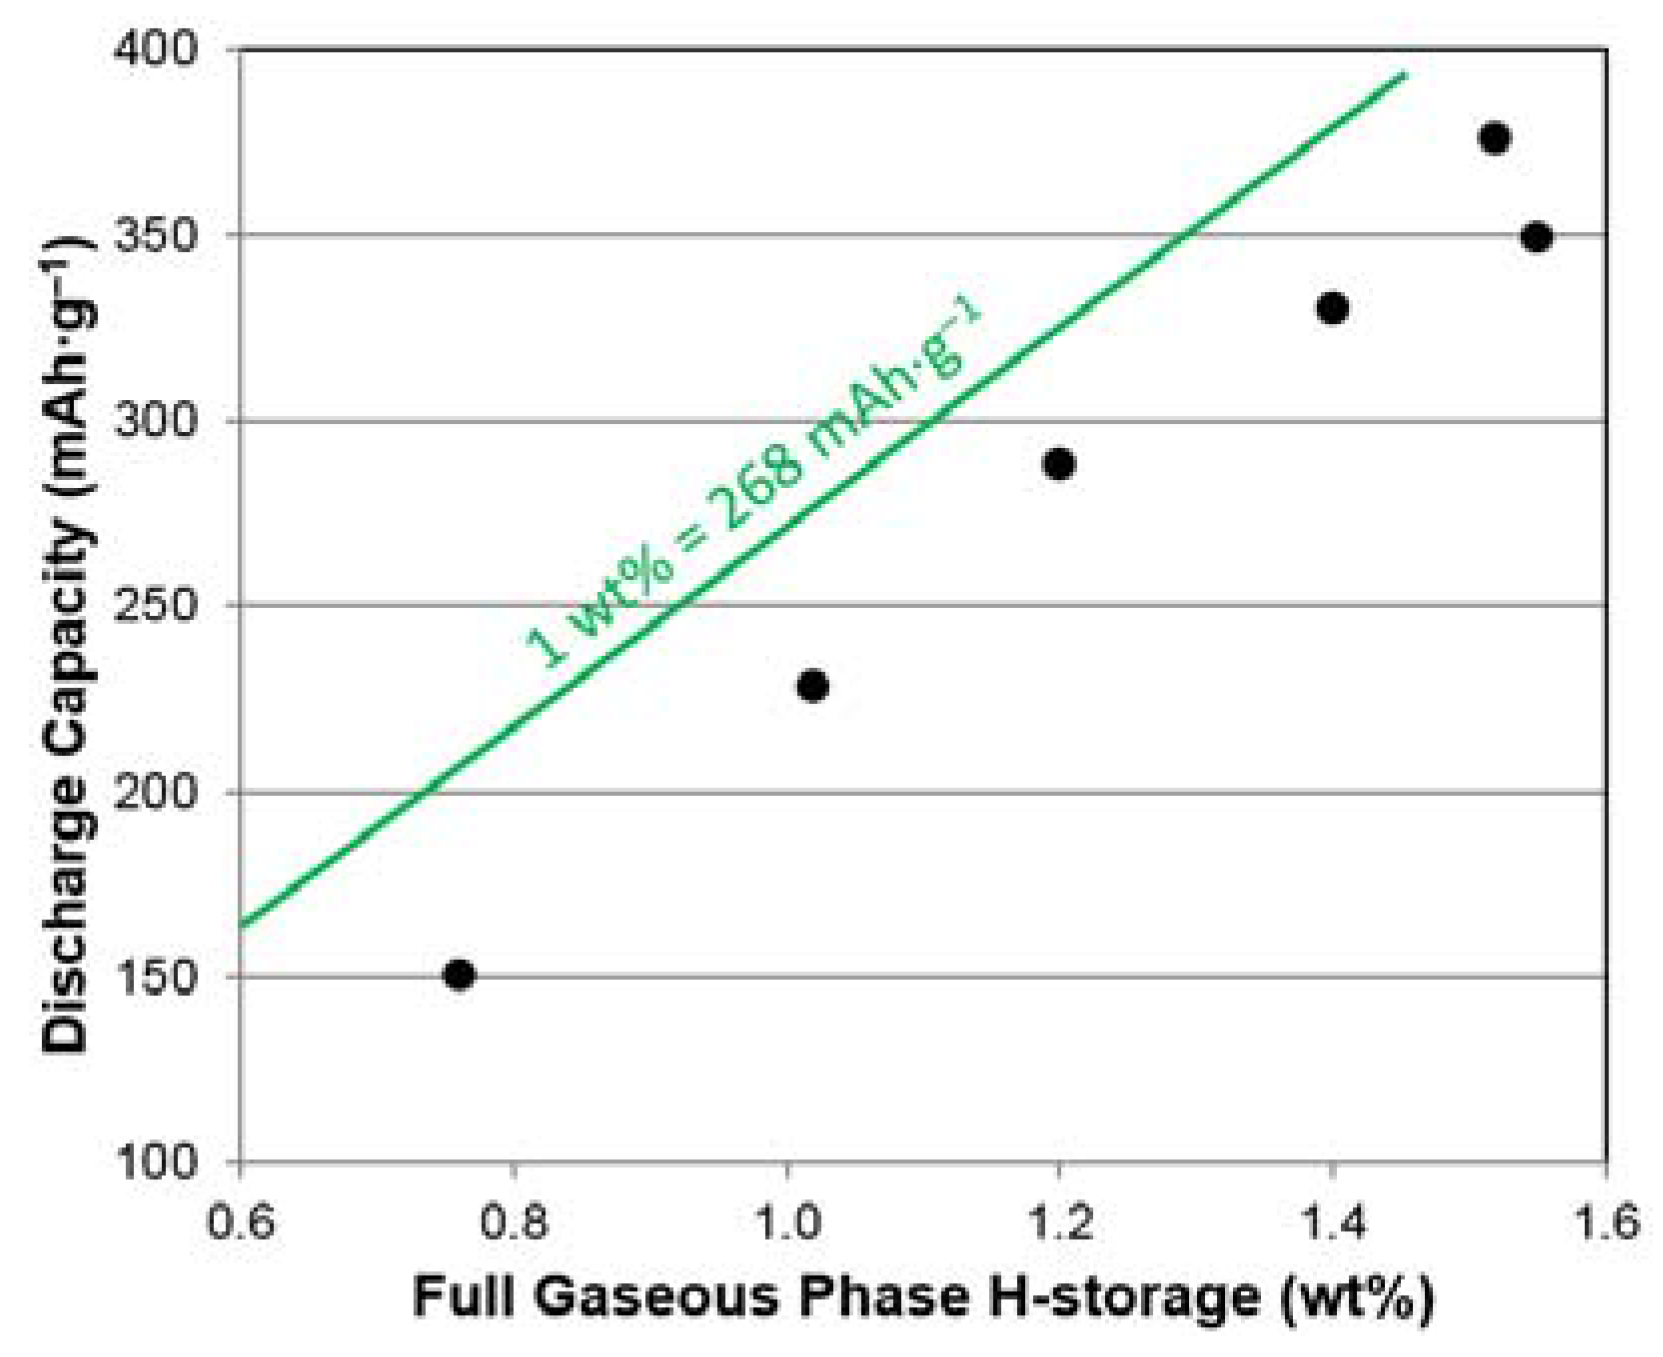
All the electrochemical properties obtained from the alloys are summarized in Table 7. With increasing Pd-content, the following trends are observed: the high-rate capacity first increases with the addition of catalytic Pd, but then decreases due to the reduction in unit cell volume of C14; the full capacity decreases monotonically; HRD increases; and the activation performance is ultimately improved. The increase in capacity for the gaseous phase in alloy Pd1 was not observed in the electrochemical capacity. Although the TiNi phase is considered highly catalytic in the gaseous phase, it is also prone to surface passivation and, consequently, may not be as effective in the electrochemical environment. Electrochemical discharge capacity is plotted against the gaseous phase maximum H-storage capacity, shown in Figure 13. Gaseous phase maximum H-storage capacity is composed of reversible and irreversible capacities and considered to be the upper bound for the electrochemical discharge capacity. Therefore, although a close correlation between electrochemical discharge capacity and gaseous phase maximum H-storage capacity can be observed, it falls below the conversion of 1 wt. % = 268 mAh·g−1 due to some capacity irreversibility. Moreover, the linear relationship of electrochemical discharge capacity vs. gaseous phase maximum H-storage capacity indicates that the origin for the decrease in electrochemical discharge capacity with increasing Pd-content is the same as that in the gaseous phase, specifically a decrease in the C14 unit cell volume. For all the alloys, the discharge capacity is smaller than the gaseous phase H-storage since the open-to-air configuration and high plateau pressure cause an incomplete charging in the electrochemical environment.
To trace the source of Pd’s contribution to HRD, both D (bulk-related) and Io (surface-related) were measured, and the results are listed in Table 7. Details on these two measurements can be found in our previous publication [8]. The reported values were averaged from the values measured from three samples prepared in parallel. Except for alloy Pd3, the D values from the Pd-containing alloys are at least double of that from the Pd-free Pd0 alloy. We repeated the same experiments three times for alloy Pd3, and the results are very close to the first measurement. At the present time, we cannot explain the relatively low D value for alloy Pd3 and speculate that it may be related to the distribution and orientation alignment of the C14 and C15 grains. The Io value increases in the first two Pd-containing alloys (Pd1 and Pd2) but decreases with further increase in the Pd-content. In general, both D and Io are improved by the addition of Pd, so we can conclude that the origin of enhanced HRD in Pd-containing C14-based MH alloys is a combination of transportation of hydrogen in the alloy bulk and facilitation of the surface electrochemical reaction.
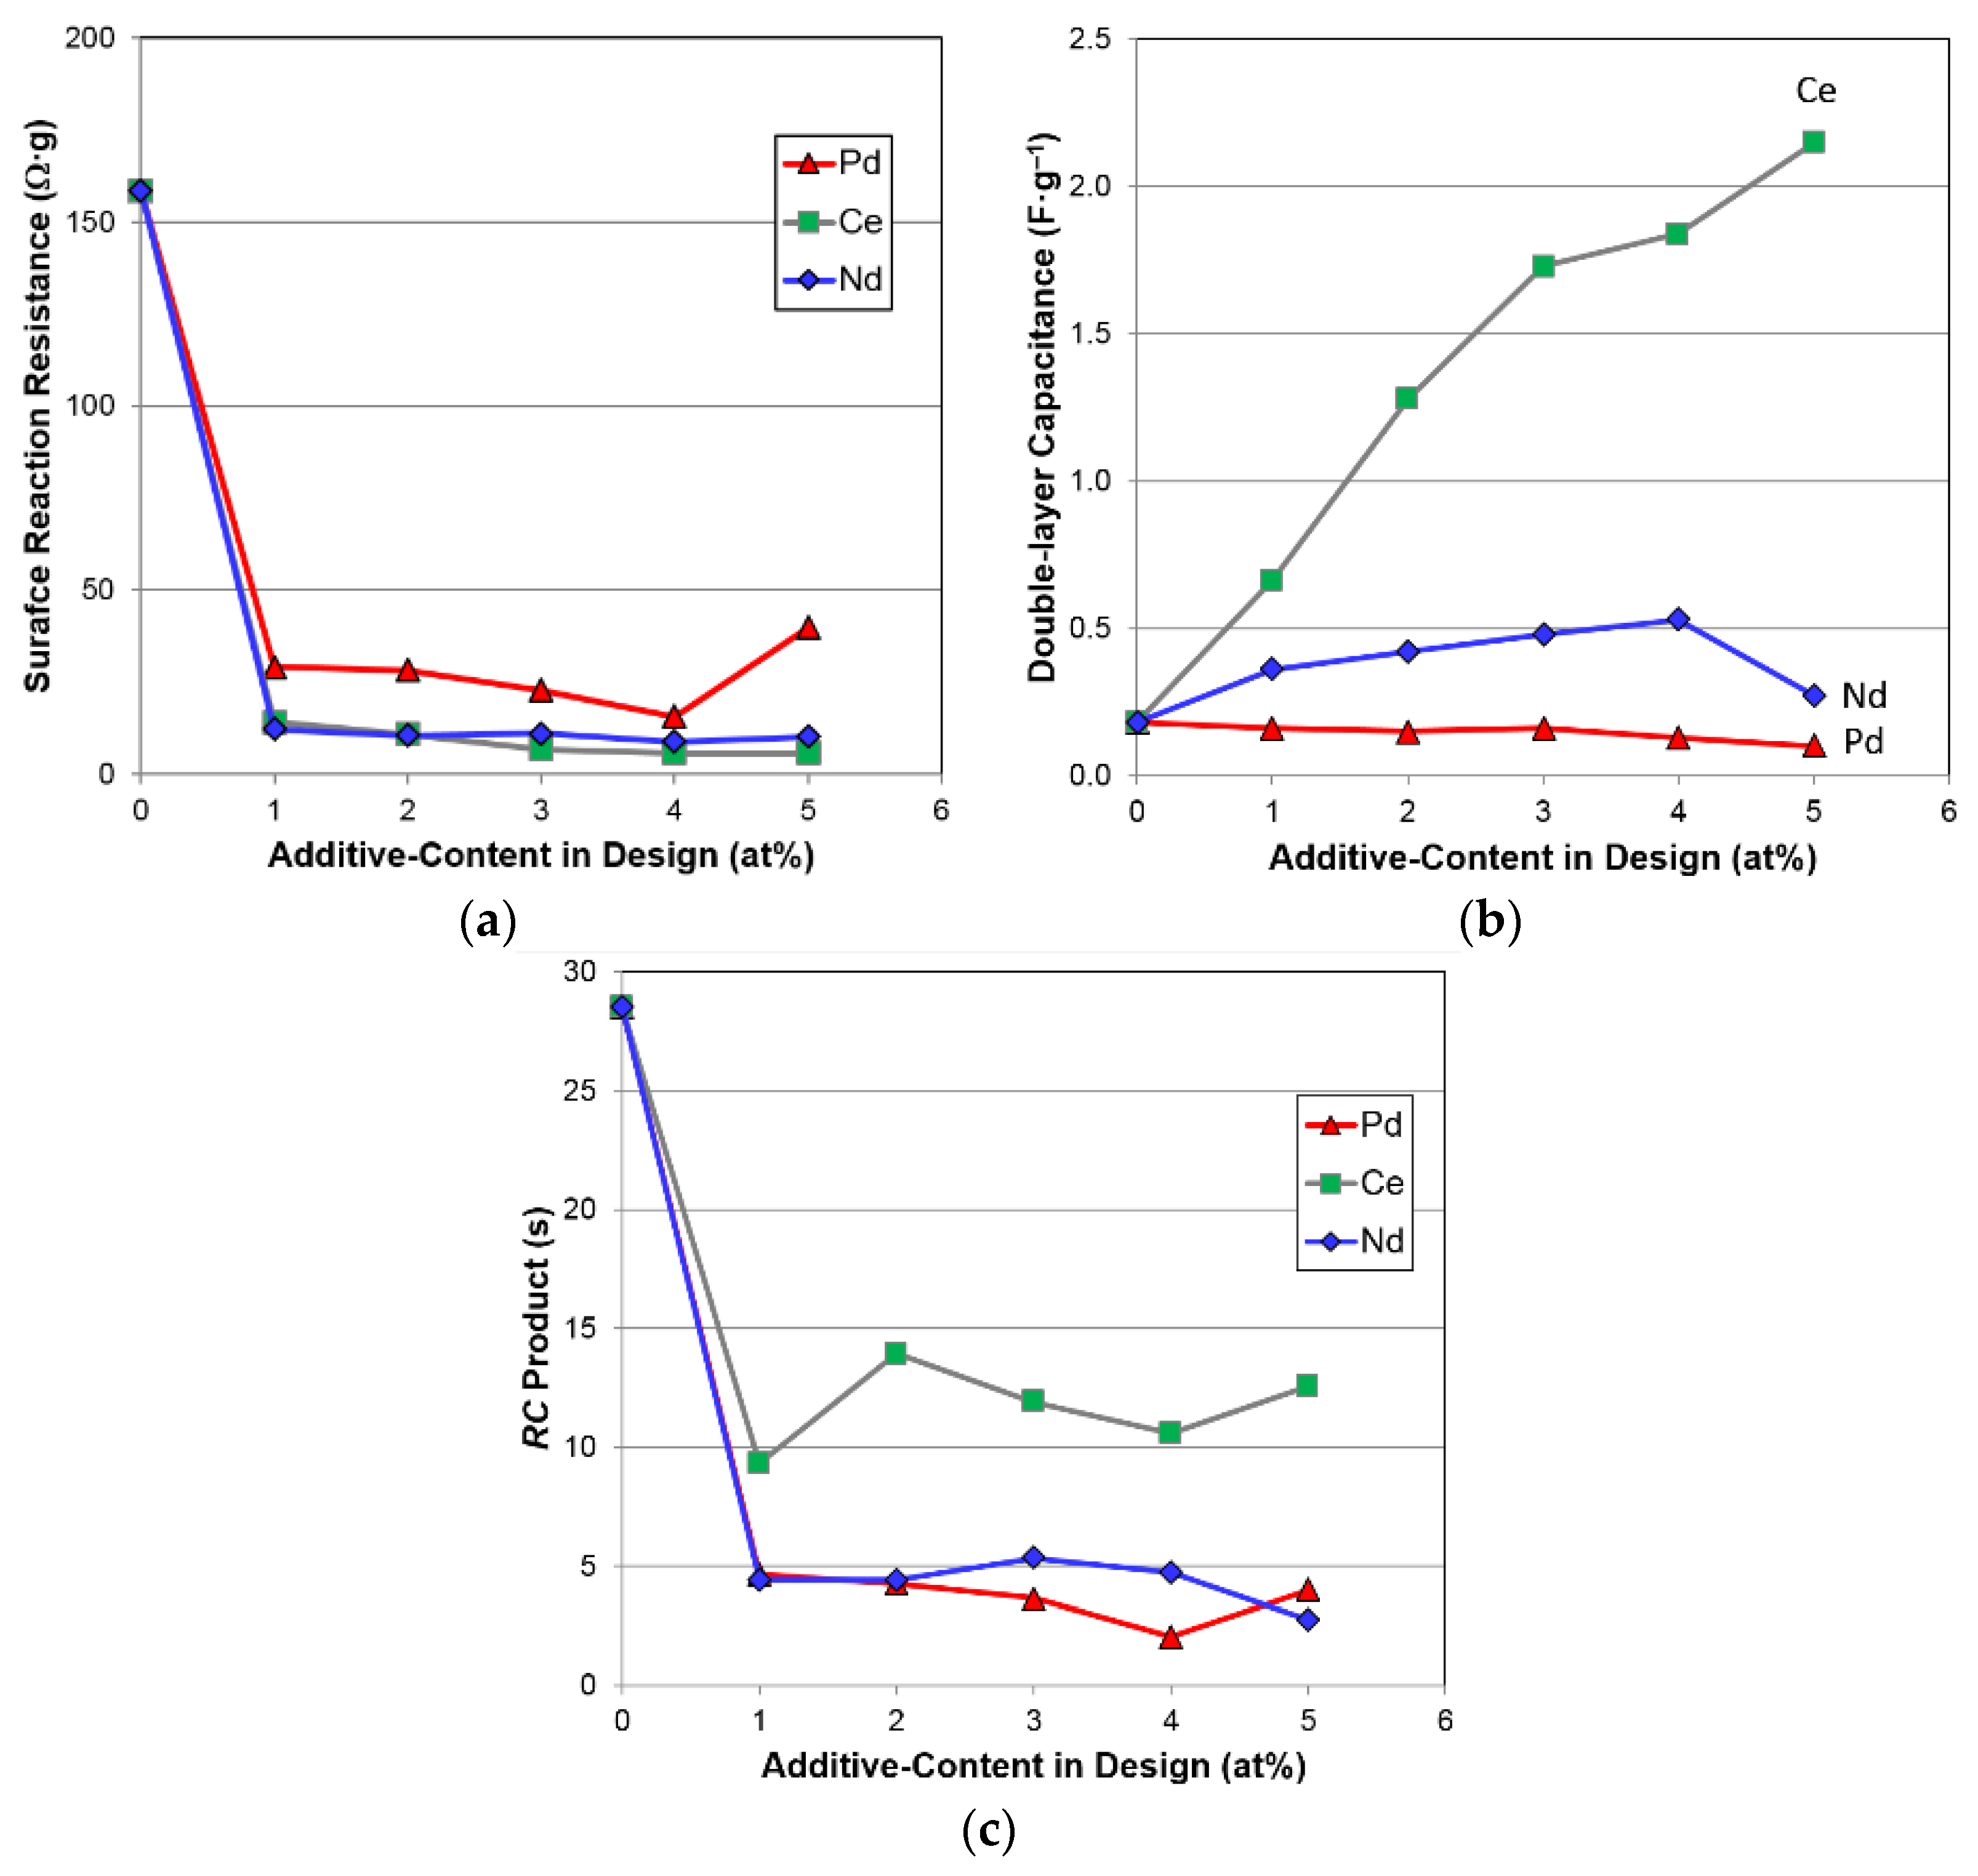
Low-temperature performance of alloys in the current study was evaluated by AC impedance analysis. Both the charge-transfer resistance (R) and double-layer capacitance (C) were obtained from the semi-circle in the Cole-Cole plot (plot of the negative imaginary part vs. the real part of impedance with varying frequency). While R is closely related to the speed of electrochemical reaction, C is proportional to the reactive surface area, and their product (RC) can be interpreted as the surface catalytic ability without any contribution from the surface area [7,9,142]. These calculated values are listed in Table 7 and plotted with the amounts of Pd, Ce [9], and Nd [10] present in the C14 MH alloys in Figure 14. The R values are reduced dramatically with all the additives, but Ce and Nd are demonstrate the most dramatic decrease in R, compared to Pd. Figure 14b shows that the surface area increases by a large amount with Ce-addition, also does not increases as much with Nd-addition, and decreases slightly with Pd-addition. While adding Ce and Nd results in the formation of a soluble AB phase and a consequent increase the surface area in alkaline solution [9,10], the TiNi phase is more protective and lowers the amount of reactive surface area in the Pd-containing alloys. Figure 14c demonstrates that although all three additives increase the surface catalytic ability by lowering the RC product (corresponding to a faster reaction), the Nd- and Pd-containing alloys (especially alloys Pd3 and Pd4) are more catalytic than the Ce-containing alloys. In conclusion, Pd, Ce, and Nd increase the surface electrochemical reaction rate by improving the catalytic ability, reactive surface area, and both, respectively. Future substitution work should combine the highly catalytic Pd and effective surface area promoter Ce.
3.7. Magnetic Susceptibility
The catalytic ability in the surface of MH alloy was previously correlated successfully to the saturated M.S. [143]. After activation, Zr from the alloy forms surface oxides, and the non-corroded Ni atoms conglomerate and form metallic clusters within the oxides [144]. Since the M.S. of metallic Ni is at least seven orders of magnitude larger than that of the alloy, due to the existence of unpaired electrons in metallic Ni [145], the total percentage of metallic Ni can be estimated from the saturated M.S. (MS) by measuring the M.S. of the activated MH alloy. The average size of Ni clusters can also be estimated by the strength of the applied magnetic field that corresponds to half of the MS value (H1/2) [7]. The magnetic properties of several key MH alloys were compared in an earlier publication [1]. Both the MS and H1/2 of alloys in this study are listed in the last two rows in Table 7. The MS values of the Pd-containing alloys are much lower than that of the Pd-free alloy Pd0. Since the percentage of reduction in MS of the Pd-containing alloys is much larger than that of the increase in the TiNi phase abundance, Pd in the main C14 phase must also contribute to the reduction in MS. Moreover, the improved HRD, achieved by adding Pd, is certainly not related to the amount of metallic clusters embedded in the surface oxide. The H1/2 values for the alloys indicate that the Ni cluster size is relatively unchanged with the addition of Pd.
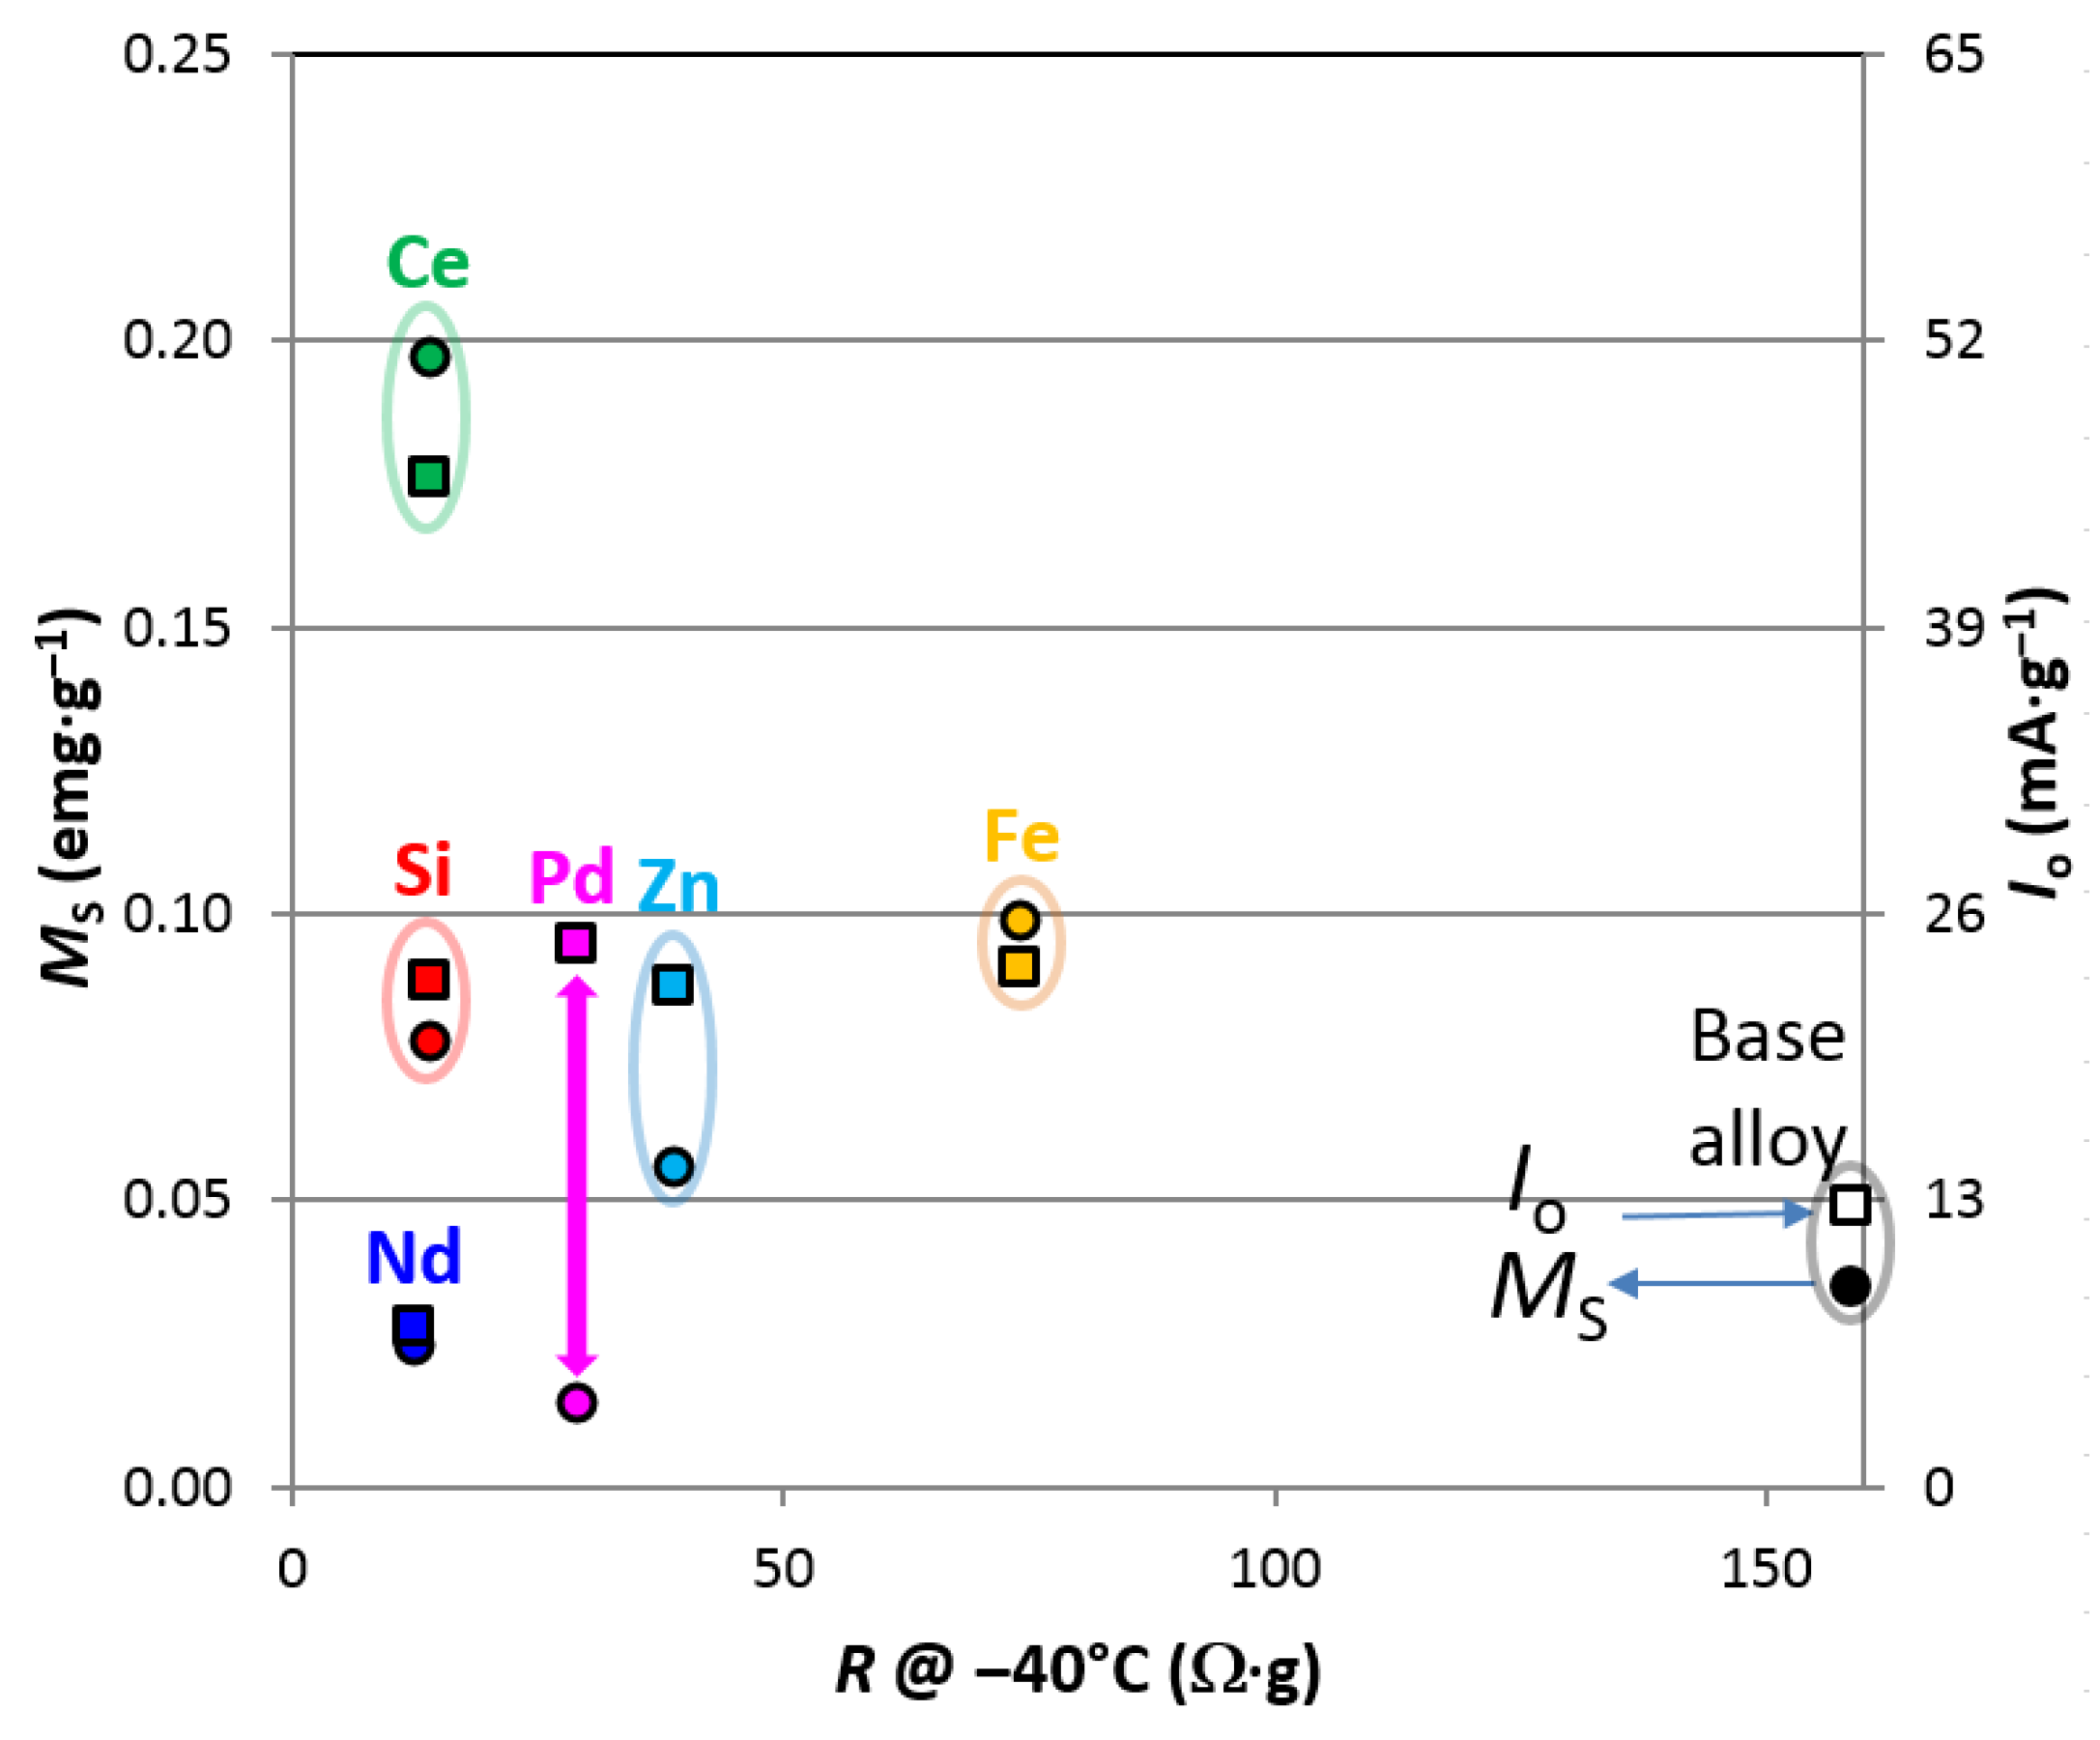
MS and Io measured at room temperature vs. R measured at −40 °C for several C14-based alloys with 1 at % of various additives are plotted in Figure 15. Except for Pd, MS and Io from the same alloy correlate very closely. In other words, surface electrochemical reaction is dominated by the amount of metallic Ni in the surface oxide for the majority of modified C14 MH alloys. However, Pd facilitates the electrochemical reaction by acting as a catalyst. Figure 15 also demonstrates that MS (Io) is inversely proportional to R, except for the Nd- and Pd-containing alloys. Nd, although it shows zero solubility in the C14 phase, may participate in the catalytic process through another more complicated route (for example, creating a unique surface oxide structure as in the case of the La-addition [146]).
4. Conclusions
Incorporation of Pd in the Zr-based AB2 multi-phase metal hydride alloy has been systematically studied. XRD analysis results show that Pd occupies the A-site for both the C14 and C15 structures, which results in shrinkage of the unit cells and, consequently, reductions in the gaseous phase and electrochemical capacities. With a strong affinity to Ni, Pd promotes the formation of the Ti(Ni, Pd) phase with a B2 structure as shown by the XRD and SEM/EDS results (where as the Pd-content in the alloy increases, the TiNi abundance and amount of Pd in the phase increase). This secondary phase is beneficial for gaseous phase H-storage, which is indicated by the increase in H-storage capacity despite the decrease in unit cell size of the main storage C14 phase at the point of dramatic increase in TiNi (substitution of 1 at % Pd); however, TiNi is detrimental to various electrochemical properties due to its passivating nature with alkaline electrolytes. Although the reactive surface areas of the Pd-containing alloys are smaller, the completeness of gaseous hydrogen desorption, high-rate dischargeability, and low-temperature performance are all improved with the addition of highly catalytic Pd at only 1 at %. Therefore, combining a small amount of Pd with other substitution elements with the capability of increasing capacity and/or reactive surface area, such as Ce, Y, and Si, is recommend for future modification research.
Acknowledgments
The authors would like to thank the following individuals from BASF-Ovonic for their help: Su Cronogue, Baoquan Huang, Diana F. Wong, David Pawlik, Allen Chan, and Ryan J. Blankenship.
Author Contributions
Kwo-Hsiung Young designed the experiments and analyzed the results. Taihei Ouchi prepared the alloy samples and performed the PCT and XRD analysis. Jean Nei prepared the electrode samples and conducted the magnetic measurements. Shiuan Chang assisted in data analysis and manuscript preparation.
Conflicts of Interest
The authors declare no conflict of interest.
Abbreviations
The following abbreviations are used in this manuscript:
| MH | Metal hydride |
| H-storage | Hydrogen storage |
| HRD | High-rate dischargeability |
| AM | Arc melting |
| RD | Replacement-diffusion |
| MA | Mechanical alloying |
| TA | Thermal annealing |
| IM | Induction melting |
| MS | Melt spinning |
| LM | Levitation melting |
| WI | Wet impregnation |
| GP | Gaseous phase |
| EC | Electrochemical |
| Io | Surface exchange current |
| XRD | X-ray diffractometer |
| SEM | Scanning electron microscope |
| PCT | Pressure concentration temperature |
| ICP-OES | Inductively coupled plasma optical emission spectrometer |
| EDS | Energy dispersive spectroscopy |
| M.S. | Magnetic susceptibility |
| ΔHh | Heat of hydride formation |
| hcp | Hexagonal close-packed |
| fcc | Face-centered-cubic |
| bcc | Body-centered-cubic |
| IMC | Intermetallic compound |
| e/a | Average electron density |
| VC14 | Unit cell volume of the C14 phase |
| FWHM | Full width at half maximum |
| BEI | Back-scattering electron image |
| ΔSh | Change in entropy |
| T | Absolute temperature |
| R | Ideal gas constant |
| D | Bulk diffusion coefficient |
| R | Surface charge-transfer resistance |
| C | Surface double-layer capacitance |
| MS | Saturated magnetic susceptibility |
| H1/2 | Applied magnetic field strength corresponding to half of saturated magnetic susceptibility |
References
- Young, K.; Nei, J. The current status of hydrogen storage alloy development for electrochemical applications. Materials 2013, 6, 4574–4608. [Google Scholar] [CrossRef] [PubMed]
- Chang, S.; Young, K.; Nei, J.; Fierro, C. Reviews on the U.S. Patents regarding nickel/metal hydride batteries. Batteries 2016, 2. [Google Scholar] [CrossRef]
- Shaltiel, D.; Jacob, I.; Davidov, D. Hydrogen absorption and desorption properties of AB2 Laves-phase pseudobinary compounds. J. Less Common Met. 1977, 53, 117–131. [Google Scholar] [CrossRef]
- Jacob, I.; Shaltiel, D.; Davidov, D.; Miloslavski, I. A phenomenological model for the hydrogen absorption capacity in pseudobinary Laves phase compounds. Solid State Commun. 1977, 23, 669–671. [Google Scholar] [CrossRef]
- Shaltiel, D. Hydride properties of AB2 Laves-phase compounds. J. Less Common Met. 1978, 62, 407–416. [Google Scholar] [CrossRef]
- Mendelsohn, M.H.; Gruen, D.M. The pseudo-binary system Zr(V1−xCrx)2: Hydrogen absorption and stability considerations. J. Less Common Met. 1981, 78, 275–280. [Google Scholar] [CrossRef]
- Chang, S.; Young, K.; Ouchi, T.; Meng, T.; Nei, J.; Wu, X. Studies on incorporation of Mg in Zr-based AB2 metal hydride alloys. Batteries 2016, 2. [Google Scholar] [CrossRef]
- Young, K.; Wong, D.F.; Ouchi, T.; Huang, B.; Reichman, B. Effects of La-addition to the structure, hydrogen storage, and electrochemical properties of C14 metal hydride alloys. Electrochim. Acta 2015, 174, 815–825. [Google Scholar] [CrossRef]
- Young, K.; Ouchi, T.; Nei, J.; Moghe, D. The importance of rare-earth additions in Zr-based AB2 metal hydride alloys. Batteries 2016, 2. [Google Scholar] [CrossRef]
- Wong, D.F.; Young, K.; Nei, J.; Wang, L.; Ng, K.Y.S. Effects of Nd-addition on the structural, hydrogen storage, and electrochemical properties of C14 metal hydride alloys. J. Alloys Compd. 2015, 647, 507–518. [Google Scholar] [CrossRef]
- Griessen, R.; Riesterer, T. Heat of Formation Models. In Hydrogen in Intermetallic Compounds I; Schlapbach, L., Ed.; Springer: Berlin/Heidelberg, Germany, 1988. [Google Scholar]
- Osumi, Y. Suiso Kyuzou Goukin; Agune Co. Ltd.: Tokyo, Japan, 1993. (In Japanese) [Google Scholar]
- Graham, T. On the absorption and dislytic separation of gases by colloid septa. Philos. Trans. R. Soc. Lond. 1866, 156, 399–439. [Google Scholar] [CrossRef]
- Smith, D.P. Hydrogen in Metals; The University of Chicago Press: Chicago, IL, USA, 1947. [Google Scholar]
- Mackay, K.M. Hydrogen Compounds of the Metallic Elements; E.&F.N. Spon Ltd.: London, UK, 1966. [Google Scholar]
- Muetterties, E.L. The transition metal-hydrogen interaction. In Transition Metal Hydrides; Muetterties, E.L., Ed.; Marcel Dekker, Inc.: New York, NY, USA, 1971. [Google Scholar]
- Sakamoto, Y.; Yuwasa, K.; Hirayama, H. X-ray investigation of the absorption of hydrogen by several palladium and nickel solid solution alloys. J. Less Common Met. 1982, 88, 115–124. [Google Scholar] [CrossRef]
- Żurowski, A.; Łukaszewski, M.; Czerwiński, A. Electrosorption of hydrogen into palladium-rhodium alloys Part 2. Pd-rich electrodes of various thickness. Electrochim. Acta 2008, 53, 7812–7816. [Google Scholar] [CrossRef]
- Rousselot, S.; Bichat, M.-P.; Guay, D.; Roué, L. Structure and electrochemical behavior of metastable Mg50Ti50 alloy prepared by ball milling. J. Power Sources 2008, 175, 621–624. [Google Scholar] [CrossRef]
- Łukaszewski, M.; Hubkowska, K.; Koss, U.; Czerwiński, A. On the nature of voltammetric signals originating from hydrogen electrosorption into palladium-noble metal alloys. Materials 2013, 6, 4817–4835. [Google Scholar] [CrossRef] [PubMed]
- Badri, V.; Hermann, A.M. Metal hydride batteries: Pd nanotube incorporation into the negative electrode. Int. J. Hydrogen Energy 2000, 25, 249–253. [Google Scholar] [CrossRef]
- Zaluska, A.; Zaluski, L.; Ström-Olsen, J.O. Nanocrystalline magnesium for hydrogen storage. J. Alloys Compd. 1999, 288, 217–225. [Google Scholar] [CrossRef]
- Kohno, T.; Yamamoto, M.; Kanda, M. Electrochemical properties of mechanically ground Mg2Ni alloy. J. Alloys Compd. 1999, 293–295, 643–647. [Google Scholar] [CrossRef]
- Janot, R.; Rougier, A.; Aymard, L.; Lenain, C.; Herrera-Urbina, R.; Narzi, G.A.; Tarascon, J.M. Enhancement of hydrogen storage in MgNi by Pd-coating. J. Alloys Compd. 2003, 356–357, 438–441. [Google Scholar] [CrossRef]
- Rivera, M.A.; Pal, U.; Wang, X.; Gonzalez-Rodriguez, J.G.; Gamboa, S.A. Rapid activation of MmNi5−xMx based MH alloy through Pd Nanoparticle impregnation. J. Power Sources 2006, 155, 470–474. [Google Scholar] [CrossRef]
- Visintin, A.; Castro, E.B.; Real, S.G.; Trica, W.E.; Wang, C.; Soriaga, M.P. Electrochemical activation and electrocatalytic enhancement of a hydride-forming metal alloy modified with palladium, platinum and nickel. Electrochim. Acta 2006, 51, 3658–3667. [Google Scholar] [CrossRef]
- Shan, X.; Payer, J.H.; Jennings, W.D. Mechanism of increased performance and durability of Pd-treated metal hydriding alloys. Int. J. Hydrogen Energy 2009, 34, 363–369. [Google Scholar] [CrossRef]
- Uchida, H.H.; Wulz, H.-G.; Fromm, E. Catalytic effect of nickel, iron and palladium on hydriding titanium and storage materials. J. Less Common Met. 1991, 172–174, 1076–1083. [Google Scholar] [CrossRef]
- Matsuoka, M.; Kohno, T.; Iwakura, C. Electrochemical properties of hydrogen storage alloys modified with foreign metals. Electrochim. Acta 1993, 38, 789–791. [Google Scholar] [CrossRef]
- Hjort, P.; Krozer, A.; Kasemo, B. Hydrogen sorption kinetics in partly oxidized Mg films. J. Alloys Compd. 1996, 237, 74–80. [Google Scholar] [CrossRef]
- Visintin, A.; Tori, C.A.; Garaventta, G.; Triaca, W.E. The electrochemical performance of Pd-coated metal hydride electrodes with different binding additives in alkaline solution. J. Electrochem. Soc. 1998, 145, 4169–4172. [Google Scholar] [CrossRef]
- Cuevas, F.; Hirscher, M. The hydrogen desorption kinetics of Pd-coated LaNi5-type films. J. Alloys Compd. 2000, 313, 269–275. [Google Scholar] [CrossRef]
- Hara, M.; Hatano, Y.; Abe, T.; Watanabe, K.; Naitoh, T.; Ikeno, S.; Honda, Y. Hydrogen absorption by Pd-coated ZrNi prepared by using Barrel-sputtering system. J. Nucl. Mat. 2003, 320, 265–271. [Google Scholar] [CrossRef]
- Park, H.J.; Goo, N.H.; Lee, K.S. In situ Pd deposition on Mg2Ni electrode for Ni/MH secondary batteries during charge cycles. J. Electrochem. Soc. 2003, 150, A1328–A1332. [Google Scholar] [CrossRef]
- Barsellini, D.B.; Visintin, A.; Triaca, W.E.; Soriaga, M.P. Electrochemical characterization of a hydride-forming metal alloy surface-modified with palladium. J. Power Sources 2003, 124, 309–313. [Google Scholar] [CrossRef]
- Parimala, R.; Ananth, M.V.; Ramaprabhu, S.; Raju, M. Effect of electroless coating of Cu, Ni and Pd on ZrMn0.2V0.2Fe0.8Ni0.8 alloy used as anodes in Ni-MH batteries. Int. J. Hydrogen Energy 2004, 29, 509–513. [Google Scholar] [CrossRef]
- Yoshimura, K.; Yamada, Y.; Okada, M. Hydrogenation of Pd capped Mg thin films at room temperature. Surf. Sci. 2004, 566–568, 751–754. [Google Scholar] [CrossRef]
- Souza, E.C.; Ticianelli, E.A. Structural and electrochemical properties of MgNi-based alloys with Ti, Pt and Pd additives. Int. J. Hydrogen Energy 2000, 25, 249–253. [Google Scholar] [CrossRef]
- Xin, G.; Yang, J.; Fu, H.; Zheng, J.; Li, X. Pd capped MgxTi1−x films: Promising anode materials for alkaline secondary batteries with superior discharge capacities and cyclic stabilities. Int. J. Hydrogen Energy 2013, 38, 10625–10629. [Google Scholar] [CrossRef]
- Jung, H.; Cho, S.; Lee, W. A catalytic effect on hydrogen absorption kinetics in Pd/Ti/Mg/Ti multilayer thin films. J. Alloys Compd. 2015, 635, 203–206. [Google Scholar] [CrossRef]
- Zhu, M.; Lu, Y.; Ouyang, L.; Wang, H. Thermodynamic tuning of Mg-based hydrogen storage alloys: A review. Materials 2013, 6, 4654–4674. [Google Scholar] [CrossRef] [PubMed]
- Zhang, M.; Hu, R.; Zhang, T.; Kou, H.; Li, J.; Xue, X. Hydrogenation properties of Pd-coated Zr-based Laves phase compounds. Vacuum 2014, 109, 191–196. [Google Scholar] [CrossRef]
- Geng, M. Electrochemical characteristics of Ni-Pd-coated MmNi5-based alloy powder for nickel-metal hydride batteries. J. Alloys Compd. 1995, 217, 90–93. [Google Scholar] [CrossRef]
- Geng, M. Electrochemical characterization of MmNi5-based alloy powder coated with palladium and nickel-palladium. J. Alloys Compd. 1994, 215, 151–153. [Google Scholar] [CrossRef]
- Williams, M.; Lototsky, M.V.; Davids, M.W.; Linkov, V.; Yartyes, V.A.; Solberg, J.K. Chemical surface modification for the improvement of the hydrogenation kinetics and poisoning resistance of TiFe. J. Alloys Compd. 2011, 509, S770–S774. [Google Scholar] [CrossRef]
- Williams, M.; Lototsky, M.; Nechaev, A.; Linkov, V.; Vartys, V.; Li, Q. Surface-modified AB5 alloys with enhanced hydrogen absorption kinetics. In Carbon Nanomaterials in Clean Energy Hydrogen Systems; Barabowski, B., Zaginaichenko, S.Y., Schur, D.V., Skorokhod, V.V., Veziroglu, A., Eds.; Springer: Dordrecht, The Netherlands, 2008; pp. 625–636. [Google Scholar]
- Van Mal, H.H.; Buschow, K.H.J.; Miedema, A.R. Hydrogen absorption in LaNi5 and related compounds: Experimental observations and their explanation. J. Less Common Met. 1974, 35, 65–76. [Google Scholar] [CrossRef]
- Zhang, Y.; Ji, J.; Yuan, H.; Chen, S.; Wang, D.; Zang, T. Synthesis of hydrogen storage compound Mg2Ni0.75Pd0.25 and studies on hydriding-dehydriding properties. Acta Sci. Nat. Univ. Nan Kaiensis 1991, 1, 93–98. (In Chinese) [Google Scholar]
- Zaluski, L.; Zaluska, A.; Ström-Olsen, J.O. Hydrogen absorption in nanacrystalline Mg2Ni formed by mechanical alloying. J. Alloys Compd. 1995, 217, 245–249. [Google Scholar] [CrossRef]
- Zaluski, L.; Zaluska, A.; Tessier, P.; Ström-Olsen, J.O.; Schulz, R. Effects of relaxation on hydrogen absorption in Fe-Yi produced by ball-milling. J. Alloys Compd. 1995, 227, 53–57. [Google Scholar] [CrossRef]
- Tsukahara, M.; Takahashi, K.; Mishima, T.; Isomura, A.; Sakai, T. Influence of various additives in vanadium-based alloys V3TiNi0.56 on secondary phase formation, hydrogen storage properties and electrode properties. J. Alloys Compd. 1996, 245, 59–65. [Google Scholar] [CrossRef]
- Yamashita, I.; Tanaka, H.; Takeshita, H.; Kuriyama, N.; Sakai, T.; Uehara, I. Hydrogenation characteristics of TiFe1−xPdx (0.05 ≤ x≤ 0.30) alloys. J. Alloys Compd. 1997, 253–254, 238–240. [Google Scholar] [CrossRef]
- Wang, C.S.; Lei, Y.Q.; Wang, Q.D. Effects of Nb and Pd on the electrochemical properties of a Ti-Ni hydrogen-storage electrode. J. Power Sources 1998, 70, 222–227. [Google Scholar] [CrossRef]
- Yang, X.G.; Zhang, W.K.; Lei, Y.Q.; Wang, Q.D. Electrochemical properties of Zr-V-Ni system hydrogen storage alloys. J. Electrochem. Soc. 1999, 146, 1245–1250. [Google Scholar] [CrossRef]
- Zeppelin, F.; Reule, H.; Hirscher, M. Hydrogen desorption kinetics of nanostructured MgH2 composite materials. J. Alloys Compd. 2002, 330–332, 723–726. [Google Scholar] [CrossRef]
- Ovshinsky, S.R.; Young, R. High Power Nickel-Metal Hydride Batteries and High Power Alloys/Electrodes for Use Therein. U.S. Patent 6,413,670 B1, 2 July 2002. [Google Scholar]
- Yamaura, S.; Kim, H.; Kimura, H.; Inoue, A.; Arata, Y. Thermal stabilities and discharge capacities of melt-spun Mg-Ni-based amorphous alloys. J. Alloys Compd. 2002, 339, 230–235. [Google Scholar] [CrossRef]
- Yamaura, S.; Kim, H.; Kimura, H.; Inoue, A.; Arata, Y. Electrode properties of rapidly solidified Mg67Ni23Pd10 amorphous alloy. J. Alloys Compd. 2002, 347, 239–243. [Google Scholar] [CrossRef]
- Yamaura, S.; Kimura, H.; Inoue, A. Discharge capacities of melt-spun Mg-Ni-Pd amorphous alloys. J. Alloys Compd. 2003, 358, 173–176. [Google Scholar] [CrossRef]
- Ma, J.; Hatano, Y.; Abe, T.; Watanabe, K. Effects of Pd addition on electrochemical properties of MgNi. J. Alloys Compd. 2004, 372, 251–258. [Google Scholar] [CrossRef]
- Ma, T.; Hatano, Y.; Abe, T.; Watanabe, K. Effects of bulk modification by Pd on electrochemical properties of MgNi. J. Alloys Compd. 2005, 391, 313–317. [Google Scholar] [CrossRef]
- Miyamura, H.; Takada, M.; Kikuchi, S. Characteristics of hydride electrode using Ti-Fe-Pd-X alloys. J. Alloys Compd. 2005, 404–406, 675–678. [Google Scholar] [CrossRef]
- Tian, Q.; Zhang, Y.; Sun, L.; Xu, F.; Tan, Z.; Yuan, H.; Zhang, T. Effects of Pd substitution on the electrochemical properties of Mg0.9−xTi0.1PdxNi (x = 0.04–0.1) hydrogen storage electrode alloys. J. Power Sources 2006, 158, 1463–1471. [Google Scholar] [CrossRef]
- Tian, Q.; Zhang, Y.; Chu, H.; Sun, L.; Xu, F.; Tan, Z.; Yuan, H.; Zhang, T. The electrochemical performances of Mg0.9Ti0.1Ni1−xPdx (x = 0–0.15) hydrogen storage electrode alloys. J. Power Sources 2006, 159, 155–158. [Google Scholar] [CrossRef]
- Tian, Q.; Zhang, Y.; Tan, Z.; Xu, F.; Sun, L.; Zhang, T.; Yuan, H. Effects of Pd substitution for Ni on the corrosion performances of Mg0.9Ti0.1Ni1–xPdx hydrogen storage electrode alloys. Trans. Nonferrous Met. Soc. China 2006, 16, 497–501. [Google Scholar] [CrossRef]
- Tian, Q.; Zhang, Y.; Sun, L.; Xu, F.; Yuan, H. The hydrogen desorption kinetics of Mg0.9−xTi0.1PdxNi (x = 0.04, 0.06, 0.08, 0.1) electrode alloys. J. Alloys Compd. 2007, 446–447, 121–123. [Google Scholar] [CrossRef]
- Pinkerton, F.E.; Balogh, M.P.; Meyer, M.S.; Meisner, G.P. Hydrogen Generation Material. U.S. Patent Application 2006/0,057,049 A1, 16 March 2006. [Google Scholar]
- Yermakov, A.Y.; Mushnikov, N.V.; Uimin, M.A.; Gaviko, V.S.; Tankeev, A.P.; Skripov, A.V.; Soloninin, A.V.; Buzlukov, A.L. Hydrogen reaction kinetics of Mg-based alloys synthesized by mechanical milling. J. Alloys Compd. 2006, 425, 367–372. [Google Scholar] [CrossRef]
- Berlouis, L.E.A.; Honnor, P.; Hall, P.J.; Morris, S.; Dodd, S.B. An investigation of the effect of Ti, Pd, and Zr on the dehydriding kinetics of MgH2. J. Mater. Sci. 2006, 41, 6403–6408. [Google Scholar] [CrossRef]
- Kalisvaart, W.P.; Wondergem, H.J.; Bakker, F.; Notten, P.H.L. Mg-Ti based materials for electrochemical hydrogen storage. J. Mater. Res. 2007, 22, 1640–1649. [Google Scholar] [CrossRef]
- Spassov, T.; Todorova, S.; Jung, W.; Borissova, A. Hydrogen sorption properties of ternary intermetallic Mg-(Ir,Rh,Pd)-Si compounds. J. Alloys Compd. 2007, 429, 306–310. [Google Scholar] [CrossRef]
- Yvon, K.; Rapin, J.-Ph.; Penin, N.; Ma, Z.; Chou, M.Y. LaMg2PdH7, a new complex metal hydride containing tetrahedral [PdH4]4− anion. J. Alloys Compd. 2007, 446–447, 34–38. [Google Scholar] [CrossRef]
- Jeng, R.; Lee, S.; Hsu, C.; Wu, Y.; Lin, J. Effects of the addition of Pd on the hydrogen absorption-desorption characteristics of Ti33V33Cr34 alloys. J. Alloys Compd. 2008, 464, 467–471. [Google Scholar] [CrossRef]
- Liu, Y.; Zhang, S.; Li, R.; Gao, M.; Zhong, K.; Miao, H.; Pan, H. Electrochemical performances of the Pd-added Ti-V-based hydrogen storage alloys. Int. J. Hydrogen Energy 2008, 33, 728–734. [Google Scholar] [CrossRef]
- Liu, B.; Zhang, Y.; Mi, G.; Zhang, Z.; Wang, L. Crystallographic and electrochemical characteristics of Ti-Zr-Ni-Pd quasicrystalline alloys. Int. J. Hydrog. Energy 1008, 34, 6925–6929. [Google Scholar] [CrossRef]
- Tian, Q.; Zhang, Y.; Chu, H.; Ding, Y.; Wu, Y. Electrochemical impedance study of discharge characteristics of Pd substituted MgNi-based hydrogen storage electrode alloys. J. Alloys Compd. 2009, 481, 826–829. [Google Scholar] [CrossRef]
- Gao, L.; Yao, E.; Nakamura, J.; Zhang, W.; Chua, H. Hydrogen storage in Pd-Ni doped defective carbon nanotubes through the formation of CHx (x = 1, 2). Carbon 2010, 48, 3250–3255. [Google Scholar] [CrossRef]
- Rousselot, S.; Gazeau, A.; Guay, D.; Roué, L. Influence of Pd on the structure and electrochemical hydrogen storage properties of Mg50Ti50 alloy prepared by ball milling. Electrochim. Acta 2010, 55, 611–619. [Google Scholar] [CrossRef]
- Ruiz, F.C.; Peretti, H.A.; Visintin, A. Electrochemical hydrogen storage in ZrCrNiPdx alloys. Int. J. Hydrogen Energy 2010, 35, 5963–5967. [Google Scholar] [CrossRef]
- Okonska, I.; Jurczyk, M. Hydriding properties of Mg-3d/M-type nanocomposites (3d = Cu, Ni; M = Ni, Cu, Pd). Phys. Status Solidi A 2010, 207, 1139–1143. [Google Scholar] [CrossRef]
- Emami, H.; Cuevas, F. Hydrogenation properties of shape memory Ti(Ni,Pd) compounds. Intermetallics 2011, 19, 876–886. [Google Scholar] [CrossRef]
- Anik, M.; Özdemir, G.; Küҫükdeveci, N. Electrochemical hydrogen storage characteristics of Mg-Pd-Ni ternary alloys. Int. J. Hydrogen Energy 2011, 36, 6744–6750. [Google Scholar] [CrossRef]
- Prigent, J.; Joubert, J.-M.; Gupta, M. Investigation of modification of hydrogenation and structural properties of LaNi5 intermetallic compound induced by substitution of Ni by Pd. J. Solid State Chem. 2011, 184, 123–133. [Google Scholar] [CrossRef]
- Anik, M. Improvement of the electrochemical hydrogen storage performance of magnesium based alloys by various additive elements. Int. J. Hydrogen Energy 2012, 37, 1905–1911. [Google Scholar] [CrossRef]
- Lin, K.; Mai, Y.; Chiu, W.; Yang, J.; Chan, S.L.I. Synthesis and characterization of metal hydride/carbon aerogel composites for hydrogen storage. J. Nanomater. 2012, 20154. [Google Scholar] [CrossRef]
- Etiemble, A.; Rousselot, S.; Guo, W.; Idrissi, H.; Roué, L. Influence of Pd addition on the electrochemical performance of Mg-Ni-Ti-Al-based metal hydride for Ni-MH batteries. Int. J. Hydrogen Energy 2013, 38, 10625–10629. [Google Scholar] [CrossRef]
- Santos, S.F.; Castro, J.F.R.; Ticianelli, E.A. Microstructures and electrode performances of Mg50Ni(50−x)Pdx alloys. Cent. Eur. Chem. 2013, 11, 485–491. [Google Scholar] [CrossRef]
- Williams, M.; Sibanyoni, J.M.; Lototskyy, M.; Pollet, B.G. Hydrogen absorption study of high-energy reactive ball milled Mg composites with palladium additives. J. Alloys Compd. 2013, 580, S144–S148. [Google Scholar] [CrossRef]
- Nikkuni, F.R.; Santos, S.F.; Ticianelli, E.A. Microstructures and electrochemical properties of Mg49Ti6Ni(45−x)Mx (M = Pd and Pt) alloy electrodes. Int. J. Energy Res. 2013, 37, 706–712. [Google Scholar] [CrossRef]
- Teresiak, A.; Uhlemann, M.; Thomas, J.; Eckert, J.; Gebert, A. Influence of Co and Pd on the formation of nanostructured LaMg2Ni and its hydrogen reactivity. J. Alloys Compd. 2014, 582, 647–658. [Google Scholar] [CrossRef]
- Balcerzak, M.; Nowak, M.; Jakubowicz, J.; Jurczyk, M. Electrochemical behavior of Nanocrystalline TiNi doped by MWCNTs and Pd. Renew. Energy 2014, 62, 432–438. [Google Scholar] [CrossRef]
- Zhang, Y.; Zhuang, X.; Zhu, Y.; Zhan, L.; Pu, Z.; Wan, N.; Li, L. Effects of additive Pd on the structures and electrochemical hydrogen storage properties of Mg67Co33-based composited or alloys with BCC phase. J. Alloys Compd. 2015, 622, 580–586. [Google Scholar] [CrossRef]
- Zhan, L.; Zhang, Y.; Zhu, Y.; Zhuang, X.; Dong, J.; Guo, X.; Chen, J.; Wang, Z.; Li, L. The electrochemical hydrogen storage properties of Mg67−xPdxCo33 (x = 1, 3, 5, 7) electrodes with BCC phase. J. Alloys Compd. 2016, 662, 396–403. [Google Scholar] [CrossRef]
- Banerjee, S.; Dasgupta, K.; Kumar, A.; Ruz, P.; Vishwanadh, B.; Joshi, J.B.; Sudarsan, V. Comparative evaluation of hydrogen storage behavior of Pd dopes carbon nanotubes prepared by wet impregnation and polyol methods. Int. J. Hydrogen Energy 2015, 40, 3268–3276. [Google Scholar] [CrossRef]
- Dündar-Tekkaya, E.; Yürüm, Y. Effect of loading bimetallic mixture of Ni and Pd on hydrogen storage capacity of MCM-41. Int. J. Hydrog. Energy 2015, 40, 7636–7643. [Google Scholar] [CrossRef]
- Ismail, N.; Madian, M.; El-Shall, M.S. Reduced graphene oxide doped with Ni/Pd nanoparticles for hydrogen storage application. J. Ind. Eng. Chem. 2015, 30, 328–335. [Google Scholar] [CrossRef]
- Balcerzak, M. Electrochemical and structural studies on Ti-Zr-Ni and Ti-Zr-Ni-Pd alloys and composites. J. Alloys Compd. 2016, 658, 576–587. [Google Scholar] [CrossRef]
- Giasafaki, D.; Charalambopoulou, G.; Tampaxis, Ch.; Dimos, K.; Gournis, D.; Stubos, A. Comparing hydrogen sorption in different Pd-doped pristine and surface-modified nanoporous carbons. Carbon 2016, 98, 1–14. [Google Scholar] [CrossRef]
- Crivello, J.-C.; Denys, R.V.; Dornheim, M.; Felderhoff, M.; Grant, D.M.; Huot, J.; Jensen, T.R.; Jongh, P.; Latroche, M.; Walker, G.S.; et al. Mg-based compounds for hydrogen and energy storage. Appl. Phys. A 2016, 122, 85. [Google Scholar] [CrossRef]
- Abdul, J.M. Development of titanium alloys for hydrogen storage. Ph.D. Thesis, University of the Witwatersrand, Johannesburg, South Africa, December 2015. Available online: http://wiredspace.wits.ac.za/handle/10539/21151 (accessed on 11 August 2017).
- Zhan, L.; Zhang, Y.; Zhu, Y.; Zhuang, X.; Wan, N.; Qu, Y.; Guo, X.; Chen, J.; Wang, Z.; Li, L. Electrochemical performances of Mg45M5Co50 (M = Pd, Zr) ternary hydrogen storage electrodes. Trans. Nonferrous Met. Soc. China 2016, 26, 1388–1395. [Google Scholar] [CrossRef]
- Tosques, J.; Guerreiro, B.H.; Martin, M.H.; Roué, L.; Guay, D. Hydrogen solubility of bcc PdCu and PdCuAg alloys prepared by mechanical alloys. J. Alloys Compd. 2017, 698, 725–730. [Google Scholar] [CrossRef]
- Young, K.; Fetcenko, M.A.; Li, F.; Ouchi, T. Structural, thermodynamics, and electrochemical properties of TixZr1−x(VNiCrMnCoAl)2 C14 Laves phase alloys. J. Alloys Compd. 2008, 464, 238–247. [Google Scholar] [CrossRef]
- Young, K.; Fetcenko, M.A.; Koch, J.; Morii, K.; Shimizu, T. Studies of Sn, Co, Al, and Fe additives in C14/C15 Laves alloys for NiMH battery application by orthogonal arrays. J. Alloys Compd. 2009, 486, 559–569. [Google Scholar] [CrossRef]
- Price of Palladium. Available online: http://www.apmex.com/spotprices/palladium-price (accessed on 18 October 2016).
- Price of Nickel. Available online: www.infomine.com/investment/metal-prices/nickel/ (accessed on 18 October 2016).
- Rennert, P.; Radwan, A.M. Structural investigation of the Laves phase MgZn2 with model potential calculations. Phys. Status Solidi B 1977, 79, 167–173. [Google Scholar] [CrossRef]
- Douglas, B.E.; Ho, S.M. Structure and Chemistry of Crystalline Solids; Springer Science + Business, Inc.: New York, NY, USA, 2006. [Google Scholar]
- Yakoubi, A.; Baraka, O.; Bouhafs, B. Structural and electronic properties of the Laves phase based on rare earth type BaM2 (M = Rh, Pd, Pt). Results Phys. 2012, 2, 58–65. [Google Scholar] [CrossRef]
- Palladium Hydride. Available online: https://en.wikipedia.org/wiki/Palladium_hydride (accessed on 18 October 2016).
- Adams, B.D.; Chen, A. The role of palladium in a hydrogen economy. Mater. Today 2011, 14, 282–289. [Google Scholar] [CrossRef]
- Nihon Kinzoku Gakkai. Hi Kagaku Ryouronteki Kinzoku Kagobutsu; Maruzen: Tokyo, Japan, 1975; p. 296. [Google Scholar]
- Crystal Structure of the Elements. Available online: http://www.periodictable.com/Properties/A/CrystalStructure.html (accessed on 13 October 2016).
- Lide, D.R. CRC Handbook of Chemistry and Physics, 74th ed.; CRC Press Inc.: Boca Raton, FL, USA, 1993. [Google Scholar]
- Murray, J.L. Ti-Zr binary phase diagram. In ASM Handbook, Vol. 3 Alloy Phase Diagram; Baker, H., Ed.; ASM International: Materials Park, OH, USA, 1992. [Google Scholar]
- Zhu, J.H.; Liu, C.T.; Pike, L.M.; Liaw, P.K. Enthalpies of formation of binary Laves phases. Intermetallics 2002, 10, 579–595. [Google Scholar] [CrossRef]
- Liu, C.T.; Zhu, J.H.; Brady, M.P.; McKamey, C.G.; Pike, L.M. Physical metallurgy and mechanical properties of transition-metal Laves phase alloys. Intermetallics 2000, 8, 1119–1129. [Google Scholar] [CrossRef]
- Johnston, R.L.; Hoffmann, R. Structure-bonding relationships in the Laves phases. Z. Anorg. Allg. Chem. 1992, 616, 105–120. [Google Scholar] [CrossRef]
- Young, K.; Ouchi, T.; Fetcenko, M.A. Pressure-composition-temperature hysteresis in C14 Laves phase alloys: Part 1. Simple ternary alloys. J. Alloys Compd. 2009, 480, 428–433. [Google Scholar] [CrossRef]
- Nei, J.; Young, K.; Salley, S.O.; Ng, K.Y.S. Determination of C14/C15 phase abundance in Laves phase alloys. Mater. Chem. Phys. 2012, 135, 520–527. [Google Scholar] [CrossRef]
- Young, K.; Fetcenko, M.A.; Li, F.; Ouchi, T.; Koch, J. Effect of vanadium substitution in C14 Laves phase alloys for NiMH battery application. J. Alloys Compd. 2009, 468, 482–492. [Google Scholar] [CrossRef]
- Young, K.; Regmi, R.; Lawes, G.; Ouchi, T.; Fetcenko, M.A.; Wu, A. Effect of aluminum substitution in C14-rich multi-component alloys for NiMH battery application. J. Alloys Compd. 2010, 490, 282–292. [Google Scholar] [CrossRef]
- Young, K.; Fetcenko, M.A.; Ouchi, T.; Li, F.; Koch, J. Effect of Sn-substitution in C14 Laves phase alloys for NiMH battery application. J. Alloys Compd. 2009, 469, 406–416. [Google Scholar] [CrossRef]
- Boriskina, N.G.; Kenina, E.M. Phase equilibria in the Ti-TiPd-TiNi system alloys. In Proceedings of the 4th International Conference on Titanium 80, Science & Technology, Kyoto, Japan, 19–22 May 1980; Kimura, H., Izumi, O., Eds.; The Metallurgical Society of AIME: Warrendale, PA, USA, 1980; pp. 2917–2927. [Google Scholar]
- Ghost, G. Nickel-Palladium-Titanium. In Light Metal System. Part 4 Selected Systems from Al-Si-Ti to Ni-Si-Ti; Effenberg, D., Ilyenko, S., Eds.; Springer: Berlin/Heidelberg, Germany, 2006; pp. 425–434. [Google Scholar]
- Thoma, D.J.; Perepezko, J.H. A geometric analysis of solubility ranges in Laves phases. J. Alloys Compd. 1995, 224, 330–341. [Google Scholar] [CrossRef]
- Young, K.; Ouchi, T.; Nei, J.; Wang, L. Annealing effects on Laves phase-related body-centered-cubic solid solution metal hydride alloys. J. Alloys Compd. 2016, 654, 216–225. [Google Scholar] [CrossRef]
- Bououdina, M.; Soubeyroux, J.L.; De Rango, P.; Fruchart, D. Phase stability and neutron diffraction studies of the laves phase compounds Zr(Cr1−xMox)2 with 0.0 ≤ x ≤ 0.5 and their hydrides. Int. J. Hydrogen Energy 2000, 25, 1059–1068. [Google Scholar] [CrossRef]
- Young, K.; Ouchi, T.; Huang, B.; Reichman, B.; Fetcenko, M.A. Effect of molybdenum content on structural, gaseous storage, and electrochemical properties of C14-predominated AB2 metal hydride alloys. J. Power Sources 2011, 196, 8815–8821. [Google Scholar] [CrossRef]
- Young, K.; Ouchi, T.; Lin, X.; Reichman, B. Effects of Zn-addition to C14 metal hydride alloys and comparisons to Si, Fe, Cu, Y, and Mo-additives. J. Alloys Compd. 2016, 655, 50–59. [Google Scholar] [CrossRef]
- Boettinger, W.J.; Newbury, D.E.; Wang, K.; Bendersky, L.A.; Chiu, C.; Kattner, U.R.; Young, K.; Chao, B. Examination of multiphase (Zr, Ti) (V, Cr, Mn, Ni)2 Ni-MH electrode alloys: Part I. Dendritic solidification structure. Metall. Mater. Trans. 2010, 41A, 2033–2047. [Google Scholar] [CrossRef]
- Bendersky, L.A.; Wang, K.; Boettinger, W.J.; Newbury, D.E.; Young, K.; Chao, B. Examination of multiphase (Zr, Ti) (V, Cr, Mn, Ni)2 Ni-MH electrode alloys: Part II. Solid-state transformation of the interdendric B2 phase. Metall. Mater. Trans. 2010, 41A, 1891–1906. [Google Scholar] [CrossRef]
- Liu, Y.; Young, K. Microstructure investigation on metal hydride alloys by electron backscatter diffraction technique. Batteries 2016, 2. [Google Scholar] [CrossRef]
- Wong, D.F.; Young, K.; Ouchi, T.; Ng, K.Y.S. First-principles point defect models for Zr7Ni10 and Zr2Ni7 phases. Batteries 2016, 2. [Google Scholar] [CrossRef]
- Young, K.; Ouchi, T.; Koch, J.; Fetcenko, M.A. Compositional optimization of vanadium-free hypo-stoichiometric AB2 metal hydride for Ni/MH battery application. J. Alloys Compd. 2012, 510, 97–106. [Google Scholar] [CrossRef]
- Young, K.; Ouchi, T.; Huang, B.; Reichman, B.; Blankenship, R. Improvement in −40 °C electrochemical properties of AB2 metal hydride alloy by silicon incorporation. J. Alloys Compd. 2013, 575, 65–72. [Google Scholar] [CrossRef]
- Young, K.; Ouchi, T.; Meng, T.; Wong, D.F. Studies on the synergetic effects in multi-phase metal hydride alloys. Batteries 2016, 2. [Google Scholar] [CrossRef]
- Young, K.; Wong, D.F.; Nei, J. Effects of vanadium/nickel contents in Laves phase-related body-centered-cubic solid solution metal hydride alloys. Batteries 2015, 1, 34–53. [Google Scholar] [CrossRef]
- Sinha, V.K.; Pourarian, F.; Wallace, W.E. Hydrogenation characteristics of Zr1−xTixMnFe alloys. J. Less Common Met. 1982, 87, 283–296. [Google Scholar] [CrossRef]
- Lee, H.; Lee, K.; Lee, J. The hydrogenation characteristics of Ti-Zr-V-Mn-Ni C14 type Laves phase alloys for metal hydride electrodes. J. Alloys Compd. 1997, 253–254, 601–604. [Google Scholar] [CrossRef]
- Pourbaix, M.J.N.; Van Muylder, J.; De Zoubov, N. Electrochemical properties of the platinum metals. Platinum Met. Rev. 1959, 3, 100–106. [Google Scholar]
- Young, K.; Reichman, B.; Fetcenko, M.A. Electrochemical performance of AB2 metal hydride alloys measured at −40 °C. J. Alloys Compd. 2013, 580, S349–S352. [Google Scholar] [CrossRef]
- Young, K.; Huang, B.; Regmi, R.K.; Lawes, G.; Liu, Y. Comparisons of metallic clusters imbedded in the surface of AB2, AB5, and A2B7 alloys. J. Alloys Compd. 2010, 506, 831–840. [Google Scholar] [CrossRef]
- Young, K.; Chao, B.; Liu, Y.; Nei, J. Microstructures of the oxides on the activated AB2 and AB5 metal hydride alloys surface. J. Alloys Compd. 2014, 606, 97–104. [Google Scholar] [CrossRef]
- Stucki, F.; Schlapbach, L. Magnetic properties of LaNi5, FeTi, Mg2Ni and their hydrides. J. Less Common Met. 1980, 74, 143–151. [Google Scholar] [CrossRef]
- Young, K.; Chao, B.; Pawlik, D.; Shen, H.T. Transmission electron microscope studies in the surface oxide on the La-containing AB2 metal hydride alloy. J. Alloys Compd. 2016, 672, 356–365. [Google Scholar] [CrossRef]
Figure 1.
X-ray diffraction (XRD) patterns using Cu-Kα as the radiation source for alloys (a) Pd0, (b) Pd1, (c) Pd2, (d) Pd3, (e) Pd4, and (f) Pd5. In addition to the two Laves phases, another cubic phase is also identified. Vertical lines indicate the shifts of the TiNi and main C14/C15 peaks into lower and higher angles, respectively, with increasing Pd-content in design.

Figure 2.
Evolution of the lattice constants of the (a) C14 and (b) C15 and TiNi phases with increasing Pd-content in design.
Figure 2.
Evolution of the lattice constants of the (a) C14 and (b) C15 and TiNi phases with increasing Pd-content in design.
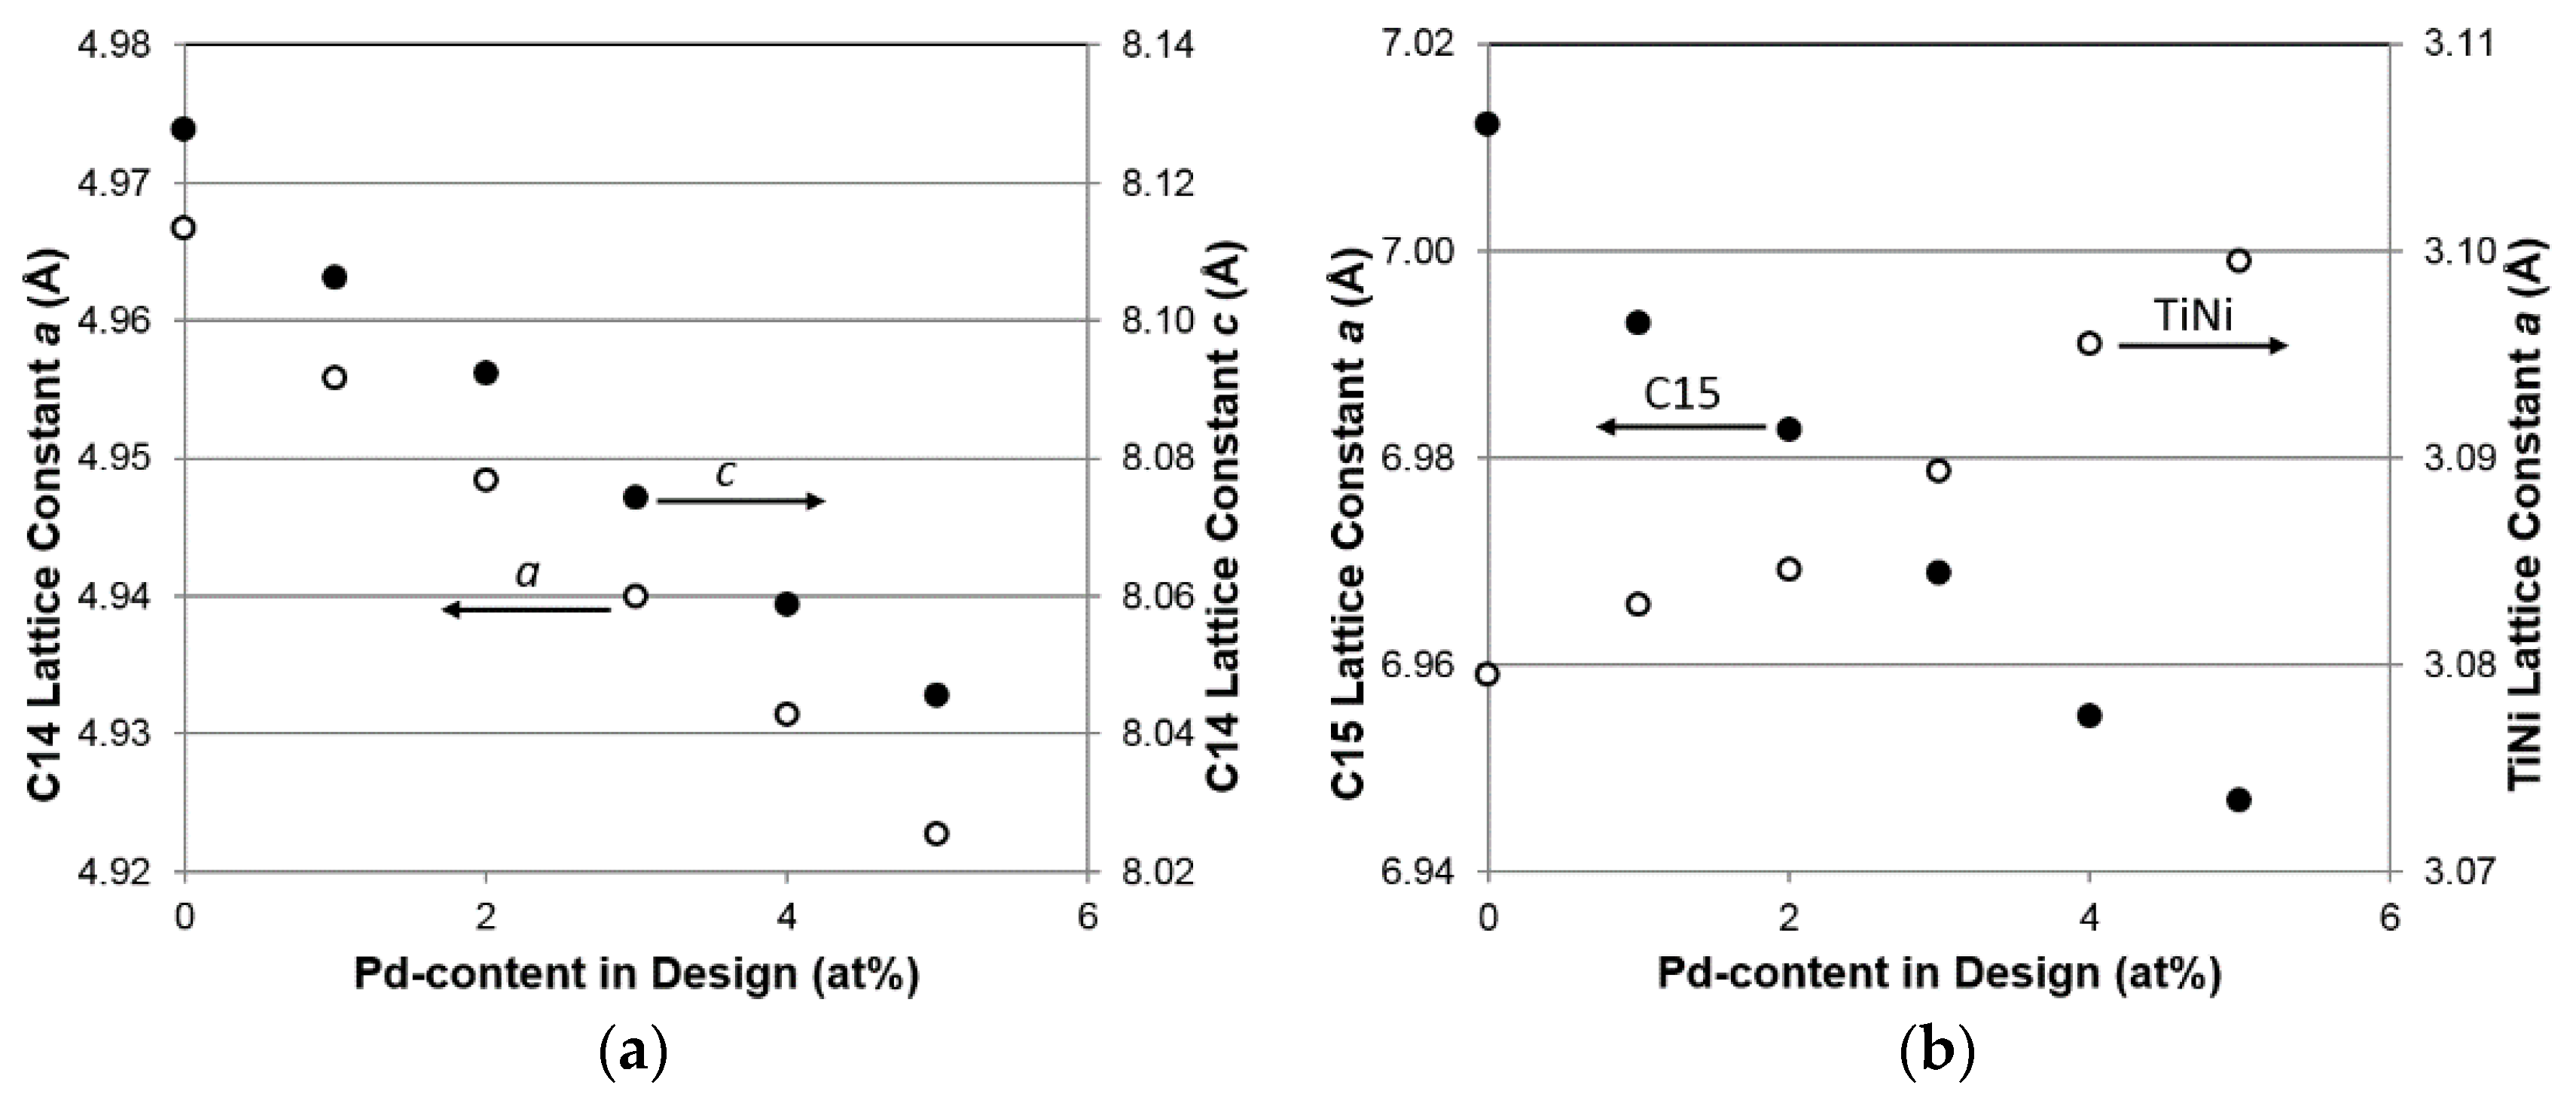
Figure 3.
Evolution of the C14, C15, and TiNi phase abundances with increasing Pd-content in design.
Figure 3.
Evolution of the C14, C15, and TiNi phase abundances with increasing Pd-content in design.
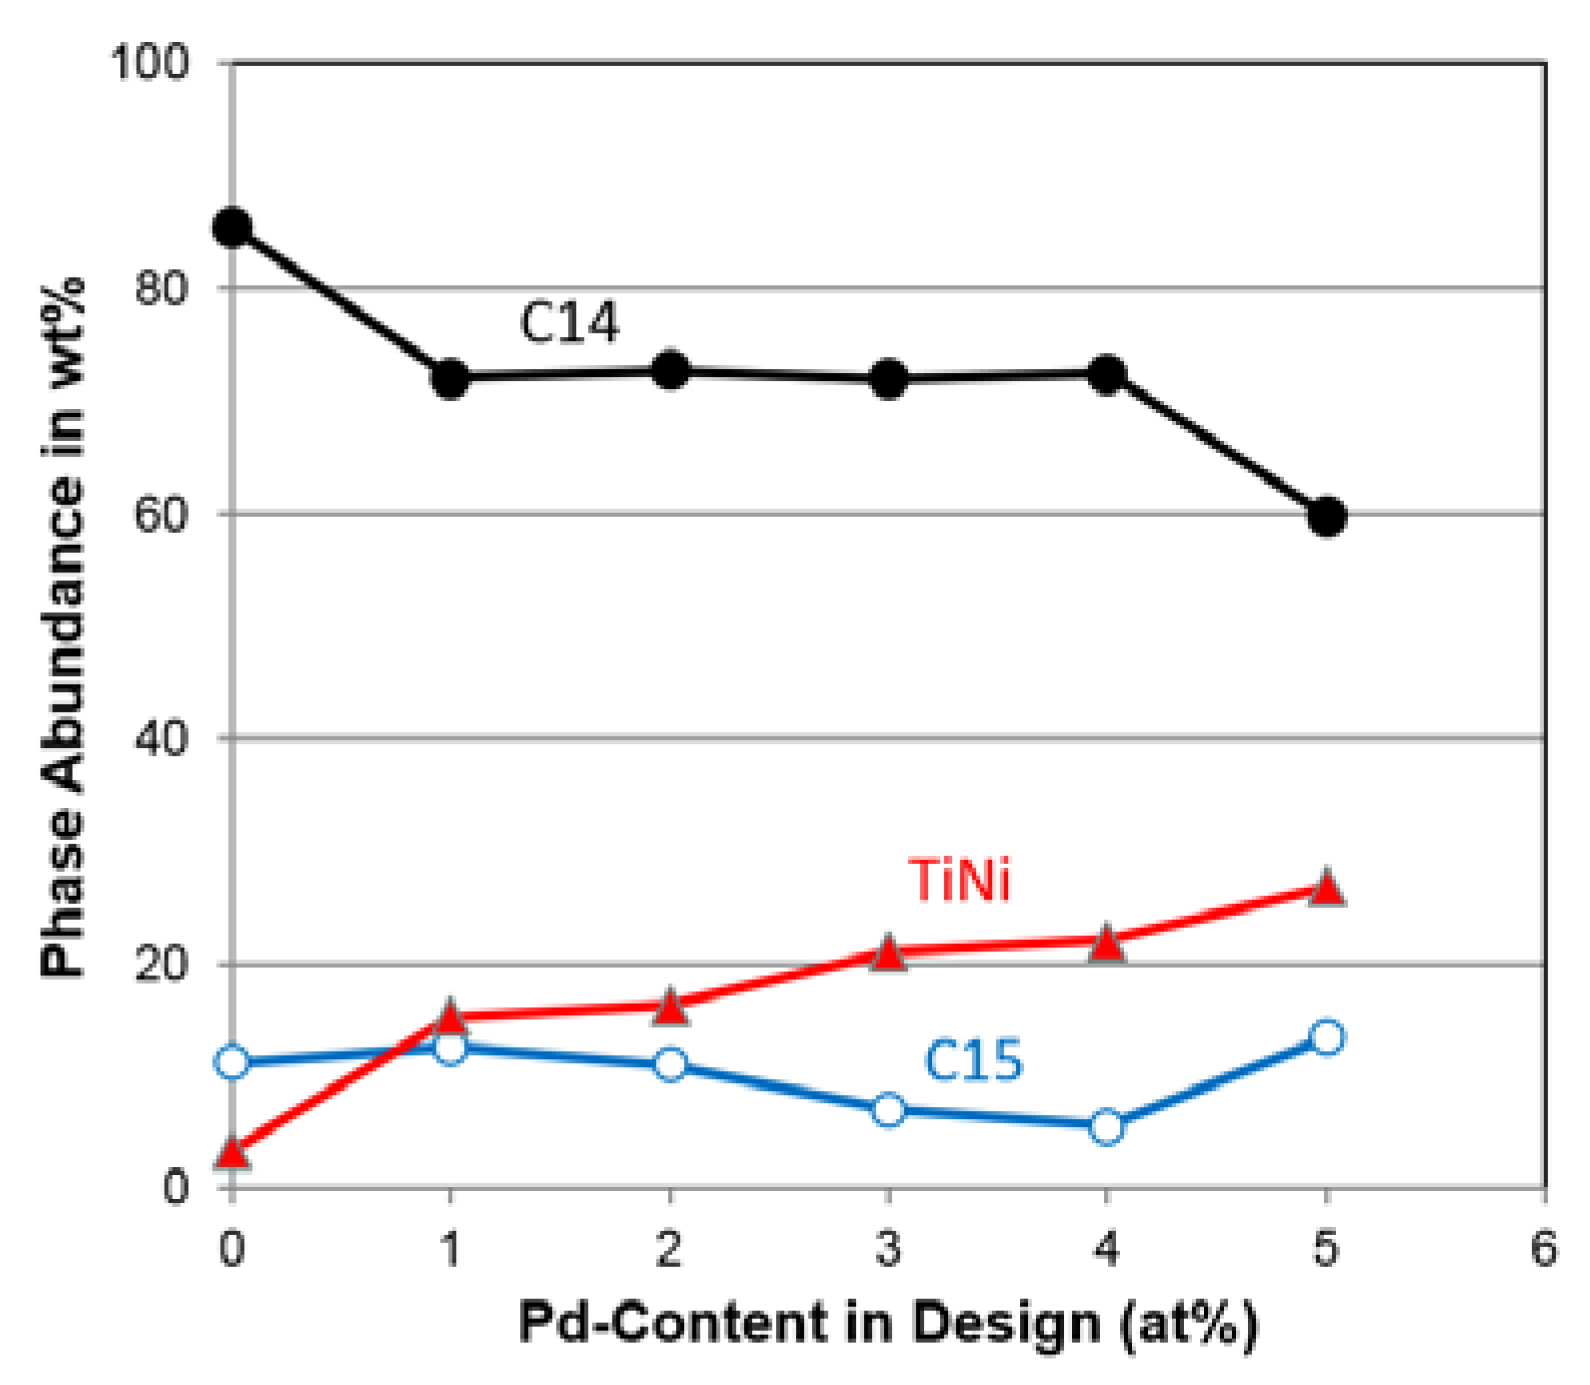
Figure 4.
Scanning Electron Microscope Backscattering Electron Images (SEM BEI) micrographs from alloys (a) Pd1, (b) Pd2, (c) Pd3, (4) Pd4, and (e) Pd5. The composition of the numbered areas was analyzed by EDS, and the results are shown in Table 5. The bar at the lower right corner in each micrograph represents 25 μm.
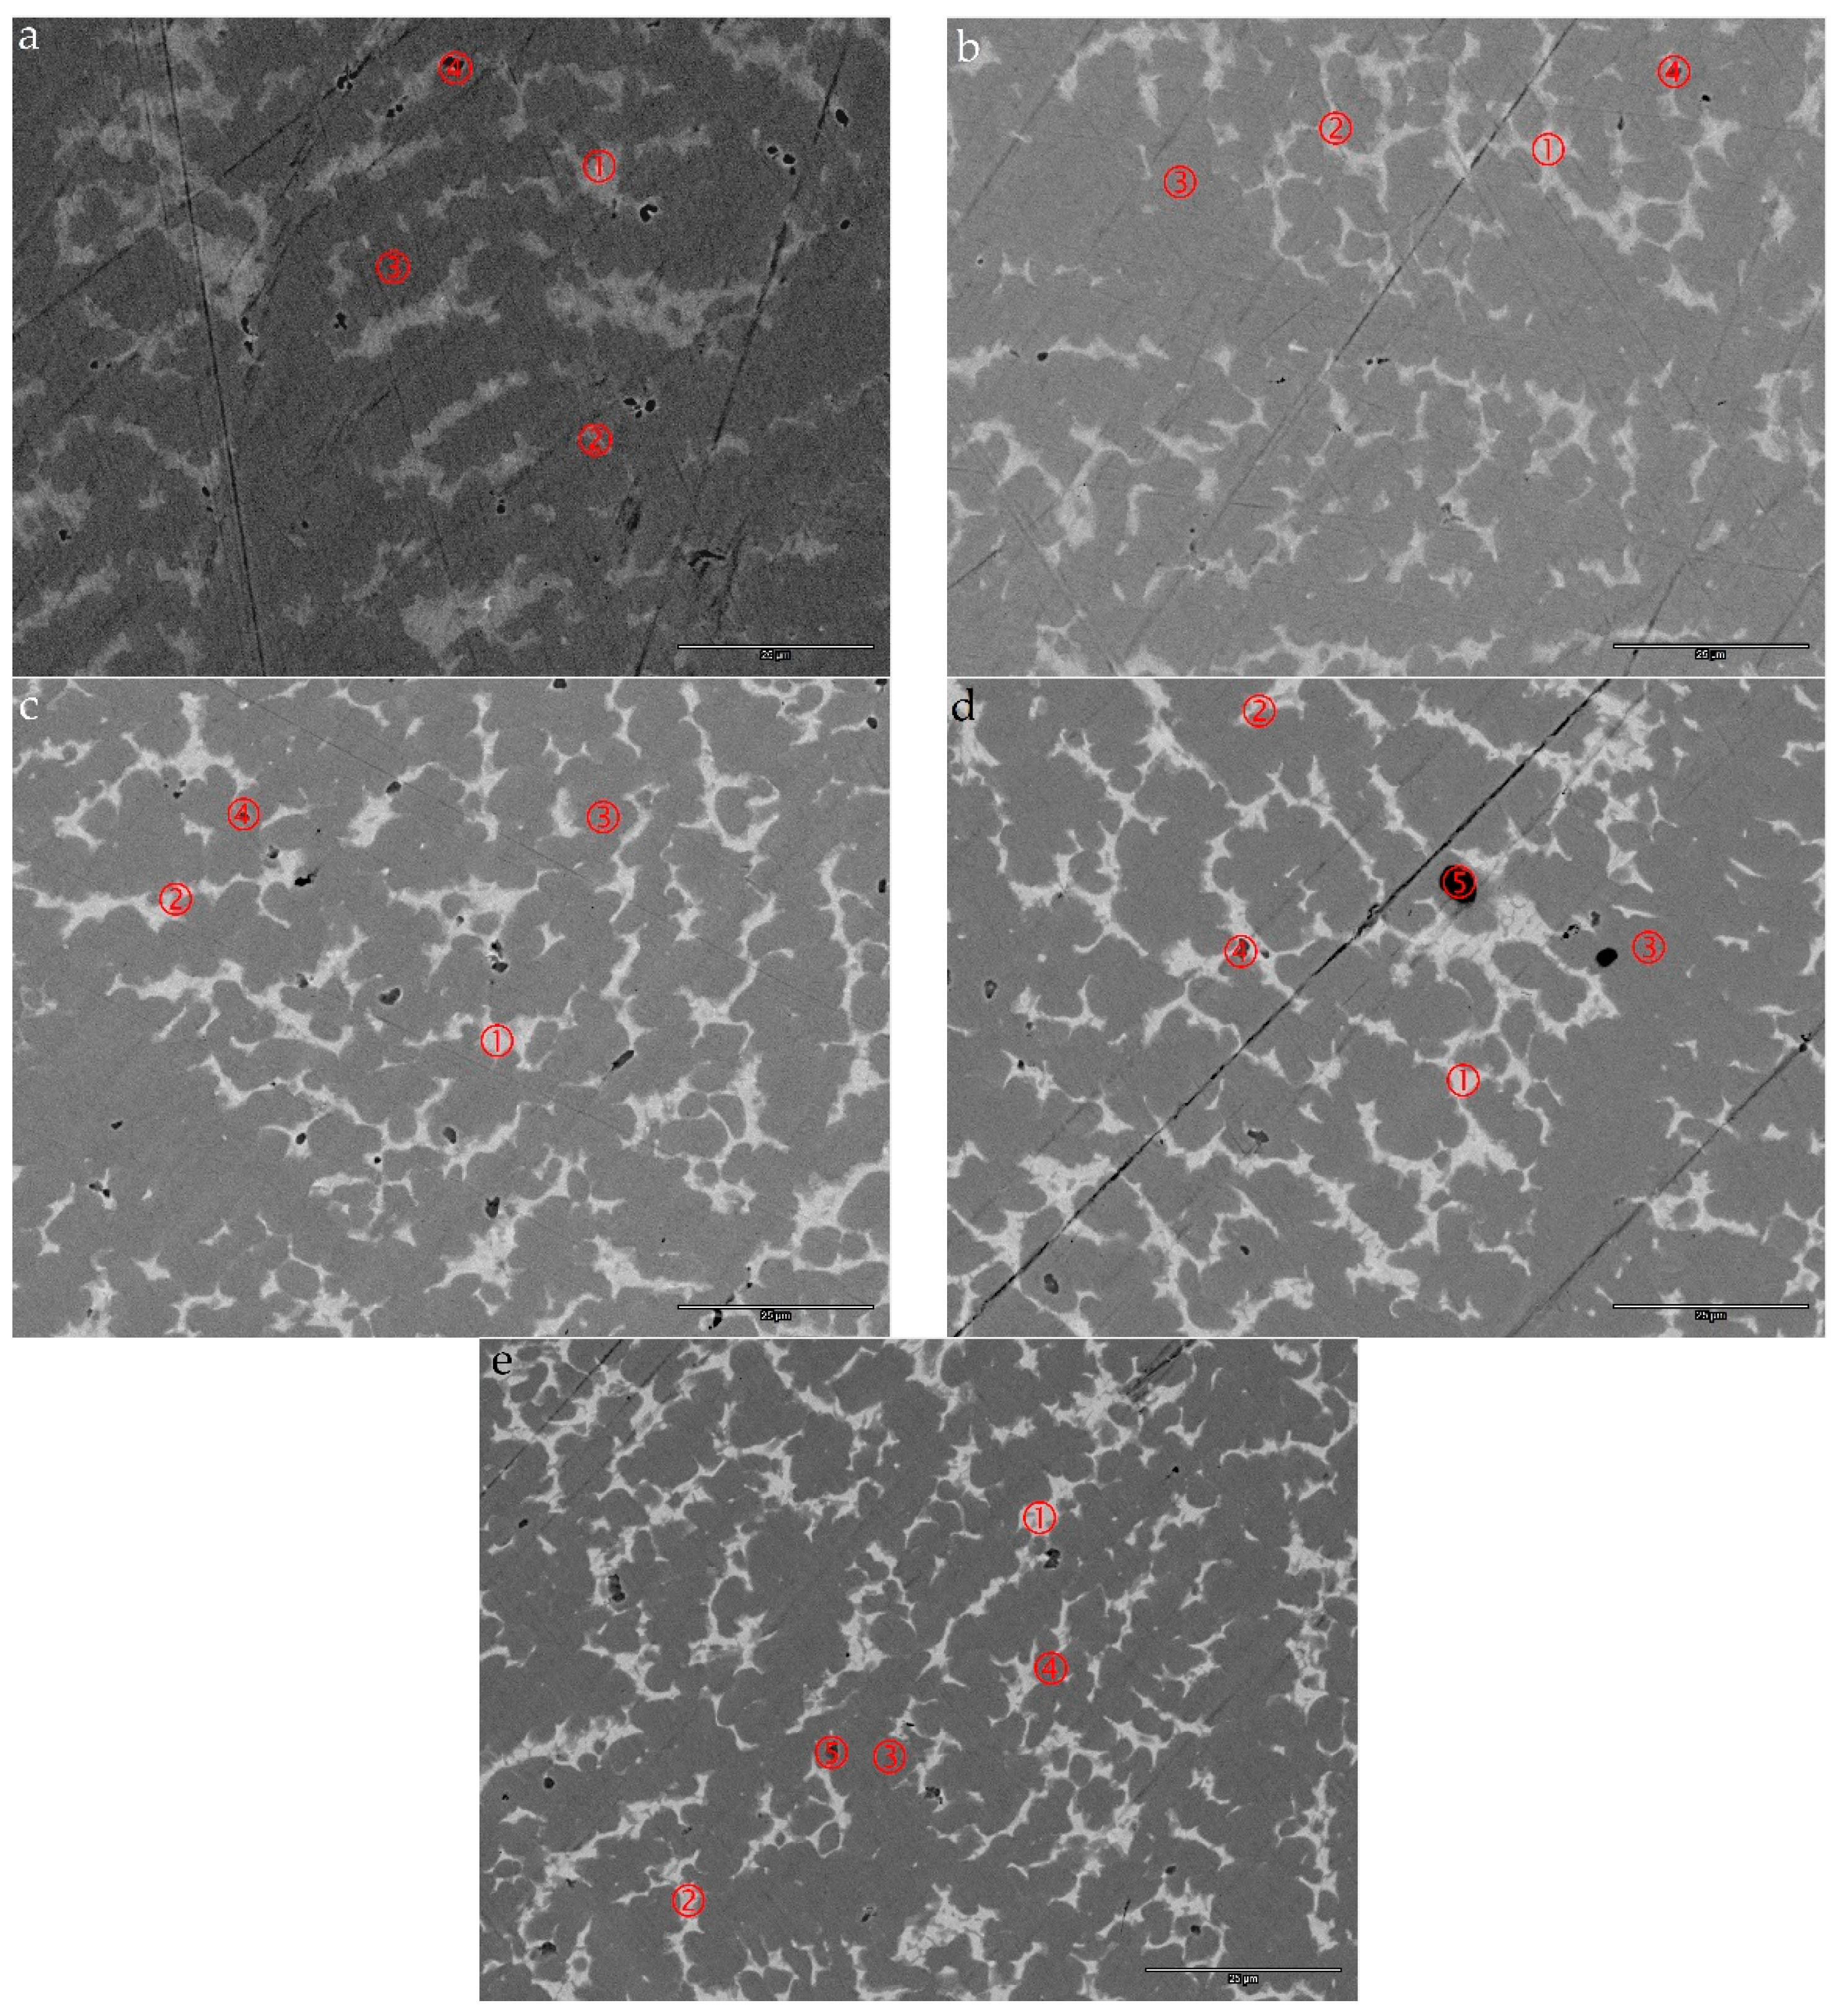
Figure 5.
Evolution of the contents of the major constituting elements in the (a) TiNi and (b) C14 phases with increasing Pd-content in design.
Figure 5.
Evolution of the contents of the major constituting elements in the (a) TiNi and (b) C14 phases with increasing Pd-content in design.
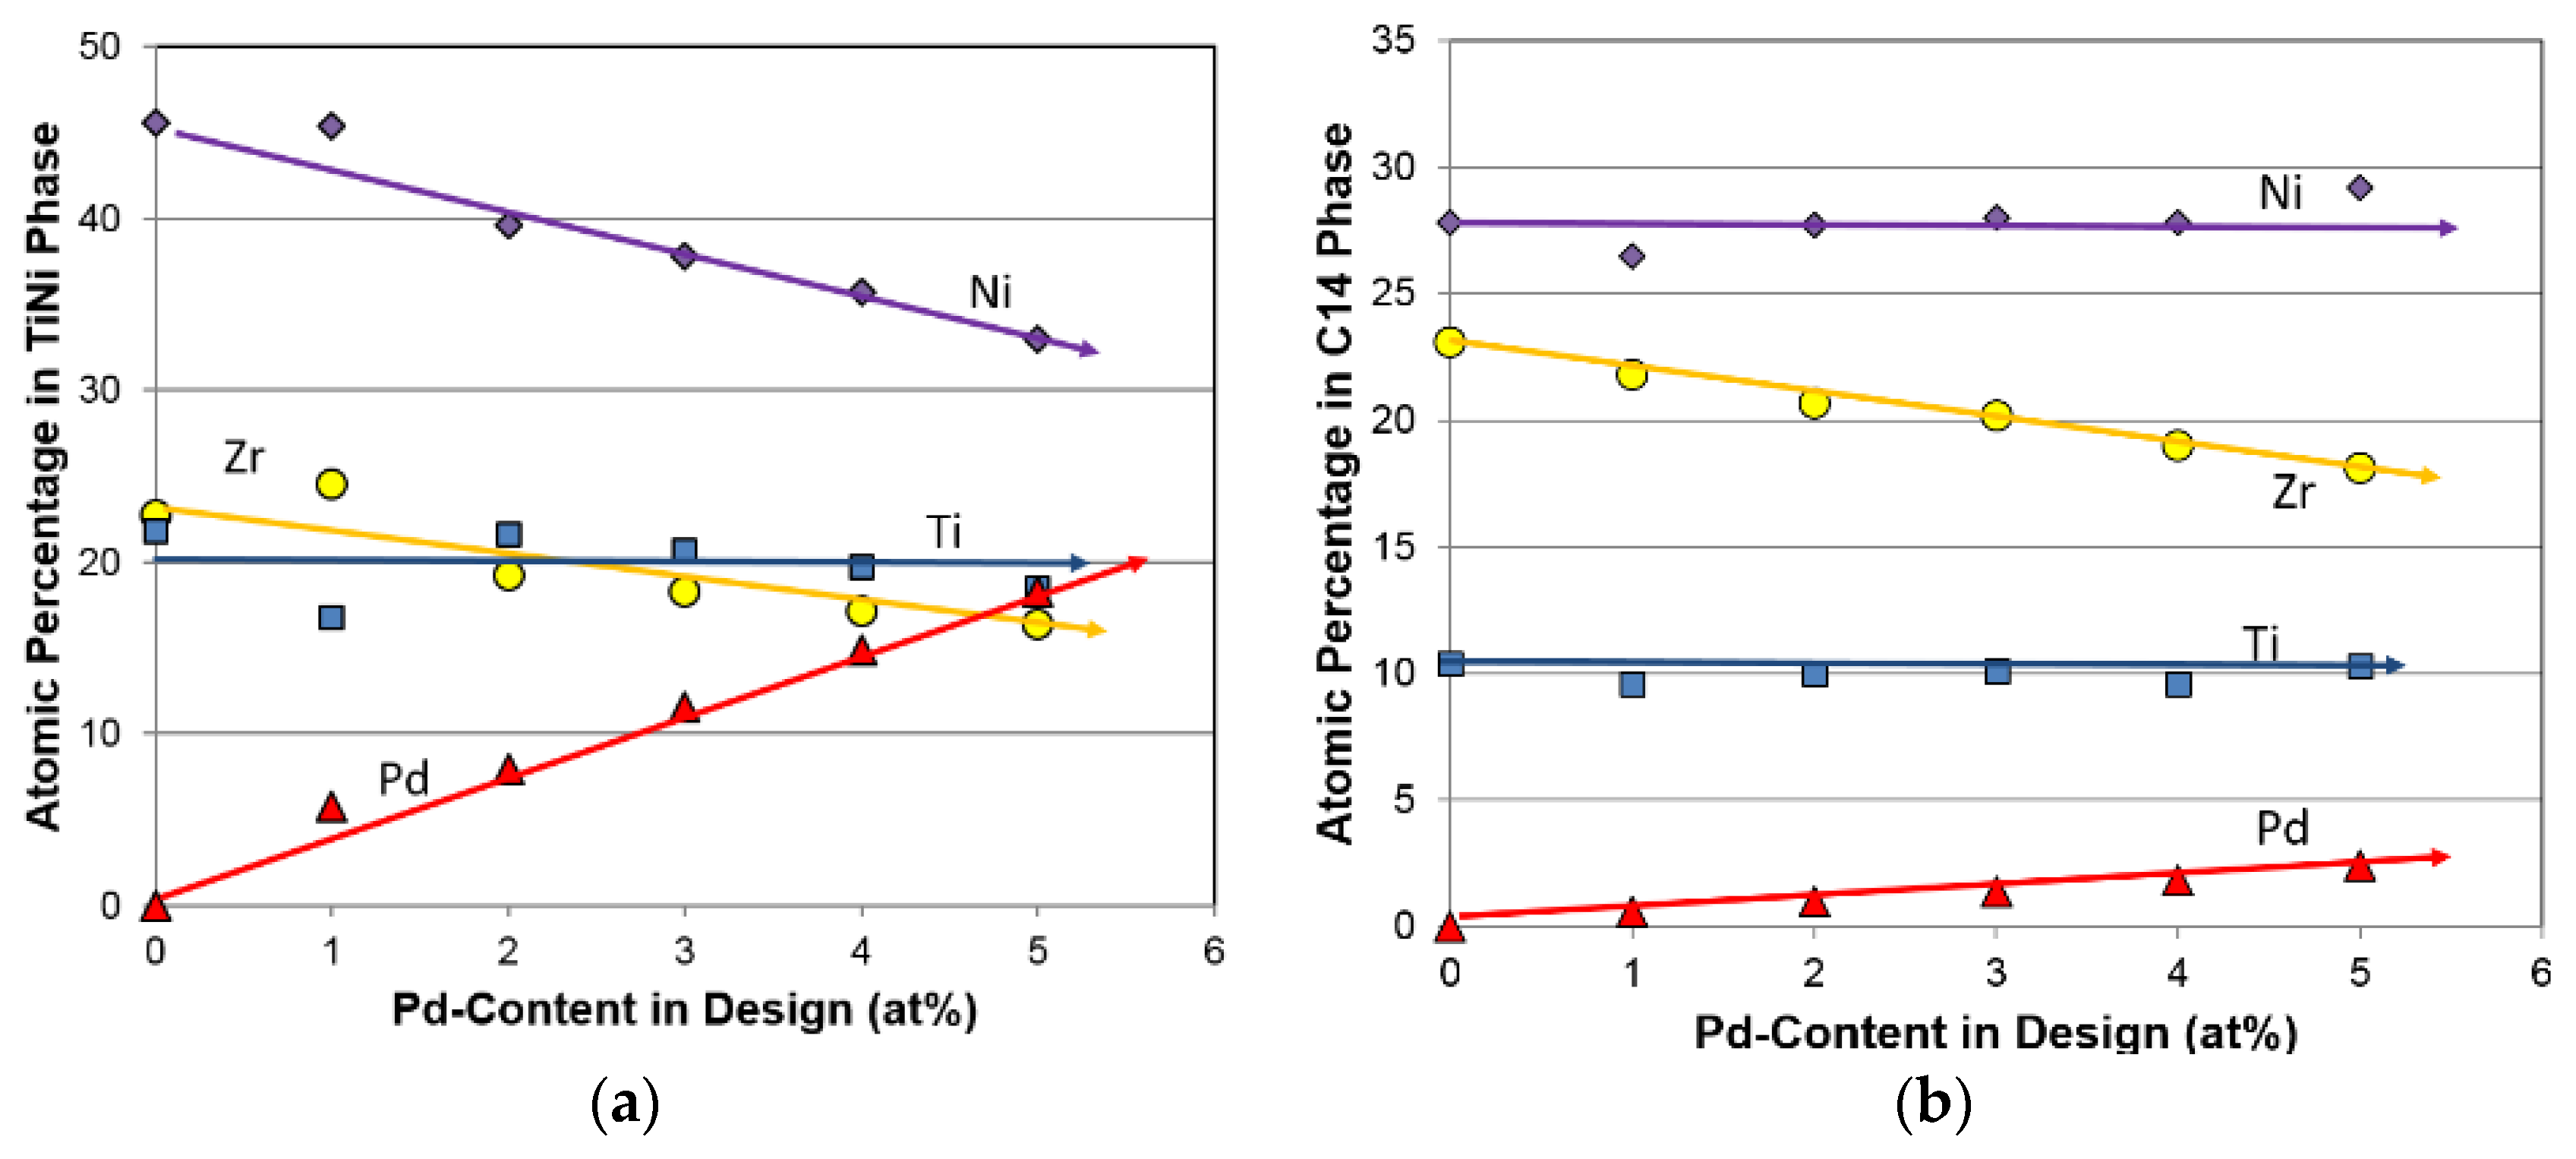
Figure 6.
Schematic of the C14 structure. Green and blue spheres represent the A- (Zr, Ti, and Pd) and B- (V, Cr, Mn, Co, Ni, and Al) atoms, respectively. While two sites (2a on the A2B plane and 6h on the B3 plane) are available for the B-atoms, only one site (4f) on the A2B plane is available for the A-atoms.
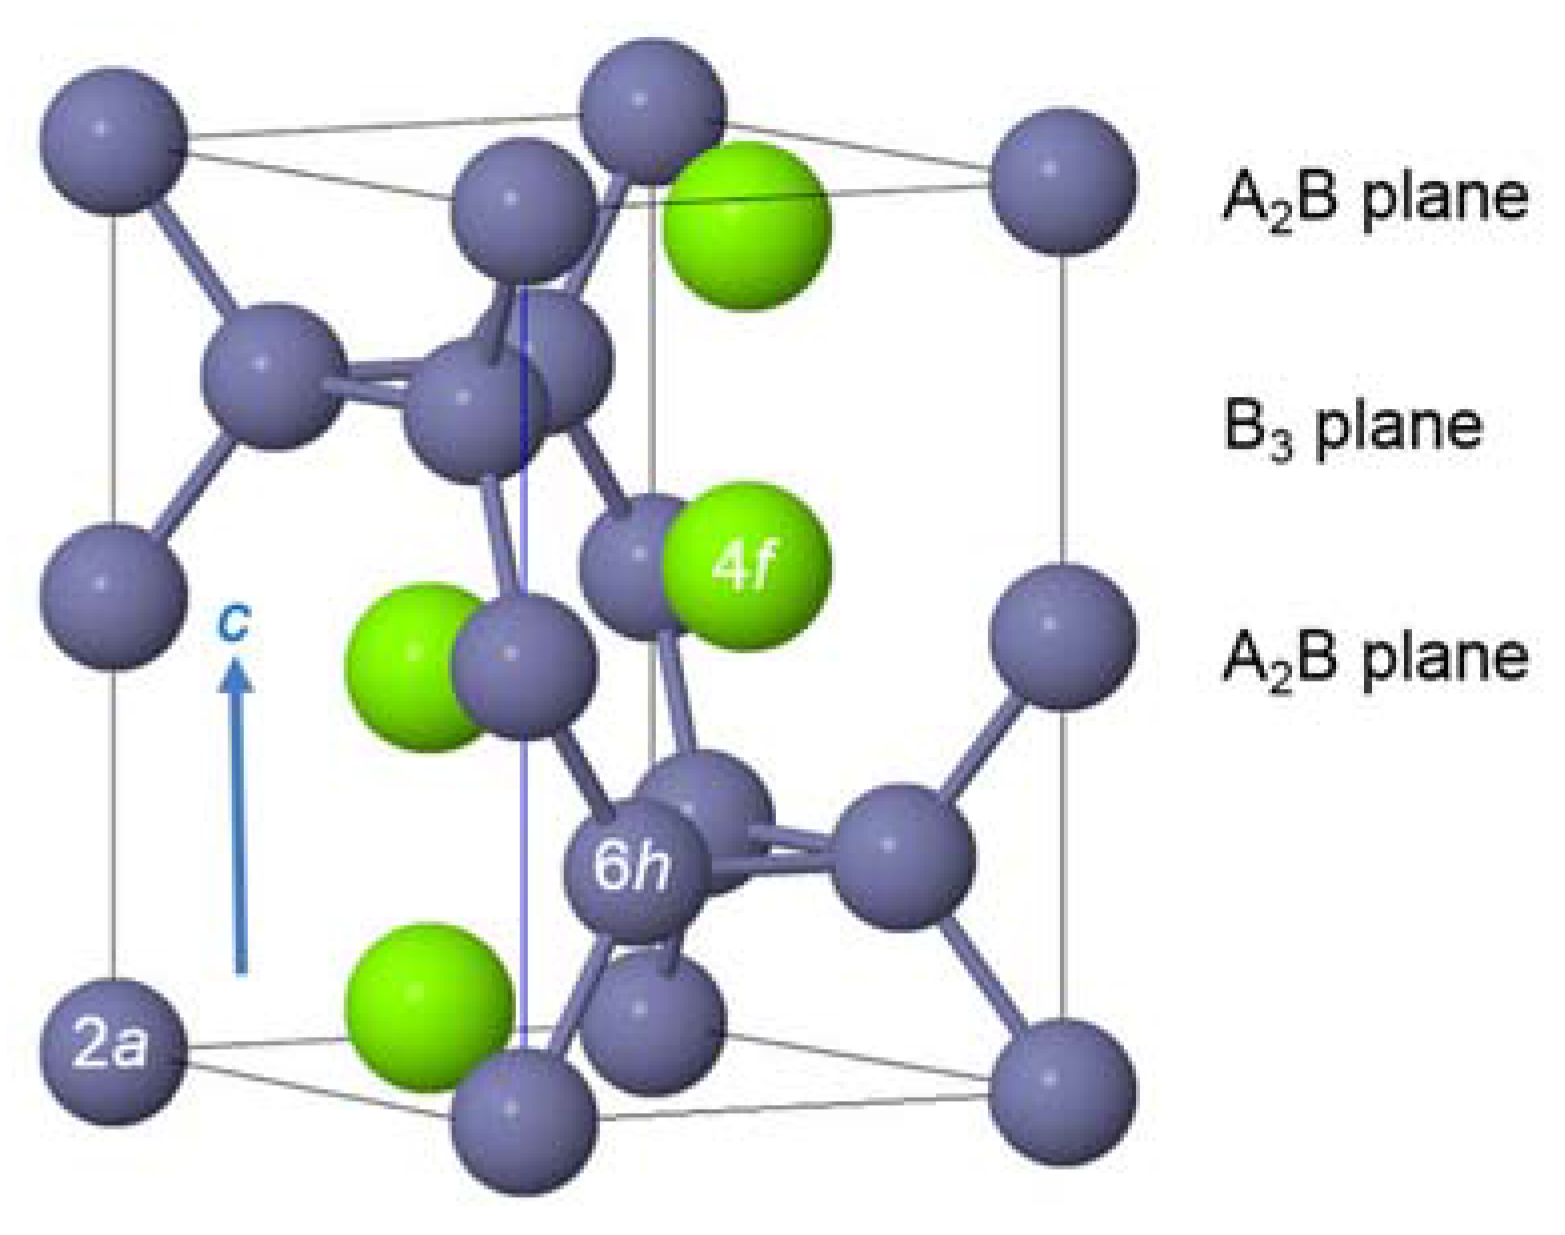
Figure 7.
Evolution of the C14 lattice constant a/c ratio with increasing Zr-content in the phase. Data for Zr/Ti and ZrTi/Pd series are from a prior work [103] and the current study, respectively.
Figure 7.
Evolution of the C14 lattice constant a/c ratio with increasing Zr-content in the phase. Data for Zr/Ti and ZrTi/Pd series are from a prior work [103] and the current study, respectively.
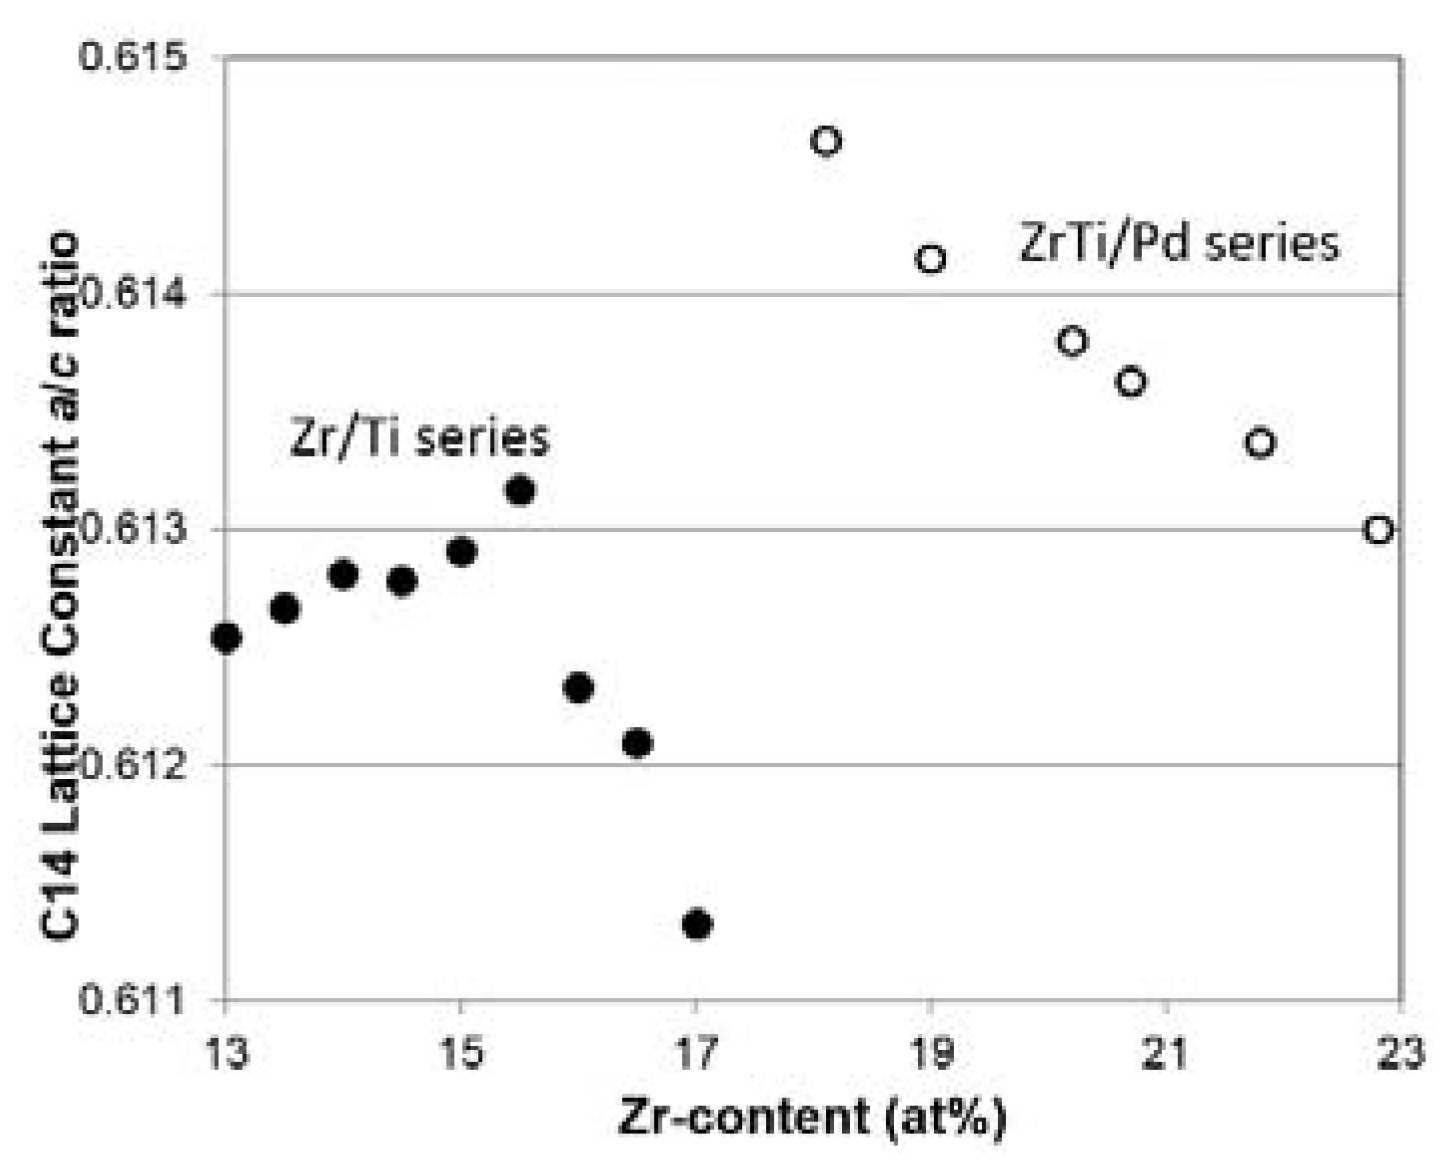
Figure 8.
Comparison of solubilities (flexibility in stoichiometry) for the C14 and C15 binary alloys with Ti, Zr, or Hf as the A-site element (date from [115]).
Figure 8.
Comparison of solubilities (flexibility in stoichiometry) for the C14 and C15 binary alloys with Ti, Zr, or Hf as the A-site element (date from [115]).
Figure 9.
Plots of the e/a values for the C14 and C15 phases. A shift in the C14/C15 threshold to a higher e/a value with increasing Pd-content in design is observed.
Figure 9.
Plots of the e/a values for the C14 and C15 phases. A shift in the C14/C15 threshold to a higher e/a value with increasing Pd-content in design is observed.
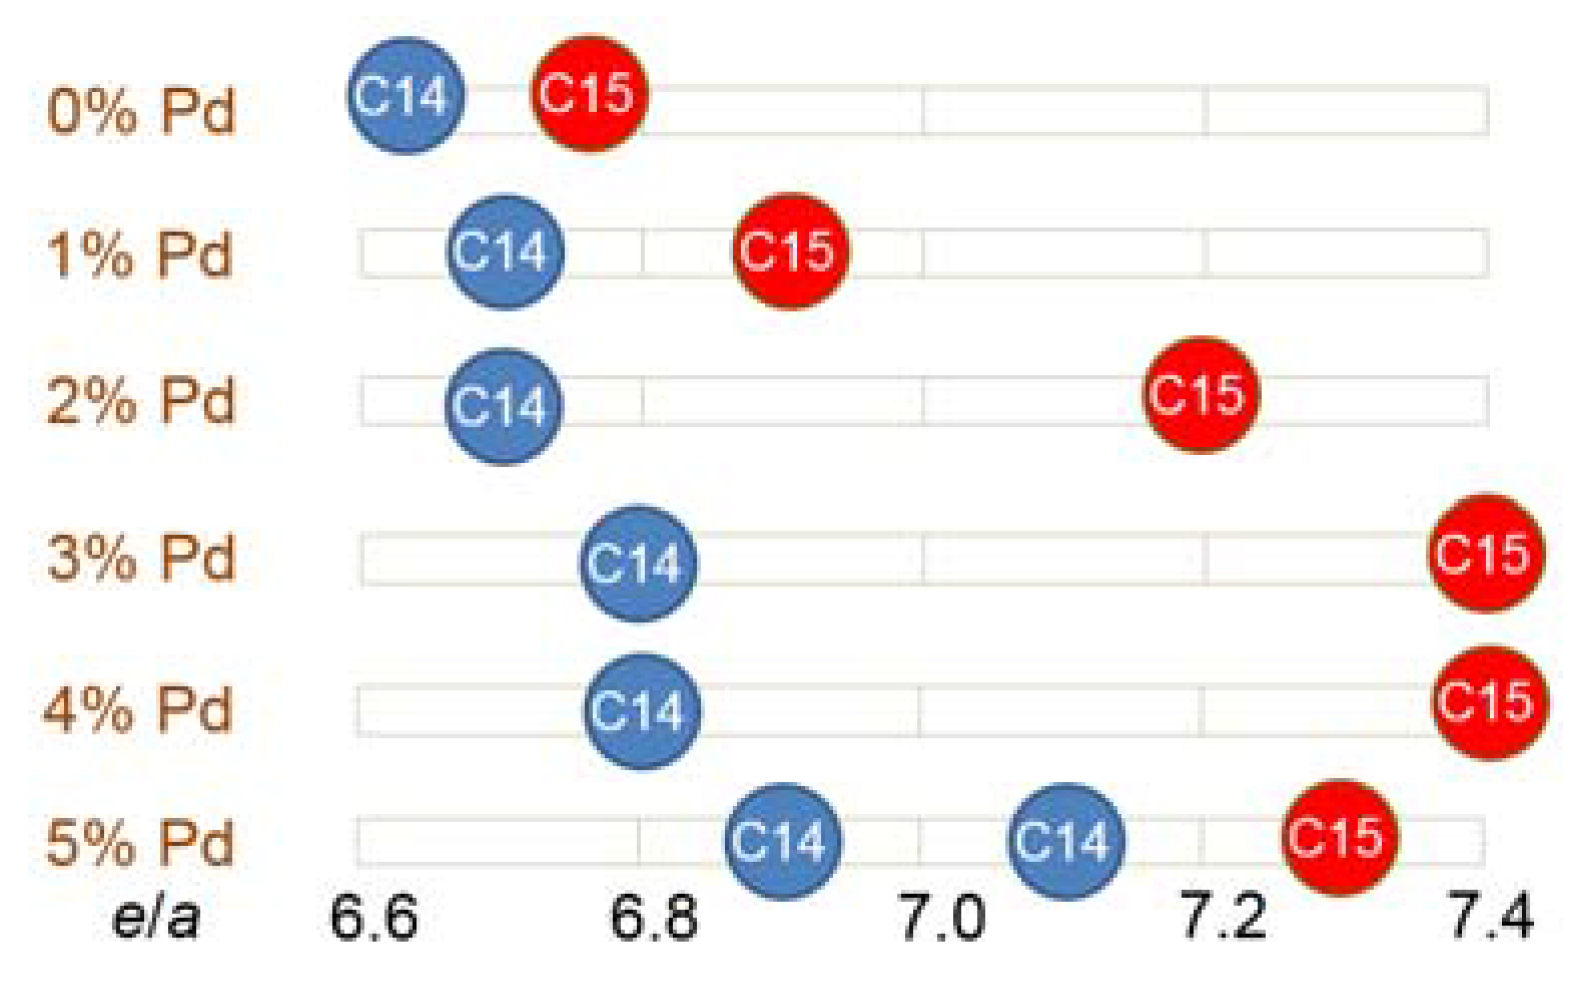
Figure 10.
30 °C PCT isotherms of alloys (a) Pd0, Pd1, and Pd2 and (b) Pd3, Pd4, and Pd5 and 60 °C PCT isotherms of alloys (c) Pd0, Pd1, and Pd2 and (d) Pd3, Pd4, and Pd5. Open and solid symbols are for absorption and desorption curves, respectively.
Figure 10.
30 °C PCT isotherms of alloys (a) Pd0, Pd1, and Pd2 and (b) Pd3, Pd4, and Pd5 and 60 °C PCT isotherms of alloys (c) Pd0, Pd1, and Pd2 and (d) Pd3, Pd4, and Pd5. Open and solid symbols are for absorption and desorption curves, respectively.
Figure 11.
Plot of the H-storage capacity and log (plateau pressure) vs. the C14 unit cell volume.
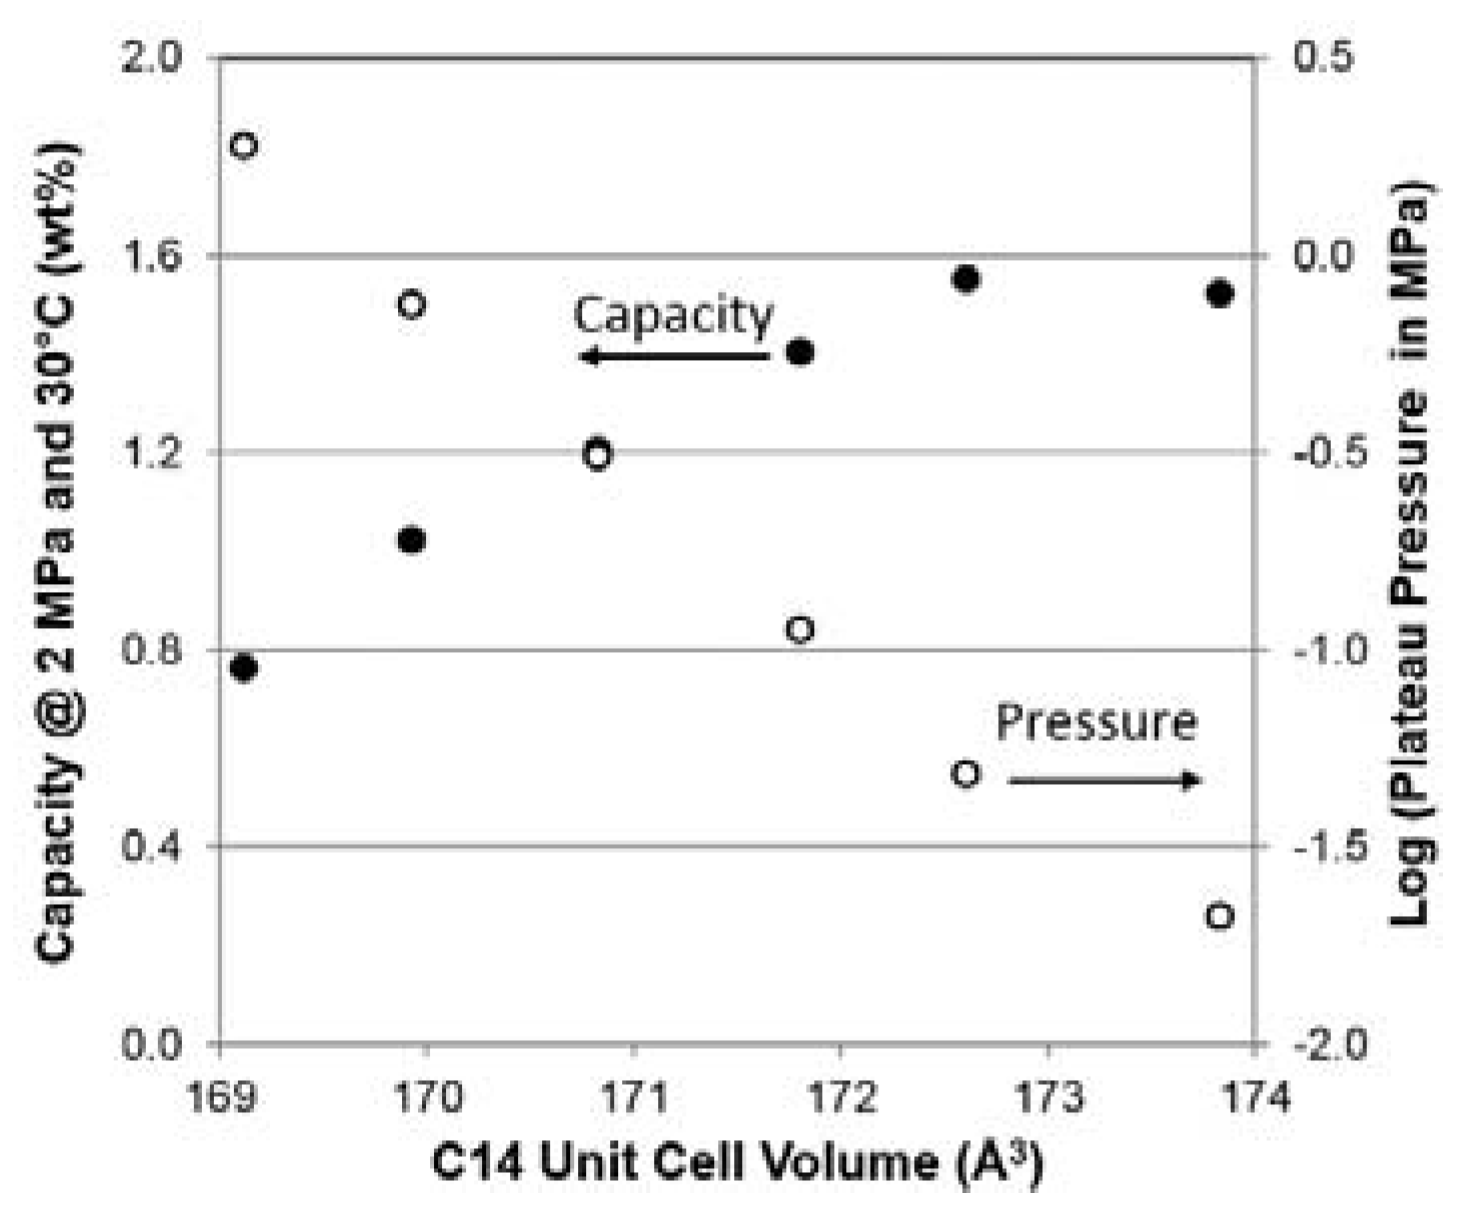
Figure 12.
Activation behaviors observed from (a) full capacity and (b) HRD for the first 13 electrochemical cycles measured at room temperature.
Figure 12.
Activation behaviors observed from (a) full capacity and (b) HRD for the first 13 electrochemical cycles measured at room temperature.
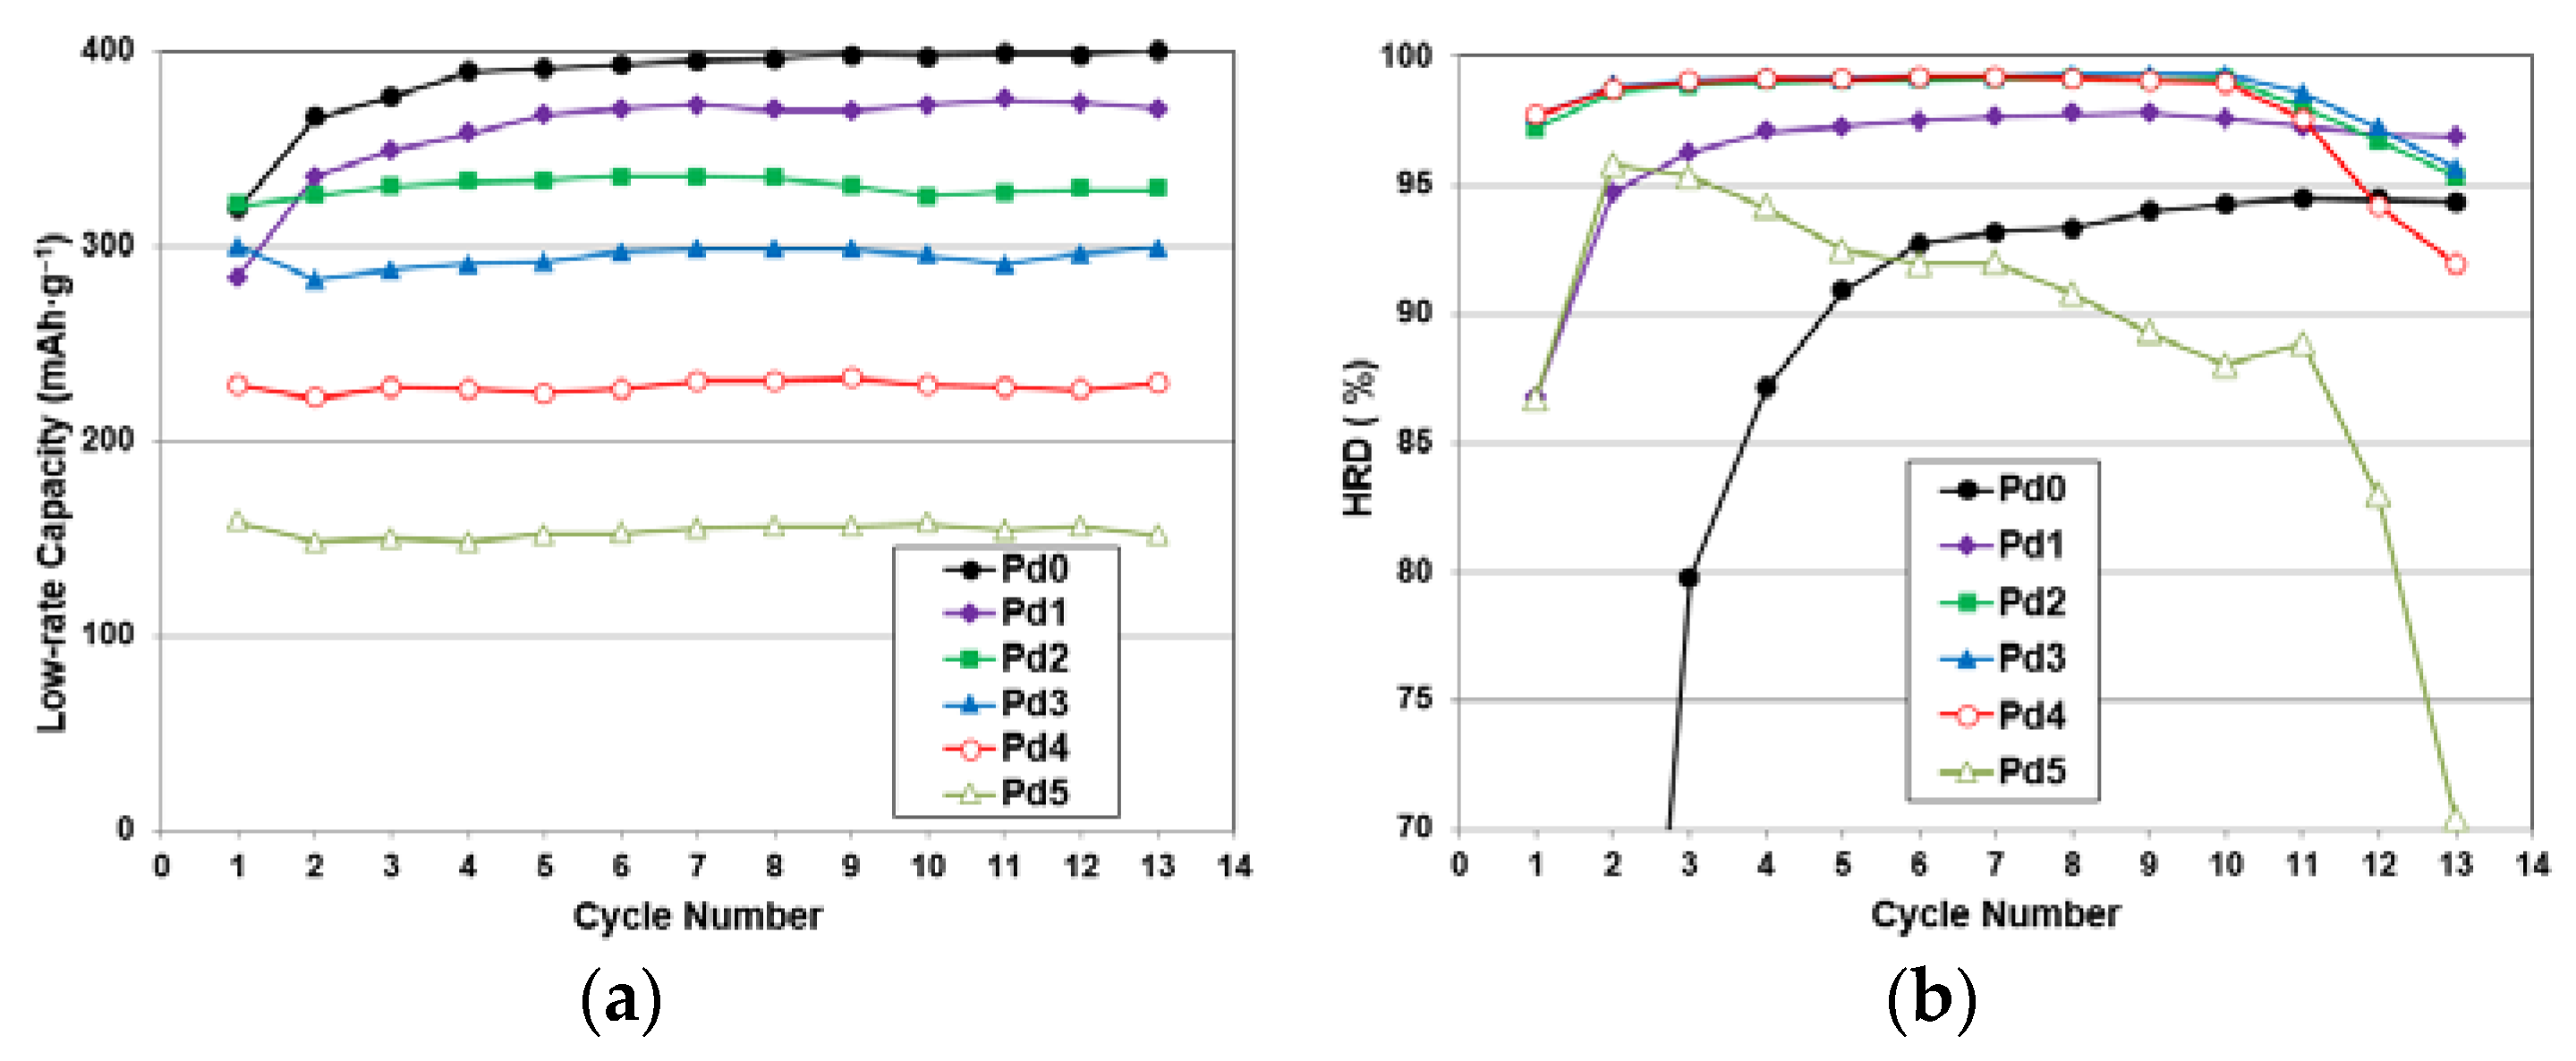
Figure 13.
Comparison of the electrochemical discharge capacity vs. gaseous phase H-storage capacity. The green line shows the conversion between two properties, which sets the upper bound for electrochemical discharge capacity.
Figure 13.
Comparison of the electrochemical discharge capacity vs. gaseous phase H-storage capacity. The green line shows the conversion between two properties, which sets the upper bound for electrochemical discharge capacity.

Figure 14.
Plots of (a) surface reaction resistance (R), (b) double-layer capacitance (C), and (c) their product (RC) as functions of Ce-, Nd- and Pd-contents in design. Data of Ce- and Nd-substitutions was previously published [9,10].
Figure 15.
MS and Io measured at room temperature vs. surface reaction resistance R measured at −40 °C are plotted for the base alloy (Ti12Zr22.8V7.5Mn8.1Co7Ni32.2Al0.4) and alloys with additions of 1 at % Ce, Si, Pd, Zn, Fe, and Nd. All additives demonstrate a reduction in R measured at −40 °C. The MS and Io pair from the Pd-containing alloy shows the largest separation, suggesting that the amount of catalytic Ni embedded in the surface oxide is not the origin of the improvements in Io and R.

Table 1.
Summary of the Pd-substitution research based on different preparation methods, including arc melting (AM), replacement diffusion (RD), mechanical alloying by ball milling (MA), thermal annealing (TA), induction melting (IM), melt spinning (MS), levitation melting (LM), and wet impregnation (WI), in chronological order. GP and EC denote gaseous phase and electrochemical applications, respectively. HRD and Io represent high-rate dischargeability and surface reaction current, respectively.
| Host | Preparation | Application | Amount | Major Effect(s) of Pd | Reference |
|---|---|---|---|---|---|
| LaNi5 | AM | GP | 16 at % | Increased plateau pressure | [47] |
| Mg2Ni | RD | GP | 8.3 at % | Increased absorption kinetics | [48] |
| Mg2Ni | MA | GP | <1 wt. % | Increased absorption kinetics | [49] |
| TiFe | MA | GP | <1 wt. % | Increased activation | [50] |
| V3TiNi0.56 | AM | EC | 1 & 5 at % | Increased capacity | [51] |
| TiFe | AM + TA | GP | 2.5 to 15 at % | Increased activation | [52] |
| Ti2Ni | AM | EC | 9.6 at % | Increased HRD and cycle life | [53] |
| AB2 | AM | EC | 3.3 at % | Increased cycle life | [54] |
| Mg | MA | GP | 14 wt. % | Increased desorption kinetics | [55] |
| AB2 | IM | EC | 1 to 4 at % | Increased HRD | [56] |
| Mg2Ni | MS | EC | 5 to 20 at % | Increased capacity and cycle life | [57,58] |
| MgNix | MS | EC | 10 at % | Easy amorphization | [59] |
| MgNi | MA | EC | 1 to 10 at % | Increased cycle life | [60] |
| MgNi | MA | EC | 10 at % | Increased cycle life | [61] |
| TiFe | AM | EC | 5 to 10% | Increased EC activity | [62] |
| Mg0.9Ti0.1Ni | MA | EC | 0 to 7.5 at % | Increased cycle life and Io | [63,64,65,66] |
| Li3BN2 | MA | GP | 5 to 10 wt. % | Increased desorption kinetics | [67] |
| Mg | MA | GP | 5 wt. % | Decreased absorption kinetics | [68] |
| Mg | MA | GP | 10 wt. % | Increased desorption kinetics | [69] |
| MgTix | MA | EC | 5 at % | Increased activation | [70] |
| Mg6Pd7Si3 | TA | GP | 44 at % | Increased cycle life | [71] |
| LaMg2Pd | TA | GP | 25 at % | Novel MH alloy | [72] |
| TiVCr | AM | GP | 0 to 0.5 at % | Increased capacity and activation | [73] |
| TiVCr | LM | EC | 0 to 3 at % | Increased capacity, cycle life, and activation | [74] |
| TiZrNi | AM | EC | 0 to 7 at % | Increased capacity, HRD, and cycle life | [75] |
| MgNi | MA | EC | 0 to 5 at % | Increased HRD and cycle life | [76] |
| C | WI | GP | 0 to 6 at % | Increased capacity | [77] |
| MgTi | MA | EC | 3.3 at % | Increased capacity and Io | [78] |
| AB2 | AM + TA | EC | 5 to 10 wt. % | Increased HRD | [79] |
| Mg2Ni | MA | EC | 10 wt. % | Increased capacity | [80] |
| TiNi | IM | GP | 0 to 2.5 at % | Decreased Capacity | [81] |
| MgNi | MA | EC | 3.5 at % | Increased capacity, HRD, and cycle life | [82] |
| LaNi5 | AM + TA | GP | 4 to 25 at % | Increase in plateau pressure | [83] |
| Mg2Ni | MA | EC | 3.3 at % | Increased capacity and cycle life | [84] |
| C | WI | GP | 5 wt. % | Decreased absorption kinetics | [85] |
| MgNi | MA | EC | 5 at % | Increased HRD and cycle life | [86] |
| MgNi | MA | EC | 0 to 5 at % | Increased capacity and cycle life | [87] |
| Mg | MA | GP | 0.1 to 5 wt. % | Increased absorption and desorption | [88] |
| MgNi | MA | EC | 0 to 4 at % | Increased capacity | [89] |
| LaMg2Ni | IM | GP | 5 at % | Increased absorption and desorption | [90] |
| TiNi | MA | EC | 5 wt. % | Increased capacity and cycle life | [91] |
| Mg2Co | MA | EC | 5 at % | Increased capacity, Io, and cycle life | [92,93] |
| WMCNT | WI | GP | 5 wt. % | Increased capacity | [94] |
| Na2SiO3 | TA | GP | 2.5 to 5 wt. % | Increased capacity | [95] |
| Graphene | WI | GP | 5 to 10 wt. % | Increased capacity | [96] |
| TiNi, Ti2Ni | MA + TA | EC | 5 wt. % | Increased capacity and cycle life | [97] |
| C | WI | GP | 0 to 13 wt. % | Increased capacity | [98] |
| Mg6Pd | TA | GP | 14 at % | Novel MH alloy | [99] |
| TiVCr | AM | GP | 0.05 to 0.1 at % | Increased capacity | [100] |
| MgCo | MA | EC | 5 at % | Increased HRD | [101] |
| PdCu, PdCuAg | MA | GP | 15 to 100 at % | Increased capacity | [102] |
Table 2.
Properties of Pd and other constituent elements in the alloys of this study. The radius quoted here is the atomic radius found in the Laves phase. Hcp, fcc, and bcc stand for hexagonal, face-centered-cubic, and body-centered cubic structures, respectively. ΔHh is the heat of hydride formation. IMC denotes intermetallic compound. Ni forms a solid solution with a continuous composition range and has no IMC with Pd, Cr, Mn, or Co.
| Property | Zr | Ti | Pd | V | Cr | Mn | Co | Ni | Al |
|---|---|---|---|---|---|---|---|---|---|
| Atomic Number | 40 | 22 | 46 | 23 | 24 | 25 | 27 | 28 | 13 |
| Number of Outer-layer e− | 4 | 4 | 10 | 5 | 6 | 7 | 9 | 10 | 3 |
| Earth Crust Abundance (%) | 0.013 | 0.66 | 6 × 10⁻⁷ | 0.019 | 0.014 | 0.11 | 0.003 | 0.009 | 8.1 |
| Radius (Å) [112] | 1.771 | 1.614 | 1.521 | 1.491 | 1.423 | 1.428 | 1.385 | 1.377 | 1.582 |
| Electronegativity | 1.33 | 1.54 | 2.20 | 1.63 | 1.66 | 1.55 | 1.88 | 1.91 | 1.61 |
| Crystal Structure [113] | hcp | hcp | fcc | bcc | bcc | bcc | hcp | fcc | fcc |
| Melting Point (°C) [114] | 1855 | 1668 | 1555 | 1910 | 1907 | 1246 | 1495 | 1455 | 660 |
| ΔHh (kJ·mol−1) [11] | −94 | −67 | −20 | −35 | −8 | −8 | 15 | −3 | 3 |
| Number of IMC with Ni [115] | 8 | 3 | 0 | 3 | 0 | 0 | 0 | - | 4 |
Table 3.
Design compositions (in bold) and ICP results in at %. The average electron density is shown as e/a, and B/A is the ratio of B-atoms to A-atoms (Ti, Zr, and Pd).
Table 3.
Design compositions (in bold) and ICP results in at %. The average electron density is shown as e/a, and B/A is the ratio of B-atoms to A-atoms (Ti, Zr, and Pd).
| Alloy | Source | Ti | Zr | V | Cr | Mn | Co | Ni | Pd | Al | e/a | B/A |
|---|---|---|---|---|---|---|---|---|---|---|---|---|
| Pd0 | Design | 12.0 | 22.8 | 10.0 | 7.5 | 8.1 | 7.0 | 32.2 | 0.0 | 0.4 | 6.771 | 1.87 |
| ICP | 11.9 | 22.9 | 10.0 | 7.5 | 8.0 | 7.1 | 32.2 | 0.0 | 0.4 | 6.773 | 1.87 | |
| Pd1 | Design | 12.0 | 21.8 | 10.0 | 7.5 | 8.1 | 7.0 | 32.2 | 1.0 | 0.4 | 6.831 | 1.87 |
| ICP | 12.0 | 21.3 | 10.3 | 7.5 | 8.5 | 7.0 | 31.9 | 1.1 | 0.4 | 6.834 | 1.91 | |
| Pd2 | Design | 12.0 | 20.8 | 10.0 | 7.5 | 8.1 | 7.0 | 32.2 | 2.0 | 0.4 | 6.891 | 1.87 |
| ICP | 12.0 | 20.5 | 9.9 | 7.5 | 8.6 | 6.9 | 32.2 | 2.0 | 0.4 | 6.900 | 1.90 | |
| Pd3 | Design | 12.0 | 19.8 | 10.0 | 7.5 | 8.1 | 7.0 | 32.2 | 3.0 | 0.4 | 6.951 | 1.87 |
| ICP | 12.0 | 19.5 | 10.1 | 7.5 | 8.6 | 7.0 | 32.1 | 2.8 | 0.4 | 6.949 | 1.92 | |
| Pd4 | Design | 12.0 | 18.8 | 10.0 | 7.5 | 8.1 | 7.0 | 32.2 | 4.0 | 0.4 | 7.011 | 1.87 |
| ICP | 11.9 | 18.7 | 10.1 | 7.6 | 8.7 | 7.0 | 31.9 | 3.7 | 0.4 | 6.996 | 1.92 | |
| Pd5 | Design | 12.0 | 17.8 | 10.0 | 7.5 | 8.1 | 7.0 | 32.2 | 5.0 | 0.4 | 7.071 | 1.87 |
| ICP | 11.9 | 17.8 | 10.2 | 7.4 | 8.6 | 7.1 | 32.0 | 4.6 | 0.4 | 7.055 | 1.92 |
Table 4.
Lattice constants a and c, a/c ratio, and unit cell volume (VC14) for the C14 phase, lattice constant a for the C15 and TiNi phases, Full width at half maximum (FWHM), and phase abundances in wt. % calculated from the XRD analysis.
Table 4.
Lattice constants a and c, a/c ratio, and unit cell volume (VC14) for the C14 phase, lattice constant a for the C15 and TiNi phases, Full width at half maximum (FWHM), and phase abundances in wt. % calculated from the XRD analysis.
| Structural Property | Pd0 | Pd1 | Pd2 | Pd3 | Pd4 | Pd5 |
|---|---|---|---|---|---|---|
| a, C14 (Å) | 4.9739 | 4.9631 | 4.9561 | 4.9471 | 4.9394 | 4.9328 |
| c, C14 (Å) | 8.1134 | 8.0915 | 8.0767 | 8.0598 | 8.0427 | 8.0254 |
| a/c, C14 (Å) | 0.61305 | 0.61337 | 0.61363 | 0.61380 | 0.61415 | 0.61465 |
| VC14 (Å3) | 173.83 | 172.61 | 171.81 | 170.83 | 169.93 | 169.12 |
| a, C15 (Å) | 7.0121 | 6.9929 | 6.9827 | 6.9689 | 6.9550 | 6.9468 |
| a, TiNi (Å) | 3.0795 | 3.0829 | 3.0846 | 3.0893 | 3.0955 | 3.0995 |
| FWHM, C14 (103) | 0.237 | 0.25 | 0.249 | 0.241 | 0.234 | 0.243 |
| C14 Crystallite Size (Å) | 482 | 446 | 448 | 469 | 491 | 465 |
| C14 Abundance (%) | 85.4 | 72.1 | 72.7 | 72.0 | 72.4 | 59.8 |
| C15 Abundance (%) | 11.2 | 12.6 | 11.0 | 7.0 | 5.5 | 13.4 |
| TiNi Abundance (%) | 3.4 | 15.3 | 16.3 | 21.0 | 22.1 | 26.8 |
Table 5.
Summary of the EDS results from several selective spots in the SEM-BEI micrographs shown in Figure 4. All compositions are in at %. The main C14 phase is identified in bold.
Table 5.
Summary of the EDS results from several selective spots in the SEM-BEI micrographs shown in Figure 4. All compositions are in at %. The main C14 phase is identified in bold.
| Alloy | Location | Ti | Zr | V | Cr | Mn | Co | Ni | Pd | Al | e/a | B/A | Phase |
|---|---|---|---|---|---|---|---|---|---|---|---|---|---|
| Pd1 | Pd1-1 | 16.8 | 24.5 | 1.4 | 0.5 | 2.3 | 2.7 | 45.4 | 5.8 | 0.5 | 7.3 | 1.1 | TiNi |
| Pd1-2 | 13.3 | 20.8 | 9.2 | 5.1 | 8.2 | 6.7 | 35.2 | 1.0 | 0.5 | 6.9 | 1.8 | C15 | |
| Pd1-3 | 9.6 | 21.8 | 12.4 | 10.6 | 10.2 | 7.8 | 26.5 | 0.6 | 0.5 | 6.7 | 2.1 | C14 | |
| Pd1-4 | 7.8 | 58.9 | 5.0 | 2.6 | 4.2 | 3.0 | 17.4 | 0.9 | 0.3 | - | - | ZrO2 | |
| Pd2 | Pd2-1 | 21.6 | 19.2 | 2.1 | 0.9 | 3.6 | 4.3 | 39.6 | 8.0 | 0.7 | 7.2 | 1.0 | TiNi |
| Pd2-2 | 11.6 | 20.8 | 7.2 | 4.0 | 7.1 | 5.1 | 40.9 | 2.8 | 0.5 | 7.2 | 1.8 | C15 | |
| Pd2-3 | 10.0 | 20.7 | 12.4 | 9.6 | 10.1 | 8.0 | 27.7 | 1.0 | 0.5 | 6.7 | 2.2 | C14 | |
| Pd2-4 | 5.7 | 69.1 | 3.3 | 2.3 | 3.0 | 2.3 | 12.5 | 1.6 | 0.3 | - | - | ZrO2 | |
| Pd3 | Pd3-1 | 20.7 | 18.3 | 2.0 | 0.8 | 4.3 | 3.8 | 37.8 | 11.6 | 0.7 | 7.3 | 1.0 | TiNi |
| Pd3-2 | 12.7 | 19.7 | 6.0 | 3.0 | 6.4 | 4.5 | 41.9 | 5.3 | 0.5 | 7.4 | 1.7 | C15 | |
| Pd3-3 | 10.1 | 20.2 | 11.9 | 10.1 | 9.7 | 8.1 | 28.0 | 1.4 | 0.4 | 6.8 | 2.2 | C14 | |
| Pd3-4 | 19.5 | 51.8 | 3.3 | 1.5 | 3.2 | 2.2 | 15.3 | 3.0 | 0.2 | - | - | ZrO2 | |
| Pd4 | Pd4-1 | 19.7 | 17.2 | 2.0 | 0.8 | 5.4 | 3.4 | 35.7 | 14.9 | 0.8 | 7.4 | 0.9 | TiNi |
| Pd4-2 | 10.7 | 18.9 | 7.5 | 4.2 | 6.9 | 4.8 | 40.8 | 5.7 | 0.6 | 7.4 | 1.8 | C15 | |
| Pd4-3 | 9.6 | 19.0 | 12.1 | 10.9 | 10.2 | 8.1 | 27.8 | 1.8 | 0.5 | 6.8 | 2.3 | C14 | |
| Pd4-4 | 3.6 | 80.1 | 1.8 | 1.0 | 1.3 | 1.3 | 7.6 | 3.2 | 0.1 | - | - | ZrO2 | |
| Pd4-5 | 1.7 | 0.2 | 42.8 | 41.1 | 8.8 | 2.4 | 2.8 | 0.1 | 0.1 | - | - | BCC | |
| Pd5 | Pd5-1 | 18.5 | 16.4 | 2.3 | 1.0 | 6.6 | 3.1 | 33.0 | 18.3 | 0.8 | 7.5 | 0.9 | TiNi |
| Pd5-2 | 12.4 | 18.0 | 7.7 | 4.1 | 6.7 | 4.7 | 38.7 | 7.2 | 0.5 | 7.3 | 1.7 | C15 | |
| Pd5-3 | 12.2 | 16.6 | 10.7 | 6.8 | 8.8 | 7.4 | 33.6 | 3.5 | 0.4 | 7.1 | 2.1 | C14 | |
| Pd5-4 | 10.3 | 18.1 | 11.5 | 10.4 | 9.4 | 8.3 | 29.2 | 2.4 | 0.4 | 6.9 | 2.2 | C14 | |
| Pd5-5 | 7.3 | 51.4 | 7.3 | 5.0 | 5.2 | 4.2 | 17.4 | 2.0 | 0.2 | - | - | ZrO2 |
Table 6.
Summary of gaseous phase properties: maximum and reversible capacities, plateau pressure, slope factor, hysteresis, and changes in enthalpy and entropy.
Table 6.
Summary of gaseous phase properties: maximum and reversible capacities, plateau pressure, slope factor, hysteresis, and changes in enthalpy and entropy.
| Gaseous Phase Property | Unit | Pd0 | Pd1 | Pd2 | Pd3 | Pd4 | Pd5 |
|---|---|---|---|---|---|---|---|
| Maximum capacity @ 2 MPa and 30 °C | wt. % | 1.52 | 1.55 | 1.40 | 1.20 | 1.02 | 0.76 |
| Reversible Capacity @ 30 °C | wt. % | 1.25 | 1.32 | 1.23 | 1.11 | 0.92 | 0.69 |
| Capacity @ 0.002 MPa and 30 °C | wt. % | 0.30 | 0.23 | 0.17 | 0.10 | 0.09 | 0.06 |
| Desorption Pressure @ 0.75 wt. % and 30 °C | MPa | 0.021 | 0.048 | 0.112 | 0.306 | 0.745 | 1.882 |
| Slope Factor @ 30 °C | % | 78 | 81 | 78 | 66 | 53 | 44 |
| Hysteresis @ 30 °C | 0.21 | 0.05 | 0.03 | 0.05 | 0.03 | 0.00 | |
| −ΔHh | kJ·mol H2−1 | 41.6 | 40.5 | 35.6 | 30.9 | 28.0 | - |
| −ΔSh | J·mol H2−1·K−1 | 127 | 125 | 118 | 111 | 109 | - |
Table 7.
Summary of electrochemical half-cell measurements: capacities at the 3rd cycle, HRD at the 3rd cycle, cycles needed to achieve 92% HRD, bulk diffusion coefficient, surface exchange current, and results from AC impedance and magnetic susceptibility measurements. AC impedance measurement was performed at −40 °C while all other properties were measured at room temperature.
| Electrochemical and Magnetics Properties | Unit | Pd0 | Pd1 | Pd2 | Pd3 | Pd4 | Pd5 |
|---|---|---|---|---|---|---|---|
| 3rd Cycle High-rate Discharge Capacity | mAh·g−1 | 300 | 335 | 327 | 285 | 226 | 143 |
| 3rd Cycle Full Discharge Capacity | mAh·g−1 | 376 | 349 | 330 | 288 | 228 | 150 |
| 3rd Cycle HRD | % | 80 | 96 | 99 | 99 | 99 | 98 |
| Activation Cycle # to Achieve 92% HRD | 6 | 1 | 1 | 1 | 1 | 1 | |
| Diffusion Coefficient, D | 10−10 cm2·s−1 | 2.1 | 4.4 | 6.2 | 2.0 | 4.1 | 4.5 |
| Surface Reaction Current, Io | mA·g−1 | 12.8 | 24.7 | 28.8 | 25.2 | 22.1 | 17.1 |
| Charge-transfer Resistance @ −40 °C | Ω·g | 158.6 | 29.1 | 28.3 | 22.9 | 15.7 | 39.9 |
| Double-layer Capacitance @ −40 °C | F·g−1 | 0.18 | 0.16 | 0.15 | 0.16 | 0.13 | 0.10 |
| RC Product @ −40 °C | s | 28.4 | 4.8 | 4.2 | 3.6 | 2.0 | 4.0 |
| Total Saturated Magnetic Susceptibility, MS | emu·g−1 | 0.035 | 0.015 | 0.008 | 0.018 | 0.011 | 0.013 |
| Applied Field @ M.S. = ½ MS, H1/2 | kOe | 0.50 | 0.47 | 0.34 | 0.61 | 0.77 | 0.36 |
© 2017 by the authors. Licensee MDPI, Basel, Switzerland. This article is an open access article distributed under the terms and conditions of the Creative Commons Attribution (CC BY) license (http://creativecommons.org/licenses/by/4.0/).
Share and Cite
MDPI and ACS Style
Young, K.-H.; Ouchi, T.; Nei, J.; Chang, S. Increase in the Surface Catalytic Ability by Addition of Palladium in C14 Metal Hydride Alloy. Batteries 2017, 3, 26. https://doi.org/10.3390/batteries3030026
AMA Style
Young K-H, Ouchi T, Nei J, Chang S. Increase in the Surface Catalytic Ability by Addition of Palladium in C14 Metal Hydride Alloy. Batteries. 2017; 3(3):26. https://doi.org/10.3390/batteries3030026
Chicago/Turabian StyleYoung, Kwo-Hsiung, Taihei Ouchi, Jean Nei, and Shiuan Chang. 2017. "Increase in the Surface Catalytic Ability by Addition of Palladium in C14 Metal Hydride Alloy" Batteries 3, no. 3: 26. https://doi.org/10.3390/batteries3030026
Note that from the first issue of 2016, this journal uses article numbers instead of page numbers. See further details here.