
Electrolyte Additive Concentration for Maximum Energy Storage in Lead-Acid Batteries

Department of Mechanical, Chemical and Materials Engineering, University of Cagliari, 09123 Cagliari, Italy
Batteries 2016, 2(4), 36; https://doi.org/10.3390/batteries2040036
Submission received: 20 September 2016
/
Revised: 3 November 2016
/
Accepted: 16 November 2016
/
Published: 23 November 2016
(This article belongs to the Special Issue Rechargeable Battery Technologies--From Materials to Applications)
Abstract
:This paper presents a method to assess the effect of electrolyte additives on the energy capacity of Pb-acid batteries. The method applies to additives of various kinds, including suspensions and gels. The approach is based on thermodynamics and leads to the definition of a region of admissible concentrations—the battery’s admissible range—where the battery can operate without suffering irreversible changes. An experimental procedure to determine this range is presented. The obtained results provide a way to assess the potential of electrolyte additives to improve the energy capacity of Pb-acid batteries. They also provide a means to determine the additive concentration that produces the maximum energy capacity increase of the battery. The paper closes with an example of the application of the proposed approach to a practical case.
1. Introduction
Adding a chemical additive to the electrolyte of a Pb-acid battery may modify the specific energy that the battery can store. This fact has been known since the invention of the battery and is currently a research topic of great interest to the battery industry. This paper presents a general method to evaluate the effect of electrolyte additives on the energy capacity of a Pb-acid battery and to determine the best additive concentration to use. The electrolyte additive considered here is quite general. It can be a chemical compound or a mixture of chemicals; a suspension or a gel of the kind used to immobilize the electrolyte. The only restriction is that the additive—whatever it is—should be in chemical equilibrium and have a low reactivity with respect to the other battery’s components.
Additives are also added to the battery electrolyte for a host of other reasons, such as to prolong battery life, reduce electrode corrosion, improve conductivity, diminish gas evolution at the electrodes, protect against overcharging or deep discharging, etc. Additives that are beneficial in some respects may be detrimental in others. Thus, choice and concentration of the additive must always be assessed against the side effects that it produces. This means, in particular, that an additive that enhances the battery’s energy capacity may not be viable, at least at certain concentrations, owing to other undesirable effects that it produces.
There are hundreds of papers, books and patents dealing with electrolyte additives and their effects in Pb-acid batteries. A complete review of the literature would exceed the scope of the present paper. Chapter 3 of Pavlov’s book [1] contains a comparatively short review of the main literature on the subject up to about 2011. It concerns classic inorganic additives (phosphoric acid, boric acid, citric acid, strontium sulphate, sodium sulphate), carbon suspensions, and organic polymer emulsions. At the present time, the great potential of ionic liquids as electrolyte additives is being actively studied [2] due to the capacity of these salts to widen the electrochemical window of water [3,4,5]. Furthermore, of great practical interest is the study of additives that produce gelled electrolytes, due to their applications in the field of electric locomotion [6,7,8]. An interesting study of the addition of an additive to a gelled electrolyte was recently presented in [9].
The variety of available additives makes it impossible to give general rules on the best additive and best concentration to use for a given purpose. Therefore, the present paper must, out of necessity, be rather restricted in scope. For this reason, by ignoring other effects, this paper concentrates on the influence of the additives on the energy storage capacity of the battery. The analysis presented provides a general way to assess the effect of any electrolyte additive as far as this capacity is concerned. It also shows how the additive concentration that maximizes this capacity can be determined from little basic experimental data. Of course a positive assessment of an additive with respect to the energy capacity of a battery does not rule out the need to ascertain whether or not, and to what extent, the additive produces undesired side effects. However, in the search for the best additives to increase the energy storage capacity of a battery, the results of the present paper may help to discard ineffective additives quickly, thus greatly simplifying the selection process.
Central to the analysis of this paper is the observation that at any finite temperature the internal energy of any finite volume system must be finite. This is a consequence of the energy conservation principle or first law of thermodynamics. Under rather broad assumptions, which are met by most natural systems, and by electrolyte solutions in particular, this observation, together with the second law of thermodynamics, implies a limit to the specific free energy that the electrolyte can store and supply isothermally. This point is discussed in Section 3. A similar analysis has been previously applied in [10] to determine the maximum energy capacity of a living cell—a problem that is conceptually analogous to the one considered here.
The present approach leads to the definition of the battery’s limit curve (Section 4). This curve defines the limit concentration of electrolyte components beyond which the battery suffers irreversible changes or damage, which may reduce the battery’s service life. In the case of a Pb-acid battery, this damage materializes in the evolution of O2 at the positive electrode for excess of charge, or in irreversible sulfation of the negative electrode for excess discharge. The said limit curve is instrumental not only to find out the value of the maximum increase in the battery energy capacity that can be achieved by the use of a given electrolyte additive, but also to determine the value of the additive concentration that produces this maximum increase. It also leads to establishing the theoretical limits of charge within which the battery can operate without suffering irreversible changes. A practical example of the application of the obtained results is given in Section 5.
2. Free Energy of Battery Electrolytes with Additives
The free energy of a solution or a mixture is the sum of the free energies of its components. Thus, if , , and nj (j = 1, 2, …, k) denote the moles of water, the moles of sulfuric acid, and the moles of additives, respectively, the Gibbs free energy of a Pb-acid battery electrolyte at pressure p and absolute temperature T is given by:
Here , , and μj are the partial molar Gibbs free energies or chemical potentials of water, sulfuric acid, and additives, respectively, while C is an arbitrary constant. The chemical potential of any component of a solution or mixture can always be expressed in the form:
In this equation, μo is the chemical potential of the considered component in a standard state at pressure po and temperature T, while is the partial molar volume of the same component, R is the universal gas constant, Δp stands for p − po and, finally, a is the activity or effective concentration of the considered component.
In what follows, the mole ratio:
is taken as a measure of solvent concentration, while the concentrations of sulfuric acid and additives are measured in molalities (moles per kg of H2O) and denoted by and bj, respectively. That is:
and:
where MH2O = 18.015 × 10⁻³ kg·mol−1 is the molar mass of water. In this notation, the activities of the electrolyte components can be expressed as:
and:
where , , and γj stand for the appropriate activity coefficients, which, in general, depend on , , and nj, besides T and p. By expressing , , and μj in Equation (2) and using Equations (6)–(8), we can write Equation (1) as:
In writing this equation we have made use of the following equation:
which relates the partial molar volumes , , and of the electrolyte components to the electrolyte volume, V.
Helmholtz free energy, Ψ, and Gibbs free energy are related to each other by the well-known equation:
Ψ = G − p·V
From this and from Equation (9), the Helmholtz free energy of the electrolyte is obtained:
The above formulae are standard. However, as evident from Equation (7), the activity coefficient introduced above refers to the overall concentration of sulfuric acid. This coefficient should be distinguished from the mean activity coefficient of sulfuric acid ions, which may be denoted by and is normally considered in electrochemistry (although less frequently when dealing with Pb-acid batteries). Using instead of simplifies the formulae that follow, since the details of dissociation of sulfuric acid into ions do not play any explicit role in the present approach. The relationship between the two activity coefficients is:
This can be obtained from Equation (7) once is expressed as a function of according to the standard formulae for ionic solutes (see e.g., Section 7.4 in [11],). Both and depend on and they are best determined from the experiment.
An important simplification of Equation (12) is obtained by introducing the following equation:
a proof of which, in a slightly modified form, is given in [10]. In this equation we set:
and:
where the symbol Π indicates the product of a sequence, i.e.,:
By rewriting the right-hand side of Equation (12) as a sum of two parts and by using Equation (14), the Helmholtz free energy of the electrolyte can, quite generally, be expressed as:
where functions Ψ′ and Ψ″ are given by:
and:
respectively. As discussed in the next section, Ψ″ is the part of Ψ that determines the admissible range of the electrolyte. Thus, as far as the determination of this range is concerned, Equation (20) enables us to substitute all of the electrolyte additives with just one single, fictitious additive of amount nadd and activity coefficient γadd. Such an additive will be referred to as the equivalent additive.
Equation (20) is quite general. It applies to any combination of additives be they liquids, solid suspensions, colloids, or any mixture thereof. Irrespective of the number and kind of additives, the values of nadd and γadd can be determined experimentally by exploiting the fact that, as discussed in the next section, there is a limit to the maximum amount of free energy that any finite system can store in isothermal conditions. The details of the relevant experimental procedure are given in Section 5.
3. Free Energy Limit of the Electrolyte Solution
At any given finite temperature, the amount of non-thermal energy that a finite system can store or supply is finite. This is an immediate consequence of the first law of thermodynamics. It implies a limit to the maximum energy that the system can store. When considered in the light of the second law of thermodynamics, the maximum energy limit entails a restriction on the states that a system can reach without suffering irreversible changes in its constitutive properties. Under rather general assumptions, such a restriction defines the region of all the states that the system can reach without suffering irreversible changes in its properties. This region is the (thermodynamically) admissible range of the system. Its boundaries are the system’s limit surface. The particular case of solutions, on which we are concerned in this paper, is discussed in detail in [10]. A systematic introduction on the subject, including general systems, is provided in [12].
From classical thermodynamics we know that, at a constant temperature, the amount of non-thermal energy that a system can store or supply equals the change in the Helmholtz free energy of the system. However, not all of the free energy of a system is subjected to thermodynamic limitation. For instance, any purely mechanical part of the free energy of a system, e.g., the potential energy due to the system’s weight, is not limited by thermodynamics. Therefore, when looking for the admissible range of a system, the part of the system’s free energy that is not bounded by thermodynamics should be ignored.
In the present case, the part of the free energy of the electrolyte that is not bounded by thermodynamics is Ψ′. This is apparent from Equation (19), as Ψ′ equals the sum of the free energies of the electrolyte components in their standard state. Thus, Ψ′ depends on the amounts of these components () independently of whether they are in a solution or separated from each other. Since there is no thermodynamic limit to the amounts of material that can be put together to form a system, there is no thermodynamic limit to the values that Ψ′ can assume. The situation is totally different for Ψ″. As Equations (6)–(8) and (20) should make evident, Ψ″ depends on the concentration of the above components. Thus, it refers to the energy that these components have as a result of their mutual interaction once they are mixed together. Any thermodynamic limitation to the energy of the electrolyte solution must therefore be a limitation on Ψ″, although the total free energy of the solution is the sum of Ψ″ plus the part of energy, Ψ′, that each component carries irrespective of the presence of other components.
Actually, it can be verified that Ψ″ is only a small fraction of Ψ. The largest part of the total free energy that a battery can store or supply is due to Ψ′ and it comes from the changes in and that are produced by the chemical reactions taking place in the electrolyte. Small as it is, however, Ψ″ determines the admissible range of the electrolyte. As a consequence, Ψ″ sets a limit to the total free energy of the battery, Ψ, because it restricts the range of variation of and . A similar situation may also apply to solutions that contain chemically reacting components. For instance, in the case of a living cell, the part of the cytosol free energy that determines the admissible range of the cell is only a fraction of the total free energy of the cytosol [10]. In that case, too, a small part of the total free energy of the cytosol sets a limit to the amount of solution components, thus limiting the energy that the living cell can store or release and, hence, its capacity to operate.
To make the following analysis independent of the amount of electrolyte, it is convenient to refer to the molal concentration of Ψ″ per kg of solvent. This energy concentration is denoted by ψ″ and is obtained by dividing both sides of Equation (20) by (i.e., by the weight in kilograms of the water contained in the electrolyte):
where is the electrolyte volume per mole of solvent:
In both the above equations, is a variable because the number of moles of water in the electrolyte varies as the battery charges or discharges.
In what follows, temperature is assumed to be constant. Moreover, the dependence of free energy on p will be ignored, as is usually done in the absence of gaseous phases, and also when operating at a constant pressure or nearly so. Thus, if is the value that ψ″ attains at the thermodynamic limit mentioned above, the following relation:
applies to all states that the electrolyte can reach at the considered temperature. When taken together with Equation (21), Equation (23) defines the admissible range of the electrolyte in the space of variables . The limit surface of the electrolyte is the boundary to this range:
It is, therefore, equipotential for ψ″ or Ψ″ (the same surface is not, however, equipotential for the total free energy of the system, or for the part Ψ′ of it, as Equations (18) and (19) show).
Although is variable, it suffers minor changes (less than about 0.3%) in normal battery operation. As far as the present analysis is concerned, the term that appears in Equation (21) can be treated as a constant. As a consequence, its contribution to ψ″ and can, to a good approximation, be neglected when applying Equations (23) and (24), because addition or subtraction of a constant term to both sides of these relations is immaterial. Accordingly, when determining the admissible range and limit surface of the electrolyte or the limit curve of the battery, we shall henceforth ignore the term in the far right-hand side of Equation (21). With this proviso, the admissible range of the electrolyte can be expressed as:
In the three-dimensional space (, , nadd) this relation defines the region of all the states that the electrolyte can attain without suffering irreversible changes. The boundary of this region is the limit surface of the electrolyte:
and it represents a surface in the three-dimensional space mentioned above.
4. Battery’s Admissible Range and Limit Curve
Not all states of the admissible range from Equation (25) can be accessed by the electrolyte inside a battery. Under normal operating conditions, the battery does not exchange material with the surroundings. In these conditions the total number of molecules of water and sulfuric acid inside the battery remains constant. This is an immediate consequence of the well-known overall reaction that controls the battery operation:
Pb (s) + PbO2 (s) + 2H2SO4 (aq) ⇌ 2PbSO4 (s) + 2H2O (l)
The reaction proceeds from left to right during battery discharge. This produces two molecules of water for every two molecules of sulfuric acid that are consumed. Charging the battery drives the reaction in the opposite direction, thus producing two molecules of sulfuric acid for every two molecules of water consumed. In both cases the sum of and remains constant. At any time of the battery’s charging or discharging process we have, therefore:
where is a constant. The value of this constant depends on battery preparation and can be determined from the values of and at any time of the battery’s life. In particular, let and be the values of and of the electrolyte that is to be introduced into the battery. These coincide with the values of and of the electrolyte within the battery as the battery starts operating once filled. The following equation must, therefore, hold true:
which fixes .
Equation (28) can be used to eliminate variable from Equations (25) and (26). This reduces the number of independent variables appearing in these equations, thus further restricting the range of states that the electrolyte can attain. More explicitly, by introducing Equation (28) into Equation (25) we obtain the battery’s admissible range:
This is the region of plane (, nadd) that contains all of the states that the electrolyte can attain during normal battery operation without suffering irreversible changes. Its boundary is the battery’s limit curve. It is obtained by taking the equality sign in Equation (30):
This curve in the plane (, nadd) delimits the region of all the states that the electrolyte can reach reversibly as it operates inside a battery.
Equations (27)–(31) apply to Pb-acid batteries containing non-reacting electrolyte additives, i.e., additives that do not react chemically between themselves or with other battery components. Non-reacting additives are commonly used in commercial batteries. As previously stated, these are the only additives about which we are concerned in this paper. The same equations also apply, in particular, in the absence of electrolyte additives, in which case nadd = 0.
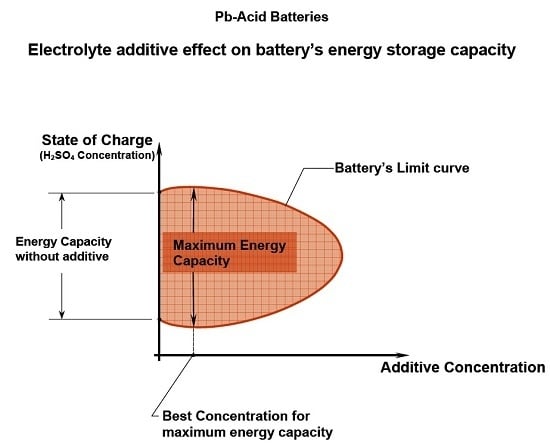
A typical limit curve ψ″ = and, thus, moves the state of the battery upward, i.e., along line AB of Figure 1. The battery’s admissible range is the shadowed region within the curve. The amount of additive in the electrolyte remains constant during charge and discharge, because the additive is chemically inactive. Thus, charging or discharging the battery within this range displaces the state of the battery up and down a vertical line, nadd = constant, in the plane of Figure 1. Irreversible changes are produced in the electrolyte if the battery’s limit curve is exceeded. More specifically, charging the battery increases and, thus, moves the state of the battery upward, i.e., along line AB of Figure 1.
The process is reversible as long as the battery state remains within segment AB. However, if point A is exceeded, oxygen evolution takes place at the positive electrode, which makes the process irreversible. A similar situation occurs during discharging. In this case, the discharging process consumes sulfuric acid and the battery state moves downward along line AB. Point B on the battery’s limit curve is the limit to reversible discharge. Beyond this point, the battery’s voltage becomes lower than the voltage needed to maintain the negative electrode reaction:
in chemical equilibrium. This makes the reaction proceed irreversibly to the right. The phenomenon occurs at a comparably low time rate and is known as sulfation. It leads to the formation of insoluble PbSO2 crystals at the negative electrode with concomitant evolution of hydrogen. Oxygen and hydrogen evolution at the limits of the admissible range are related to the electrochemical windows of water. The reader is referred to the relevant literature for details on the chemical reactions that regulate the electrochemical stability of water in aqueous electrolytes (see e.g., ([13,14,15,16,17]).
Pb + H2SO4 ⇌ PbSO4 + H2
The width of the admissible range along a vertical line through nadd is denoted as in Figure 1. This width represents the maximum amount of sulfuric acid that, per kilogram of solvent water, can react reversibly according to Equation (27). Thus, the greater this width, the greater the amount of energy that the battery can store and produce without the electrolyte deteriorating. The maximum value of is attained for nadd = and is denoted as in the above figure. Since the amount of solvent water depends on the state of charge of the battery, it may be convenient to define the additive concentration with reference to a fixed state of charge of the battery. This will be taken as the hypothetical state of total discharge, which the battery would attain once all sulfuric acid in the electrolyte is consumed according to Equation (27). In this state the amount of water in the electrolyte would be , according to Equation (28). Therefore, when referring to this hypothetical state, the molal concentration of the electrolyte additive corresponding to is given by:
This can be considered as the nominal molality of additive that is required to produce the maximum capacity of energy storage in the battery.
Let be the value of when the battery electrolyte is free from additives (see Figure 1). Since the energy that a battery can store or supply is proportional to the moles of sulfuric acid which undergo Equation (27), the ratio:
represents the largest relative increase in the maximum capacity of energy storage that can be obtained from a given electrolyte additive. Of course, ηmax depends on the additive being used, due to the dependence on the additive of the battery limit curve.
5. Experimental Determination of the Limit Curve
To determine the limit curve of a battery, we need to know the values of and γadd which are to be introduced into Equation (31). These values can be determined experimentally as follows: We start by observing that Equation (31) holds true, in particular, when the electrolyte is free from additives. In this case nadd = 0 and Equation (31) reduces to:
This equation applies at the limit of the battery’s admissible range. The quantity appearing here is given by Equation (29). It depends on battery preparation but not on the presence of electrolyte additives. Thus, by operating on the battery deprived of electrolyte additive, we increase the battery’s state of charge until we reach a limit point beyond which oxygen starts to develop at the positive electrode in open circuit conditions (point A° of Figure 1). The appearance of this irreversible phenomenon indicates that the state of the battery has reached the limit curve. We determine the value of at this limit and we insert it into Equation (35). We can, thus, calculate .
As widely known, sulfuric acid concentration and battery voltage are related to each other (see e.g., [18,19,20,21]). Therefore, rather than determining the limit value of , we may determine the maximum open circuit voltage at which the battery maintains its charge without producing oxygen at the positive electrode. This voltage is considerably higher than the standard voltage (1.229 V) of water electrolysis [22], owing to the overvoltage that develops at the battery electrodes. The extent of overvoltage depends on the property of the electrode surface and on the presence of small amounts of various additives in the electrodes, introduced in their fabrication. As is apparent from Equations (20) and (21), functions Ψ″ and ψ″ are independent of the free energy of the electrodes. However, the overvoltage that the electrodes produce influences the battery’s admissible range and limit curve, since it affects the limit value of and, hence, the value of . This makes the battery’s admissible range and limit curve depend on the properties of the battery as a whole, and not simply on the properties of its electrolyte.
The procedure to determine γadd is analogous to that followed to determine . In this case, however, the battery electrolyte should contain a known amount of additive. Again, we charge the battery up to the limit at which oxygen develops at the positive electrode in open circuit conditions. We determine the corresponding value of and we insert it together with the considered value of nadd into Equation (31). Since has already been determined, the only unknown in this equation is γadd, which can, thus, be determined. Due to the presence of transcendental terms, the value of γadd is best calculated graphically or numerically.
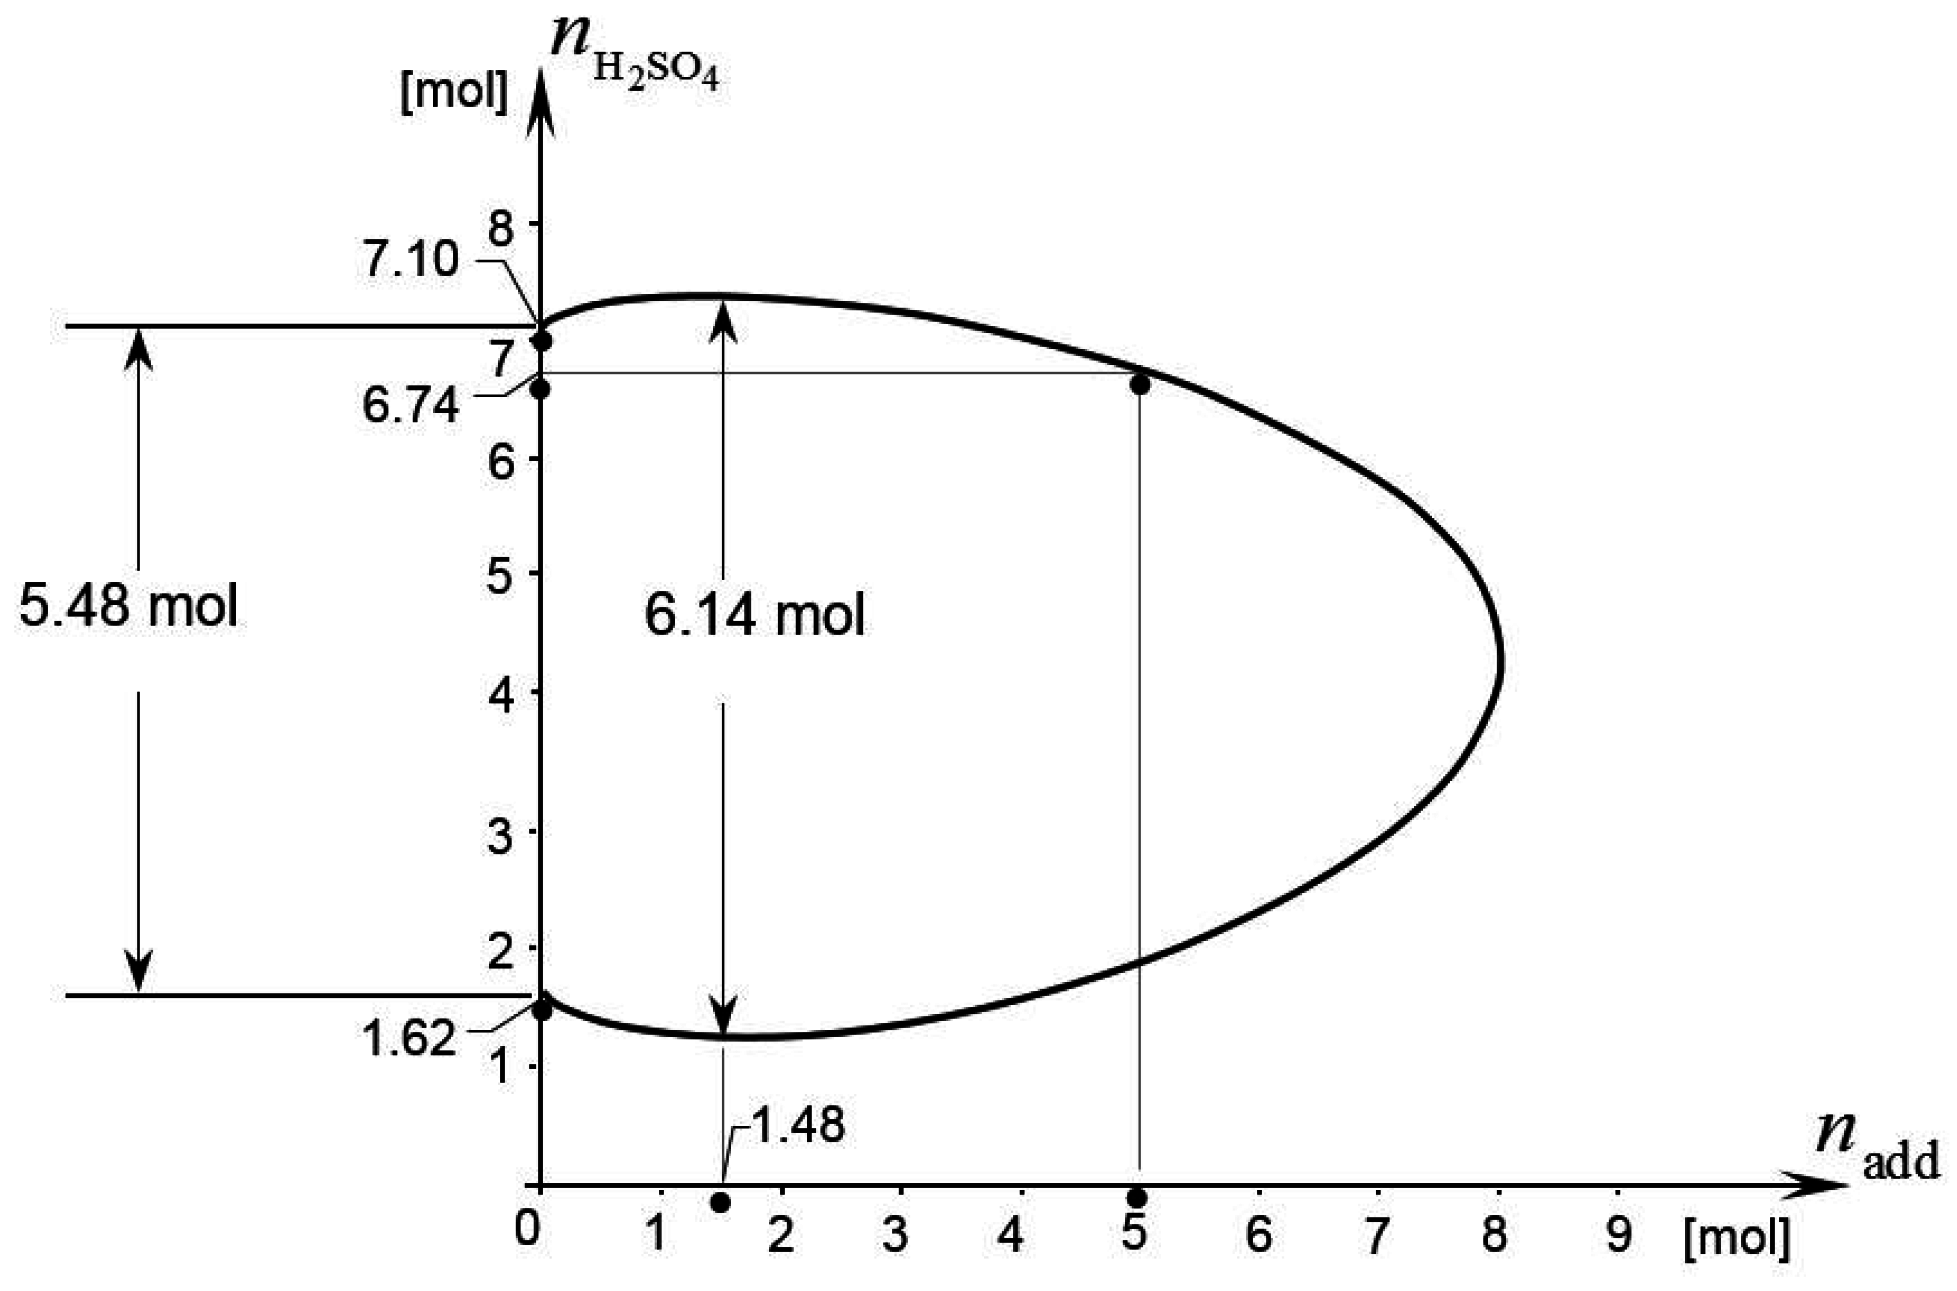
To exemplify, let us refer to a typical car battery at room temperature (T = 25 °C = 298.15 K). We assume that, at the time of manufacturing, the electrolyte within the battery contains 1 kg of water with a molar concentration of sulfuric acid given of = 6 mol/kg. This means = 55.51 mol and = 6 mol. Thus, = 55.51 + 6 = 61.51 mol, as follows from Equation (29). By leaving the electrolyte free from additives, we charge the battery and find that = 7.25 mol/kg is the highest sulfuric acid concentration that the battery can maintain in open circuit conditions without producing oxygen at its positive electrode (this concentration corresponds to a voltage of 2.16 V—or 12.96 V for a six-cell battery—according to the data available from the literature [19]). As observed, battery charge and discharge occurs at constant . Therefore, in view of Equation (28), we find that the above value = 7.25 mol/kg means = 7.10 mol and = 54.41 mol in the battery electrolyte. By introducing into Equation (35) the values of and corresponding to this value of as available from the literature and reported in the Appendix, and by recalling that R = 8.3143 J·K−1·mol−1 and = 18.015 × 10⁻³ kg·mol−1, we calculate that, for the battery under consideration, = −20.25 J·kg−1.
To determine γadd, we add an arbitrary amount of the considered additive into the electrolyte of the battery. Let nadd = 5 mol, for instance. By operating the battery thus modified, we find that the open circuit limit for oxygen evolution at the positive electrode occurs when the battery charge corresponds to an amount of sulfuric acid of, say, = 6.74 mol. By inserting this value of into Equation (35), we calculate that γadd = 0.64, as can be verified from the same equation once we set nadd = 5 mol, = 61.51 mol, and = −20.25 J·kg−1.
Finally, by inserting these values of , , and γadd into Equation (35) and by making use of the expressions of and reported in the Appendix, we obtain the analytic expression of the limit curve of the considered battery. This curve is plotted in Figure 2. From the same figure we find that = 5.48 mol and = 6.14 mol. This implies ηmax = 0.12 according to Equation (34). Thus, the electrolyte additive considered in this example can produce up to a 12% increase in the battery’s energy storage capacity. The amount of additive needed to produce the maximum energy storage capacity is = 1.48 mol, as the figure shows. The corresponding nominal molality of additive is = 1.34 mol/kg, according to Equation (33).
Different additives may affect the battery differently. For instance, for the same battery considered in the above example, an additive with γadd = 0.3 could produce a 25% increase in the energy storage capacity of the battery. This can be checked easily from Equation (35), by constructing the limit curve for γadd = 0.3 and the same values of and given above. In this case the amount of additive producing the maximum energy storage capacity would be = 3.23 mol, which means = 2.91 mol/kg.
In the above analysis, we treated γadd as a constant, thus neglecting any possible dependence of γadd on additive concentration. This may be acceptable, if the additive concentration is moderately low (as is the case in many applications) or if we confine our attention to a sufficiently small portion of the limit curve. Should more precision be required, the above procedure to determine γadd can be repeated several times for as many different values of nadd as needed. The values of γadd thus obtained could then be used to determine a function γadd(nadd) which can be substituted for γadd into Equation (35), if the approximation γadd = const. turns out to be inadequate.
Rather than charging the battery up to the oxygen evolution limit, represented by point A° in Figure 1, we could—in principle—determine by discharging the additive-free battery down to point B° of the same figure. This is the point of the battery’s limit surface at which sulfation of the negative electrode start to take place. Once the concentration of sulfuric acid corresponding to this lower limit is determined, the limit curve can be determined as described above. Both procedures should provide the same value of , because both A° and B° belong to the same curve . However, reference to the oxygen evolution limit appears to be more practical, since sulfation is a rather slow phenomenon.
6. Conclusions
It is known that the energy capacity of a Pb-acid battery may be influenced by the presence of additives in its electrolyte. The notion of equivalent additive, defined in this paper, helps to analyze the effect of chemically inert additives and mixtures of such additives on the energy capacity of the battery. This can be applied to determine an entire region of electrolyte concentrations, referred to as the battery's admissible range, within which no irreversible change is produced in the battery during charge or discharge. The boundary of this region is the battery’s limit curve. It corresponds to the concentrations of sulfuric acid and, thus, to the range of open circuit voltages, that cannot be exceeded without producing irreversible changes in the battery. The limit curve of a battery can be constructed from a few experiments in which the battery is charged (or discharged) at different additive concentrations. This provides useful information about the effectiveness of the additive to increase the energy capacity of the battery, and the best additive concentration to adopt to this end. The practical implications on the choice of the best additive to use are obvious. However, it should be kept in mind that an additive can also produce undesired side effects, which are not considered in the present work and require adequate scrutiny before any improvement of the energy capacity of the battery resulting from the additive can be considered as practical.
Conflicts of Interest
The author declares no conflict of interest.
Appendix. Activity Coefficients of Water and Sulfuric Acid in Solution
When expressed in molalities, the concentration of a solute does not depend on the presence of other solutes in the same solution. Moreover, if the concentration of solutes is sufficiently small, the activity coefficient of each solute is only marginally affected by the presence of other solutes in the same solution. For this reason, due to the lack of better data concerning the influence of the addictives on the activity coefficients of the electrolyte, the activity coefficient of sulfuric acid () is assumed to have the same values that it assumes in the absence of additives. In other terms:
where the function is obtained from after substitution Equation (4).
On the other hand, the activity coefficient of a solvent depends on its mole ratio. In the considered case, the solvent is water and its mole ratio,, depends on the amount of sulfuric acid and additives contained in the electrolyte, as is apparent from Equation (3). The analysis of the present paper, however, concerns unreactive additives at comparatively low concentration. Under these conditions, the influence of additives on solvent activity coefficient, , is expected to be of secondary importance. For this reason, and in view of the already mentioned paucity of experimental data, the values of of an electrolyte with additives are assumed to coincide with those of the electrolyte without additives, . The quantity introduced here is the solvent mole ratio when nadd = 0. That is:
This assumption about means, therefore:
The experimental values attained by the functions and for a wide range of concentrations are reported in many papers and books. For a critical review of these experimental data the reader is referred to [23,24]. On the basis of these data, Equation (A1) is assumed to be approximated by the expression:
represented graphically in the following Figure A1.
Figure A1.
Plot of Equation (A4) showing the dependence of on sulfuric acid molality in aqueous solutions. Experimental values ( ![Batteries 02 00036 i001]() ) of are taken from Bullock [24].
) of are taken from Bullock [24].
 ) of are taken from Bullock [24].
Figure A1.
Plot of Equation (A4) showing the dependence of on sulfuric acid molality in aqueous solutions. Experimental values ( ![Batteries 02 00036 i001]() ) of are taken from Bullock [24].
) of are taken from Bullock [24].
) of are taken from Bullock [24].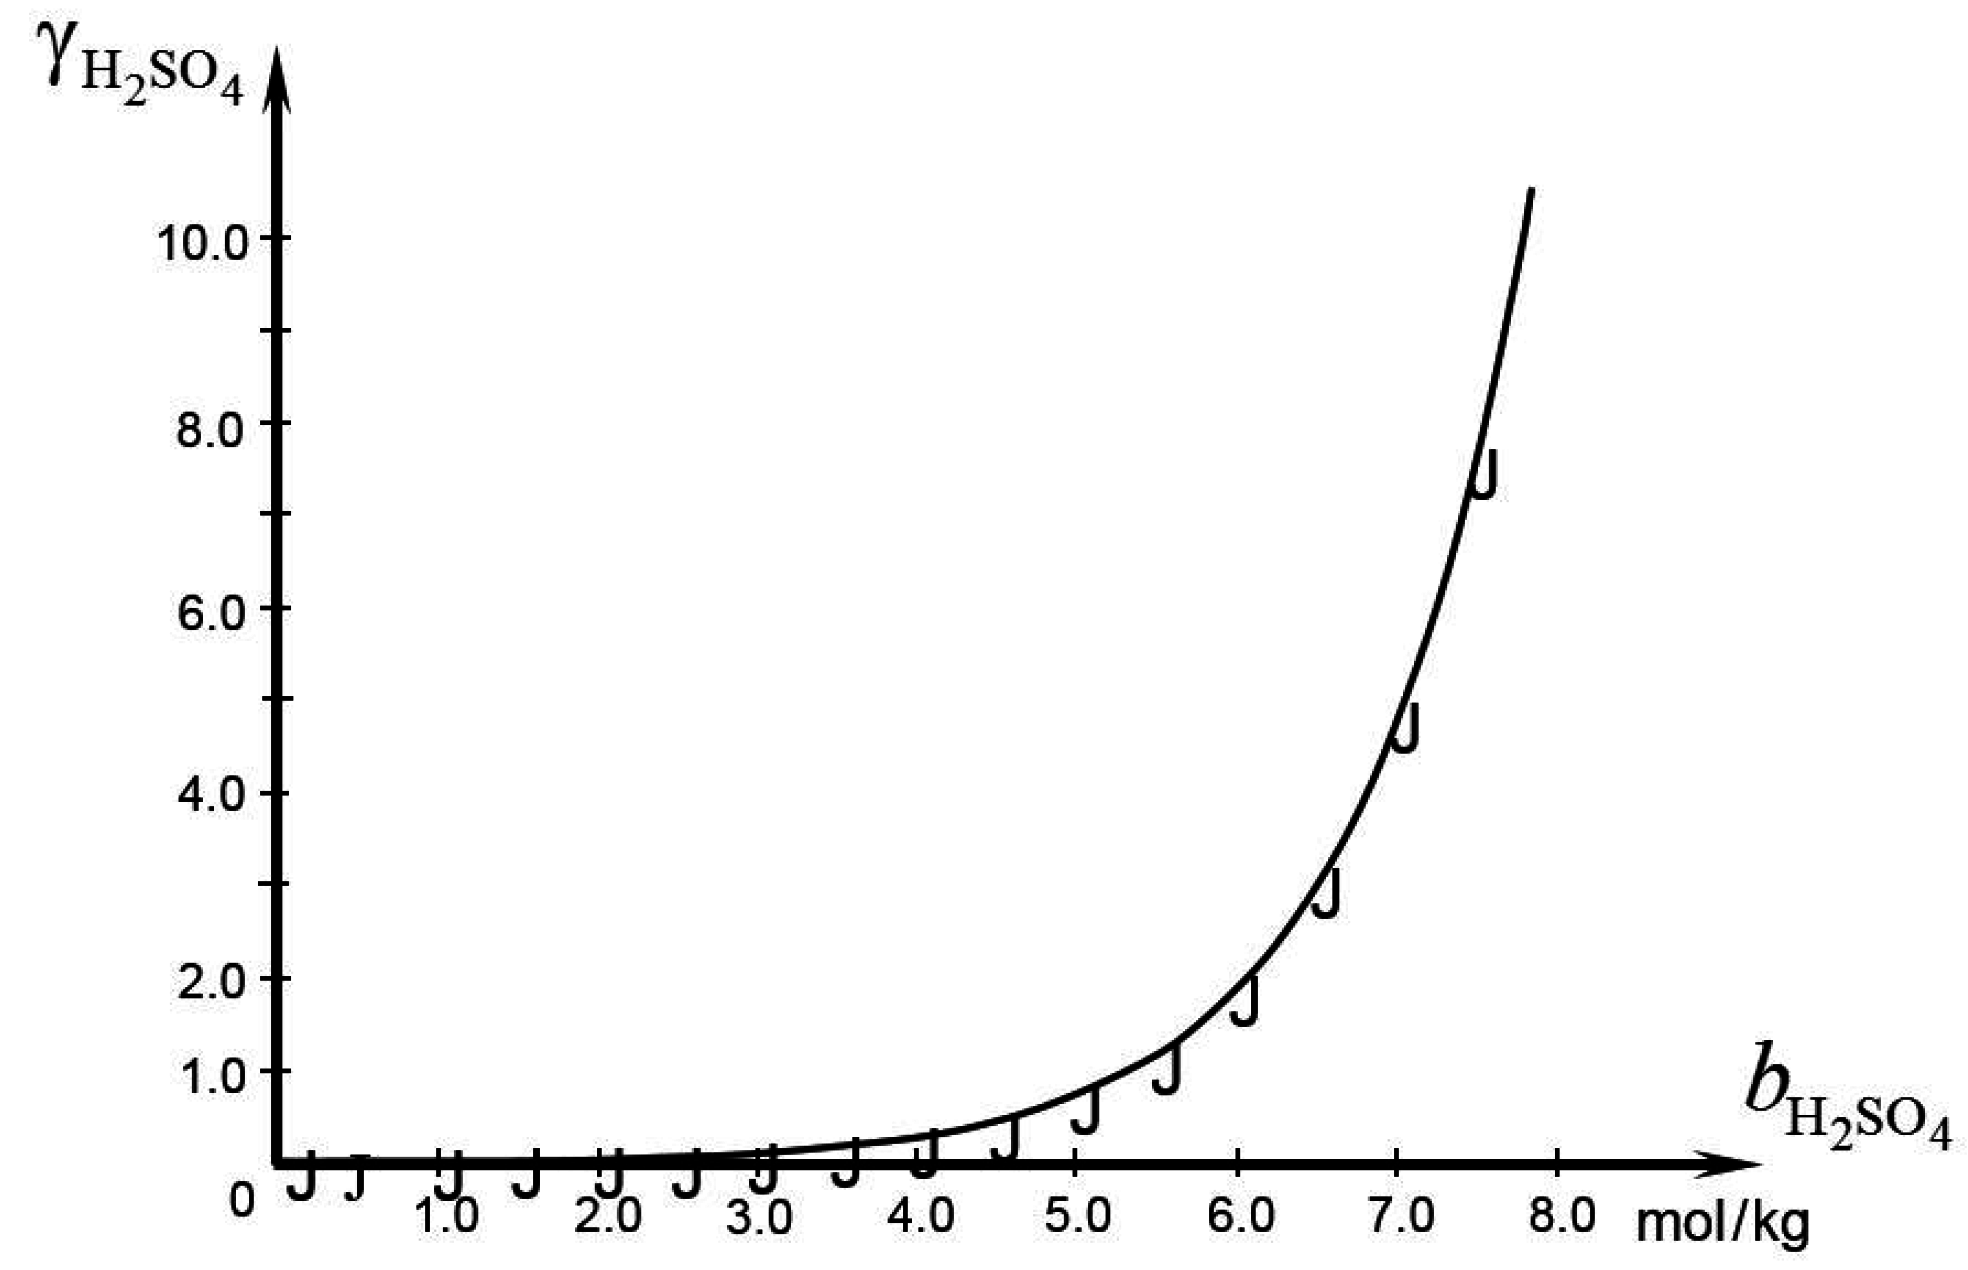
As for the solvent, the following polynomial approximation provides a good approximation to well-established experimental data ([23,24]) concerning the activity of water in sulfuric acid aqueous solutions for :
This equation is plotted in Figure A2, together with the values of obtained from the data reported in [24]. Equations (A4) and (A5) were used to determine the battery’s limit curve of the example presented in Section 5.
Figure A2.
Curve of Equation (A5) showing as a function of for sulphuric acid aqueous solutions. Values ( ![Batteries 02 00036 i001]() ) of calculated from the experimental data reviewed in Bullock [24].
) of calculated from the experimental data reviewed in Bullock [24].
) of calculated from the experimental data reviewed in Bullock [24].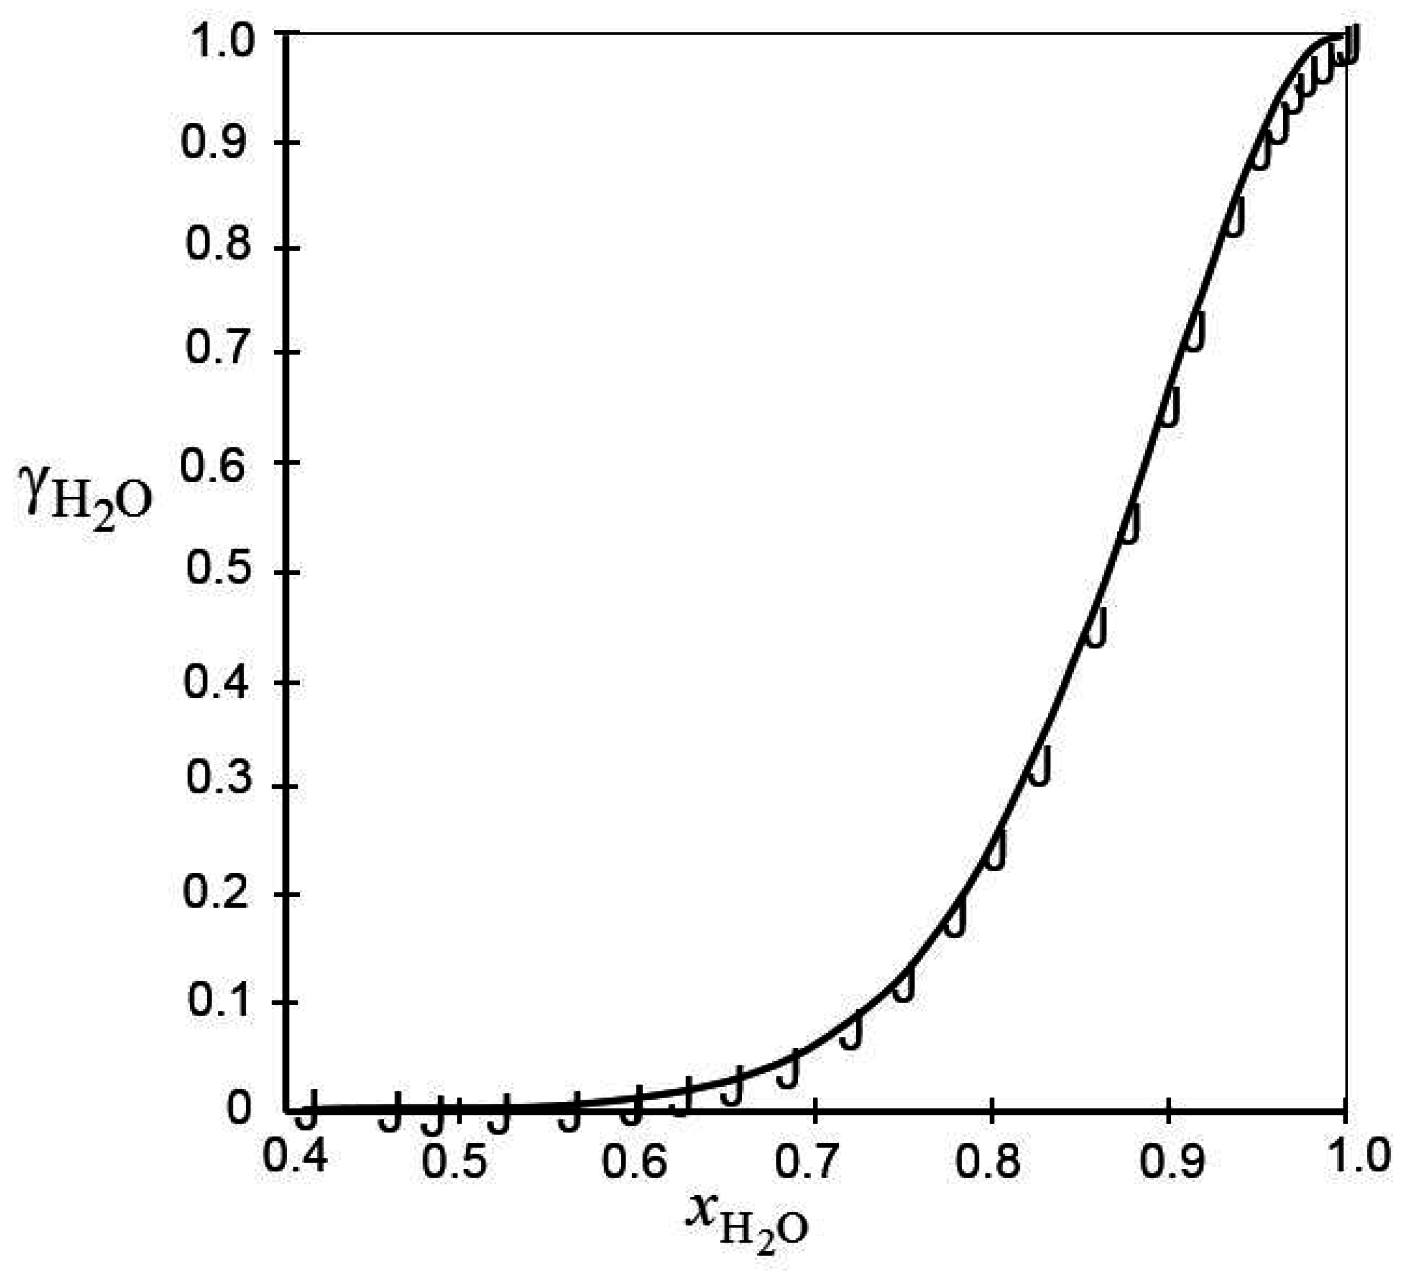
References
- Pavlov, D. Lead-Acid Batteries Science and Technology; Elsevier: Amsterdam, The Netherlands, 2011. [Google Scholar]
- Zhao, Y.; Bostrom, T. Application of ionic liquids in solar cells and batteries: A review. Curr. Org. Chem. 2015, 19, 556–566. [Google Scholar] [CrossRef]
- O’Mahony, A.M.; Silvester, D.S.; Aldous, L.; Hardacre, C.; Compton, R.G. Effect of water on the electrochemical window and potential limits of room-temperature ionic liquids. J. Chem. Eng. Data 2008, 53, 2884–2891. [Google Scholar] [CrossRef]
- Rezaei, B.; Mallakpour, S.; Taki, M. Application of ionic liquids as an electrolyte additive on the electrochemical behavior of lead acid battery. J. Power Sources 2009, 187, 605–612. [Google Scholar] [CrossRef]
- Rezaei, B.; Havakeshian, E.; Hajipour, A.R. Influence of acidic ionic liquids as an electrolyte additive on the electrochemical and corrosion behaviors of lead-acid battery. J. Solid State Electrochem. 2011, 15, 421–430. [Google Scholar] [CrossRef]
- Tuphorn, H. Gelled-electrolyte batteries for electric vehicles. J. Power Sources 1992, 40, 47–61. [Google Scholar] [CrossRef]
- Lambert, D.W.H.; Greenwood, P.H.J.; Reed, M.C. Advances in gelled-electrolyte technology for valve-regulated lead-acid batteries. J. Power Sources 2002, 107, 173–179. [Google Scholar] [CrossRef]
- Chen, M.Q.; Chen, H.Y.; Shu, D.; Li, A.J.; Finlow, D.E. Effects of preparation condition and particle size distribution on fumed silica gel valve-regulated lead-acid batteries performance. J. Power Sources 2008, 181, 161–171. [Google Scholar] [CrossRef]
- Tundorn, P.; Chailapakul, O.; Tantavichet, N. Polyaspartate as a gelled electrolyte additive to improve the performance of the gel valve-regulated lead-acid batteries under 100% depth of discharge and partial-state-of charge conditions. J. Solid State Electrochem. 2016, 20, 801–811. [Google Scholar] [CrossRef]
- Paglietti, A. Limits to anaerobic energy and cytosolic concentration in the living cell. Phys. Rev. E 2015, 92. [Google Scholar] [CrossRef] [PubMed]
- Silbey, R.J.; Alberty, R.A.; Bawendi, M.G. Physical Chemistry, 4th ed.; Wiley: Hoboken, NJ, USA, 2005. [Google Scholar]
- Paglietti, A. Thermodynamic Limit to the Existence of Inanimate and Living Systems; Sepco-Acerten: Milan, Italy, 2014. [Google Scholar]
- Revie, R.W.; Uhlig, H.H. Corrosion and Corrosion Control, 4th ed.; Wiley: Hoboken, NJ, USA, 2008; Chapter 4. [Google Scholar]
- Jones, D.A. Principles and Prevention of Corrosion, 2nd ed.; Prentice Hall: Upper Saddle River, NJ, USA, 1996; Chapter 2. [Google Scholar]
- Crow, D.R. Principles and Applications of Electrochemistry, 2nd ed.; Chapman & Hall: London, UK, 1979; Chapter 8. [Google Scholar]
- Swaddle, T.W. Inorganic Chemistry: An Industrial and Environmental Perspective; Academic Press: San Diego, CA, USA, 1997; Chapter 15. [Google Scholar]
- Wessells, C.; Ruffo, R.; Huggins, R.A.; Cui, Y. Investigation of the electrochemical stability of aqueous electrolytes for lithium battery applications. Electrochem. Solid State Lett. 2010, 13, A59–A61. [Google Scholar] [CrossRef]
- Treptow, R.S. The lead-acid battery: Its voltage in theory and practice. J. Chem. Educ. 2002, 79, 334–338. [Google Scholar] [CrossRef]
- Berndt, D. Maintenance Free Batteries Based on Aqueous Electrolyte, 3rd ed.; Research Studies Press: Baldock, UK, 2003. [Google Scholar]
- Berndt, D. Electrochemical Energy Storage. In Battery Technology Handbook, 2nd ed.; Kiehne, H.A., Ed.; Marcel Dekker: New York, NY, USA, 2003; Chapter 1; pp. 1–99. [Google Scholar]
- Pinkwart, K.; Tübke, J. Thermodynamics and Mechanistics. In Handbook of Battery Materials, 2nd ed.; Daniel, C., Besenhard, J.O., Eds.; Wiley-VCH: Weinheim, Germany, 2011; pp. 3–26. [Google Scholar]
- Millet, P. Fundamentals of Water Electrolysis. In Hydrogen Production; Godula-Jopek, A., Ed.; Wiley-VCH: Weinheim, Germany, 2015; pp. 33–62. [Google Scholar]
- Robinson, R.A.; Stokes, R.H. Electrolyte Solutions, 2nd ed.; Butterworth: London, UK, 1959. [Google Scholar]
- Bullock, K.R. The electromotive force of lead-acid cell and its half-cell potentials. J. Power Sources 1991, 35, 197–223. [Google Scholar] [CrossRef]
Figure 1.
Typical limit curve of a Pb-acid battery containing a non-reacting additive in the electrolyte. The curve is obtained from Equation (31). The electrolyte does not suffer irreversible changes if it is kept within the battery’s admissible range (shadowed in the figure).
Figure 1.
Typical limit curve of a Pb-acid battery containing a non-reacting additive in the electrolyte. The curve is obtained from Equation (31). The electrolyte does not suffer irreversible changes if it is kept within the battery’s admissible range (shadowed in the figure).
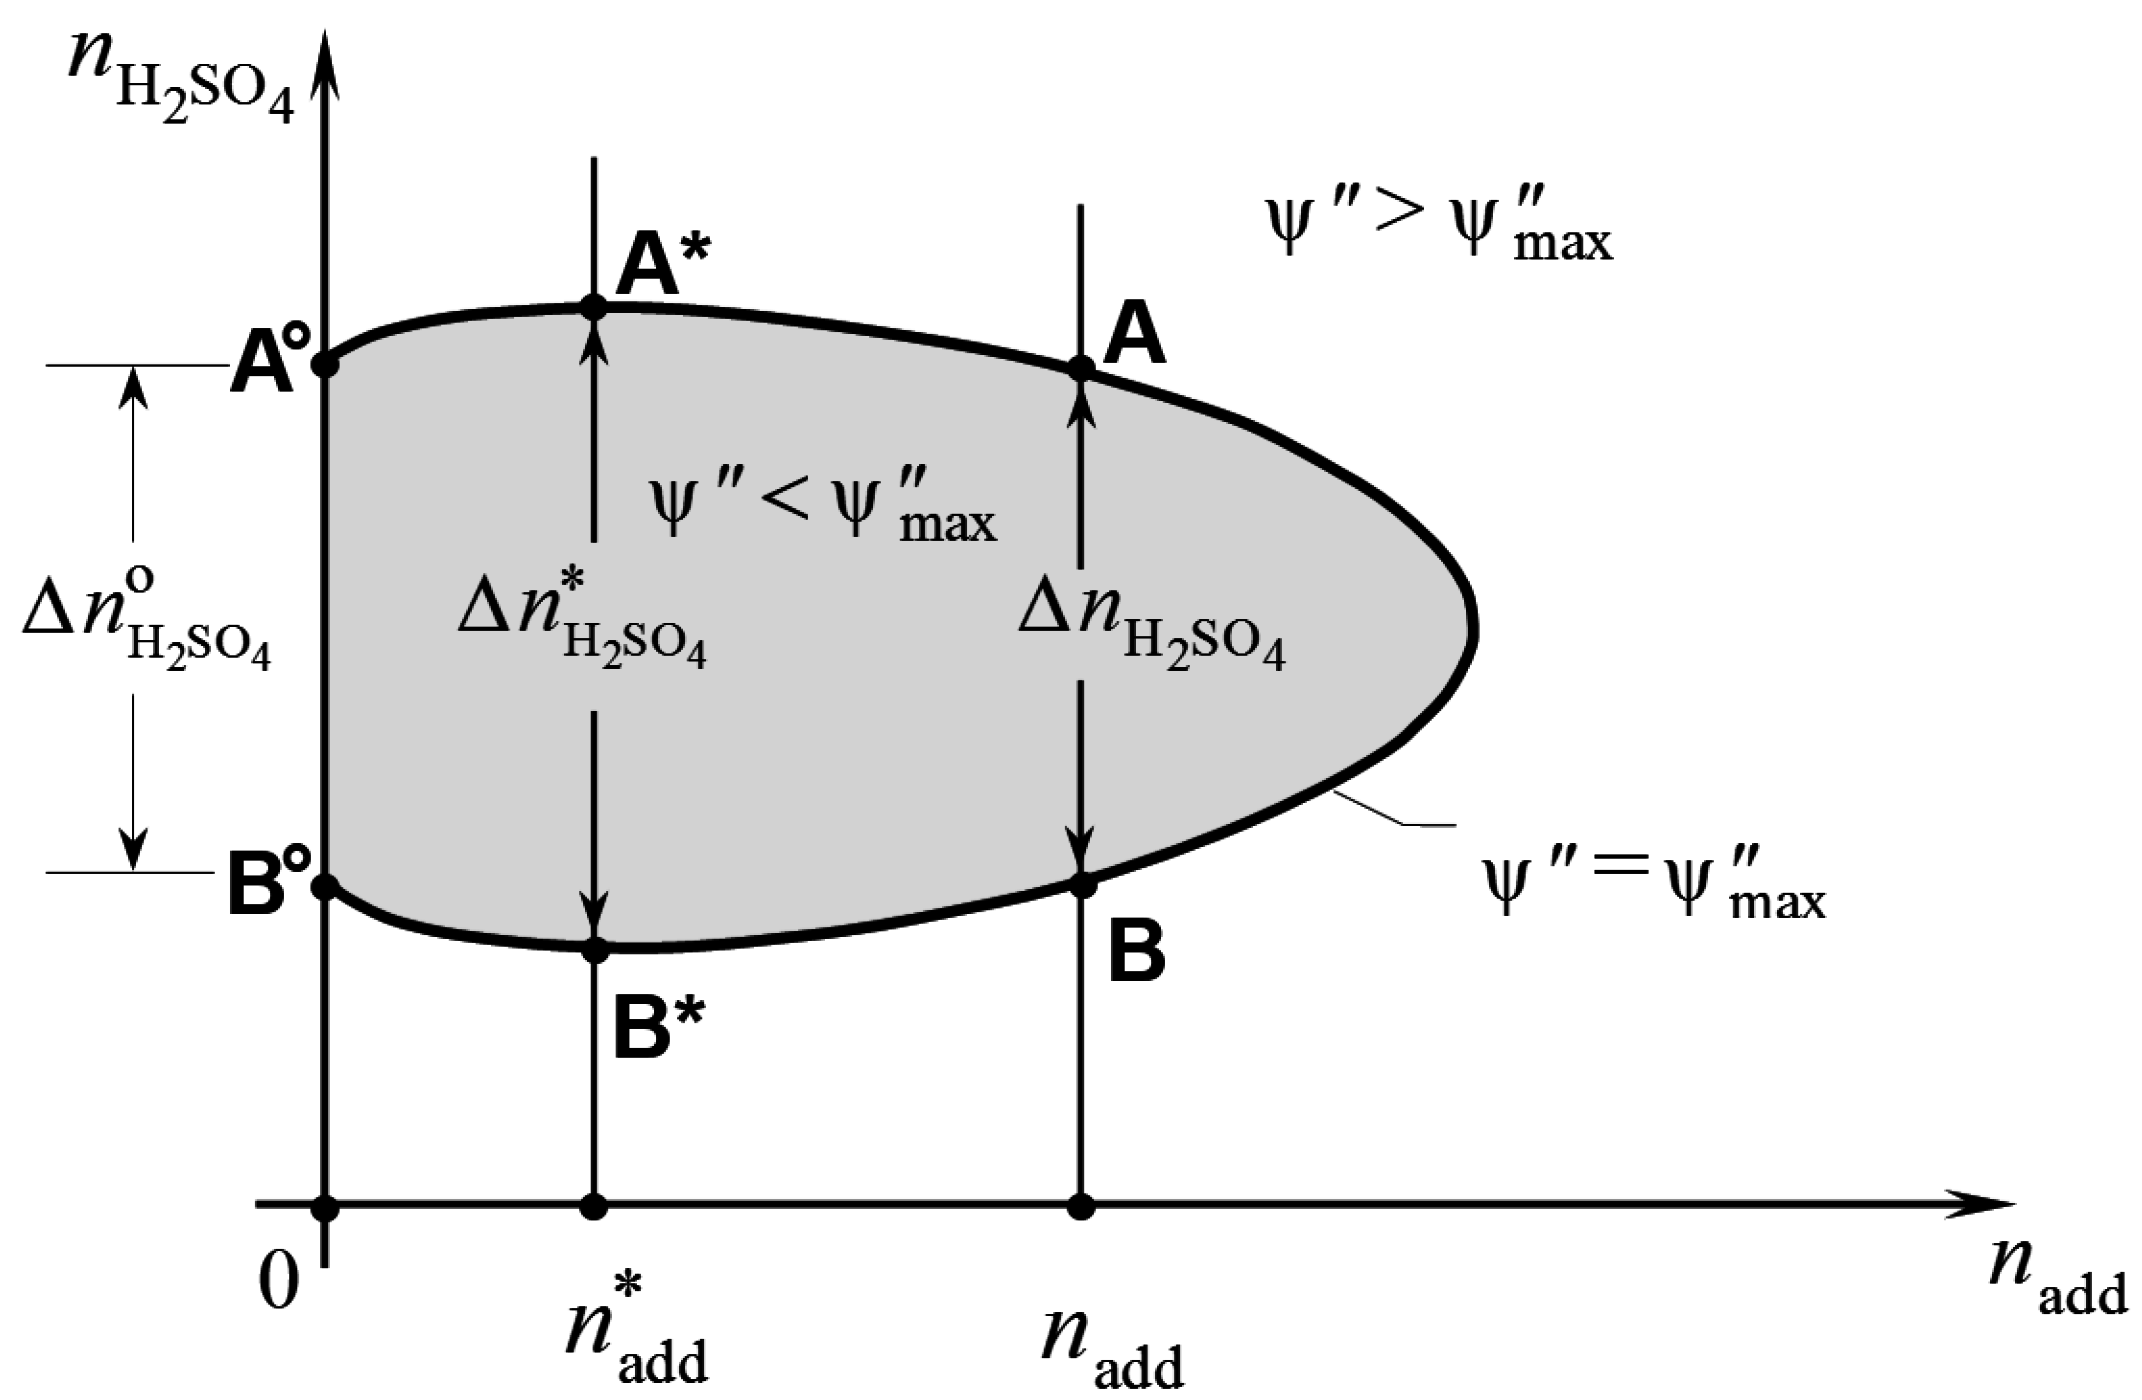
Figure 2.
Practical example of a battery’s limit curve. The diagram refers to 1 kg of electrolyte solvent (water). Thus, the values reported in the axes can also be read as molal concentrations.
Figure 2.
Practical example of a battery’s limit curve. The diagram refers to 1 kg of electrolyte solvent (water). Thus, the values reported in the axes can also be read as molal concentrations.
© 2016 by the author; licensee MDPI, Basel, Switzerland. This article is an open access article distributed under the terms and conditions of the Creative Commons Attribution (CC-BY) license (http://creativecommons.org/licenses/by/4.0/).
Share and Cite
MDPI and ACS Style
Paglietti, A. Electrolyte Additive Concentration for Maximum Energy Storage in Lead-Acid Batteries. Batteries 2016, 2, 36. https://doi.org/10.3390/batteries2040036
AMA Style
Paglietti A. Electrolyte Additive Concentration for Maximum Energy Storage in Lead-Acid Batteries. Batteries. 2016; 2(4):36. https://doi.org/10.3390/batteries2040036
Chicago/Turabian StylePaglietti, Andreas. 2016. "Electrolyte Additive Concentration for Maximum Energy Storage in Lead-Acid Batteries" Batteries 2, no. 4: 36. https://doi.org/10.3390/batteries2040036
Note that from the first issue of 2016, this journal uses article numbers instead of page numbers. See further details here.