2. Experimental Section
2.1. Electrodes’ Preparation
Pairs of energy-optimized anodes and cathodes based on synthetic graphite and NMC (111) as active materials were studied; an active material combination that is commonly used in lithium ion cells for automotive or stationary applications. Nine batches of single-sided thick electrodes with different porosities were prepared and characterized to optimize the porosity in terms of volumetric energy density (Wh/L).
Commercially available battery-grade cathode material LiNiMnCoO (NMC, BASF, Hannover, Germany) and anode material graphite SMG-A (Hitachi, Tokyo, Japan) were used as the active materials. Solef 5130 PVDF (Solvay, Bollate, Italy) was used as a binder, while Super C65 carbon black, KS6L graphite (Imerys, Bodio, Switzerland, formerly Timcal) and milled carbon fibers (SIGRAFIL, C M150-4.0/240-UN, SGL Group, Meitingen, Germany) were used as conductive agents. The carbon fibers have a mean fiber length of ∼150 m, a filament diameter of 7 m and fiber density of 1.8 g/cm3. There was no pre-treatment performed on the carbon fibers before mixing with other materials. All materials and substrates were used as delivered. PVDF was dissolved in N-methyl-pyrrolidone (NMP) at 60 C under stirring.
The cathode slurry was prepared by mixing NMC (90 wt%), Super C65 carbon black (3 wt%), KS6L graphite (3 wt%), carbon fibers (1 wt%) and PVDF (3 wt%), dissolved in NMP. The anode slurry was prepared by mixing graphite (92 wt%), Super C65 carbon black (3 wt%), carbon fibers (1 wt%) and PVDF (4 wt%), dissolved in NMP. These mixtures were further stirred and homogenized with a dispersing system (Dissolver Dispermat CA40, VMA-Getzmann GmbH, Reichshof, Germany) for approximately 2 h. Finally, the slurries were deaerated under vacuum for 1 h to remove the bubbles. The cathode slurry was then cast on aluminum foil (thickness: 20 m), and the anode slurry was cast on copper foil (thickness: 10 m). Anodes and cathodes of different thicknesses were prepared by varying the doctor blade height. The coated electrodes were dried in an oven at 120 C in an ambient atmosphere for 30 min.
A calendering roll pressure was applied to reduce 5% and 10% on the cathode side and 5%, 10%, 15% and 20% on the anode side of the original thickness of the dried slurry film, so that different porosities could be maintained in the electrodes. These values are somewhat higher than the ca. 30% porosity typically found in commercial electrodes. However, to minimize lithium ion transport losses in the electrolyte phase rather than improve electric conductivity and volumetric energy density of the layer, we opted for higher porosities.
The average mass loadings of the cathode electrode with a 300-m thickness and anode electrode with a 350-m thickness (as-coated, exclusive of current collector foil) were ∼71 mg/cm2 and ∼41 mg/cm2, respectively.
Cathode: NMC (81%), carbon black (6.7%), graphite (5.3%), PVDF (7%) and carbon fiber (2.3%) in volume%; anode: graphite (91.4%), carbon black (2.6%), PVDF (5%) and carbon fiber (1.24%) in volume%.
2.2. Cell Preparation and Characterization
Pouch bag cells with one anode and cathode sheet each were assembled in a dry room with dew points below −70 C. The active areas of the cathodes and anodes sheets were 5 × 5 cm2 and 5.4 × 5.4 cm2, respectively. It should be noted that during cutting and drying, both electrodes showed good mechanical integrity and stable edges. Electrodes were dried at 130 C under vacuum overnight. Nickel and aluminum cell terminals were welded on anode and cathode electrodes by ultrasound, respectively. The electrolyte used in all cases was LP30 (BASF SE, Ludwigshafen, Germany) with vinylene carbonate (VC) (11.5 wt% LiPF, 42.8 wt% ethylene carbonate (EC) , 42.8 wt% dimethyl carbonate (DMC) , 2.9 wt% VC, BASF).
The lithium ion full cells were cycled galvanostatically at various currents in the voltage range of 3.0–4.2 V and potentiostatically at 4.2 V for 30 min using an Arbin BT 2000 battery tester (Arbin Instruments, College Station, TX, USA) and a Binder temperature chamber (BINDER GmbH, Tuttlingen, Germany) at temperatures of 23
C, 40
C and 10
C. The Gamry potentiostat (Interface 1000) (Gamry Instruments, Warminster, PA, USA) was used to measure the impedance of the Li-ion full cells. The impedance was measured at 3.7 V in the frequency range of 100 kHz–1 mHz at different temperatures (23
C, 40
C and 10
C). Scanning electron microscopy (Leo 1530 microscope, Carl Zeiss Microscopy GmbH, Oberkochen, Germany) was used to view the difference between as-coated and calendered electrodes. The cell index (full cell names) with anode and cathode porosities is given in
Table 1.
3. Results and Discussion
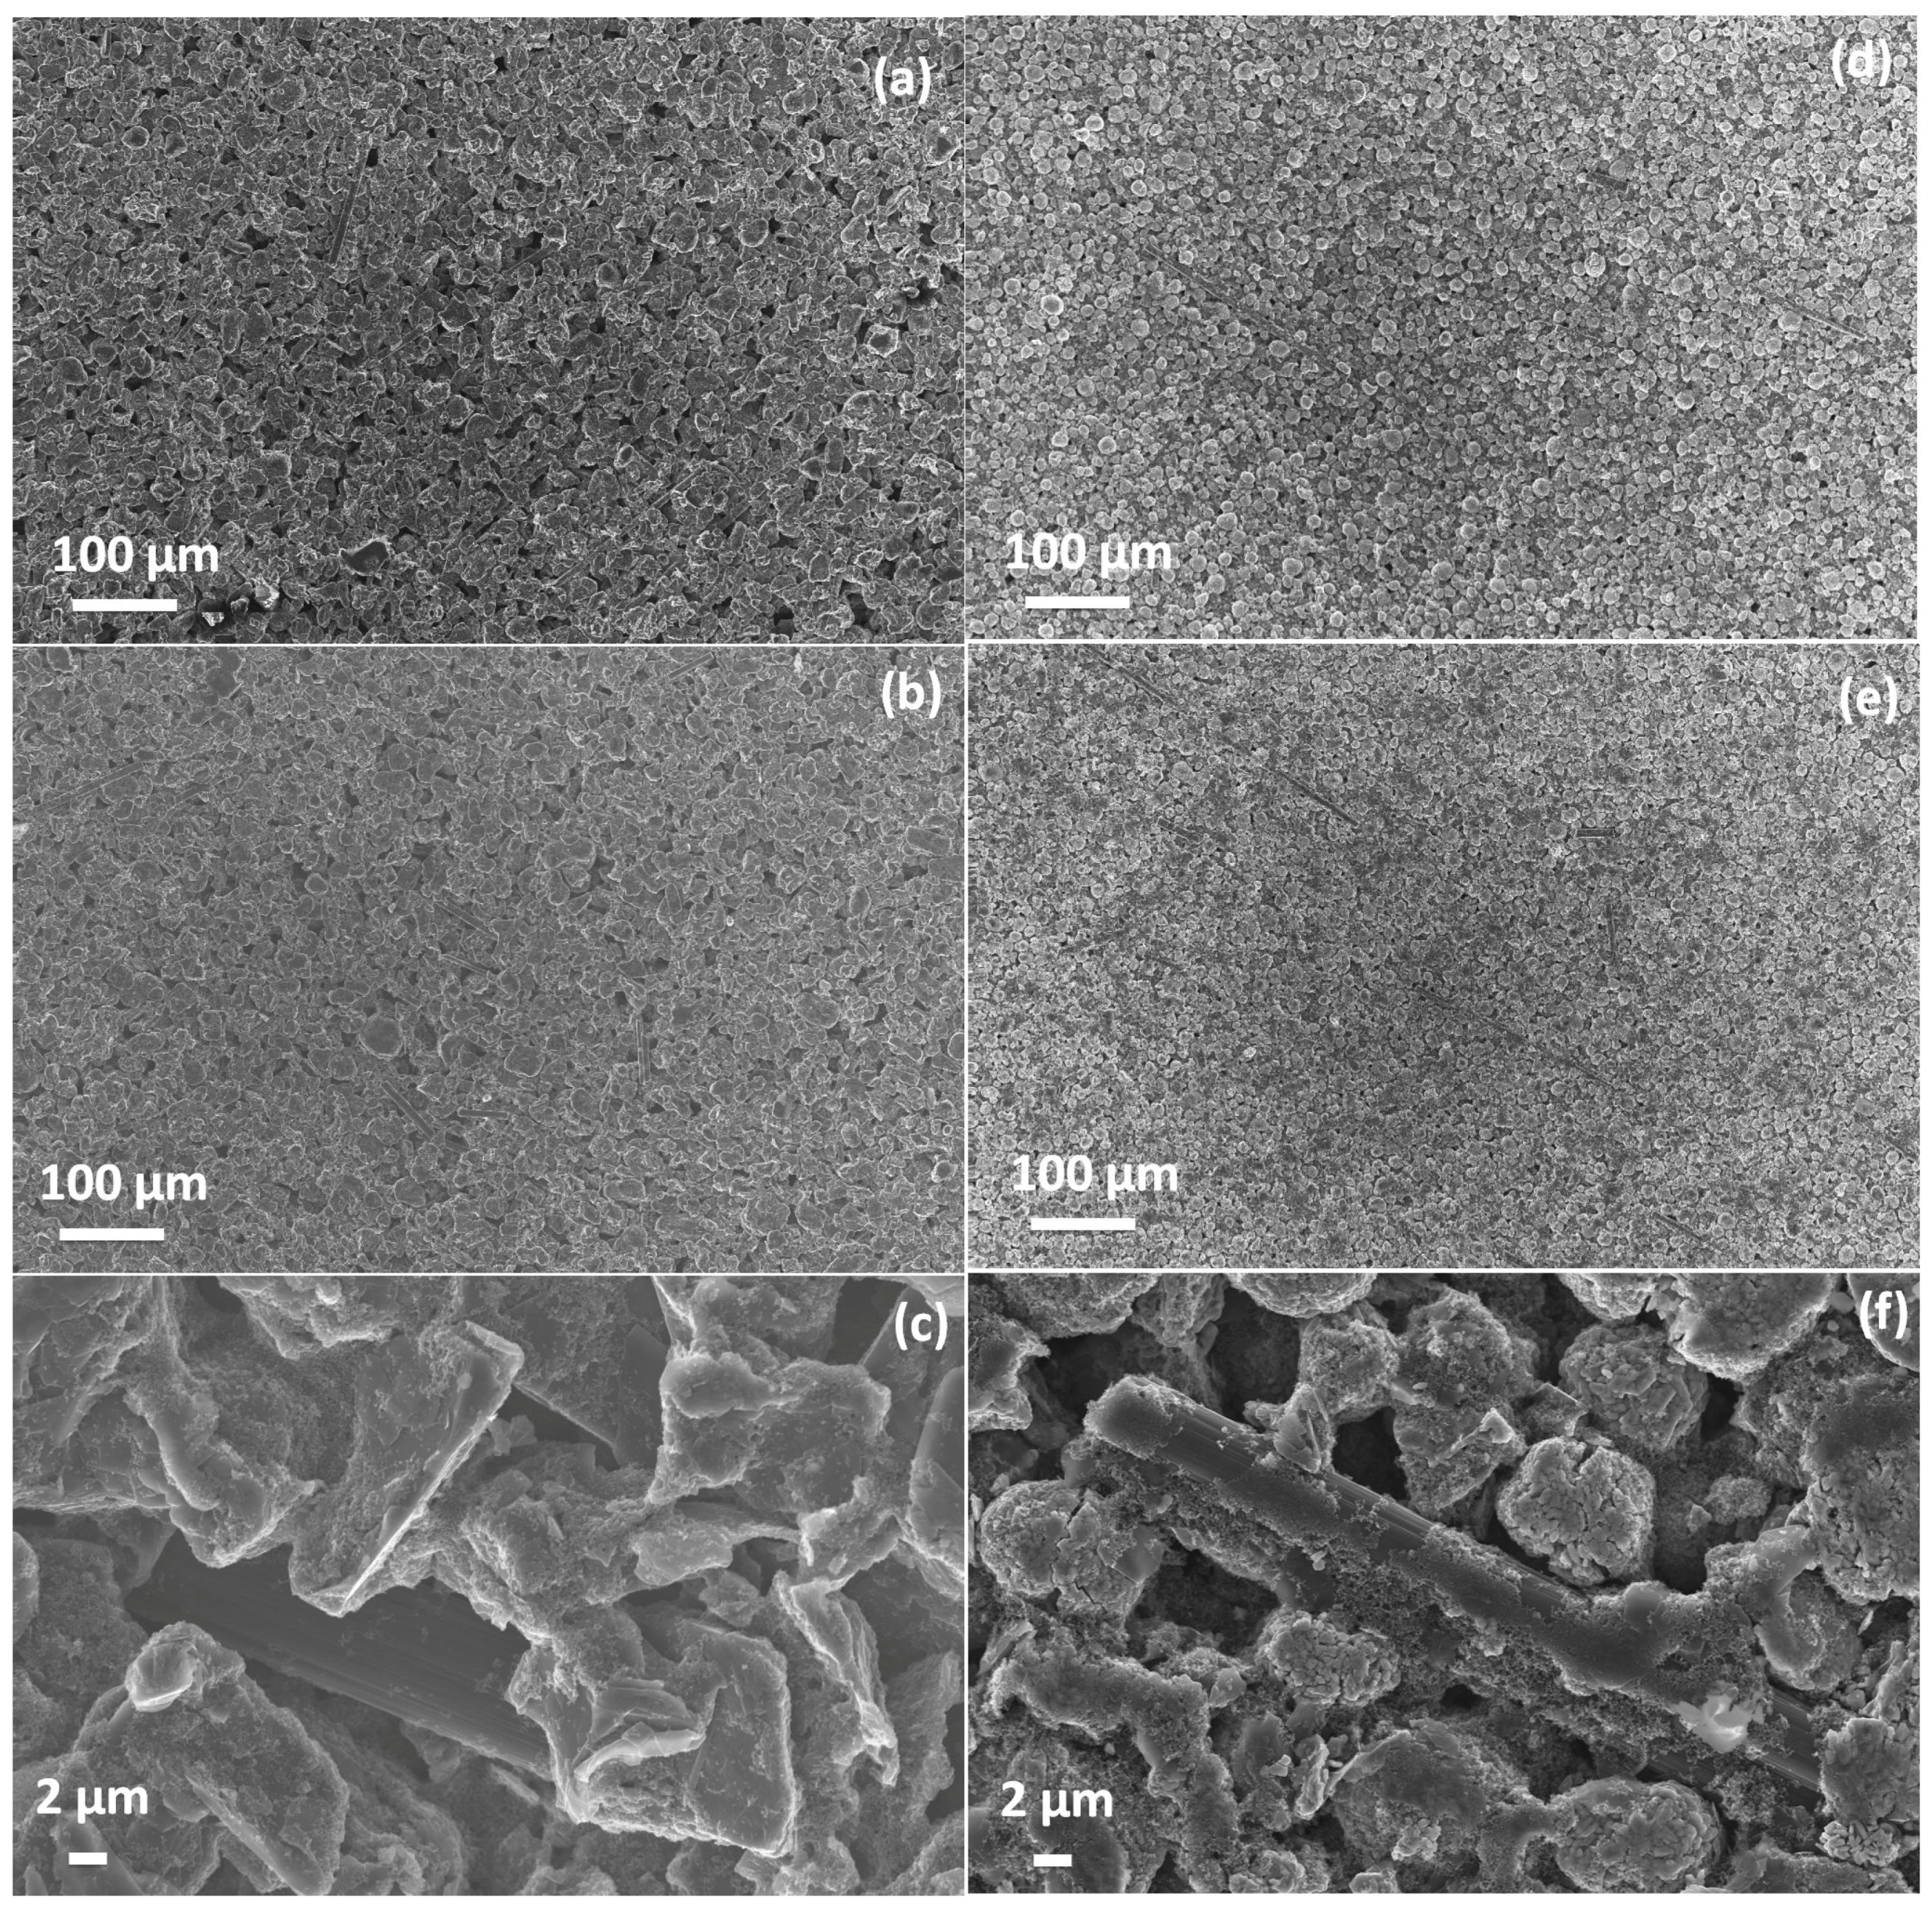
Figure 1 shows the morphological images (as-coated, calendered and high magnification calendered) of the graphite anode and NMC cathode. Electrodes show evenly-distributed active material particles and pores on the electrode surface. The scanning electron microscope (SEM) images show a uniform, crack-free and stable coating throughout the electrode surface. It would be worth mentioning here that even with the low binder content, 4 wt% in anode and 3 wt% in cathode electrodes and an additional 1 wt% of carbon fibers each, no delamination and loose particles were found in the cutting process during the cell assembly.
High magnification SEM images of both electrodes show that carbon fibers, which make up 2.2 vol% of the solid material in the cathode and 1.2 vol% in the anode, are scattered, not agglomerated and well embedded in the layers. In this way, they provide paths for better long-range conductivity in comparison to conductivity among the particle to particle contact (
Figure 1c,f). In addition, the porosity in the direct vicinity of a carbon fiber is increased, and the dense sphere packing of the active material particles softened up. This way, carbon fibers act three-fold as improvers of the mechanical stability of a electrode layer, the long-range electric conductivity and the long-range conductivity of ions in the liquid filled pores. Admittedly, the latter two should be the most effective in the direction of current flow, which is perpendicular to the plain of the electrodes. However, such a forced orientation of the fibers could not be achieved with the standard slurry coating and drying method used here during electrode preparation.
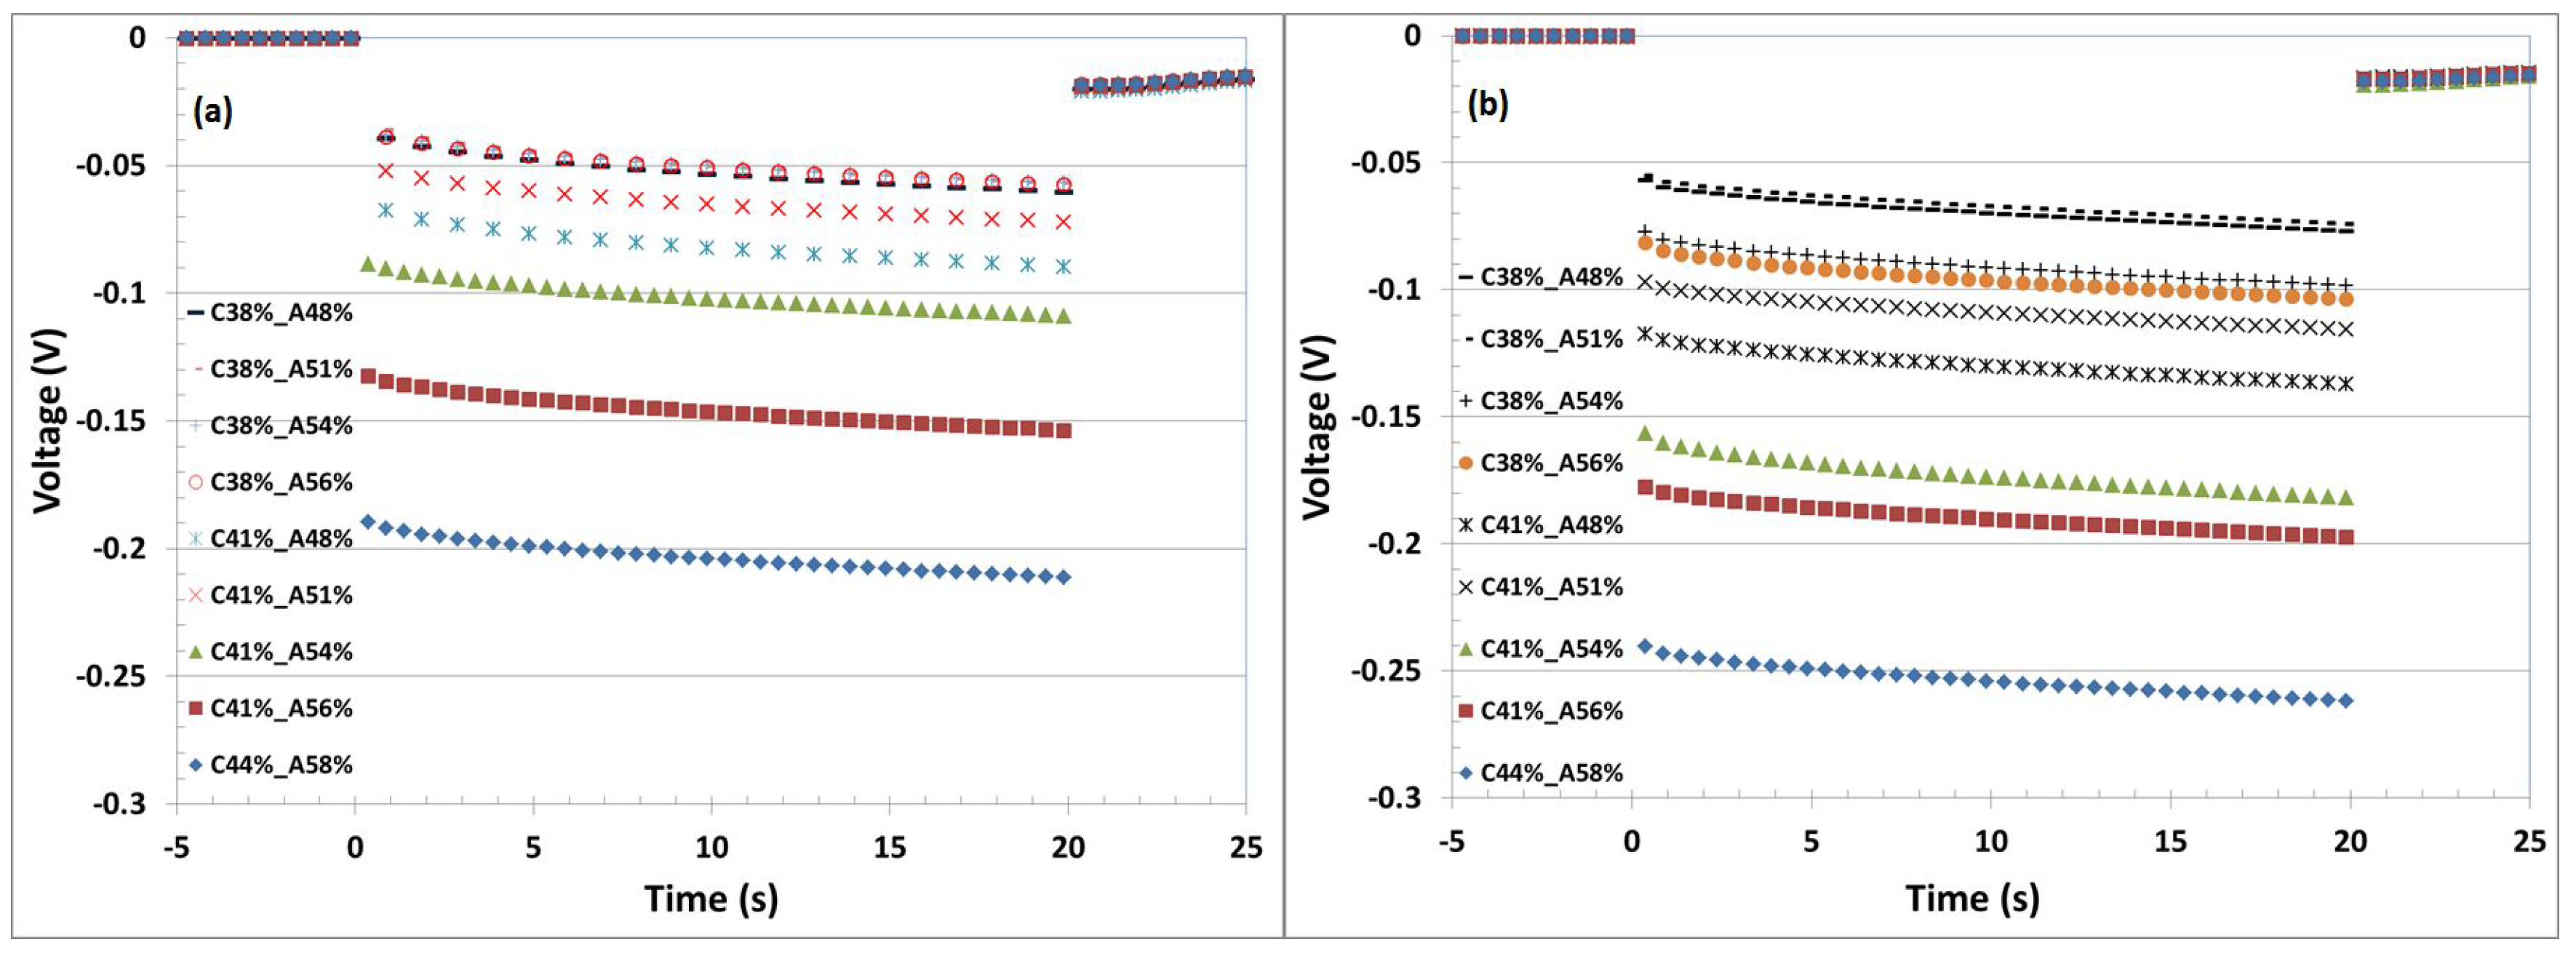
To achieve the optimum utilization and electrochemical performance of the active material in the thick electrodes, the appropriate porosity should be selected. To understand the effect of the porosity, the full cells were stopped at 3.7 V and paused for 30 min, before a discharge current pulse at C/2 rate for 20 s was applied.
Figure 2 shows the corresponding voltage profiles, which were recorded directly after formation (
Figure 2a) and after 90 cycles (
Figure 2b). The full cell Cell A (C44%-A58%) with as-coated electrodes showed the largest voltage drop (205 mV, after formation cycles) in comparison to the other cells. This indicates that the cell would reach the cut-off voltages faster, and therefore, the whole active material cannot be utilized. It was observed that the voltage drop is decreased as the porosity decreases [
6]. The cells with porosity of 38% on the cathode side showed the minimum voltage drop (∼56 mV) after the formation cycles.
A more significant voltage drop could be seen after 90 cycles. The voltage drops get smaller and smaller as the porosities are decreased. The full cells showed voltage drops of 262 mV, 197 mV, 181 mV, 115 mV, 137 mV, 103 mV, 98 mV, 77 mV and 74 mV with the cells Cell A(C44%-A58%), Cell B (C41%-A56%), Cell C (C41%-A54%), Cell D (C41%-A51%), Cell E (C41%-A48%), Cell F (C38%-A56%), Cell G (C38%-A54%), Cell H (C38%-A51%) and Cell I (C38%-A48%), respectively. The cells with the minimum maintained porosities, 38% on the cathode side and 48% and 51% on the anode side, showed the lowest potential drop.
All voltage transients in
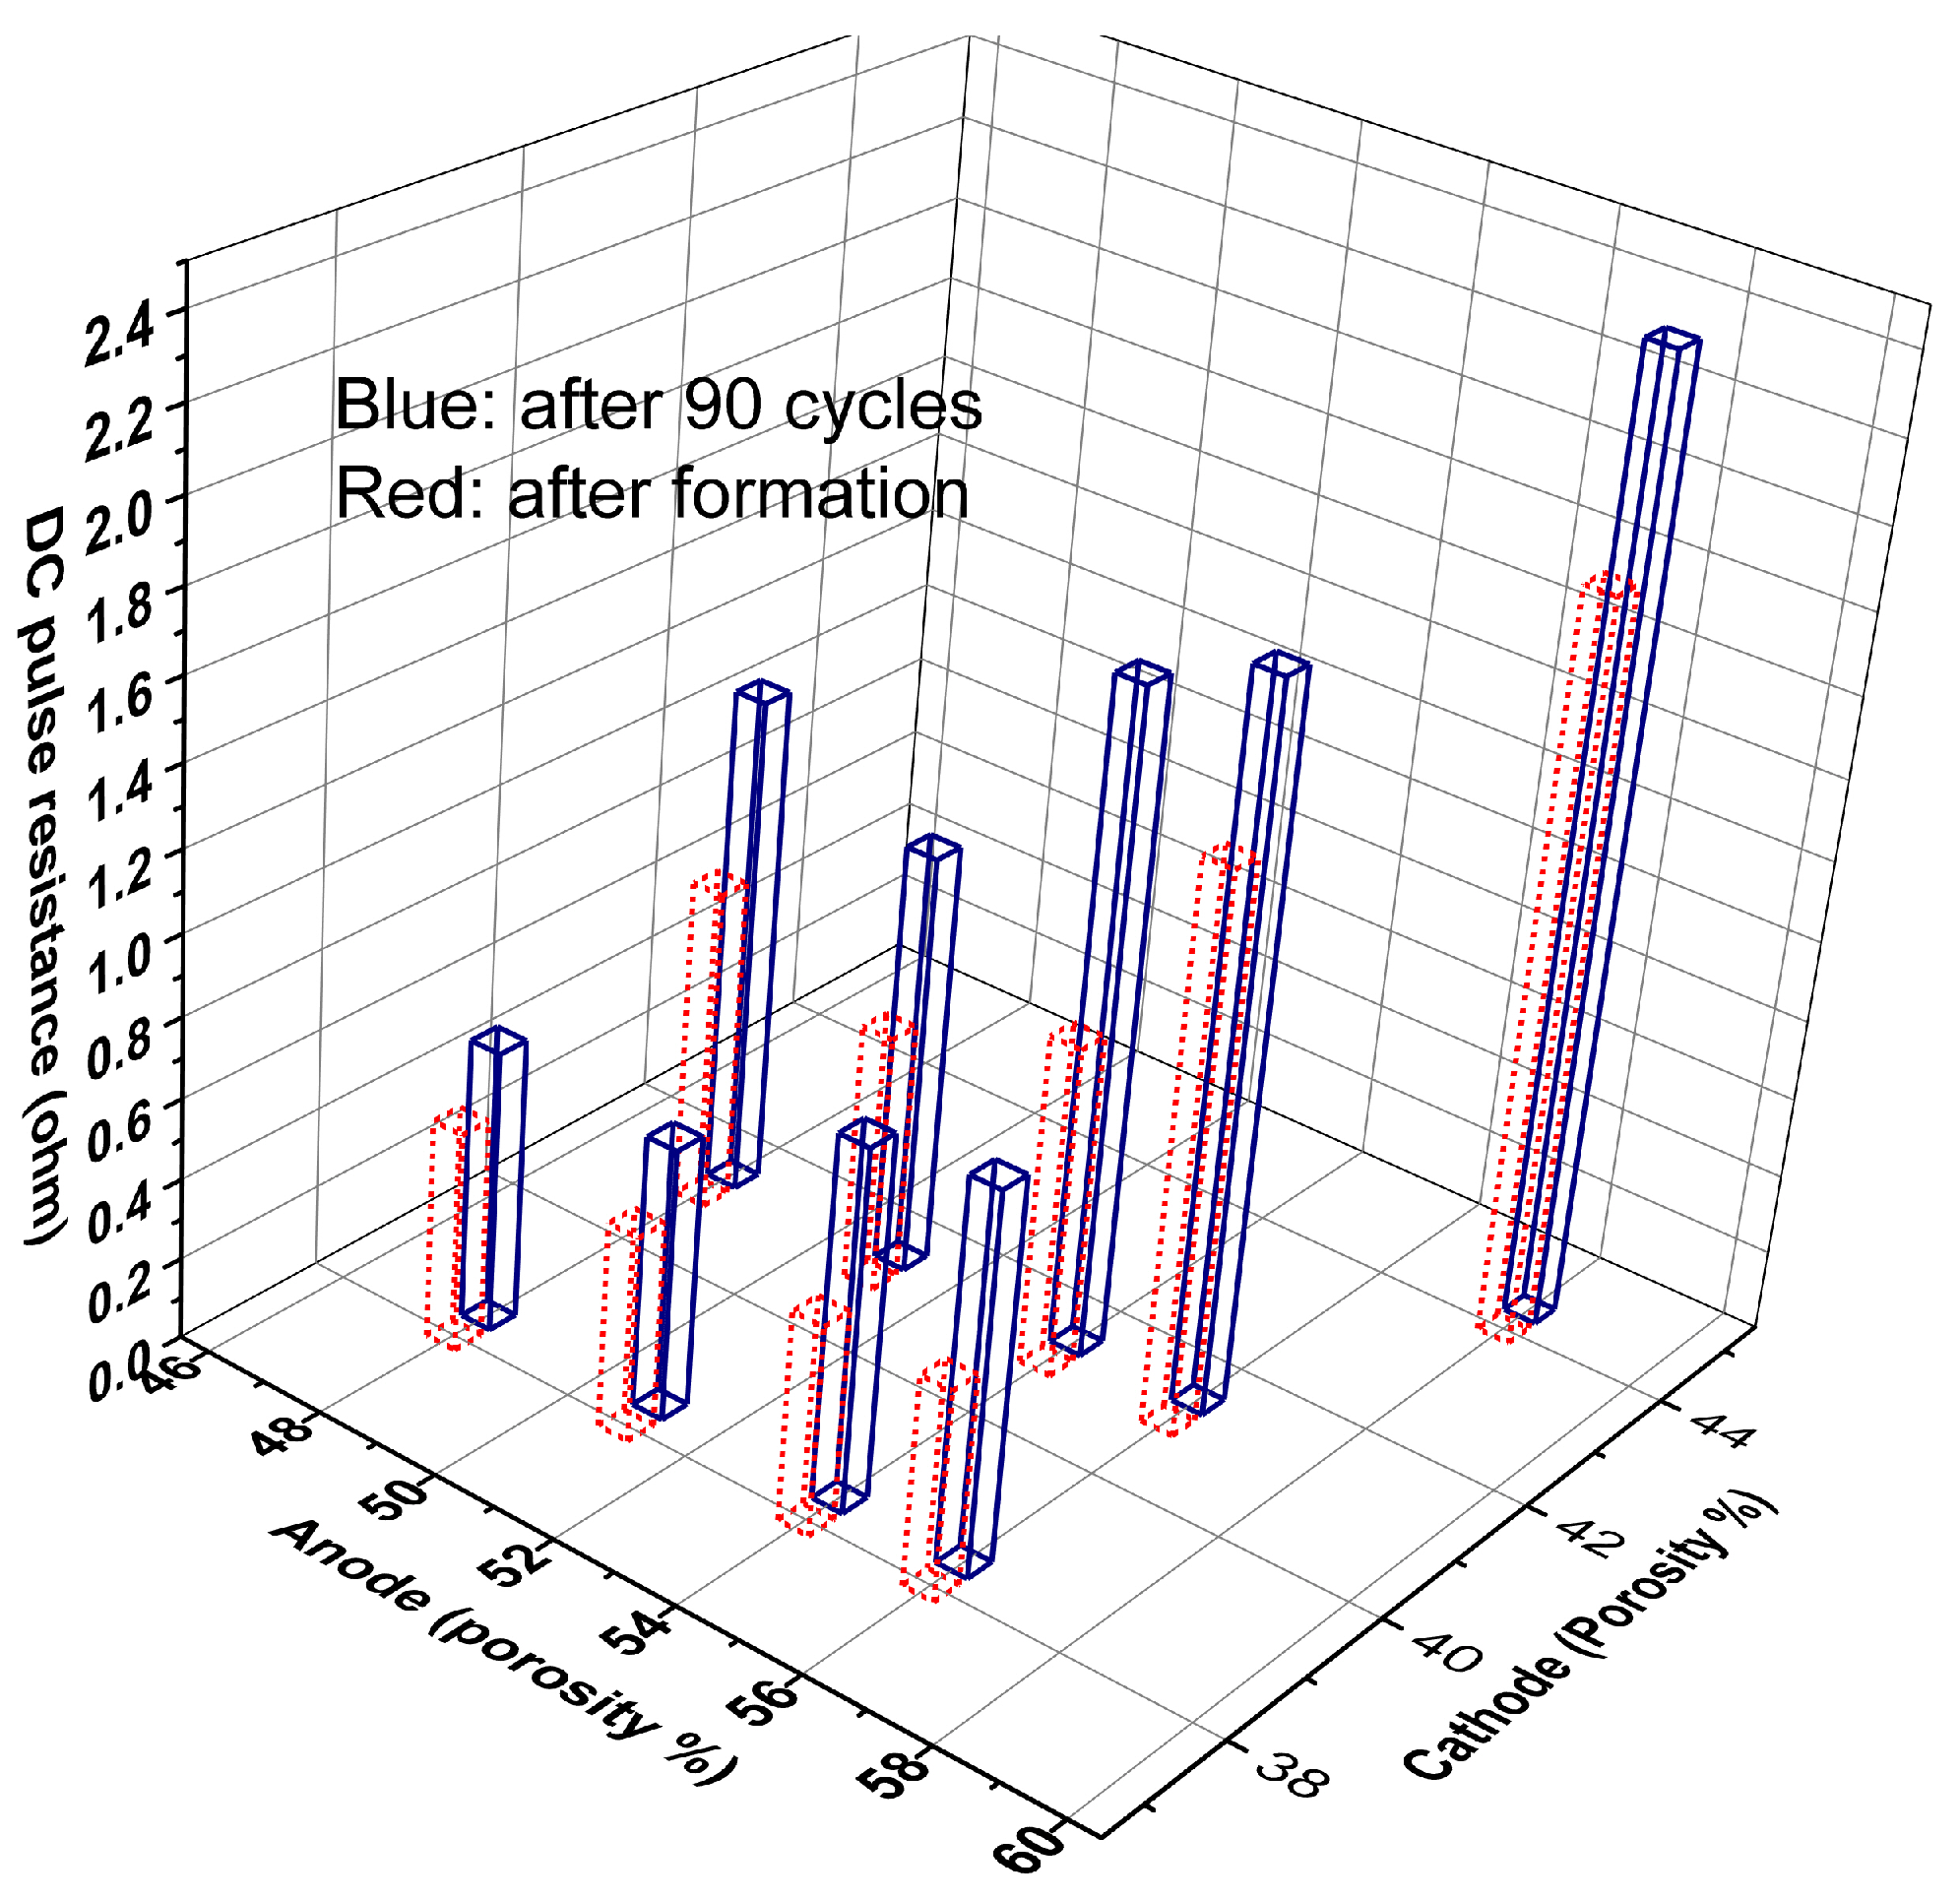
Figure 2 are of similar shape and aligned in parallel. They differ only by the initial voltage offset at the beginning of the discharge pulse. This means that the cells vary primarily by internal ohmic resistances, whereas the mass transport of lithium ions in the liquid phase influenced by the pore structure does not have an effect (at C/2 and 20-s pulse duration). Given the dependency on calendering force, we believe that these cells are limited by the particle to particle contact resistance for electron transport. The column plot of
Figure 3 gives a clearer view of the relation of anode and cathode porosities on the DC pulse resistance. Right after the formation and at the beginning of life, Cells F, G, H and I have the same DC resistances, which are governed by cathode porosity, but not anode porosity. After 90 cycles, Cells H and I show the smallest increase of DC resistance by 29%, whereas the resistances of the other calendered cells increased by 29%–82%.
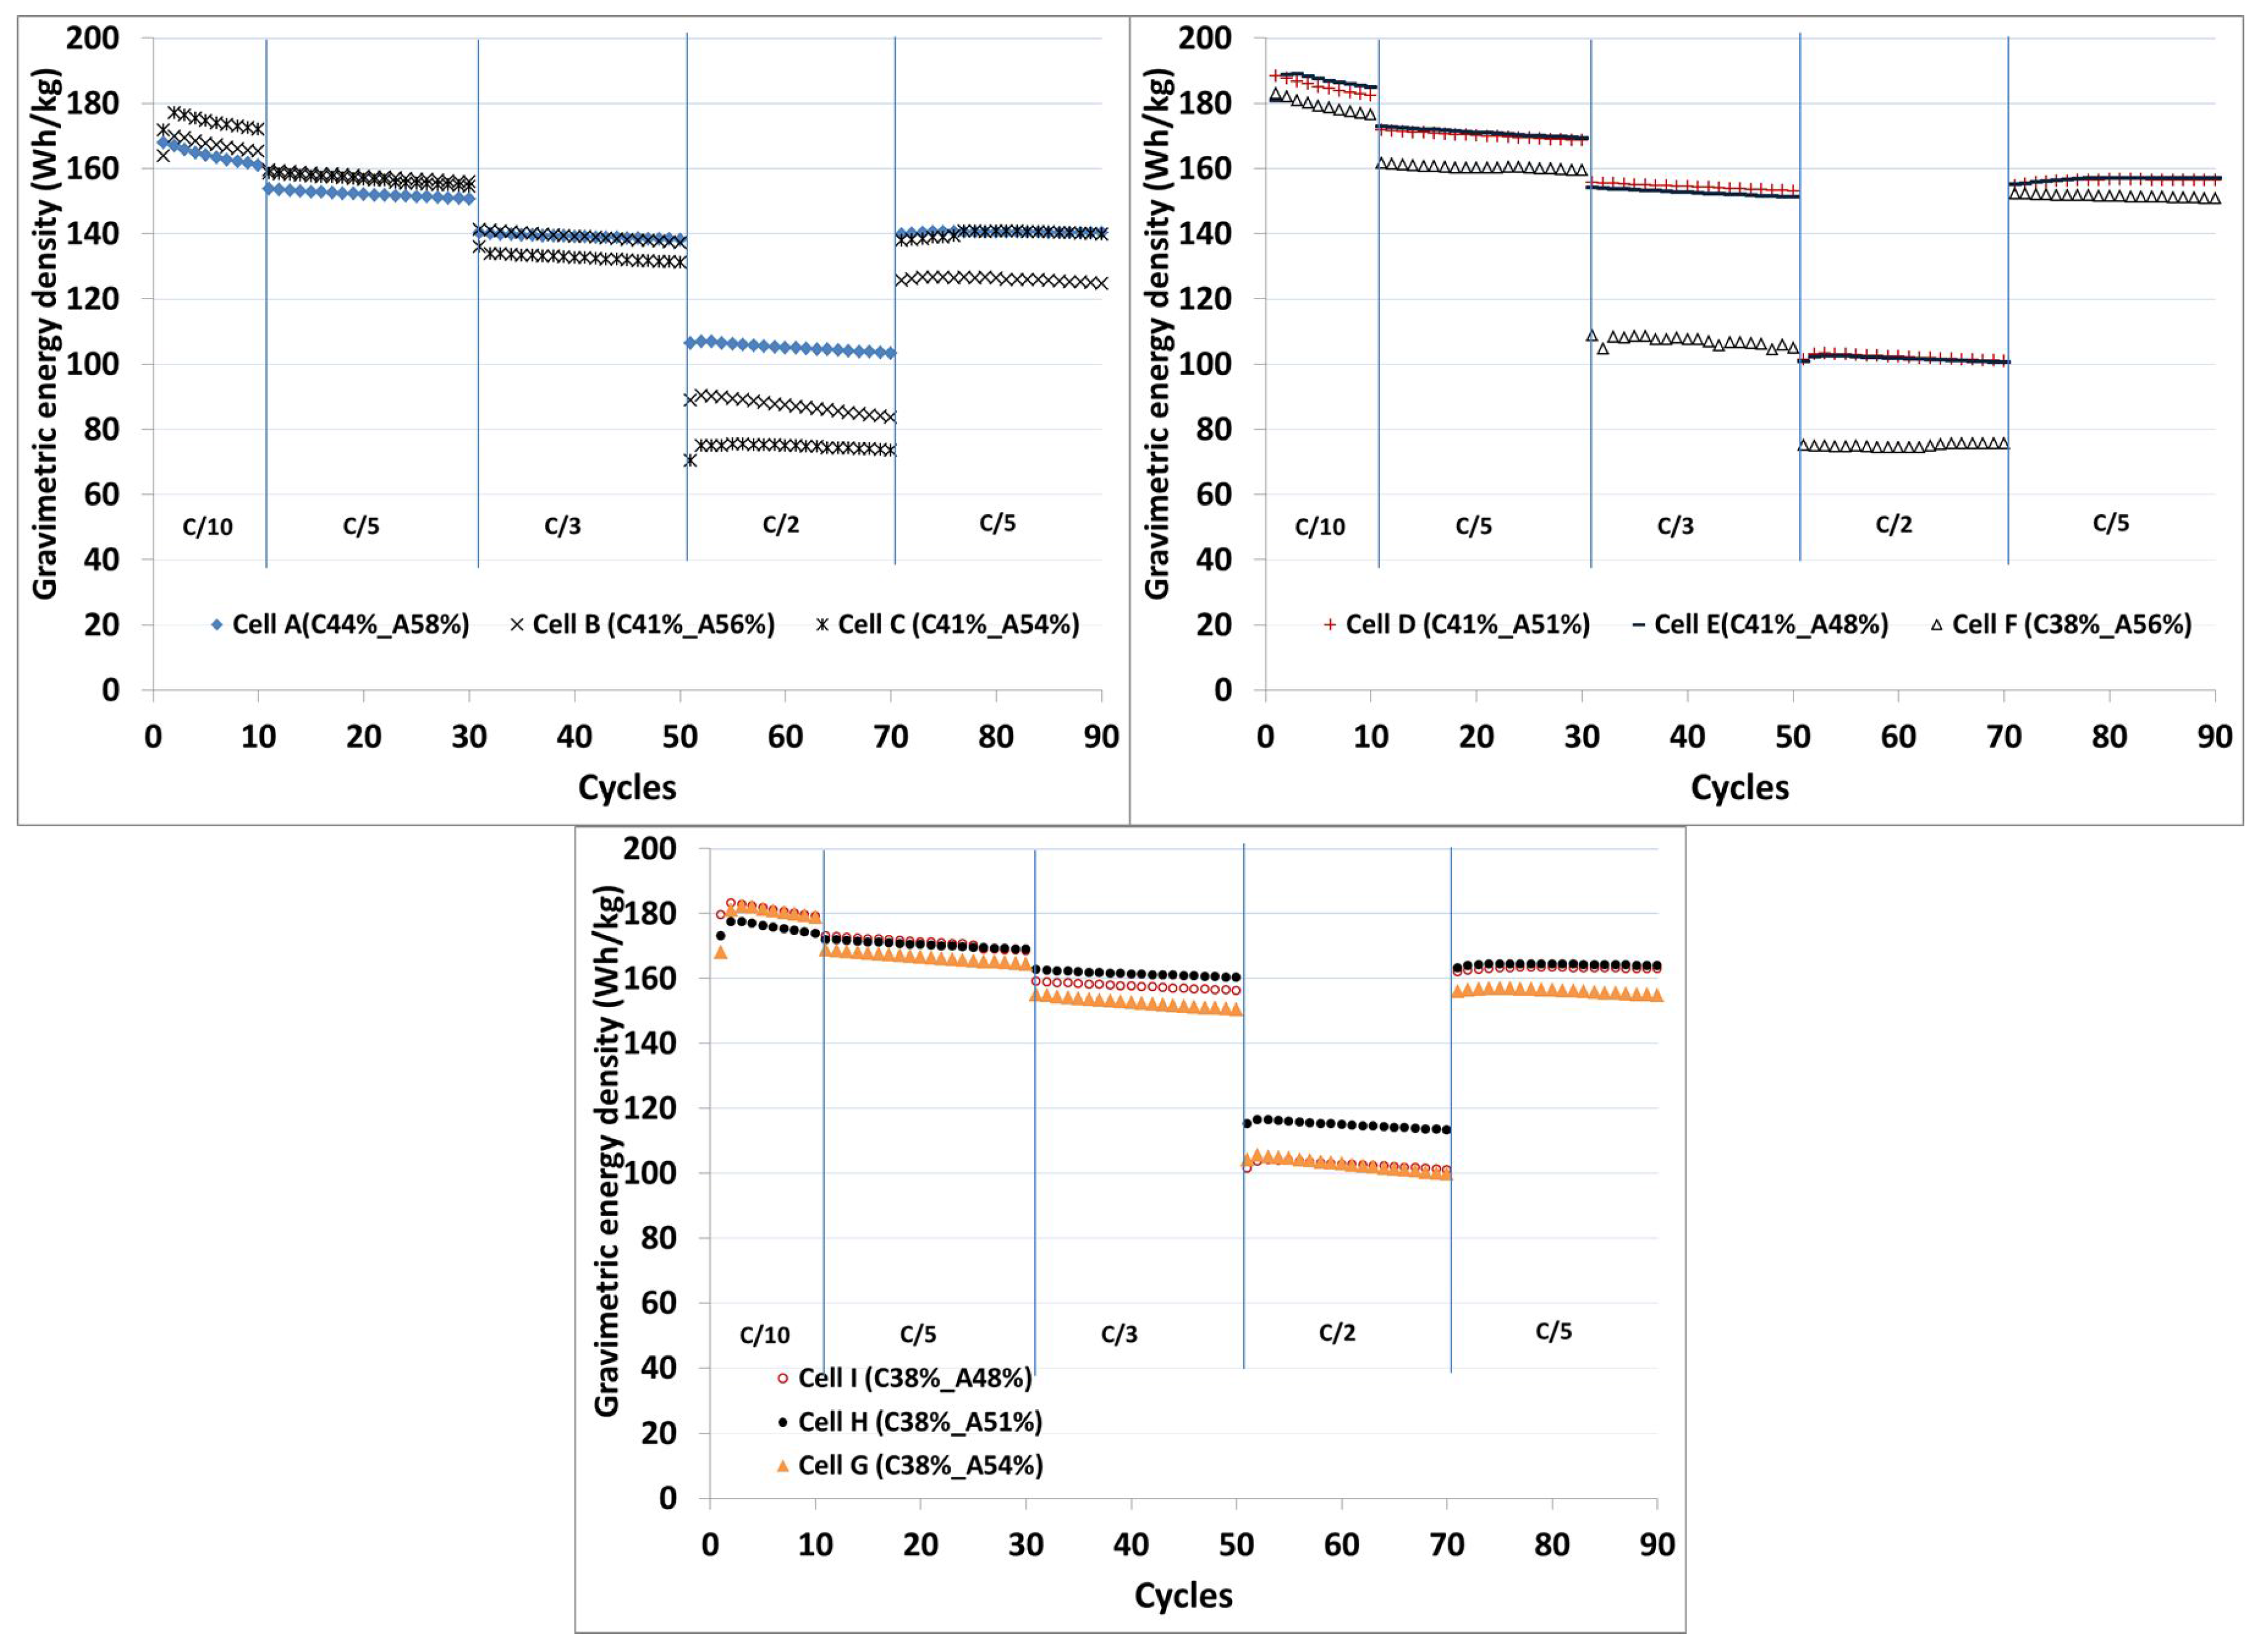
The gravimetric energy density values in Wh/kg obtained from the full cells containing thick electrodes with different porosities at different C-rates are compared in
Figure 4. The weight of the single-sided electrodes with the substrate foils, the weight of the separator and electrolyte are used to calculate the energy density. The pouch foil and current tabs are not included in the calculation.
An initial energy density of 167 Wh/kg was observed for the full cell with as-coated electrodes in Cell A (C44%-A58%). An increase in the energy density from 167 Wh/kg (100%) to 170 Wh/kg (102%), 177 Wh/kg (106%), 188 Wh/kg (113%), 189 Wh/kg (113%), 182 Wh/kg (109%), 181 Wh/kg (109%), 177 Wh/kg (106%) and 183 Wh/kg (109%) is obtained at C/10 rate when the porosity is decreased from Cell A (C44%-A58%) to Cell B (C41%-A56%), Cell C (C41%-A54%), Cell D (C41%-A51%), Cell E (C41%-A48%), Cell F (C38%-A56%), Cell G (C38%-A54%), Cell H (C38%-A51%) and Cell I (C38%-A48%), respectively. A significant improvement in the energy density could be observed when the cathodes have 41% porosity, but the energy density is reduced as the porosity is decreased to 38% at the C/10 rate.
The energy density values provide the information about the optimal porosity when the cells are cycled at different C-rates. Cells H and I show the highest energy density in comparison to other cells at the C-rates higher than C/10. Cell H showed significantly less energy density losses of 3%, 8% and 34% upon cycling at C/5, C/3 and C/2, respectively. At C-rates higher than C/5, Cell I (C38%-A48%) showed slightly lower energy density in comparison to Cell H (C38%-A51%) which is due to kinetic limitations. Kinetic limitations are negligible at the C/10 rate. As the C-rate increases, the kinetic limitations also increase. The cell with 48% porosity on the anode side contains slightly less electrolyte than the cell with 51% porosity on the anode side. The porosity of the electrodes in the Cell I (C38%-A48%) could be further reduced at the separator electrode interface during cycling, because the intercalation-deintercalation reaction rate is maximum at the electrode separator interface.
Other cells with higher porosity are quite unstable at higher C-rates. After applying cycles at C/2, Cell H (C38%-A51%) and Cell I (C38%-A48%) are restored back to their initial energy density values after 70 cycles.
From the results, it is clear that the porosity >51% on the anode side and that >40% on the cathode side do not enhance the electrochemical performance, which might be due to the decrease in mechanical properties during the cycling. It could be mentioned here that the variation in the energy density values could be due to the different electrode structures, mechanical strength and particle to particle contact throughout the electrode surface [
7]. Besides, the electrode-electrolyte interface area is varied by varying the porosity of the electrodes, and accordingly, the transport resistance is also varied [
8]. The variation in the resistance with respect to the change in porosity could be seen during fast discharge test measurements.
In order to study the effect of porosity on the cell impedance, the electrochemical impedance spectroscopy (EIS) measurements are done at 50% state of charge (SOC) at 23
C, 40
C and 10
C.
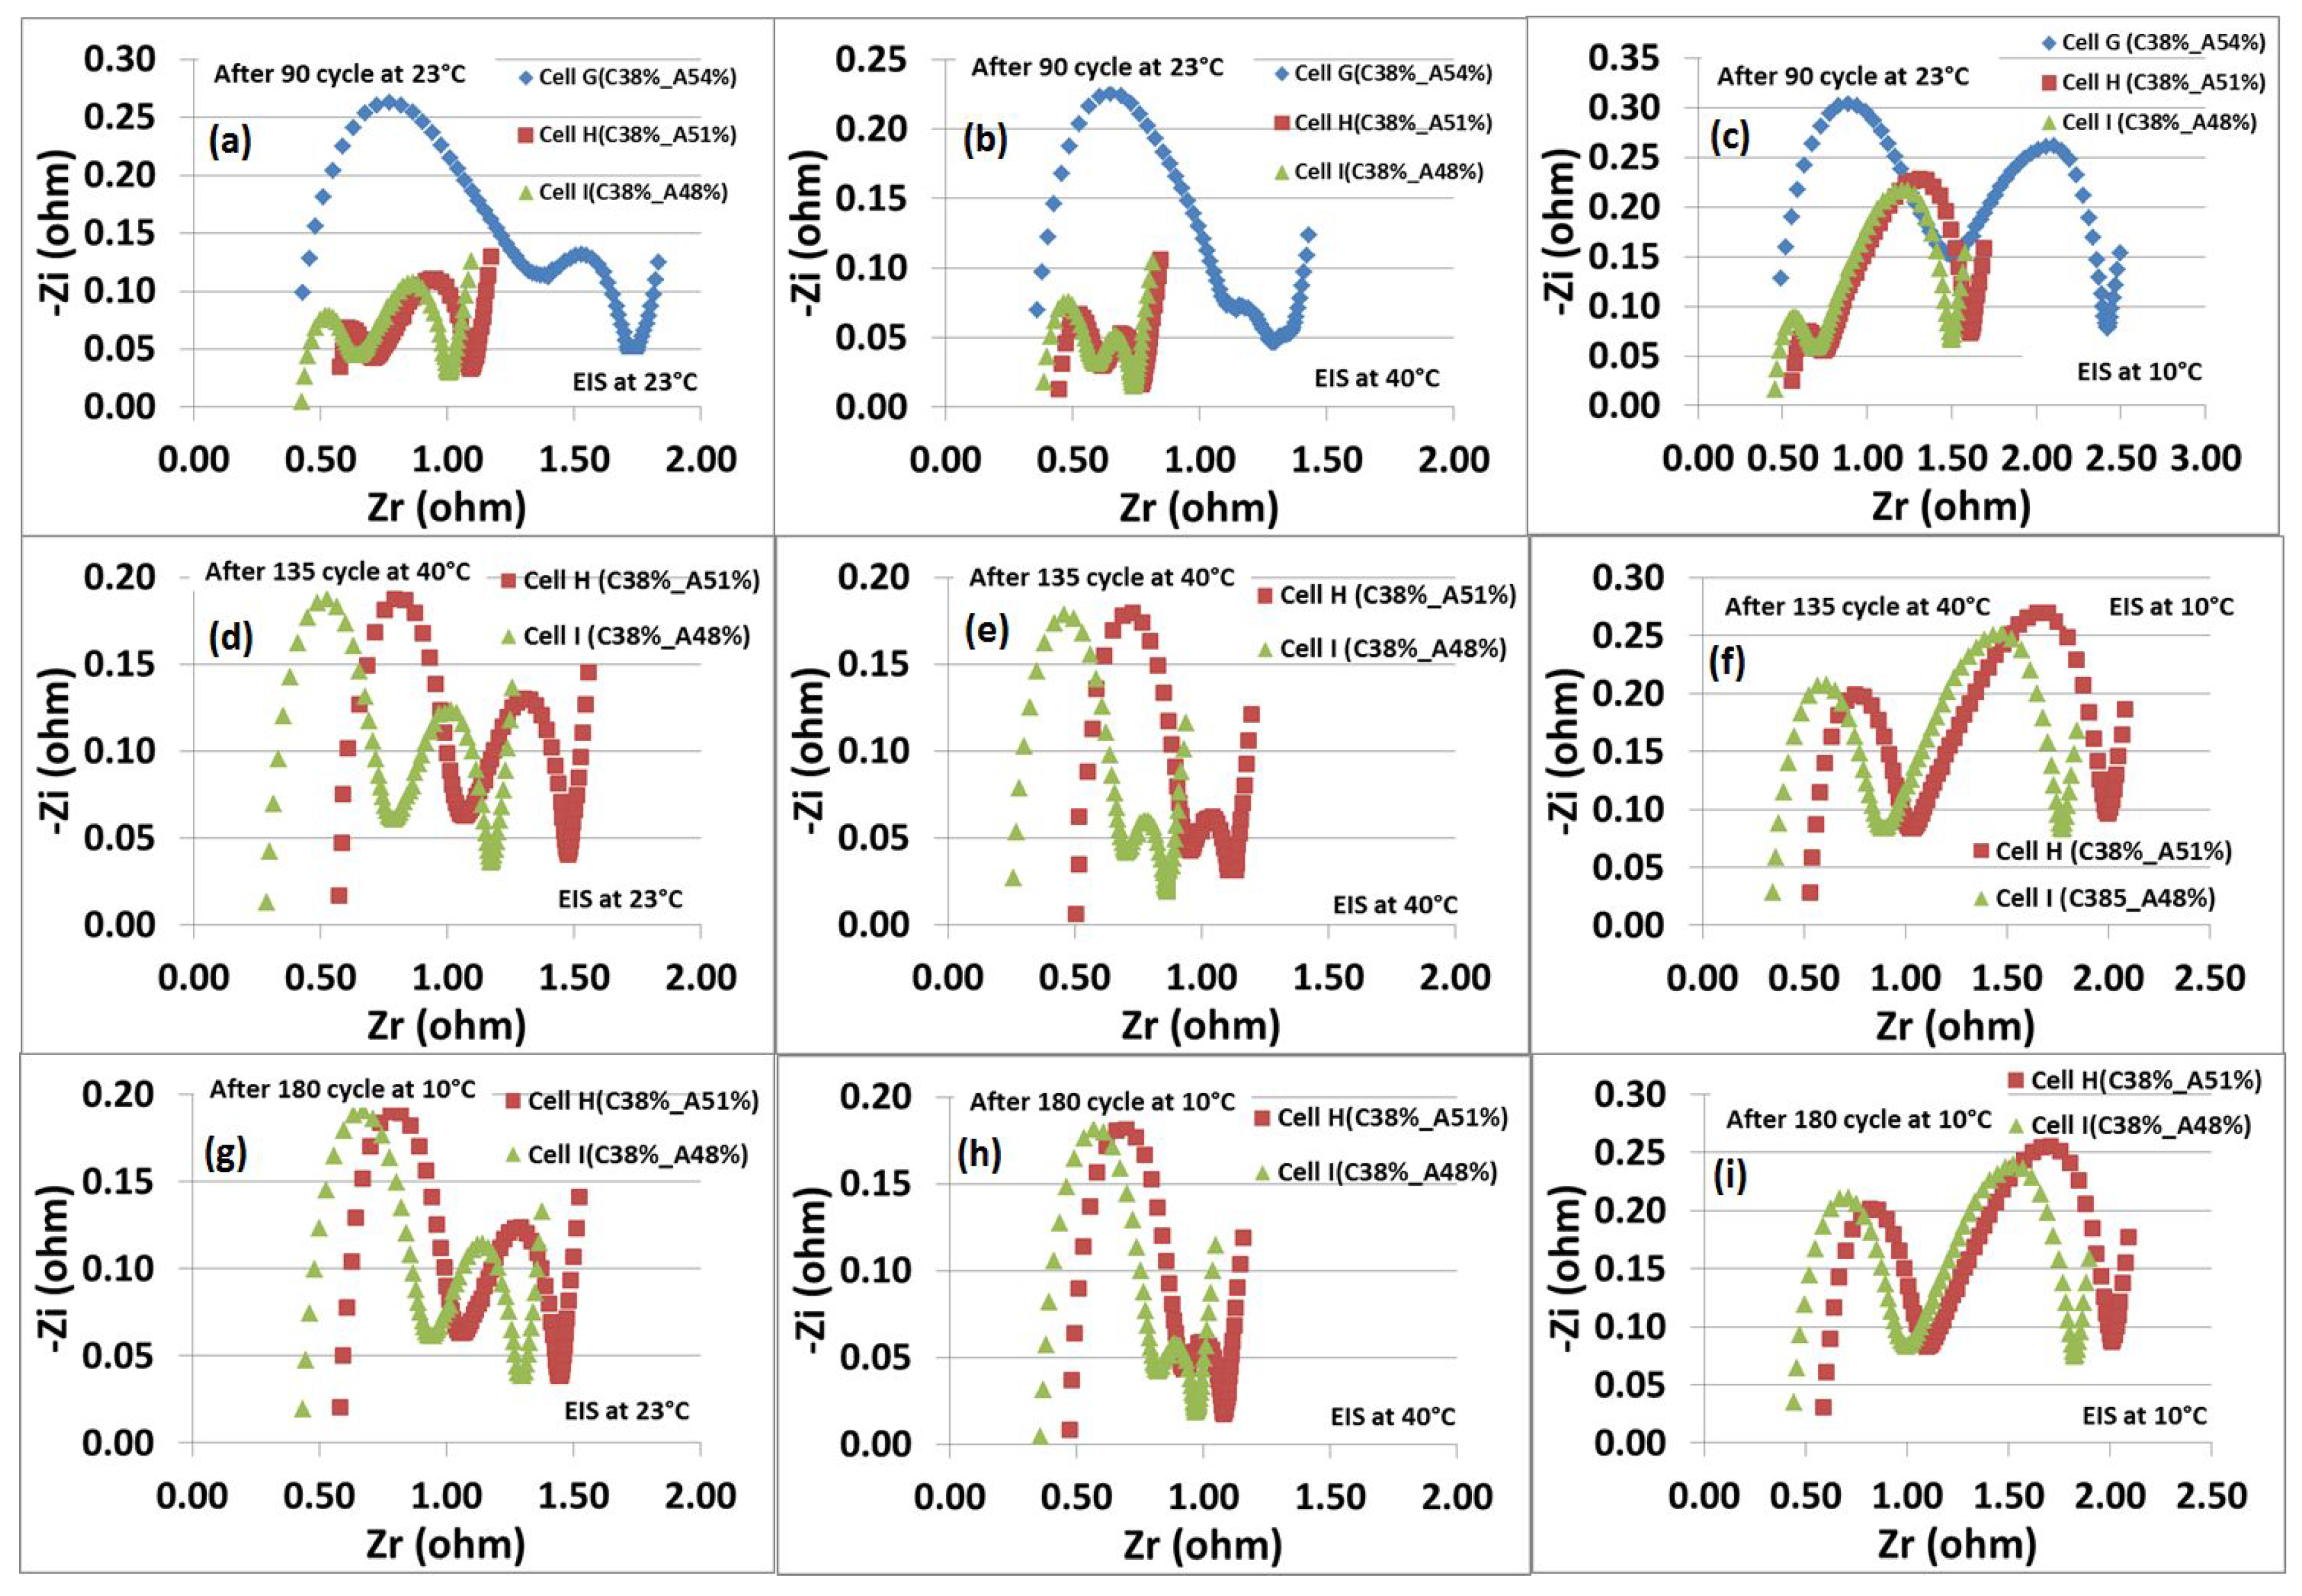
Figure 5 displays the Nyquist plots of the EIS obtained from Li-ion cells, containing NMC cathodes with 38% porosity and graphite anodes with 48%, 51% and 54% porosities, after cycling at temperatures of 23
C, 40
C and 10
C. The Nyquist plots consist of two semicircles in the high to medium frequency ranges, as well as a straight line in the low frequency range. The latter reflects the diffusion process represented by the well-known 45
slope Warburg diffusion. The semicircles provide the information about lithium migration through surface films on the electrodes and charge transfer processes within the electrodes. The high frequency intercept at Z
-axis corresponds to the electronic resistance; the first semicircle in the high frequency range corresponds to the surface film or passivating film resistance; and the second semicircle in the medium frequency range represents the charge transfer resistance [
9].
There is no significant difference observed in the electronic resistances (
), but Cell I (C38%-A48%) has slightly lower
, which indicates that a good electric conductive network has formed in the electrode. As can be seen from
Figure 5, the Li-ion full Cell G (C38%-A54%) shows the
, 764 mΩ, and
, 711 mΩ, after 90 cycles cycled at 23
C.
is decreased by over 78% (169 mΩ) and 74% (200 mΩ), and
decreased by over 45% (388 mΩ) and 47% (373 mΩ) with Cell H (C38%-A51%) and Cell I (C38%-A48%), respectively. A reduction in the resistances could be due to an improved surface particle, as well as particle to particle contact among the active material particles upon reducing the porosity [
10,
11].
An increase in the size of high frequency semicircles was seen when the cells Cell H (C38%-A51%) and Cell I (C38%-A48%) were cycled for the next 45 cycles at 40 C, while no significant change was observed when the cells were cycled for the next 45 cycles at 10 C, indicating that a stable solid-electrolyte interphase (SEI) has formed on the graphite particles. The sizes of the medium frequency semicircles are changing gradually upon cycling.
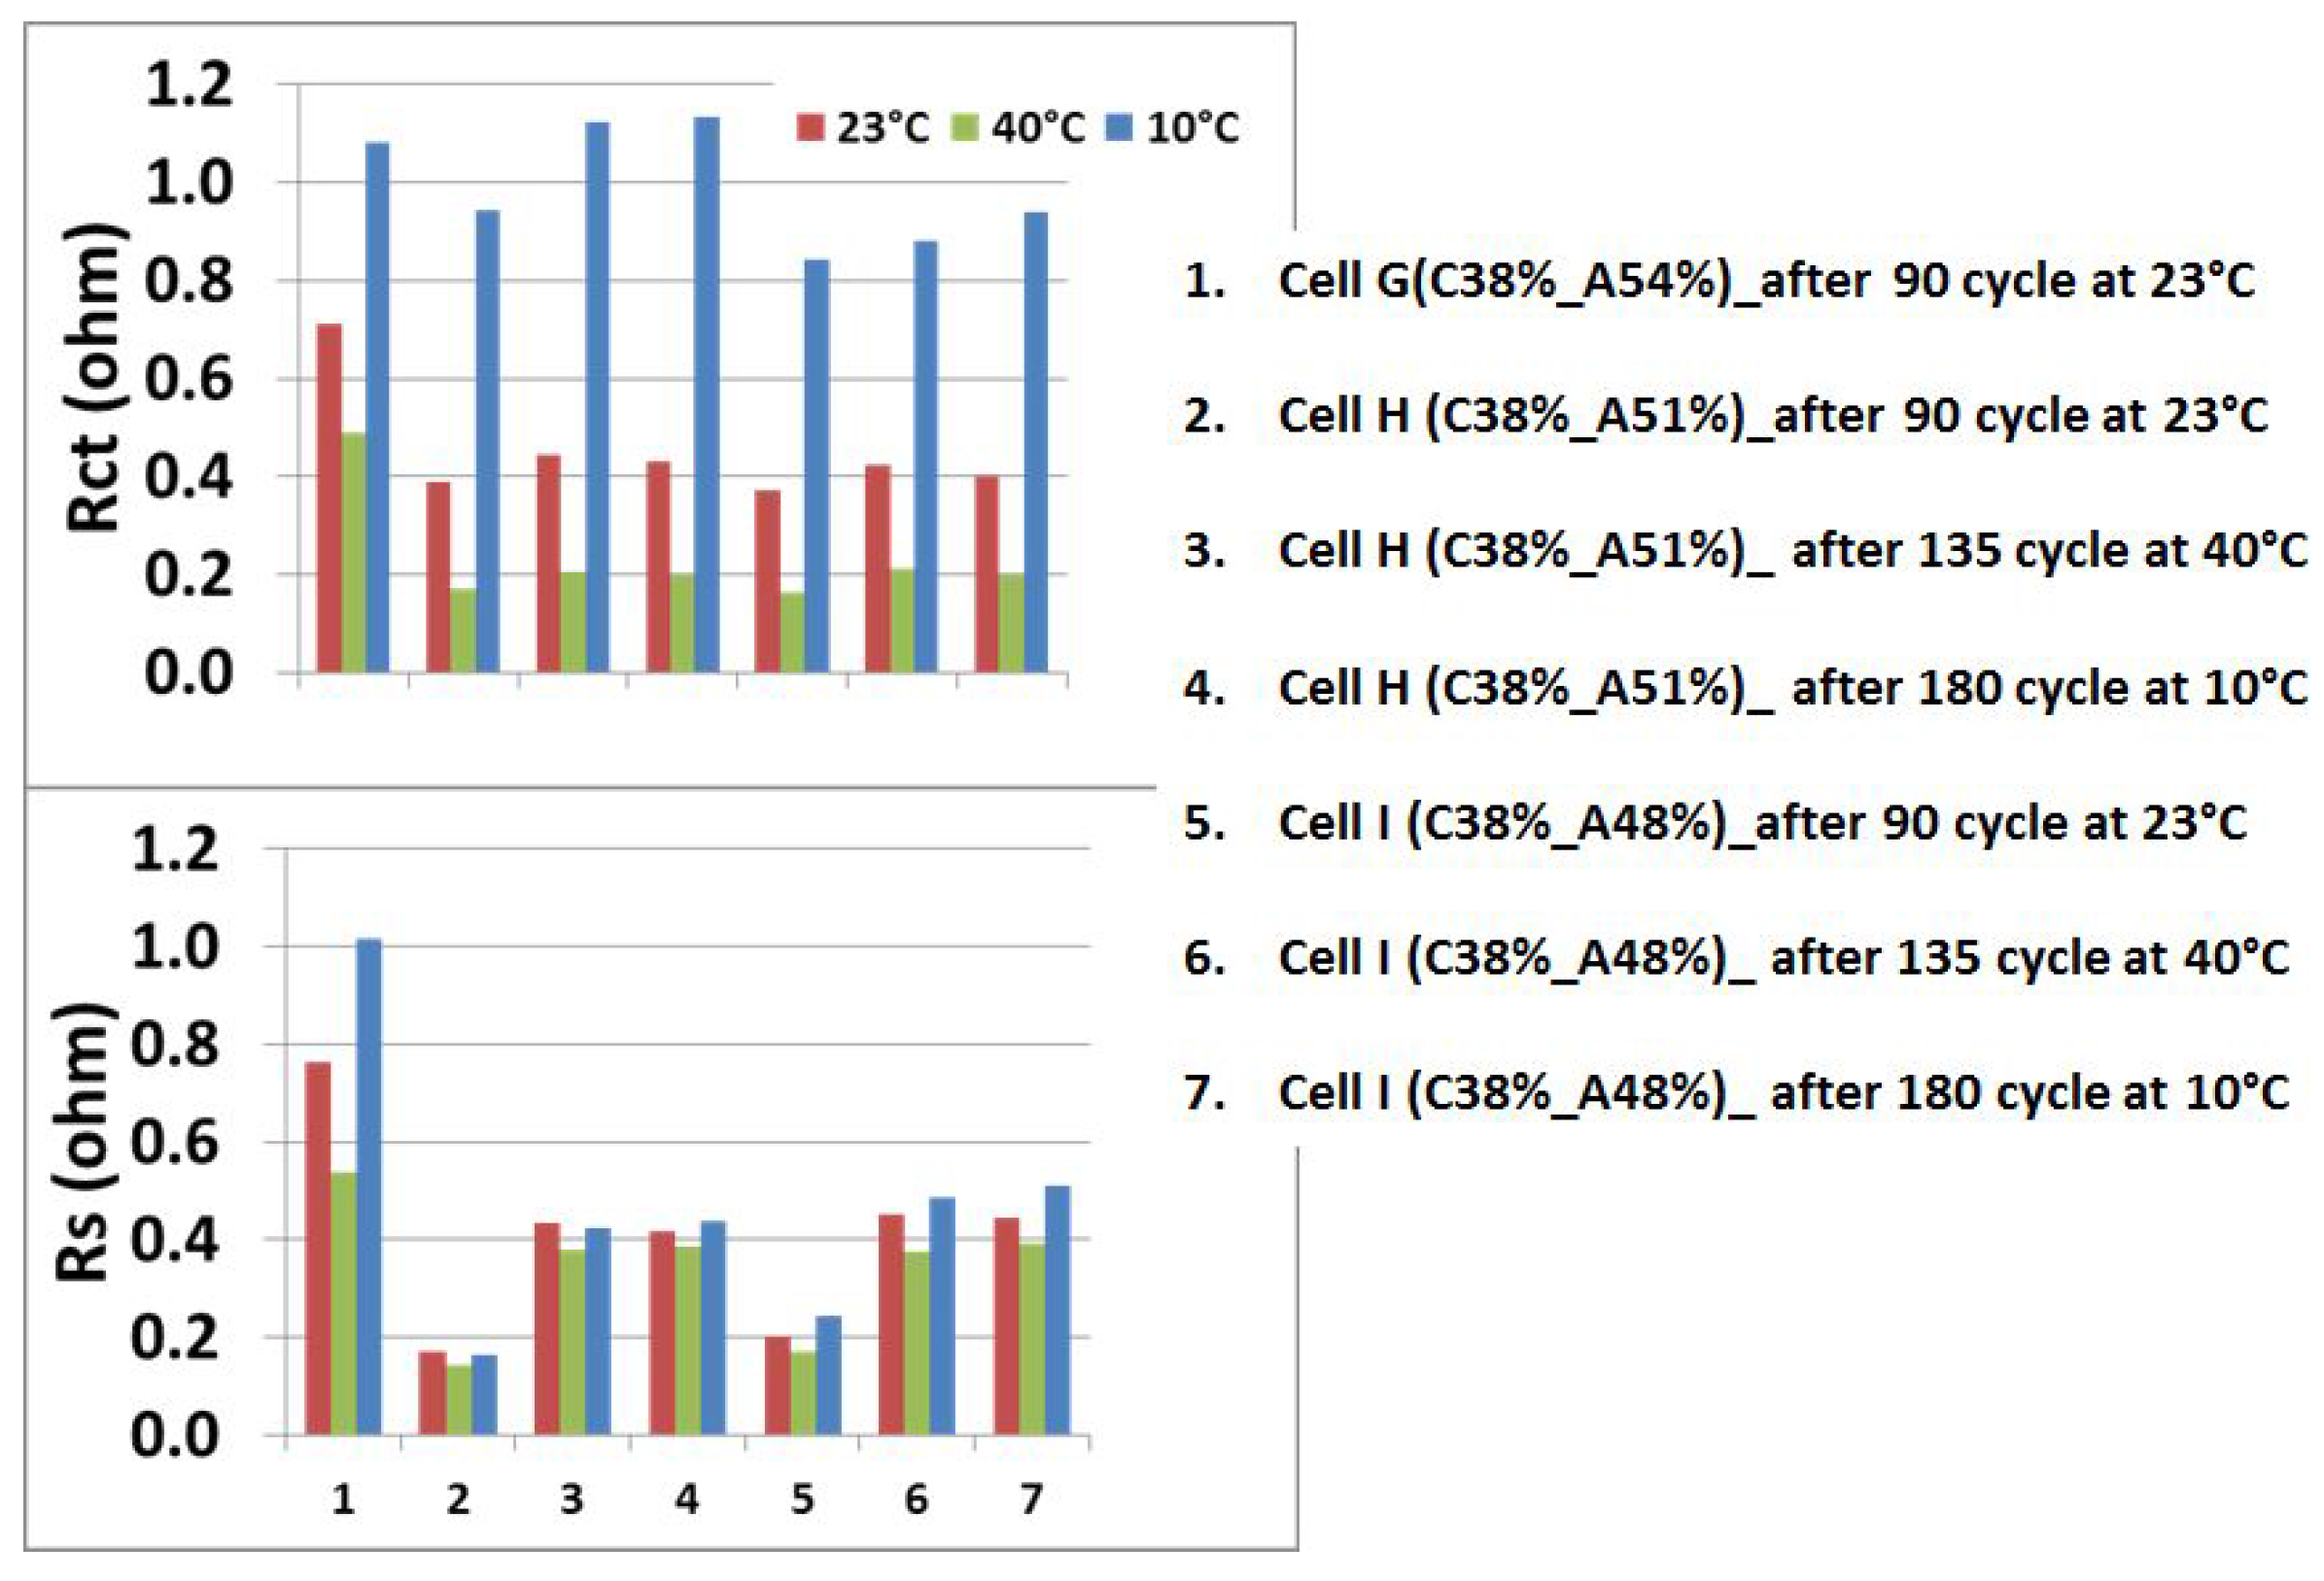
Figure 6 shows a comparison study of the observed resistance values for Li-ion cells consisting of thick electrodes with different porosities. The EIS spectrum and resistance values indicate that the cell impedance has been increased over a number of cycles which could be correlated with the mechanical stability, passivating film and Li-ion movement in the Li-ion cells [
9,
11].
It can be seen that Cell G (C38%-A54%) has a significantly higher surface and charge transfer resistances, which is possibly due to less intimate particle to particle contacts throughout the electrodes. The high frequency semicircle exhibits the impedance (
) due to the formation of the passivating film (SEI) on the graphite surface, and thus, the increase in the size of the semicircle could be caused by the growth of the SEI film, which could become thicker after each cycle. The instability in the passivated layer, which consumes a portion of the intercalated lithium, decreases the overall electrochemical performance [
11]. The volume change during Li intercalation-deintercalation and C-rates can affect further the stability of electrodes with high porosity (>51%) and lead to a loss of contact among particles and electrode-substrate foils.
A gradual increase in the charge transfer resistance was observed while the surface resistance gets almost saturated upon cycling. The
is reduced at 40
C, while it increases considerably at 10
C, which is due to the change in the ionic conductivity of the electrolyte at elevated temperatures. As temperature increases, the
decreases, which is related to the Butler–Volmer kinetic equation for the activation-controlled charge transfer electrochemical reaction [
12]. Among all combinations of porosities, Cell I (C38%-A48%) exhibits the smallest charge transfer resistance.
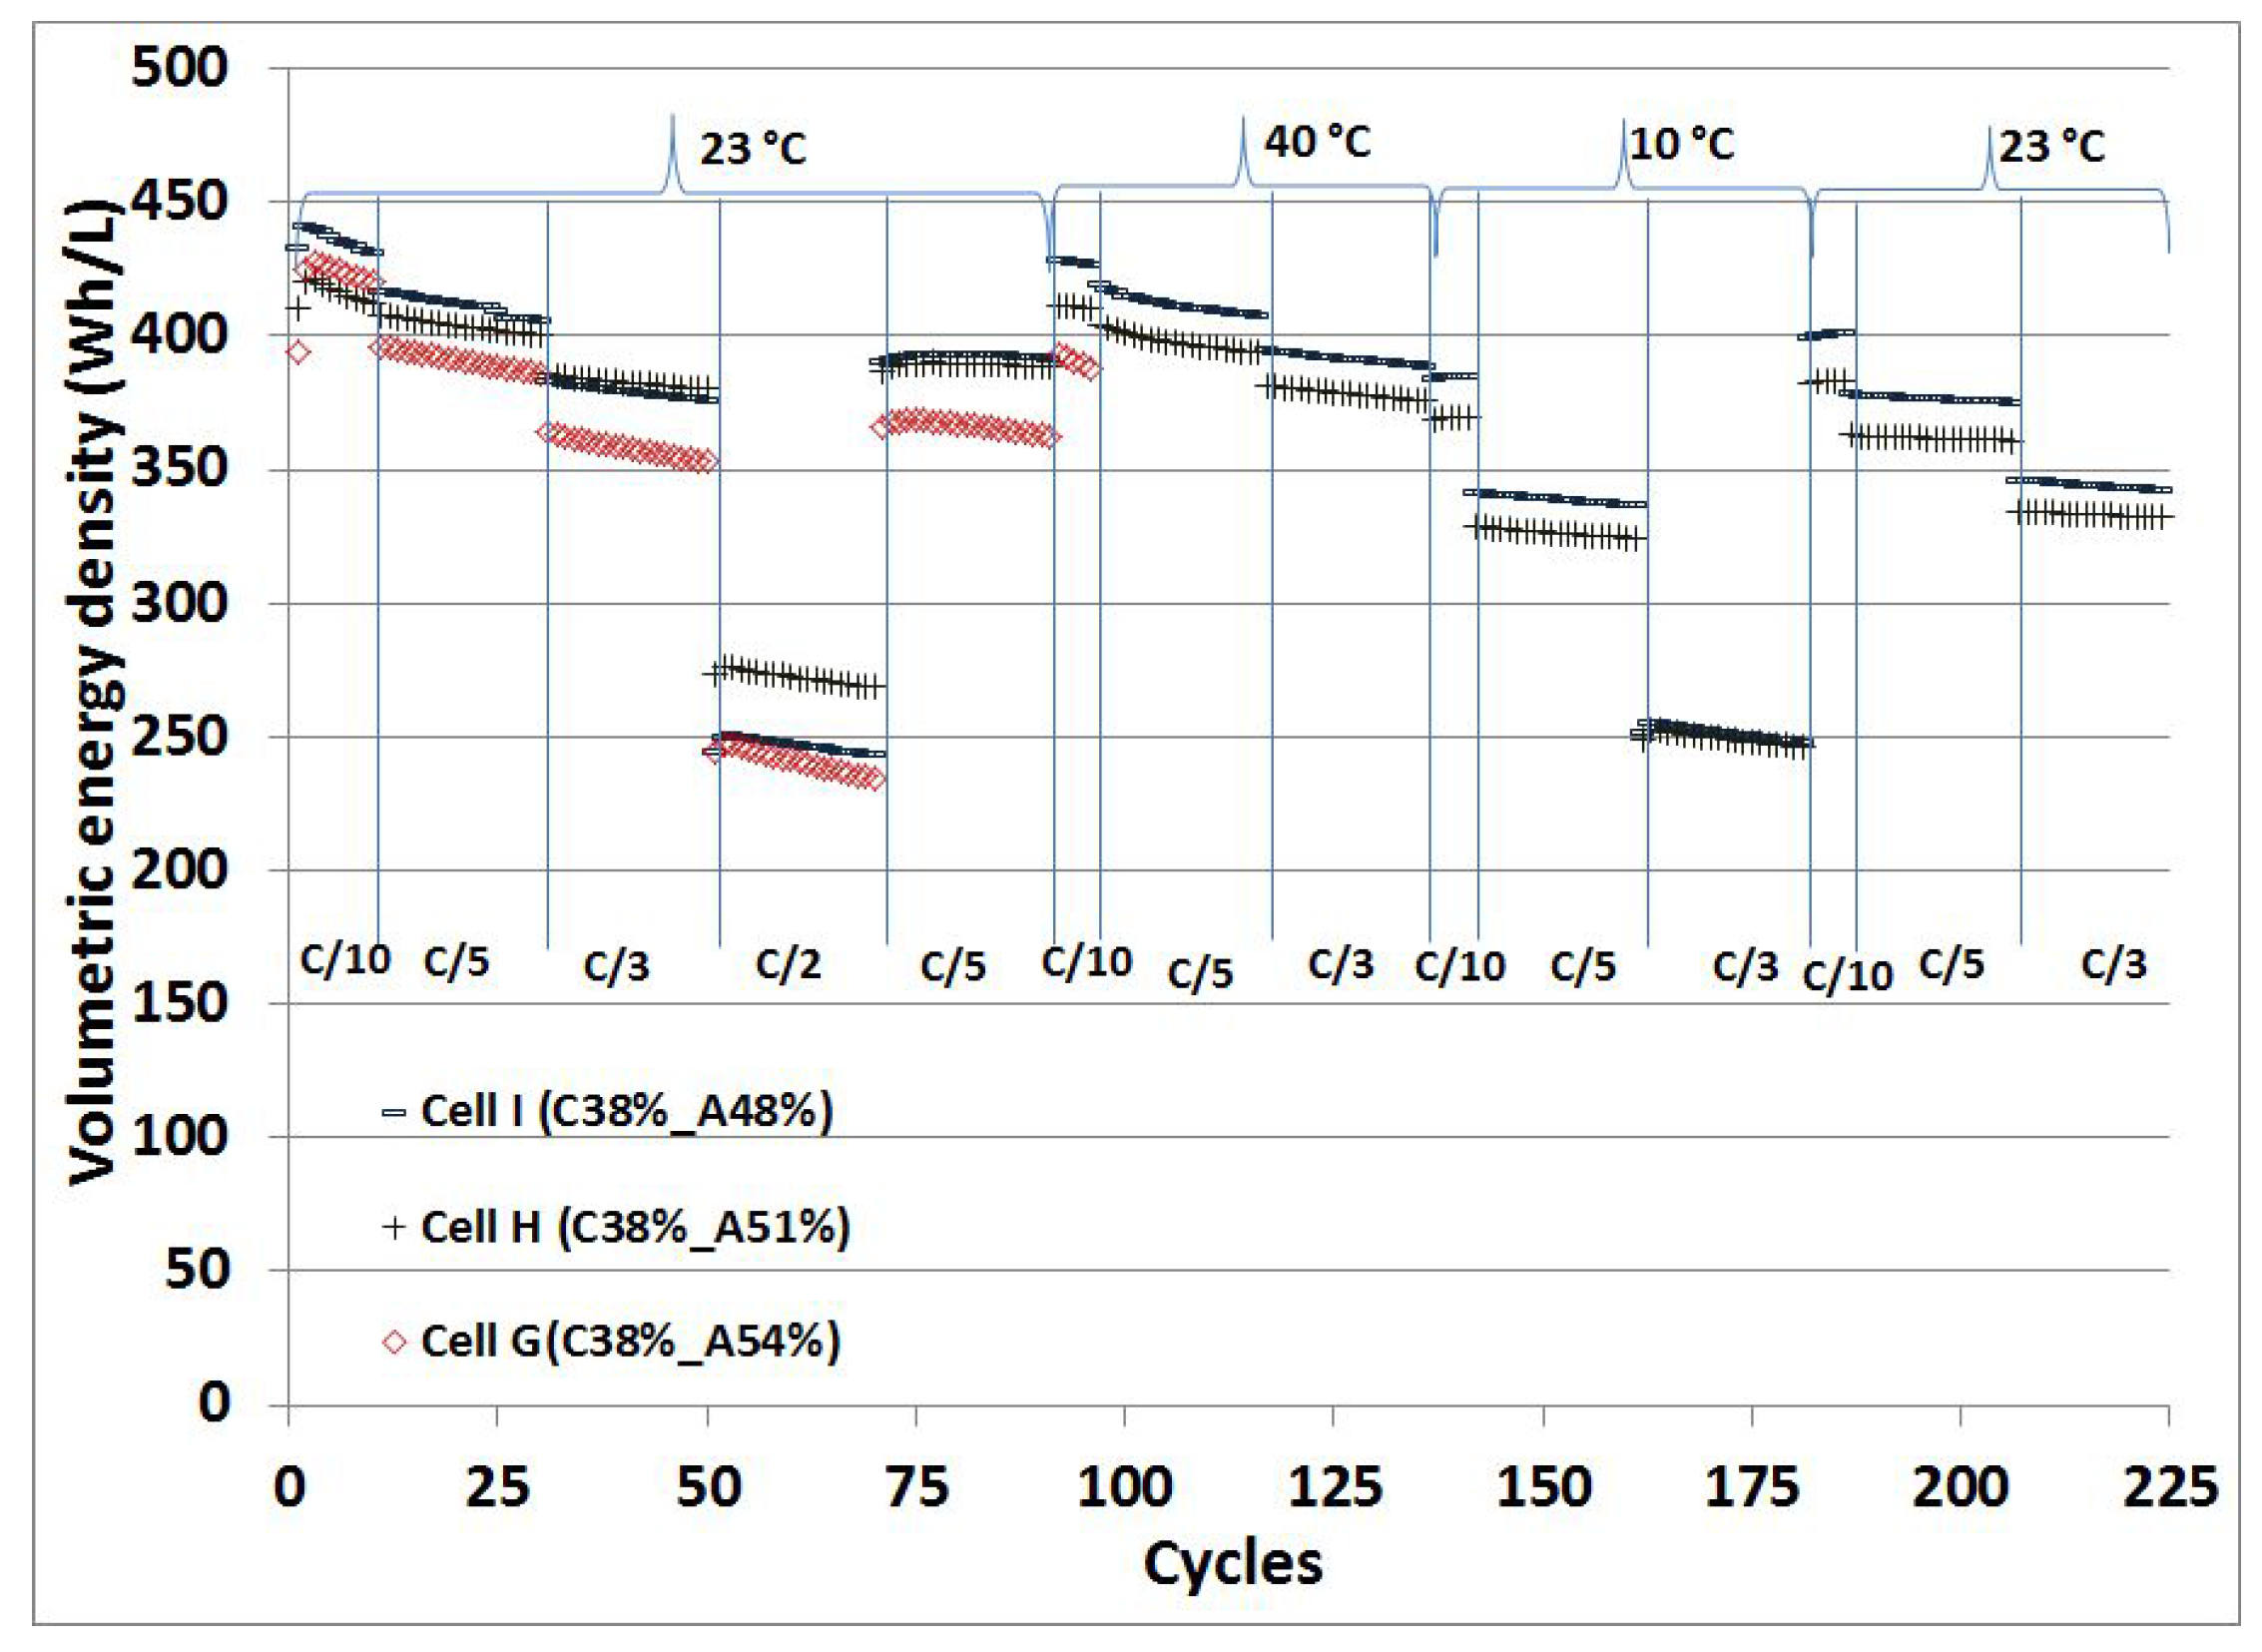
The comparison of the volumetric energy density (Wh/L) values obtained from the full cells, containing NMC cathodes with 38% porosity and graphite anodes with 48%, 51% and 54% porosities, at different C-rates at temperatures of 23
C, 40
C and 10
C is displayed in
Figure 7. The same full cells were cycled at different temperatures. A simple calculation was done taking the anode, cathode, separator and half of the substrate foils thicknesses into account to calculate the volume of the electrode stack and its volumetric energy density in Wh/L. The pouch foil and current tabs are not included in the calculation.
The volumetric energy densities of 425 Wh/L, 421 Wh/L and 441 Wh/L [
1] are obtained from the full cells, Cell G (C38%-A54%), Cell H (C38%-A51%) and Cell I (C38%-A48%) at the C/10 rate, respectively. Cell G (C38%-A54%) shows slightly higher energy density than Cell H (C38%-A51%), but lower than Cell I (C38%-A48%), which might be due to negligible kinetic limitations and appropriate ionic conduction throughout the electrode due to high porosity. As the C-rate increases, a reduction in the energy density value is observed with Cell G (C38%-A54%). The energy density loss at a high C-rate could be mainly attributed to the graphite electrode due to the formation of the passivating layer on the surface, which consumes a portion of intercalated lithium in every cycle. The energy density values are quite satisfactory up to the C/3 rate, but as expected for thick electrodes, the energy density deteriorates significantly at higher C-rates. After applying cycles at C/2, the cells restored slightly lower energy density values after 70 cycles at C/5.
After 90 cycles, Cell I (C38%-A48%) at 40 C delivered volumetric energy densities of 428 Wh/L, 416 Wh/L and 395 Wh/L at C/10, C/5 and C/3 rates, respectively. A 4% reduction in the energy density was observed when the porosity is increased to 51% on the anode side. Cell G (C38%-A54%) has stopped working after 95 cycles. This might be due to the reconstruction of the SEI layer during the cycling at high C-rates, and that led to lithium plating at the surface of the negative electrodes. Cell I (C38%-A48%) at 10 C showed a 10%, 17% and 36% reduction in the energy density values at the same C-rates after 135 cycles in comparison to the energy density obtained at 40 C. The energy density deteriorates faster at low temperature (10 C) when the C-rate increases, while the cells showed an improvement in the energy density at a high temperature (40 C). The cells showed almost the same energy density when the cells are cycled at 23 C at the C/2 rate and 10 C at C/3. The cells were further cycled again at 23 C after 180 cycles. The cells restored energy densities slightly less than the initial densities. The cells showed negligible losses in the energy density values up to C/5 rates even after 180 cycles. Cell I (C38%-A48%) exhibits the highest energy density upon cycling at different temperatures and different C-rates.
From the volumetric and gravimetric energy density results, it could be concluded that porosity ∼38% on the cathode side and ∼48% on the anode side, which is quite higher in comparison to commercial electrodes, showed maximum energy density. For the thick electrodes, a 10% and a 20% reduction on the cathode and anode side of the original thickness of the dried film could provide the optimized porosity for the thick electrodes (250–350 m).


