
Microstructure Investigation on Metal Hydride Alloys by Electron Backscatter Diffraction Technique


Abstract
:
1. Introduction
2. Experimental Setup
3. Results
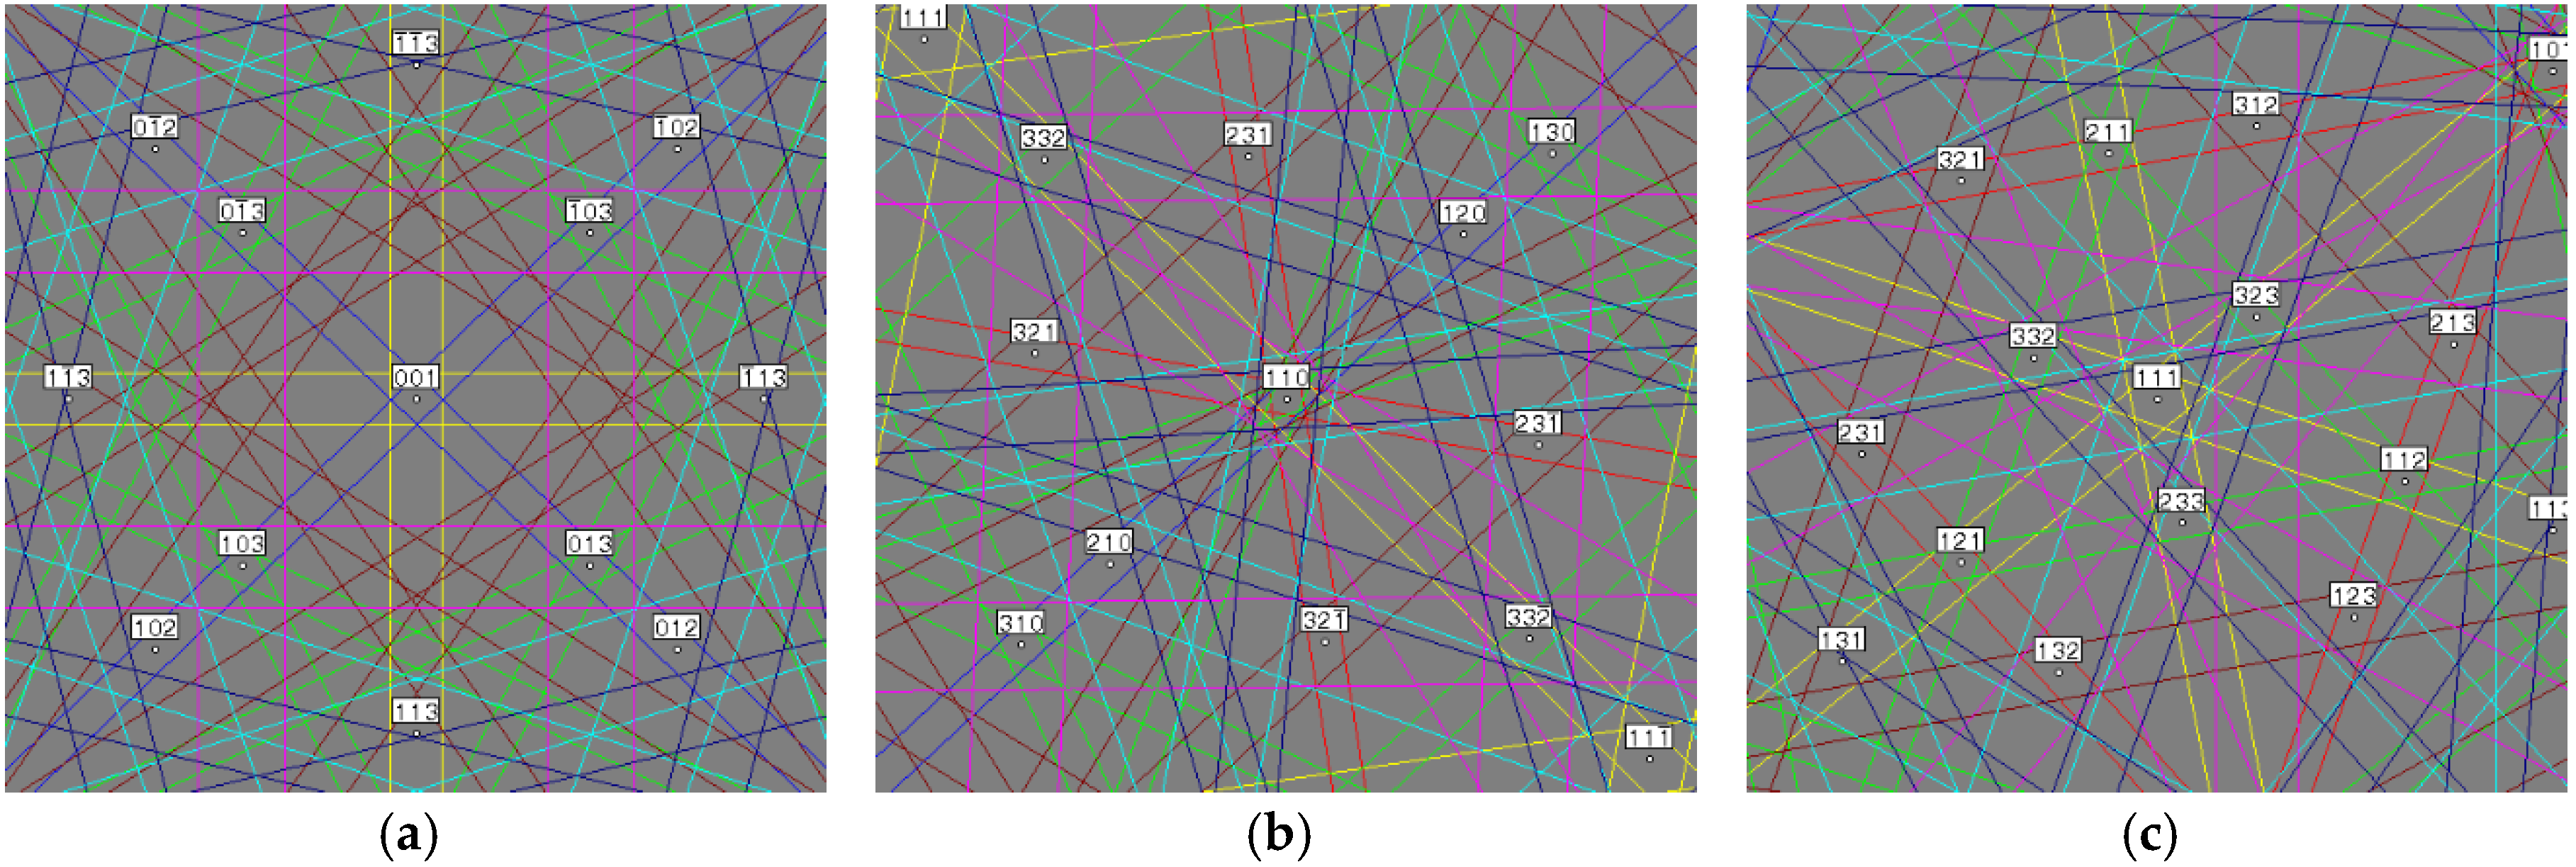
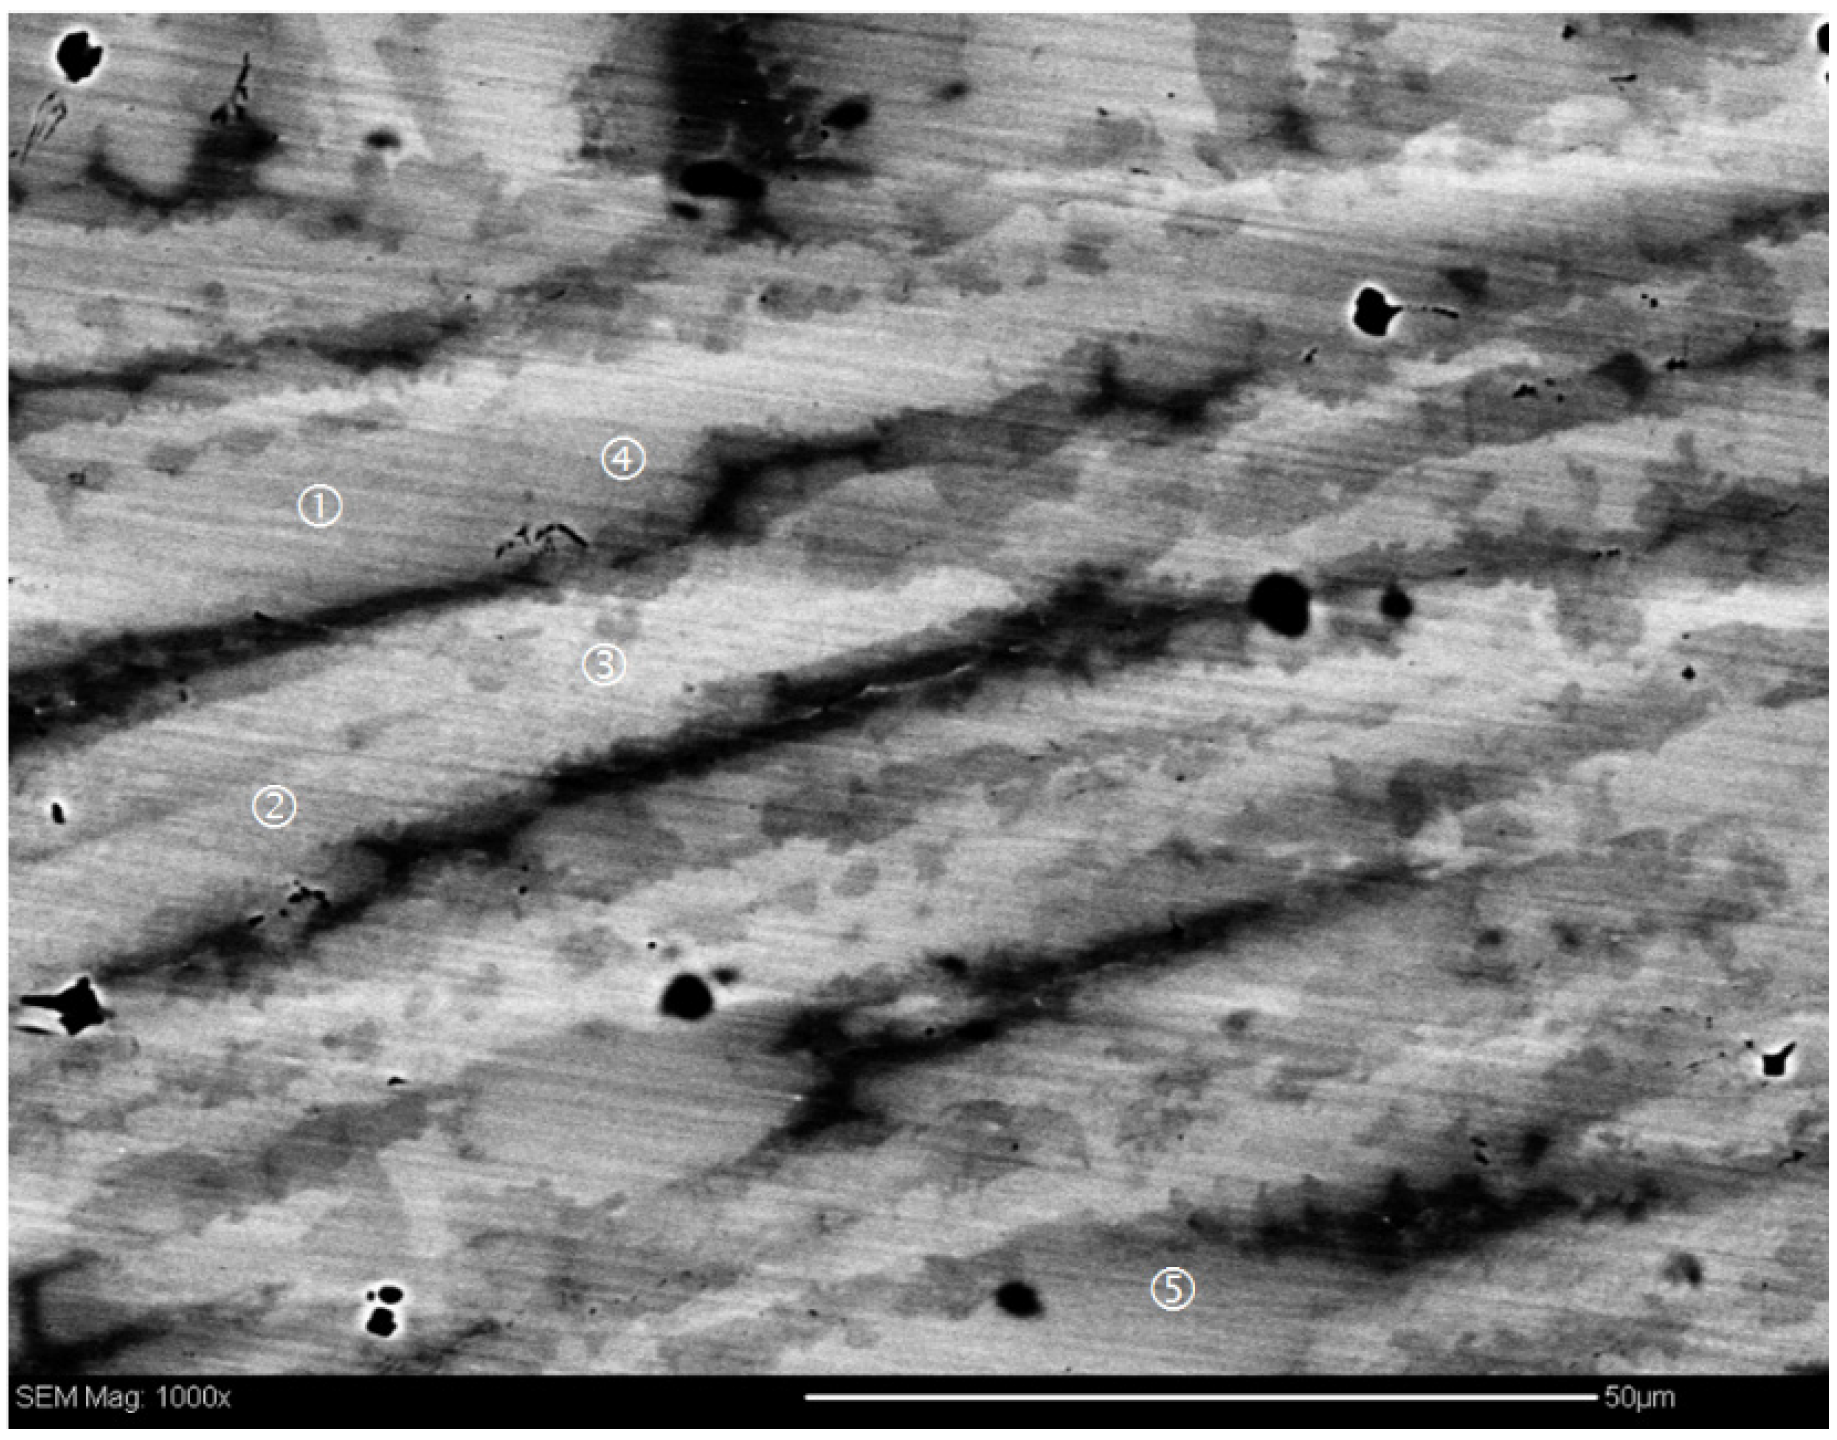
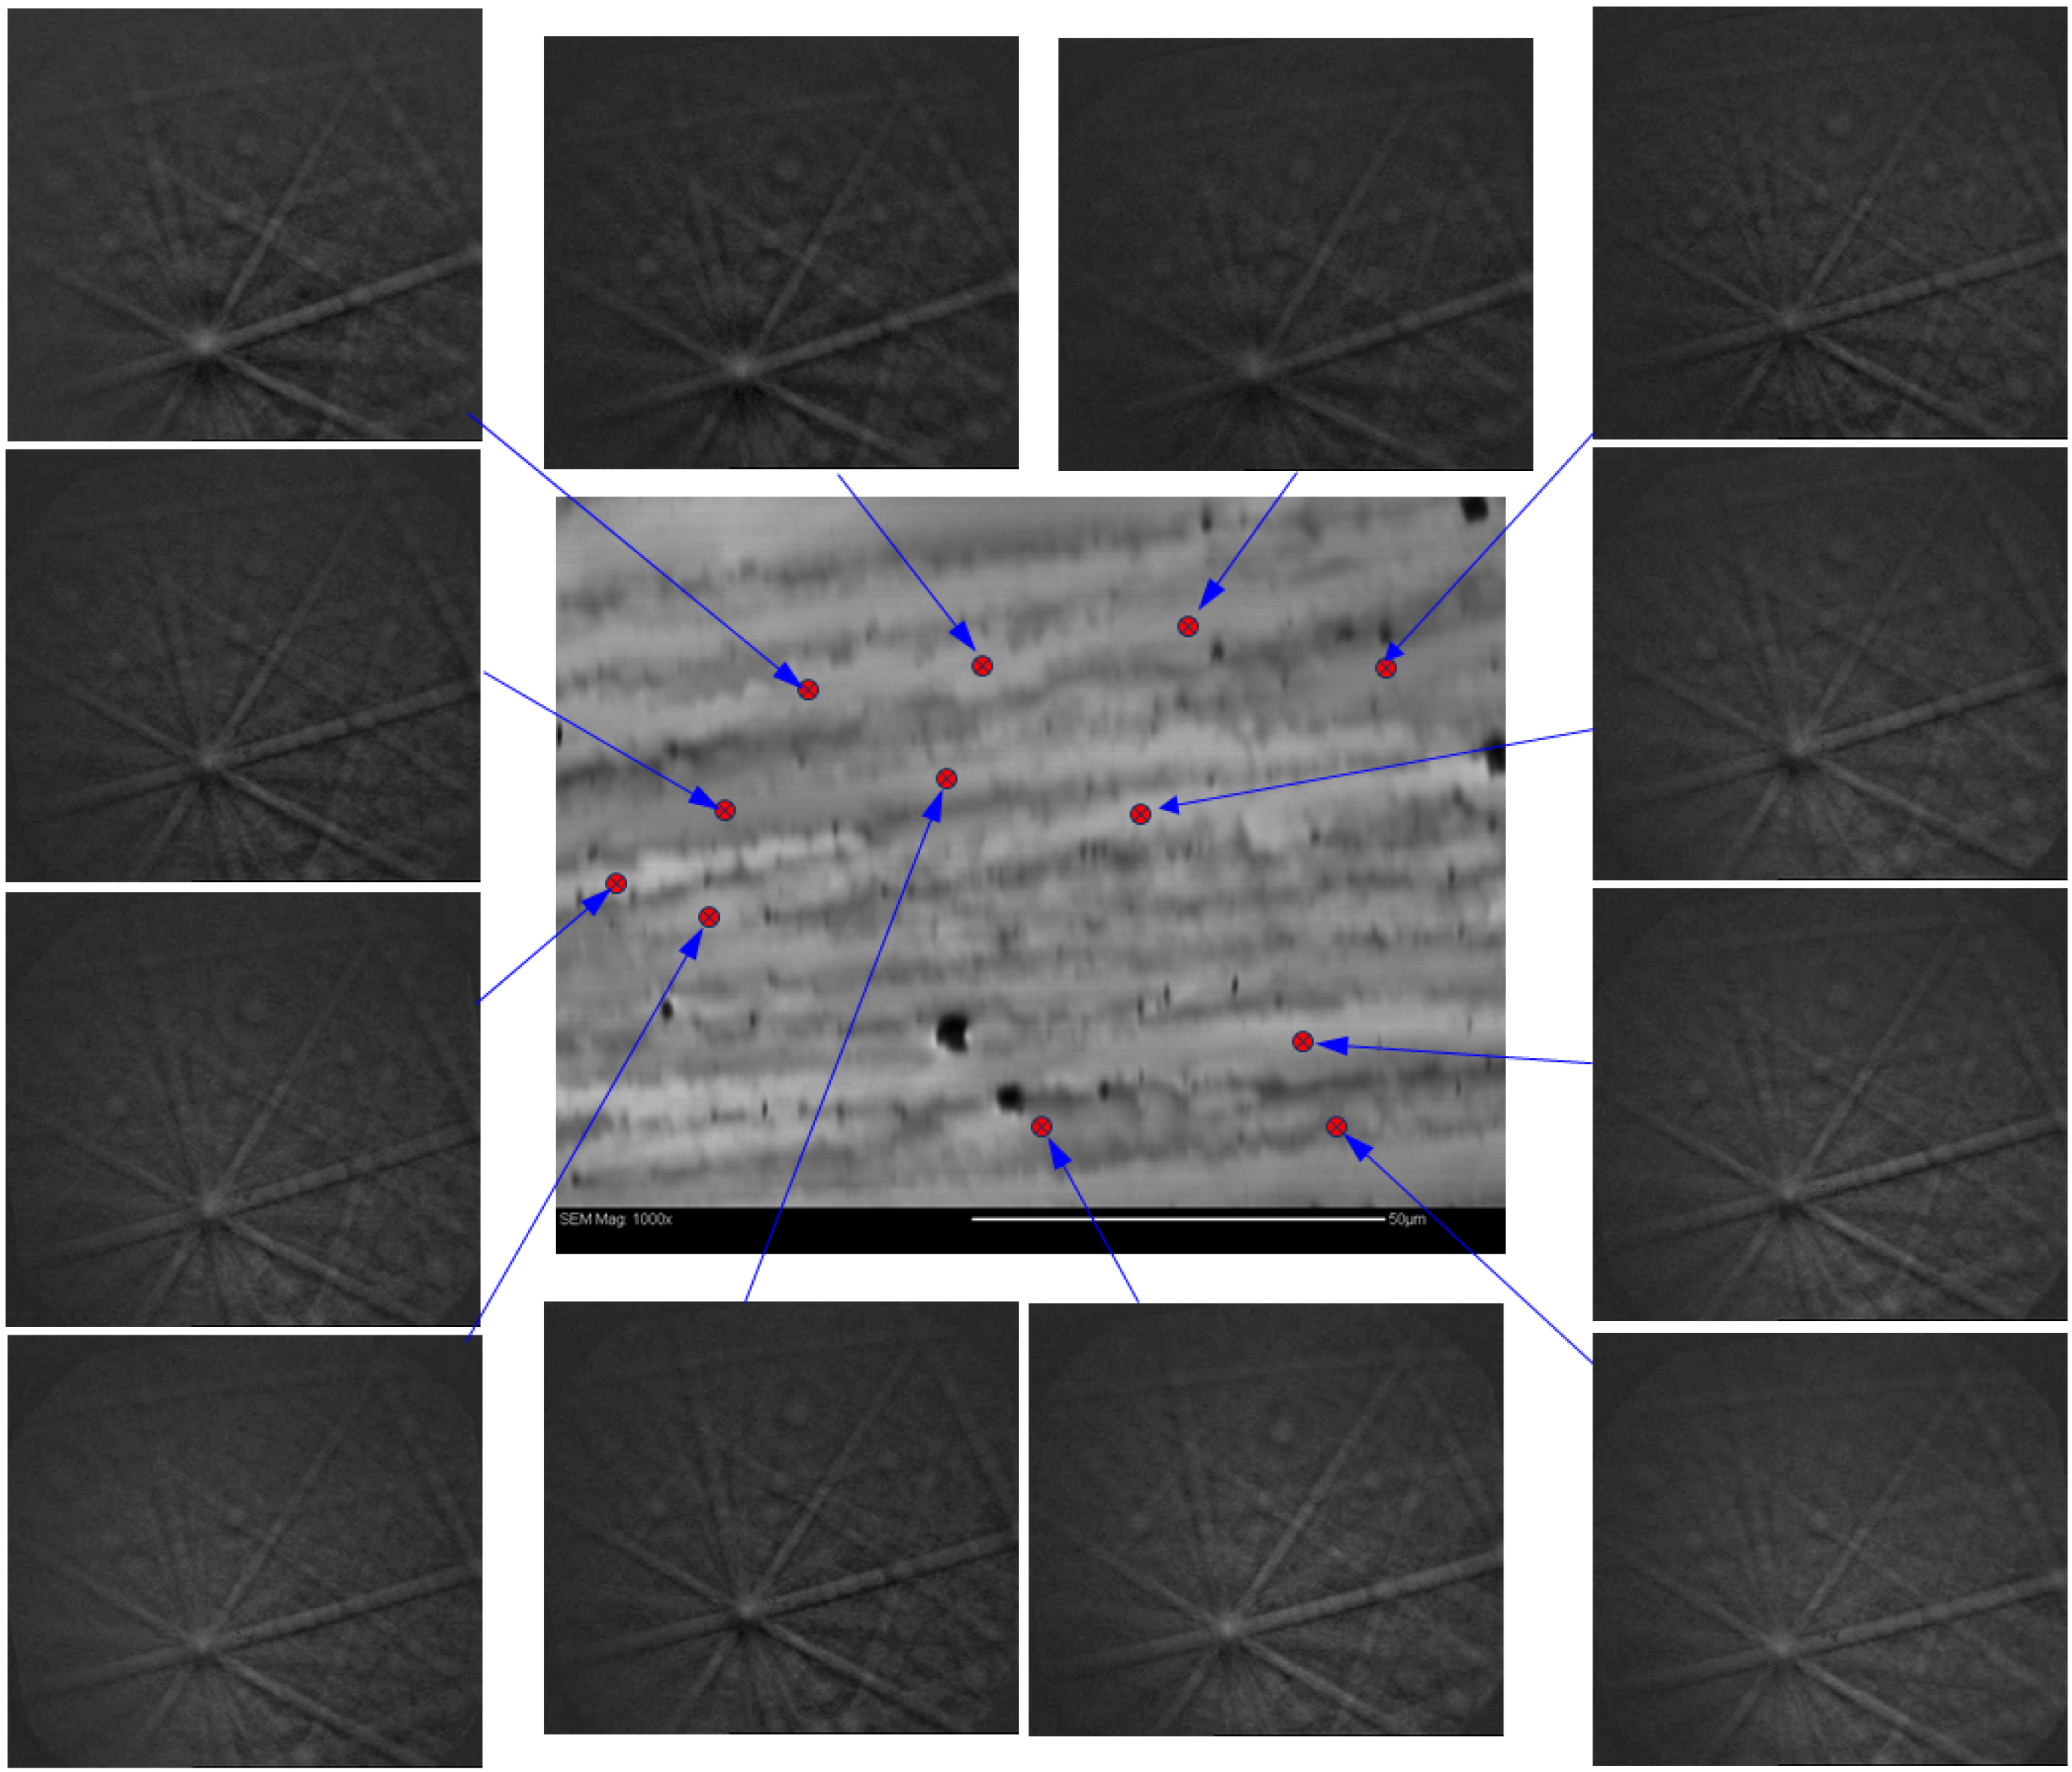
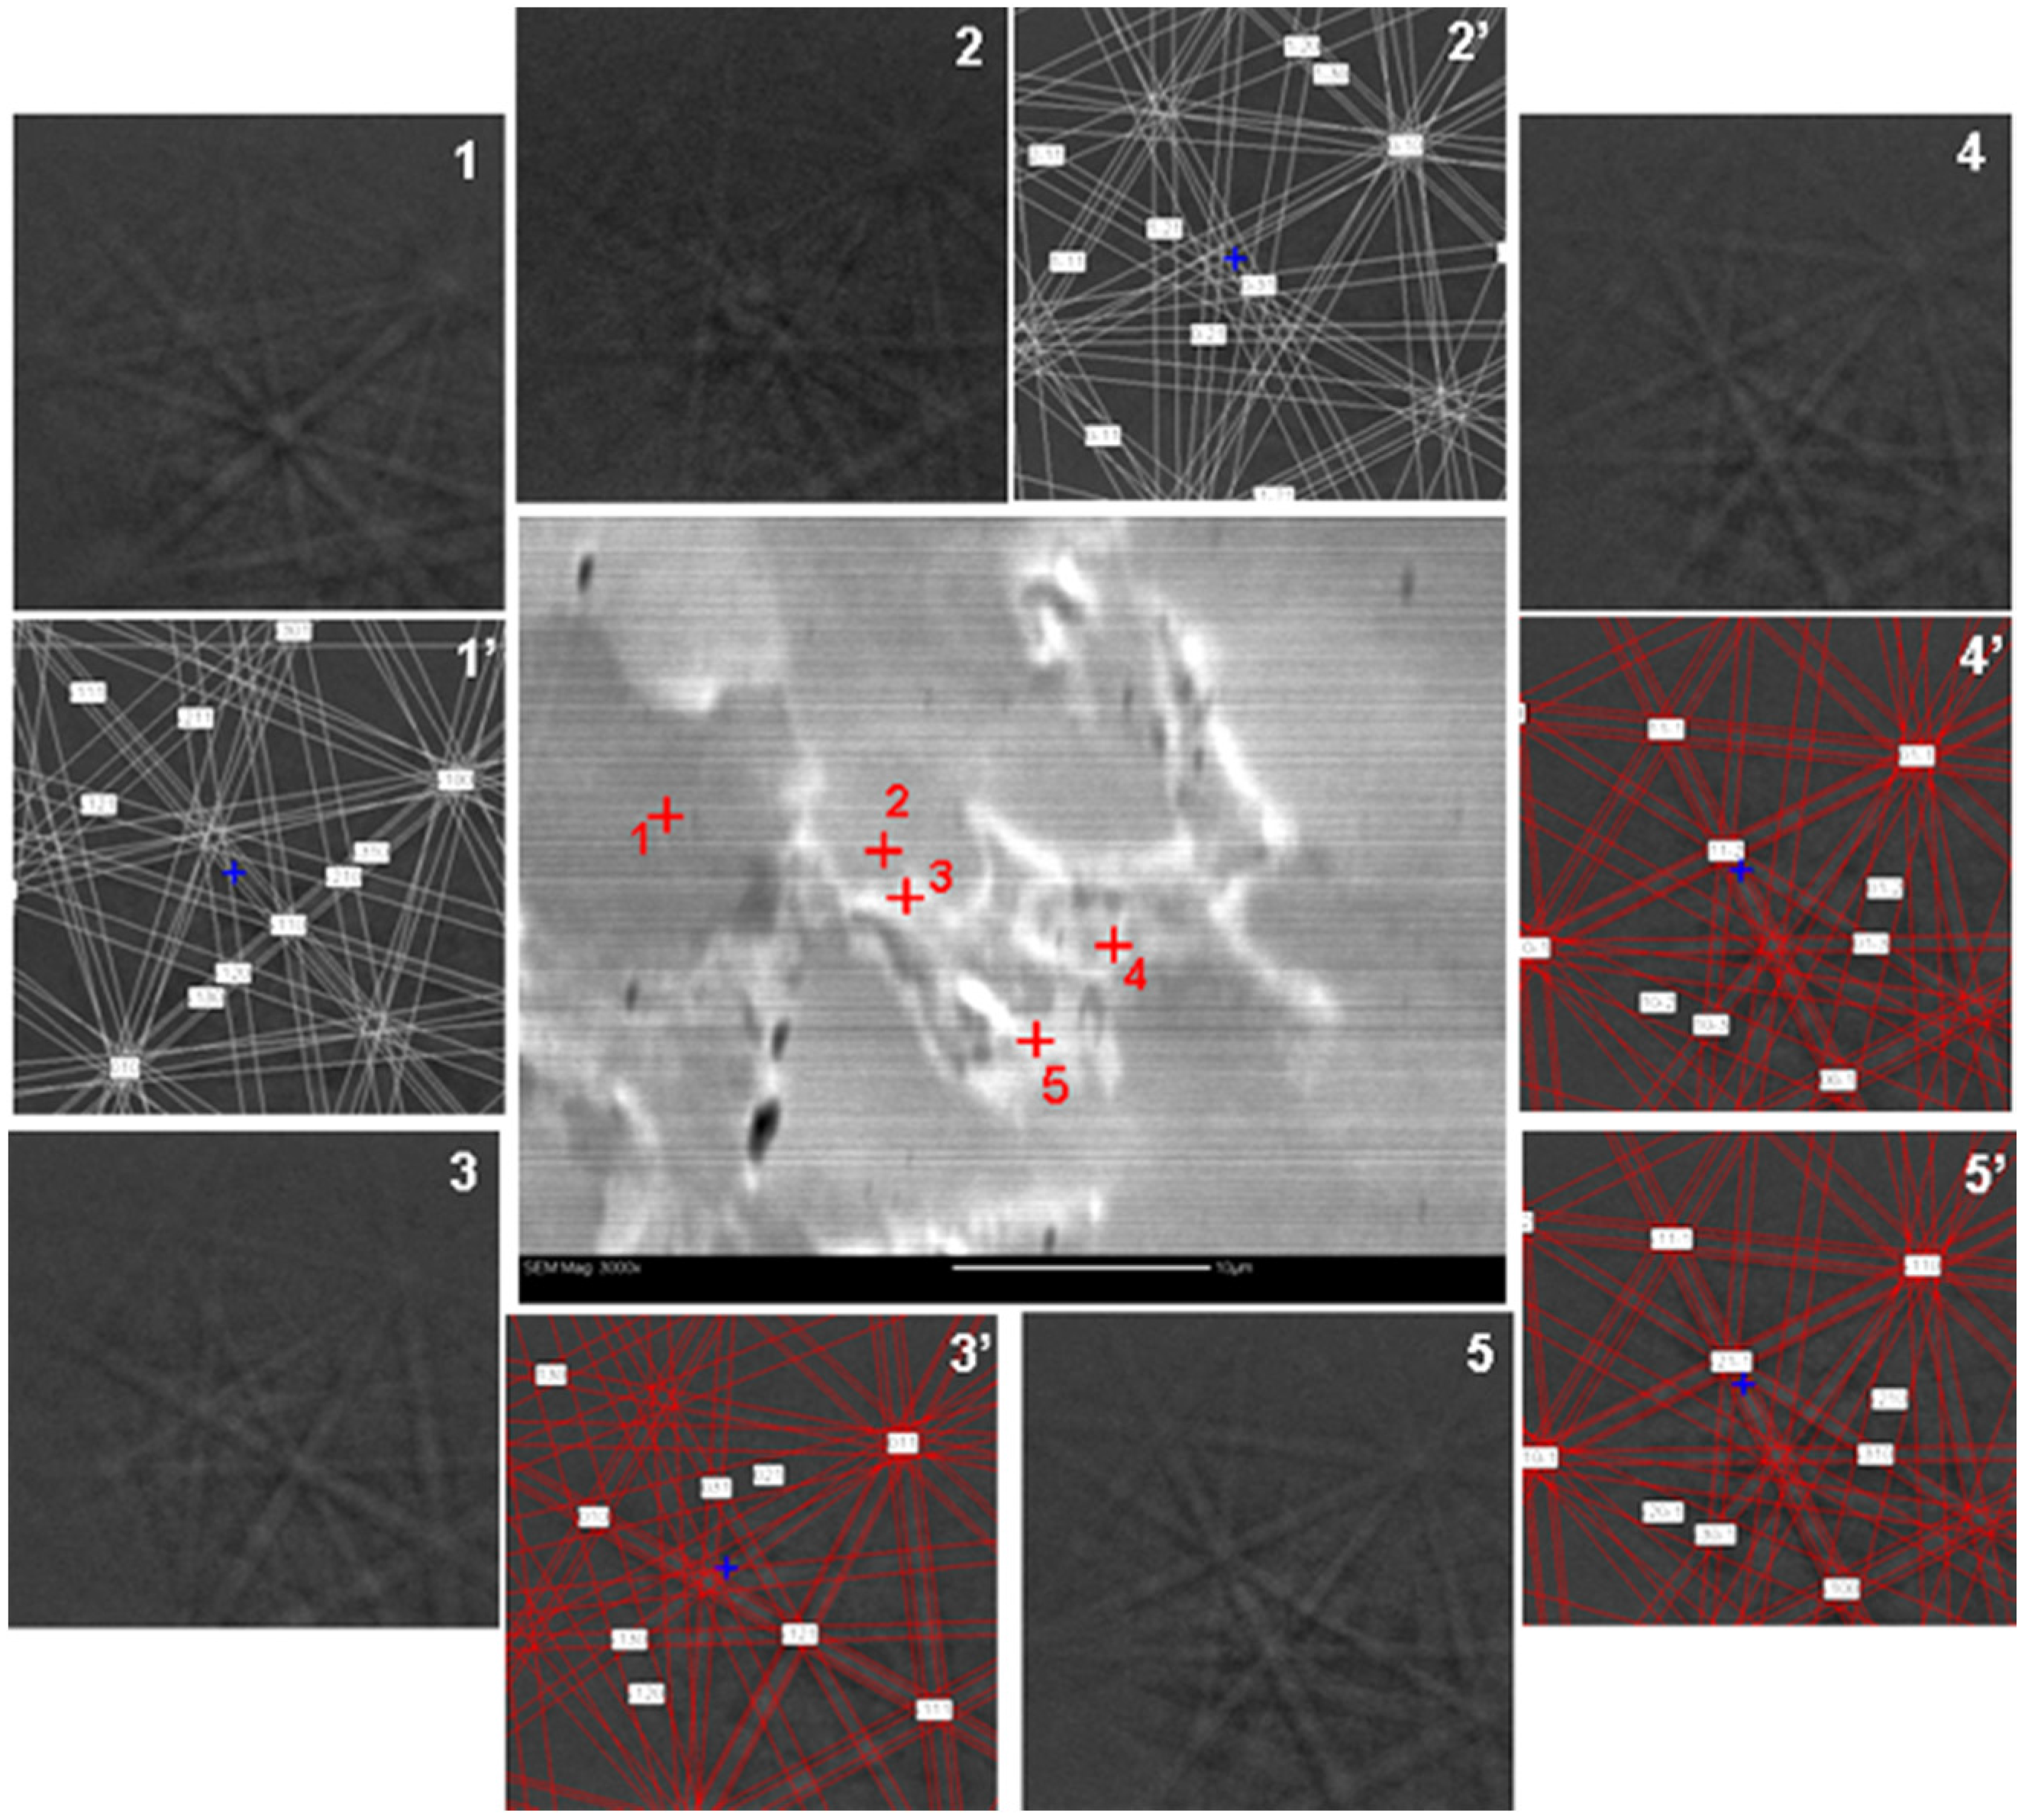
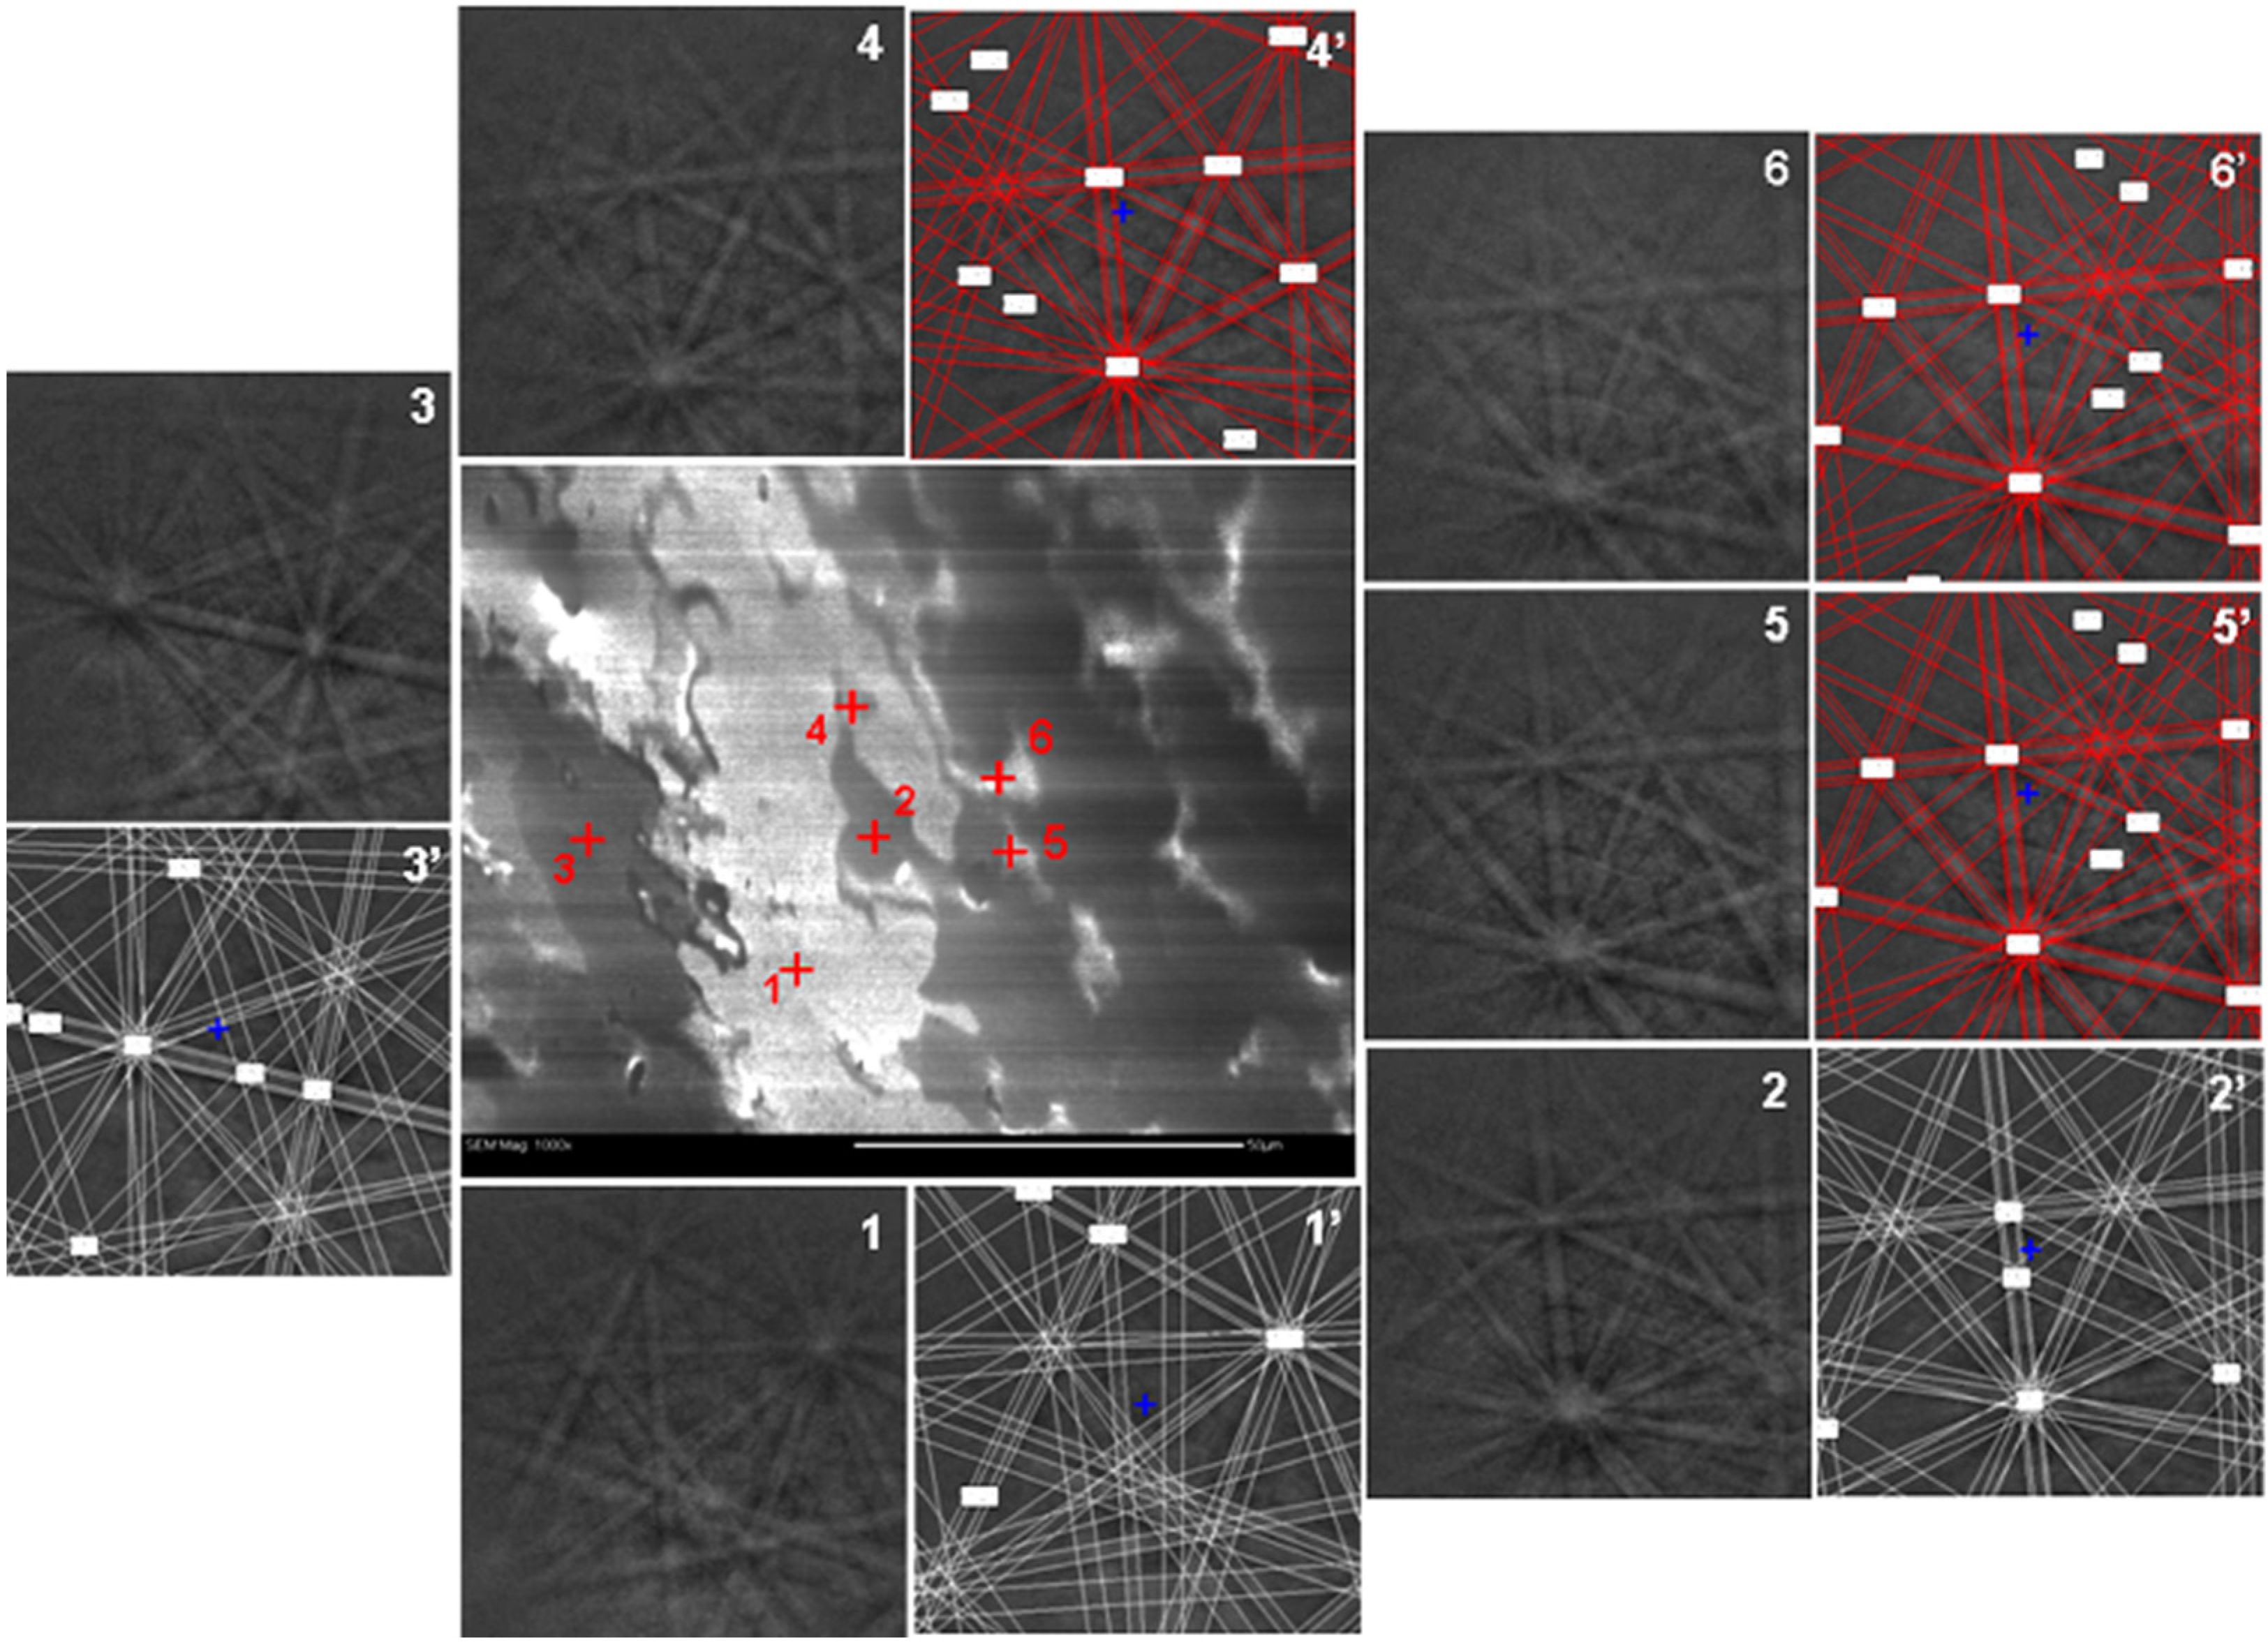
3.1. Zr7Ni10-Based Alloy
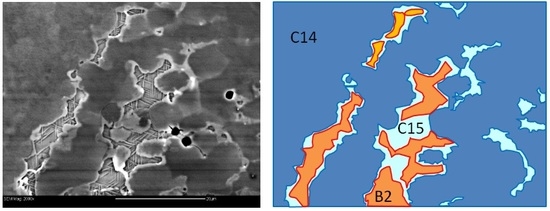
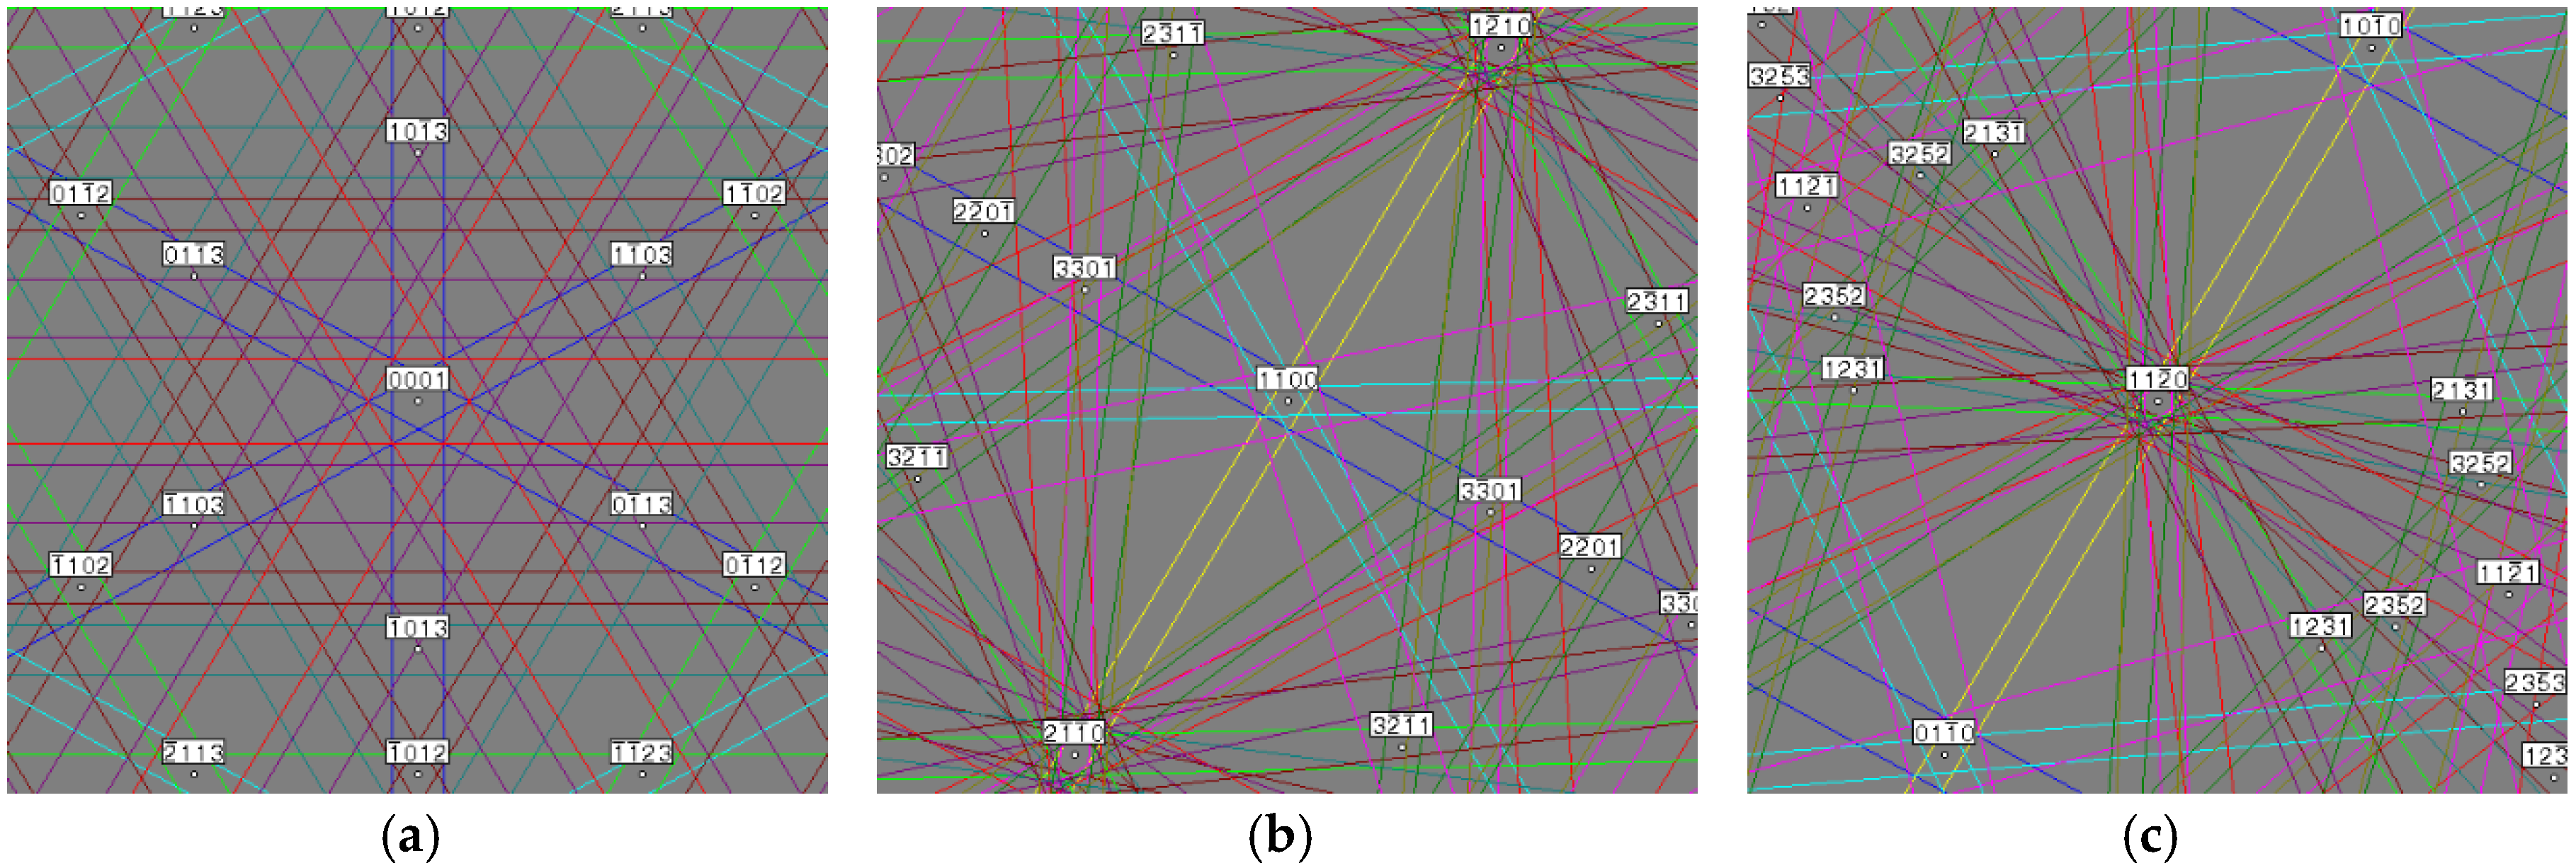
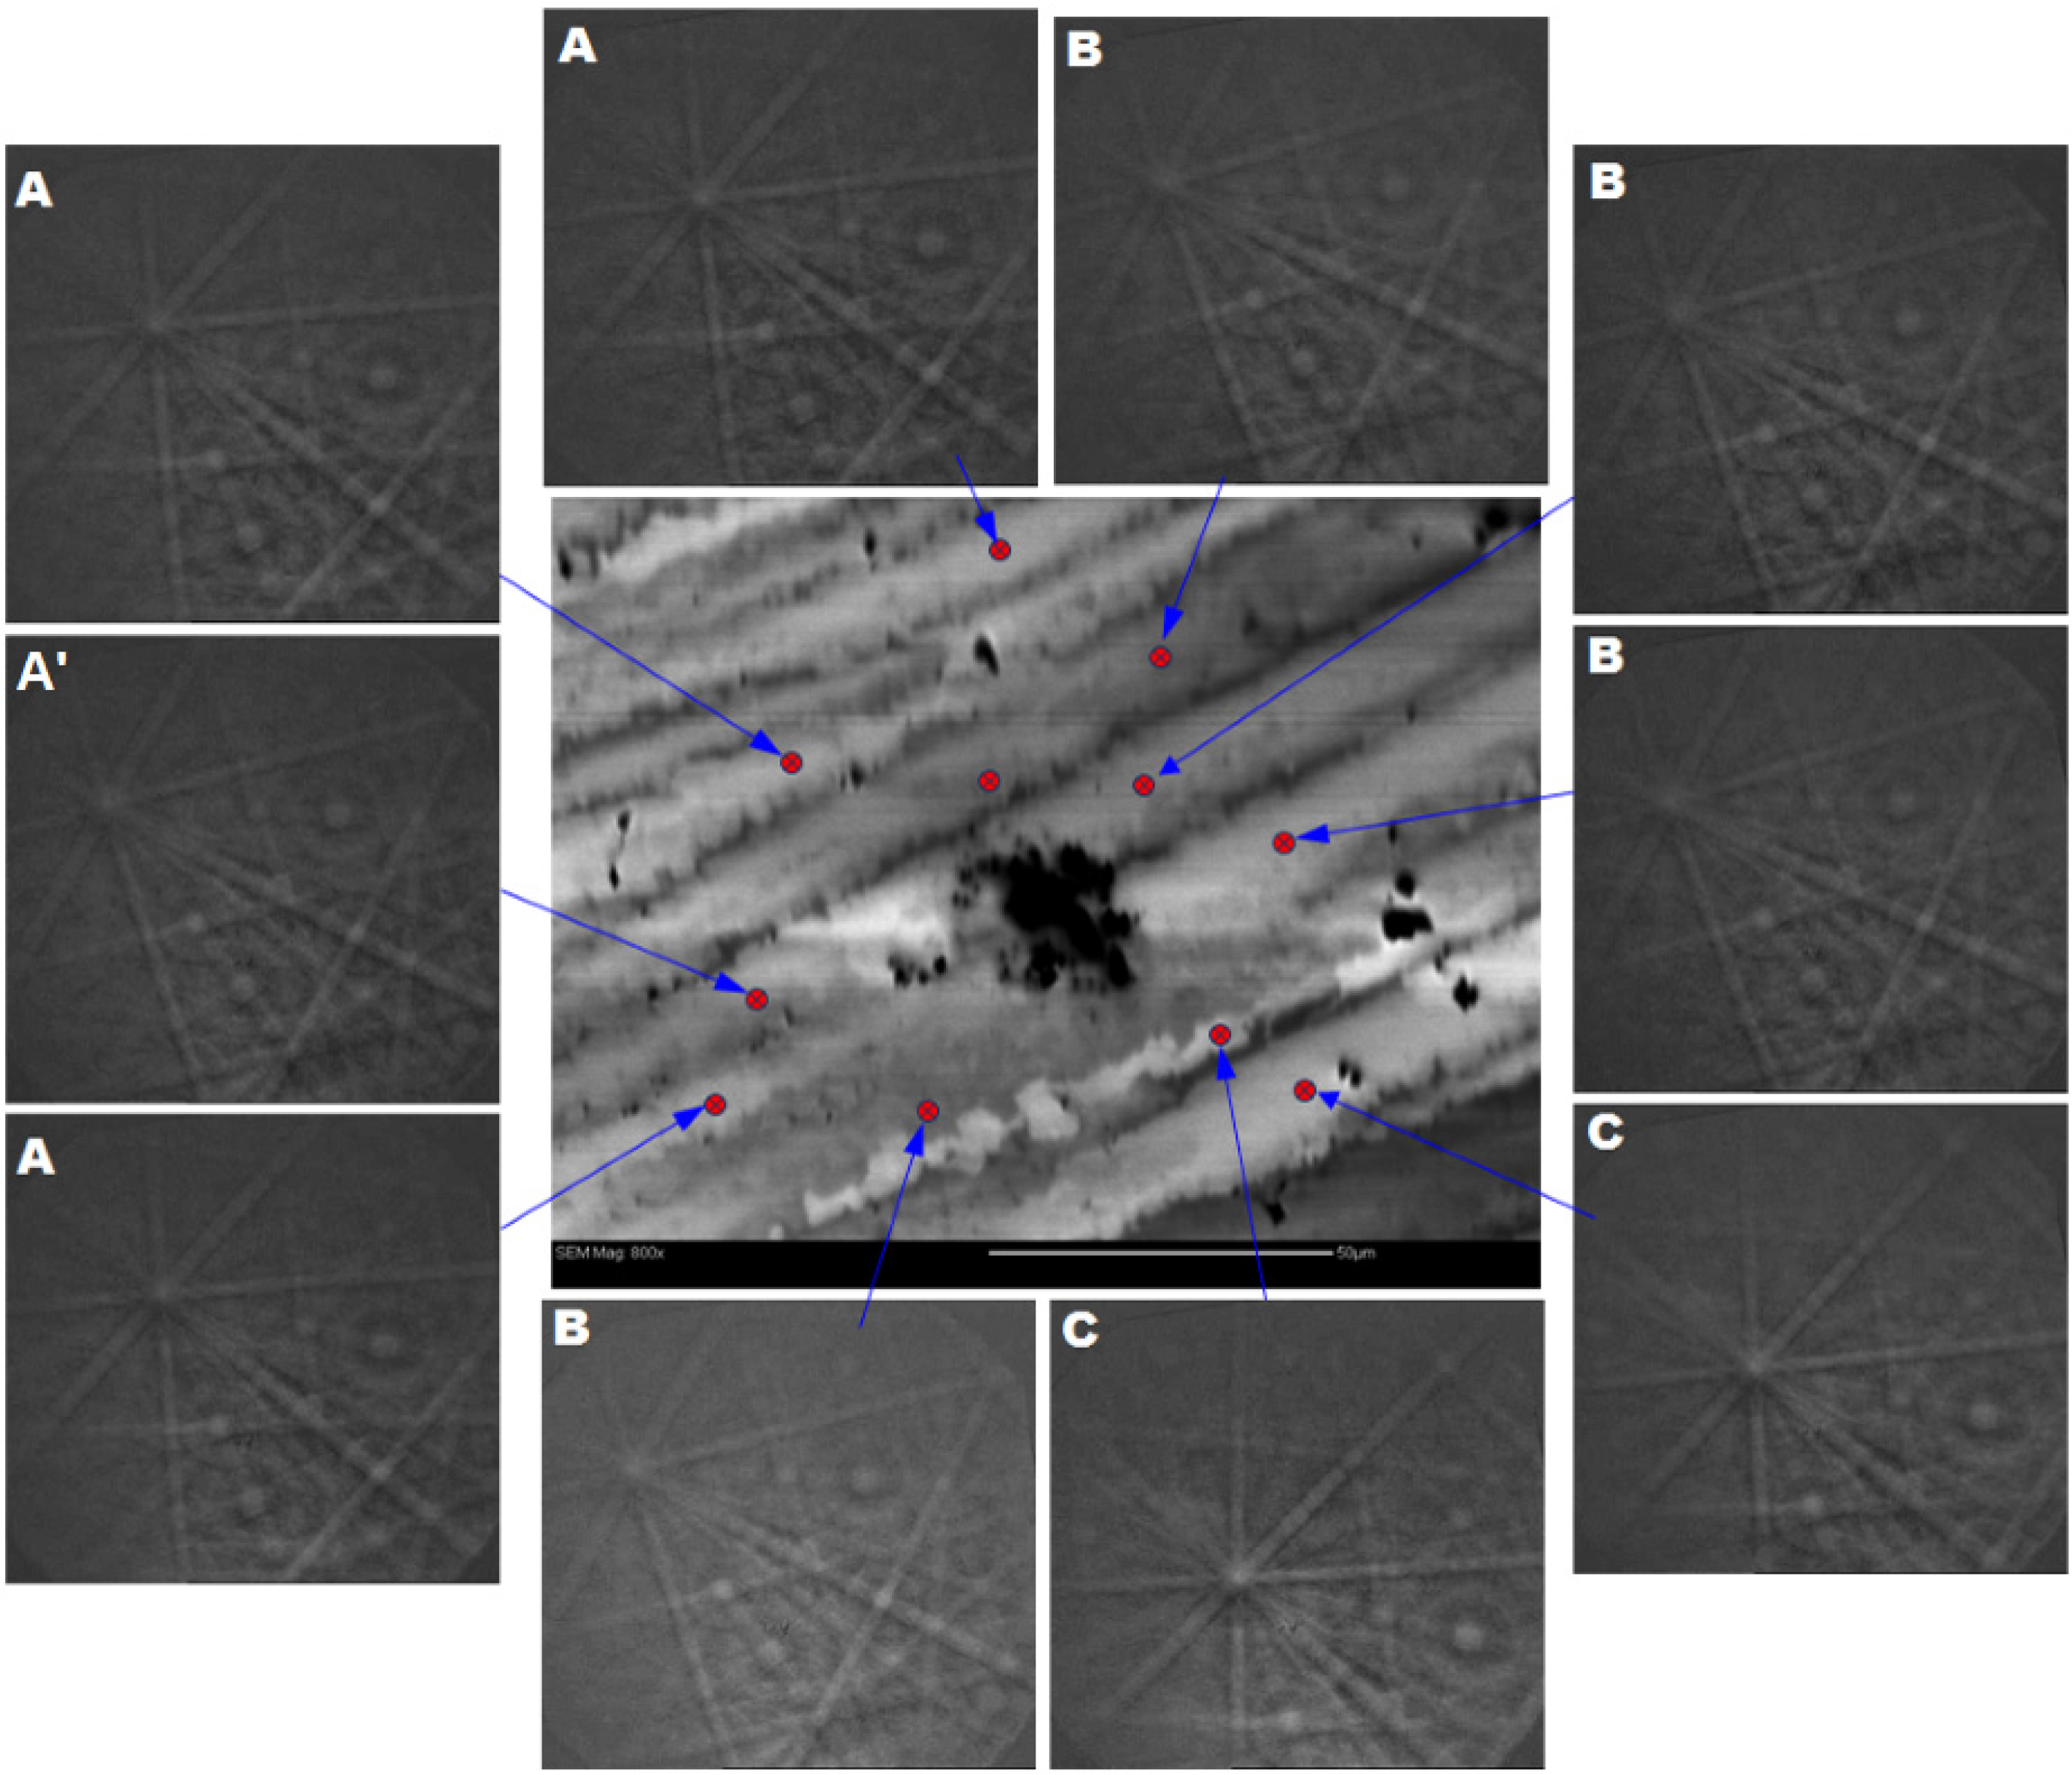
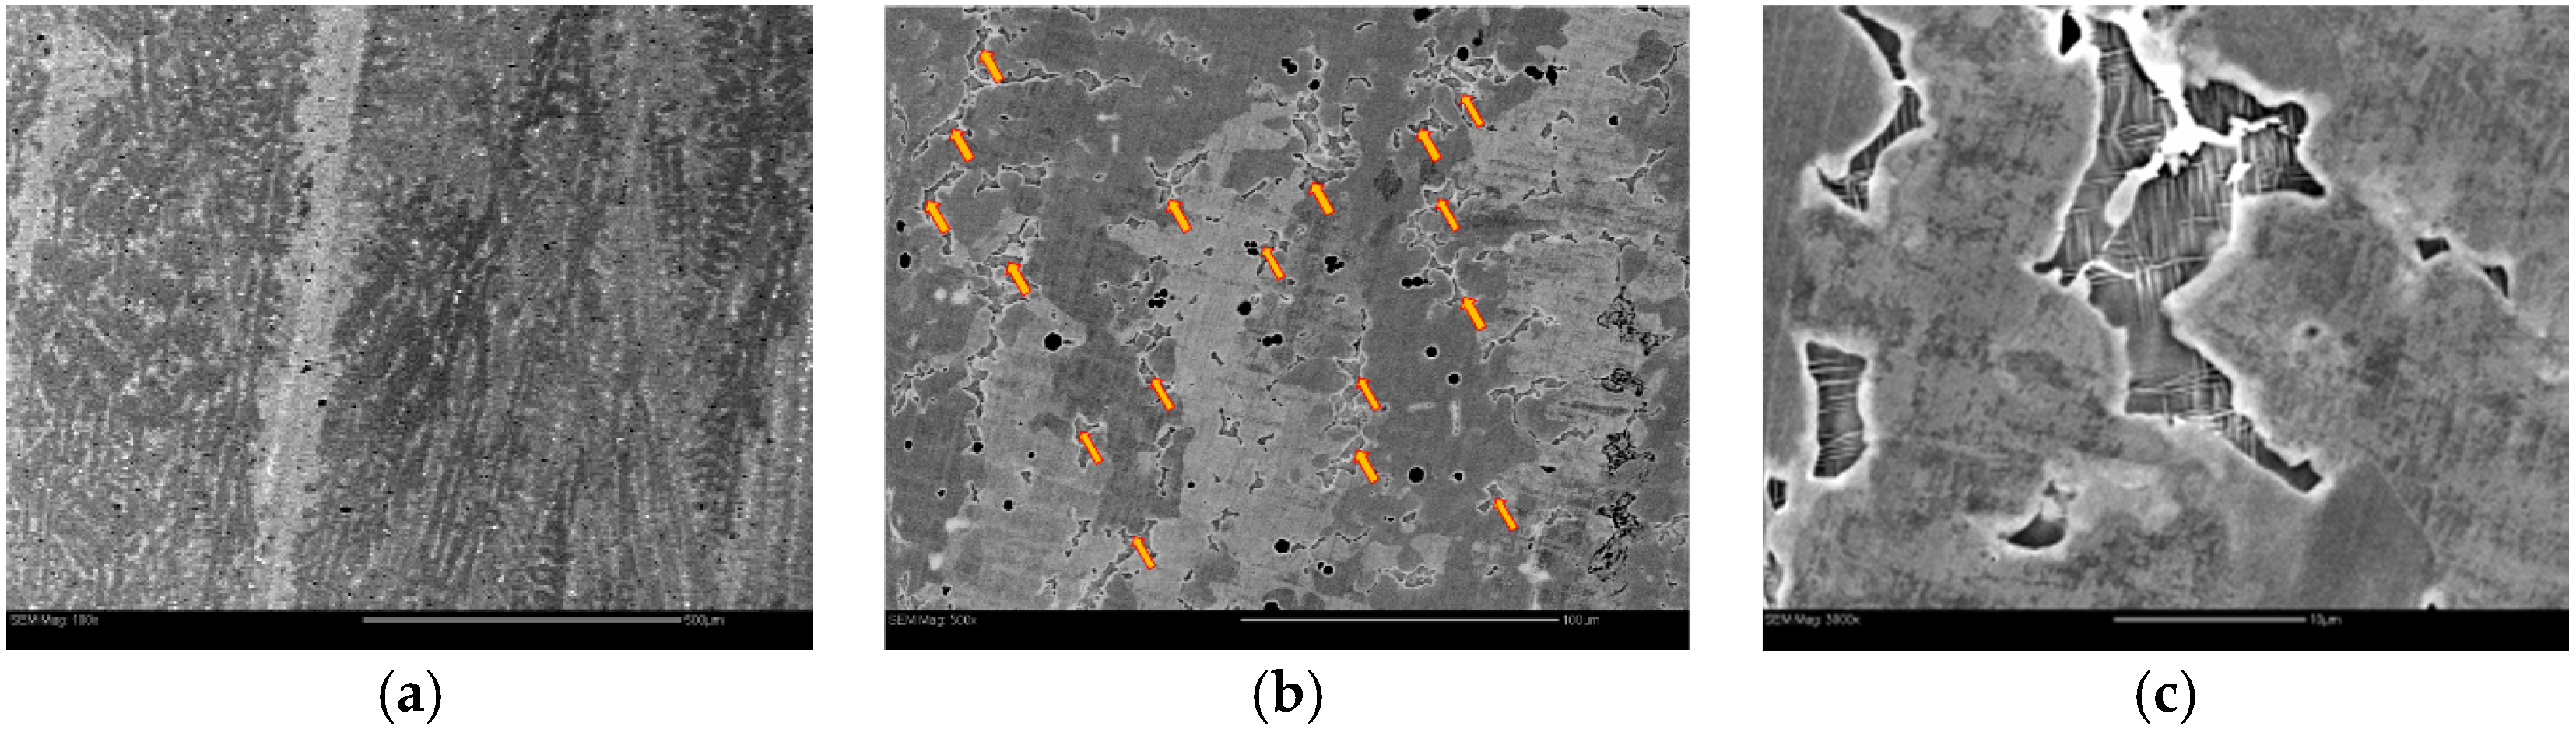
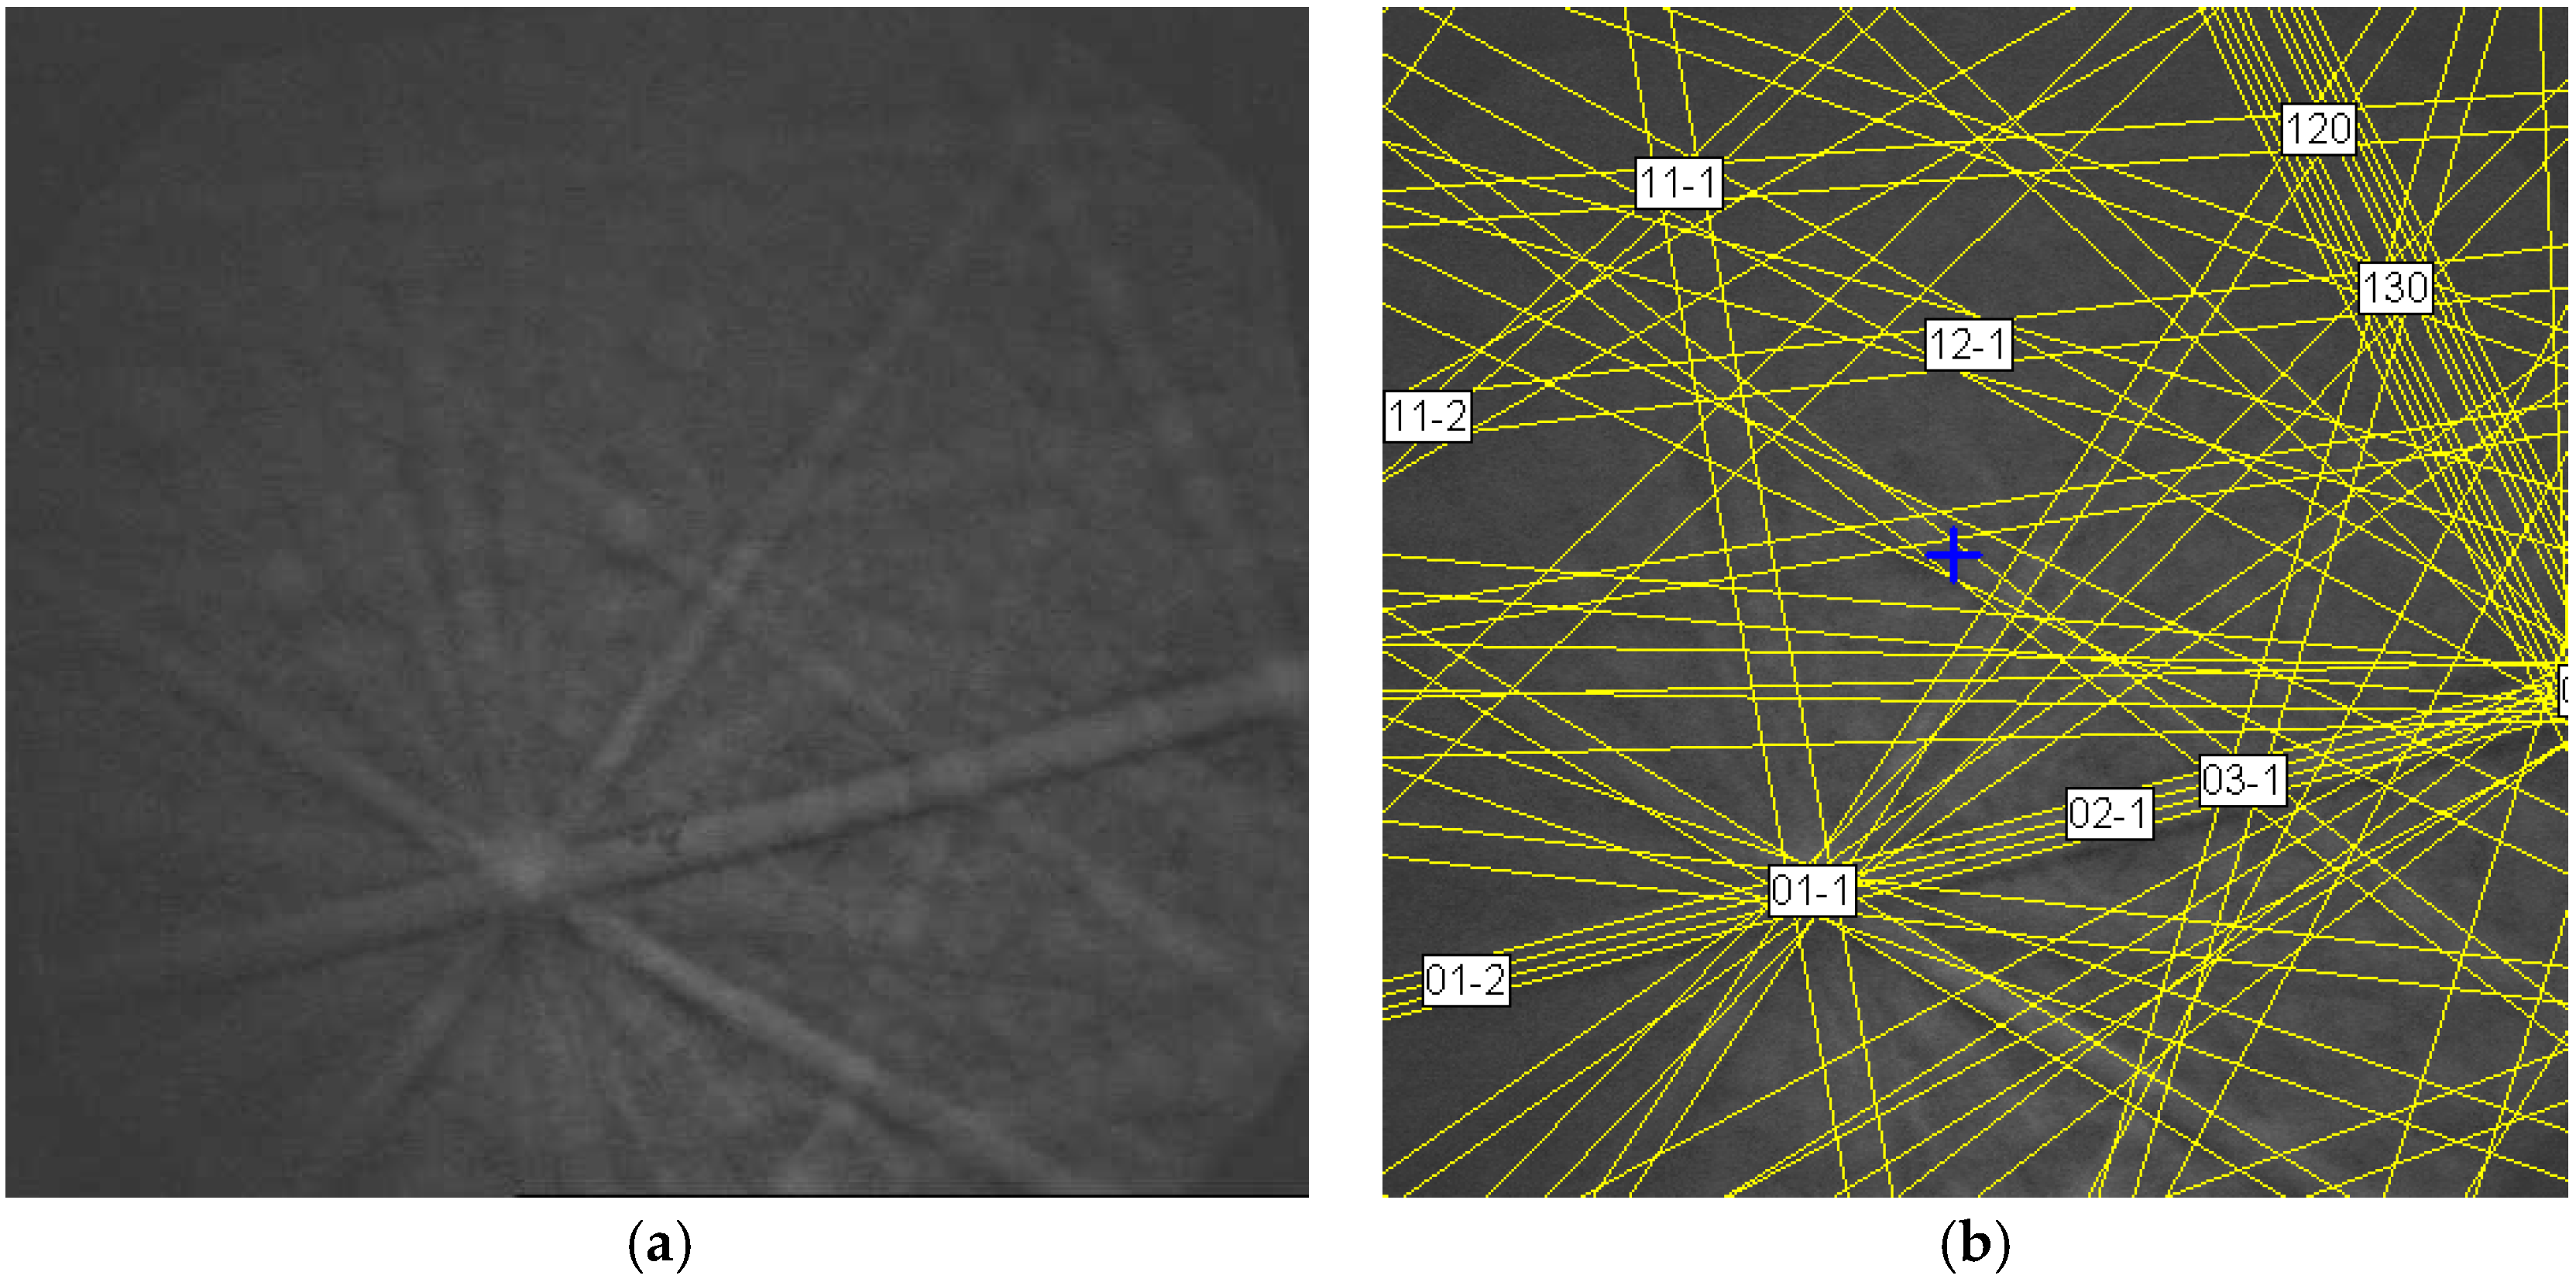
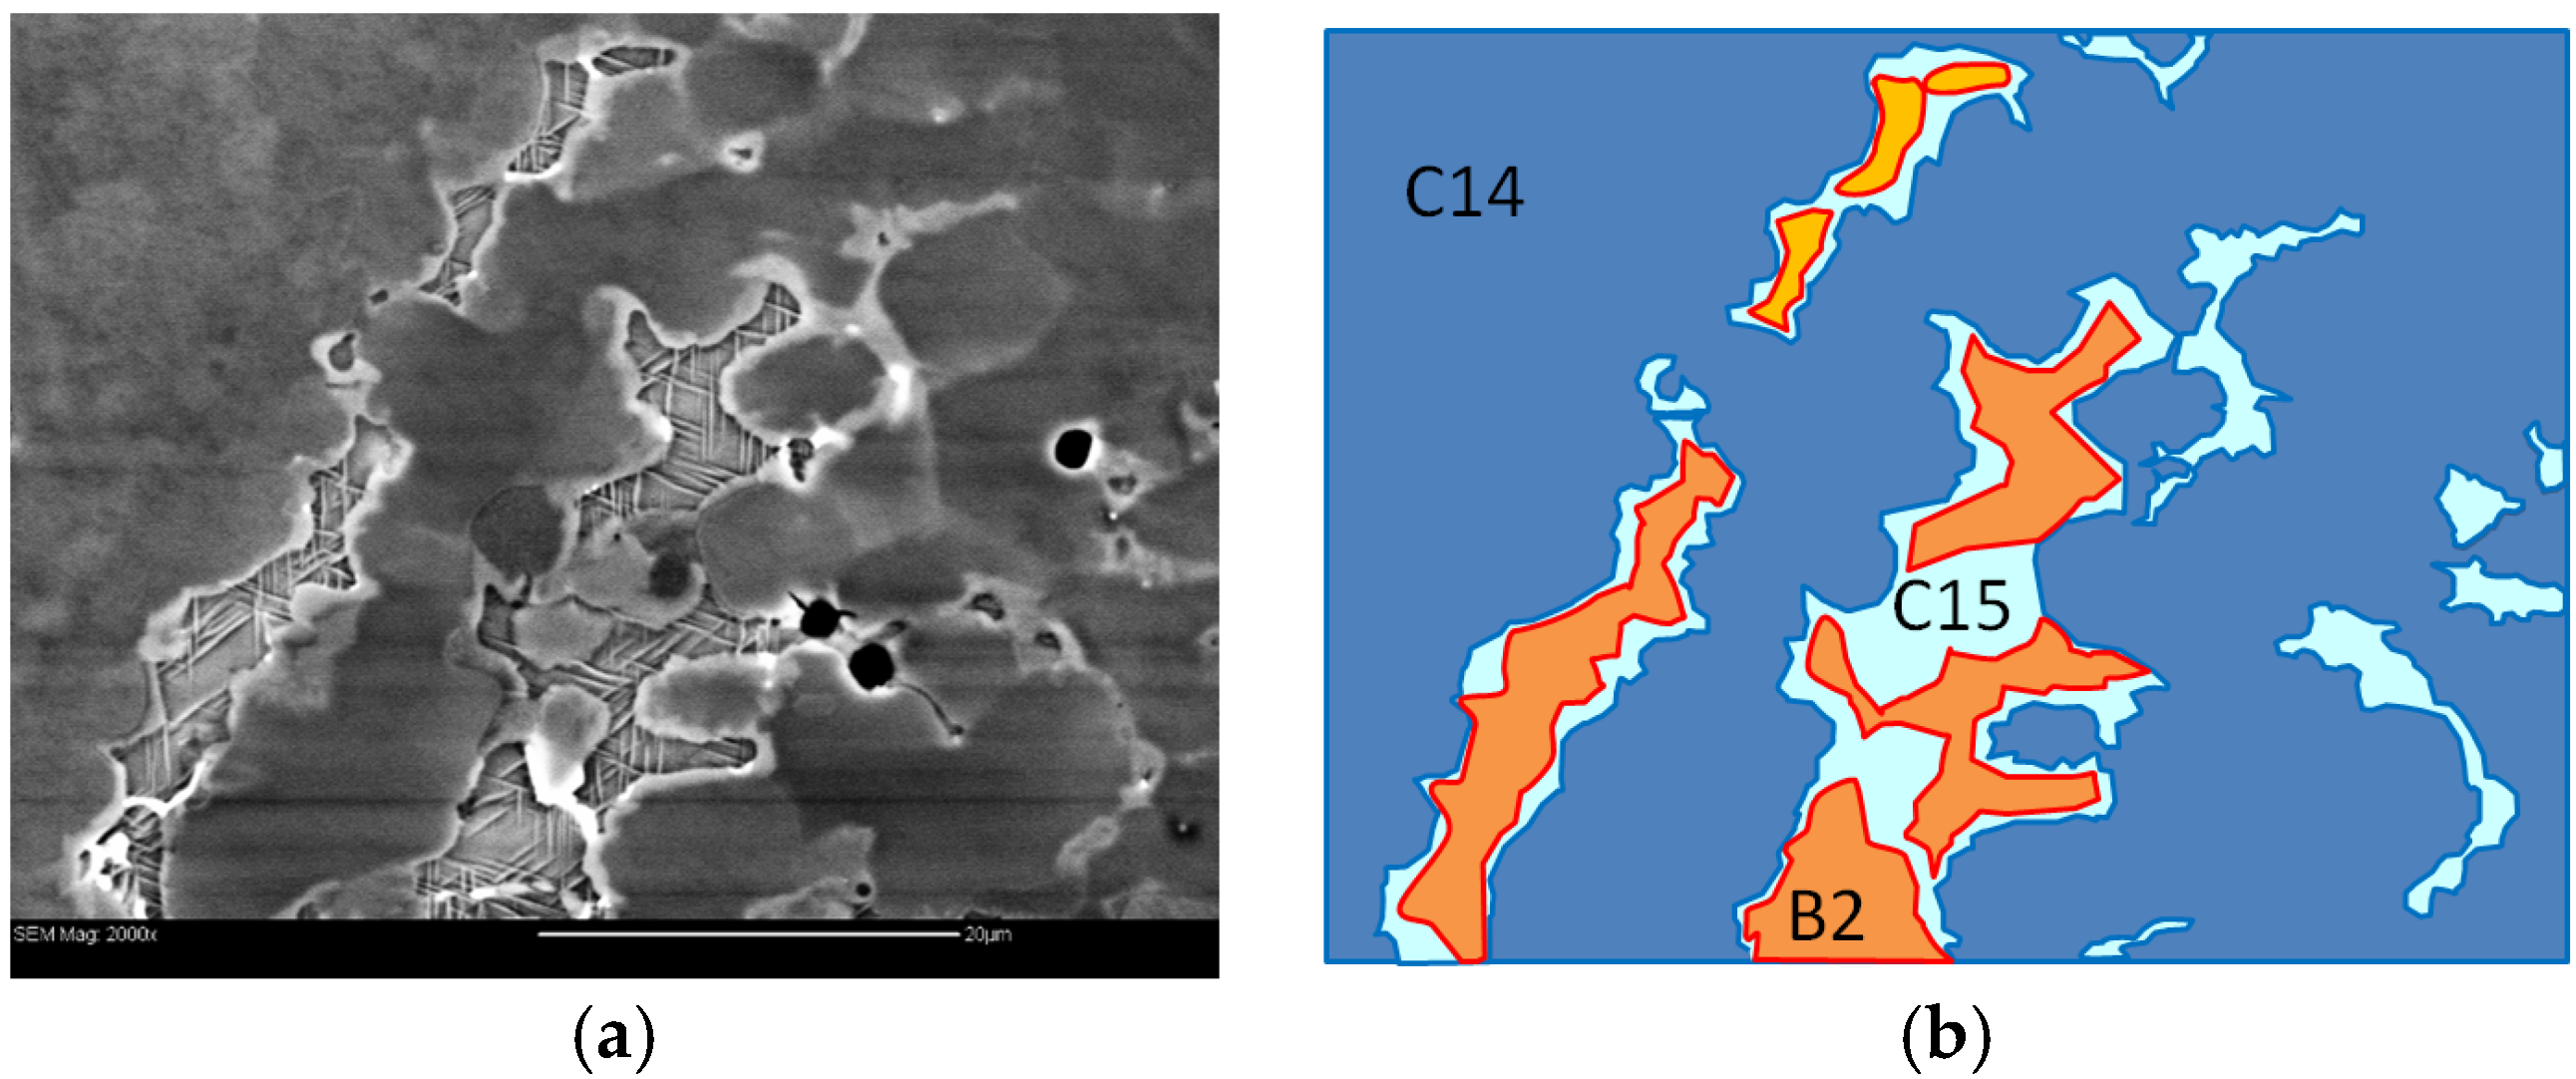
3.2. Laves Phase Based AB2 Alloy
4. Conclusions
Acknowledgments
Author Contributions
Conflicts of Interest
Abbreviations
| MH | Metal hydride |
| bcc | body-centered-cubic |
| fcc | face-centered-cubic |
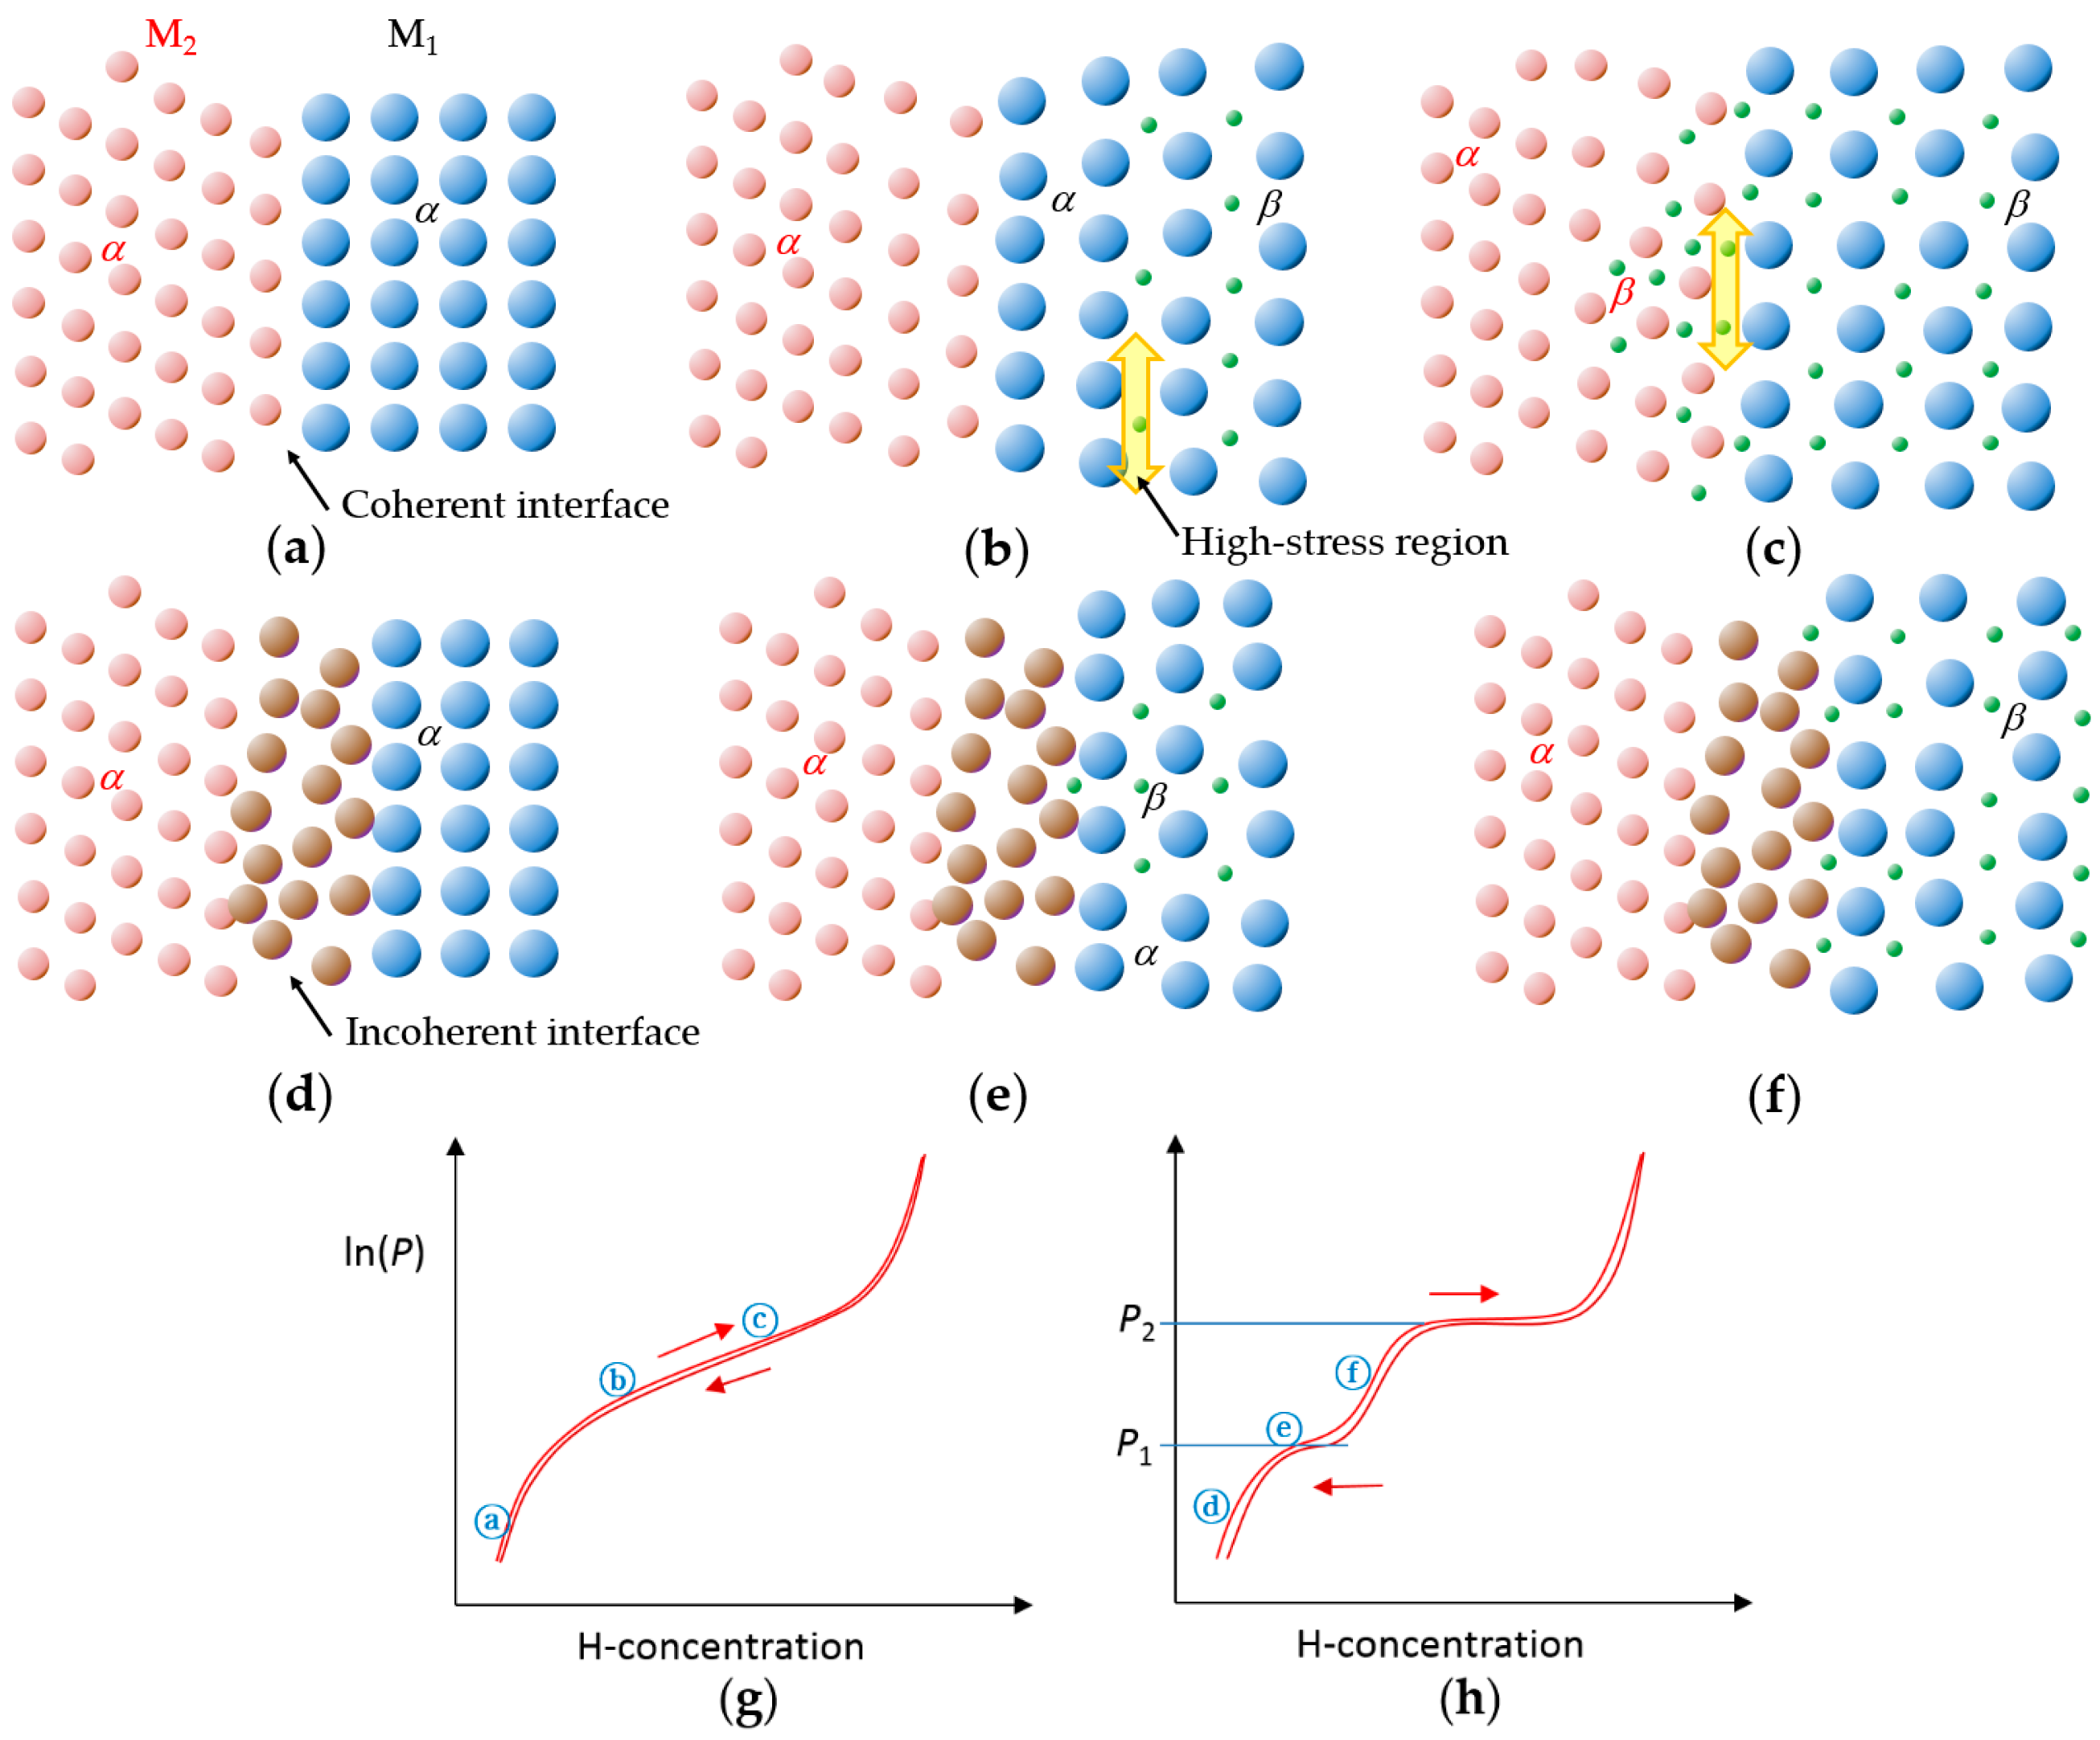
| PCT | Pressure-concentration-temperature |
| SEM | Scanning electron microscopy |
| TEM | Transmission electron microscopy |
| EBSD | Electron backscatter diffraction |
| OIM | Orientation imaging microscopy |
| EDS | X-ray energy dispersive spectroscopy |
| XRD | X-ray diffraction |
| BSE | Backscattered electron |
| ECC | Electron channeling contrast |
References
- Ovshinsky, S.R.; Fetcenko, M.A.; Ross, J. A nickel metal hydride battery for electric vehicles. Science 1993, 260, 176–181. [Google Scholar] [CrossRef] [PubMed]
- Ovshinsky, S.R.; Fetcenko, M.A. Development of high catalytic activity disordered hydrogen-storage alloys for electrochemical application in nickel-metal hydride batteries. Appl. Phys. A 2001, 72, 239–244. [Google Scholar] [CrossRef]
- Bowman, R.C., Jr.; Fultz, B. Metalic hydrides I: Hydrogen storage and other gas-phase application. MRS Bull. 2002, 27, 688–693. [Google Scholar] [CrossRef]
- Joubert, J.M.; Latroche, M.; Percheron-Guegan, A. Metallic hydrides II: Materials for electrochemical storage. MRS Bull. 2002, 27, 694–698. [Google Scholar] [CrossRef]
- Fetcenko, M.A.; Ovshinsky, S.R.; Reichman, B.; Young, K.; Fierro, C.; Koch, J.; Zallen, A.; Mays, W.; Ouchi, T. Recent advances in NiMH battery technology. J. Power Sources 2007, 165, 544–551. [Google Scholar] [CrossRef]
- Fetcenko, M.A.; Ovshinsky, S.R.; Young, K.; Reichman, B.; Fierro, C.; Koch, J.; Martin, F.; Mays, W.; Ouchi, T.; Sommers, B.; et al. High catalytic activity disordered VTiZrNiCrCoMnAlSn hydrogen storage alloys for nickel-metal hydride batteries. J. Alloys Compd. 2002, 330–332, 752–759. [Google Scholar] [CrossRef]
- Young, K.; Ouchi, T.; Koch, J.; Fetcenko, M.A. The role of Mn in C14 Laves phase multi-component alloys for NiMH battery application. J. Alloys Compd. 2009, 477, 749–758. [Google Scholar] [CrossRef]
- Young, K.; Fetcenko, M.A.; Regmi, R.K.; Lawes, G.; Liu, Y. Comparisons of metallic clusters imbedded in the surface oxide of AB2, AB5, and A2B7 alloys. J. Alloys Compd. 2010, 506, 831–840. [Google Scholar] [CrossRef]
- Zhang, W.K.; Ma, C.A.; Yang, X.G.; Lei, Y.Q.; Wang, Q.D.; Lu, G.L. Influences of annealing heat treatment on phase structure and electrochemical properties of Zr(MnVNi)2 hydrogen storage alloys. J. Alloys Compd. 1999, 293–295, 691–697. [Google Scholar] [CrossRef]
- Zhang, Q.A.; Lei, Y.Q.; Yang, X.G.; Du, Y.L.; Wang, Q.D. Effects of annealing treatment on phase structure, hydrogen absorption-desorption characteristics and electrochemical properties of a V3TiNi0.56Hf0.24Mn0.15Cr0.1 alloy. J. Alloys Compd. 2000, 305, 125–129. [Google Scholar] [CrossRef]
- Bououdina, M.; Soubeyroux, J.L.; Fruchart, D. Study of the hydrogenation/dehydrogenation processes of ZrCr0.7Ni1.3, a Laves phase-rich multi-component system, by in-situ neutron diffraction under hydrogen gas pressure. J. Alloys Compd. 2001, 327, 185–194. [Google Scholar] [CrossRef]
- Visintin, A.; Peretti, H.A.; Ruiz, F.; Corso, H.L.; Triaca, W.E. Effect of additional catalytic phases imposed by sintering on the hydrogen absorption behavior of AB2 type Zr-based alloys. J. Alloys Compd. 2007, 428, 244–251. [Google Scholar] [CrossRef]
- Wong, D.F.; Young, K.; Nei, J.; Wang, L.; Ng, K.Y.S. Effects of Nd-addition on the structural, hydrogen storage, and electrochemical properties of C14 metal hydride alloys. J. Alloys Compd. 2015, 647, 507–518. [Google Scholar] [CrossRef]
- Young, K.; Ouchi, T.; Meng, T.; Wong, D.F. Studies on the synergetic effects in multi-phase metal hydride alloys. Batteries 2016, 2. [Google Scholar] [CrossRef]
- Mosavati, N.; Young, K.; Meng, T.; Ng, K.Y.S. Electrochemical open-circuit voltage and pressure-concentration-temperature isotherm comparison for metal hydride alloys. Batteries 2016, 2. [Google Scholar] [CrossRef]
- Iba, H.; Akiba, E. The relation between microstructure and hydrogen absorbing property in Laves phase-solid solution multiphase alloys. J. Alloys Compd. 1995, 231, 508–512. [Google Scholar] [CrossRef]
- Akiba, E.; Iba, H. Hydrogen absorption by Laves phase related BCC solid solution. Intermetallics 1998, 6, 461–470. [Google Scholar] [CrossRef]
- Chen, K.C.; Allen, S.M.; Livingston, J.D. Microstructures of two-phase Ti-Cr alloys containing the TiCr2 Laves phase intermetallic. J. Mater. Res. 1997, 12, 1472–1480. [Google Scholar] [CrossRef]
- Song, X.; Zhang, X.; Lei, Y.; Zhang, Z.; Wang, Q. Effect of microstructure on the properties of Zr-Mn-V-Ni AB2 type hydride electrode alloys. Int. J. Hydrog. Energy 1999, 24, 455–459. [Google Scholar] [CrossRef]
- Song, X.; Zhang, Z.; Zhang, X.; Lei, Y.; Wang, Q. Effect of Ti substitution on the microstructure and properties of Zr-Mn-V-Ni AB2 type hydride electrode alloys. J. Mater. Res. 1999, 14, 1279–1285. [Google Scholar] [CrossRef]
- Song, X.Y.; Chen, Y.; Zhang, Z.; Lei, Y.Q.; Zhang, X.B.; Wang, Q.D. Microstructure and electrochemical properties of Ti-containing AB2 type hydrogen storage electrode alloy. Int. J. Hydrog. Energy 2000, 25, 649–656. [Google Scholar] [CrossRef]
- Shi, Z.; Chumbley, S.; Laabs, F.C. Electron diffraction analysis of an AB2-type Laves phase for hydrogen battery applications. J. Alloys Compd. 2000, 312, 41–52. [Google Scholar] [CrossRef]
- Shibuya, M.; Nakamura, J.; Enoki, H.; Akiba, E. High-pressure hydrogenation properties of Ti-V-Mn alloy for hybrid hydrogen storage vessel. J. Alloys Compd. 2009, 475, 543–545. [Google Scholar] [CrossRef]
- Boettinger, W.J.; Newbury, D.E.; Wang, K.; Bendersky, L.A.; Chiu, C.; Kattner, U.R.; Young, K.; Chao, B. Examination of multiphase (Zr,Ti)(V,Cr,Mn,Ni)2 Ni-MH electrode alloys: Part I. Dendritic solidification structure. Metall. Mater. Trans. 2010, 41, 2033–2047. [Google Scholar] [CrossRef]
- Bendersky, L.A.; Wang, K.; Boettinger, W.J.; Newbury, D.E.; Young, K.; Chao, B. Examination of multiphase (Zr,Ti)(V,Cr,Mn,Ni)2 Ni-MH electrode alloys: Part II. Solid-state transformation of the interdendritic B2 phase. Metall. Mater. Trans. 2010, 41, 1891–1906. [Google Scholar] [CrossRef]
- Park, J.; Lee, J. Thermodynamic properties of the Zr0.8Ti0.2(MnxCr1−x) system. J. Less Common Met. 1991, 167, 245–253. [Google Scholar]
- Lv, J.; Zhang, B.; Wu, Y. Effect of Ni content on microstructural evolution and hydrogen storage properties of MgxNi3La (x = 5, 10, 15, 20 at.%) alloys. J. Alloys Compd. 2015, 641, 176–180. [Google Scholar] [CrossRef]
- Matiland, T.; Sitzman, S. Electron Backscatter Diffraction (EBSD) Technique and Materials Characterizations Examples. In Scanning Microscopy for Nanotechnology Techniques and Applications; Zhou, W., Wang, Z.L., Eds.; Springer: New York, NY, USA, 2007. [Google Scholar]
- Young, K.; Ouchi, T.; Liu, Y.; Reichman, B.; Mays, W.; Fetcenko, M.A. Structural and electrochemical properties of TixZr7−xNi10. J. Alloys Compd. 2009, 480, 521–528. [Google Scholar] [CrossRef]
- Shen, H.; Young, K.; Meng, T.; Bendersky, L.A. Clean grain boundary found in C14/body-center-cubic multi-phase metal hydride alloys. Batteries 2016, 2. [Google Scholar] [CrossRef]
- NIH Image Home Page. Available online: http://rsb.info.nih.gov/nih-image/ (accessed on 21 April 2006).
- Young, K.; Ouchi, T.; Fetcenko, M.A. Roles of Ni, Cr, Mn, Sn, Co, and Al in C14 Laves phase alloys for NiMH battery application. J. Alloys Compd. 2009, 476, 774–781. [Google Scholar] [CrossRef]
- Reed-Hill, R.E. Physical Metallurgy Principles, 2nd ed.; Van Nostrand Company: Princeton, NJ, USA, 1973. [Google Scholar]
- Friauf, J.B. The crystal structure of magnesium di-zincide. Phys. Rev. 1927, 29, 34–40. [Google Scholar] [CrossRef]
- Friauf, J.B. The crystal structures of two intermetallic compounds. J. Am. Chem. Soc. 1927, 49, 3107–3114. [Google Scholar] [CrossRef]
- Nakano, H.; Wakao, S.; Shimizu, T. Correlation between crystal structure and electrochemical properties of C14 Laves-phase alloys. J. Alloys Compd. 1997, 253–254, 609–612. [Google Scholar] [CrossRef]
- Zhu, J.H.; Liu, C.T.; Pike, L.M.; Liaw, P.K. Enthalpies of formation of binary Laves phases. Intermetallics 2002, 10, 579–595. [Google Scholar] [CrossRef]
- Zhu, J.H.; Liaw, P.K.; Liu, C.T. Effect of electron concentration on the phase stability of NbCr2-based Laves phase alloys. Mater. Sci. Eng. 1997, 239–240, 260–264. [Google Scholar] [CrossRef]
- Stein, F.; Palm, M.; Sauthoff, G. Structure and stability of Laves phases. Part 1. Critical assessment of factors controlling Laves phase stability. Intermetallics 2004, 12, 713–720. [Google Scholar] [CrossRef]
- Hu, Y.; Vasiliev, A.; Zhang, L.; Song, K.; Aindow, M. Polymorphism in the Laves-phase precipitates of a quinternary Nb-Mo-Cr-Al-Si alloy. Scr. Mater. 2009, 60, 72–75. [Google Scholar] [CrossRef]
- Zhang, Q.A.; Lei, Y.Q.; Yang, X.G.; Ren, K.; Wang, Q.D. Annealing treatment of AB2-type hydrogen storage alloys: I. crystal structure. J. Alloys Compd. 1999, 292, 236–240. [Google Scholar] [CrossRef]
- Shu, K.; Lei, Y.; Yang, X.; Liu, G.; Wang, Q.; Lu, G.; Chen, L. Effect of rapid solidification process on the alloy structure and electrode performance of Zr(Ni0.55V0.1Mn0.3Cr0.55)2.1. J. Alloys Compd. 1999, 293–295, 756–761. [Google Scholar] [CrossRef]
- Takasugi, T.; Yoshida, M. The effect of ternary addition on structure and stability of NbCr2 Laves phases. J. Mater. Res. 1998, 13, 2505–2513. [Google Scholar] [CrossRef]
- Kumar, K.S.; Hazzledine, P.M. Polytypic transformation in Laves phases. Intermetallics 2004, 12, 763–770. [Google Scholar] [CrossRef]
- Yoshida, M.; Takasugi, T. TEM observation for deformation microstructures of two C15 NbCr2 intermetallic compounds. Intermetallics 2002, 10, 85–93. [Google Scholar] [CrossRef]
- Zhou, O.; Yao, Q.; Sun, J.; Smith, D.J. Effect of V addition on the structure of ZrCr2 Laves phase: A high-resolution transmission electron microscope study. Philos. Mag. Lett. 2006, 86, 347–354. [Google Scholar] [CrossRef]
- Massalski, T.B. Binary Alloy Phase Diagrams; ASM International: Materials Park, OH, USA, 1990. [Google Scholar]
- Chang, S.; Young, K.; Ouchi, T.; Meng, T.; Nei, J.; Wu, X. Studies on incorporation of Mg in Zr-based AB2 metal hydride alloys. Batteries 2016, 2. [Google Scholar] [CrossRef]
- Young, K.; Ouchi, T.; Nei, J.; Moghe, D. The importance of rare-earth additions in Zr-based AB2 metal hydride alloys. Batteries 2016, 2. [Google Scholar] [CrossRef]
- Zhang, Q.A.; Lei, Y.Q.; Yang, X.G.; Ren, K.; Wang, Q.D. Annealing treatment of AB2-type hydrogen storage alloys: II. Electrochemical properties. J. Alloys Compd. 1999, 292, 241–246. [Google Scholar] [CrossRef]
- Bououdina, M.; Lenain, C.; Aymard, L.; Soubeyroux, J.L.; Fruchart, D. The effects of heat treatments on the microstructure and electrochemical properties of the ZrCr0.7Ni1.3 multiphase alloy. J. Alloys Compd. 2001, 327, 178–184. [Google Scholar] [CrossRef]
- Young, K.; Ouchi, T.; Huang, B.; Chao, B.; Fetcenko, M.A.; Bendersky, L.A.; Wang, K.; Chiu, C. The correlation of C14/C15 phase abundance and electrochemical properties in the AB2 alloys. J. Alloys Compd. 2010, 506, 841–848. [Google Scholar] [CrossRef]
- Nei, J.; Young, K.; Salley, S.O.; Ng, K.Y.S. Effects of annealing on Zr8Ni19X2 (X = Ni, Mg, Al, Sc, V, Mn, Co, Sn, La, and Hf): Hydrogen storage and electrochemical properties. Int. J. Hydrog. Energy 2012, 37, 8418–8427. [Google Scholar] [CrossRef]
- Young, K.; Chao, B.; Huang, B.; Nei, J. Studies on the hydrogen storage characteristic of La1−xCex(NiCoMnAlCuSiZr)5.7 with a B2 secondary phase. J. Alloys Compd. 2014, 585, 760–770. [Google Scholar] [CrossRef]


| Alloy | Major Phase | Minor Phase(s) | Gaseous Phase Storage @30 °C (wt%) | Electrochemical Capacity (mAh·g−1) | High-Rate Dischargeability |
|---|---|---|---|---|---|
| ZN06 | Zr7Ni10 | C15 | 1.12 | 186 | 0.74 |
| AB2#2 | C14 | C15, Zr7Ni10, Zr9Ni11, ZrNi | 1.66 | 384 | 0.98 |
| Location | Ti | Zr | Ni | B/A Ratio |
|---|---|---|---|---|
| 1 | 12.65 | 32.30 | 55.05 | 1.224 |
| 2 | 12.83 | 31.76 | 55.40 | 1.242 |
| 3 | 12.75 | 31.88 | 55.37 | 1.241 |
| 4 | 12.44 | 32.43 | 55.13 | 1.229 |
| 5 | 12.08 | 32.65 | 55.26 | 1.235 |
| Standard deviation (%) | 2.1 | 1.0 | 0.24 | 0.55 |
| Region | Ti | Zr | V | Cr | Mn | Co | Ni | B/A Ratio |
|---|---|---|---|---|---|---|---|---|
| Grey | 10.2 | 22.0 | 11.5 | 6.6 | 15.5 | 2.2 | 32.0 | 2.11 |
| Dark | 11.1 | 21.8 | 10.7 | 5.6 | 14.6 | 2.2 | 34.1 | 2.03 |
| Second Phase | 18.5 | 21.2 | 3.8 | 1.7 | 7.1 | 1.6 | 46.1 | 1.29 |
© 2016 by the authors; licensee MDPI, Basel, Switzerland. This article is an open access article distributed under the terms and conditions of the Creative Commons Attribution (CC-BY) license (http://creativecommons.org/licenses/by/4.0/).
Share and Cite
Liu, Y.; Young, K.-H. Microstructure Investigation on Metal Hydride Alloys by Electron Backscatter Diffraction Technique. Batteries 2016, 2, 26. https://doi.org/10.3390/batteries2030026
Liu Y, Young K-H. Microstructure Investigation on Metal Hydride Alloys by Electron Backscatter Diffraction Technique. Batteries. 2016; 2(3):26. https://doi.org/10.3390/batteries2030026
Chicago/Turabian StyleLiu, Yi, and Kwo-Hsiung Young. 2016. "Microstructure Investigation on Metal Hydride Alloys by Electron Backscatter Diffraction Technique" Batteries 2, no. 3: 26. https://doi.org/10.3390/batteries2030026