Article

The Importance of Rare-Earth Additions in Zr-Based AB2 Metal Hydride Alloys

1
Department of Chemical Engineering and Materials Science, Wayne State University, Detroit, MI 48202, USA
2
BASF/Battery Materials-Ovonic, 2983 Waterview Drive, Rochester Hills, MI 48309, USA
3
Department of Chemical Engineering and Materials Science, Michigan State University, East Lansing, MI 48824, USA
*
Author to whom correspondence should be addressed.
Batteries 2016, 2(3), 25; https://doi.org/10.3390/batteries2030025
Submission received: 28 April 2016 / Revised: 20 June 2016 / Accepted: 4 July 2016 / Published: 11 July 2016
(This article belongs to the Special Issue Nickel Metal Hydride Batteries)

Abstract

:
Effects of substitutions of rare earth (RE) elements (Y, La, Ce, and Nd) to the Zr-based AB2 multi-phase metal hydride (MH) alloys on the structure, gaseous phase hydrogen storage (H-storage), and electrochemical properties were studied and compared. Solubilities of the RE atoms in the main Laves phases (C14 and C15) are very low, and therefore the main contributions of the RE additives are through the formation of the RENi phase and change in TiNi phase abundance. Both the RENi and TiNi phases are found to facilitate the bulk diffusion of hydrogen but impede the surface reaction. The former is very effective in improving the activation behaviors. −40 °C performances of the Ce-doped alloys are slightly better than the Nd-doped alloys but not as good as those of the La-doped alloys, which gained the improvement through a different mechanism. While the improvement in ultra-low-temperature performance of the Ce-containing alloys can be associated with a larger amount of metallic Ni-clusters embedded in the surface oxide, the improvement in the La-containing alloys originates from the clean alloy/oxide interface as shown in an earlier transmission electron microscopy study. Overall, the substitution of 1 at% Ce to partially replace Zr gives the best electrochemical performances (capacity, rate, and activation) and is recommended for all the AB2 MH alloys for electrochemical applications.

Graphical Abstract

1. Introduction

Nickel/metal hydride (Ni/MH) rechargeable batteries have been extensively used to replace Ni/Cd rechargeable and alkaline primary batteries in the consumer electronics market. In addition, Ni/MH batteries also dominate the hybrid electric vehicle market [1] and are found in stationary applications [2,3]. Although the volumetric energy density of Ni/MH battery is good, its gravimetric energy density is only one third of that of its Li-ion rival. Therefore, Laves phase AB2 metal hydride (MH) alloys have been proposed to replace the currently used rare earth (RE) element-based AB5 MH alloys to achieve an increase in capacity of the negative electrode [4,5]. Besides its relatively high capacity (420 mAh·g1 [6] versus 330 mAh·g1 of AB5), alloy design for AB2 also has a higher flexibility in constituent elements and phases, making it more adaptable to various requirements, including low cost, ultra-low-temperature operation [7,8], and high-temperature storage [9]. RE elements, such as Y, La, Ce, Pr, and Nd, were added in the AB2 MH alloys in the early days to improve activation behavior of the negative electrode [10,11,12,13,14,15]. Recently, we reported our works of adding Y [7,8,16], La [17], and Nd [18] in the AB2 MH alloys and observed a substantial improvement in −40 °C electrochemical performance. In this paper, results from the partial substitution of Zr by Ce in the AB2 MH alloys are presented in detail and are compared to those obtained from the AB2 MH alloys substituted with Y, La, and Nd.

2. Experimental Setup

Ingot samples were prepared by arc melting under a 0.08 MPa Ar protection atmosphere. Samples were flipped five times during the melting–cooling procedure to ensure homogeneity, and they then underwent a hydriding/dehydriding process, which introduced volume expansion/contraction and consequently damages to the crystal structure, leading to an increase in brittleness of the samples before they were crushed and grounded into −200 mesh powder. We used a Varian Liberty 100 inductively coupled plasma-optical emission spectrometer (ICP-OES, Agilent Technologies, Santa Clara, CA, USA) to study the chemical composition, a Philips X’Pert Pro X-ray diffractometer (XRD, Amsterdam, The Netherlands) to perform phase analysis, a JEOL-JSM6320F scanning electron microscope (SEM, Tokyo, Japan) with energy dispersive spectroscopy (EDS) to investigate the phase distribution and composition, and a Suzuki-Shokan multi-channel pressure–concentration–temperature (PCT, Tokyo, Japan) system to measure the gaseous phase hydrogen storage (H-storage) characteristics. PCT measurements at 30, 60, and 90 °C were performed after activation, which was a 2 h thermal cycle between room temperature and 300 °C under 2.5 MPa H2 pressure. Details of the electrode and cell preparations, as well as the electrochemical measurement methods, are as previously reported [19,20]. We used a Solartron 1250 Frequency Response Analyzer (Solartron Analytical, Leicester, UK) with a sine wave amplitude of 10 mV and a frequency range of 0.5 mHz–10 kHz to conduct the AC impedance measurements and a Digital Measurement Systems Model 880 vibrating sample magnetometer (MicroSense, Lowell, MA, USA) to measure the magnetic susceptibility (M.S.) of the activated alloy surfaces (4 h in 100 °C 30 wt% KOH solution).

3. Property Comparison of Elements and Intermetallic Compounds of Y, La, Ce, Pr, and Nd

Several important properties of Y, La, Ce, Pr, and Nd elements and their intermetallic compounds (RENi and RENi5) with Ni are listed in Table 1. The name “rare earth” originated from the difficult nature in separating one element from another in the ore deposits but not the scarcity. Indeed, Ce is as abundant as Cu in the earth’s crust [21]. Compared to the other RE elements, Ce has an additional common 4+ oxidation state [22], which is a perfect example of Hund’s rule that states the empty, half-filled, and completely filled electronic levels tend to be at more stable states [23]. Therefore, Ce is different from others with regards to several properties, such as the RE melting point (M.P.), hydroxide and RENi5 heats of formation, RENi5 unit cell volume, and RENi5 plateau pressure. Furthermore, in MH alloy formula design of the misch metal-based AB5/A2B4 stacking superlattice MH alloys, Ce is not incorporated [24] due to its small radius, which cannot maintain the lattice constant in the AB5 slab and promotes the formation of the AB2 phase [25].
Comparing the stabilities of RE(OH)3 compounds, represented by their heats of formation (Table 1), reveals that Ce(OH)3 and Y(OH)3 are less stable than the other hydroxides. Also, the ease of oxidation can be judged based on the oxidation potentials of the RE elements (Table 1) and is in the order of Y ≈ La > Pr > Ce > Nd. Solubility of RE(OH)3 can be represented by the constant A in Equation (1):
2RE3+ + 3H2O ⇄ RE2O3 + 6H+, log (RE3+) = A − 3pH
and is in the order of La > Pr > Ce > Nd > Y. Moreover, SEM pictures of the A2B7 and AB5 alloys with La or Nd show the difference in surface morphology: small needles of La(OH)3 covering the entire surface versus large rods of Nd(OH)3 covering any surface with open space [26].
Judging from the comparison of heats of formation for La3Ni (−13), LaNi (−24.8), LaNi2 (−20), LaNi3 (−21), La2Ni7 (−24), and LaNi5 (−21 kJ·mol−1) [41,42], the RE-Ni intermetallic compounds are relatively easy to form. In addition, theoretical calculation results of the heats of formation for both the Ce-Ni [39] and Nd-Ni [46] intermetallic compounds show a minimum at 1:1 stoichiometry (RENi). RENi is commonly found in the RE-doped Laves phase AB2 MH alloys as a segregated phase [7,8,12,16,17,18] since the larger radius of the RE atom does not fit into the atomic radius ratio range for the Laves phases (atomic radius ratio of the A to B atoms between 1.05 and 1.68) [47]. Crystal structure of YNi (FeB-type) is slightly different from the other RENi intermetallic compounds (CrB-type) [48]. While both types are composed of trigonal prisms with the RE atoms occupying the eight corners and Ni forming a zigzag chain, the placement of these prisms is in either the CrB or FeB structure (Figure 1). Previously, some RENi alloys have been studied as H-storage alloys (YNiH3 and YNiH4 [49], LaNiH3 [50,51], CeNiH2.9 [52], CeNiH4 [53], and PrNiH4.3 [53]).

4. Results and Discussion

Results from the Y- [7], La- [17], and Nd- [18] substitutions have been previously published. In this paper, new data from the Ce-substitution are organized and presented. Five alloys with different Ce-contents were made by arc melting. Their design compositions are listed in Table 2. The base Ce-free alloy, Ce0 (Ti12Zr22.8V10Cr7.5Mn8.1Co7.0Ni32.2Co0.4), is the same base alloy used in the La- [17] and Nd- [18] substitution studies and a high-rate derivative of the base alloy in the Y-substitution study, Y0 (Ti12Zr21.5V10Cr7.5Mn8.1Co8.0Ni32.2Sn0.3Co0.4) [7]. Compared to alloy Y0, alloy Ce0 contains 1.3 at% higher Zn-content, 1.0 at% lower Co-content, and no Sn. ICP results of the current batch of alloys (alloys Ce0 to Ce5) are also listed in Table 2 for comparison. Most samples show very close compositions to the design values with the exception of a slight deficiency in Cr observed in alloy Ce2. Inconsistent uniformity of Cr in the AB2 MH alloy has been seen previously [17]. Comparing among Zr, V, and Cr, which are the higher-content elements with the highest melting points, Cr has the highest eutectic temperature with Ni (1345 °C, 960 °C for Zr-Ni, and 1202 °C for V-Ni) [38]. Therefore, Cr’s distribution may not be as consistently uniform compared to the other constituent elements among alloys. In combination with the small sample size for ICP, the sampling from alloy Ce2 may exclude a Cr-rich region that is not dissolved in the main phases and results in the observed lower Cr-content compared to the design composition. Average electron densities (e/a) of these alloys are just slightly under the C14/C15 threshold (6.83) [54], so a C14-predominating microstructure is predicted. The B/A ratios are slightly over the design value (1.87) due to the loss of Zr during slag formation. The slight hypo-stoichiometry design is used to balance between the degree of disorder (DOD, from the secondary phase abundances) and electrochemical properties [55].

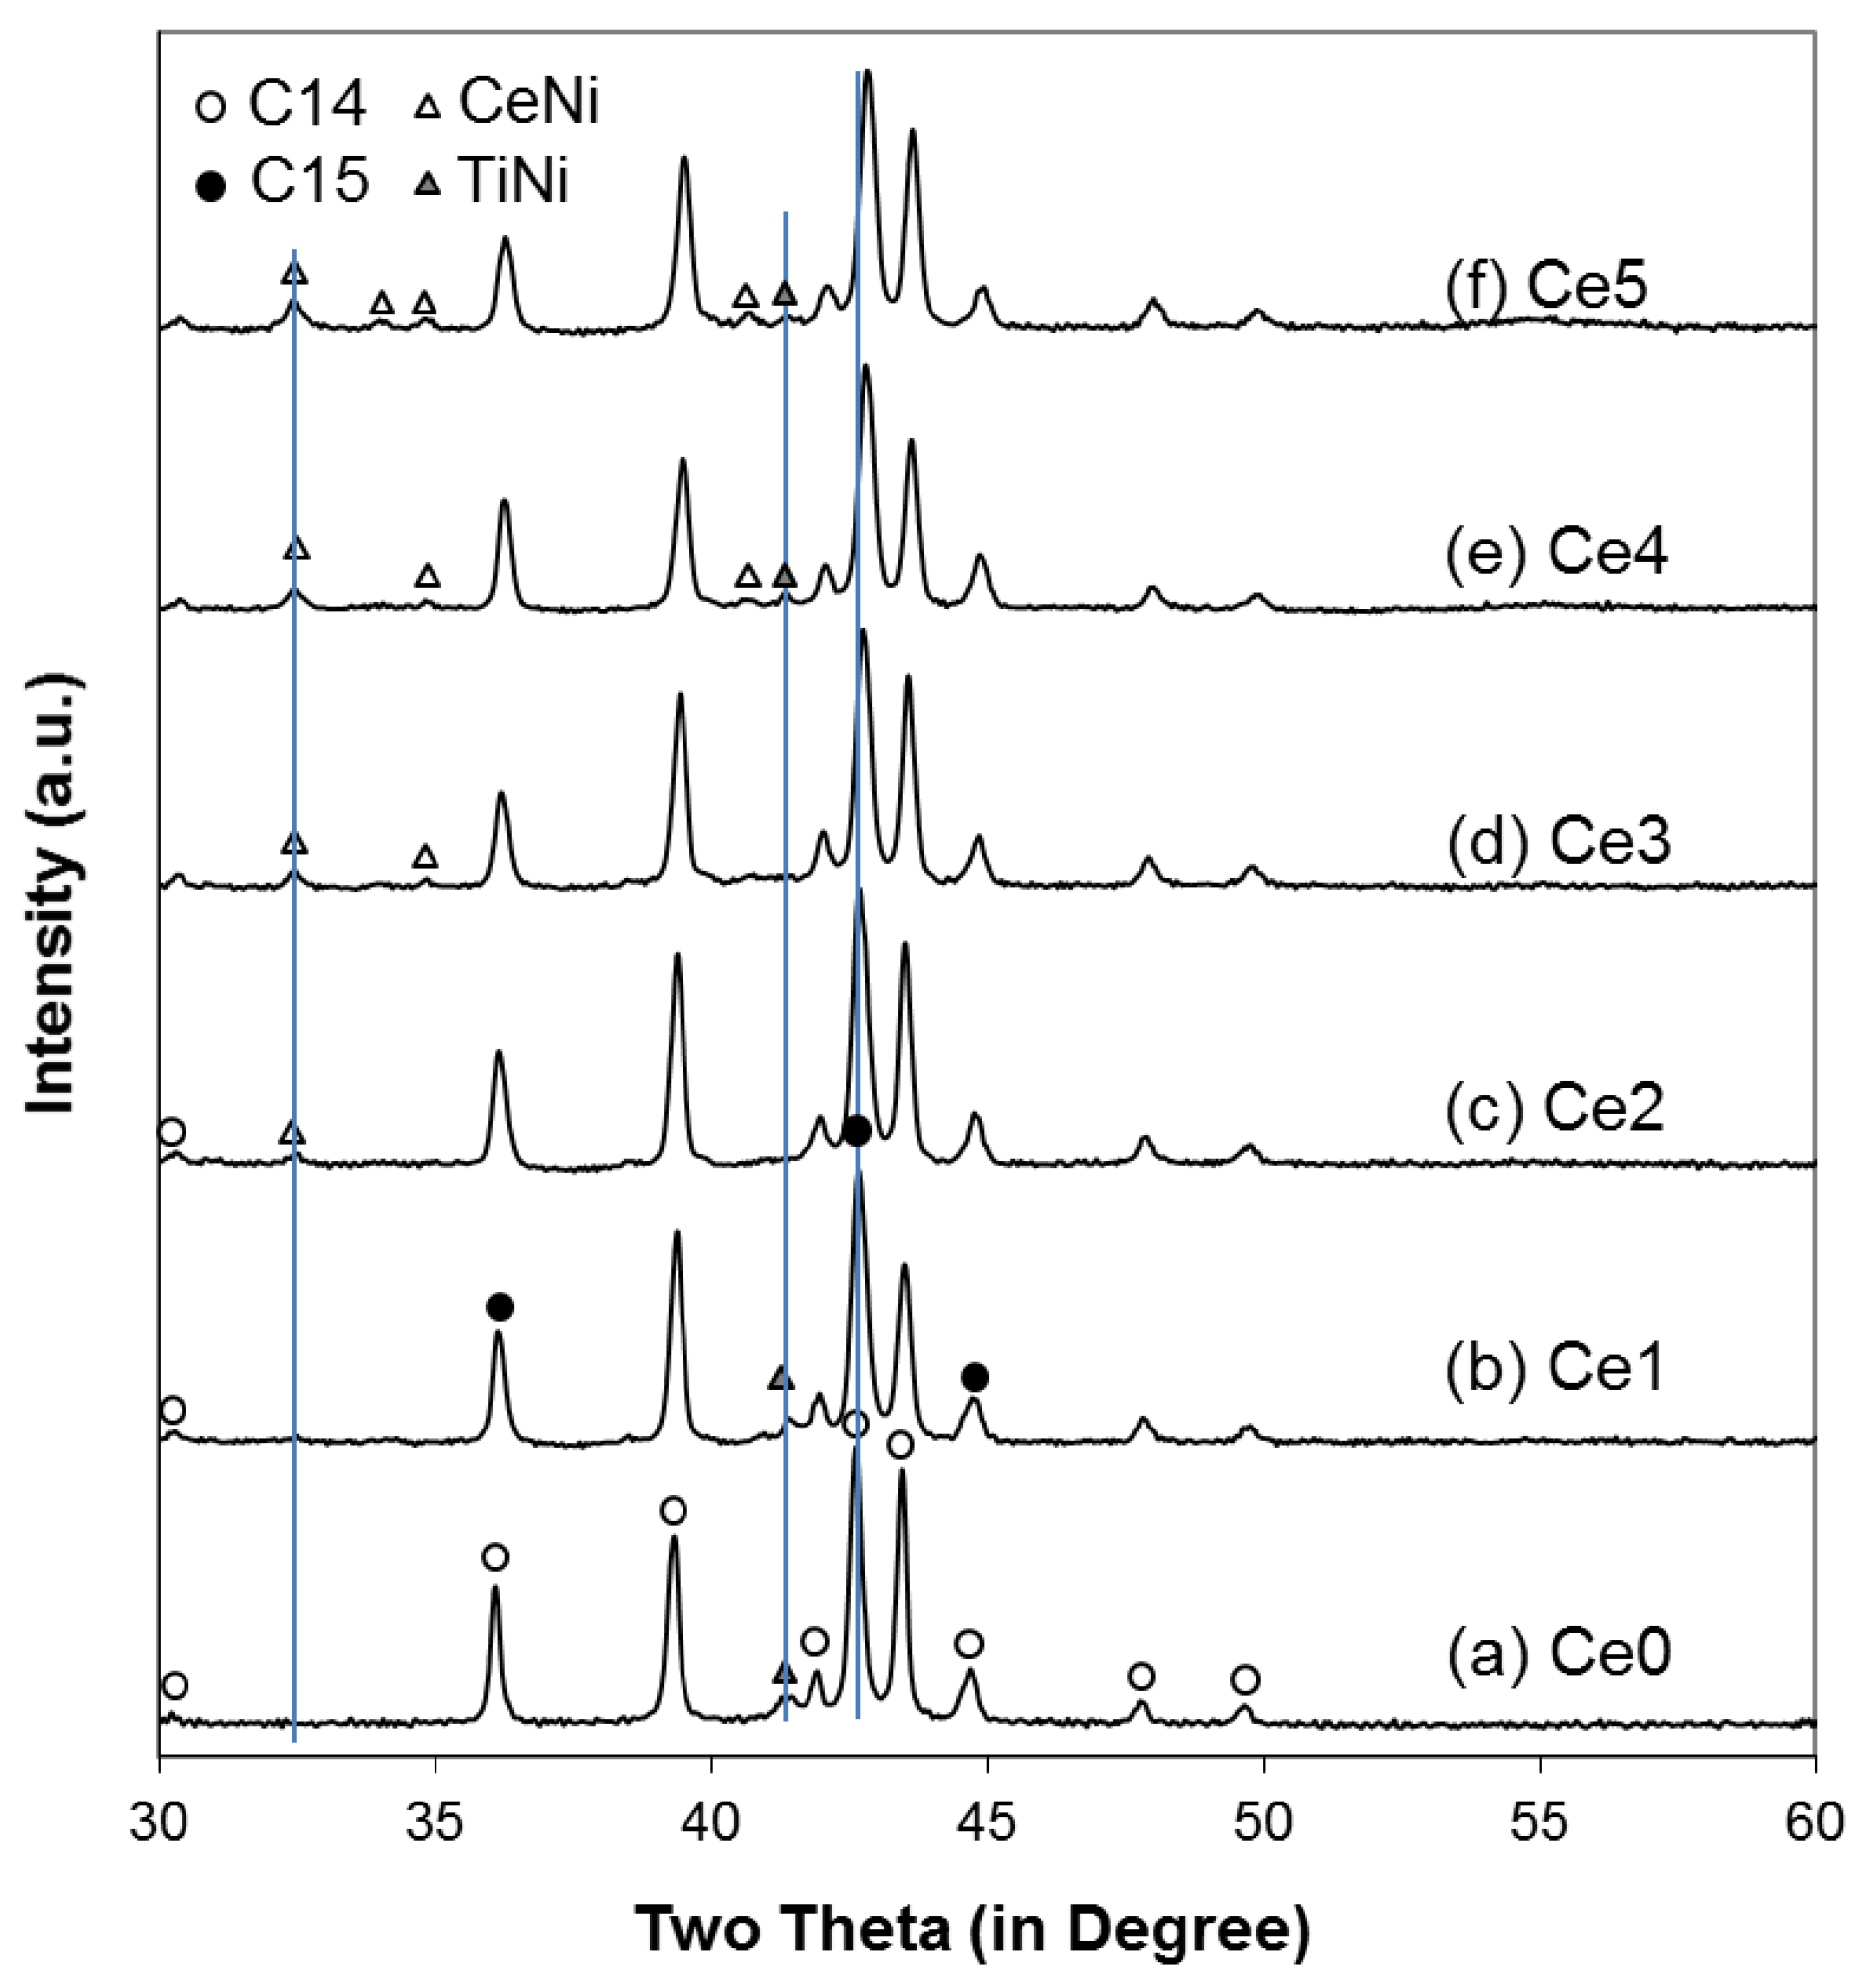
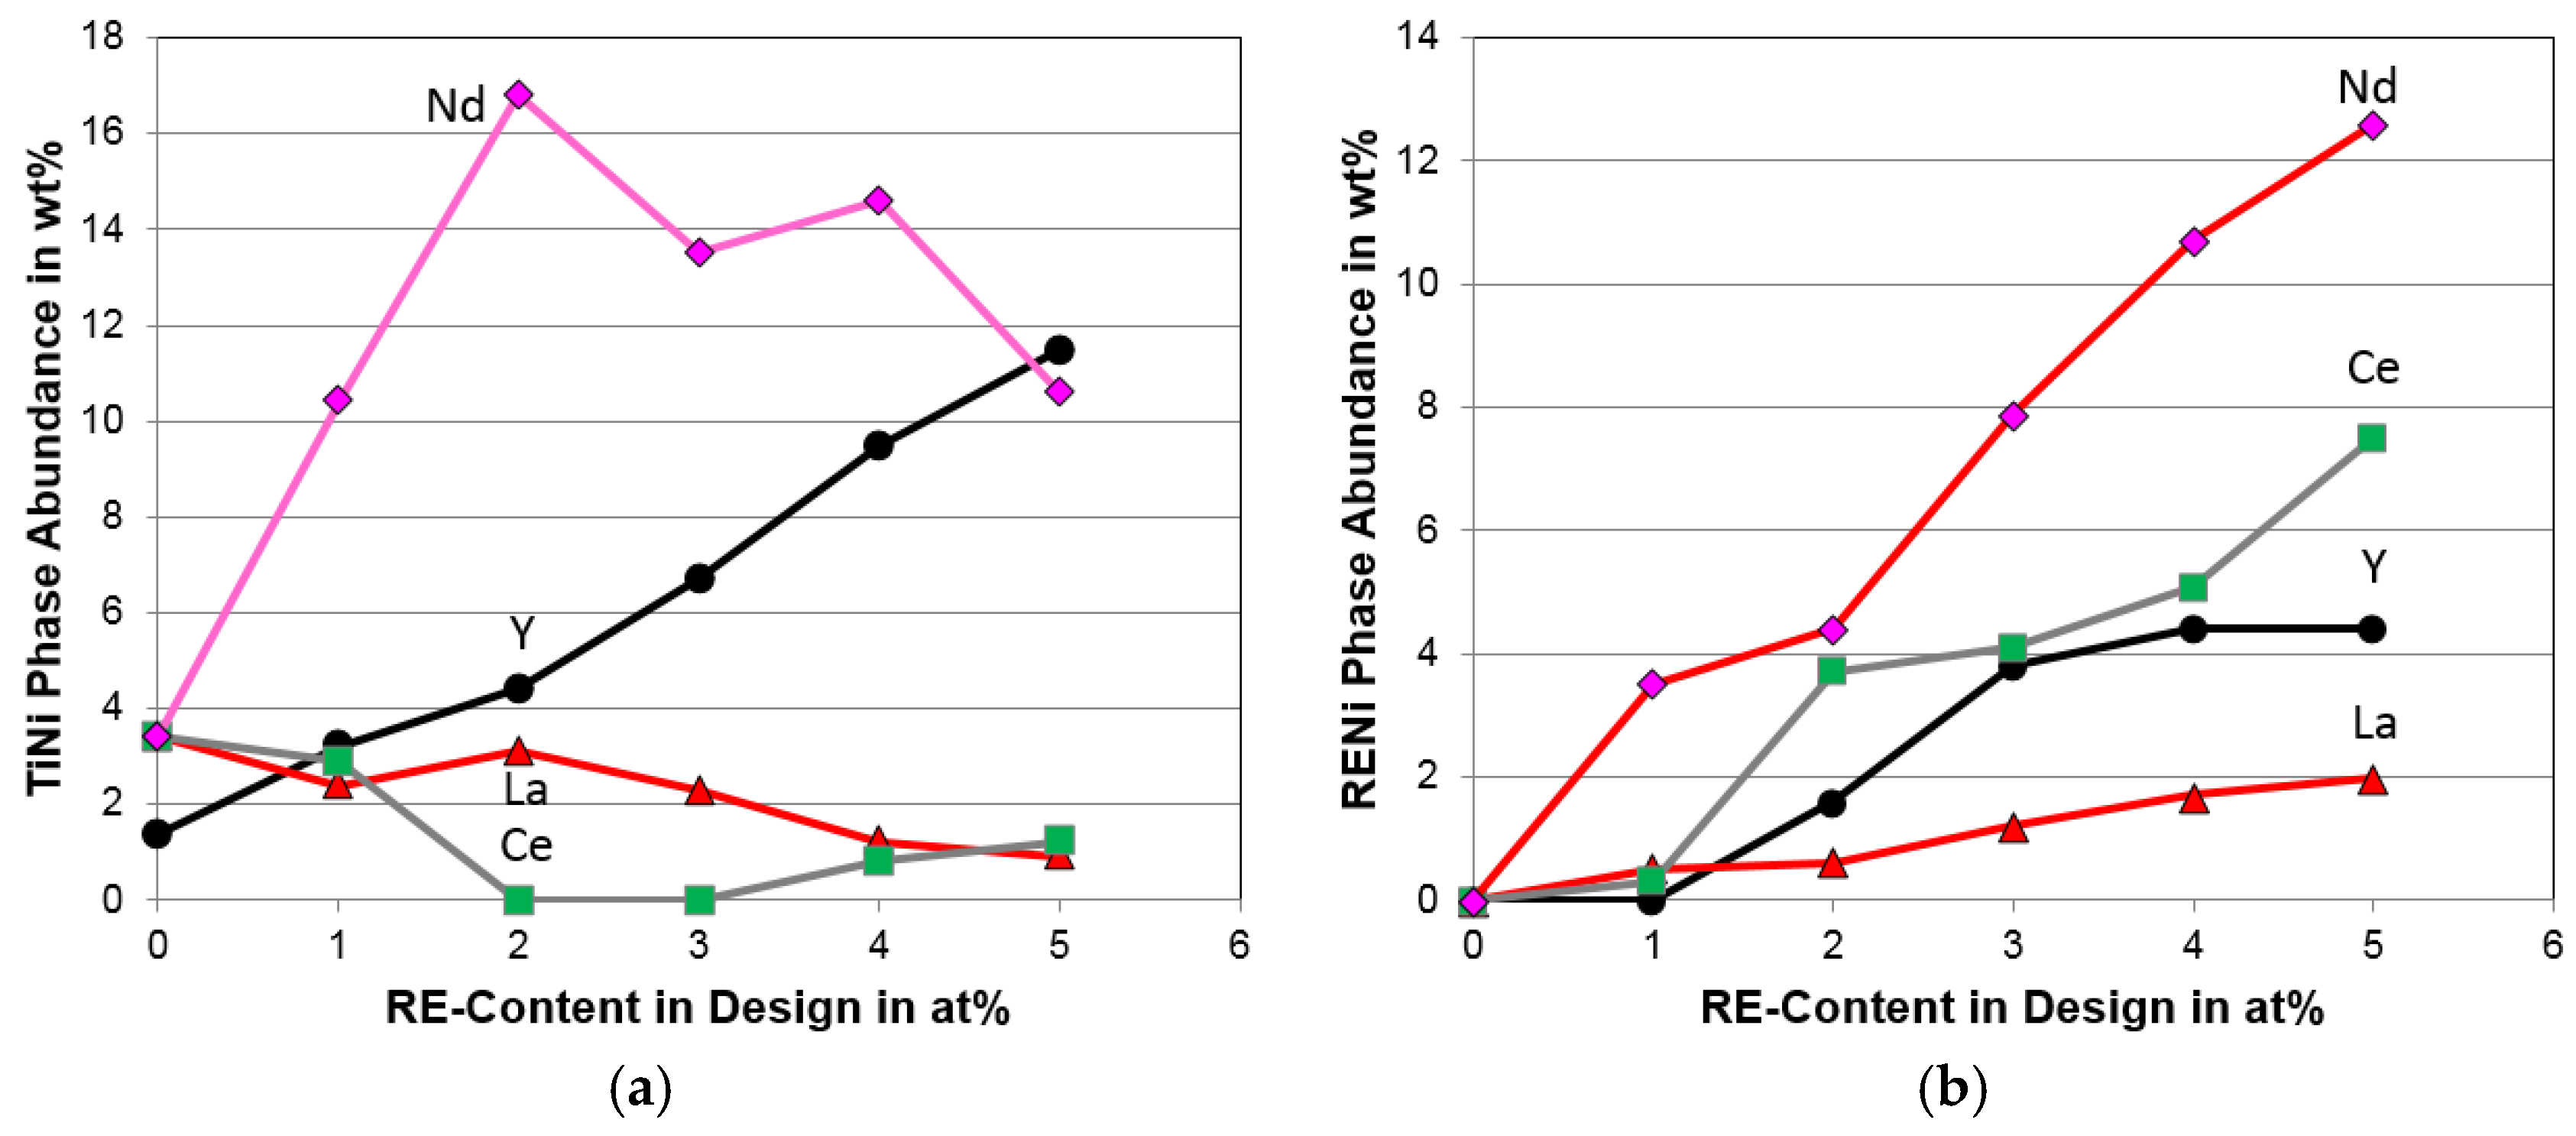
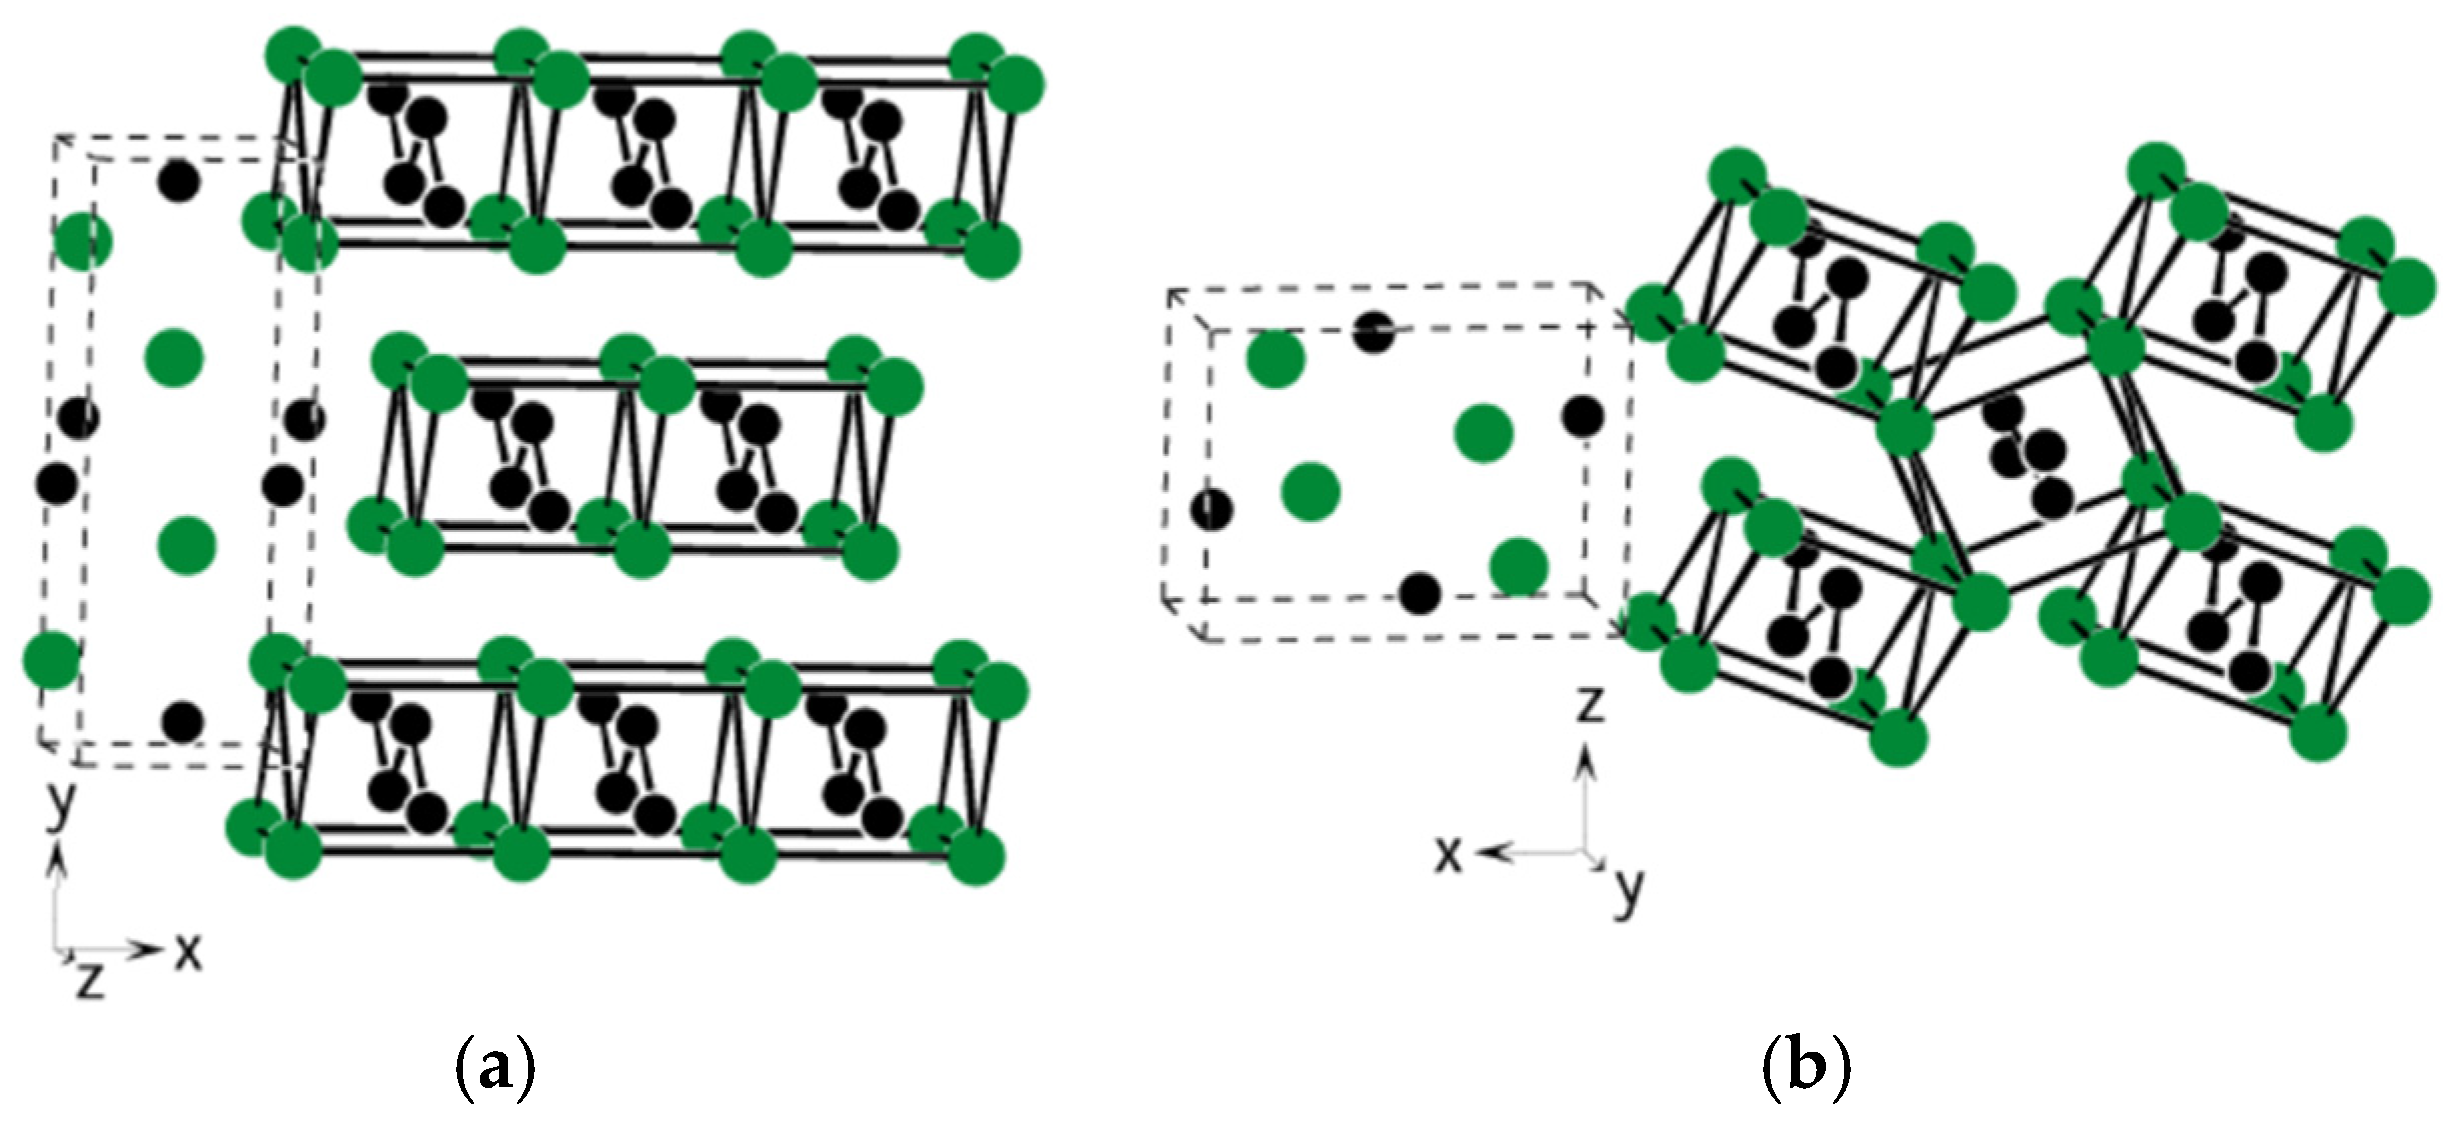
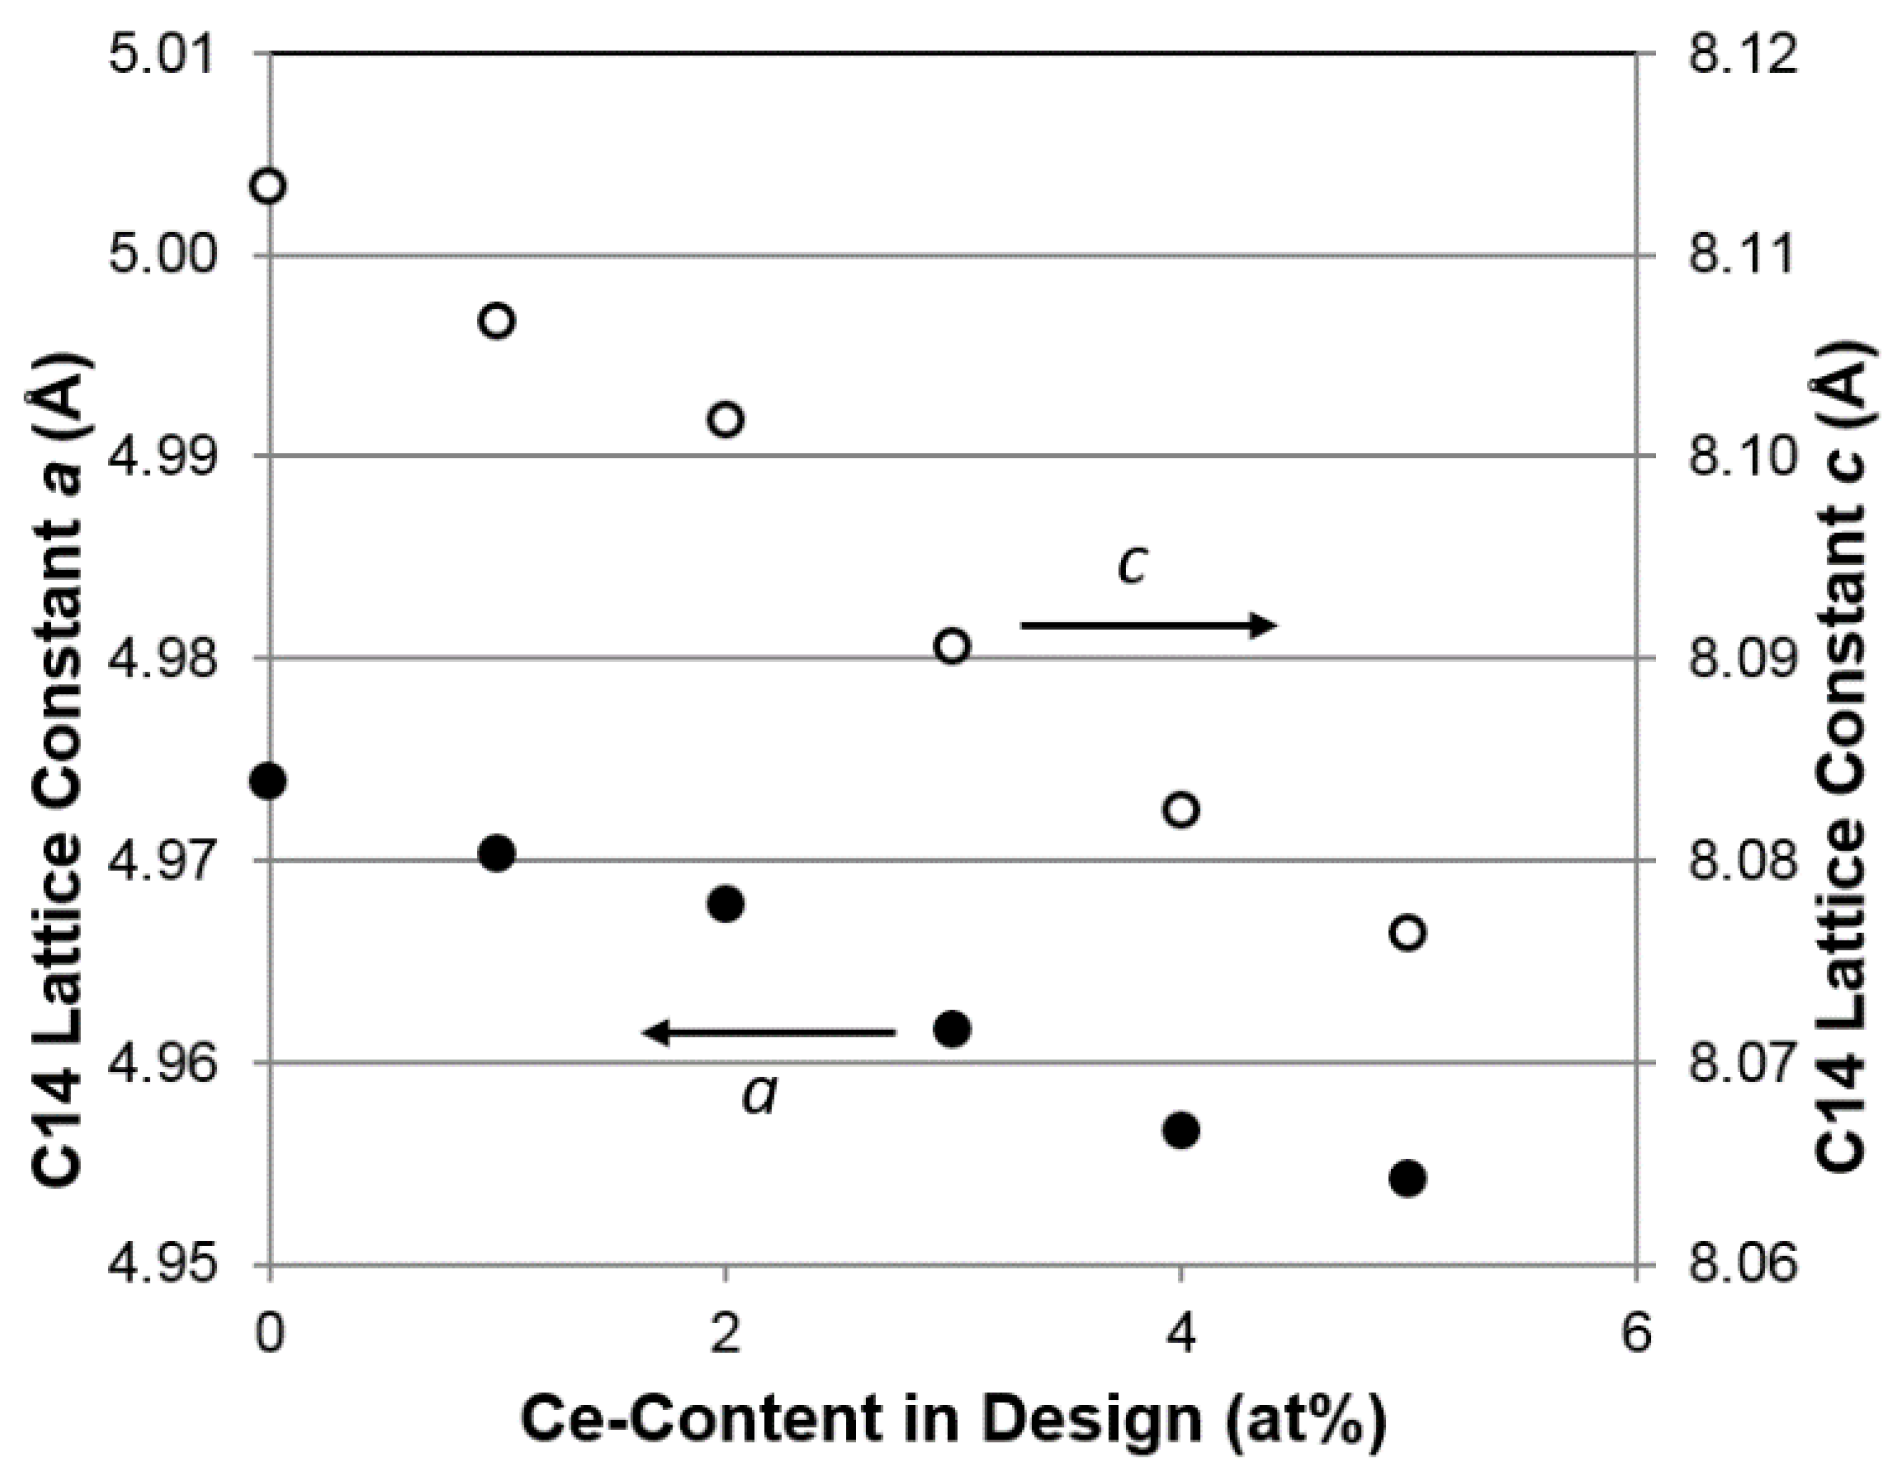
4.1. X-Ray Diffraction Analysis

XRD analysis was used to study the microstructures of the alloys. The obtained XRD patterns are shown in Figure 2 with four phases identified: C14, C15, CeNi, and TiNi. Full XRD pattern fitting was performed using the Rietveld refinement and Jade 9 Software to obtain the lattice parameters and crystallite size of the main C14 phase and the abundances of all four phases, and the results are summarized in Table 3. With the increase in Ce-content (and the corresponding decrease in Zr-content) in the alloy, both lattice constants a and c in the C14 phase decrease, and the a/c ratio increases slightly (Figure 3). Lattice constant a of the C15 phase follows the same trend as the one in the C14 phase, and both decreasing trends are caused by the reduction in Zr-content (second largest among all constituent elements) and zero or close to zero solubility of Ce (largest among all constituent elements) in the C14 and C15 phases as the Ce-content in the alloy design increases. Un-shifted positions of the major peaks for the TiNi and CeNi phases, shown in Figure 2, indicate that the unit cell sizes of these two phases stay the same as the Ce-content increases in the alloy design, which can be explained by the relatively unchanged TiNi and CeNi phase compositions as revealed by the EDS analysis (Section 4.2). Crystallite size of the main C14 phase first increases with the initial introduction of Ce in the alloy but then decreases with further increases in Ce-content, and this trend is very similar to that observed in the La-substitution study [17]. One possible explanation for the C14 crystallize size evolution is by the phase abundance of the non-Laves secondary phase. The higher abundance of non-Laves phase reduces the crystallization time of the matrix phase and consequently reduces the crystallite size of the matrix phase. In the beginning, when the CeNi phase abundance is small, the C14 crystallite size increases due to the decrease in the TiNi abundance. After more Ce is added, the CeNi phase abundance started to increase and caused a decrease in the C14 crystallite size.
Evolutions of the TiNi and RENi (where RE = Y, La, Ce, and Nd) phase abundances with increasing RE-content in the alloy design are plotted in Figure 4 and demonstrate that larger amounts of Ce (>1 at%) is very effective in suppressing the TiNi phase (beneficial to low-temperature performance [7,8]) and promoting the RENi phase (detrimental to low-temperature performance in the case of YNi [7,8]). Furthermore, the RENi phase abundances in various RE-substituted alloys do not correlate very well with the heats of formation or melting temperatures of the corresponding RENi phases.

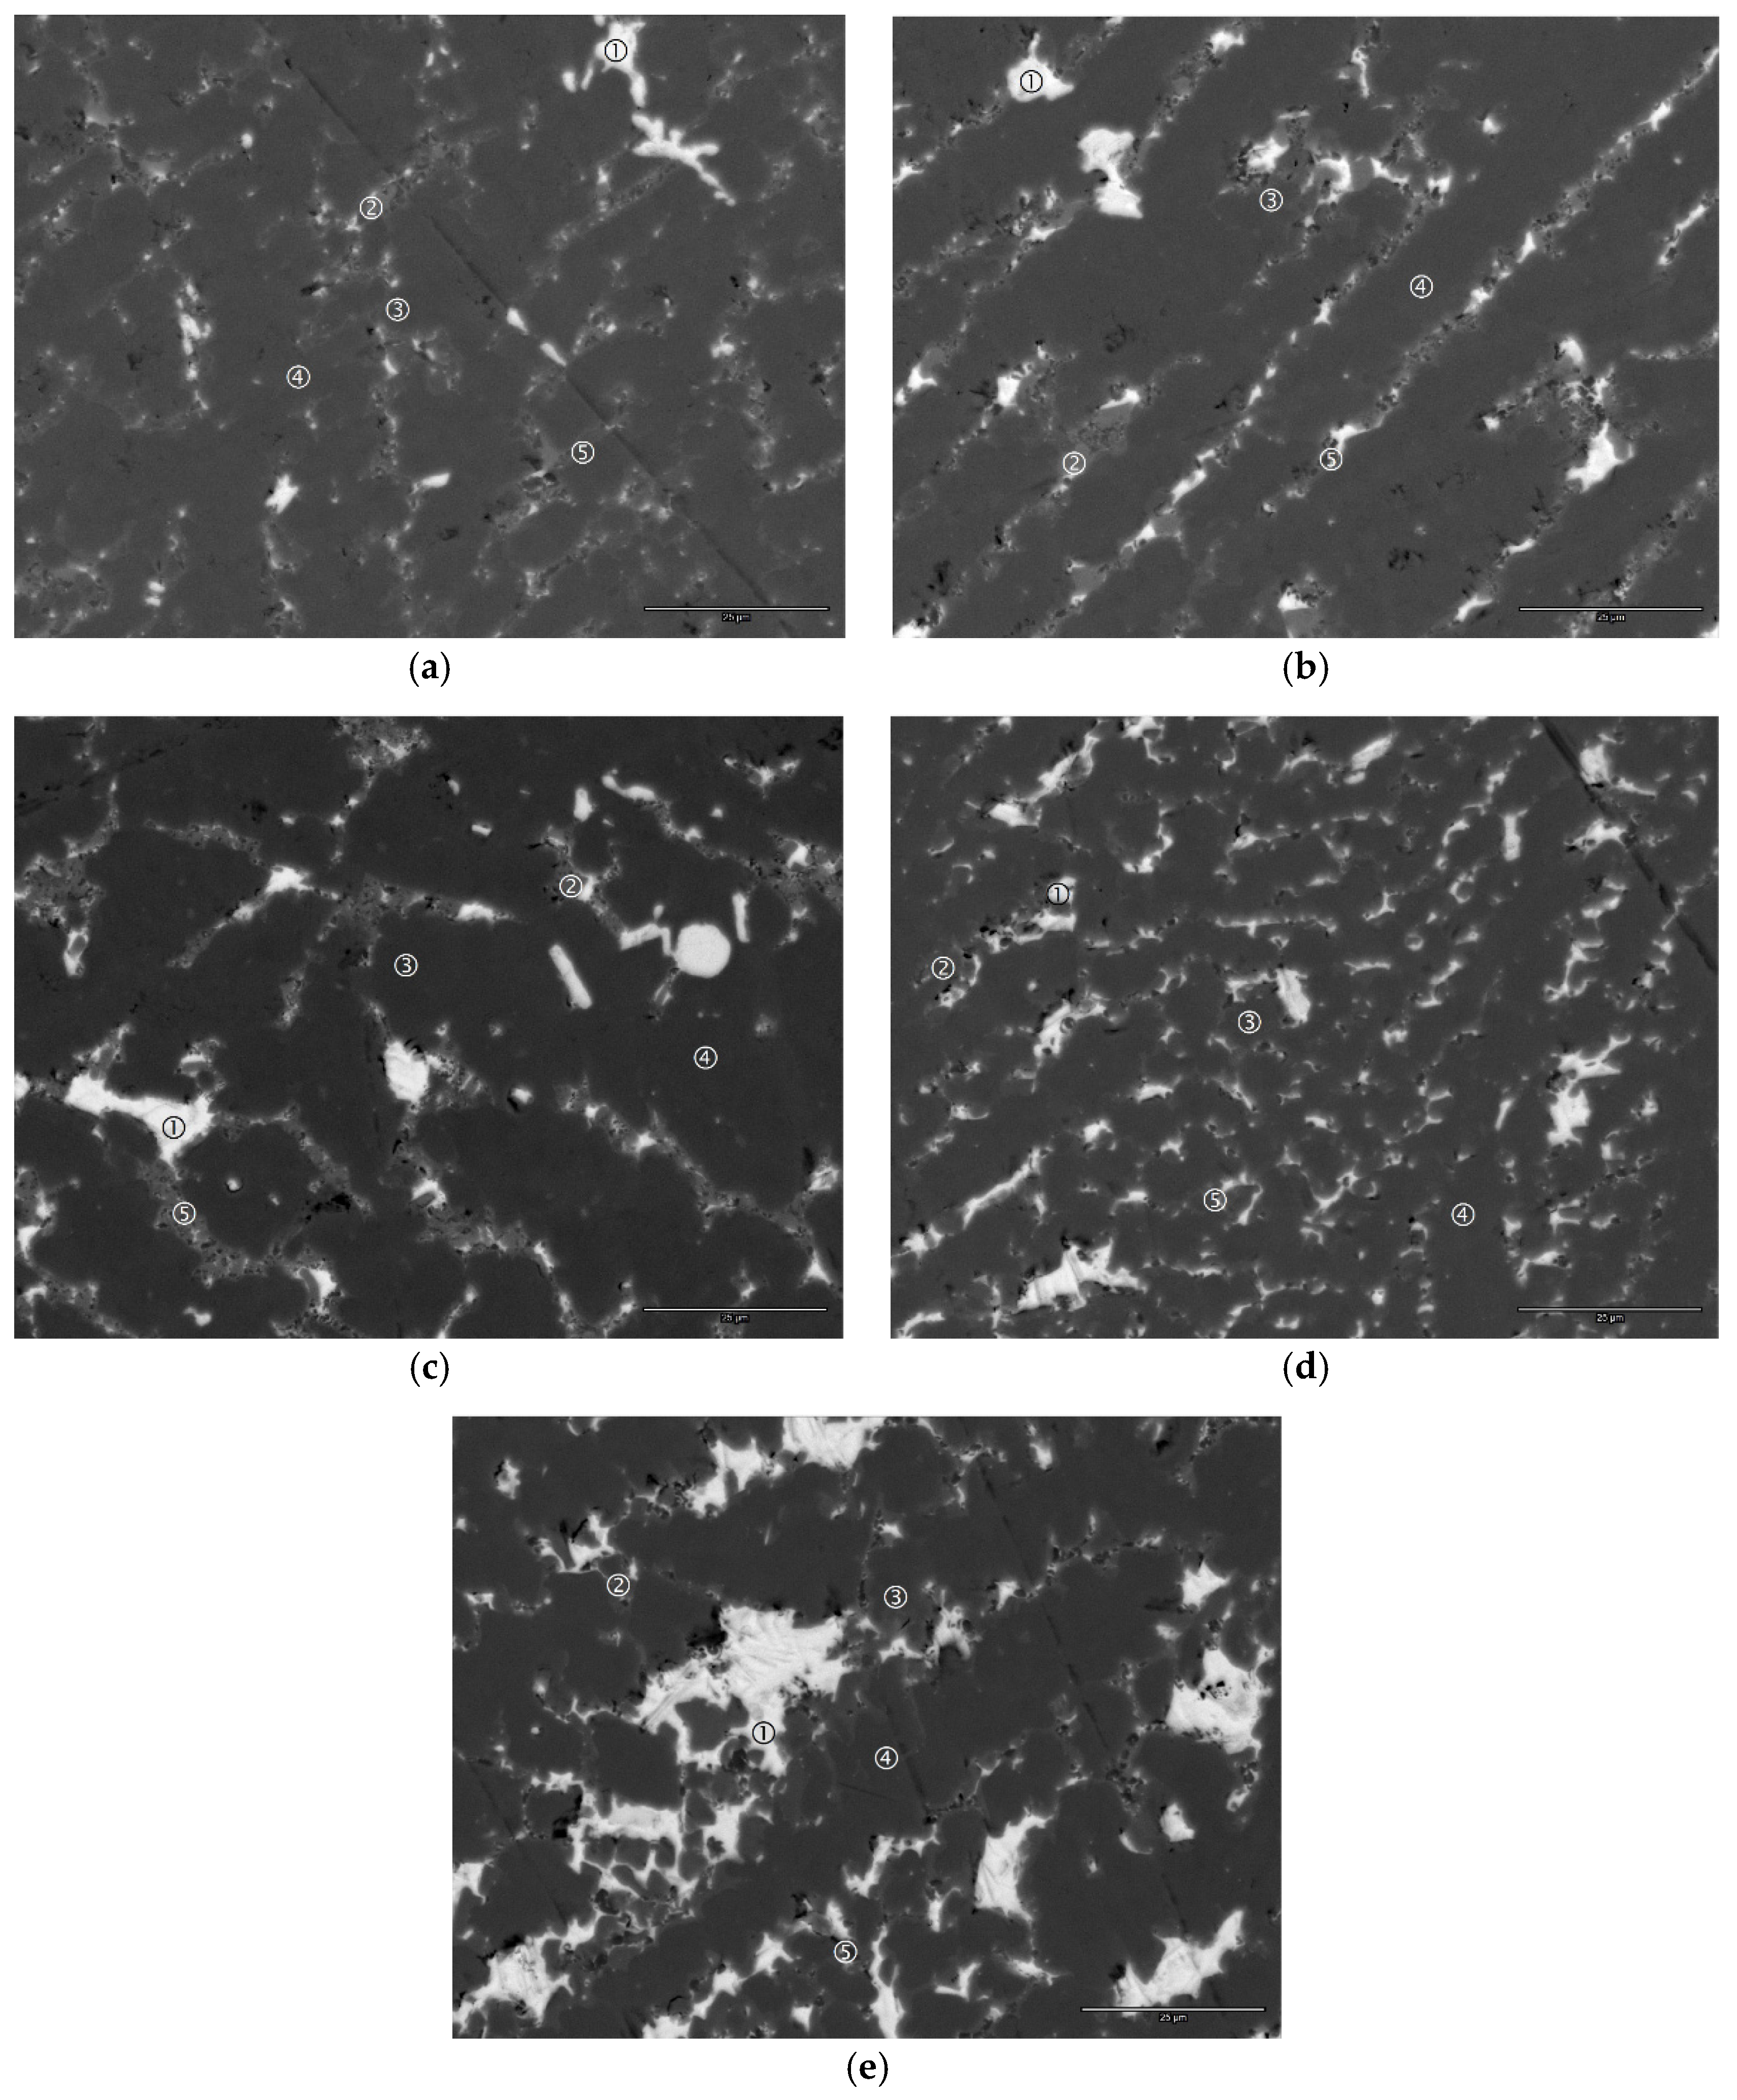
4.2. Scanning Electron Microscope/Energy Dispersive Spectroscopy Analysis

Both SEM secondary electron images (SEI) and back-scattering electron images (BEI) were taken from each alloy in this study. While the former carry surface topological information, the latter demonstrate both topological and compositional information and are shown in Figure 5 for comparison. Compositions of several representative areas (identified by Roman numerals) in Figure 5 were studied by EDS, and the results are summarized in Table 4. The brightest region in each micrograph belongs to Ce metal (Figure 5a-1 in alloy Ce1) or CeNi (Figure 5b-1,c-1,d-1,e-1 in Alloys Ce2–Ce5, respectively). These observations are in agreement with the close-to-zero CeNi-content in alloy Ce1 revealed by the XRD analysis. Areas with the second brightest contrast (Figure 5a-2,b-2,c-2,d-2,e-2) are identified as a Zr-rich phase with a B/A ratio very close to the theoretical stoichiometry of Zr7Ni10 (1.43) by taking into consideration that V resides in the A-site of the crystal [18]. Solubilities of V, Co, Mn, and Cr in the Zr7Ni10 phase are much lower than those in the Laves phases. Moreover, the B/A ratio of the TiNi phase (Figure 5a-5,b-5,c-5,d-5,e-5) is always greater than 1 even with the assignment of V in the A-site [16,17,18]. The Ti-Ni binary phase diagram shows a solubility range of TiNi on the Ni-rich side at higher temperatures [38]. Therefore, a higher B/A ratio for the TiNi phase is expected due to the quick cooling nature of arc melting technique. The main phase is composed of two regions with very close contrasts. The slightly brighter region (Figure 5a-3,b-3,c-3,d-3,e-3) has a smaller B/A ratio and an e/a value higher than the C14/C15 threshold of 6.83 [54], and it was consequently assigned to the C15 phase. The other phase (Figure 5a-4,b-4,c-4,d-4,e-4) with an e/a value lower than the C14/C15 threshold was assigned to the C14 phase. Since the solubility of Ce, same as those of the other RE elements, in the AB2 phase is almost zero, the lattice constants of the C14 and C15 phases do not increase with increasing overall Ce-content; on the contrary, they decrease due to the decrease in Zr/Ti ratio (Zr is larger than Ti) in both the C14 and C15 phases as seen in Table 4. Upon a closer examination of the C14 and C15 phase compositions, we found that the main differences occur in the V- and Ni-contents. More specifically, the Ni/V ratio in the C14 phase is lower compared to that in the C15 phase (a lower Ni-content and a higher V-content in the C14 phase compared to those in the C15 phase), which results in a lower e/a in the C14 phase. In addition, the C14 phase is predicted to have a larger H-storage capacity due to its higher V-content but also exhibit a lower electrochemical high-rate dischargeability (HRD) due to its lower Ni-content according to our previous findings from a phase contribution study on the AB2 MH alloys [56]. Finally, phase distribution analysis reveals the following solidification sequence: AB2 phase first (M.P. ≈ 1450 °C), followed by TiNi (1310 °C), Zr7Ni10 (1158 °C), and finally CeNi (680 °C) as the last solid formed from the liquid.

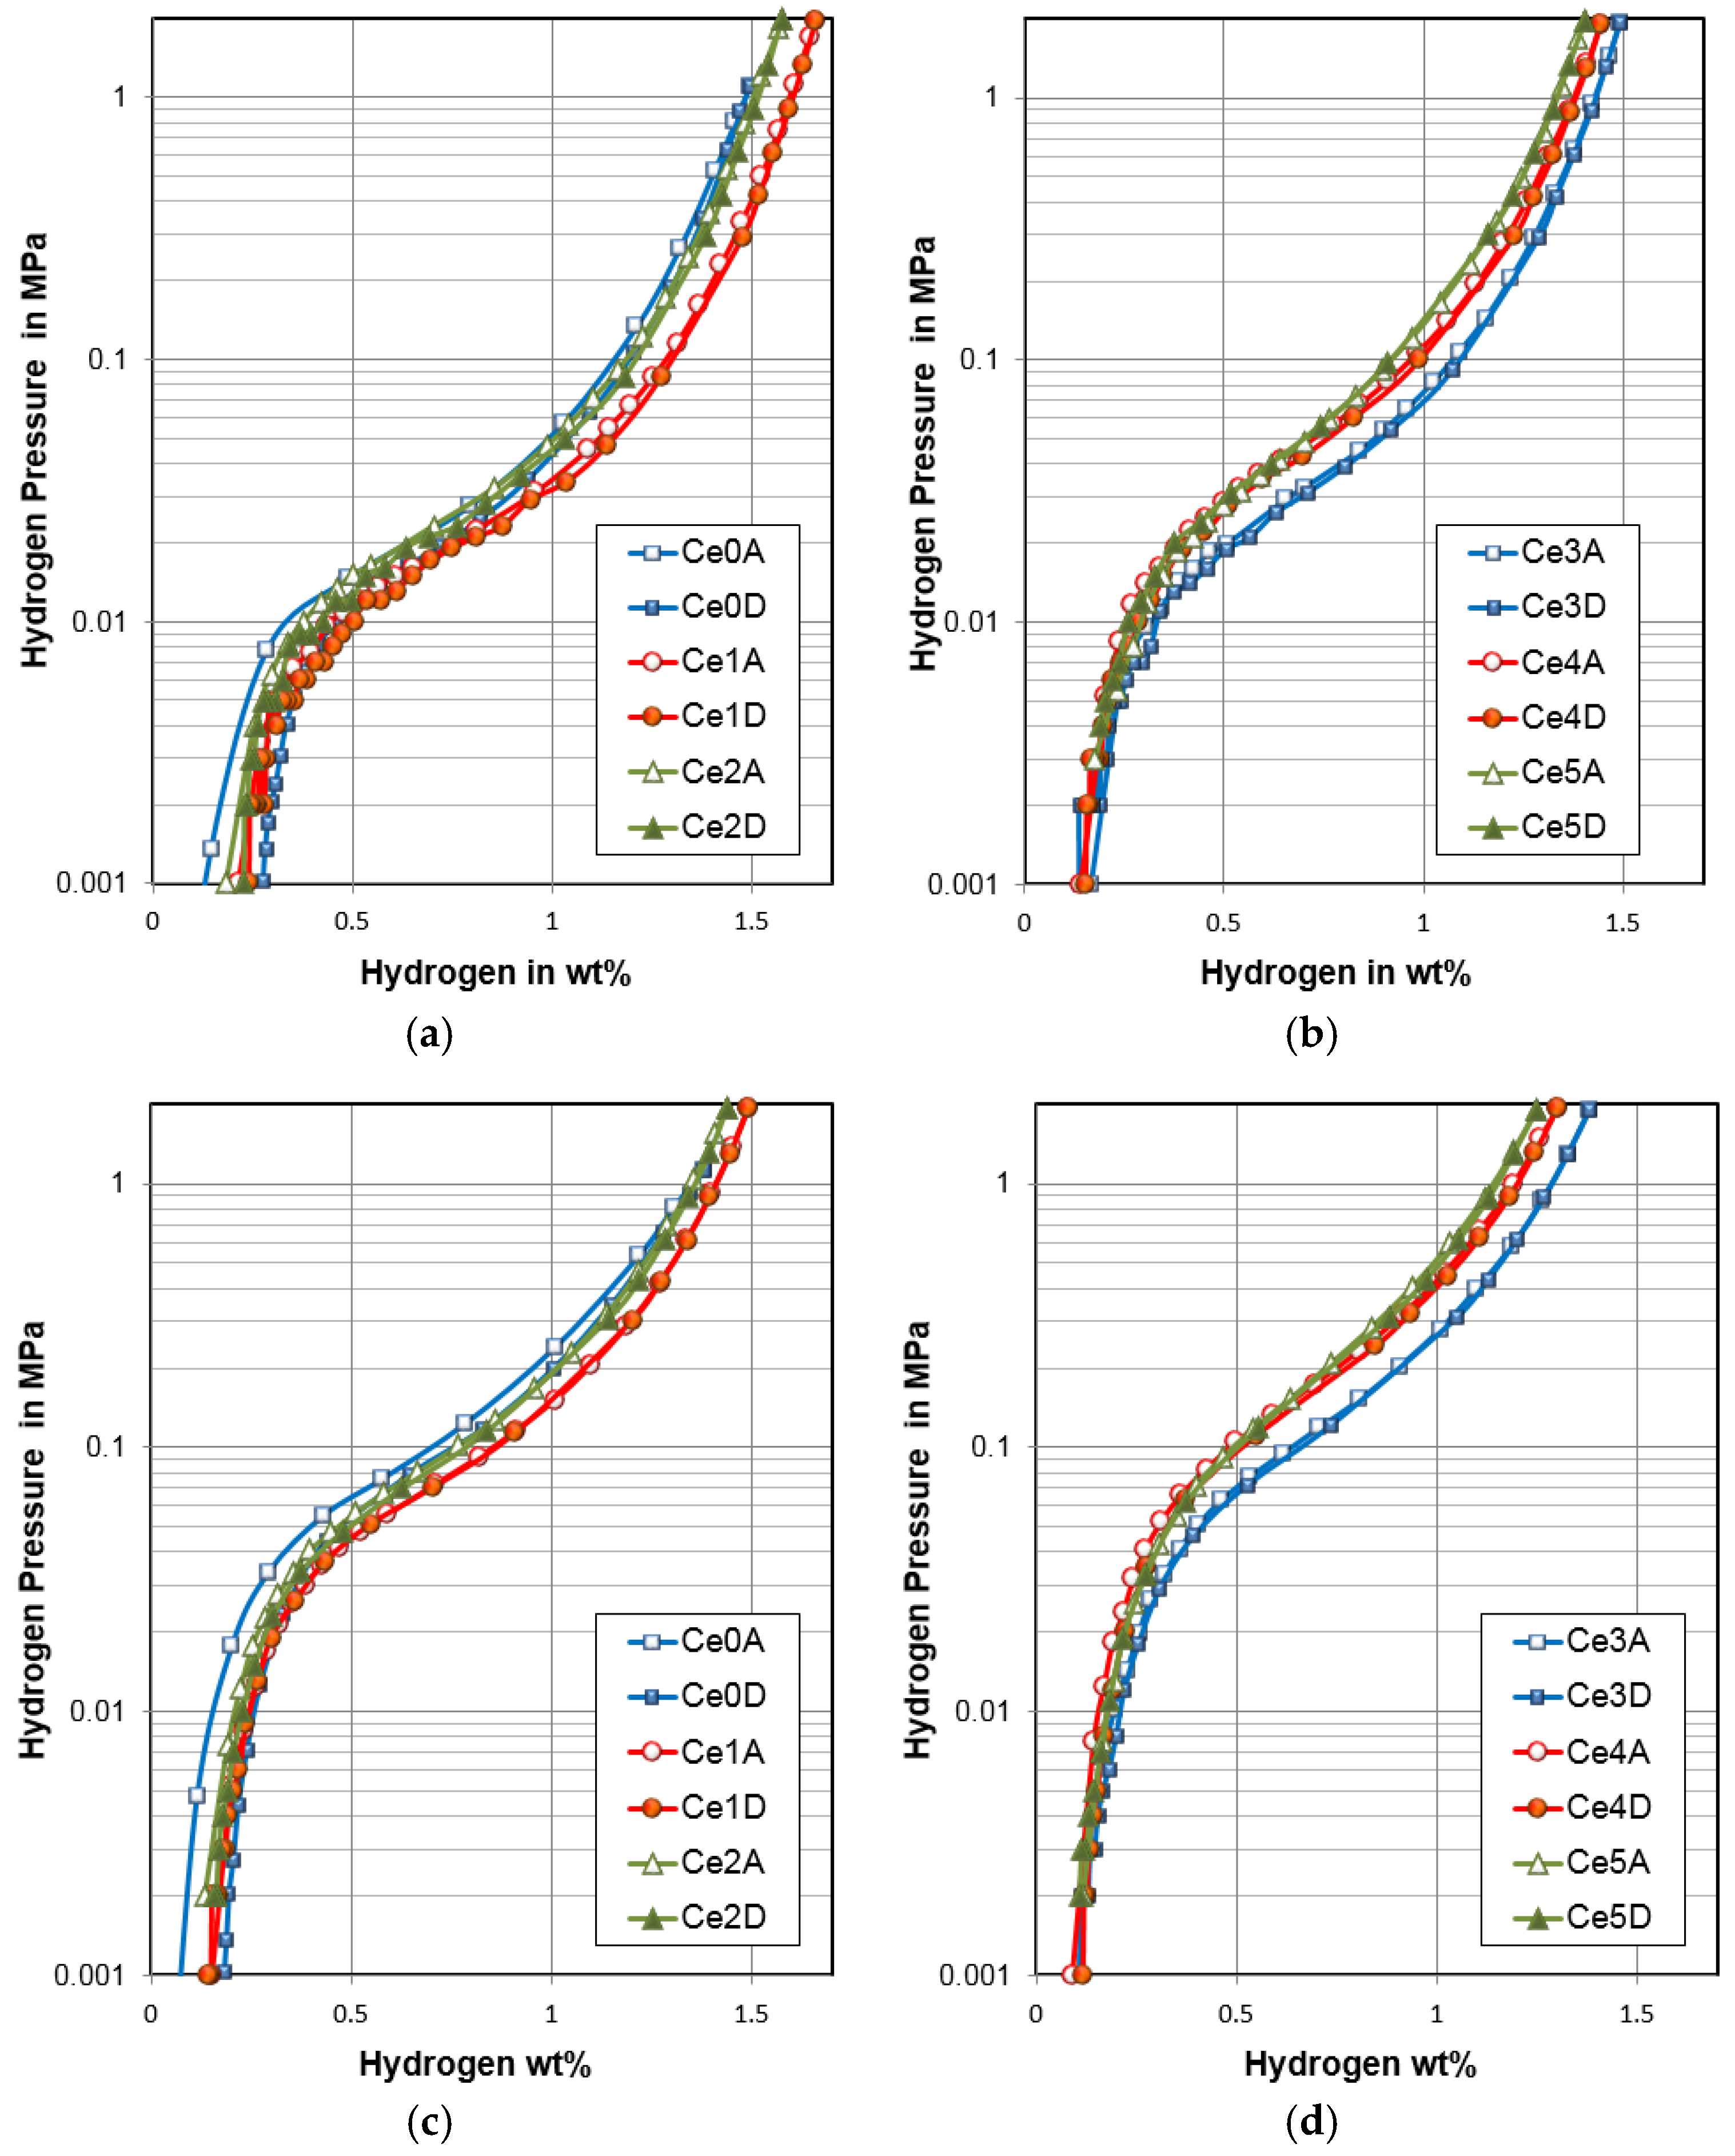
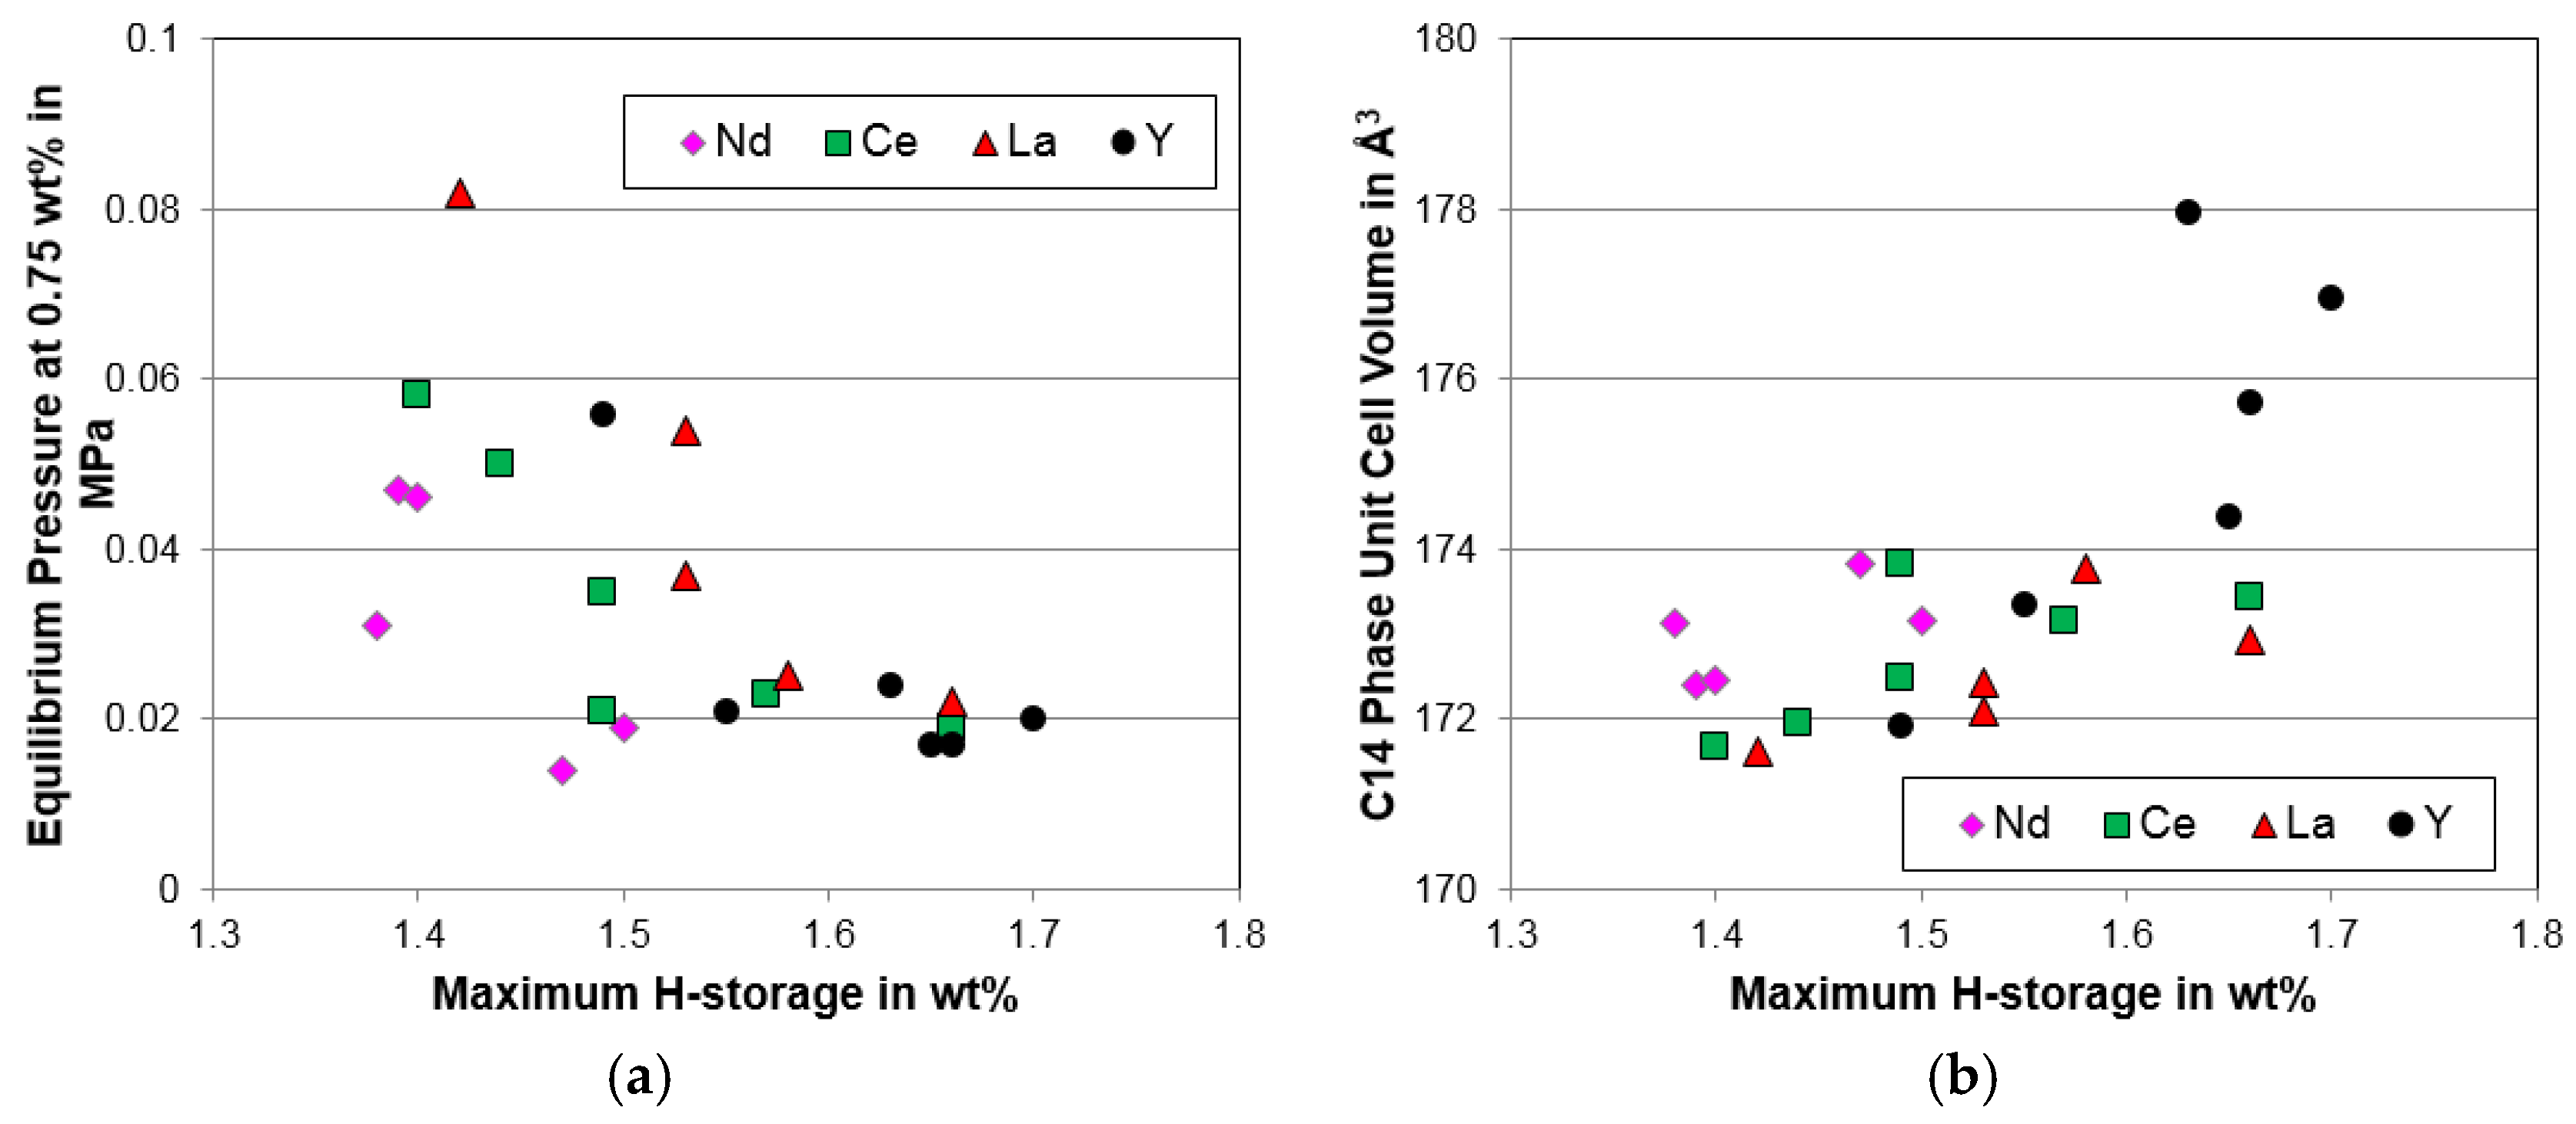
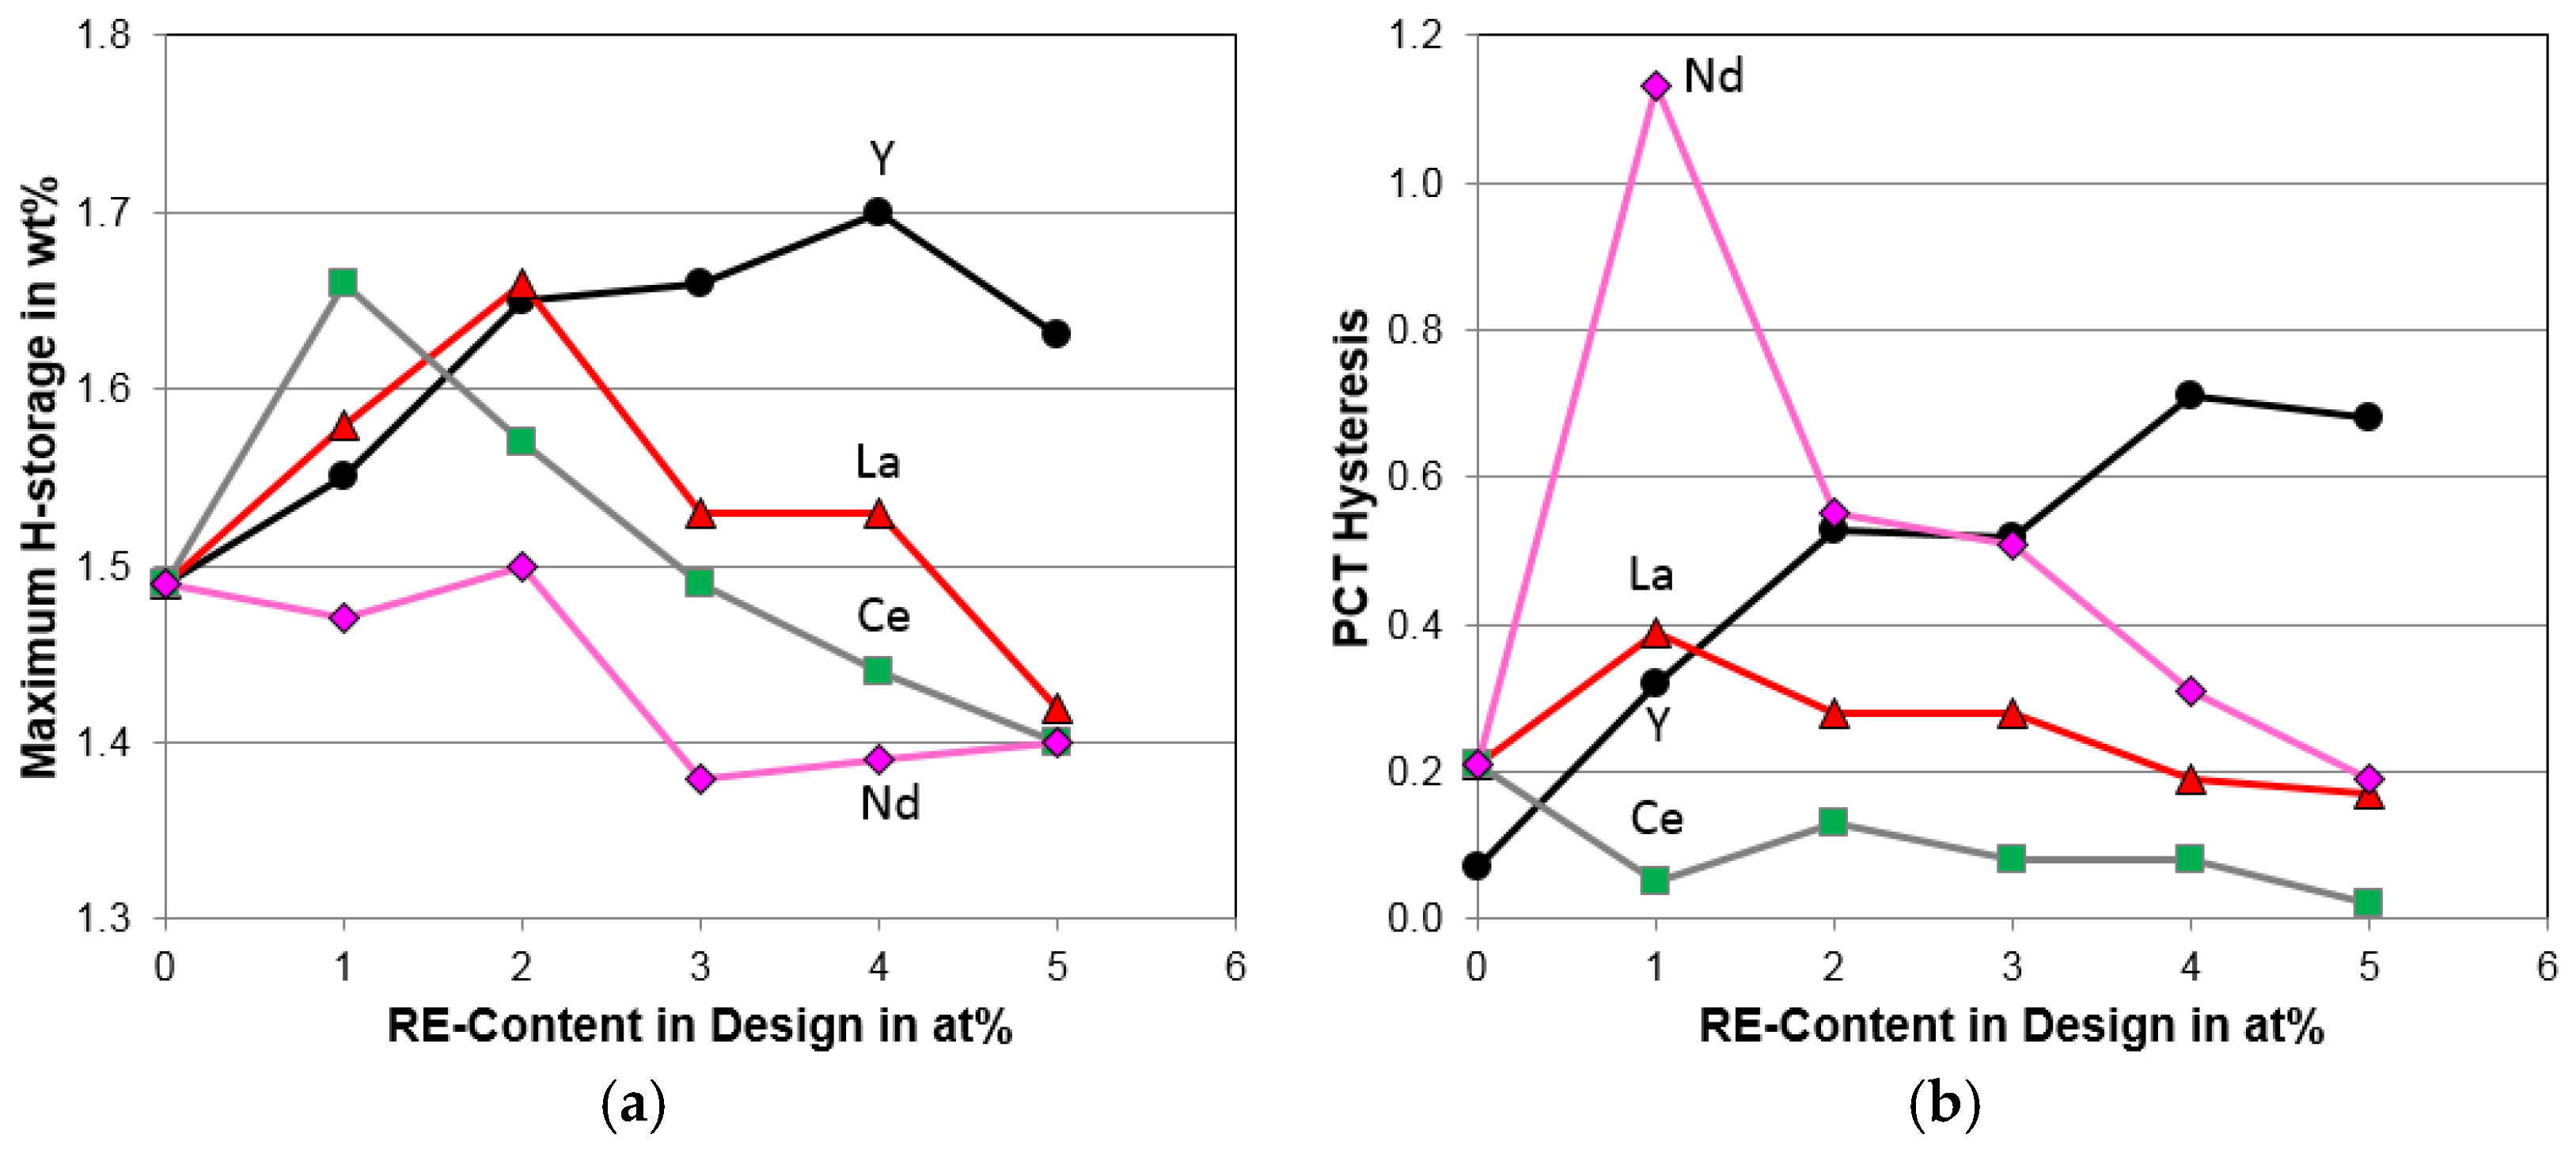
4.3. Pressure–Concentration–Temperature Analysis

PCT isotherms were measured at 30, 60, and 90 °C, and results from the first two temperatures are shown in Figure 6. These isotherms are typical examples of multi-phase alloys with coherent synergetic effects among constituent phases [18]. Gaseous phase H-storage characteristics obtained from the PCT isotherms are summarized in Table 5. Both the maximum and reversible H-storage capacities first increase (maximized at alloy Ce1) and then decrease as the Ce-content in the alloy increases. Compared to the other RE additives, as shown in Figure 7a, alloy Ce1 has the second highest maximum H-storage capacity (alloy Y4 with 4 at% Y has the highest maximum H-storage capacity capacity). It is interesting to observe that alloys with 5 at% La, Ce, and Nd show very similar maximum H-storage capacities. Since no obvious pressure plateau can be identified, desorption pressures at 0.75 wt% H-storage capacity were compared and used in the calculations for hysteresis, heat of hydride formation (ΔHh), and change in entropy (ΔSh). For the Ce-containing alloys, both the 30 °C and 60 °C desorption pressure at 0.75 wt% H-storage first decrease (minimized at alloy Ce1) and then increase as the Ce-content in the alloy increases, and this trend is opposite to the trend observed in H-storage capacity. Desorption pressure is plotted against maximum H-storage capacity for all four RE-substituted series of alloys in Figure 8a, and a trend emerges where alloy with a higher metal–hydrogen (M–H) bond strength demonstrates both a lower plateau pressure and a higher H-storage capability, which was previously proposed [19]. This trend is also related to the evolution of the main phase unit cell volume as seen in Figure 8b, where a larger unit cell makes for a more stable hydride with a stronger M–H bond and increases the maximum H-storage capacity.
Slope factor (SF) is defined as the ratio of the storage capacity between 0.01 MPa and 0.5 MPa to the total capacity in the desorption isotherm. This ratio can be used as an indicator for DOD in a multi-phase MH alloy system [6,20,57]. A large SF corresponds to a flatter plateau and lower DOD (fewer components or variations) in the system. The 30 °C SFs of this series of alloys are similar with the exception of alloy Ce1, which has the lowest SF and thus the highest DOD. Hysteresis of the PCT isotherm is defined as ln(Pa/Pd), where Pa and Pd are the absorption and desorption equilibrium pressures, respectively, at 0.75 wt% H-storage. Hysteresis is believed to be associated with the irreversible energy loss during plastic deformation of the hydride phase (β) in the alloy matrix (α) [58,59,60] and was found to be related to both the a/c ratio and pulverization rate of the alloy [61]. PCT hystereses at 30 °C of the Ce-containing alloys are smaller than that of the Ce-free alloy Ce0, indicating that the addition of the CeNi phase can reduce the stress built from the α to β transformation; however, such effect was not observed with the other RE-substitutions (Figure 7b). 60 °C H-storage characteristics are similar to those measured at 30 °C with the only exception of SF. SF measured at 60 °C decreases with increasing Ce-content in the alloy. One possible explanation is that the CeNi phase contributes more to DOD at a higher temperature with a higher participation rate (CeNi has a stronger M–H bond than AB2 and will not release hydrogen at room temperature [52]).
Desorption equilibrium pressures at 0.75 wt% H-storage at 30, 60, and 90 °C were used to estimate ΔHh and ΔSh with the equation:
ΔG = ΔHhTΔSh = RTlnP
where R is the ideal gas constant, and T is the absolute temperature at which the measurement was performed. ΔHh is negative due to the exothermic nature of the hydrogenation reaction. ΔHh increases (becomes less negative) with increasing Ce-content in the alloy and can be correlated to the shrinking C14 unit cell volume, resulting in a less stable hydride (lower capacity and higher equilibrium pressure). ΔSh is related to DOD in a hydride from a completely ordered solid (e.g., solid hydrogen) (−130.7 J·mol−1·K−1 for H2 (g) at 300 K and 0.1 MPa [27]). The Ce-containing alloys have slightly higher ΔSh (less negative), suggesting that the addition of the CeNi phase increases DOD of the hydride, which is another indication of the CeNi phase’s participation in H-storage.

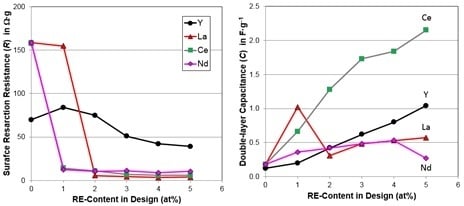
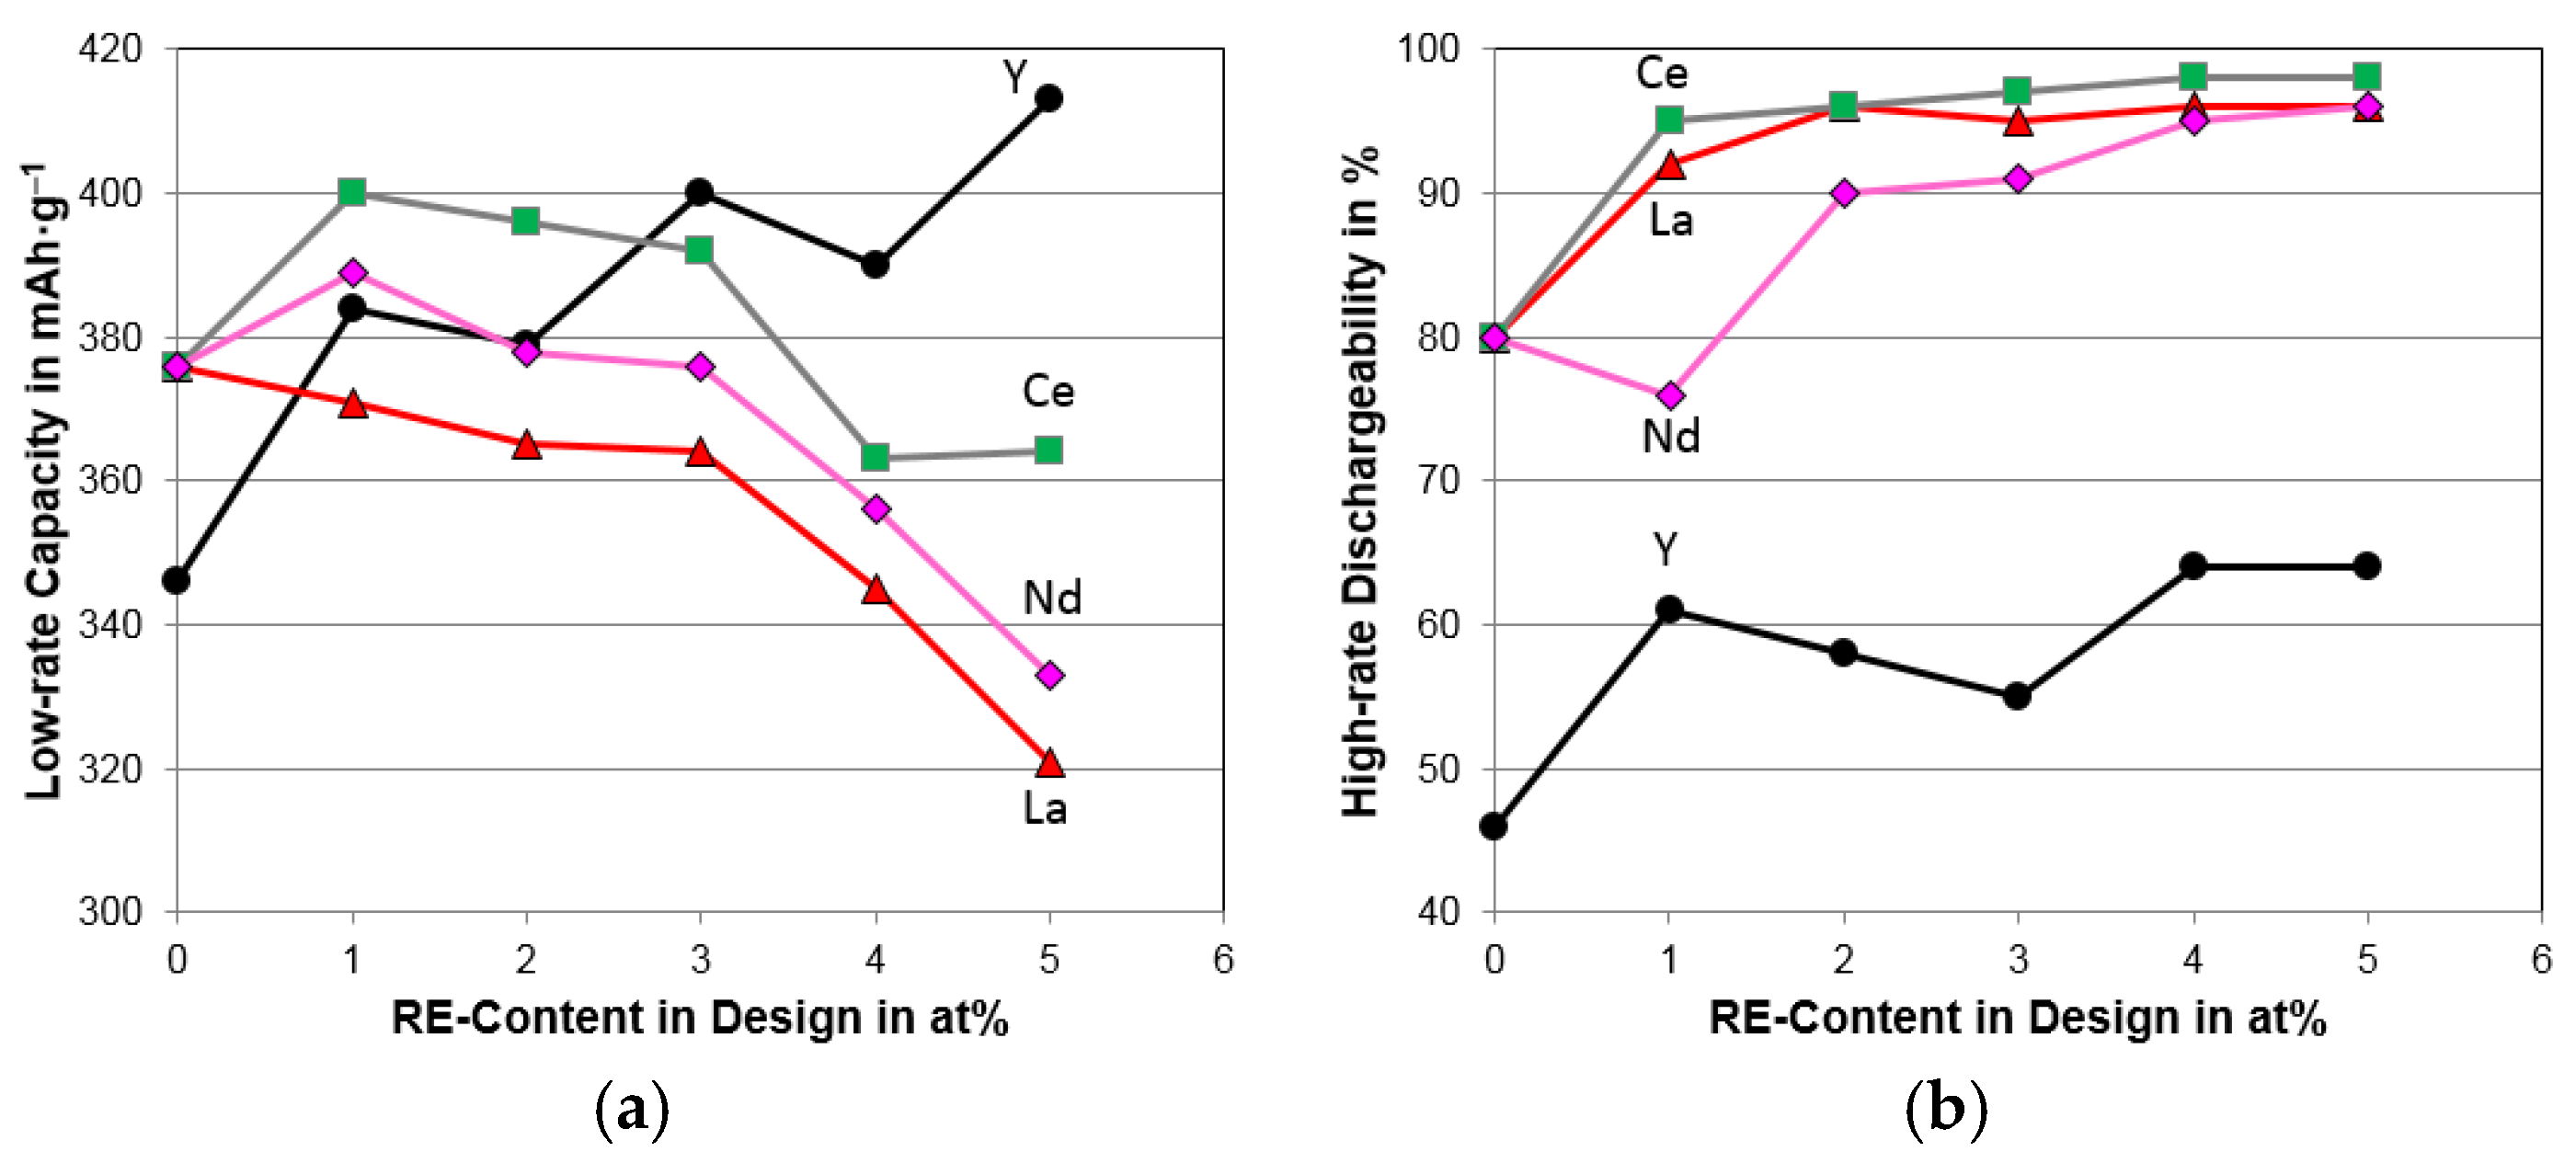
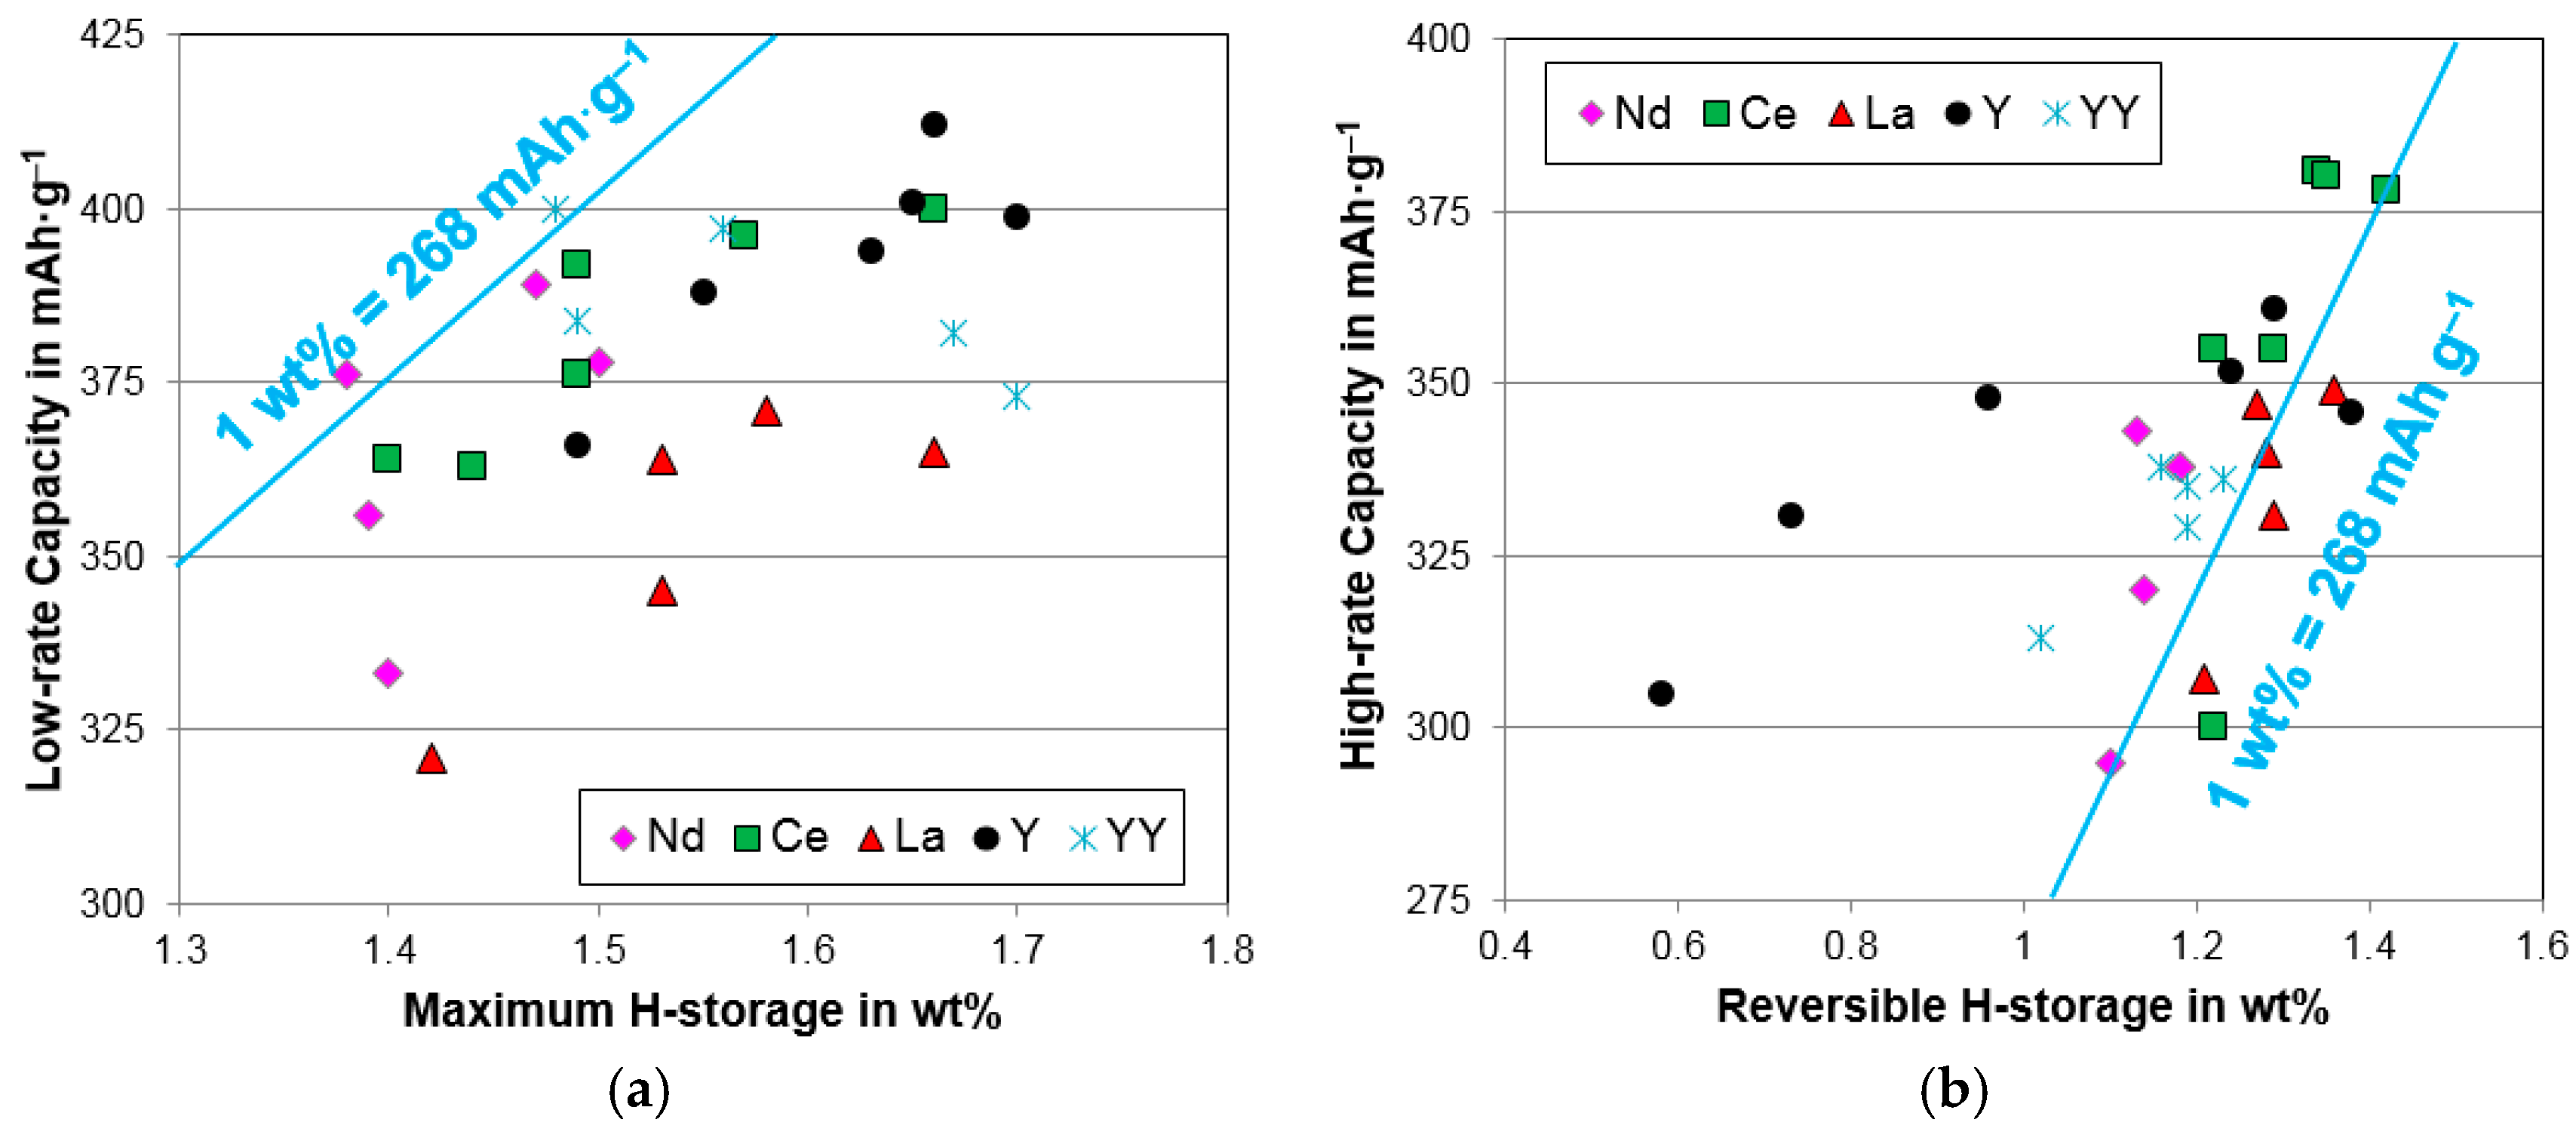
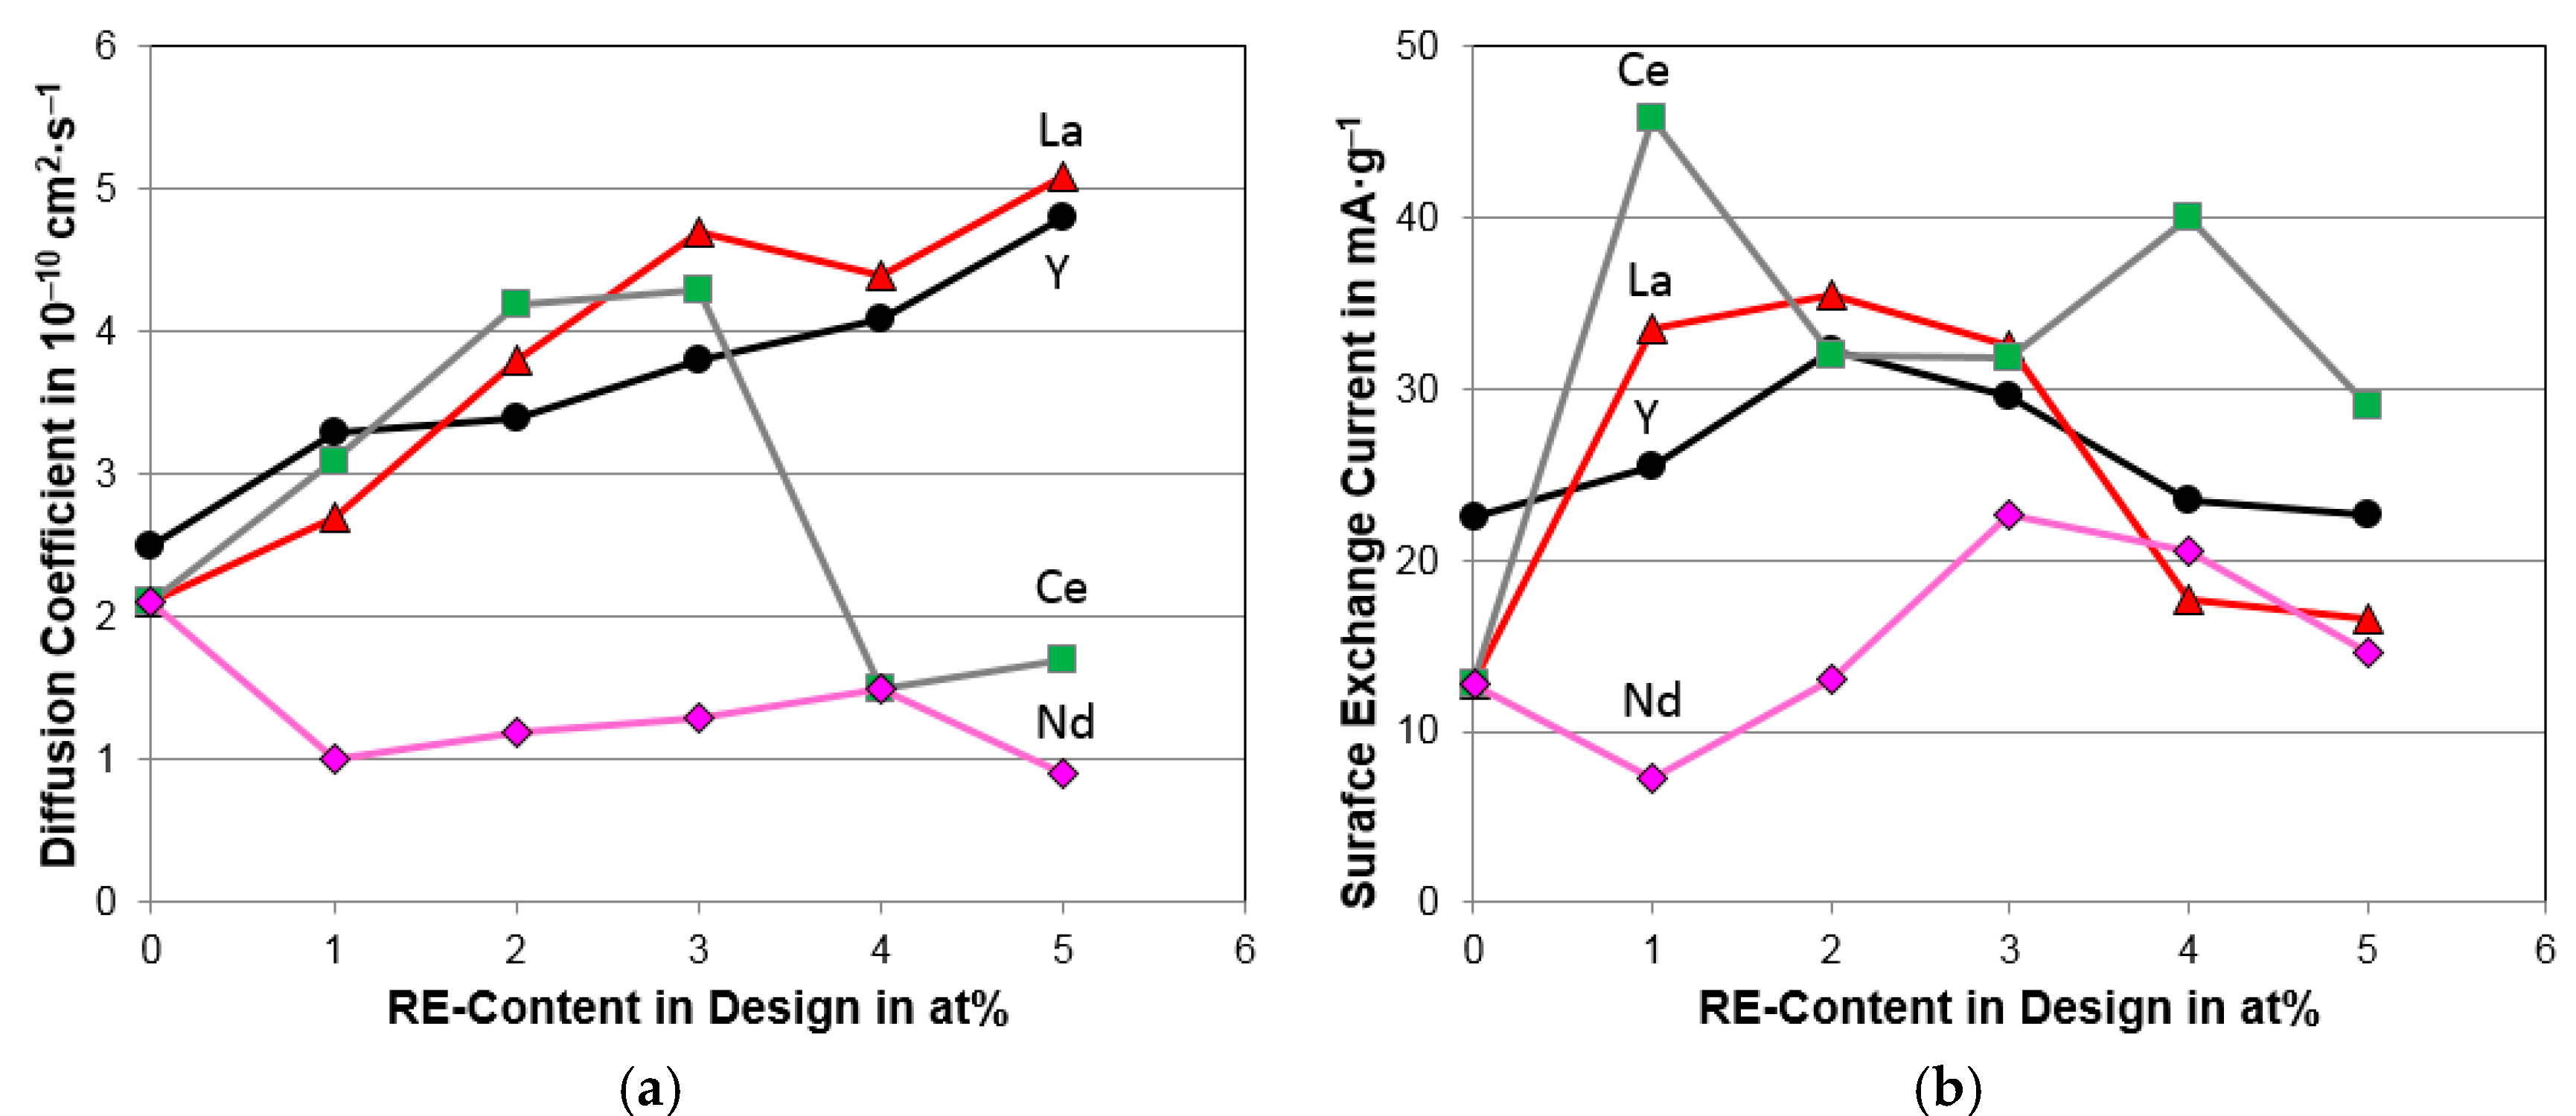
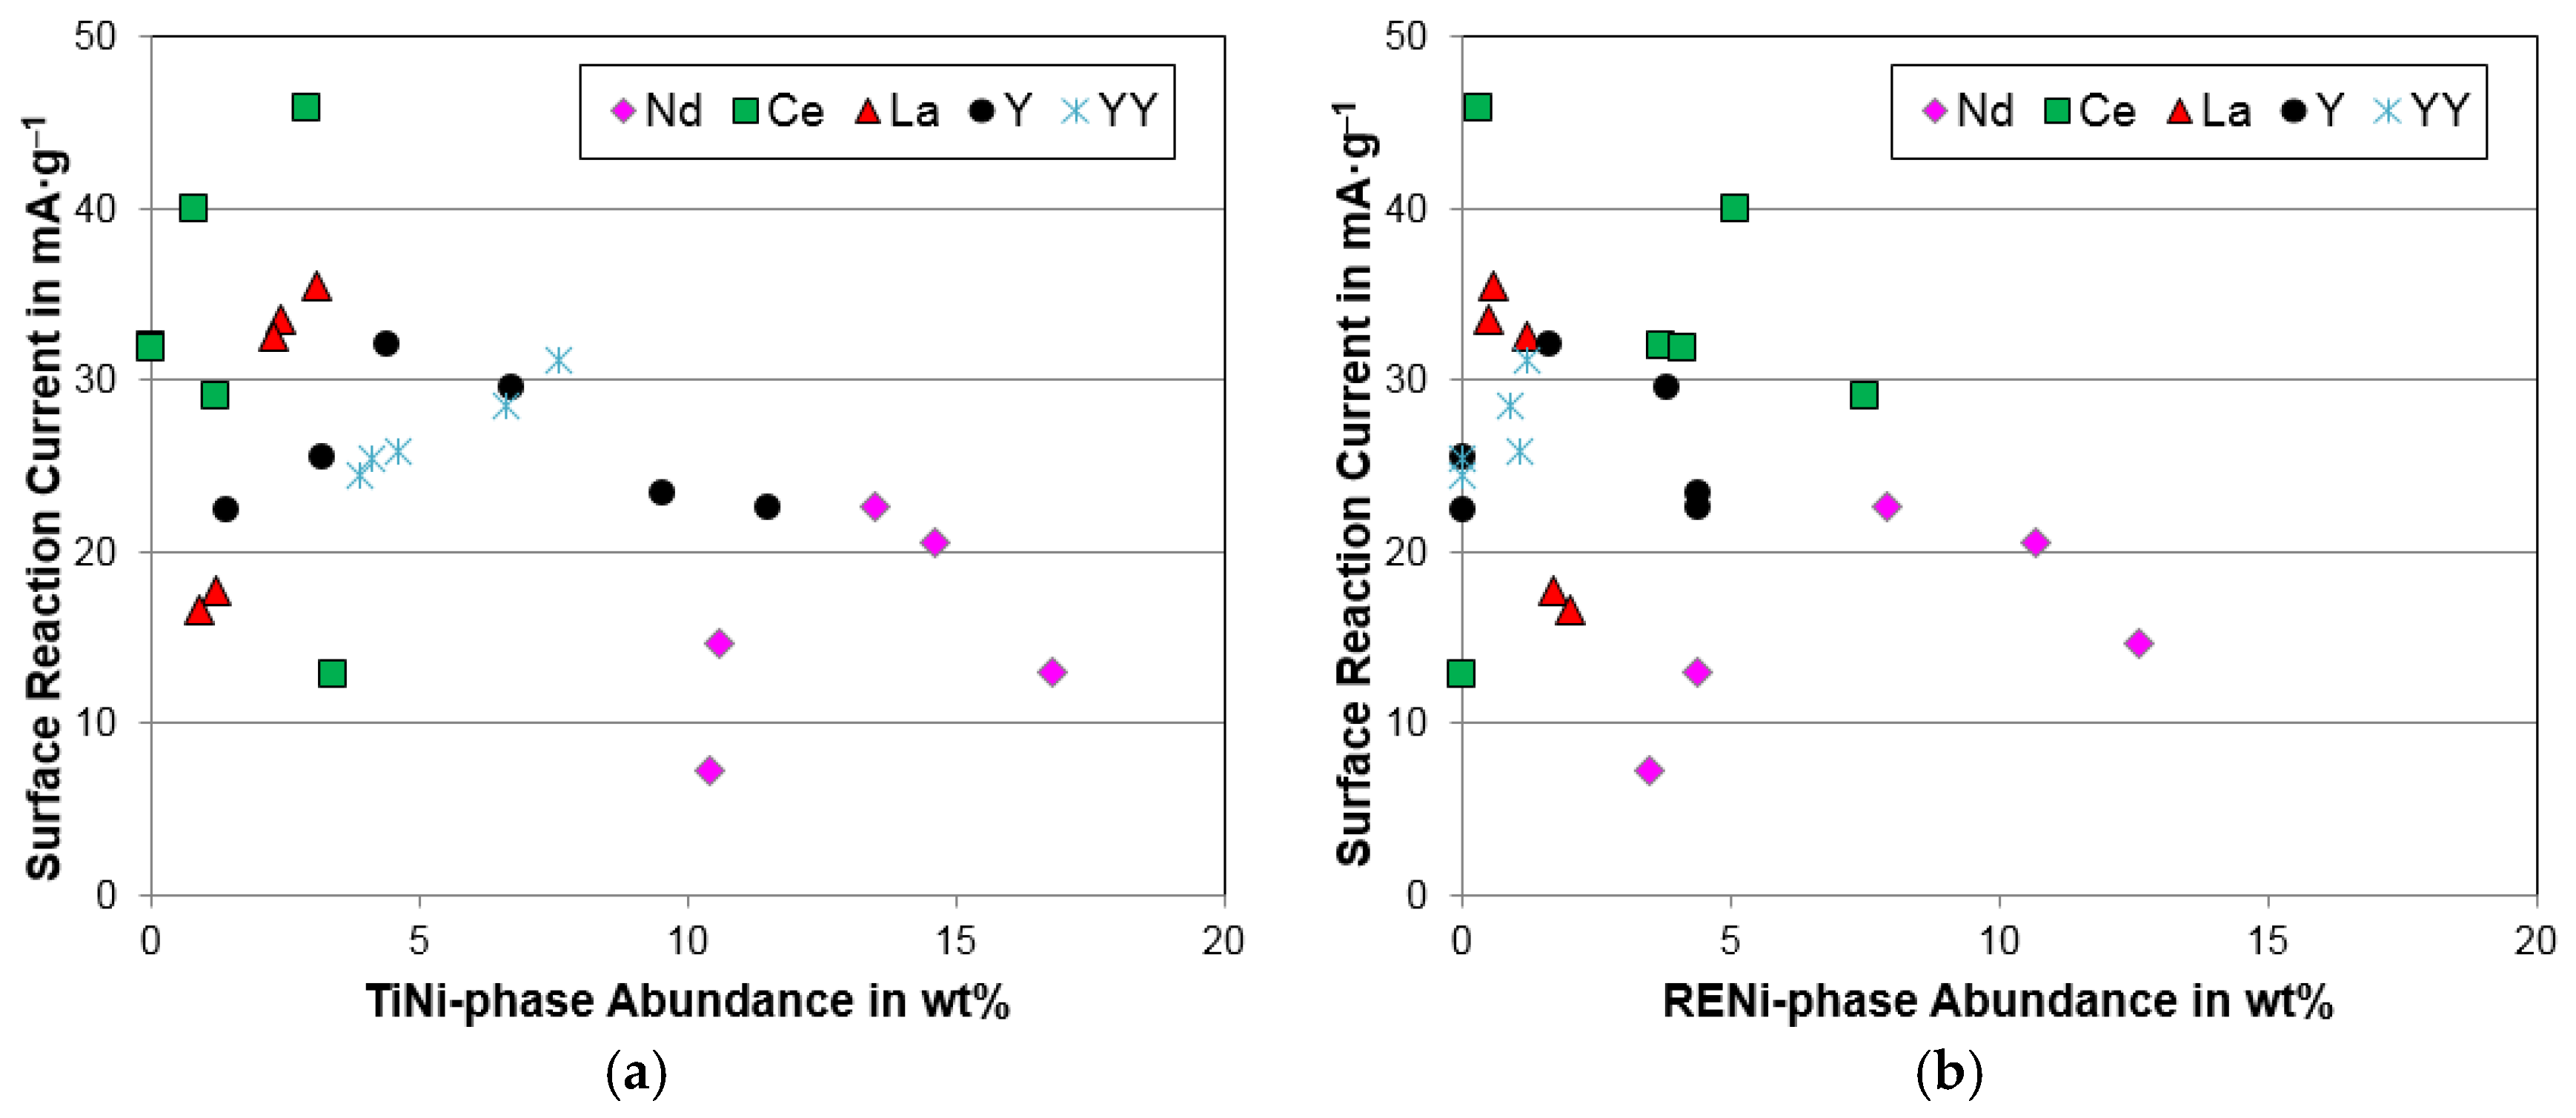
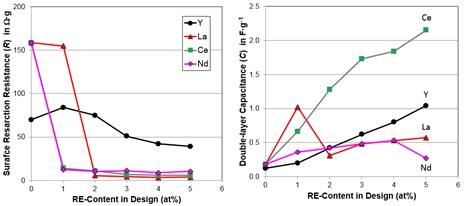
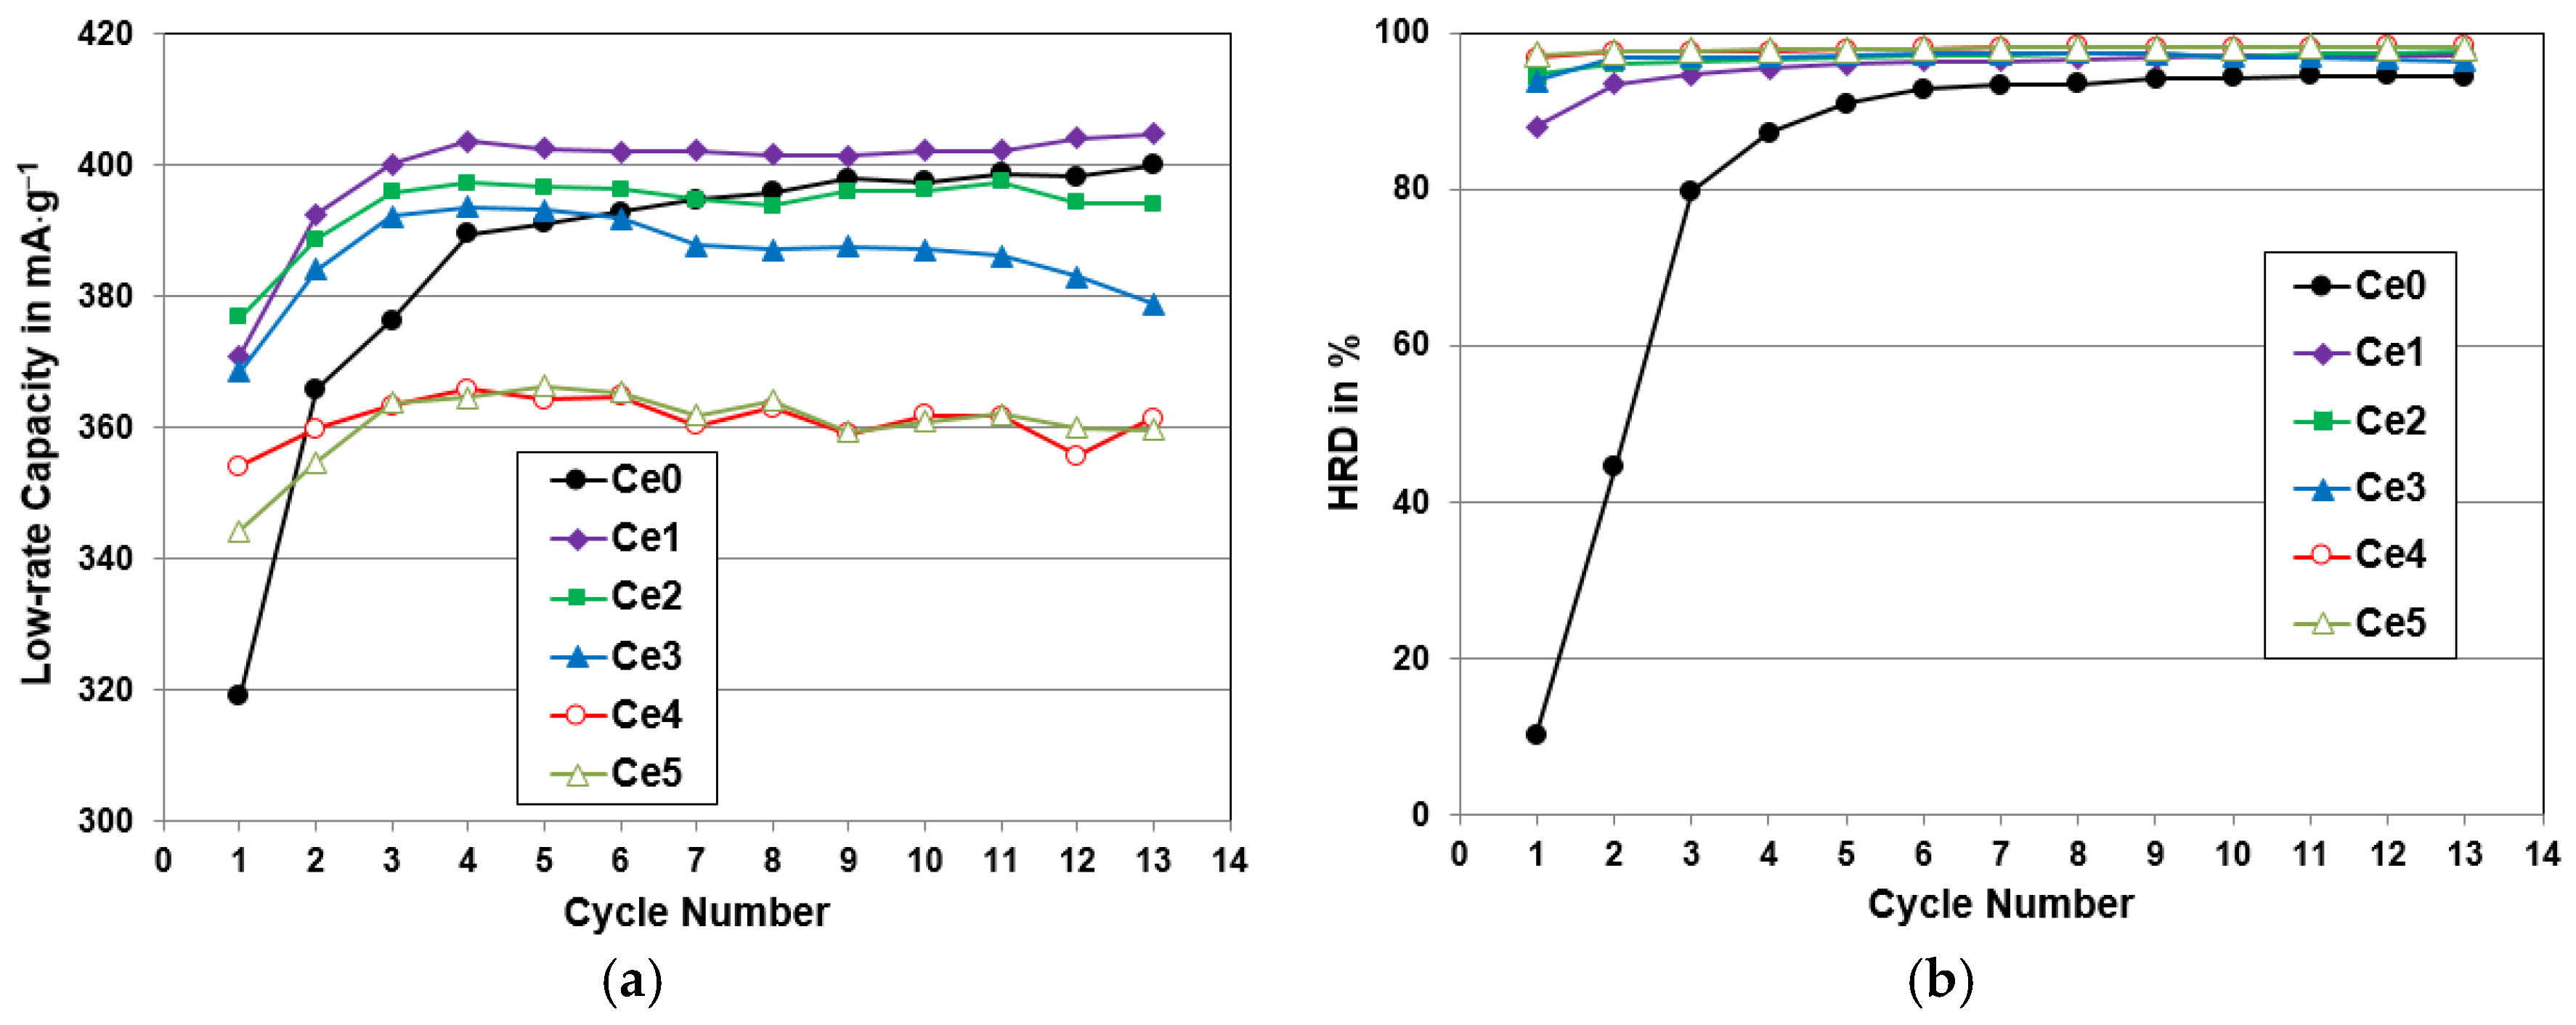
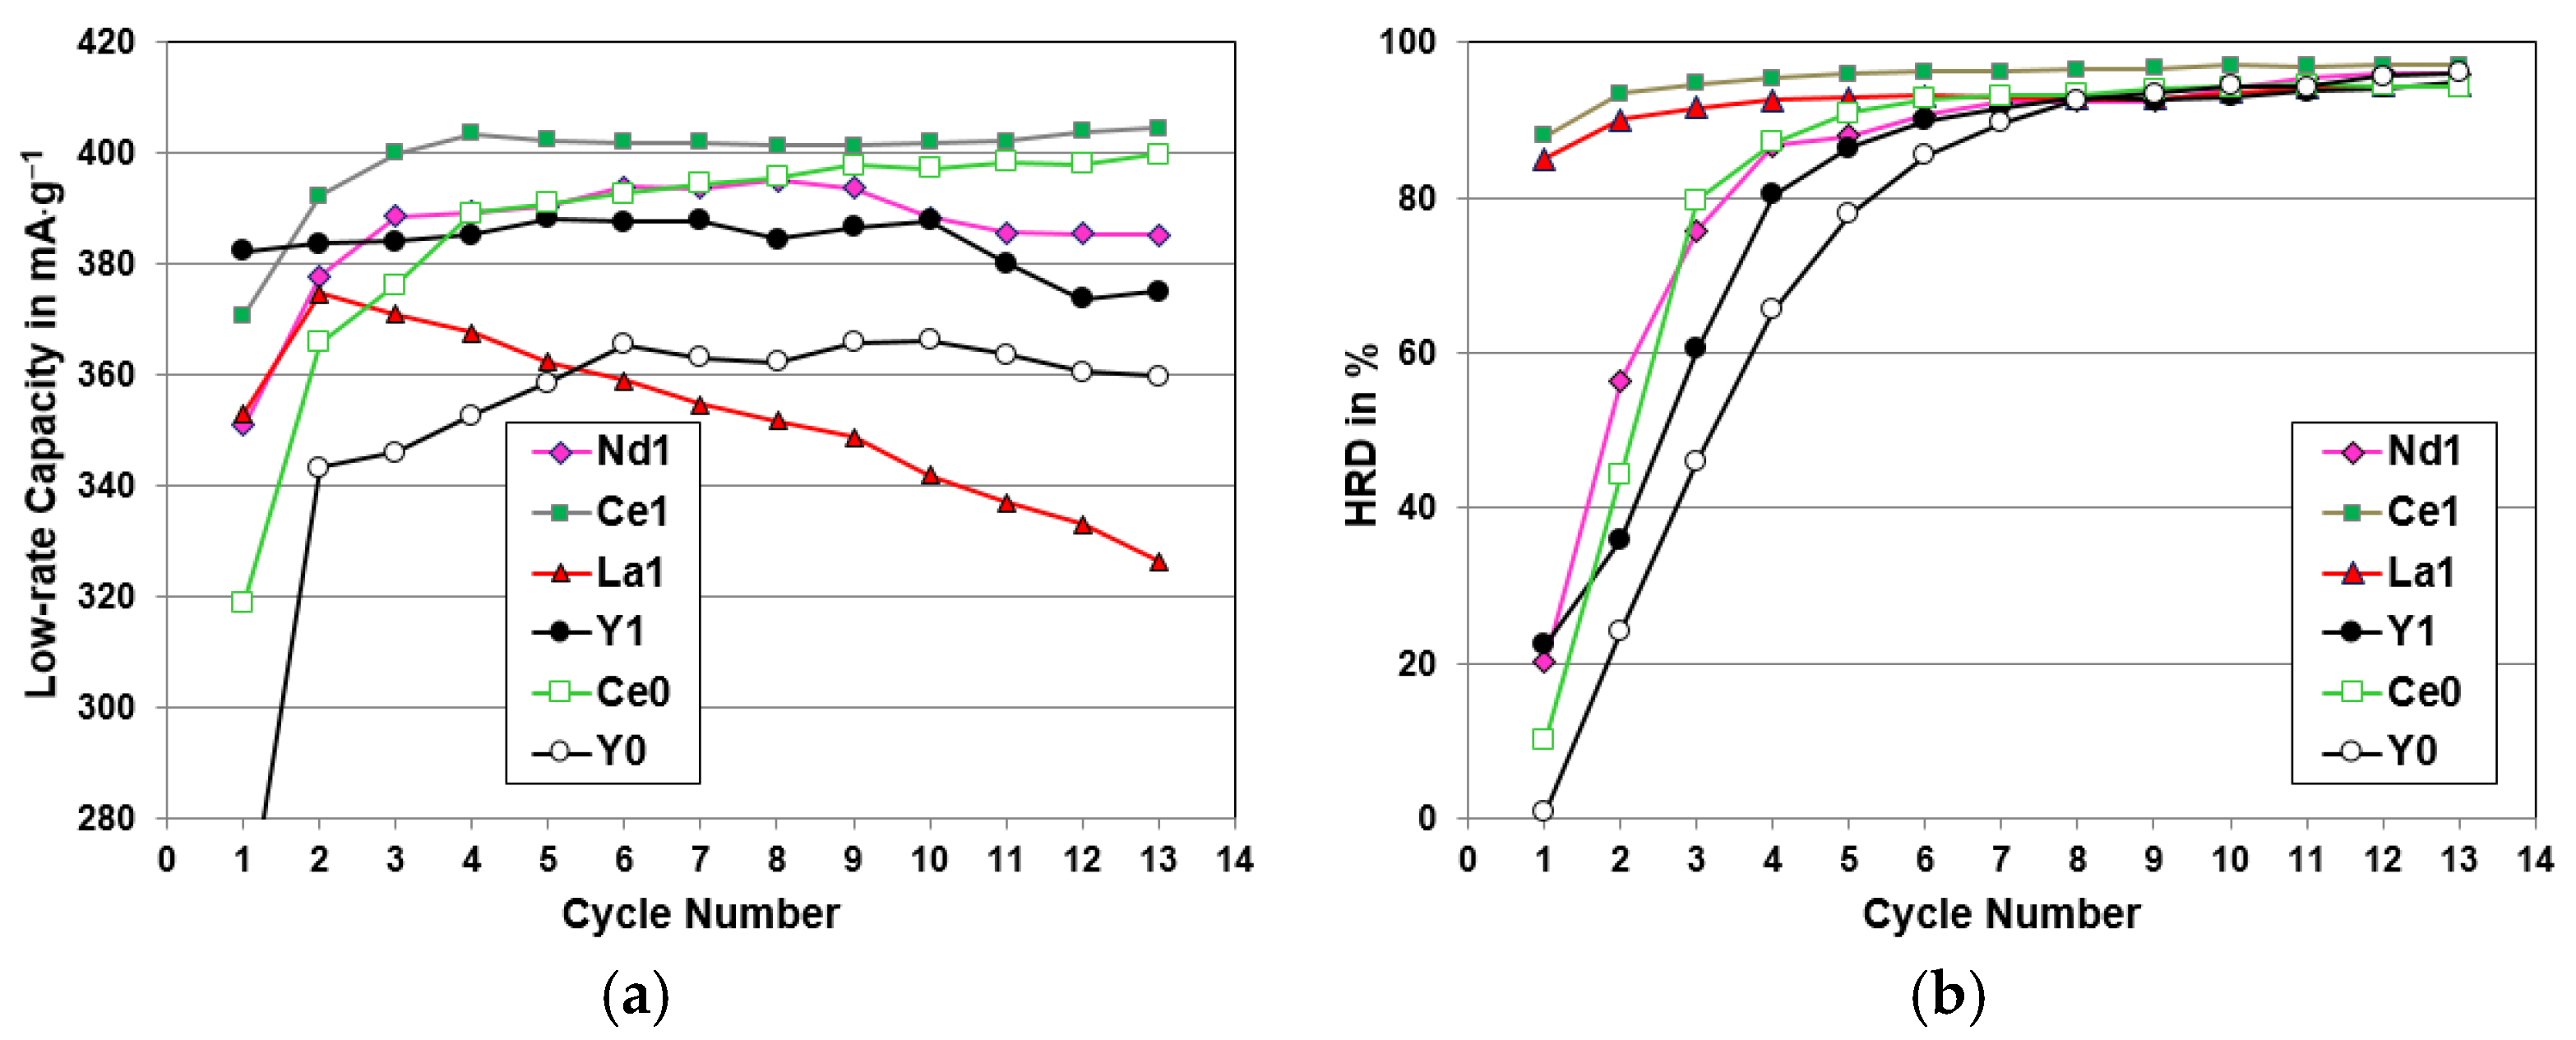
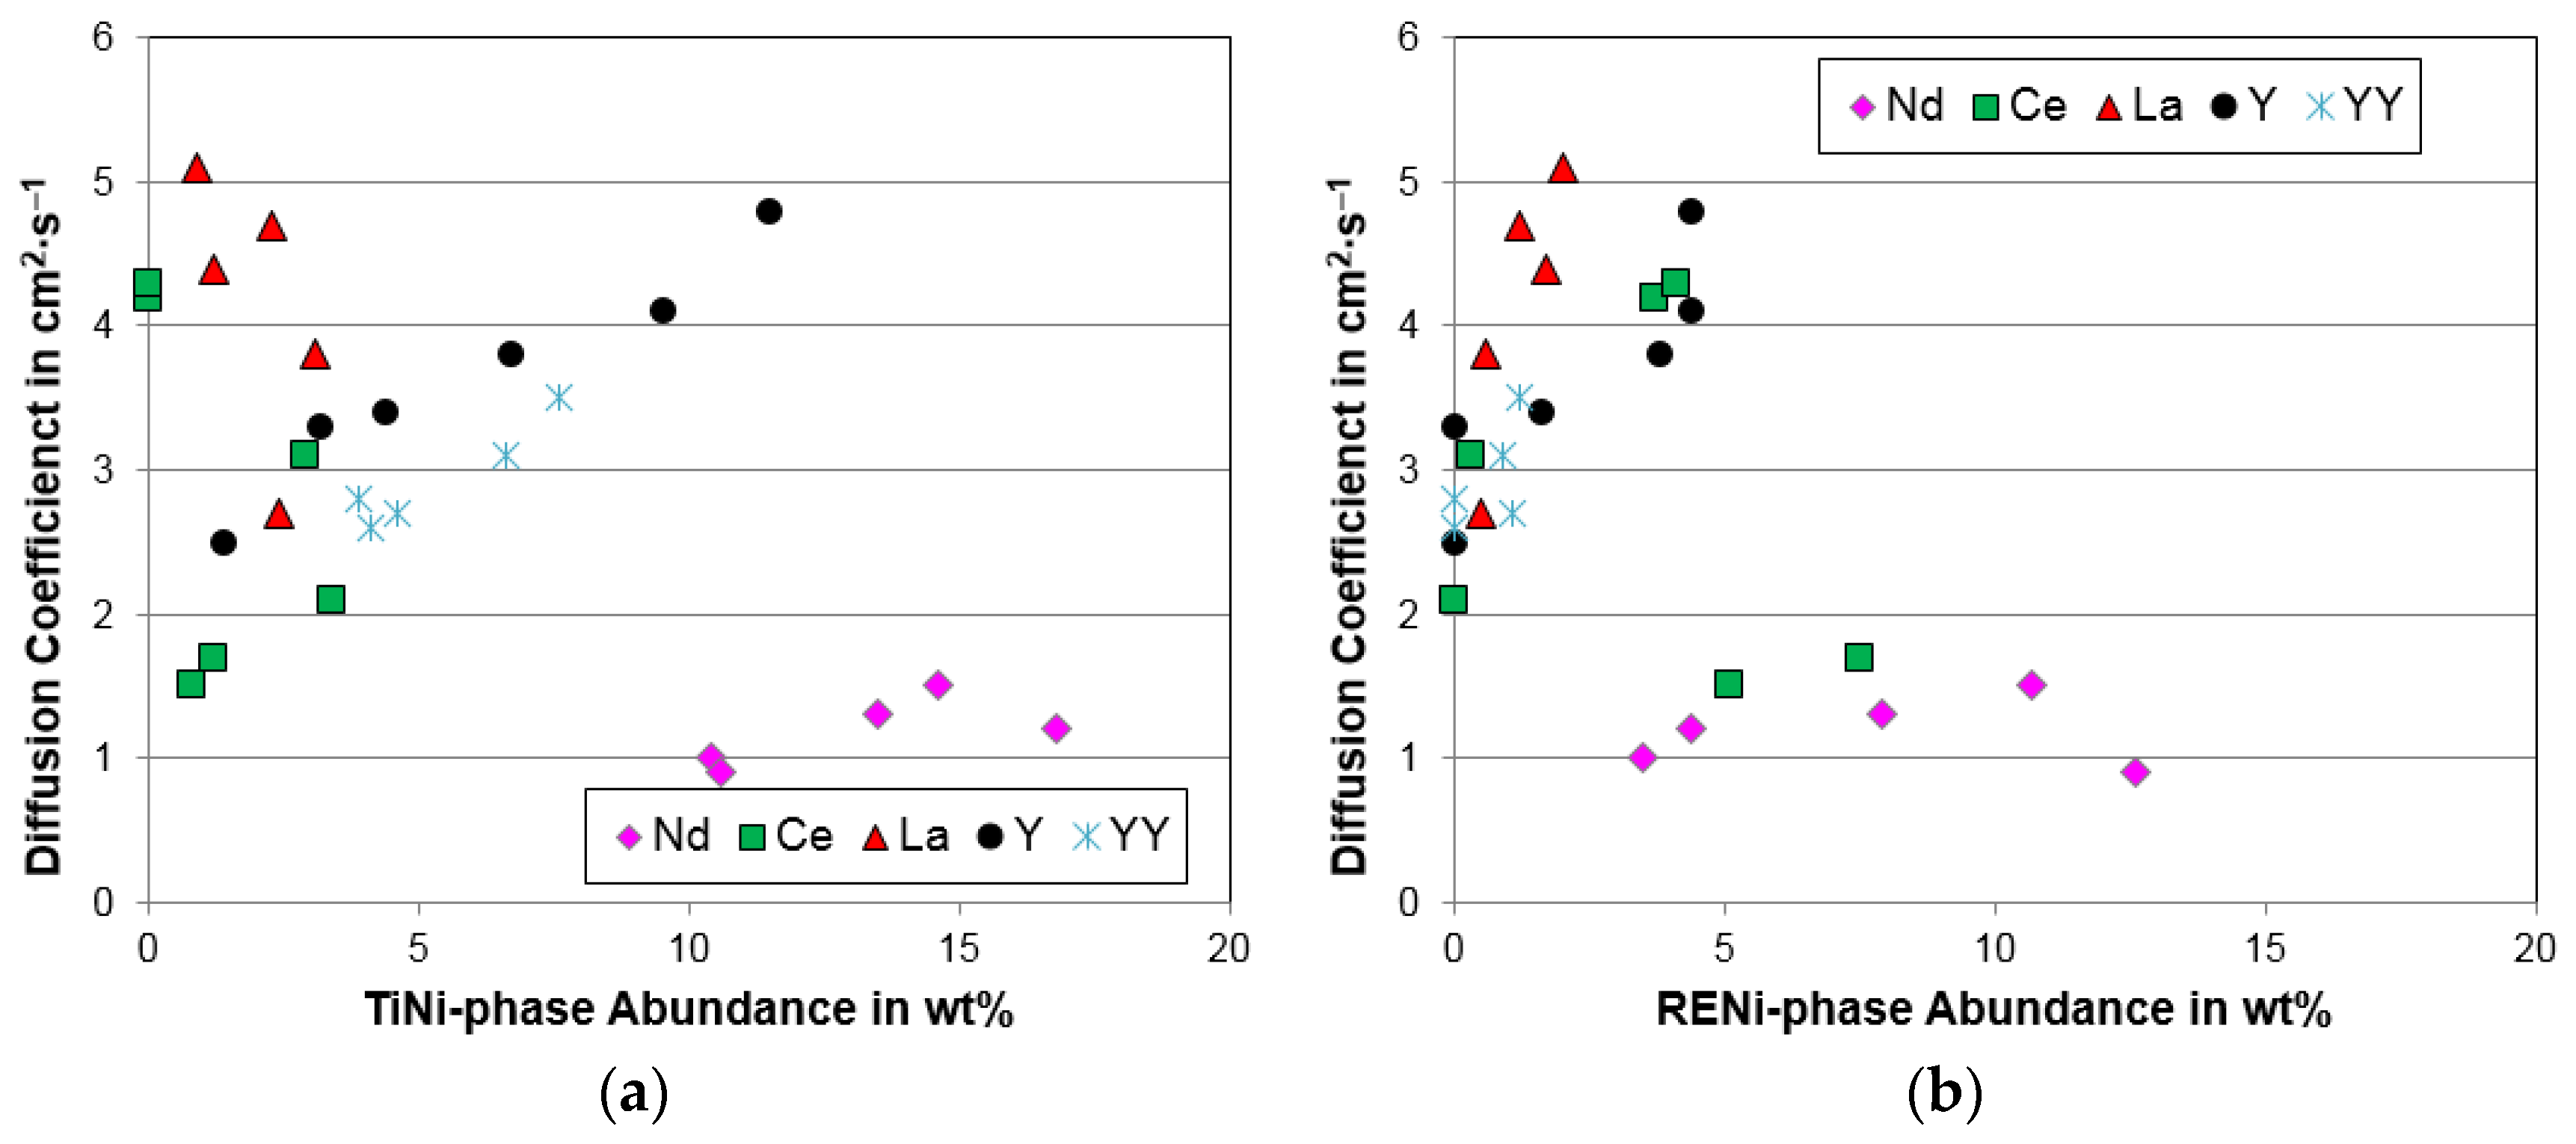
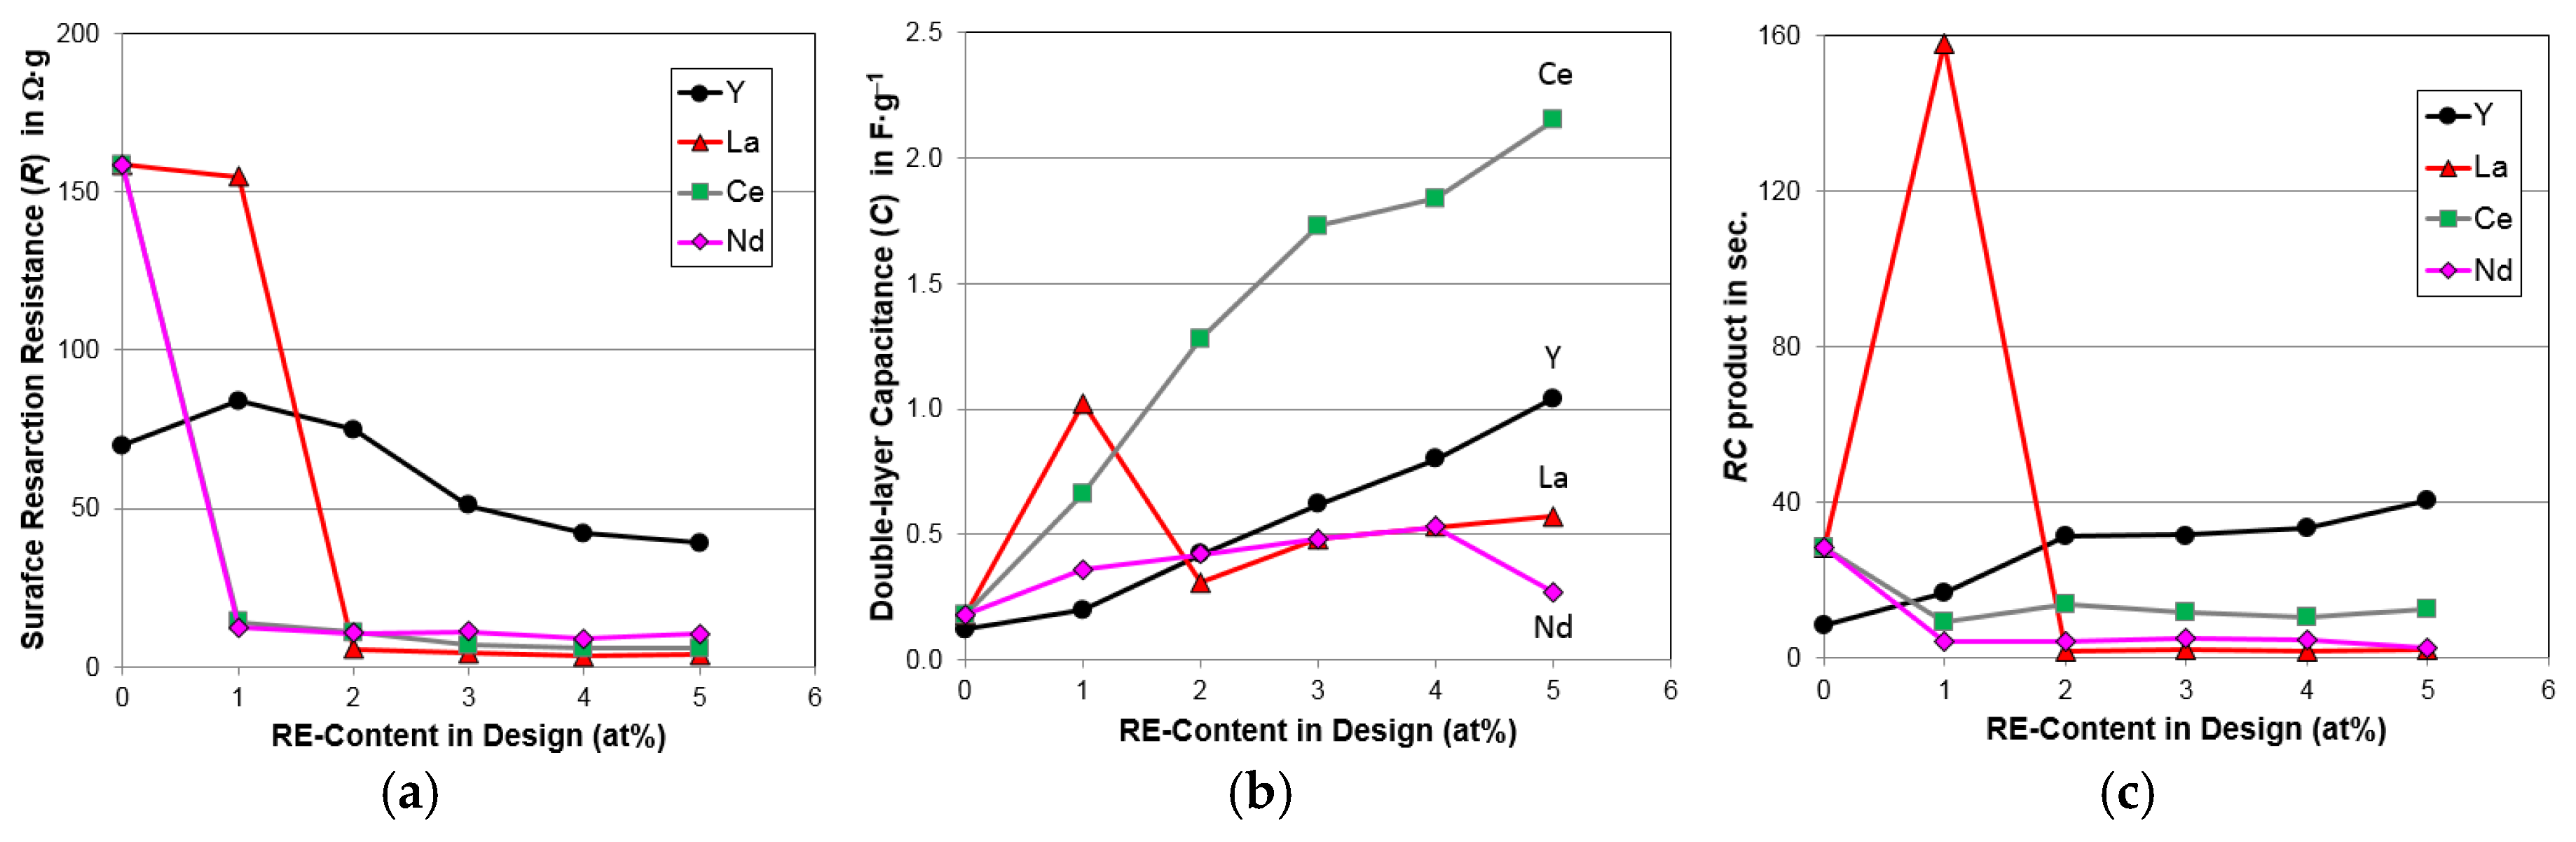
4.4. Electrochemical Analysis

Activation characteristics were studied by half-cell capacity measurements in a flooded configuration. Electrode was made from ground and sieved powder without any annealing or surface acid/alkaline treatments. Low-rate capacities (sum of discharge capacity of 50 mA·g−1 and discharge capacities from two additional pulls at 12 mA·g−1 and 4 mA·g−1) and HRDs (ratio of discharge capacity at 50 mA·g−1 to that at 4 mA·g−1) for the first 13 cycles for each alloy in this study are plotted in Figure 9a,b, respectively. Activations in both capacity and HRD were facilitated by the addition of Ce, and therefore alloys with higher Ce-content activated faster. The improvement in the activation by the addition of RE element is commonly seen and was attributed to the formation of RENi secondary phase with a higher solubility in KOH solution [8,16,17,18]. Both the low-rate discharge capacities and HRDs of the two base alloys (alloys Y0 and Ce0) and alloys with 1 at% RE are compared in Figure 10a,b, respectively. For the low-rate capacity performance, alloy Y1 exhibits the easiest activation due to the ease of oxidation (Y has the lowest oxidation potential in Table 1), and alloy La1 shows a degradation in capacity as a result of the thick and passive surface oxide formation [62]. For the HRD activation, which is more related to the new surface formation from cracking, alloys La1 and Ce1 show the fastest formations due to the relative high solubilities of lanthanum and cerium hydroxides in 30 wt% KOH electrolyte (pH ≈ 14.7 in Equation (1)). Discharge capacities measured at 50 mA·g−1 and 4 mA·g−1 and HRD at the third cycle are listed in Table 6. As the Ce-content in the alloy increases, capacities measured at both rates first increase and then decreases while HRD continues to increase. The highest discharge capacity obtained from this series of alloys is from alloy Ce1 (400 mAh·g−1), which also has the highest gaseous phase storage capacity. Low-rate capacities and HRDs measured at the third cycle for alloys with different RE substitutions are compared in Figure 11a,b, respectively. Alloys Y5 and Ce1 show the highest and second highest low-rate capacities, respectively, and the La- and Ce-substitutions demonstrate the best HRD performances among all the RE-substitutions. Except for YNi, the RENi phases are beneficial for HRD with the trade-off occurring in capacity. By examining both the capacity and HRD results, it is concluded that alloy Ce1 has the best electrochemical properties among all the RE-substituted alloys.
Since the MH alloy can be charged either in the gaseous phase by reacting with hydrogen gas or in the electrochemical environment with protons from water splitting that occurs with voltage, it is always interesting to compare the capacities obtained by these two different paths. After converting the unit of gaseous phase H-storage to that of electrochemical discharge capacity, 1 wt% hydrogen content was found to be equivalent to a discharge capacity of 268 mAh·g−1. Our earlier studies indicated that both the high-rate (50 mA·g−1 for AB2) and low-rate (4 mA·g−1 for AB2) electrochemical capacities are between the boundaries set by the gaseous phase maximum and reversible H-storage capacities but do not necessarily exhibit strong correlations with the gaseous phase capacities [19]. In order to investigate the connection between the gaseous phase and electrochemical measurements, low-rate discharge capacity vs. maximum H-storage capacity and high-rate discharge capacity vs. reversible H-storage capacity for the RE-substituted AB2 MH alloys are plotted in Figure 12a,b, respectively. From these two subfigures, linear correlations can be established in both cases, and the electrochemical discharge capacities occur between the boundaries set by the maximum and reversible H-storage capacities. It is worthwhile to point out that the Ce-containing alloys have the highest reversible H-storage and high-rate discharge capacities as shown in Figure 12b.
Origins of the variations observed in HRD can be studied by the changes in bulk diffusion coefficient (D) and surface reaction current (Io) measured electrochemically. Details of the measurements and data analysis can be found in our earlier publication [17]. Both D and Io of the Ce-containing AB2 MH alloys were measured, and the results are listed in Table 6. In general, both quantities increase and then decrease with increasing Ce-content in the alloy with the exception of Io from alloy Ce4. Both trends are different from the monotonic increase seen in HRD. Therefore, other factors may also play important roles in affecting HRD for this series of alloys. Comparing among various RE-substitutions, D increases with increasing La-, Y-, and Ce-contents but remains low in the case of Nd-substitution (Figure 13a), and Io increases with a small amount of Ce, La, and Y but decreases with a small amount of Nd (Figure 13b). Alloy Ce1 shows the highest Io, which can be attributed to its unique microstructure that contains Ce metal instead of the CeNi phase as in the alloys with higher Ce-contents (Table 4). It appears that Ce metal is more reactive compared to CeNi with KOH electrolyte and thus contributes more to the surface reaction.
In order to study the roles of the TiNi and RENi phases in D and Io, four sets of correlations are shown in Figure 14 and Figure 15. In general, both the TiNi and RENi phase abundances show positive correlations to D with the exception of the Nd-containing alloys, which have the highest RENi- and TiNi-contents but also the lowest Ds (Figure 4). It is possible that the TiNi and RENi phases are beneficial to D only up to certain percentages (approximately 10 wt% and 5 wt% for TiNi and RENi, respectively). Correlations with the TiNi and RENi phase abundances for Io are less obvious, but the general decreasing trends with increasing RENi and TiNi phase abundances are observed (Figure 15). In an earlier effort to differentiate the increasing rates of the YNi and TiNi phases, an off-stoichiometric composition design was adopted [8]. In that study, the increase in YNi phase abundance was suppressed, and Io increased with the increase in TiNi phase abundance (data sets with symbol * in Figure 14 and Figure 15).
Low-temperature performance of the alloys was studied by AC impedance measured at −40 °C. Surface charge-transfer resistance (R) and surface double-layer capacitance (C) of each alloy were calculated from curve fitting of the Cole-Cole plot and are listed in Table 6. Very similar to the case of Nd-substitution, the Ce-containing alloys have much lower R compared to the RE-free base alloy (Figure 16a). The main reason for the reduction in R in the Ce-containing alloys is the increase in surface area represented by the increase in C as the Ce-content increases in the alloy (Figure 16b). RC product, a quantity inversely proportional to the surface catalytic ability, from the Ce-containing alloys are higher (less catalytic) than those from the La- and Nd-containing alloys.

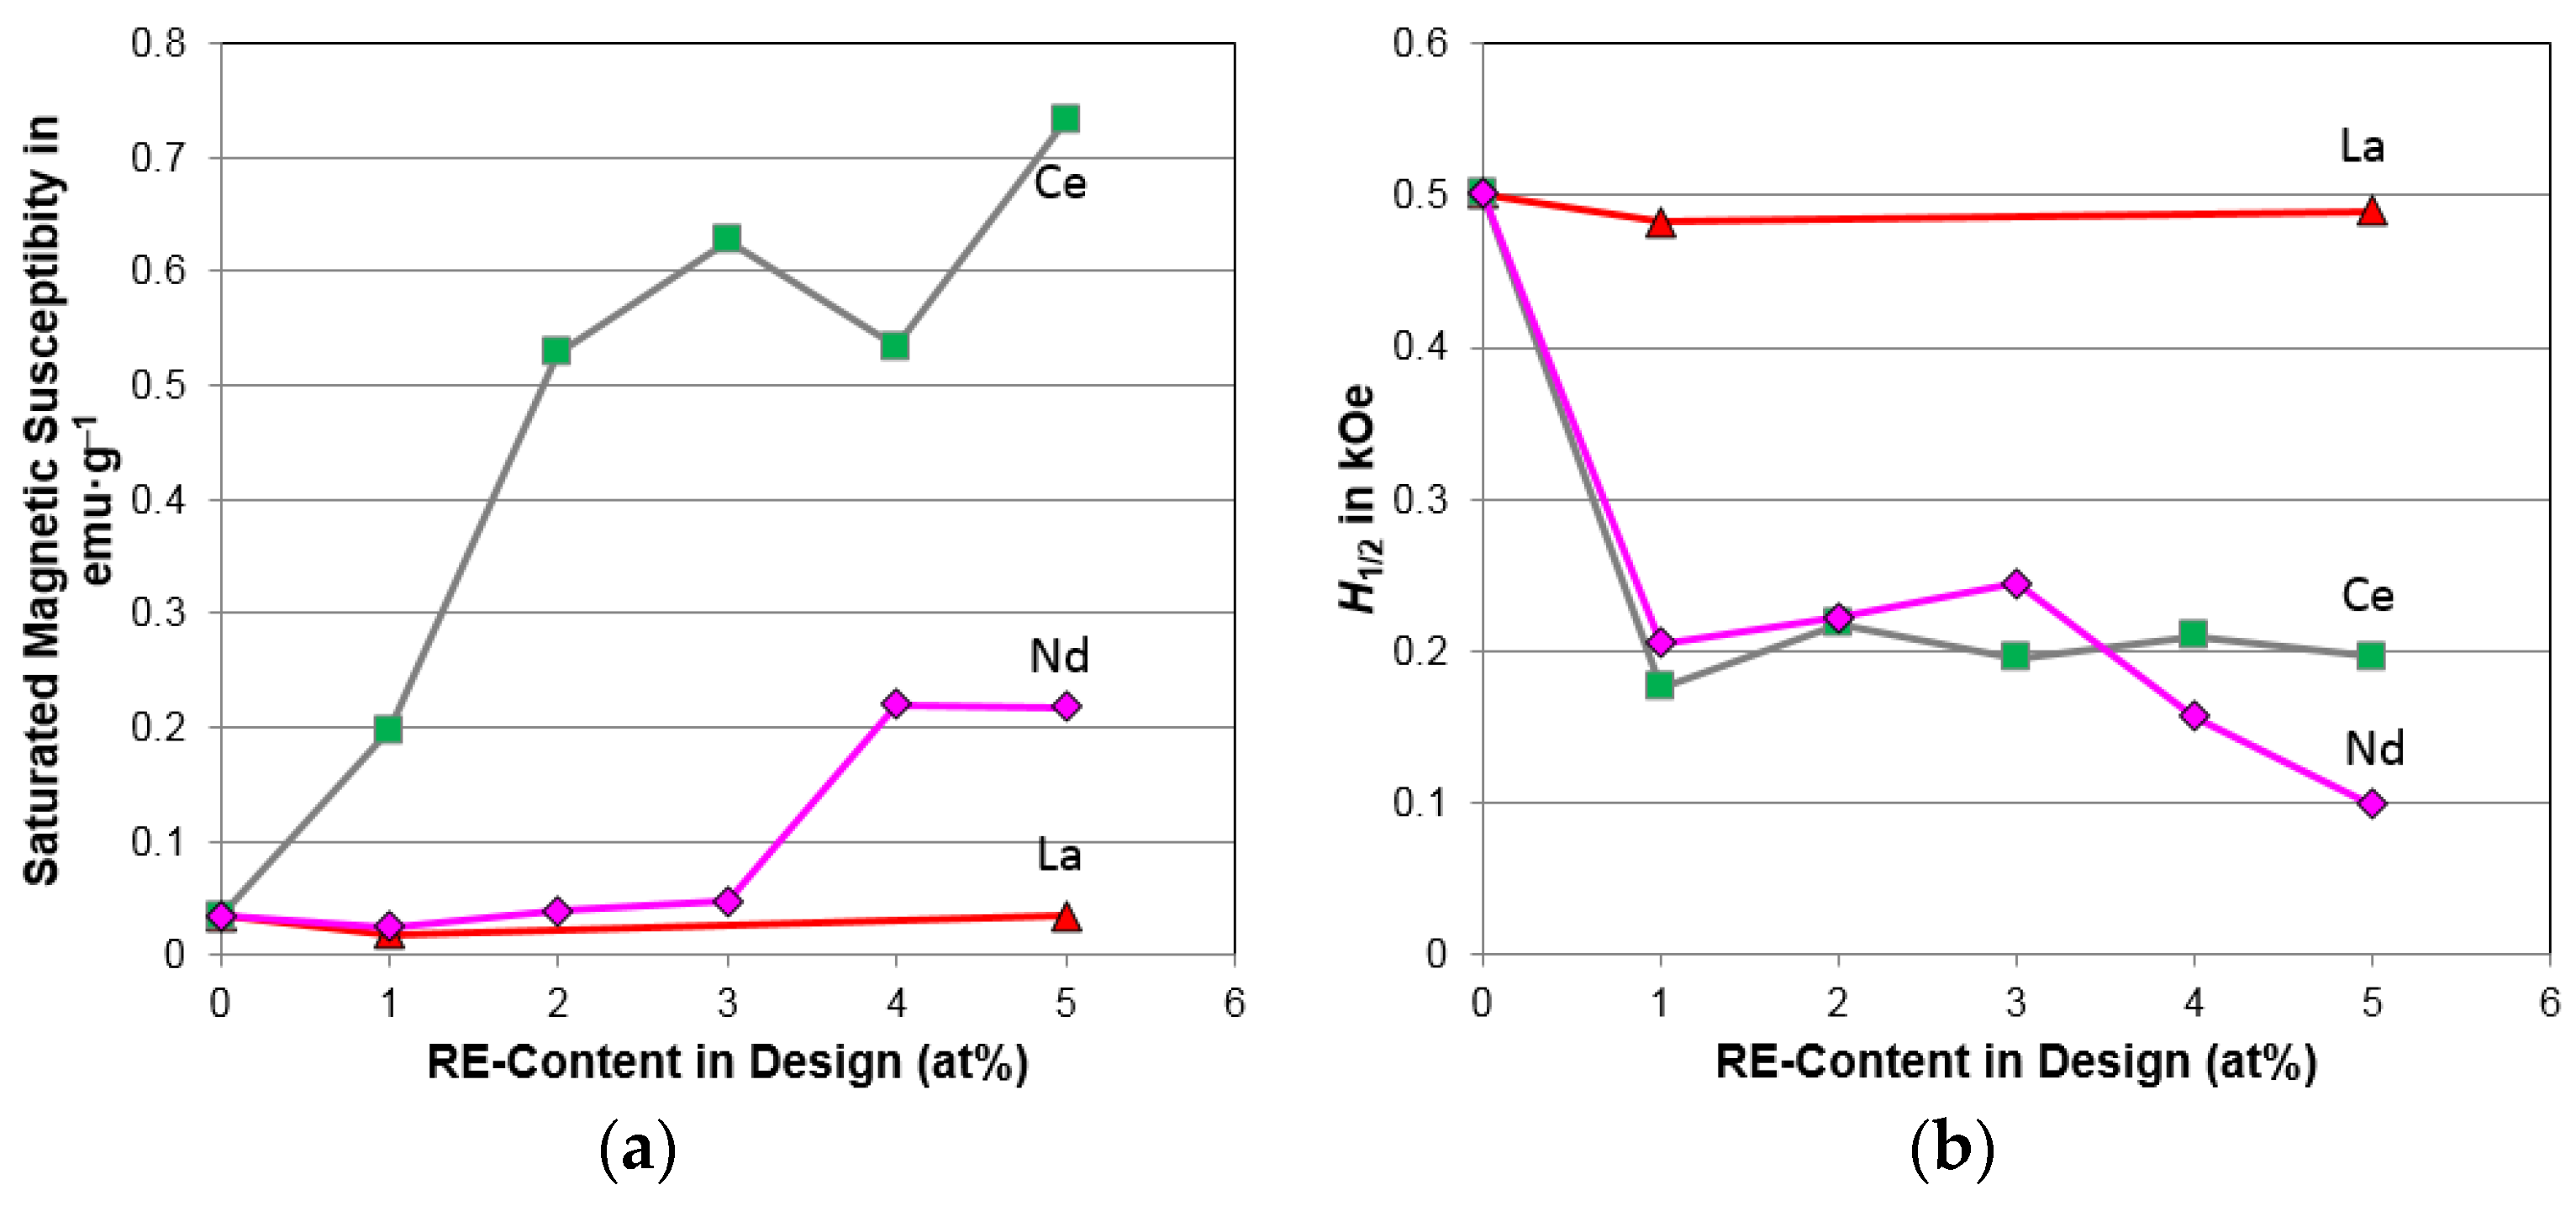
4.5. Magnetic Properties

In most MH alloys, the HRD characteristics are heavily affected by the density of metallic Ni-inclusion embedded in the surface oxide [63,64,65,66]. Thus far, the Si-containing AB2 MH alloys are the only type of alloy where the HRD performance is dominated by the clean oxide/metal interface but not the occurrence of metallic Ni [67]. Both the total saturated magnetic susceptibility (Ms, related to the total volume of metallic Ni-clusters) and applied field corresponding to half of Ms (H1/2, inversely proportional to the average number of Ni atoms in a cluster) were calculated from the plot of measured M.S. versus applied magnetic field (as in [65]) and are listed in Table 6. As the Ce-content in the alloy increases, Ms increases, and H1/2 drops precipitously and then remains approximately the same. The Ce/CeNi phase in the Ce-containing alloys promotes the formation of metallic Ni-clusters embedded in the surface oxide with a size around two and half times larger than those in the Ce-free base alloy. When these two properties (Ms and H1/2) are compared among all the RE-substitutions, as shown in Figure 17, the Ce-doped alloys have the highest Ms values, which is in agreement of their high HRD (Figure 11b) and Io (Figure 13b) values. The La-substitution shows the lowest Ms but still exibits comparable HRD to that of the Ce-substitution due to the unique clean interface between the alloy and surface catalytic Ni(OH)2 layer [62]. All the Ce- and Nd-doped alloys have approximately the same size of metallic Ni-clusters that are larger than those in the undoped base alloy (Figure 17b), which is very different from the unchanged size of Ni-clusters observed in the La-doped alloys. The relatively high solubility of the La ion promotes the formation of a catalytic Ni(OH)2 layer directly onto the metal surface instead of having the metallic Ni embedded in the surface oxide/hydroixde of Nd or Ce.

5. Conclusions

We have analyzed and compared the effects of various RE-substitutions to the Zr-based AB2 MH alloys on the structure, gaseous phase H-storage, and electrochemical properties. The additions of RE elements were found to facilitate activation and improve the HRD and low-temperature electrochemical performance. Among all of the substitutions, the Ce-substitution was found to be the most effective in reducing the PCT isotherm hysteresis (improving the cycle stability), increasing the electrochemical capacity, and increasing the total volume of metallic Ni-clusters embedded in the surface oxide, reactive surface area, and consequently surface reaction current. Overall, our observations indicate that a 1 at% Ce-substitution in the AB2 MH alloy can improve the electrochemical properties and is a viable option for Ni/MH rechargeable batteries.

Acknowledgments

The authors would like to thank the following individuals from BASF-Ovonic for their help: Su Cronogue, Baoquan Huang, Diana F. Wong, David Pawlik, Allen Chan, and Ryan J. Blankenship.

Author Contributions

Kwo-Hsiung Young designed the experiments and analyzed the results. Taihei Ouchi prepared the alloy samples and performed the PCT and XRD analyses. Jean Nei prepared the electrode samples and conducted the magnetic measurements. Dhanashree Moghe assisted in data analysis and manuscript preparation.

Conflicts of Interest

The authors declare no conflict of interest.

Abbreviations

Ni/MHNickel/metal hydride
MHMetal hydride
RERare earth
ICP-OESInductively coupled plasma-optical emission spectrometer
XRDX-ray diffractometer
SEMScanning electron microscope
EDSEnergy dispersive spectroscopy
PCTPressure–concentration–temperature
H-storageHydrogen storage
M.S.Magnetic susceptibility
M.P.Melting point
HCPHexagonal closest-packed
DHCPDouble- c hexagonal close-packed
e/aAverage electron density
DODDegree of disorder
VC14Unit cell volume of the C14 phase
FWHMFull-width at half-maximum
SEISecondary electron image
BEIBack-scattering electron image
HRDHigh-rate dischargeability
Δ HhHeat of hydride formation
Δ ShChange in entropy
M–HMetal–hydrogen
SFSlope factor
PaAbsorption equilibrium pressure at 0.75 wt% H-storage
PdDesorption equilibrium pressure at 0.75 wt% H-storage
βHydride phase
αMetal phase or alloy matrix
RIdeal gas constant
TAbsolute temperature
DBulk diffusion coefficient
IoSurface exchange current
RSurface charge-transfer resistance
CSurface double-layer capacitance
MsSaturated magnetic susceptibility
H1/2Applied magnetic field strength corresponding to half of saturated magnetic susceptibility

References

  1. Wikipedia, the Free Encyclopedia. Nickel–Metal Hydride Battery. Available online: https://en.wikipedia.org/wiki/Nickel%E2%80%93metal_hydride_battery (accessed on 14 April 2016).
  2. Zelinsky, M.; Koch, J.; Fetcenko, M. Heat Tolerant NiMH Batteries for Stationary Power. Available online: www.battcon.com/PapersFinal2010/ZelinskyPaper2010Final_12.pdf (accessed on 28 March 2016).
  3. Zelinsky, M.; Koch, J. Batteries and Heat—A Recipe for Success? Available online: www.battcon.com/PapersFinal2013/16-Mike%20Zelinsky%20-%20Batteries%20and%20Heat.pdf (accessed on 28 March 2016).
  4. Young, K.; Nei, J. The current status of hydrogen storage alloy development for electrochemical applications. Materials 2013, 6, 4574–4608. [Google Scholar] [CrossRef]
  5. Chang, S.; Young, K.; Nei, J.; Fierro, C. Reviews on the U.S. Patents regarding nickel/metal hydride batteries. Batteries 2016, 2. [Google Scholar] [CrossRef]
  6. Young, K.; Ouchi, T.; Koch, J.; Fetcenko, M.A. The role of Mn in C14 Laves phase multi-component alloys for NiMH battery application. J. Alloys Compd. 2009, 477, 749–758. [Google Scholar] [CrossRef]
  7. Young, K.; Reichman, B.; Fetcenko, M.A. Electrochemical properties of AB2 metal hydride alloys measured at −40 °C. J. Alloys Compd. 2013, 580, S349–S353. [Google Scholar] [CrossRef]
  8. Young, K.; Wong, D.F.; Nei, J.; Reichman, B. Electrochemical properties of hypo-stoichiometric Y-doped AB2 metal hydride alloys at ultra-low temperature. J. Alloys Compd. 2015, 643, 17–27. [Google Scholar] [CrossRef]
  9. Huang, B.; Young, K.; BASF-Ovonic. Private Communication, 2016.
  10. Kim, S.; Lee, J.; Park, H. A study of the activation behavior of ZrCrNiLa metal hydride electrodes in alkaline solution. J. Alloys Compd. 1994, 205, 225–229. [Google Scholar] [CrossRef]
  11. Jung, J.; Lee, K.; Lee, J. The activation mechanism of Zr-based alloy electrodes. J. Alloys Compd. 1995, 226, 166–169. [Google Scholar] [CrossRef]
  12. Sun, D.; Latroche, M.; Percheron-Guégan, A. Effects of lanthanum or cerium on the equilibrium of ZrNi1.2Mn0.6V0.2Cr0.1 and its related hydrogenation properties. J. Alloys Compd. 1997, 248, 215–219. [Google Scholar] [CrossRef]
  13. Park, H.Y.; Cho, W.I.; Cho, B.W.; Lee, S.R.; Yun, K.S. Effect of fluorination on the lanthanum-doped AB2-type metal hydride electrodes. J. Power Sources 2001, 92, 149–156. [Google Scholar] [CrossRef]
  14. Park, H.Y.; Chang, I.; Cho, W.I.; Cho, B.W.; Jang, H.; Lee, S.R.; Yun, K.S. Electrode characteristics of the Cr and La dopes AB2-type hydrogen storage alloys. Int. J. Hydrog. Energy 2001, 26, 949–955. [Google Scholar] [CrossRef]
  15. Gao, M.; Miao, H.; Zhao, Y.; Liu, Y.; Pan, H. Effects of rare earth elements substitution for Ti on the structure and electrochemical properties of Fe-doped Ti-V-based hydrogen storage alloy. J. Alloys Compd. 2009, 484, 249–255. [Google Scholar] [CrossRef]
  16. Young, K.; Young, M.; Ouchi, T.; Reichman, B.; Fetcenko, M.A. Improvement in high-rate dischargeability, activation, and low-temperature performance in multi-phase AB2 alloys by partial substitution of Zr with Y. J. Power Sources 2012, 215, 279–287. [Google Scholar] [CrossRef]
  17. Young, K.; Wong, D.F.; Ouchi, T.; Huang, B.; Reichman, B. Effects of La-addition to the structure, hydrogen storage, and electrochemical properties of C14 metal hydride alloys. Electrochim. Acta 2015, 174, 815–825. [Google Scholar] [CrossRef]
  18. Wong, D.F.; Young, K.; Nei, J.; Wang, L.; Ng, K.Y.S. Effects of Nd-addition on the structural, hydrogen storage, and electrochemical properties of C14 metal hydride alloys. J. Alloys Compd. 2015, 647, 507–518. [Google Scholar] [CrossRef]
  19. Young, K.; Fetcenko, M.A.; Li, F.; Ouchi, T. Structural, thermodynamics, and electrochemical properties of TixZr1–x(VNiCrMnCoAl)2 C14 Laves phase alloys. J. Alloys Compd. 2008, 464, 238–247. [Google Scholar] [CrossRef]
  20. Young, K.; Fetcenko, M.A.; Koch, J.; Morii, K.; Shimizu, T. Studies of Sn, Co, Al, and Fe additives in C14/C15 Laves alloys for NiMH battery application by orthogonal arrays. J. Alloy. Compd. 2009, 486, 559–569. [Google Scholar] [CrossRef]
  21. Wikipedia, the Free Encyclopedia. Rare Earth Element. Available online: https://en.wikipedia.org/wiki/Rare_earth_element (accessed on 14 April 2016).
  22. Yaroslavtsev, A.; Menushenkov, A.; Chernikov, R.; Clementyev, E.; Lazukov, V.; Zubavichus, Y.; Veligzhanin, A.; Efremova, N.; Gribanov, A.; Kuchin, A. Ce valence in intermetallic compounds by means of XANES spectroscopy. Z. Kristallogr. 2010, 225, 482–486. [Google Scholar] [CrossRef]
  23. Gschneidner, K.A. Rare-Earth Element. Available online: http://www.britannica.com/science/rare-earth-element (accessed on 14 April 2016).
  24. Young, K.; Wong, D.F.; Wang, L.; Nei, J.; Ouchi, T.; Yasuoka, S. Mn in misch-metal based superlattice metal hydride alloy—Part 1 Structural, hydrogen storage and electrochemical properties. J. Power Sources 2015, 277, 426–432. [Google Scholar] [CrossRef]
  25. Yasuoka, S.; Ishida, J. Effects of cerium (Ce) on the hydrogen absorption-desorption characteristics of RE-Mg-Ni hydrogen absorbing alloy. J. Power Sources 2016. submitted for publication. [Google Scholar]
  26. Young, K.; Chao, B.; Liu, Y.; Nei, J. Microstructures of the oxides on the activated AB2 and AB5 metal hydride alloys surface. J. Alloys Compd. 2014, 606, 97–104. [Google Scholar] [CrossRef]
  27. Lide, D.R. CRC Handbook of Chemistry and Physics, 74th ed.; CRC Press Inc.: Boca Raton, FL, USA, 1993; pp. 6–22. [Google Scholar]
  28. Long, K.R.; Van Gosen, B.S.; Foley, N.K.; Cordier, D. The Principal Rare Earth Elements Deposits of the United States—A Summary of Domestic Deposits and a Global Perspective; Scientific Investigations Report 2010-5220; U.S. Geological Survey: Reston, VA, USA, 2010.
  29. Gakkai, N.K. Hi Kagaku Ryouronteki Kinzoku Kagobutu; Maruzen: Tokyo, Japan, 1975; p. 296. [Google Scholar]
  30. Griessen, R.; Riesterer, T. Heat of Formation Models. In Hydrogen in Intermetallic Compounds I.; Schlapbach, L., Ed.; Springer-Verlag Berlin Heidelberg: Berlin, Germany, 1988. [Google Scholar]
  31. Courcot, E.; Rebillat, F.; Teyssandier, F. Thermochemical Stability of Rare Earth Sesquioxides under a Most Environment. In Design, Development, and Applications of Engineering Ceramics and Composites: Ceramic Transaction; Singh, D., Zhu, D., Zhou, Y., Eds.; John Wiley & Sons: New York, NY, USA, 2010; Volume 215. [Google Scholar]
  32. Cordfunke, E.H.P.; Konings, R.J.M.; Ouweltjes, W. The standard enthalpies of formation of hydroxides IV. La(OH)3 and LaOOH. J. Chem. Thermodyn. 1990, 22, 449–452. [Google Scholar] [CrossRef]
  33. Fang, Z.; Thanthiriwatte, K.S.; Dixon, D.A.; Andrews, L.; Wang, X. Properties of cerium hydroxides from matrix infrared spectra and electronic structure calculations. Inorg. Chem. 2015, 55, 1702–1714. [Google Scholar] [CrossRef] [PubMed]
  34. Ekberg, C.; Brown, P.L. Hydrolysis of Metal Ions; Wiley-VCH Verlag GmbH & Co: Weinheim, Germany, 2016; p. 265. [Google Scholar]
  35. Merli, L.; Fuger, J. Thermochemistry of a few neptunium and neodymium oxides and hydroxides. Radiochim. Acta 1994, 66–67, 109–113. [Google Scholar] [CrossRef]
  36. Pourbaix, M. Atlas of Electrochemical Equilibrium in Aqueous Solutions; National Association of Corrosion Engineers: Houston, TX, USA, 1974. [Google Scholar]
  37. Powder Diffraction File (PDF) Database; MSDS No. 00-014-0481; International Centre for Diffraction Data: Newtown Square, PA, USA, 2011.
  38. Massalski, T.B. Binary Alloy Phase Diagrams; ASM International: Materials Park, OH, USA, 1990. [Google Scholar]
  39. Du, Z.; Yang, L.; Ling, G. Thermodynamic assessment of the Ce-Ni system. J. Alloys Compd. 2004, 375, 186–190. [Google Scholar] [CrossRef]
  40. Boer, F.R.; Boom, R.; Mattens, W.C.M.; Miedema, A.R.; Niessen, A.K. Cohesion in Metals Transition Metal Alloys; North-Holland: Amsterdam, The Netherlands, 1988; p. 302. [Google Scholar]
  41. Chen, N.; Lu, W.; Yang, J.; Li, G. Support Vector Machine in Chemistry; World Scientific Pub. Co.: Singapore, 2004; p. 148. [Google Scholar]
  42. Colinet, C.; Pasturel, A. Enthalpies of formation of RNi5 compounds. Inorg. Chim. Acta 1984, 94, 66–67. [Google Scholar] [CrossRef]
  43. Hussain, A.; Ende, A.V.; Kim, J.; Jung, I. Critical thermodynamic evaluation and optimization of the Co-Nd, Cu-Nd and Nd-Ni system. Calphad 2013, 41, 26–41. [Google Scholar] [CrossRef]
  44. Osumi, Y. Suiso Kyuzou Goukin; Agune Co. Ltd.: Tokyo, Japan, 1993; p. 54. [Google Scholar]
  45. Lundin, C.E.; Lynch, F.E.; Magg, C.B. A correlation between the interstitial hole sizes in intermetallic compounds and the thermodynamic properties of the hydrides formed from those compounds. J. Less Common Met. 1977, 56, 19–37. [Google Scholar] [CrossRef]
  46. Luo, Q.; Chen, S.; Zhang, J.; Li, L.; Chou, K.; Li, Q. Experimental investigation and thermodynamic assessment of Nd-H and Nd-Ni-H systems. Calphad 2015, 51, 282–291. [Google Scholar] [CrossRef]
  47. Thoma, D.J.; Perepezko, J.H. A geometric analysis of solubility ranges in Laves phases. J. Alloys Compd. 1995, 224, 330–341. [Google Scholar] [CrossRef]
  48. Crystal Structures of CrB and FeB. Available online: http://www.hardmaterials.de/html/crb__feb.html (accessed on 14 April 2016).
  49. Matar, S.F.; Nakhl, M.; Alam, A.F.A.; Ouaini, N.; Chevalier, B. YNi and its hydrides: Phase stabilities, electronic structures and chemical bonding properties from first principles. Chem. Phys. 2010, 377, 109–114. [Google Scholar] [CrossRef]
  50. Maeland, A.; Andresen, A.F.; Videm, K. Hydrides of lanthanum-nickel compounds. J. Less Common. Met. 1976, 45, 347–350. [Google Scholar] [CrossRef]
  51. Buschow, K.H.J.; Bouten, P.C.P.; Miedema, A.R. Hydrides formed from inter metallic compounds of two transition metals: A special class of ternary alloy. Rep. Prog. Phys. 1982, 45, 939–1039. [Google Scholar] [CrossRef]
  52. Bobet, J.L.; Grigorova, E.; Chevalier, B.; Khrussanova, M.; Peshev, P. Hydrogenation of CeNi: Hydride formation, structure and magnetic properties. Intermetallics 2006, 14, 208–212. [Google Scholar] [CrossRef]
  53. Kolomiets, A.V.; Miliyanchuk, K.; Galadzhun, Y.; Havela, L.; Vejpravova, J. PrNi and CeNi hydrides with extremely high H-density. J. Alloys Compd. 2005, 402, 95–97. [Google Scholar] [CrossRef]
  54. Nei, J.; Young, K.; Salley, S.O.; Ng, K.Y.S. Determination of C14/C15 phase abundance in Laves phase alloys. Mater. Chem. Phys. 2012, 136, 520–527. [Google Scholar] [CrossRef]
  55. Young, K. Stoichiometry in Inter-Metallic Compounds for Hydrogen Storage Applications. In Stoichiometry and Materials Science—When Numbers Matter; Innocenti, A., Kamarulzaman, N., Eds.; Intech: Rijeka, Croatia, 2012. [Google Scholar]
  56. Young, K.; Nei, J.; Ouchi, T.; Fetcenko, M.A. Phase abundances in AB2 metal hydride alloys and their correlations to various properties. J. Alloys Compd. 2011, 509, 2277–2284. [Google Scholar] [CrossRef]
  57. Young, K.; Ouchi, T.; Lin, X.; Reichman, B. Effects of Zn-addition to C14 metal hydride alloys and comparisons to Si, Fe, Cu, Y, and Mo-additives. J. Alloys Compd. 2016, 655, 50–59. [Google Scholar] [CrossRef]
  58. Scholtus, N.A.; Hall, W.K. Hysteresis in the palladium-hydrogen system. J. Chem. Phys. 1963, 39, 868–870. [Google Scholar] [CrossRef]
  59. Makenas, B.J.; Birnbaum, H.K. Phase changes in the niobium-hydrogen system I: Accommodation effects during hydride precipitation. Acta Metall. 1980, 28, 979–988. [Google Scholar] [CrossRef]
  60. Balasubramaniam, R. Accommodation effects during room temperature hydrogen transformations in the niobium-hydrogen system. Acta Metall. Mater. 1993, 41, 3341–3349. [Google Scholar] [CrossRef]
  61. Young, K.; Ouchi, T.; Fetcenko, M.A. Pressure-composition-temperature hysteresis in C14 Laves phase alloys: Part 1. Simple ternary alloys. J. Alloys Compd. 2009, 480, 428–433. [Google Scholar] [CrossRef]
  62. Young, K.; Chao Pawlik, D.; Shen, H.T. Transmission electron microscope studies in the surface oxide on the La-containing AB2 metal hydride alloy. J. Alloys Compd. 2016, 672, 356–365. [Google Scholar] [CrossRef]
  63. Züttle, A.; Meli, F. Electrochemical and surface properties of Zr(VxNi1−x)2 alloys as hydrogen absorbing electrodes in alkaline electrolyte. J. Alloys Compd. 1994, 203, 235–241. [Google Scholar] [CrossRef]
  64. Young, K.; Huang, B.; Regmi, R.K.; Lawes, G.; Liu, Y. Comparisons of metallic clusters imbedded in the surface of AB2, AB5, and A2B7 alloys. J. Alloys Compd. 2010, 506, 831–840. [Google Scholar] [CrossRef]
  65. Chang, S.; Young, K.; Ouchi, T.; Meng, T.; Nei, J.; Wu, X. Studies on incorporation of Mg in Zr-based AB2 metal hydride alloys. Batteries 2016, 2. [Google Scholar] [CrossRef]
  66. Young, K.; Wong, D.F.; Nei, J. Effects of vanadium/nickel contents in Laves phase-related body-centered-cubic solid solution metal hydride alloys. Batteries 2015, 1, 34–53. [Google Scholar] [CrossRef]
  67. Young, K.; Chao, B.; Nei, J. Microstructures of the activated Si-containing AB2 metal hydride alloy surface by transmission electron microscope. Batteries 2016, 2. [Google Scholar] [CrossRef]
Figure 1. (a) CrB- and (b) FeB-type structures. Green and black circles represent the RE and Ni atoms, respectively. Both structures are composed of trigonal prisms containing four RE and four Ni atoms. While the RE atoms form a HCP stacking, the Ni atoms form a zigzag chain in both cases. Reprinted from [48].
Batteries 02 00025 g001
Figure 2. X-ray diffraction (XRD) patterns from alloys: (a) Ce0; (b) Ce1; (c) Ce2; (d) Ce3; (e) Ce4; and (f) Ce5. Vertical lines show the shift exists for the C14 peak but not for the CeNi or TiNi phases.
Batteries 02 00025 g002
Figure 3. Evolutions of the C14 lattice constants a and c with increasing Ce-content in the design.
Batteries 02 00025 g003
Figure 4. Evolutions of (a) TiNi and (b) RENi phase abundances with increasing RE-content in the design.
Batteries 02 00025 g004
Figure 5. Scanning electron microscope (SEM)-back-scattering electron images (BEI) micrographs from alloys: (a) Ce1; (b) Ce2; (c) Ce3; (d) Ce4; and (e) Ce5. The bar at the lower right corner represents a scale of 25 μm.
Batteries 02 00025 g005
Figure 6. Pressure–concentration–temperature (PCT) isotherms measured at 30 °C for (a) alloys Ce0, Ce1, and Ce2; and (b) alloys Ce3, Ce4, and Ce5; and at 60 °C for (c) alloys Ce0, Ce1, and Ce2; and (d) alloys Ce3, Ce4, and Ce5.
Batteries 02 00025 g006
Figure 7. Evolutions of (a) maximum H-storage capacity and (b) PCT absorption–desorption hysteresis with increasing RE-content in the design.
Batteries 02 00025 g007
Figure 8. Correlations between the maximum H-storage and (a) equilibrium pressure at 0.75 wt% H-storage; and (b) C14 phase unit cell volume.
Batteries 02 00025 g008
Figure 9. Activation characteristics shown by (a) discharge capacities with the lowest discharge current (4 mA·g−1); and (b) high-rate dischargeabilities for the first 13 cycles for the alloys in this study.
Batteries 02 00025 g009
Figure 10. Comparisons of the activation behaviors in (a) capacity and (b) high-rate dischargeability (HRD) among the RE-free alloys (alloys Y0 and Ce) and 1 at% RE-containing alloys (alloys Y1, La1, Ce1, and Nd1).
Batteries 02 00025 g010
Figure 11. Evolutions of (a) low-rate capacity and (b) HRD at the third cycle with increasing RE-content in the design.
Batteries 02 00025 g011
Figure 12. Comparisons of the electrochemical discharge capacities and gaseous phase H-storages of the RE-containing MH alloys by plotting: (a) low-rate discharge capacity vs. maximum H-storage capacity; and (b) high-rate discharge capacity vs. reversible H-storage capacity. Data set YY is from a previous study on the combination of Y-addition and stoichiometry in the AB2 MH alloys [8].
Batteries 02 00025 g012
Figure 13. Evolutions of (a) bulk diffusion coefficient and (b) surface exchange current with increasing RE-content in the design.
Batteries 02 00025 g013
Figure 14. Correlations between diffusion coefficient and (a) TiNi phase abundance; and (b) RENi phase abundance.
Batteries 02 00025 g014
Figure 15. Correlations between surface reaction current and (a) TiNi phase abundance; and (b) RENi phase abundance.
Batteries 02 00025 g015
Figure 16. Evolutions of (a) surface charge-transfer resistance; (b) double-layer capacitance calculated from the AC impedance results measured at −40 °C; and (c) their product with increasing RE-content in the design.
Batteries 02 00025 g016
Figure 17. Evolutions of (a) saturated magnetic susceptibility and (b) strength of the applied field corresponding to half of the saturated magnetic susceptibility with increasing RE-content in the design.
Batteries 02 00025 g017
Table 1. Properties of the rare earth (RE = Y, La, Ce, Pr, and Nd) elements, RENi and RENi5 intermetallic compounds. Data are from [27] unless otherwise cited. HCP and DHCP denote hexagonal close packed, and double-c hexagonal close packed, respectively.
Properties of RE, RENi, and RENi5YLaCePrNd
Atomic number3957585960
Content in earth crust (ppm) [28]333966.59.241.5
Outer shell electron configuration5s24d16s25d16s25d14f16s25d14f26s25d14f3
Electronegativity1.221.101.121.131.14
Ionic radius (Å)1.04 (Y3+)1.17 (La3+)1.15 (Ce3+); 1.01 (Ce4+)1.13 (Pr3+)1.12 (Nd3+)
Atomic radius in Laves phase alloy (Å) [29]1.9903.3352.0172.0132.013
Crystal structure at 25°CHCPDHCPDHCPDHCPDHCP
Melting point (°C)15229187989311021
Temperature when vapor pressure reaches 0.001 Pa (°C)1220130112901083995
Oxidation potential (V)−2.37−2.37−2.335−2.353−2.246
Heat of hydride formation (kJ·mol−1) [30]−114−97−103−104−106
Heat of formation of RE(OH)3 (kJ·mol−1)−937.6 [31]−1415.5 [32]−1014.5 [33]−1419 [34]−1403.6 [35]
Solubility represented by the value of A in Equation (1) [36]19.8623.0222.1522.5021.25
Crystal structure of RENiFeB-(Pnma)CrB-(Cmcm)CrB-(Cmcm)CrB-(Cmcm)CrB-(Cmcm)
Unit cell volume of RENi (Å3) [37]162.6183.9174.6174.5172.6
Melting point of RENi (°C)1070 [38]715 [38]680 [39]730 [38]780 [38]
Heat of formation of RENi (kJ·mol−1)−37 [40]−24.8 [41]−30.3 [41]−28.1 [41]−25.0 [41]
Crystal structure of RENi5 [34]CaCu5CaCu5CaCu5CaCu5CaCu5
Unit cell volume of RENi53) [34]81.786.882.884.884.3
Heat of formation of RENi5 (kJ·mol−1)−204.6 [42]−158.9 [42]−199 [36]−160.6 [36]−151.2 [43]
Plateau pressure at 20 °C of RENi5 (MPa)30 [44]0.15 [44]4.8 [45]1.2 [44]0.62 [44]
Heat of formation of RENi5H6 (kJ·mol−1)-−30.1 [44]−14.2 [45]−30.5 [45]−29.4 [45]
Table 2. Design compositions (in bold) and inductively coupled plasma (ICP) results in at%. e/a is the average electron density, and B/A is the ratio of the B-atom-content (V, Cr, Mn, Co, Ni, and Al) to the A-atom-content (Ti, Zr, and Ce).
AlloySourceTiZrVCrMnCoNiCeAle/aB/A
Ce0Design12.022.810.07.58.17.032.20.00.46.7711.87
ICP11.922.910.07.58.07.132.20.00.46.7731.87
Ce1Design12.021.810.07.58.17.032.21.00.46.7711.87
ICP11.921.310.37.78.07.032.31.00.56.7801.92
Ce2Design12.020.810.07.58.17.032.22.00.46.7711.87
ICP12.020.610.36.88.27.132.62.00.46.7921.89
Ce3Design12.019.810.07.58.17.032.23.00.46.7711.87
ICP12.019.410.27.57.87.132.63.00.46.7931.91
Ce4Design12.018.810.07.58.17.032.24.00.46.7711.87
ICP11.918.410.27.68.07.032.53.90.56.7891.92
Ce5Design12.017.810.07.58.17.032.25.00.46.7711.87
ICP12.117.610.37.67.27.132.84.90.46.7901.89
Table 3. Lattice constants a and c, a/c ratio, unit cell volume (VC14), full-width at half-maximum (FWHM) for the (103) peak, and crystallite size for the C14 phase, lattice constant a for the C15 phase, and phase abundances in wt% calculated from the XRD analysis.
Structural PropertiesCe0Ce1Ce2Ce3Ce4Ce5
a, C14 (Å)4.97394.97034.96784.96164.95664.9542
c, C14 (Å)8.11348.10678.10188.09058.08248.0763
a/c, C14 (Å)0.613050.613110.613170.613260.613260.61342
VC143)173.83173.44173.16172.48171.96171.67
FWHM C14 (103)0.2370.2160.2170.230.2450.255
C14 crystallite size (Å)482554551503458434
a, C15 (Å)7.01217.0036.99736.98866.9896.9831
C14 abundance (%)85.479.978.879.973.278.1
C15 abundance (%)11.216.917.51620.913.2
TiNi abundance (%)3.42.90.00.00.81.2
CeNi abundance (%)0.00.33.74.15.17.5
Table 4. Summary of the energy dispersive spectroscopy (EDS) results from several selective spots in the SEM-BEI micrographs shown in Figure 5. All compositions are in at%. The main C14 phase is identified in bold.
AlloyLocationTiZrVNiCoMnCrAlCeB/Ae/aPhase
Ce1Figure 5a-10.93.11.73.81.01.00.00.188.40.083.44Ce
Figure 5a-213.526.80.754.81.61.20.30.30.81.397.41Zr7Ni10
Figure 5a-311.922.86.941.75.56.33.90.60.41.857.10C15
Figure 5a-410.622.312.428.47.78.99.30.50.02.046.67C14
Figure 5a-524.717.21.944.26.02.91.10.51.61.207.06TiNi
Ce2Figure 5b-12.71.81.241.80.81.00.00.250.50.826.08CeNi
Figure 5b-213.427.00.655.11.61.10.30.30.61.407.42Zr7Ni10
Figure 5b-311.822.86.941.05.77.23.60.60.31.867.09C15
Figure 5b-410.422.213.126.67.89.69.90.40.02.076.60C14
Figure 5b-528.814.01.541.97.43.10.70.52.11.166.98TiNi
Ce3Figure 5c-10.40.40.749.50.30.50.00.347.91.056.53CeNi
Figure 5c-213.626.00.555.81.41.00.20.31.11.427.44Zr7Ni10
Figure 5c-312.122.66.841.35.76.93.70.60.31.867.10C15
Figure 5c-411.921.313.126.08.09.29.80.50.21.996.56C14
Figure 5c-525.713.31.244.36.53.40.51.04.11.267.06TiNi
Ce4Figure 5d-11.11.31.049.00.70.90.00.046.01.076.55CeNi
Figure 5d-213.724.70.555.61.51.20.20.32.31.437.43Zr7Ni10
Figure 5d-312.322.46.641.25.67.13.80.60.41.857.10C15
Figure 5d-411.720.513.726.58.29.29.80.40.12.106.61C14
Figure 5d-528.312.42.441.87.33.71.50.72.01.227.02TiNi
Ce5Figure 5e-10.50.71.148.60.50.60.00.347.71.046.49CeNi
Figure 5e-213.624.00.655.41.61.20.30.33.01.437.42Zr7Ni10
Figure 5e-312.521.66.541.75.86.93.90.60.51.897.13C15
Figure 5e-412.419.513.327.98.28.210.00.30.22.126.66C14
Figure 5e-528.811.22.341.87.83.81.20.92.11.257.03TiNi
Table 5. Summary of gaseous phase properties, including the maximum and reversible capacities, desorption pressure at 0.75 wt% H-storage capacity, slope factor (SF), hysteresis, and changes in enthalpy and entropy.
Gaseous Phase PropertiesCe0Ce1Ce2Ce3Ce4Ce5
Maximum capacity @30 °C (wt%)1.491.661.571.491.441.4
Reversible capacity @30 °C (wt%)1.221.421.341.351.291.22
Desorption pressure @30 °C (MPa)0.0210.0190.0230.0350.050.058
SF @30 °C (%)787276767873
Hysteresis @30 °C0.210.050.130.080.080.02
Maximum capacity @60 °C (wt%)1.381.491.441.381.31.25
Reversible capacity @60 °C (wt%)1.21.351.281.271.191.14
Desorption pressure @60 °C (MPa)0.10.080.0960.130.20.23
SF @60 °C (%)807879747372
Hysteresis @60 °C0.130.010.020.020.020.01
−ΔHh (kJ·mol−1)41.640.24039.138.338.5
−ΔSh (J·mol−1·K)125119120120121122
Table 6. Summary of electrochemical half-cell and magnetic measurements, including the capacities at the third cycle, HRD at the third cycle, number of cycles needed to achieve 92% HRD, bulk diffusion coefficient, surface exchange current, results from AC impedance measurements, saturated magnetic susceptibility, and applied field at half of the saturated magnetic susceptibility.
Electrochemical and Magnetics PropertiesCe0Ce1Ce2Ce3Ce4Ce5
3rd cycle capacity @50 mA·g−1 (mAh·g−1)300378381380355355
3rd cycle capacity @4 mA·g−1 (mAh·g−1)376400396392363364
HRD (%)809596979898
Number of activation cycle(s) to reach 92% HRD621111
Diffusion coefficient, D (10−10 cm2·s−1)2.13.14.24.31.51.7
Surface reaction current, Io (mA·g−1)12.845.83231.84029
Charge-transfer resistance, R @−40 °C (Ω·g)158.5514.1310.896.885.765.84
Double-layer capacitance, C @−40 °C (F·g−1)0.180.661.281.731.842.15
RC product @−40 °C (s)28.49.3913.9411.9312.4112.54
Saturated magnetic susceptibility, Ms (emu·g−1)0.03530.1970.5290.6270.5340.733
Applied field at M.S. = ½ Ms, H1/2 (kOe)0.5000.1770.2180.1960.2100.196

