
Method for Determination of the Internal Short Resistance and Heat Evolution at Different Mechanical Loads of a Lithium Ion Battery Cell Based on Dummy Pouch Cells

 , , , ,
Abstract
:
1. Introduction
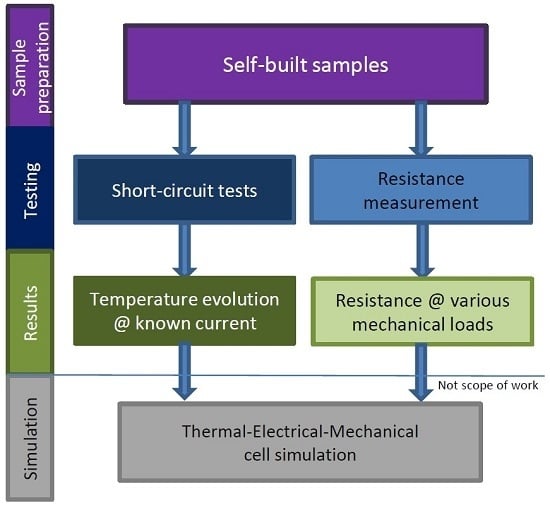
2. Method
2.1. General
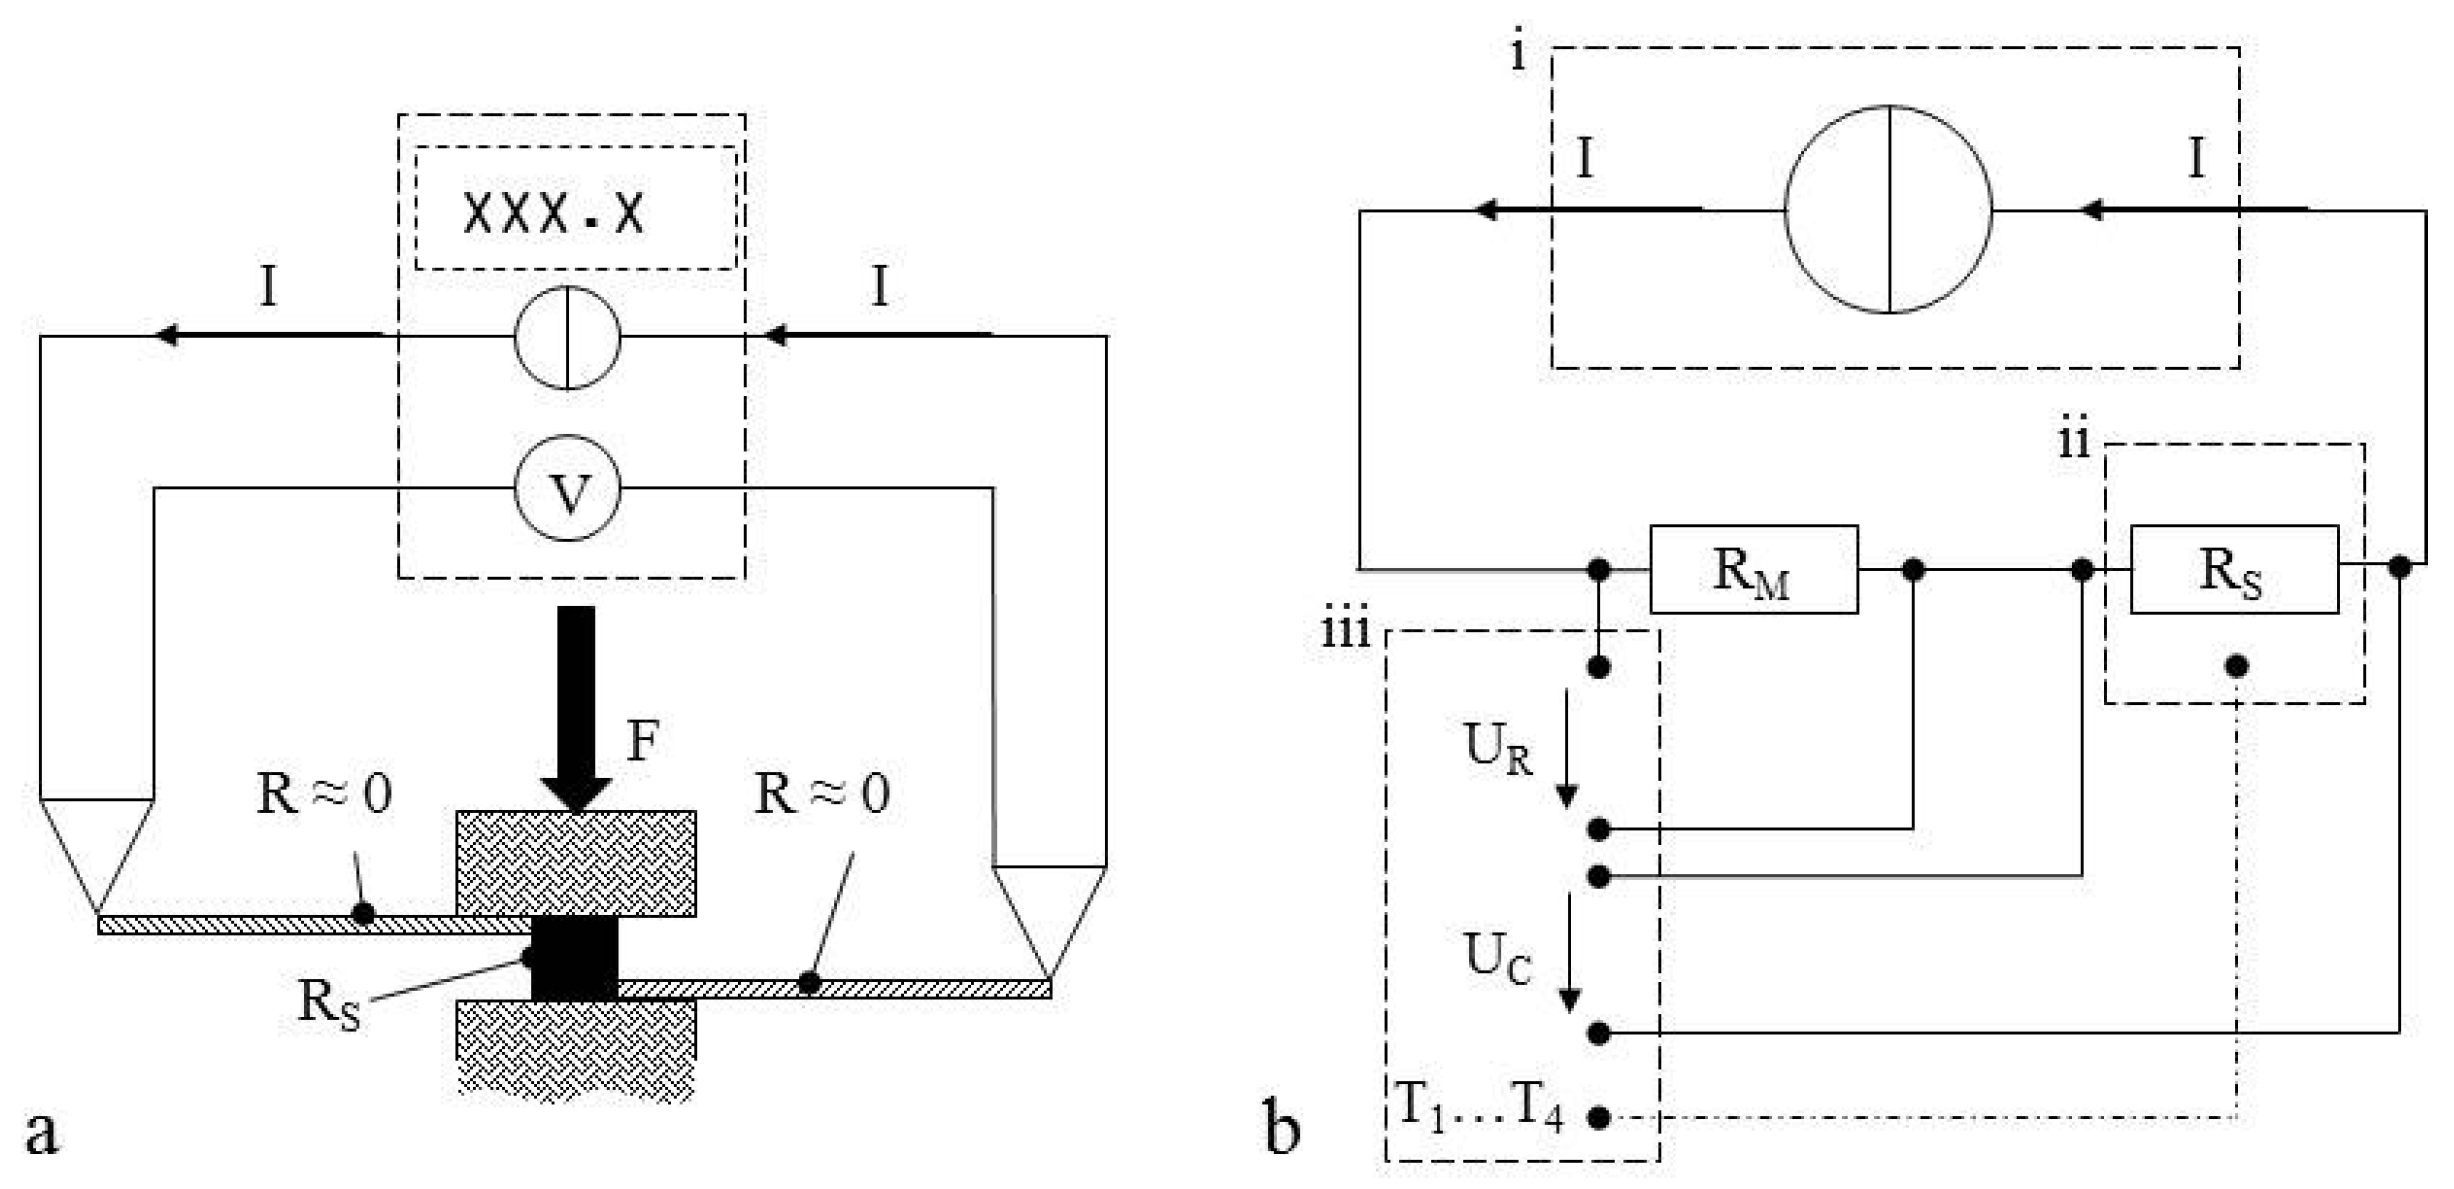
2.2. Resistance Measurements
2.3. Internal Short Circuit Experiments
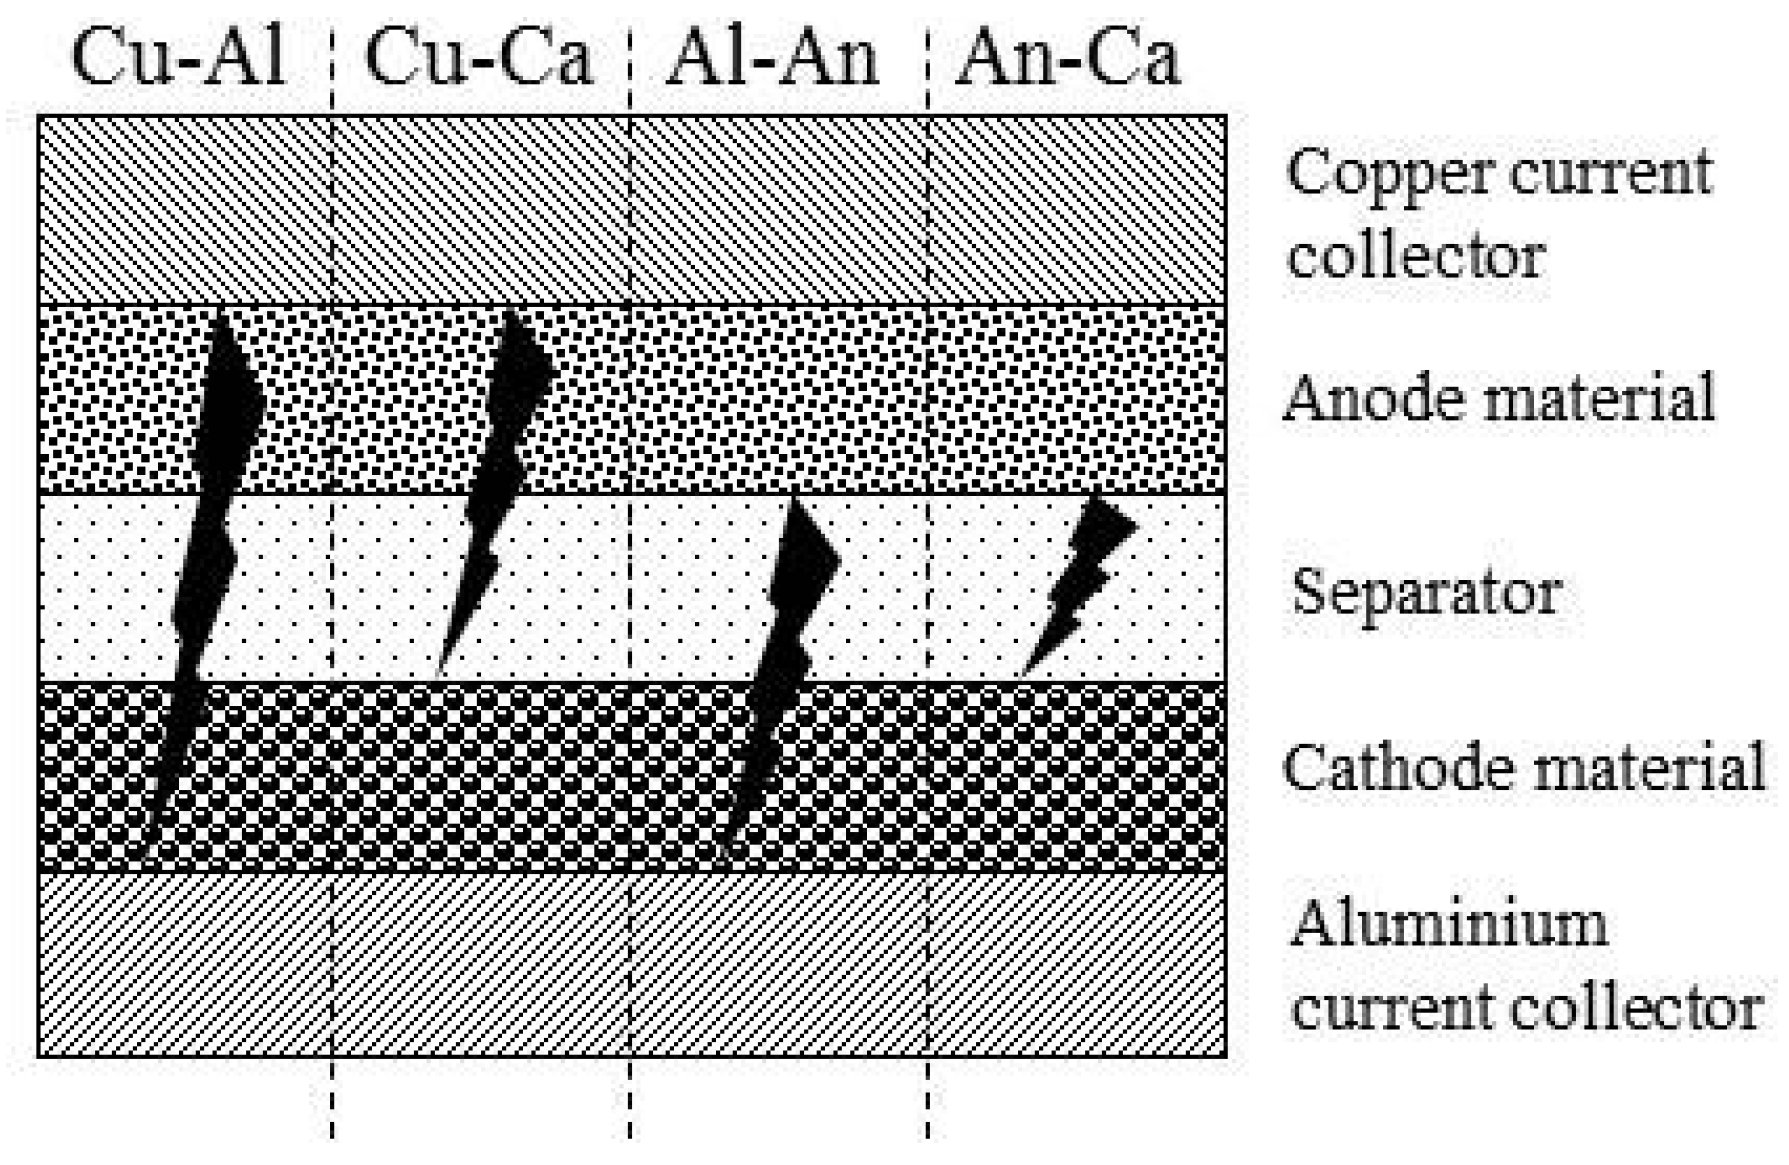
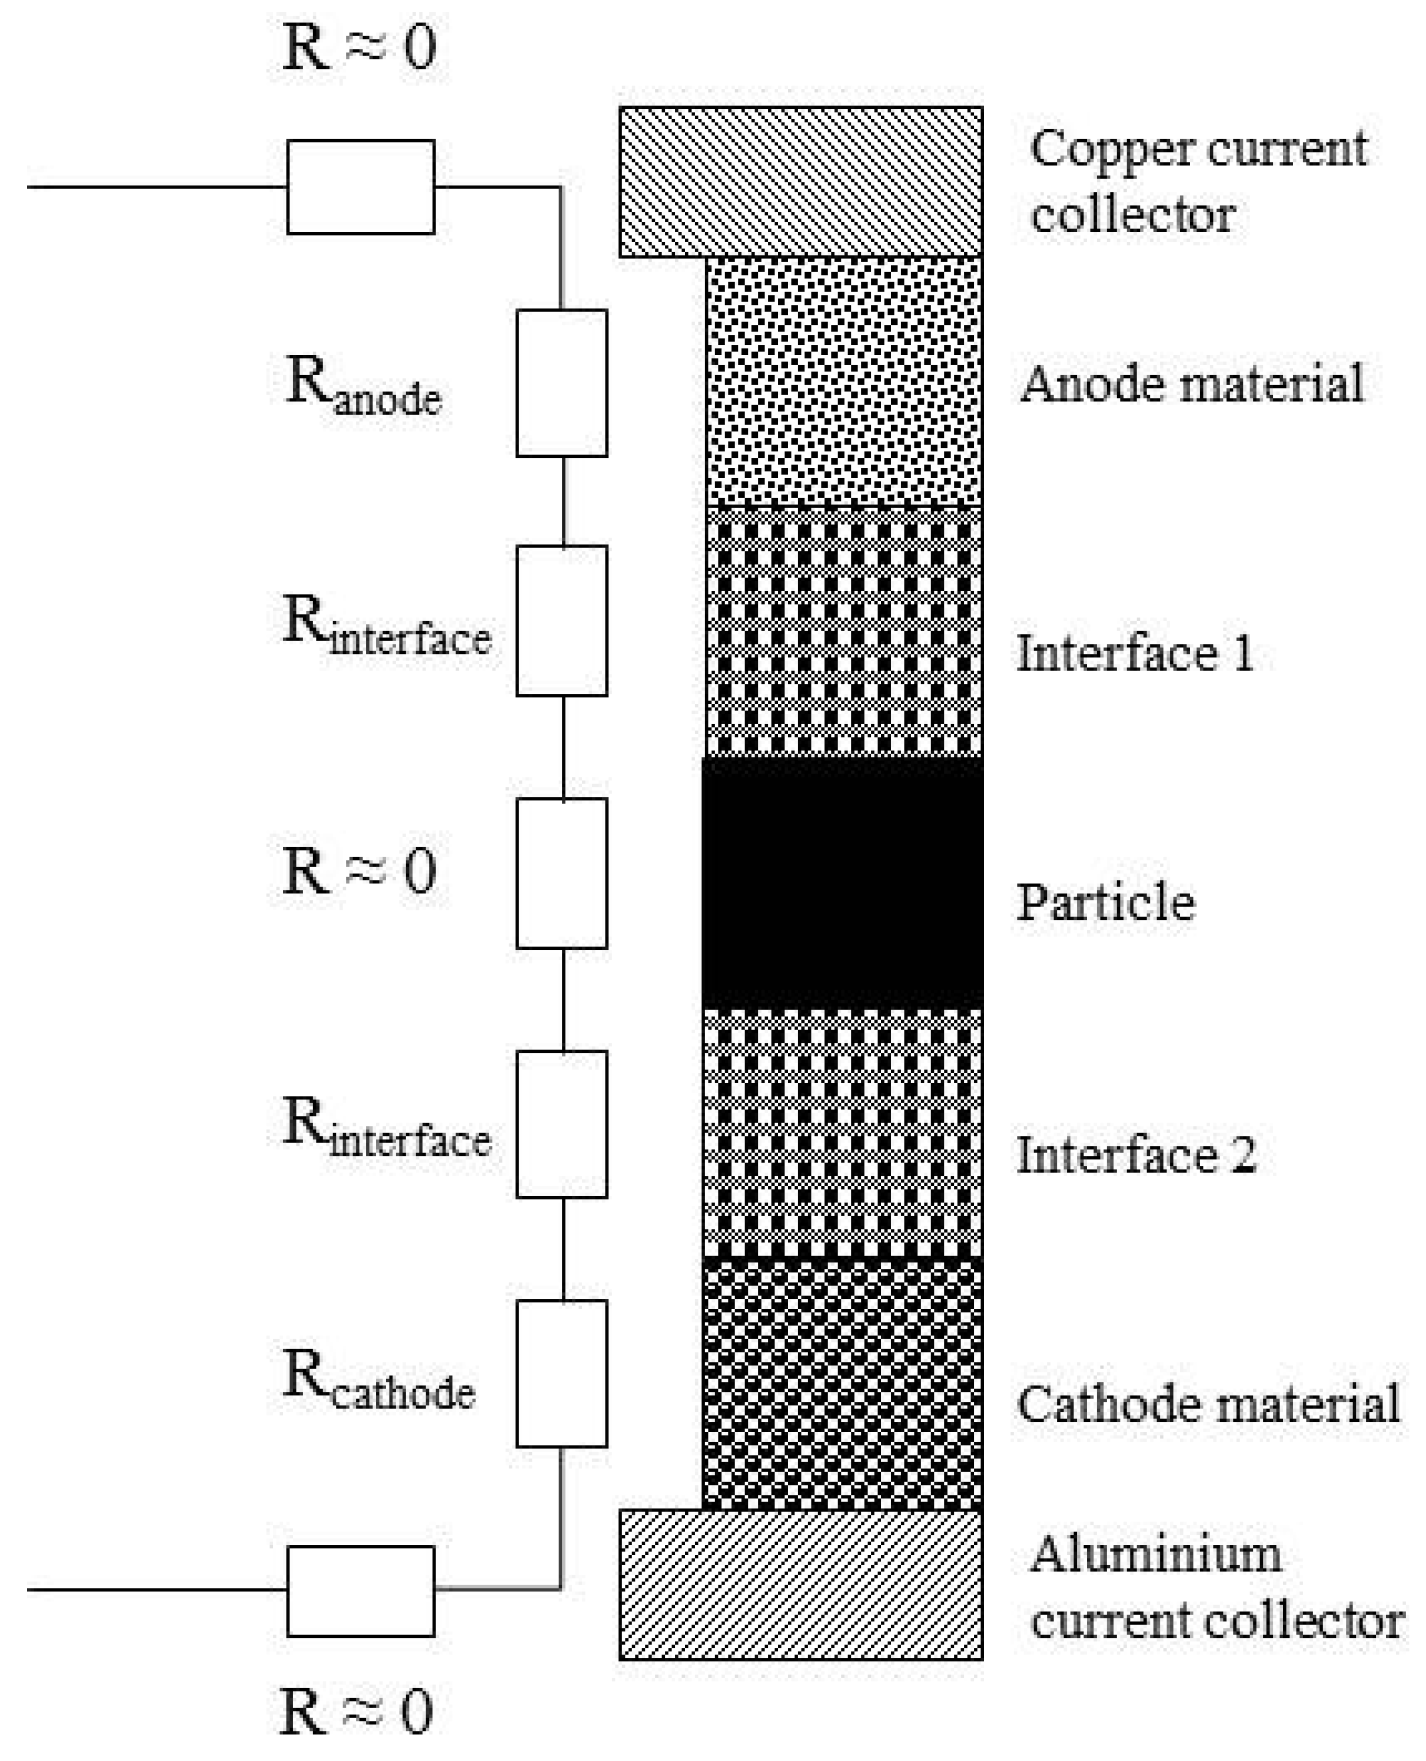
3. Contact Situations
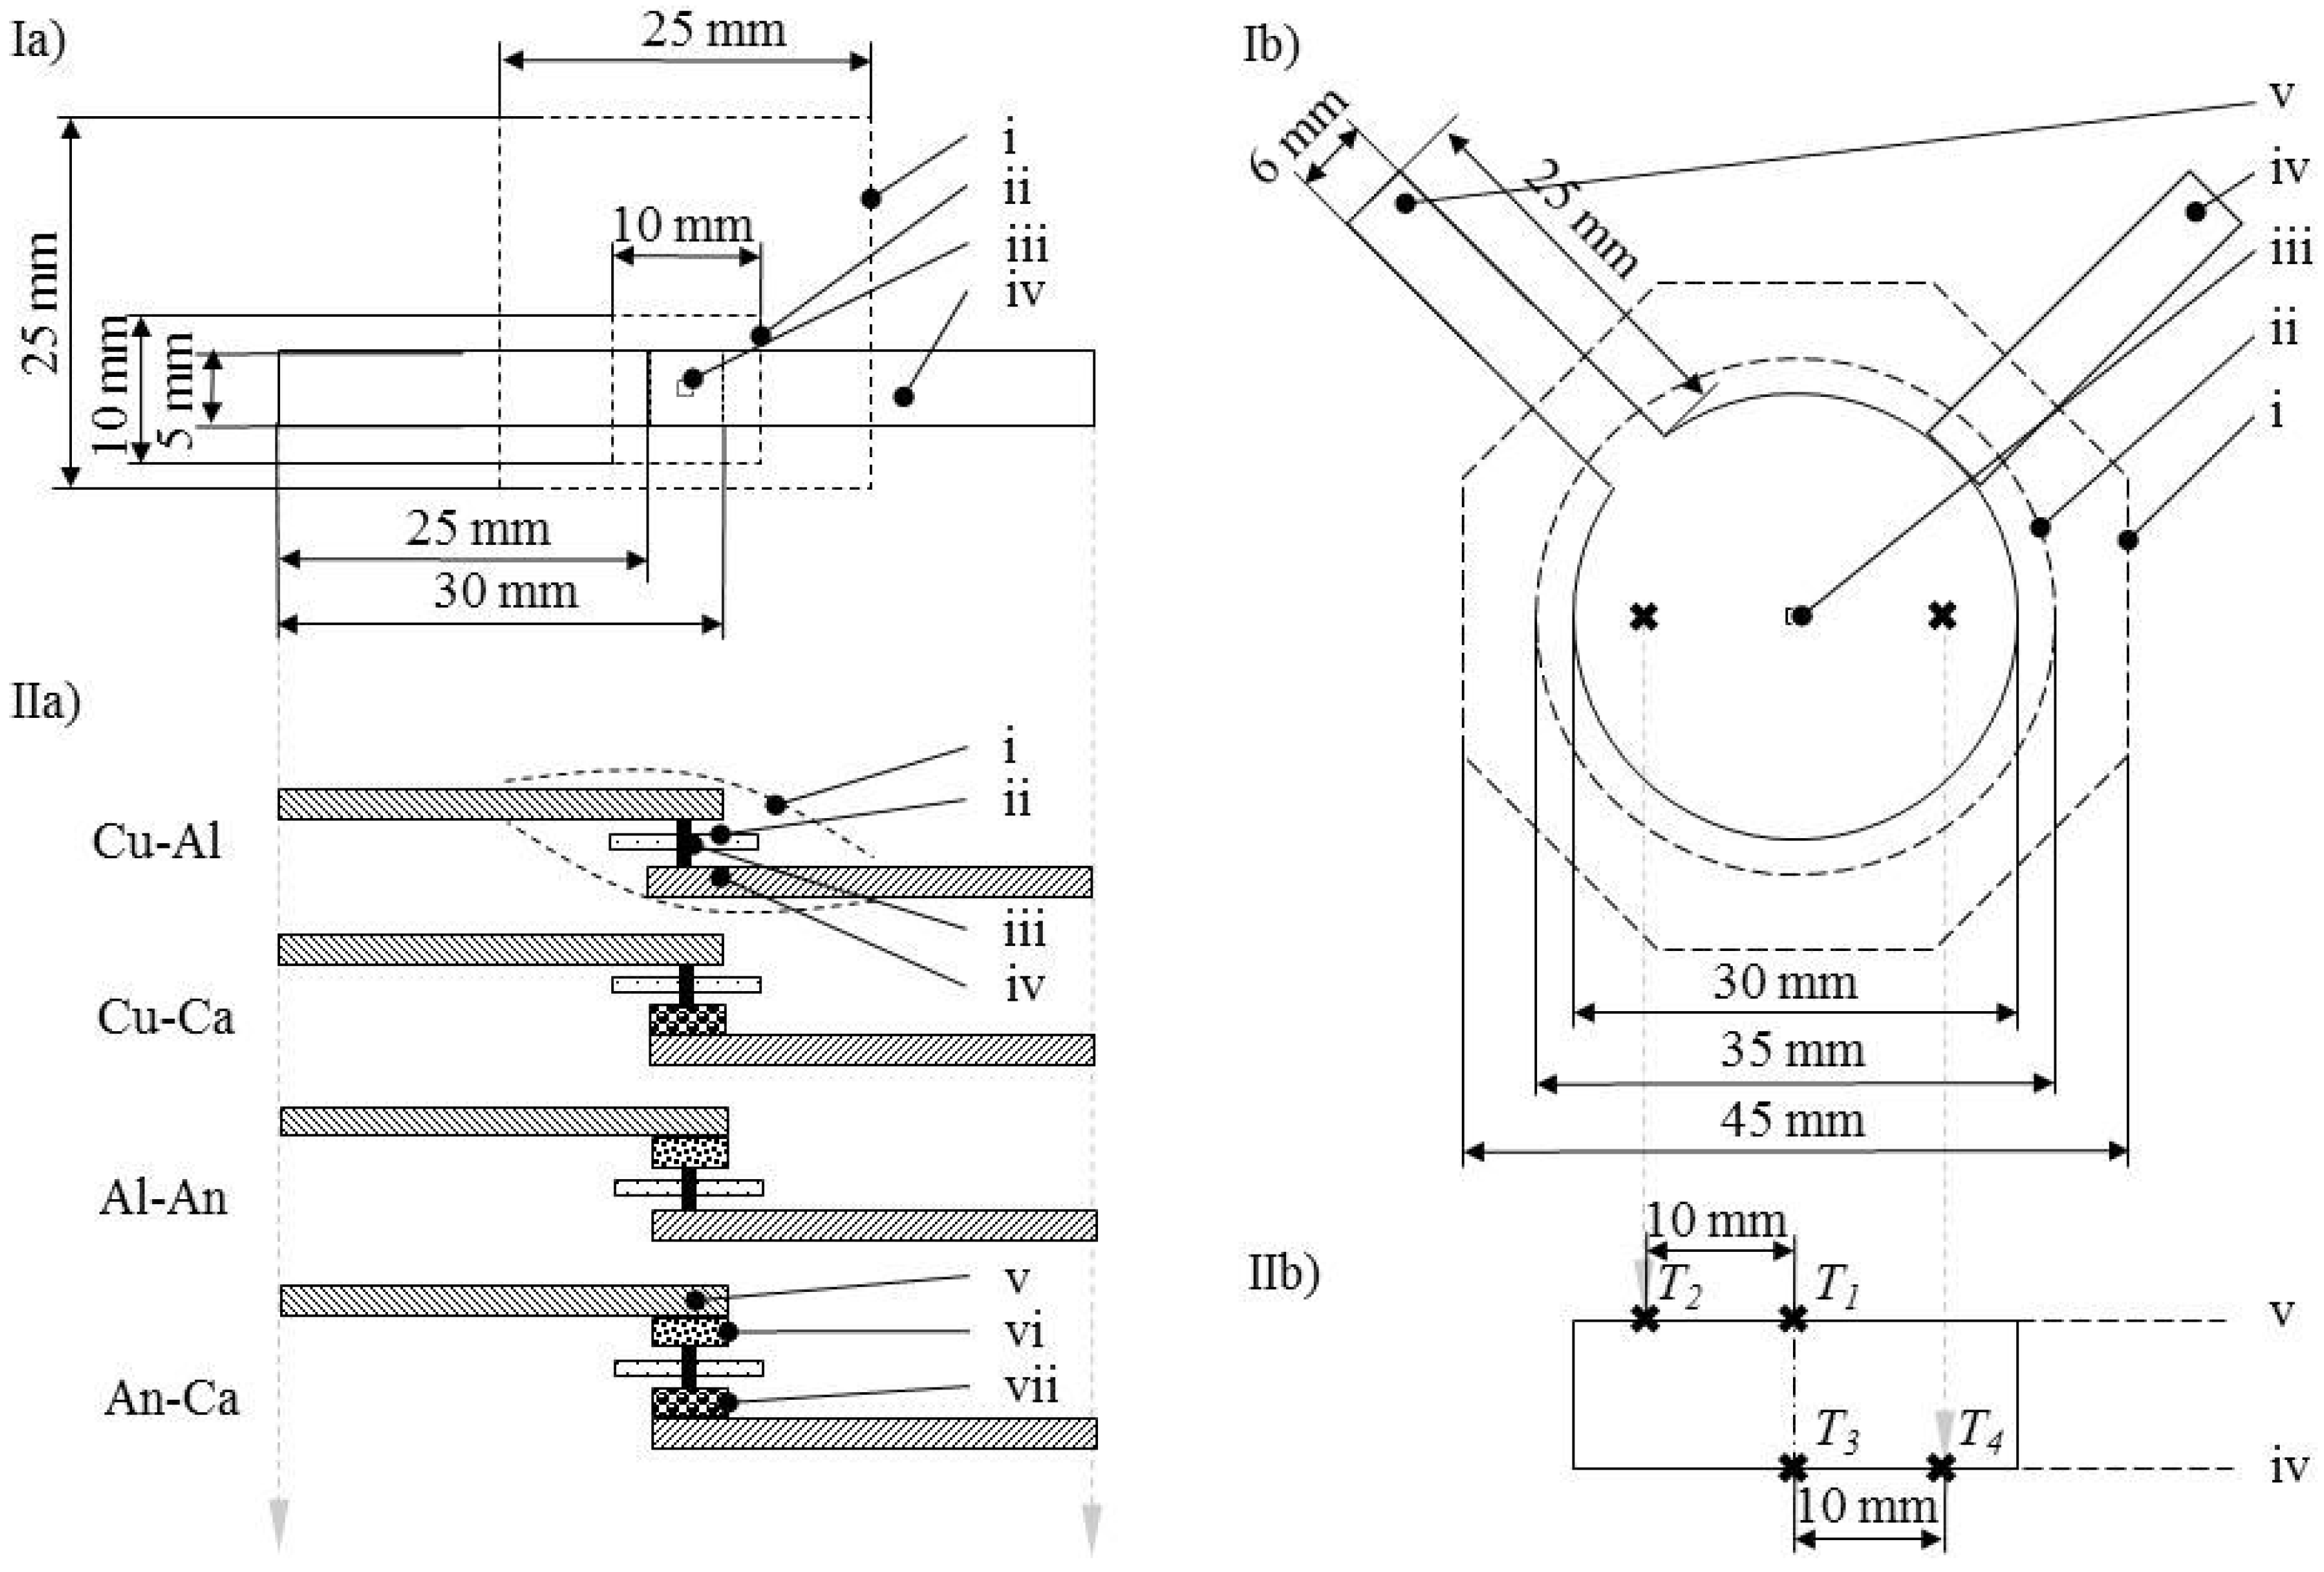
4. Preparation of Samples
4.1. General
4.2. Resistance Samples
4.3. Short Circuit Samples
5. Results
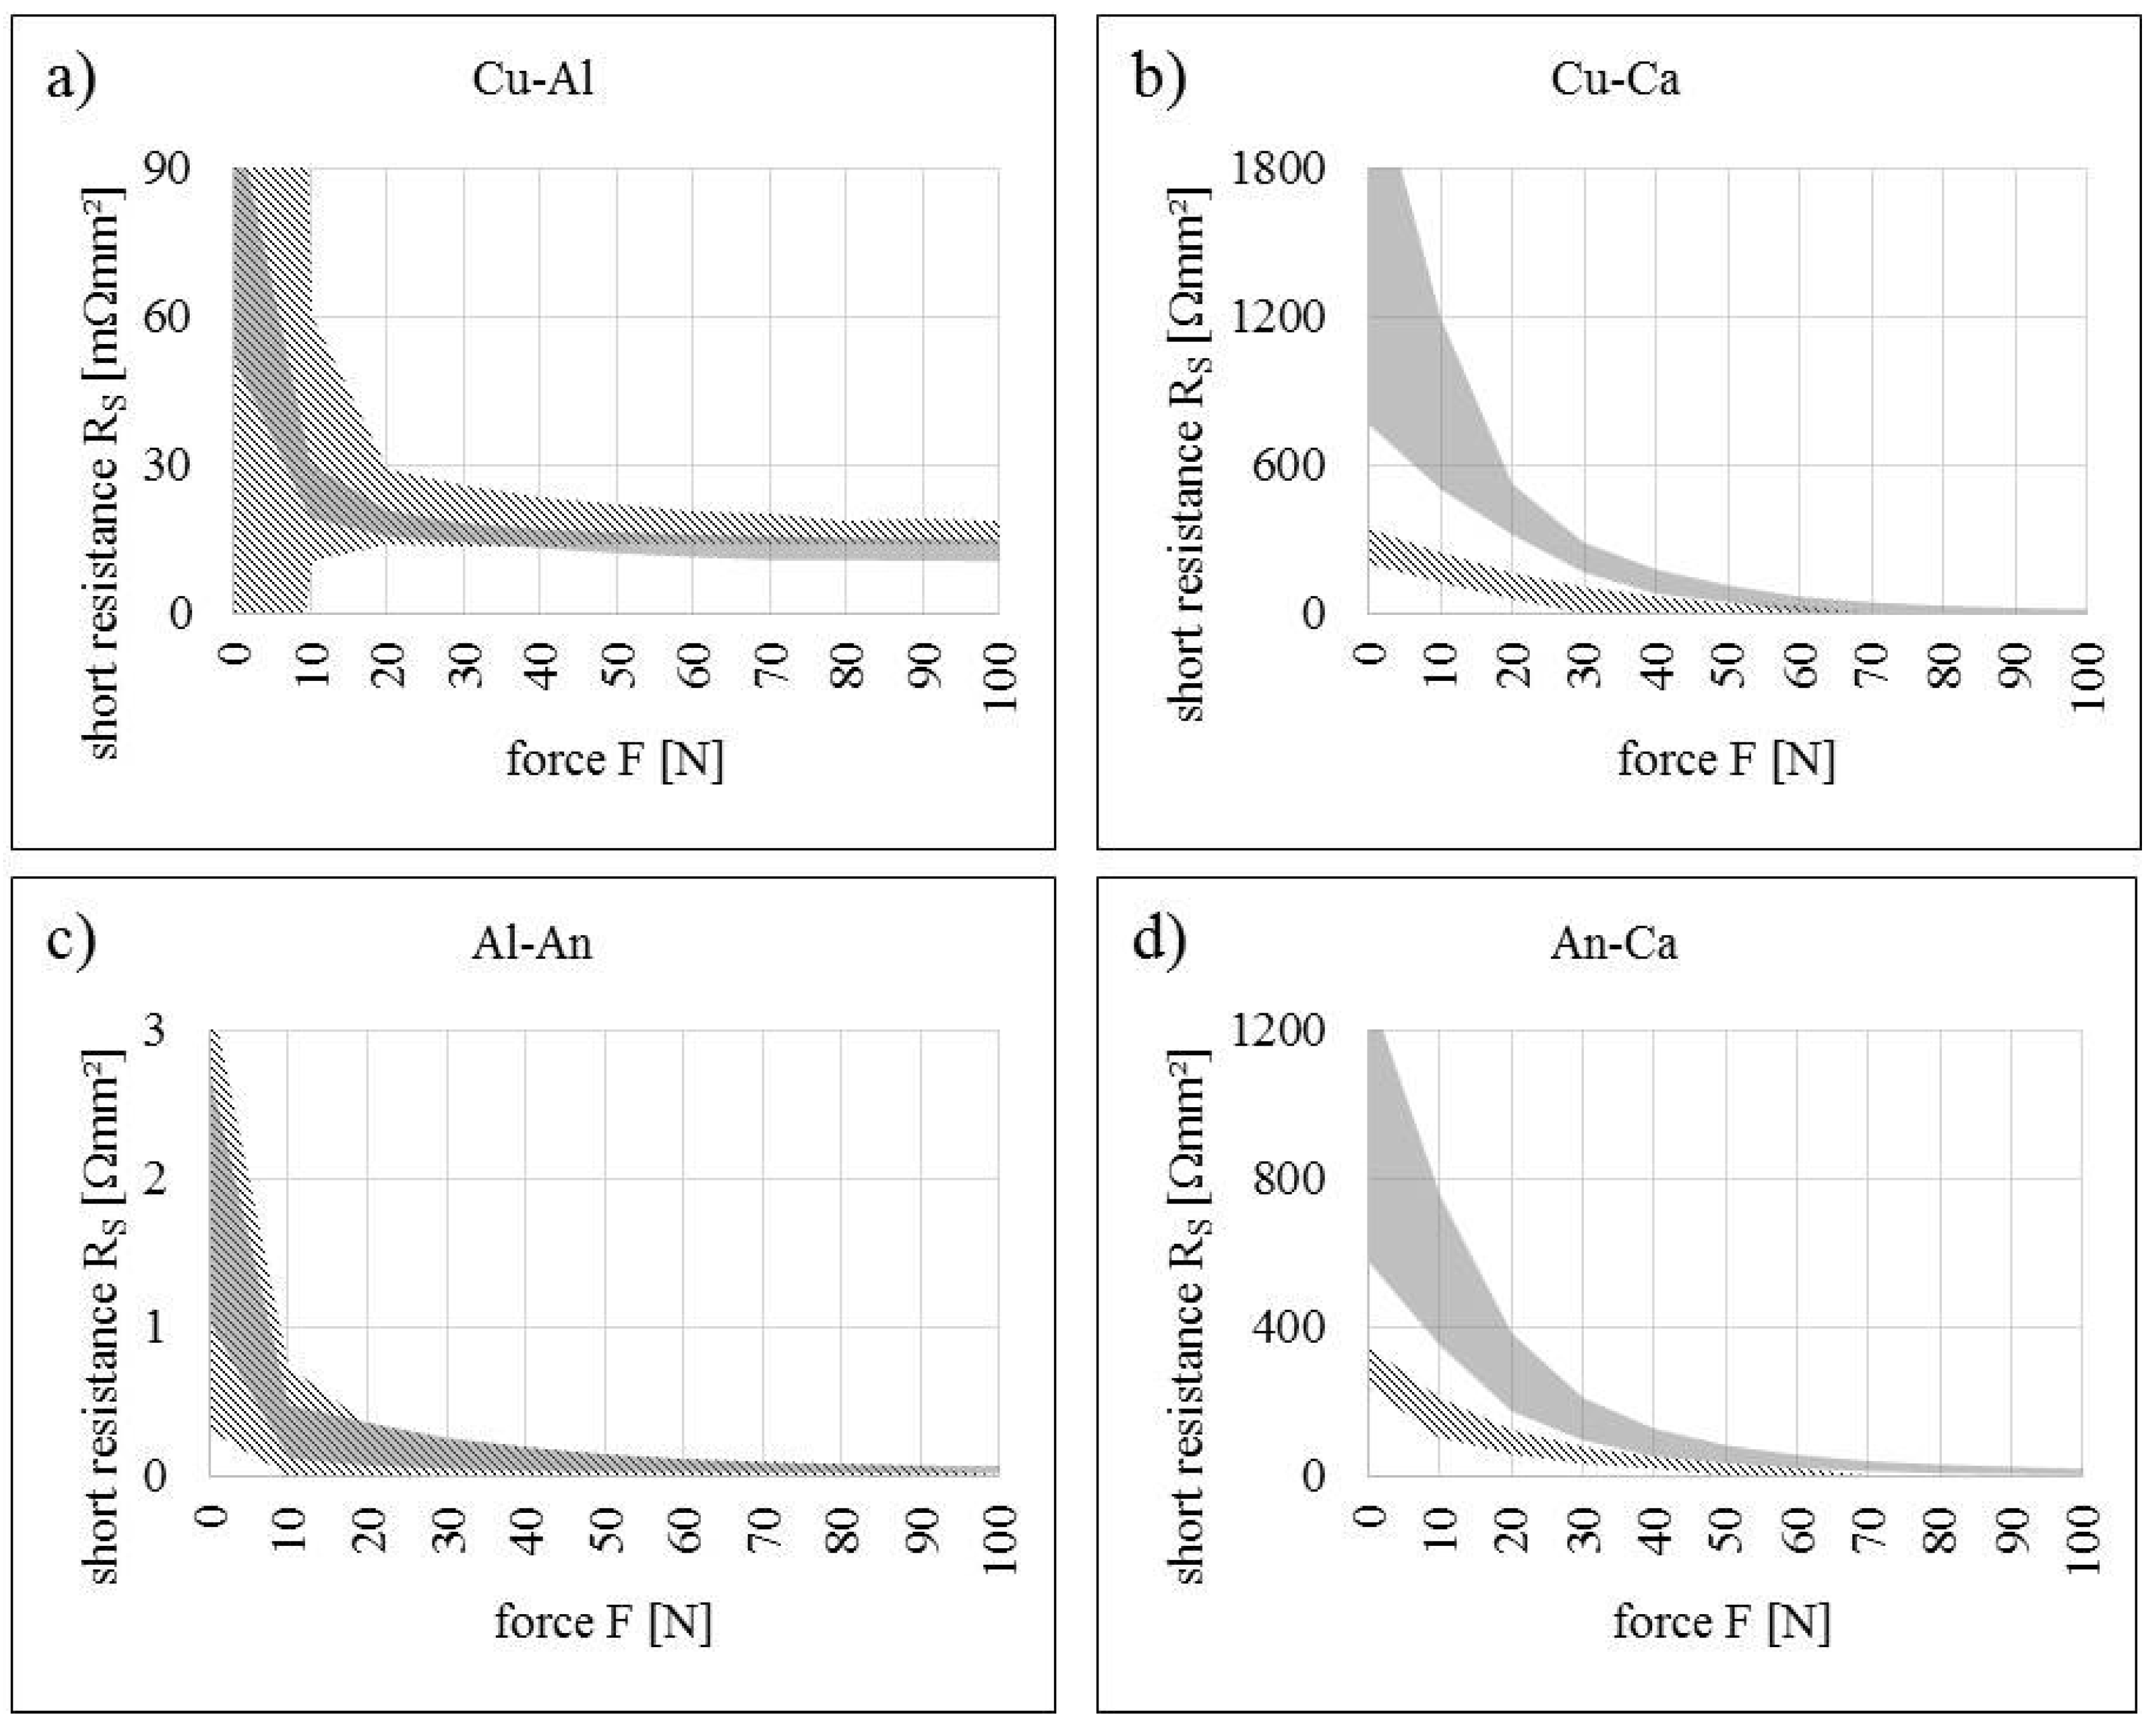
5.1. Short Resistance Measurements
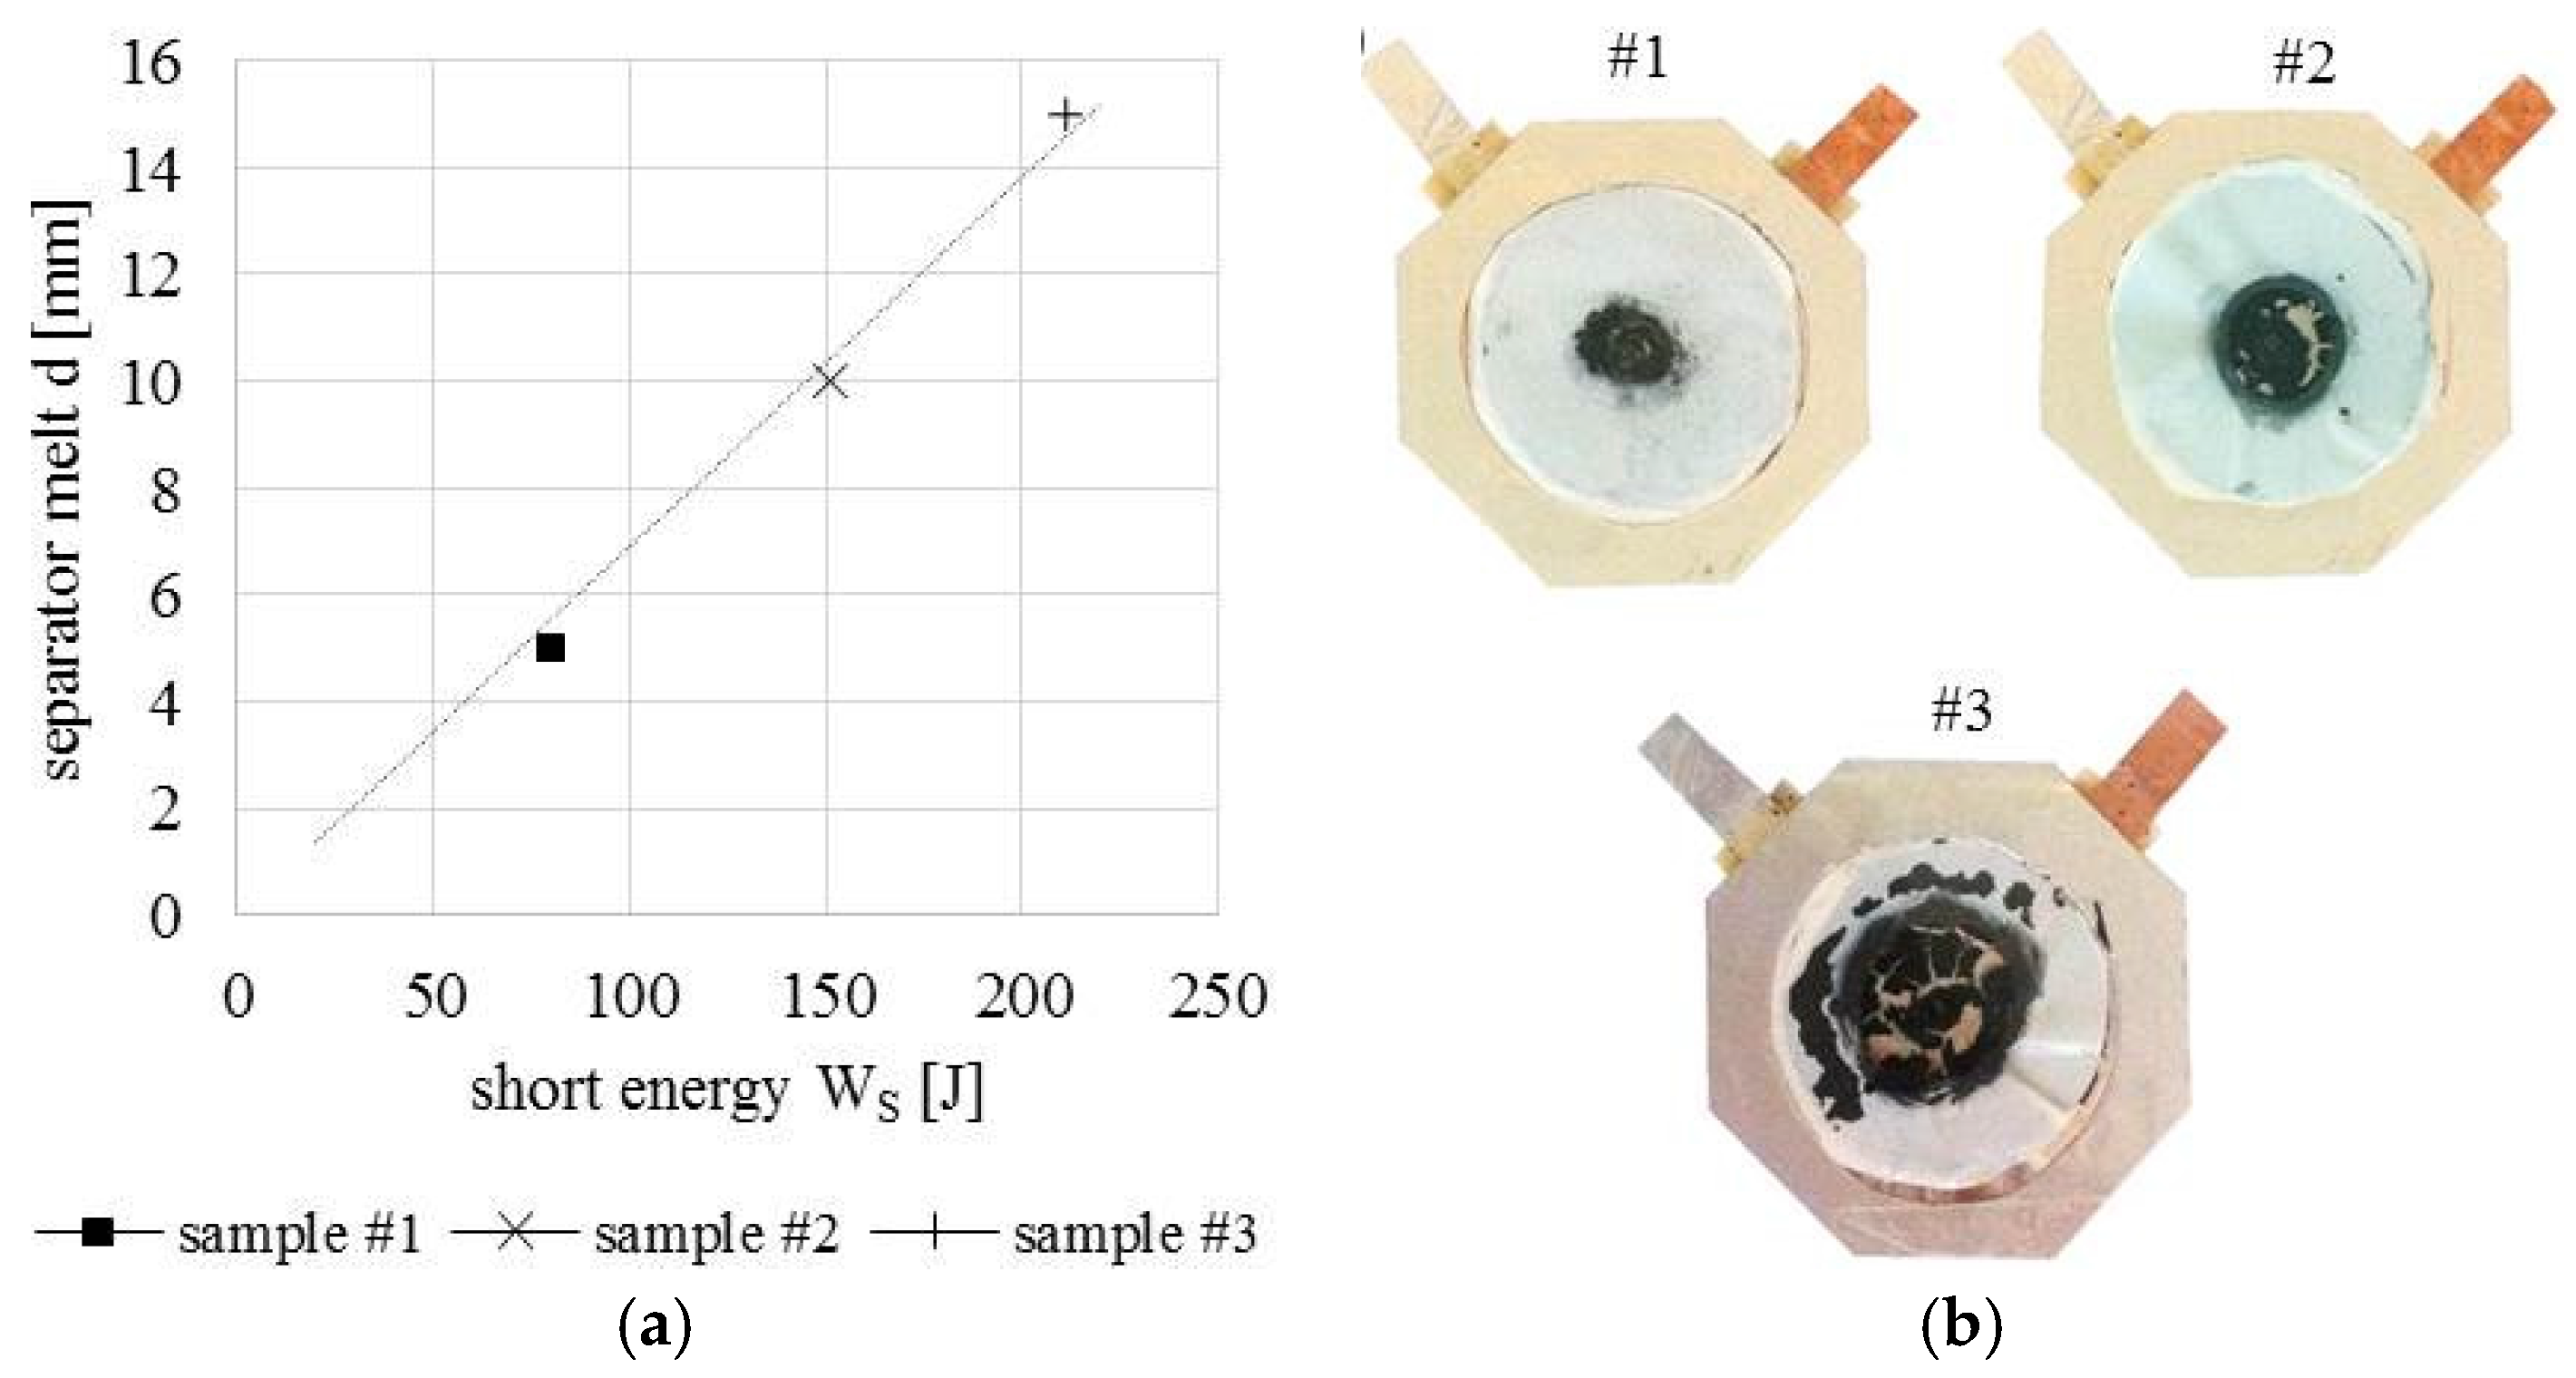
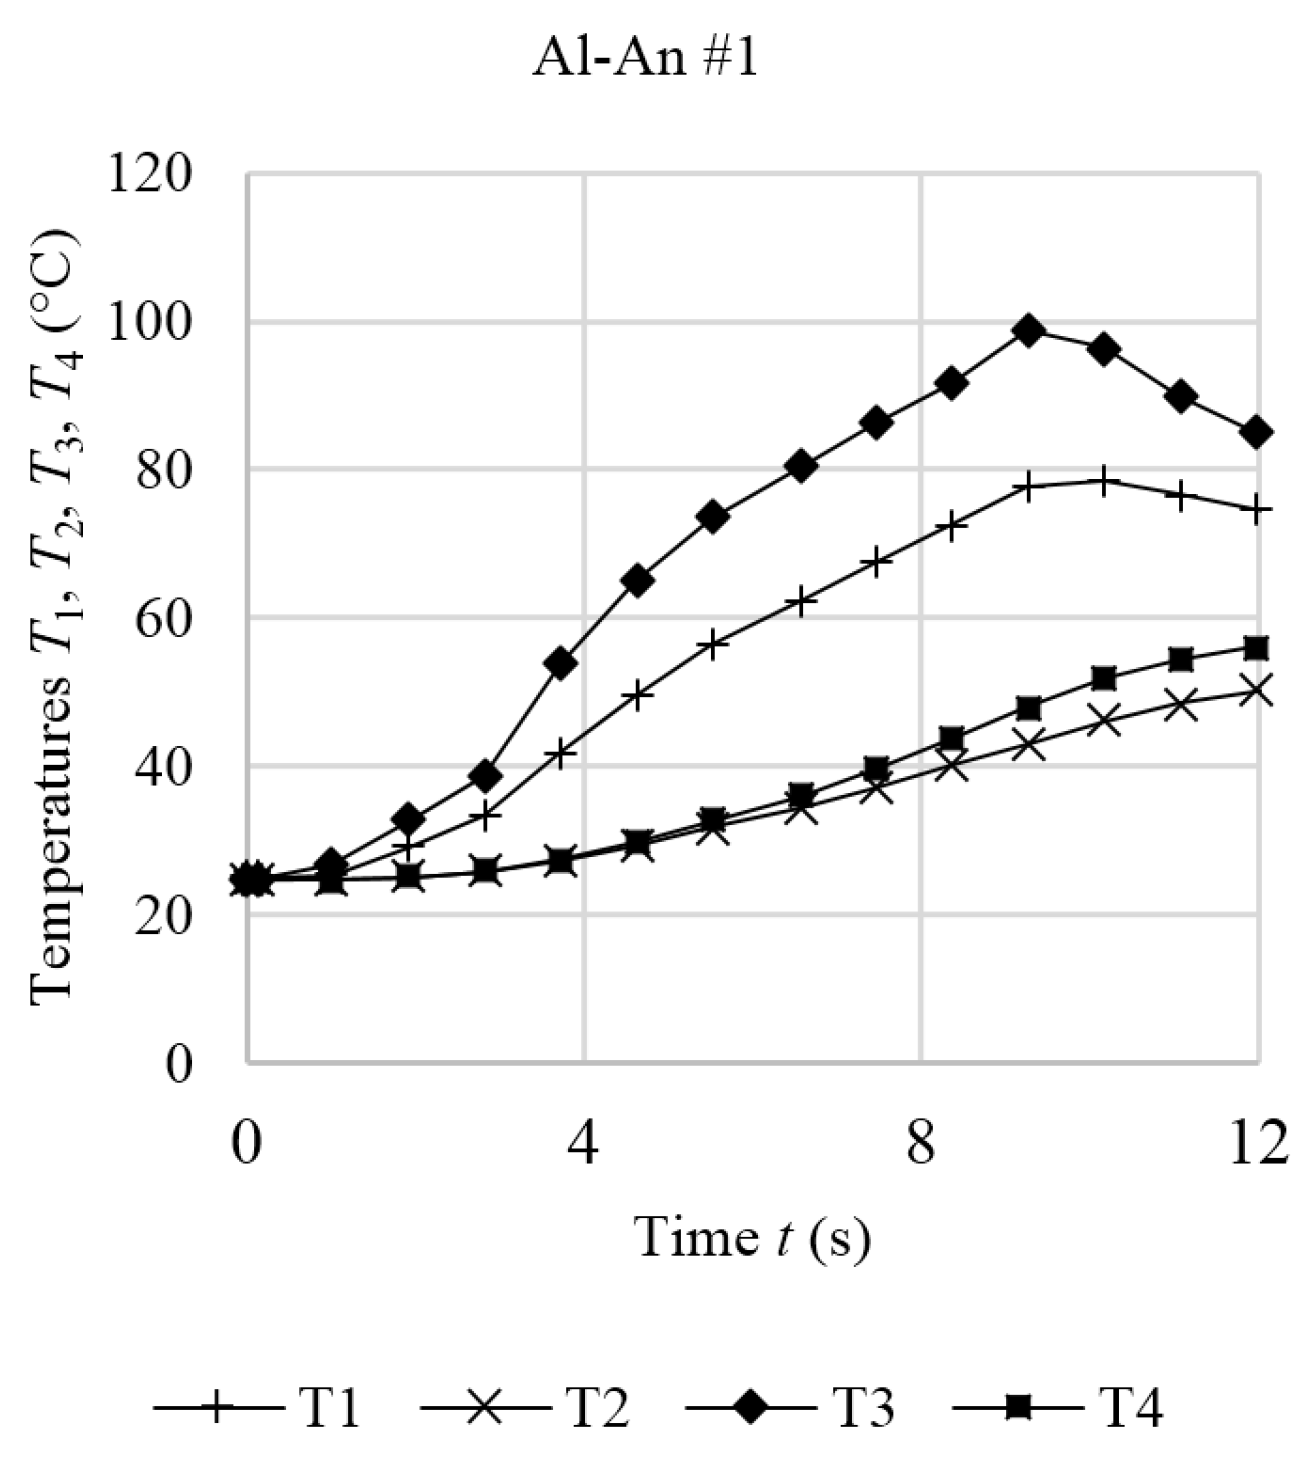
5.2. Internal Short Circuit Experiments
6. Conclusions
Acknowledgments
Author Contributions
Conflicts of Interest
Abbreviations
| Al | Aluminium |
| An | Anode |
| Ca | Cathode |
| Cu | Copper |
| DC | Direct current |
| DEC | Diethyl carbonate |
| EV | Electric vehicle |
| HEV | Hybrid electric vehicle |
| LFP | Lithium iron phosphate |
| Max. | Maximum |
| NCC | Negative current collector |
| NMP | N-methyl-2-pyrrolidon |
| NREL | National Renewable Energy Laboratory |
| OEM | Original equipment manufacturer |
| PCC | Positive current collector |
References
- Zhang, Z.J.; Ramadass, P.; Fang, W. Safety of Lithium-Ion Batteries. In Lithium-Ion Batteries—Advances and Applications; Pistoia, G., Ed.; Elsevier: Philadelphia, PA, USA, 2014; Chapter 18; pp. 409–435. [Google Scholar]
- Sinz, W.; Feist, F.; Gstrein, G.; Gugler, J.; Tomasch, E.; Breitfuss, C.; Luttenberger, P.; Steffan, H. Concepts for mechanical abuse testing of high-voltage batteries. SAE Tech. Pap. 2012. [Google Scholar] [CrossRef]
- Orecchini, F.; Santiangeli, A.; Dell’Era, A. EVs and HEVs Using Lithium-Ion Batteries. In Lithium-Ion Batteries—Advances and Applications; Pistoia, G., Ed.; Elsevier: Philadelphia, PA, USA, 2014; Chapter 10; pp. 205–248. [Google Scholar]
- Xia, Y.; Wierzbicki, T.; Sahraei, E.; Zhang, X. Damage of cells and battery packs due to ground impact. J. Power Sources 2014, 267, 78–97. [Google Scholar] [CrossRef]
- EinBliC. Entwicklung eines Multiphysikberechnungsmodells von Li-Ion Zellen als Basis zur Steigerung der Batteriecrashsicherheit. Available online: http://www2.ffg.at/verkehr/projektpdf.php?id=1115&lang=en (accessed on 3 January 2016). (In German)
- Zhang, C.; Santhanagopalan, S.; Sprague, M.A.; Pesaram, A.A. Coupled mechanical-electrical-thermal modeling for short-circuit prediction in a lithium-ion cell under mechanical abuse. J. Power Sources 2015, 290, 102–113. [Google Scholar] [CrossRef]
- Heindl, S.F.; Breitfuss, C.; Ellersdorfer, C.; Feist, F.; Sinz, W. Method for Predicting Li-Ion Cell Reactions due to Mechanical Crash Loads. In Proceedings of the AVL Advanced Simulation Technologies International User Conference, Graz, Austria, 23–25 June 2015.
- Breitfuss, C.; Sinz, W.; Florian, F.; Gstrein, G.; Lichtenegger, B.; Knauder, C.; Ellersdorfer, C.; Moser, J.; Steffan, H.; Stadler, M.; et al. A “Microscopic” Structural Mechanics FE Model of a Lithium-Ion Pouch Cell for Quasi-Static Load Cases. SAE Int. J. Passeng. Cars Mech. Syst. 2013, 6, 1044–1054. [Google Scholar] [CrossRef]
- Sahraei, E.; Hill, R.; Wierzbicki, T. Calibration and finite element simulation of pouch lithium-ion batteries for mechanical integrity. J. Power Sources 2012, 201, 307–321. [Google Scholar] [CrossRef]
- Greve, L.; Fehrenbach, C. Mechanical testing and macro-mechanical finite element simulation of the deformation, fracture and short circuit initiation of cylindrical Lithium ion battery cells. J. Power Sources 2012, 214, 377–385. [Google Scholar] [CrossRef]
- Gomez, J.; Nelson, R.; Kalu, E.E.; Weatherspoon, M.H.; Zheng, J.P. Equivalent circuit model parameters of a high-power Li-Ion battery: Thermal and state of charge effects. J. Power Sources 2011, 196, 4826–4831. [Google Scholar] [CrossRef]
- Fuller, M.E. A battery model for constant-power discharge including rate effects. Energy Convers. Manag. 2014, 88, 199–205. [Google Scholar] [CrossRef]
- Miranda, D.; Costa, C.M.; Lanceros-Mendez, S. Lithium ion rechargeable batteries: State of the art and future needs of theoretical models and simulations. J. Electroanal. Chem. 2014, 739, 97–110. [Google Scholar] [CrossRef]
- Maleki, H.; Howard, J.N. Internal short circuit in Li-ion cells. J. Power Sources 2009, 191, 568–574. [Google Scholar] [CrossRef]
- Kim, G.-H.; Smith, K.; Pesaran, A. Lithium-Ion Battery Safety Study Using Multi-Physics Internal Short-Circuit Model. In Proceedings of the 5th Intl. Symposium on Large Lithium-Ion Battery Technology and Application in Conjunction with AABC09, Long Beach, CA, USA, 9–10 June 2009.
- Kalupson, J.; Luo, G.; Shaffer, C.E. AutoLion™: A thermally coupled simulation tool for automotive Li-ion batteries. SAE Tech. Pap. 2013. [Google Scholar] [CrossRef]
- Fang, W.; Ramadass, P.; Zhang, Z. Study of internal short in a Li-ion cell-II. Numerical investigation using a 3D electrochemical-thermal model. J. Power Sources 2014, 248, 1090–1098. [Google Scholar] [CrossRef]
- Chiu, K.C.; Lin, C.H.; Yeh, S.F.; Lin, Y.H.; Chen, K.C. An electrochemical modelling of lithium-ion battery nail penetration. J. Power Sources 2014, 251, 254–263. [Google Scholar] [CrossRef]
- Keyser, M.; Long, D.; Jung, Y.S.; Pesaran, A.; Darcy, E.; Mccarthy, B.; Patrick, L.; Kruger, C. Development of a Novel Test Method for On-Demand Internal Short Circuit in a Li-Ion Cell. In Proceedings of the Large Lithium-Ion Battery Technology Application Symposium, Advanced Automotive Battery Conference, Pasadena, CA, USA, 25–28 January 2006.
- Holm, R. Electric Contacts: Theory and Application; Springer: Berlin, Germany, 1967. [Google Scholar]
- Santhanagopalan, S.; Ramadass, P.; Zhang, Z. Analysis of internal short-circuit in a lithium ion cell. J. Power Sources 2009, 194, 550–557. [Google Scholar] [CrossRef]
- Orendorff, C.J.; Ganesan, N.; Roth, P.E. Experimental triggers for internal short circuits in lithium-ion cells. J. Power Sources 2011, 196, 6554–6558. [Google Scholar] [CrossRef]


| Contact Situation | No. of Samples | Scope | Short Area | Stress (Force) | Current | Temperature |
|---|---|---|---|---|---|---|
| Cu-Al reference | 10 | Resistance measurement | 1 mm2 | 0–100 MPa (N), every 10 MPa (N), 200 MPa, 400 MPa | Range 30–300 mΩ → 200 mA; range 3–30 Ω → 20 mA | Ambient temperature ~25 °C |
| Cu-Al electrolyte | 10 | |||||
| Cu-Ca reference | 10 | |||||
| Cu-Ca electrolyte | 10 | |||||
| Al-An reference | 10 | |||||
| Al-An electrolyte | 10 | |||||
| An-Ca reference | 10 | |||||
| An-Ca electrolyte | 10 | |||||
| Al-An short tall sample | 3 | Temperature | 1 mm2 | ~20 MPa | ~6 A | Max. ~100 °C |
| Max. ~120 °C | ||||||
| Max. ~250 °C |
| Contact Situation | Cu-Al | Cu-Ca | Al-An | An-Ca |
|---|---|---|---|---|
| Expected resistance | ~10 mΩ | >100 mΩ | ~100 mΩ | >100 mΩ |
| Resistance | - | + | o | + |
| Heat conduction | + | o | - | - |
| Short power | - | + | o | + |
| Local temperature | o | + | - | + |
| Occurrence | + | o | o | - |
| Potential risk | o | + | − | + |
| Contact Case | C0 | C1 | C2 | C3 |
|---|---|---|---|---|
| Cu-Al reference | 0.016 | 0.272 | 1.28 | 0 |
| Cu-Al electrolyte | 0.0185 | 0.059 | 1.25 | −0.06 |
| Cu-Ca reference | 2.1 | 270 | 1.047 | 0 |
| Cu-Ca electrolyte | 5.5 | 1522 | 1.065 | 0 |
| Al-An reference | 0.155 | 1.65 | 1.2 | −1.2 |
| Al-An electrolyte | 0.185 | 1.69 | 1.25 | −1.4 |
| An-Ca reference | 2.9 | 294.5 | 1.059 | 0 |
| An-Ca electrolyte | 10 | 934 | 1.062 | 0 |
© 2016 by the authors; licensee MDPI, Basel, Switzerland. This article is an open access article distributed under the terms and conditions of the Creative Commons by Attribution (CC-BY) license (http://creativecommons.org/licenses/by/4.0/).
Share and Cite
Volck, T.; Sinz, W.; Gstrein, G.; Breitfuss, C.; Heindl, S.F.; Steffan, H.; Freunberger, S.; Wilkening, M.; Uitz, M.; Fink, C.; et al. Method for Determination of the Internal Short Resistance and Heat Evolution at Different Mechanical Loads of a Lithium Ion Battery Cell Based on Dummy Pouch Cells. Batteries 2016, 2, 8. https://doi.org/10.3390/batteries2020008
Volck T, Sinz W, Gstrein G, Breitfuss C, Heindl SF, Steffan H, Freunberger S, Wilkening M, Uitz M, Fink C, et al. Method for Determination of the Internal Short Resistance and Heat Evolution at Different Mechanical Loads of a Lithium Ion Battery Cell Based on Dummy Pouch Cells. Batteries. 2016; 2(2):8. https://doi.org/10.3390/batteries2020008
Chicago/Turabian StyleVolck, Theo, Wolfgang Sinz, Gregor Gstrein, Christoph Breitfuss, Simon F. Heindl, Hermann Steffan, Stefan Freunberger, Martin Wilkening, Marlena Uitz, Clemens Fink, and et al. 2016. "Method for Determination of the Internal Short Resistance and Heat Evolution at Different Mechanical Loads of a Lithium Ion Battery Cell Based on Dummy Pouch Cells" Batteries 2, no. 2: 8. https://doi.org/10.3390/batteries2020008