
Structure, Hydrogen Storage, and Electrochemical Properties of Body-Centered-Cubic Ti40V30Cr15Mn13X2 Alloys (X = B, Si, Mn, Ni, Zr, Nb, Mo, and La)


Abstract
:
1. Introduction
2. Experimental Setup
3. Results and Discussion
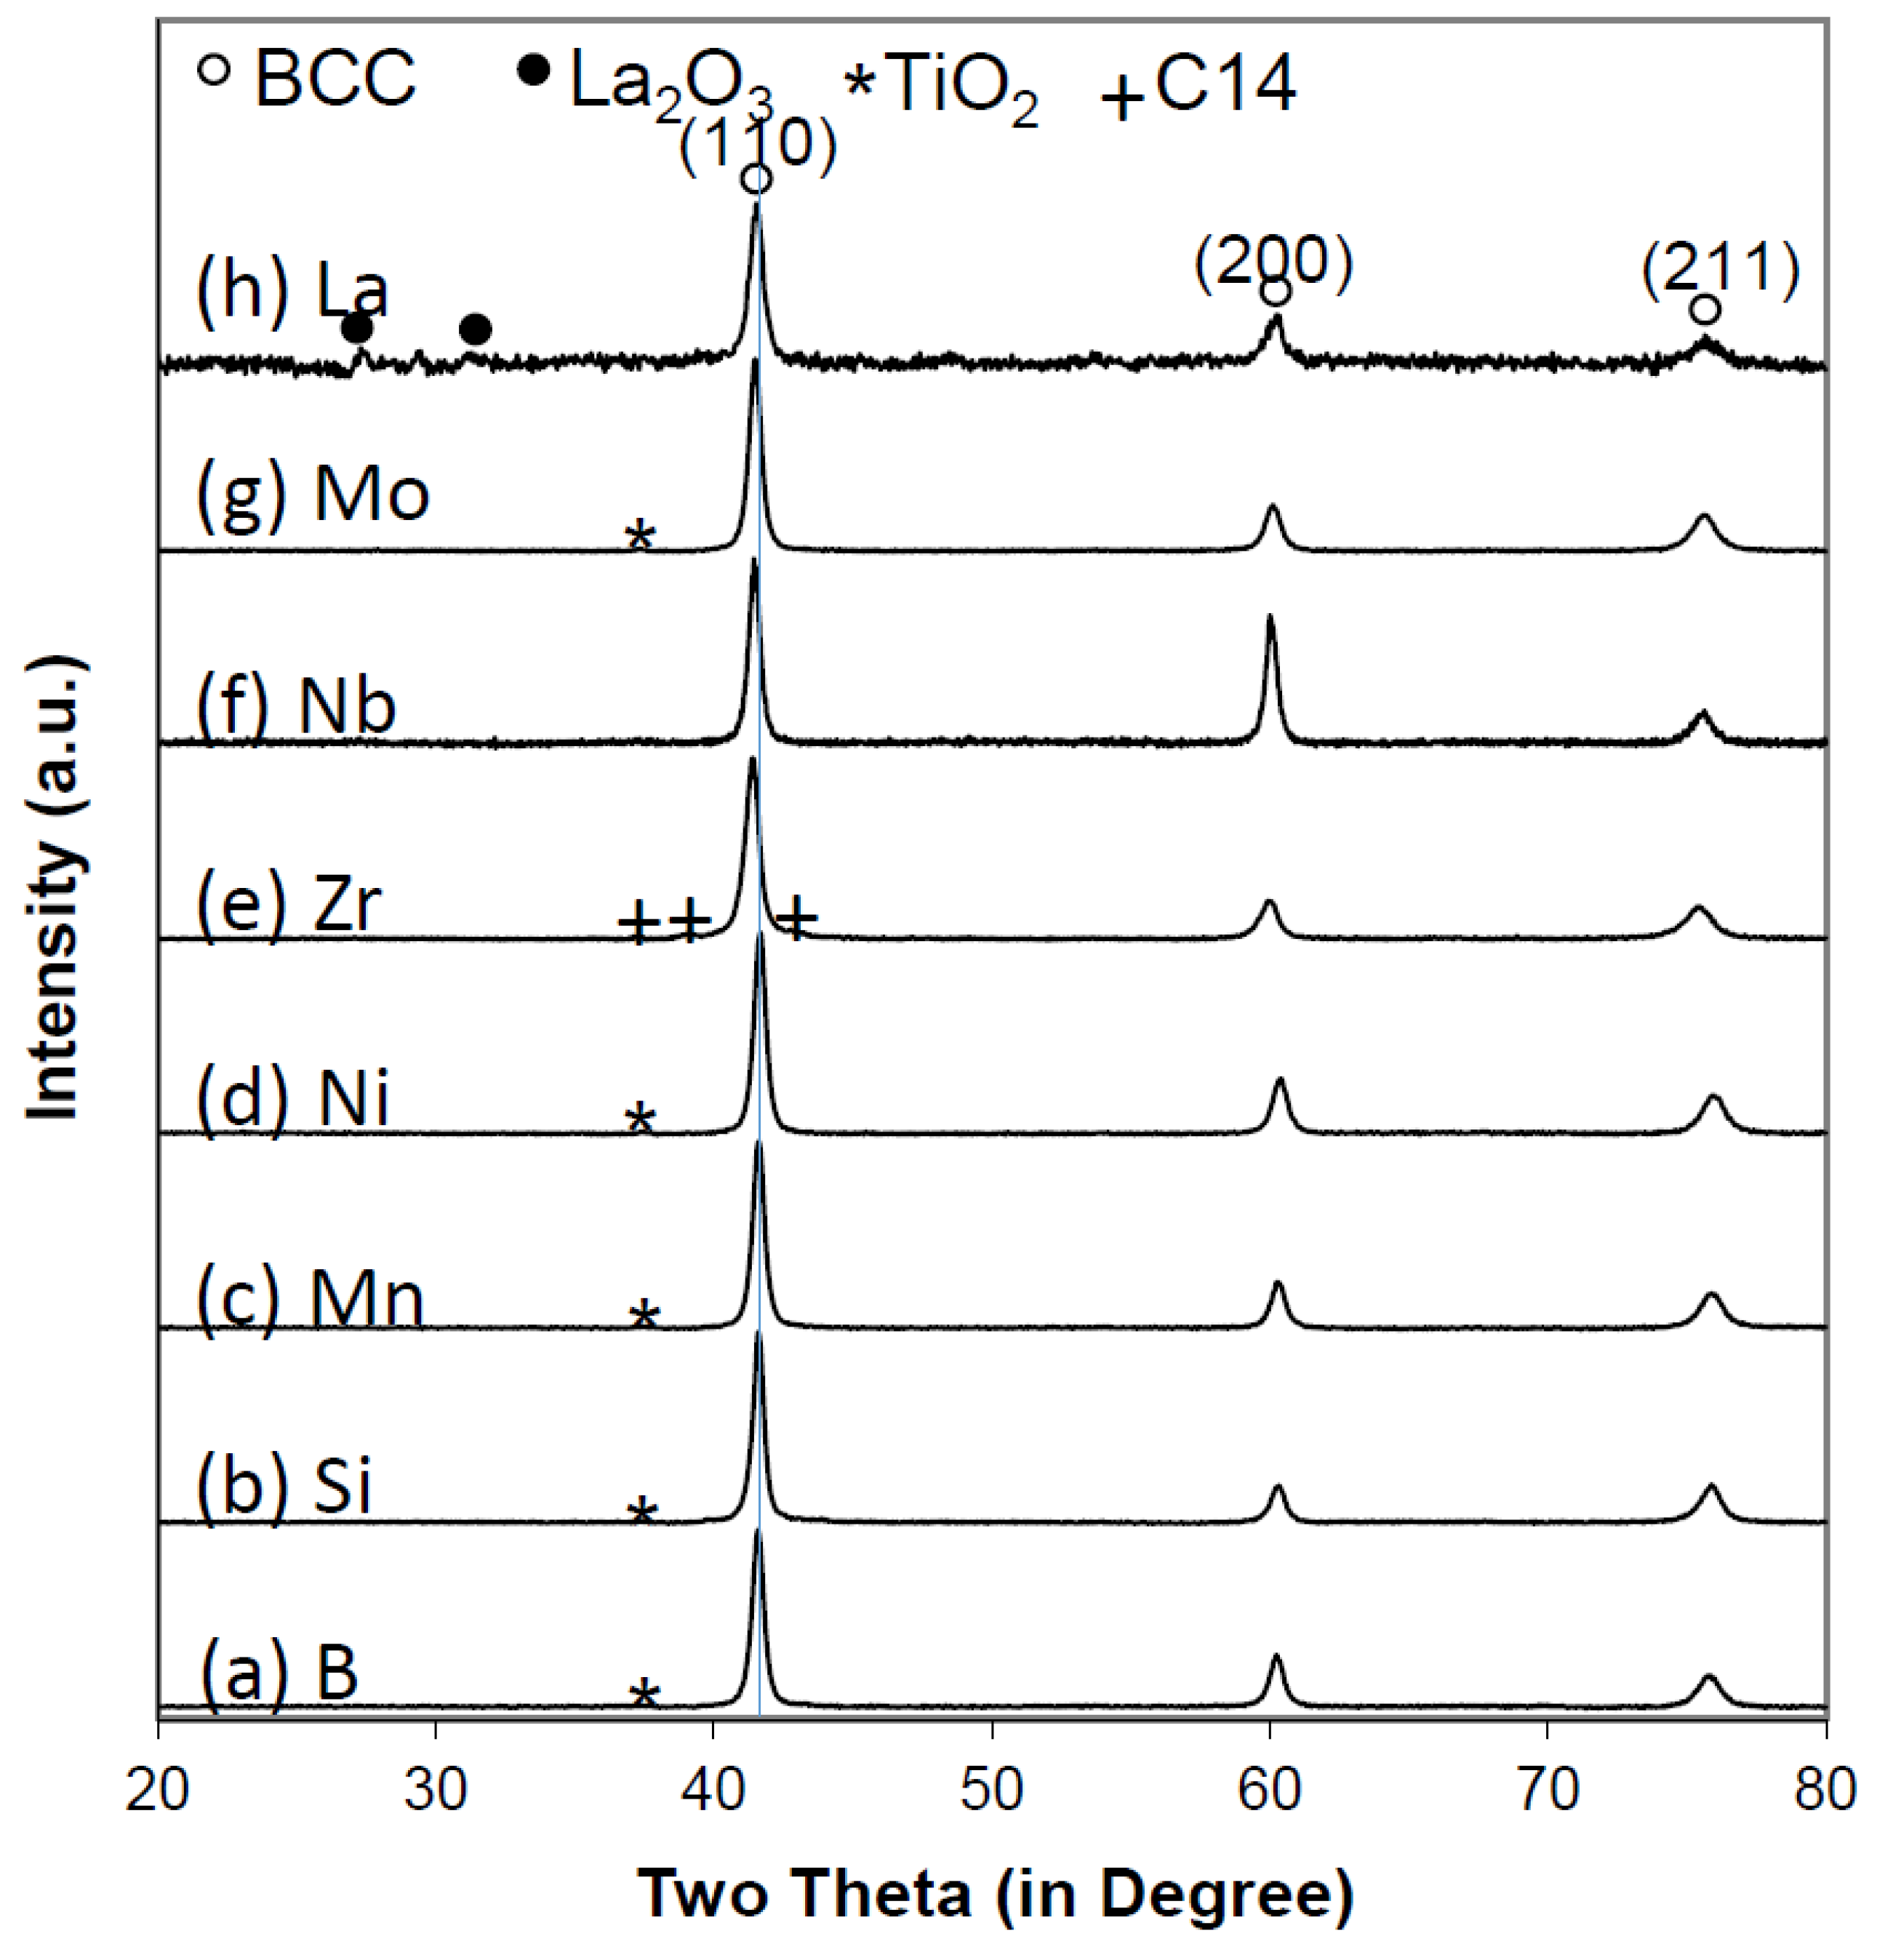
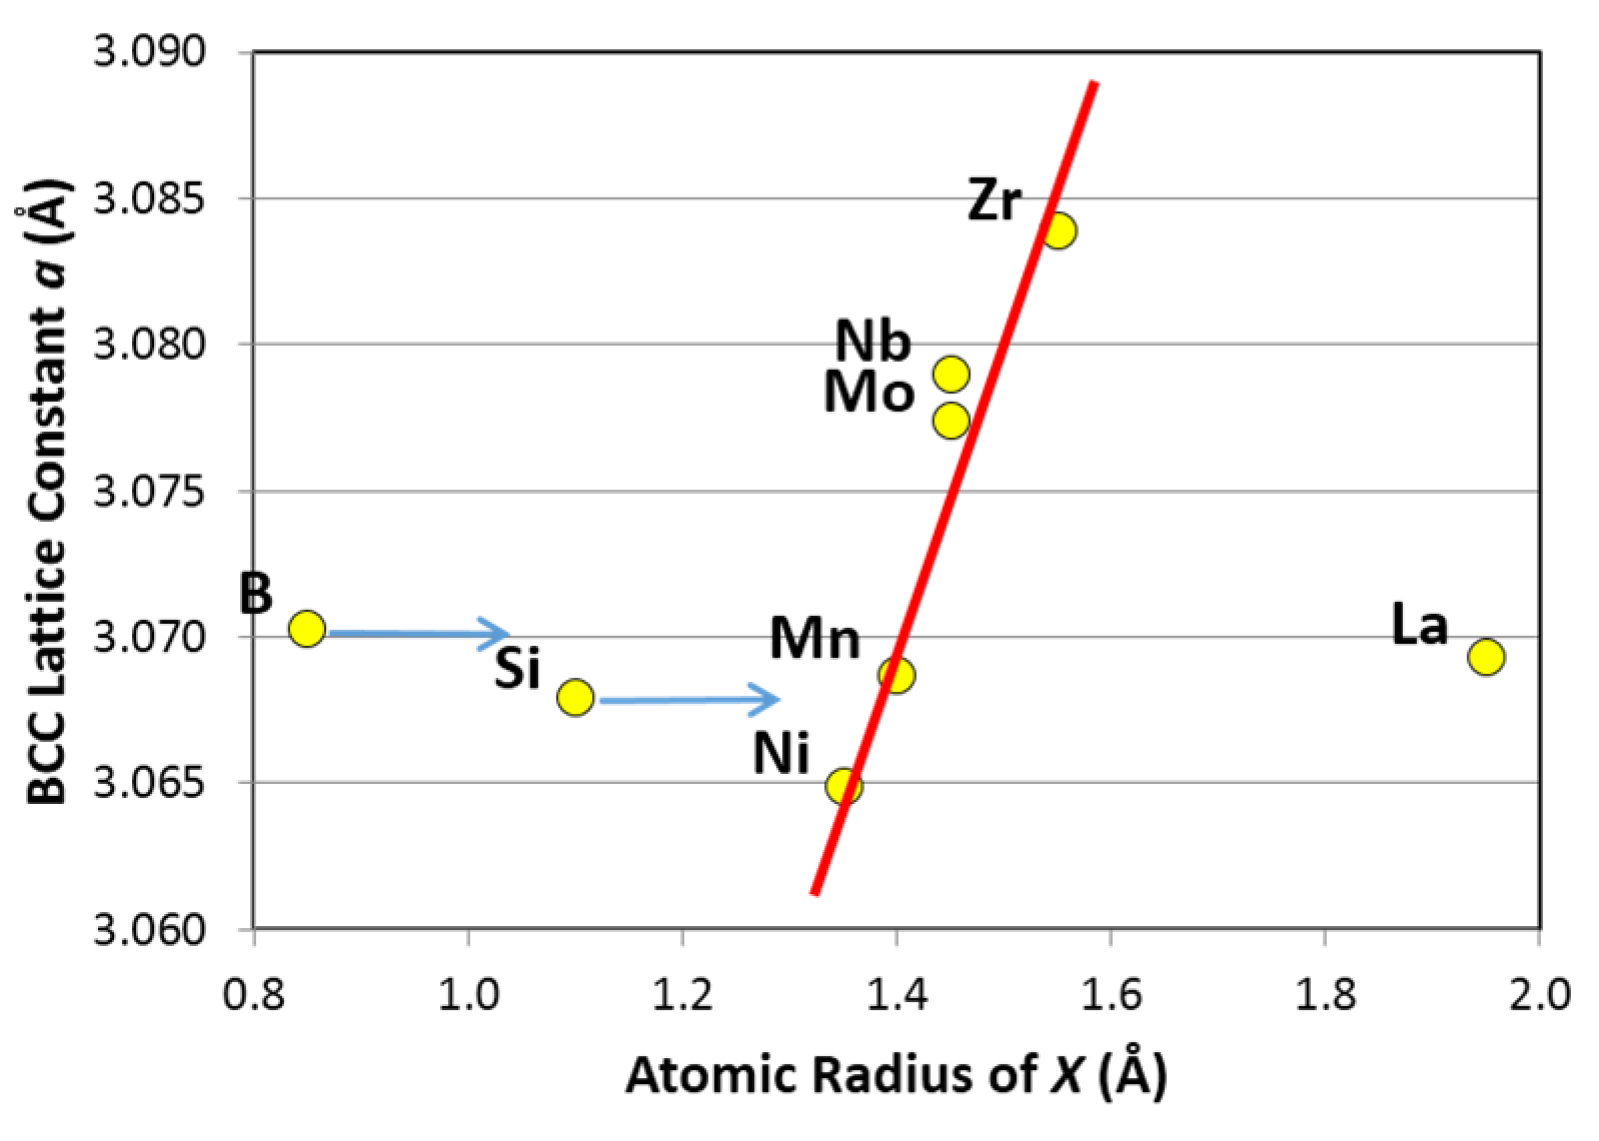
3.1. X-Ray Diffraction Structure Analysis

| X | a of BCC phase | BCC phase abundance | Secondary phase | a of secondary phase | c of secondary phase | Secondary phase abundance |
|---|---|---|---|---|---|---|
| Å | wt% | Å | Å | wt% | ||
| B | 3.0703 | 98.2 | TiO2 | 4.1761 | - | 1.8 |
| Si | 3.0679 | 96.9 | TiO2 | 4.1472 | - | 3.1 |
| Mn | 3.0687 | 98.9 | TiO2 | 4.1687 | - | 1.1 |
| Ni | 3.0649 | 99.7 | TiO2 | 4.1567 | - | 0.3 |
| Zr | 3.0839 | 98.2 | C14 | 4.9895 | 8.1790 | 1.8 |
| Nb | 3.0790 | 99.8 | TiO2 | 4.1743 | - | 0.2 |
| Mo | 3.0774 | 99.6 | TiO2 | 4.1706 | - | 0.4 |
| La | 3.0693 | 98.3 | La2O3 | 11.302 | - | 1.7 |
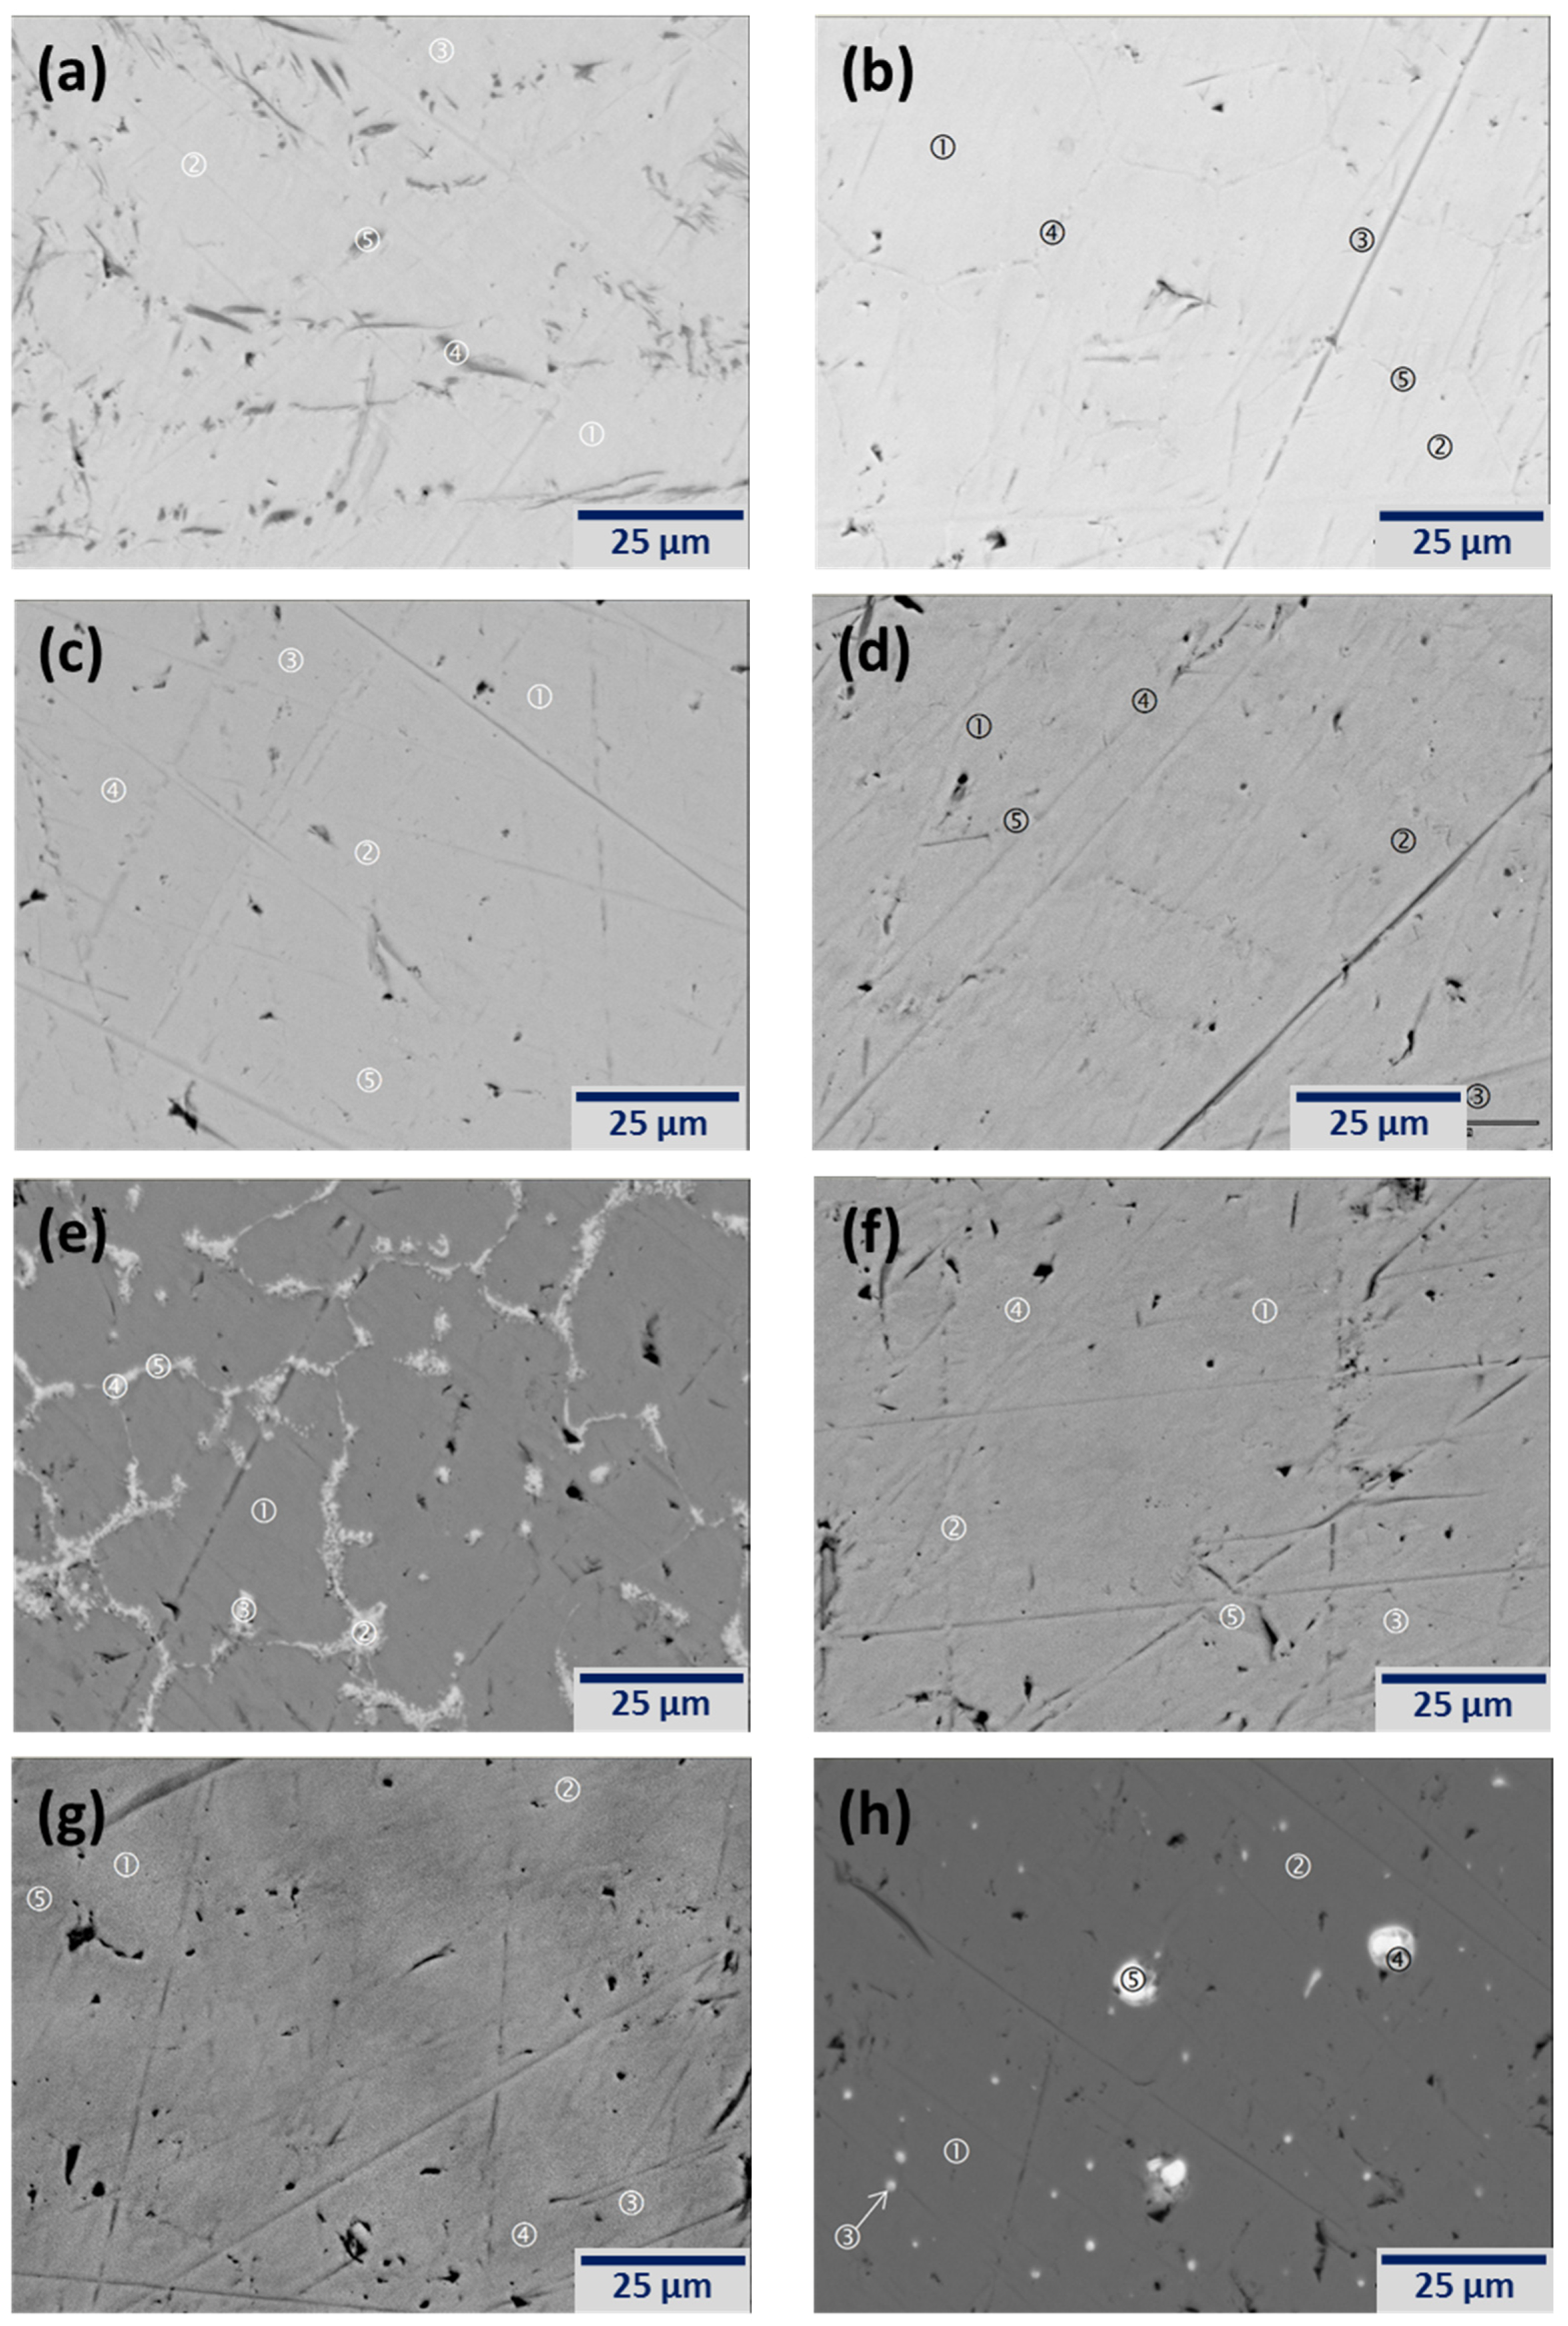
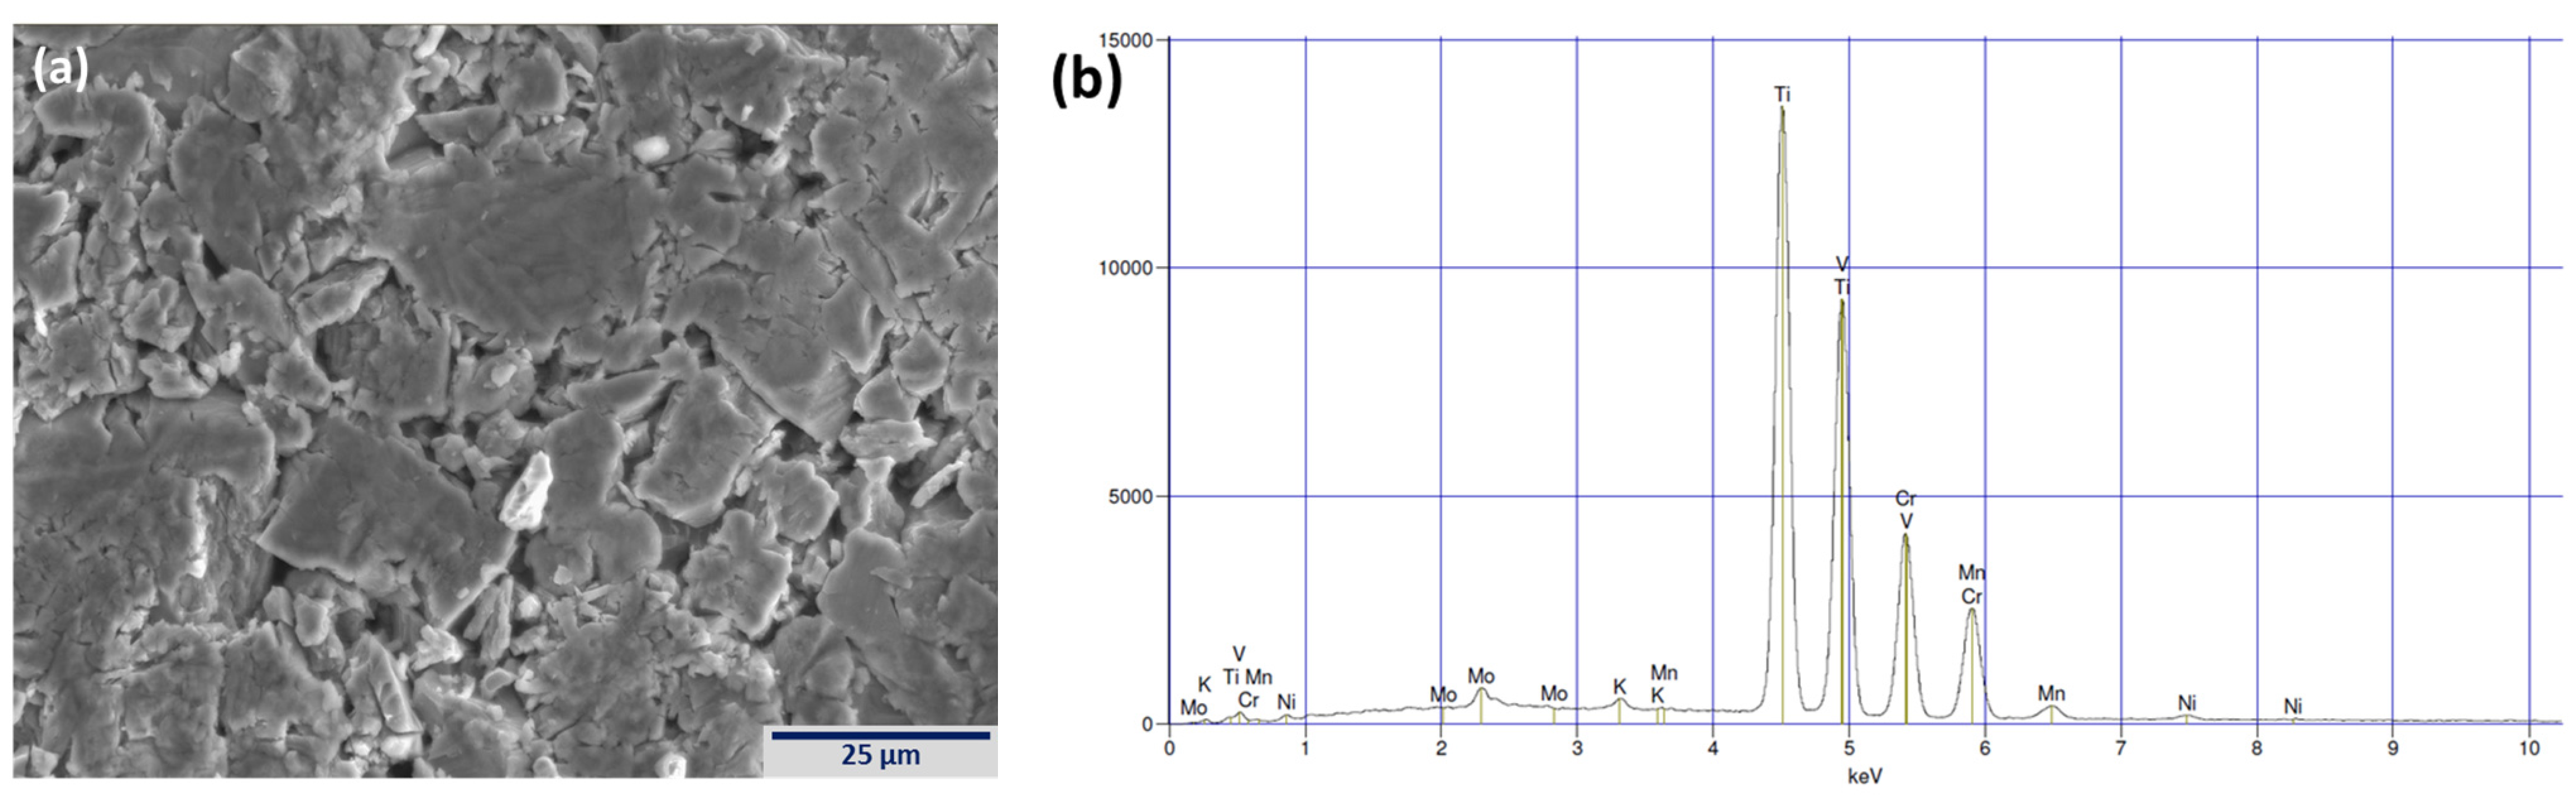
3.2. Scanning Electron Microscope/Energy Dispersive Spectroscopy Microstructure Analysis

| Location | Ti | V | Cr | Mn | X | Phase |
|---|---|---|---|---|---|---|
| Figure 3a-1 | 41.1 | 29.3 | 16.7 | 12.9 | 0.0 | BCC |
| Figure 3a-2 | 42.2 | 28.0 | 16.2 | 13.7 | 0.0 | BCC |
| Figure 3a-3 | 42.2 | 28.2 | 16.3 | 13.3 | 0.0 | BCC |
| Figure 3a-4 | 59.5 | 23.9 | 9.3 | 7.3 | 0.0 | Oxide |
| Figure 3a-5 | 64.4 | 22.5 | 7.6 | 5.5 | 0.0 | Oxide |
| Figure 3b-1 | 38.7 | 31.9 | 15.8 | 12.1 | 1.6 | BCC |
| Figure 3b-2 | 38.4 | 32.2 | 15.8 | 12.1 | 1.5 | BCC |
| Figure 3b-3 | 49.7 | 15.4 | 12.0 | 15.4 | 7.5 | Oxide |
| Figure 3b-4 | 55.8 | 15.3 | 10.5 | 12.6 | 5.8 | Oxide |
| Figure 3b-5 | 55.6 | 17.4 | 10.2 | 11.5 | 5.2 | Oxide |
| Figure 3c-1 | 38.8 | 30.1 | 15.8 | 15.3 | 0.0 | BCC |
| Figure 3c-2 | 38.7 | 29.9 | 15.9 | 15.5 | 0.0 | BCC |
| Figure 3c-3 | 41.6 | 26.4 | 14.9 | 17.0 | 0.0 | BCC |
| Figure 3c-4 | 43.3 | 26.2 | 14.6 | 15.9 | 0.0 | BCC |
| Figure 3c-5 | 42.1 | 25.9 | 14.9 | 17.1 | 0.0 | BCC |
| Figure 3d-1 | 36.9 | 33.8 | 16.6 | 11.4 | 1.3 | BCC |
| Figure 3d-2 | 38.6 | 31.9 | 16.1 | 12.0 | 1.3 | BCC |
| Figure 3d-3 | 42.6 | 28.2 | 14.7 | 12.4 | 2.1 | BCC |
| Figure 3d-4 | 51.1 | 16.8 | 10.0 | 12.6 | 9.4 | TiNi |
| Figure 3d-5 | 57.9 | 9.1 | 5.9 | 11.2 | 16.0 | TiNi |
| Figure 3e-1 | 39.7 | 31.3 | 15.7 | 12.1 | 1.1 | BCC |
| Figure 3e-2 | 43.1 | 19.9 | 13.3 | 15.9 | 7.7 | C14/ZrxNiy |
| Figure 3e-3 | 32.9 | 19.3 | 16.7 | 20.4 | 10.6 | C14/ZrxNiy |
| Figure 3e-4 | 31.5 | 17.9 | 16.4 | 21.5 | 12.7 | C14/ZrxNiy |
| Figure 3e-5 | 39.0 | 17.3 | 14.8 | 18.4 | 10.5 | C14/ZrxNiy |
| Figure 3f-1 | 38.7 | 32.8 | 15.1 | 11.3 | 2.1 | BCC |
| Figure 3f-2 | 39.6 | 31.6 | 14.9 | 11.8 | 2.1 | BCC |
| Figure 3f-3 | 39.6 | 31.8 | 14.9 | 11.6 | 2.1 | BCC |
| Figure 3f-4 | 43.3 | 27.8 | 14.1 | 13.0 | 1.9 | BCC |
| Figure 3f-5 | 45.1 | 25.9 | 13.9 | 13.3 | 1.9 | BCC |
| Figure 3g-1 | 40.5 | 29.9 | 16.1 | 12.0 | 1.5 | BCC |
| Figure 3g-2 | 41.4 | 29.0 | 16.1 | 12.3 | 1.3 | BCC |
| Figure 3g-3 | 42.1 | 27.9 | 15.9 | 12.9 | 1.2 | BCC |
| Figure 3g-4 | 44.9 | 25.5 | 15.3 | 13.6 | 0.7 | BCC |
| Figure 3g-5 | 46.7 | 23.6 | 14.9 | 14.3 | 0.6 | BCC |
| Figure 3h-1 | 45.5 | 26.1 | 13.9 | 14.5 | 0.0 | BCC |
| Figure 3h-2 | 43.6 | 28.2 | 14.5 | 13.6 | 0.0 | BCC |
| Figure 3h-3 | 34.0 | 24.2 | 10.5 | 9.1 | 22.2 | La2O3 |
| Figure 3h-4 | 16.1 | 10.4 | 1.0 | 5.6 | 66.9 | La2O3 |
| Figure 3h-5 | 5.0 | 2.9 | 1.0 | 0.0 | 91.2 | La |
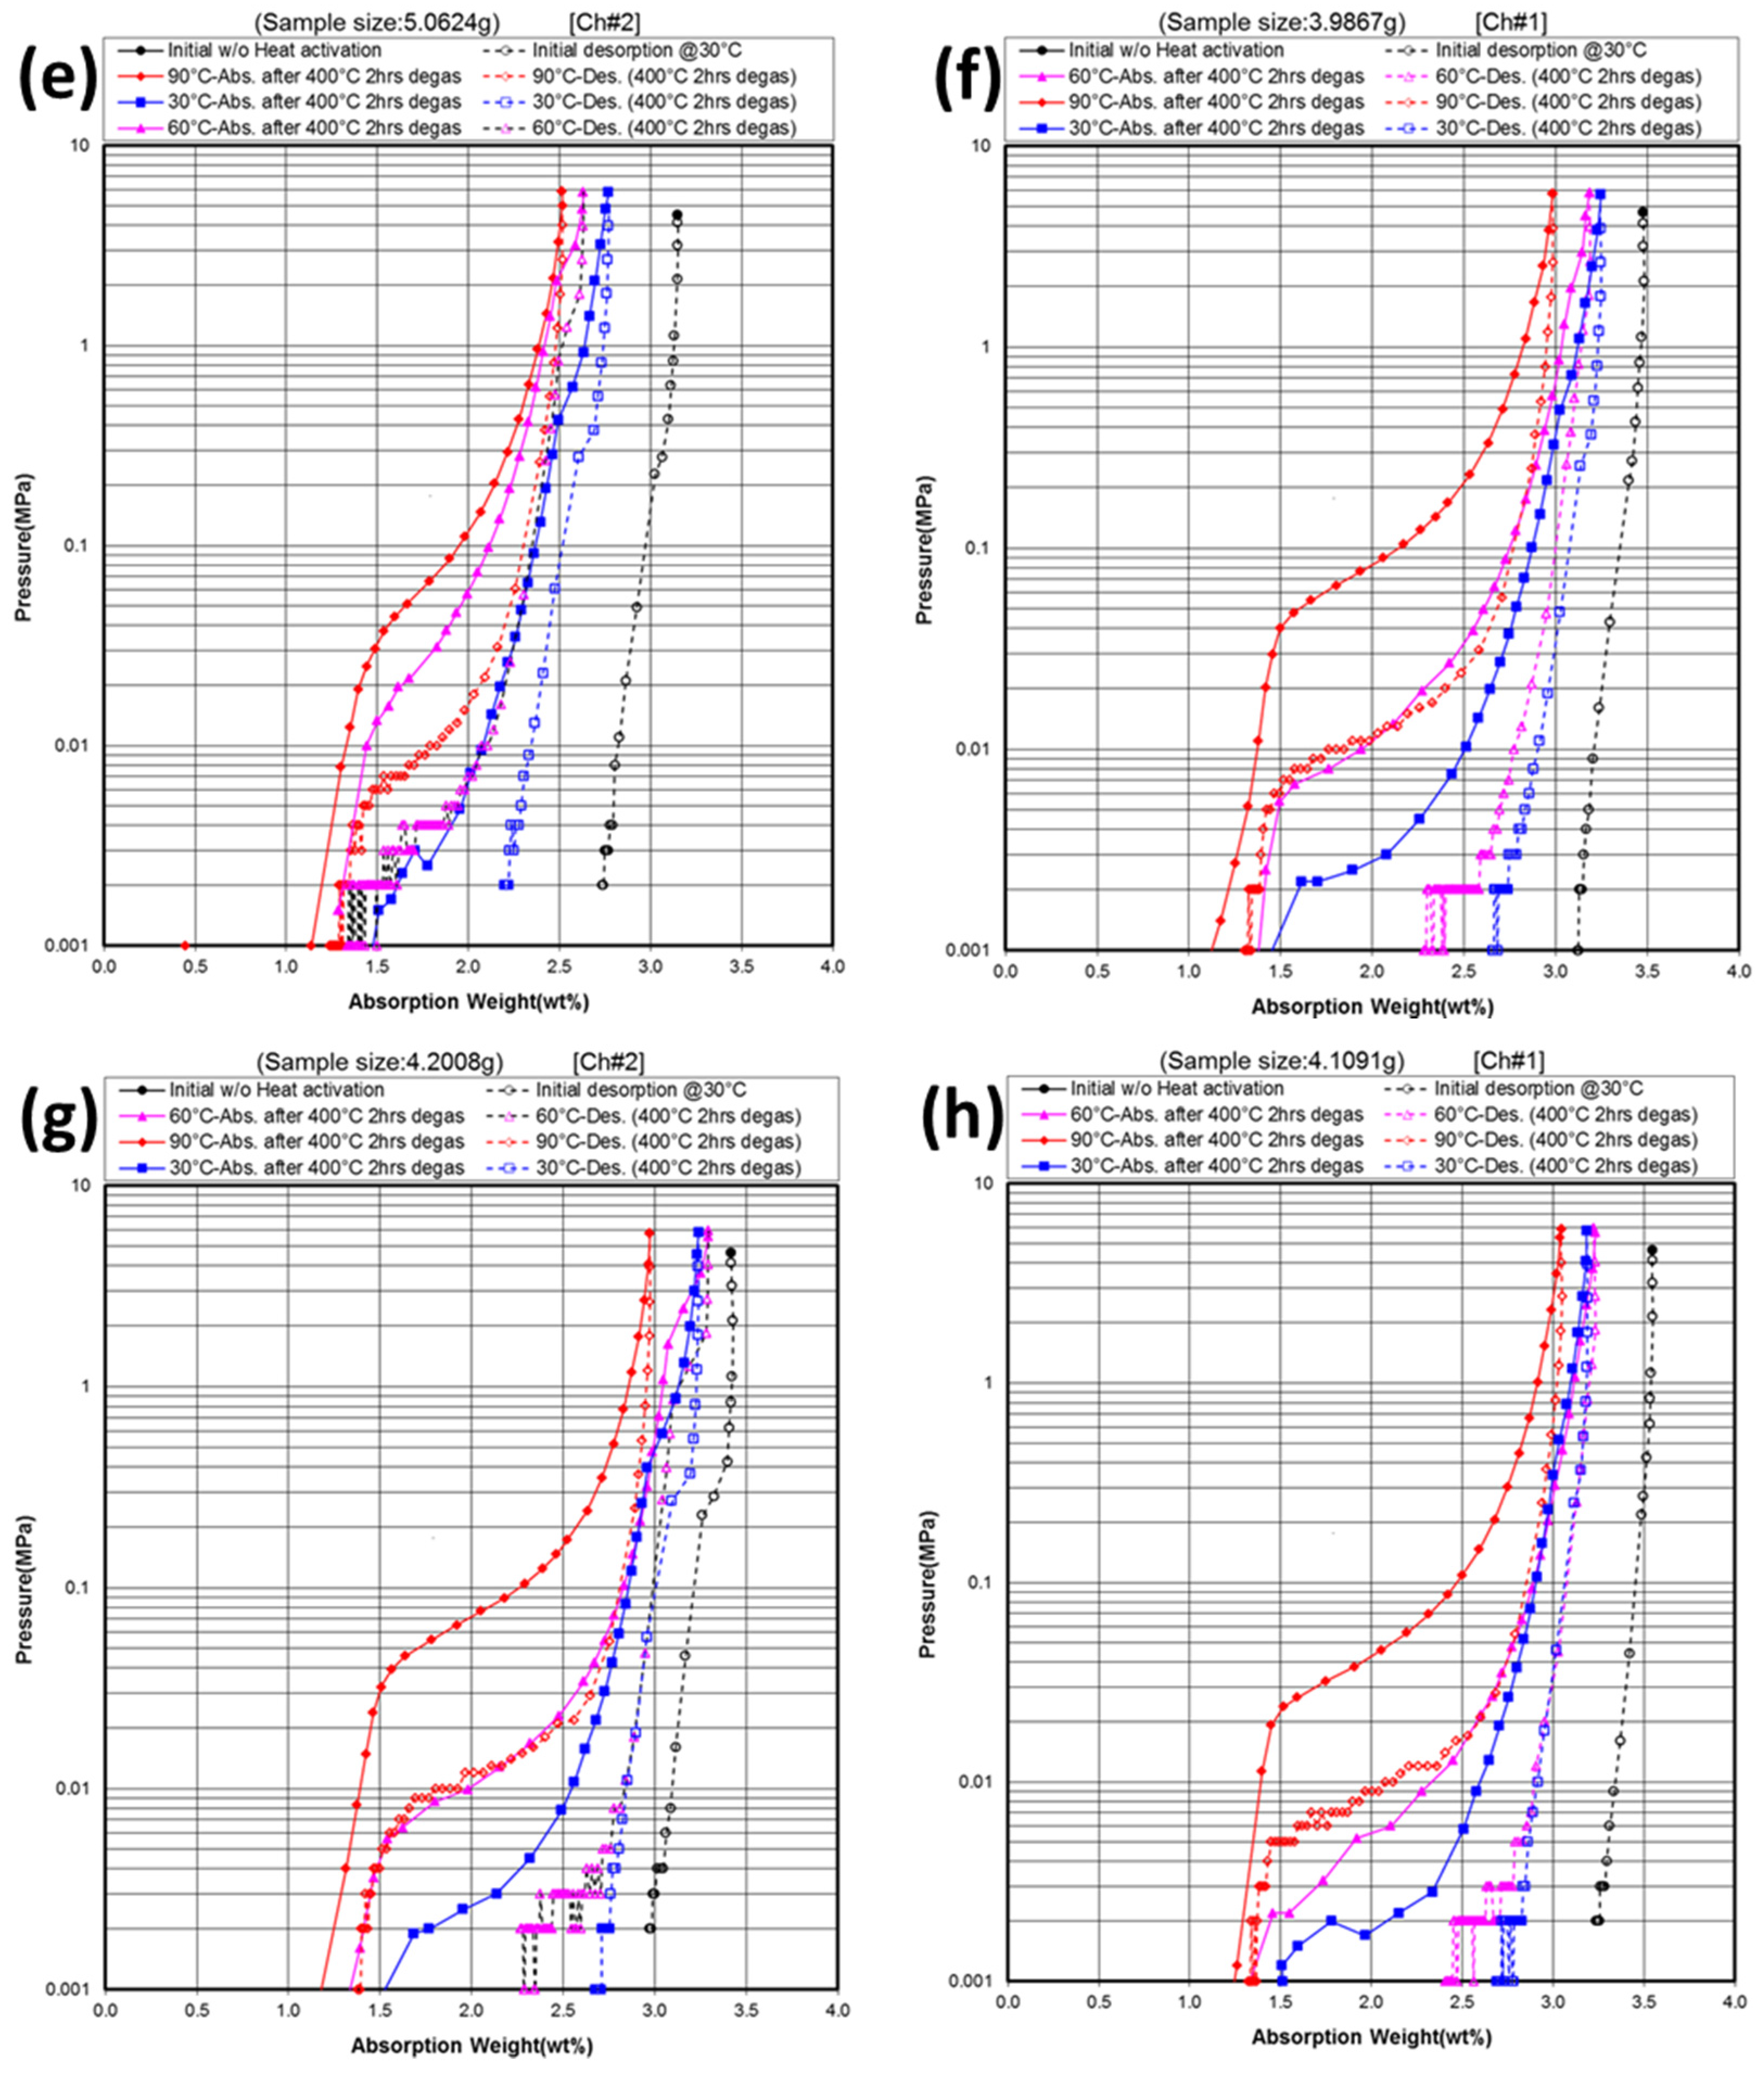
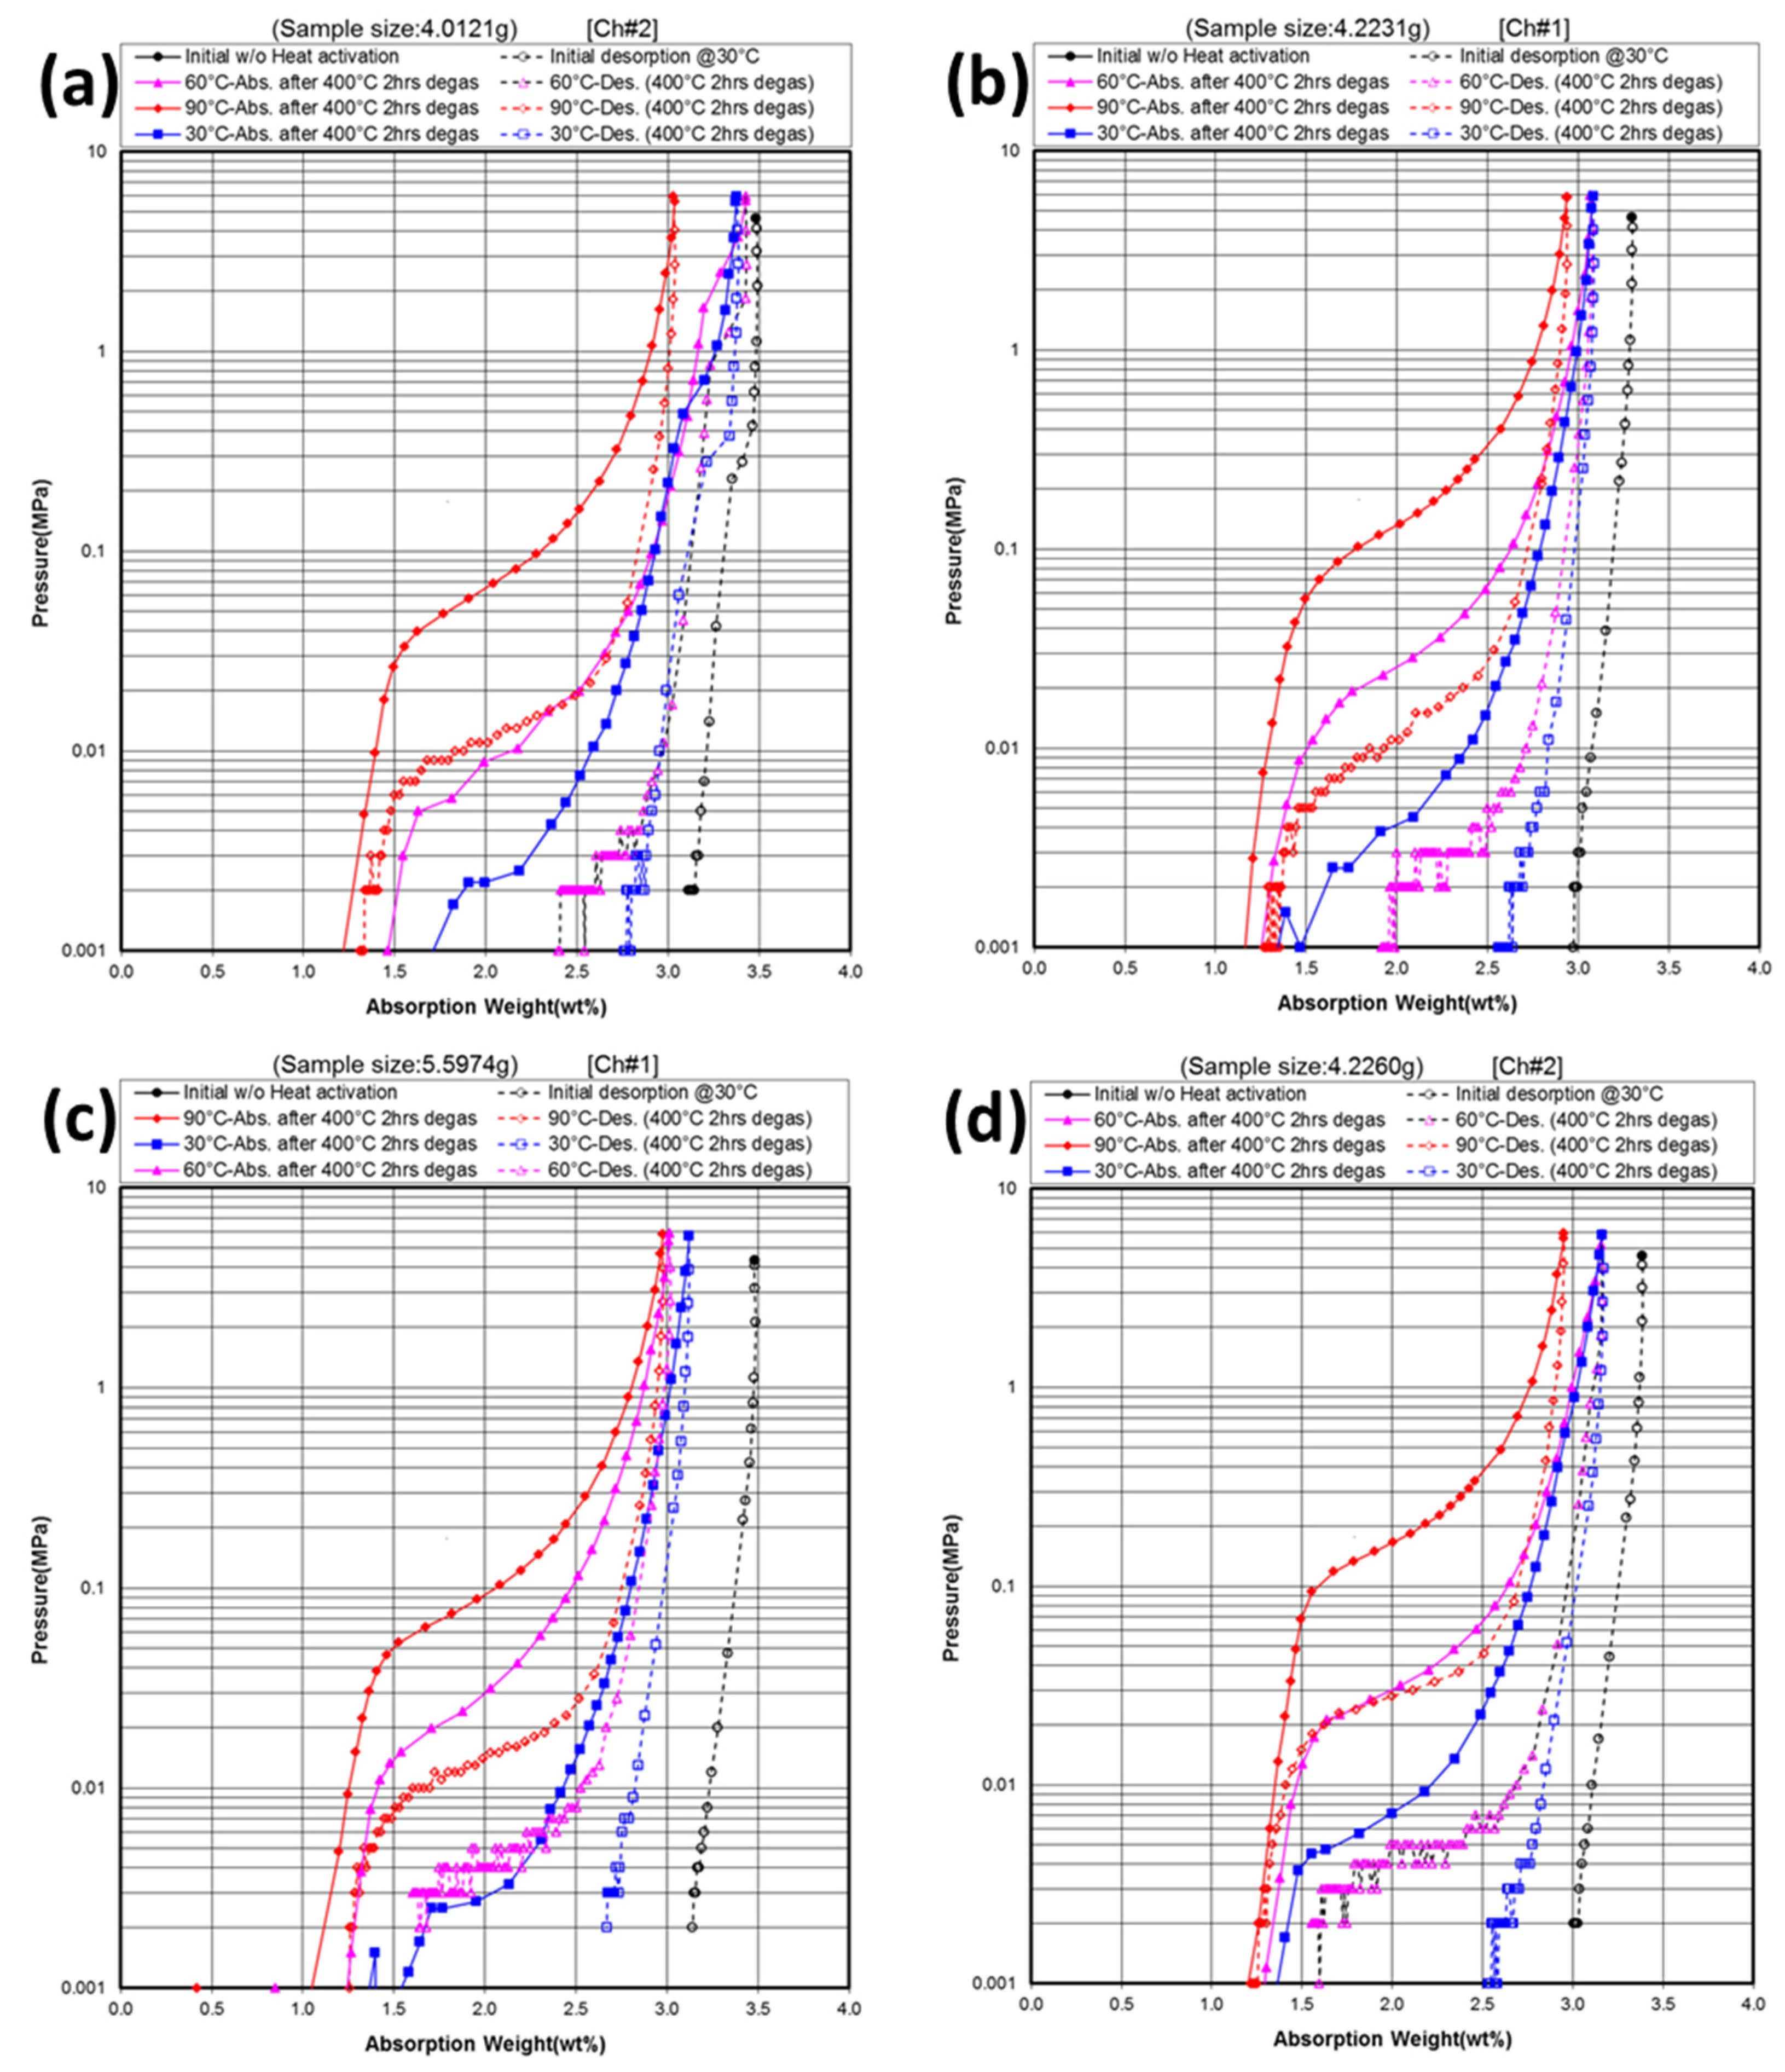
3.3. Gaseous Phase Study
| X | Initial maximum capacity | 30 °C maximum capacity | 30 °C reversible capacity | 60 °C maximum capacity | 60 °C reversible capacity | 90 °C desorption pressure @2.0 wt% | 90 °C hysteresis @2.0 wt% | −∆H | −∆S | PCT plateau @0.3 MPa |
|---|---|---|---|---|---|---|---|---|---|---|
| wt% | wt% | wt% | wt% | wt% | MPa | kJ·mol−1 | J·mol−1·K−1 | |||
| B | 3.48 | 3.38 | 1.73 | 3.43 | 1.00 | 0.011 | 1.7 | 67 | 181 | Yes |
| Si | 3.30 | 3.08 | 0.52 | 3.08 | 1.12 | 0.011 | 2.5 | 56 | 156 | No |
| Mn | 3.47 | 3.11 | 0.49 | 3.02 | 1.40 | 0.013 | 2.0 | 37 | 107 | No |
| Ni | 3.39 | 3.16 | 0.63 | 3.16 | 1.56 | 0.028 | 1.8 | 58 | 165 | No |
| Zr | 3.12 | 2.76 | 0.53 | 2.59 | 1.09 | 0.016 | 1.9 | 22 | 63 | Yes |
| Nb | 3.48 | 3.25 | 0.59 | 3.19 | 0.86 | 0.011 | 2.0 | 64 | 176 | Yes |
| Mo | 3.42 | 3.24 | 0.56 | 3.29 | 1.00 | 0.012 | 1.8 | 66 | 178 | Yes |
| La | 3.55 | 3.19 | 0.49 | 3.19 | 0.74 | 0.009 | 1.6 | 67 | 178 | No |

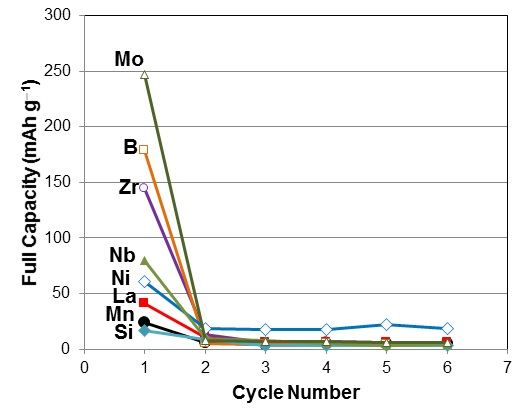
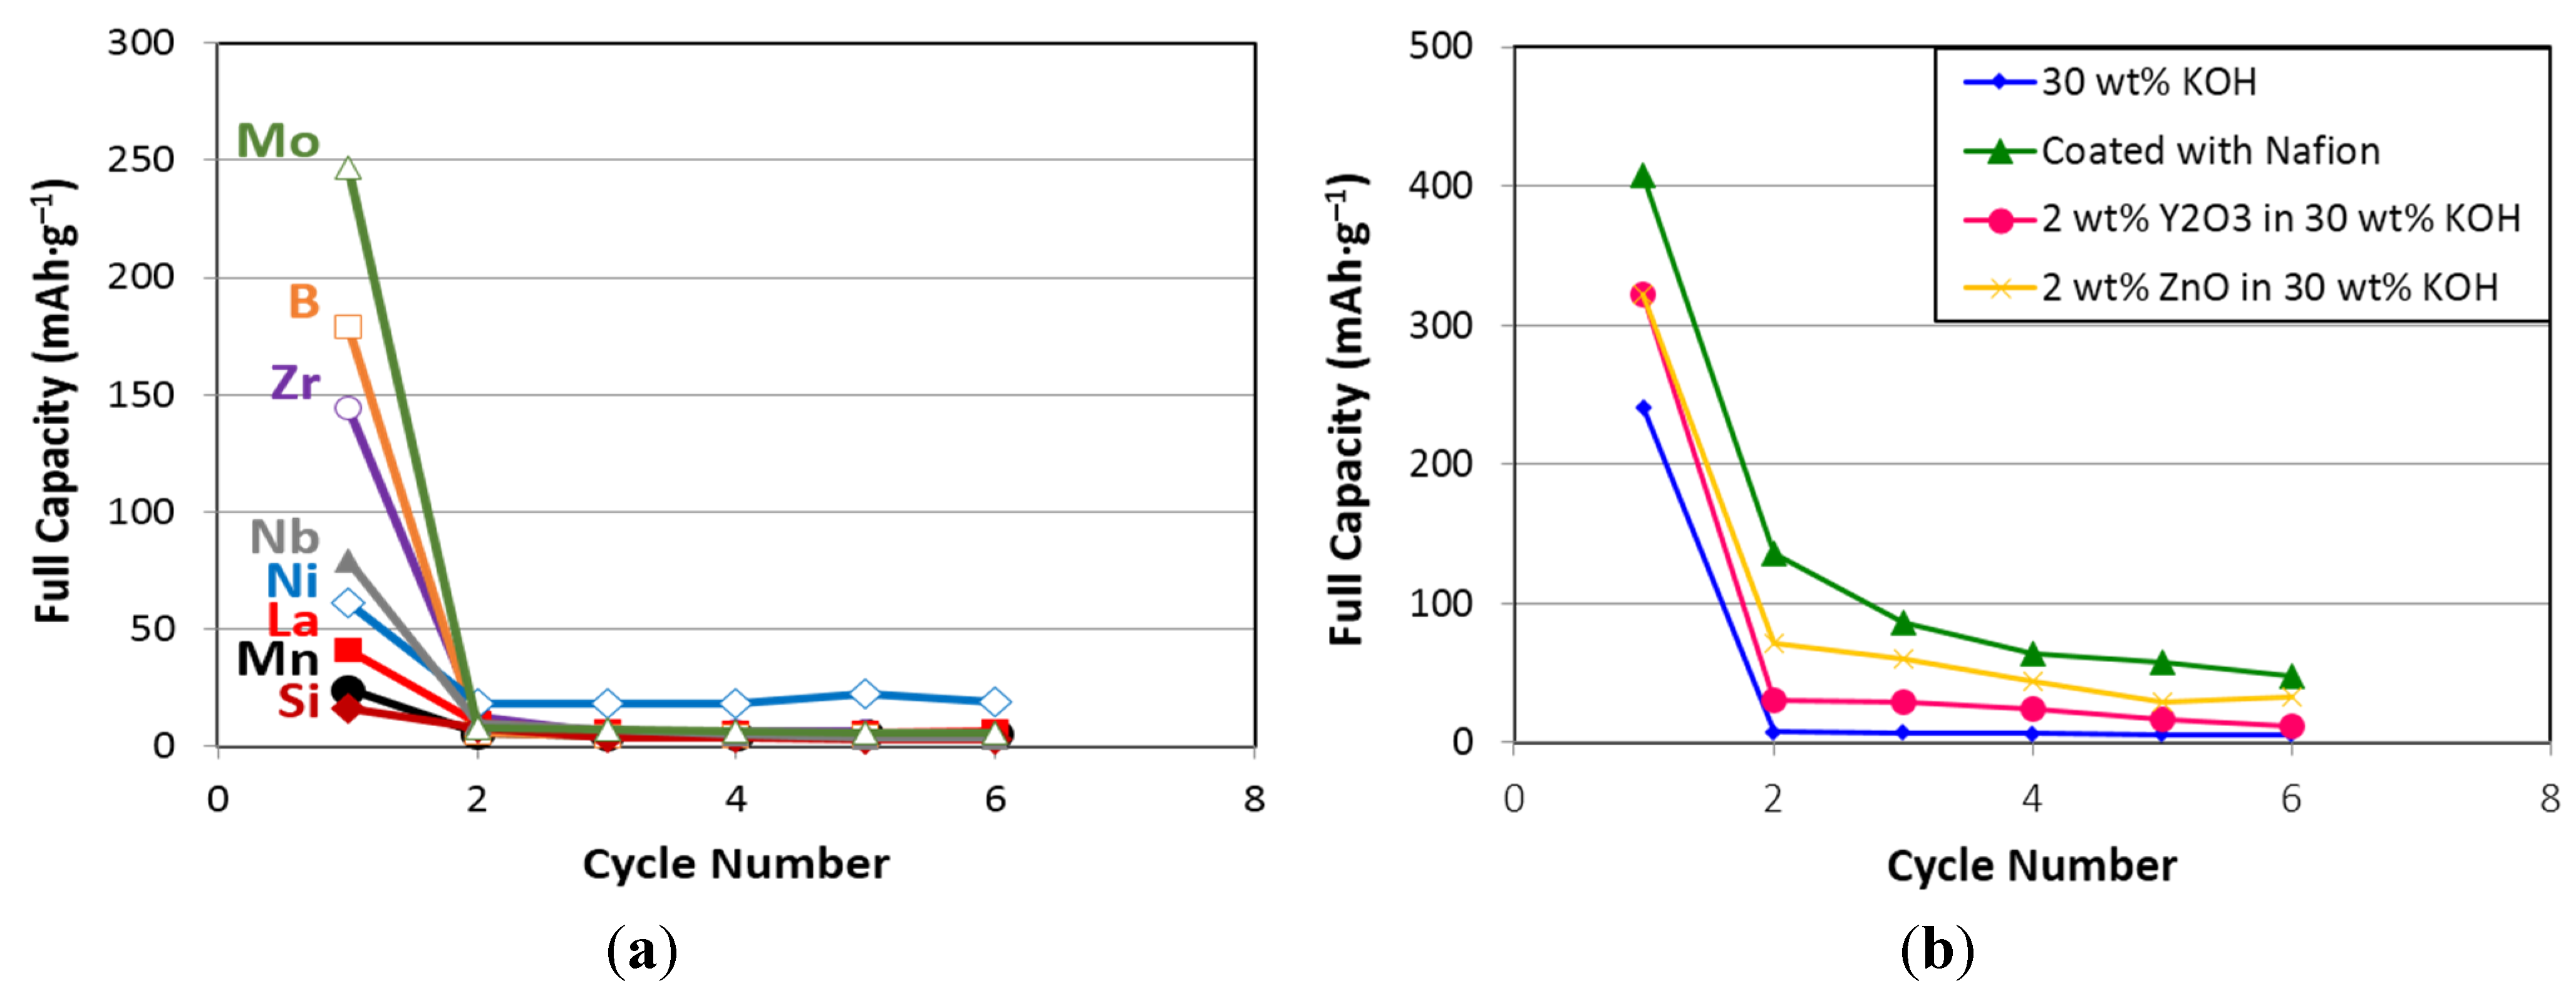
3.4. Electrochemical Measurement in 30% KOH
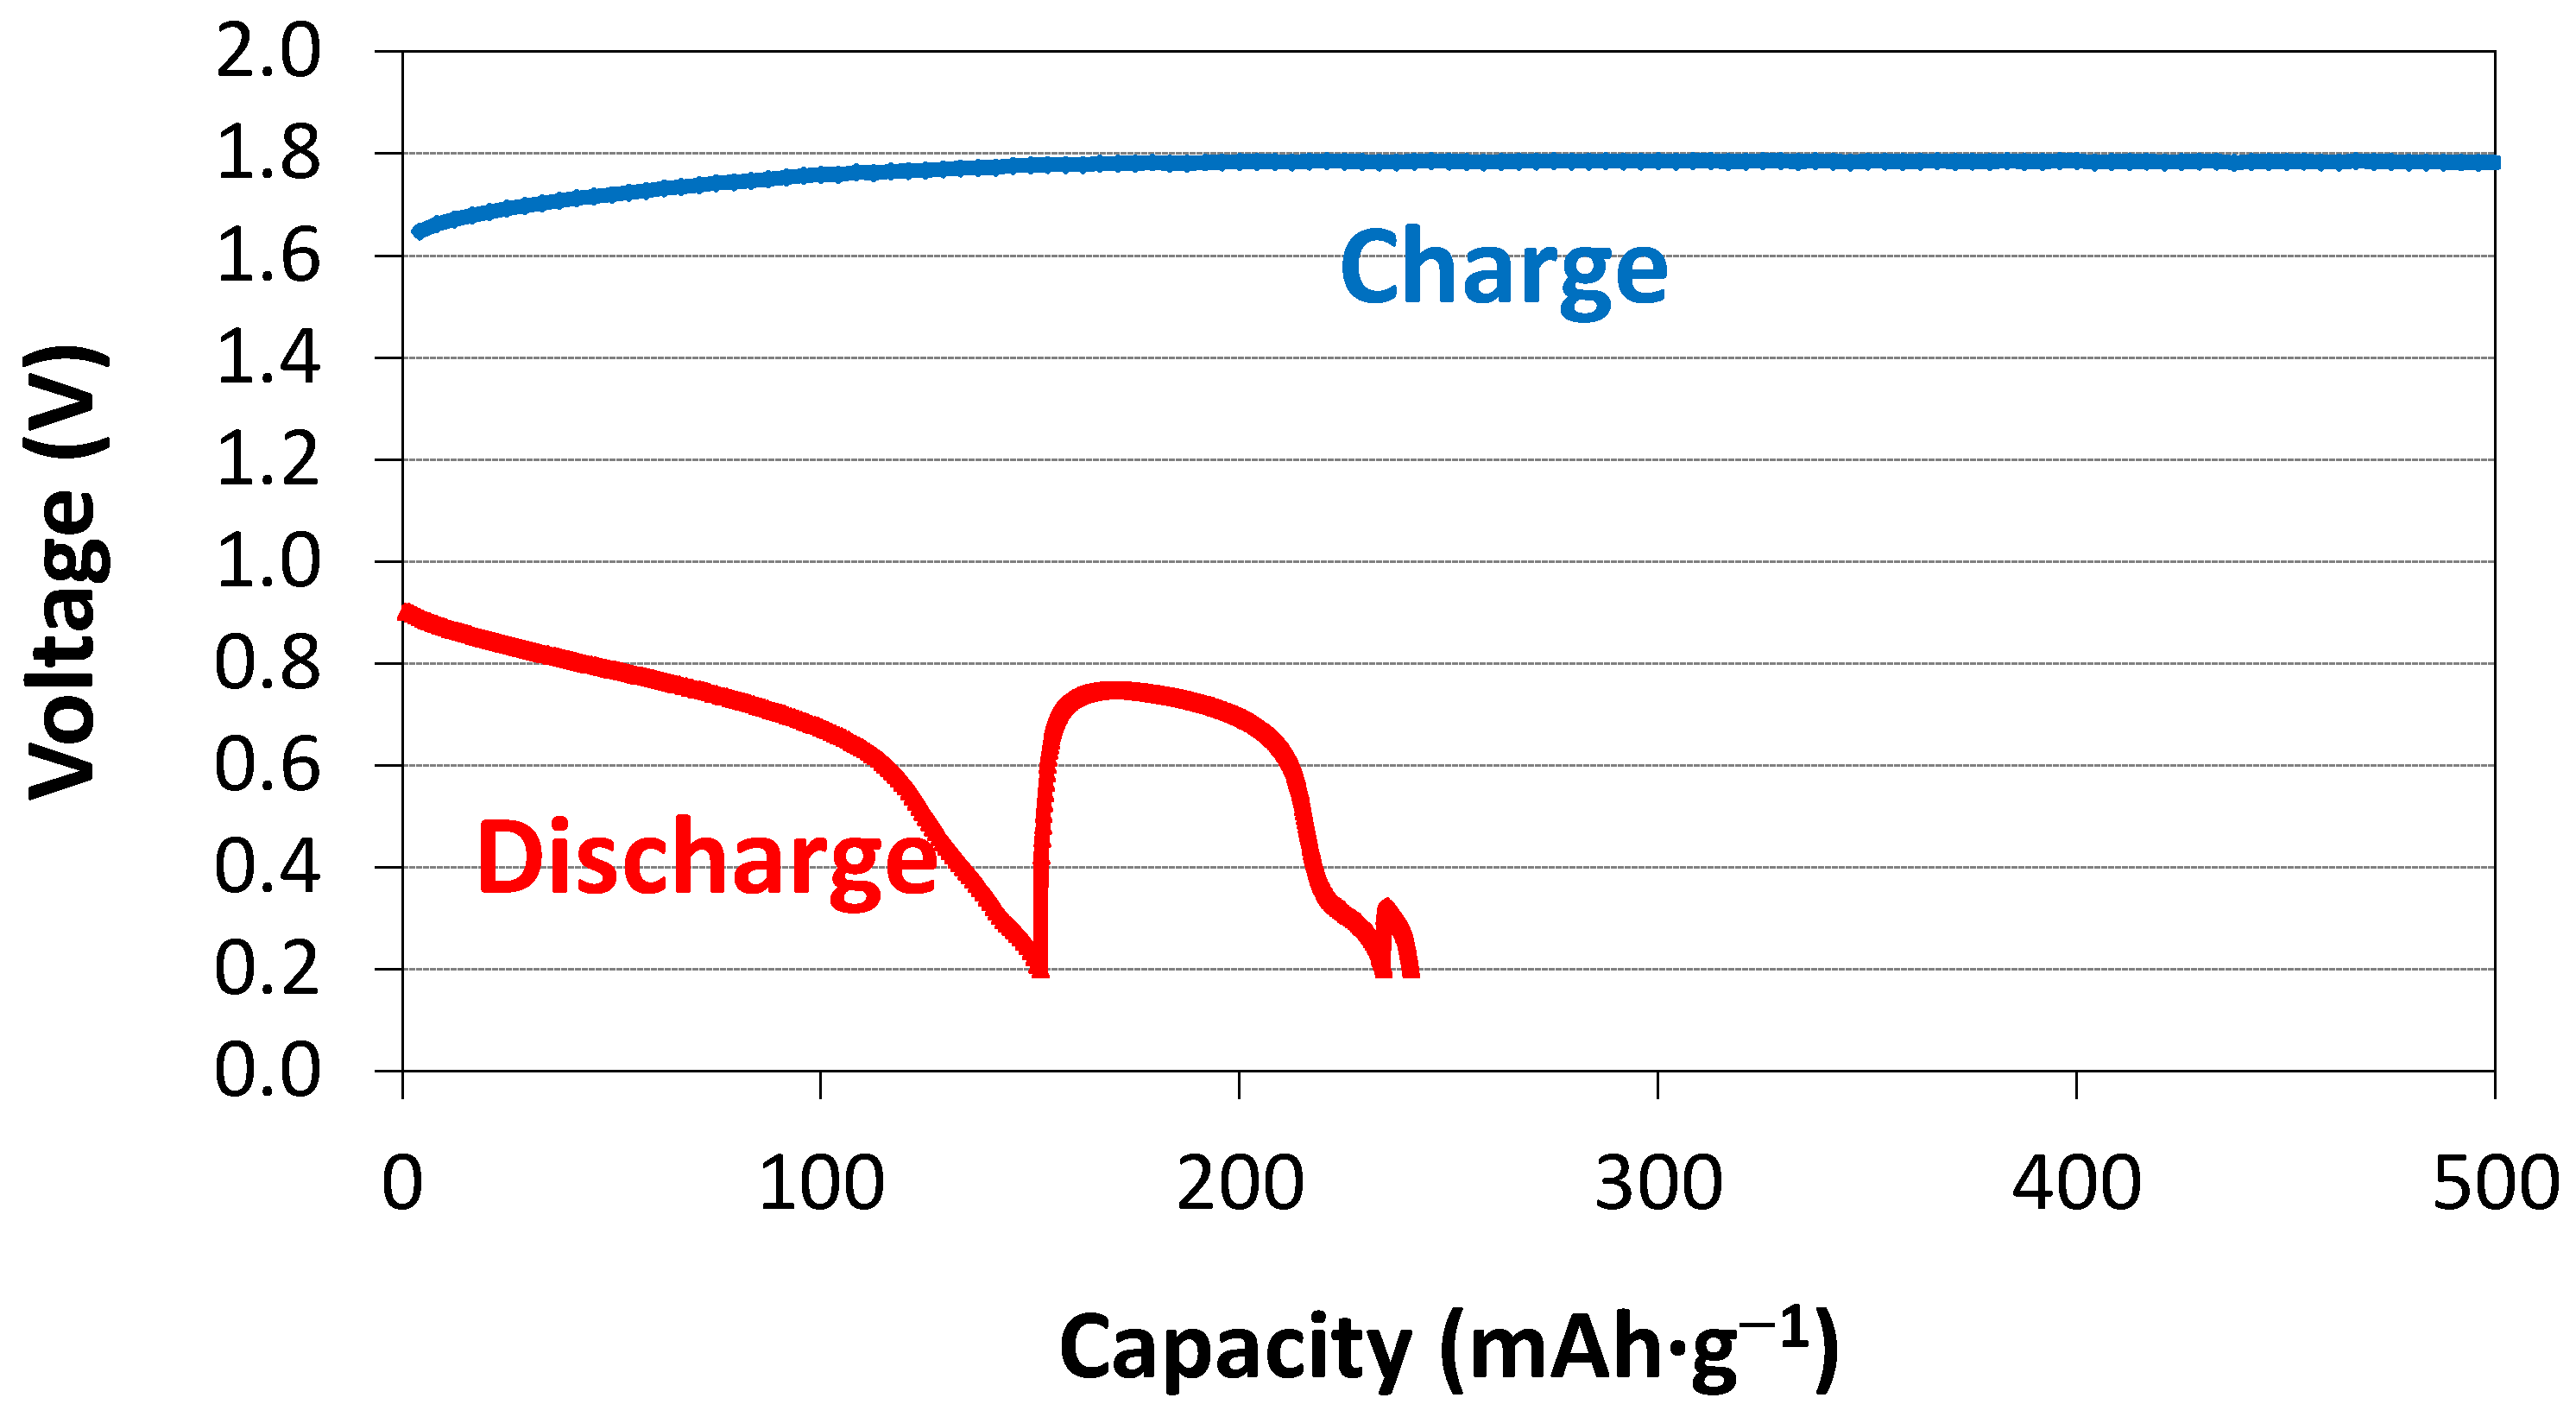
| X | 1st cycle capacity @ 50 mA·g−1 | 1st cycle capacity @ 12 mA·g−1 | 1st cycle capacity @ 4 mA·g−1 |
|---|---|---|---|
| mAh·g−1 | mAh·g−1 | mAh·g−1 | |
| B | 81 | 163 | 179 |
| Si | 8 | 14 | 16 |
| Mn | 12 | 20 | 24 |
| Ni | 33 | 47 | 61 |
| Zr | 64 | 130 | 144 |
| Nb | 41 | 68 | 79 |
| Mo | 152 | 234 | 247 |
| La | 23 | 39 | 41 |
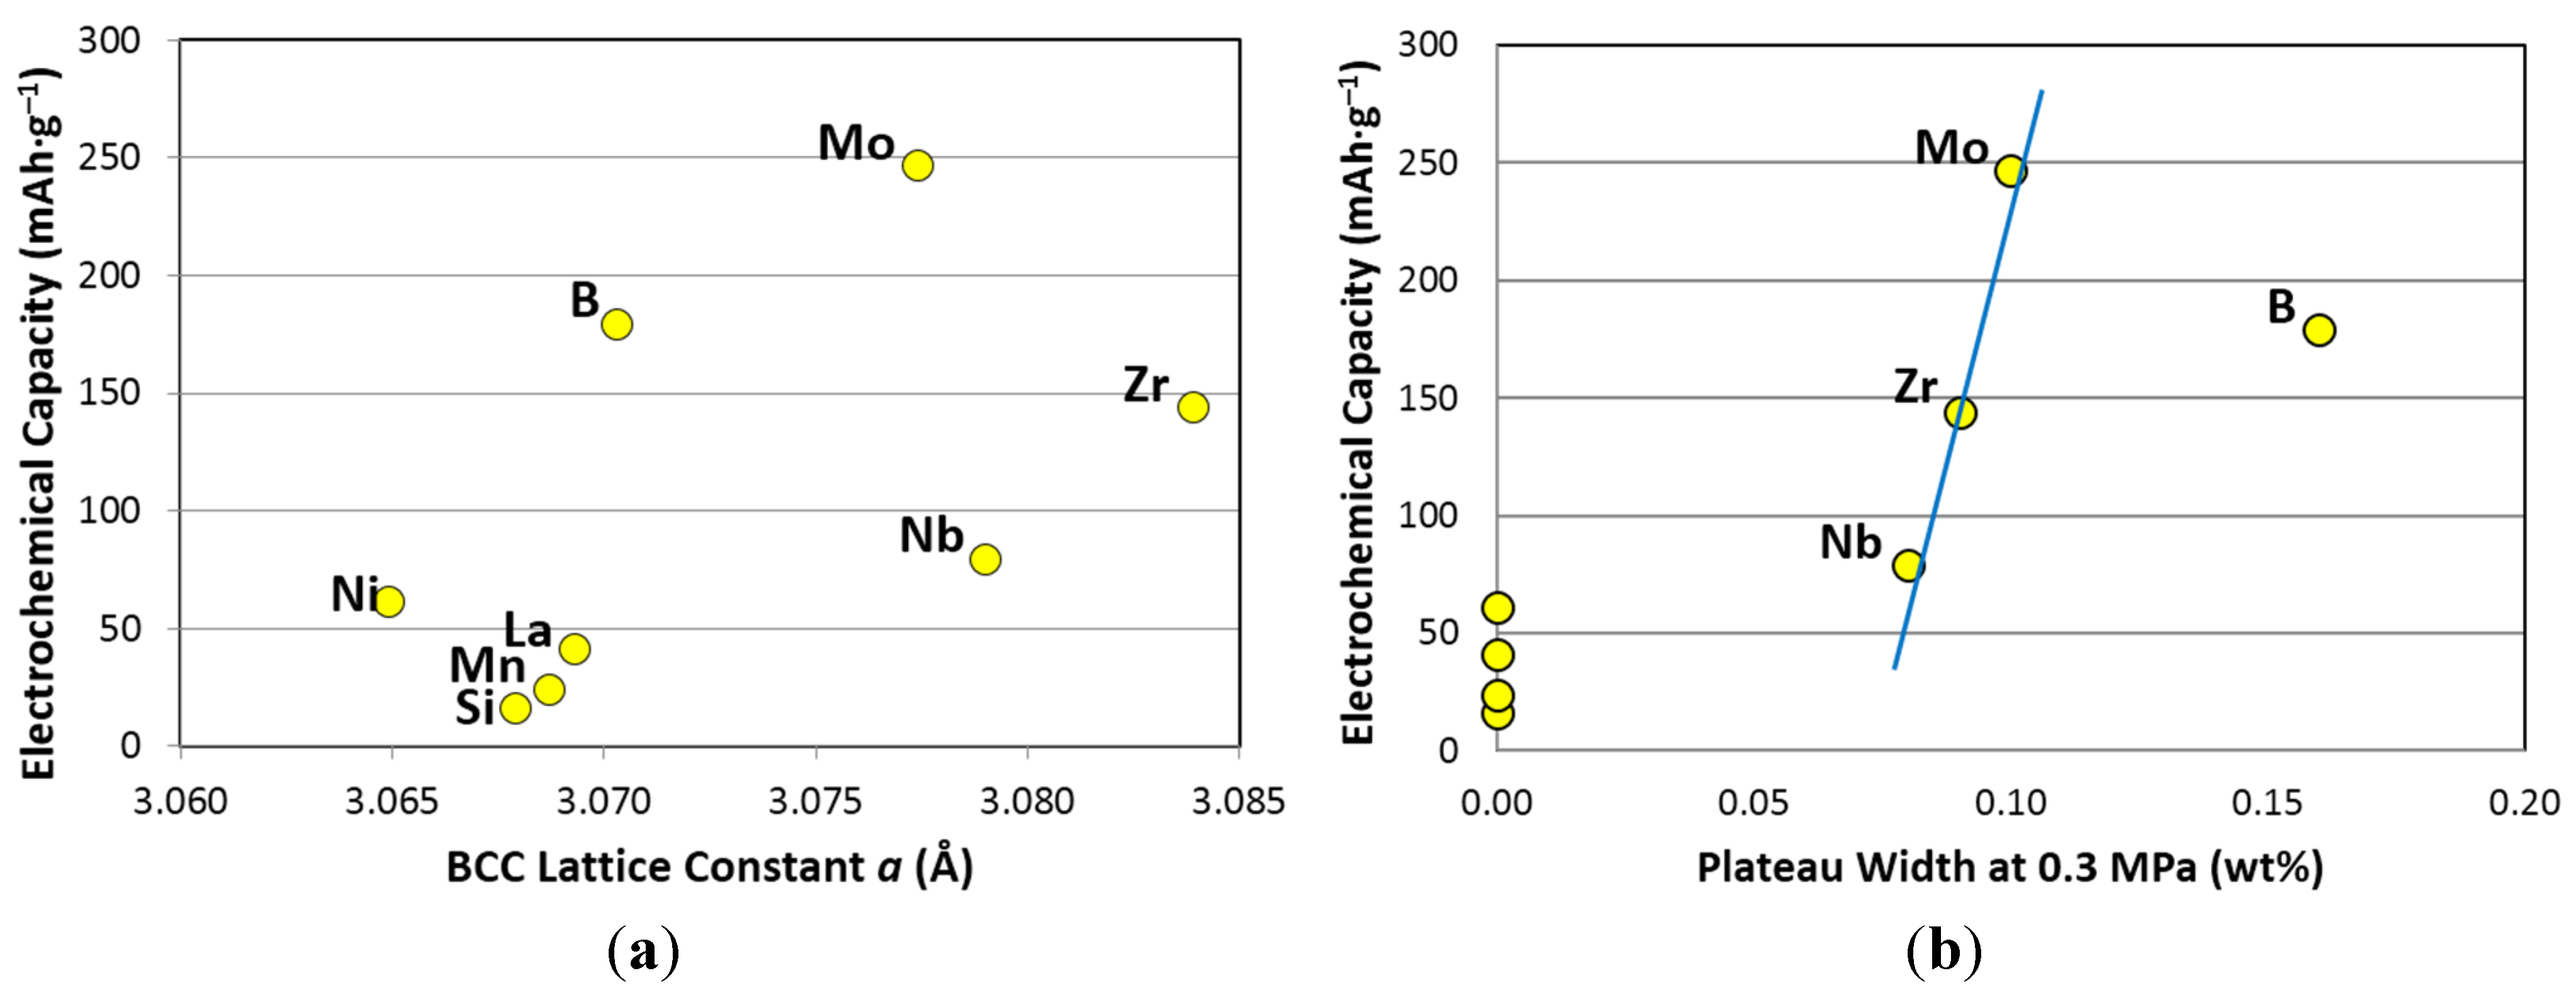
3.5. Discussion
| Correlation factor | Initial maximum capacity | 30 °C maximum capacity | 30 °C reversible capacity | 60 °C maximum capacity | 60 °C reversible capacity | 90 °C desorption pressure @2 wt% | 90 °C hysteresis @2 wt% | ΔH | BCC lattice constant a | Plateau width |
|---|---|---|---|---|---|---|---|---|---|---|
| R2 = | 0.02 | 0.03 | 0.17 | 0.04 | 0.06 | 0.01 | 0.19 | 0.02 | 0.29 | 0.70 |
4. Conclusions
Acknowledgments
Conflicts of Interest
References
- Young, K.; Fetcenko, M.A.; Ouchi, T.; Im, J.; Ovshinsky, S.R.; Li, F.; Reinhout, M. Hydrogen Storage Materials Having Excellent Kinetics, Capacity, and Cycle Stability. U.S. Patent 7,344,676, 18 March 2008. [Google Scholar]
- Lee, H.; Chourashiya, M.G.; Park, C.; Park, C. Hydrogen storage and electrochemical properties of the Ti0.32Cr0.43–x–yV0.25FexMny (x = 0–0.055, y = 0–0.080) alloys and their composites with MmNi3.99Al0.29Mn0.3Co0.6 alloy. J. Alloys Compd. 2013, 566, 37–42. [Google Scholar] [CrossRef]
- Inoue, H.; Arai, S.; Iwakura, C. Crystallographic and electrochemical characterization of TiV4–xNix alloys for nickel-metal hydride batteries. Electrochim. Acta 1996, 41, 937–939. [Google Scholar] [CrossRef]
- Mori, T.; Iba, H. Hydrogen-absorbing Alloy and Hydrogen-absorbing Alloy Electrode. U.S. Patent 6,338,764, 15 January 2002. [Google Scholar]
- Yu, X.B.; Wu, Z.; Xia, B.J.; Xu, N.X. A Ti-V-based bcc phase alloy for use as metal hydride electrode with high discharge capacity. J. Chem. Phys. 2004, 121, 987–990. [Google Scholar] [CrossRef] [PubMed]
- Chen, N.; Li, R.; Zhu, Y.; Liu, Y.; Pan, H. Electrochemical hydrogenation and dehydrogenation mechanisms of the Ti-V base multiphase hydrogen storage electrode alloy. Acta Metal. Sin. 2004, 40, 1200–1204. [Google Scholar]
- Iba, H.; Akiba, E. The relation between microstructure and hydrogen absorbing property in Laves phase-solid solution multiphase alloys. J. Alloys Compd. 1995, 231, 508–512. [Google Scholar] [CrossRef]
- Rönnebro, E.; Noréus, D.; Sakai, T.; Tsukahara, M. Structural studies of a new Laves phase alloy (Hf,Ti)(Ni,V)2 and its very stable hydride. J. Alloys Compd. 1995, 231, 90–94. [Google Scholar] [CrossRef]
- Tsukahara, M.; Takahashi, K.; Mishima, T.; Isomura, A.; Sakai, T. V-based solid solution alloys with Laves phase network: Hydrogen absorption properties and microstructure. J. Alloys Compd. 1996, 236, 151–155. [Google Scholar] [CrossRef]
- Qiu, S.; Chu, H.; Zhang, Y.; Sun, D.; Song, X.; Sun, L.; Xu, F. Electrochemical kinetics and its temperature dependence behaviors of Ti0.17Zr0.08V0.35Cr0.10Ni0.30 alloy electrode. J. Alloys Compd. 2009, 471, 453–456. [Google Scholar] [CrossRef]
- Young, K.; Nei, J.; Wong, D.F.; Wang, L. Structural, hydrogen storage, and electrochemical properties of Laves phase-related body-centered-cubic solid solution metal hydride alloys. Int. J. Hydrog. Energy 2014, 39, 21489–21499. [Google Scholar] [CrossRef]
- Young, K.; Wong, D.F.; Wang, L. Effect of Ti/Cr content on the microstructures and hydrogen storage properties of Laves phase-related body-centered-cubic solid solution alloys. J. Alloys Compd. 2015, 622, 885–893. [Google Scholar] [CrossRef]
- Young, K.; Ouchi, T.; Nei, J.; Meng, T. Effects of Cr, Zr, V, Mn, Fe, and Co to the hydride properties of Laves phase-related body-centered-cubic solid solution alloys. J. Power Sources 2015, 281, 164–172. [Google Scholar] [CrossRef]
- Yan, Y.; Chen, Y.; Liang, H.; Zhou, X.; Wu, C.; Tao, M.; Pang, L. Hydrogen storage properties of V–Ti–Cr–Fe alloys. J. Alloys Compd. 2008, 454, 427–431. [Google Scholar] [CrossRef]
- Huot, J.; Akiba, E.; Ogura, T.; Ishido, Y. Crystal structure, phase abundance and electrode performance of Laves phase compounds (Zr, A) V0.5Ni1.1Mn0.2Fe0.2 (A = Ti, Nb or Hf). J. Alloys Compd. 1995, 218, 101–109. [Google Scholar] [CrossRef]
- Iba, H.; Akiba, E. Hydrogen absorption and modulated structure in Ti–V–Mn alloys. J. Alloys Compd. 1997, 253–254, 21–24. [Google Scholar] [CrossRef]
- Young, K.; Fetcenko, M.A.; Li, F.; Ouchi, T. Structural, thermodynamic, and electrochemical properties of TixZr1–x(VNiCrMnCoAl)2 C14 Laves phase alloys. J. Alloys Compd. 2008, 464, 238–247. [Google Scholar] [CrossRef]
- Young, K.; Fetcenko, M.A.; Koch, J.; Morii, K.; Shimizu, T. Studies of Sn, Co, Al, and Fe additives in C14/C15 Laves alloys for NiMH battery application by orthogonal arrays. J. Alloys Compd. 2009, 486, 559–569. [Google Scholar] [CrossRef]
- Yoshida, M.; Akiba, E. Hydrogen absorbing-desorbing properties and crystal structure of the Zr–Ti–Ni–Mn–V AB2 Laves phase alloys. J. Alloys Compd. 1995, 224, 121–126. [Google Scholar] [CrossRef]
- Gakkai, N.K. Hi Kagaku Ryouronteki Kinzoku Kagobutu; Maruzen: Tokyo, Japan, 1975; p. 296. (In Japanese) [Google Scholar]
- Huot, H.; Akiba, E.; Ishido, Y. Crystal structure of multiphase alloys (Zr,Ti)(Mn,V)2. J. Alloys Compd. 1995, 231, 85–89. [Google Scholar] [CrossRef]
- Kuriiwa, T.; Tamura, T.; Amemiya, T.; Fuda, T.; Kamegawa, A.; Takamura, H.; Okada, M. New V-based alloys with high protium absorption and desorption capacity. J. Alloys Compd. 1999, 293–295, 433–436. [Google Scholar] [CrossRef]
- Young, K.; Ouchi, T.; Fetcenko, M.A. Roles of Ni, Cr, Mn, Sn, Co, and Al in C14 Laves phase alloys for NiMH battery application. J. Alloys Compd. 2009, 476, 774–781. [Google Scholar] [CrossRef]
- Bendersky, L.A.; Wang, K.; Levin, I.; Newbury, D.; Young, K.; Chao, B.; Creuziger, A. Ti12.5Zr21V10Cr8.5MnxCo1.5Ni46.5–x AB2-type metal hydride alloys for electrochemical storage application: Part 1. Structural characteristics. J. Power Sources 2012, 218, 474–486. [Google Scholar] [CrossRef]
- Young, K.; Ouchi, T.; Huang, B.; Reichman, B.; Blankenship, R. Improvement in −40 °C electrochemical properties of AB2 metal hydride alloy by silicon incorporation. J. Alloys Compd. 2013, 575, 65–72. [Google Scholar] [CrossRef]
- Young, K.; Reichman, B.; Fetcenko, M.A. Electrochemical performance of AB2 metal hydride alloys measured at −40 °C. J. Alloys Compd. 2013, 580, S349–S352. [Google Scholar] [CrossRef]
- Smith, J.F.; Lee, K.J. La-V (Lanthanum-Vanadium). In Binary Alloy Phase Diagram, 2nd ed.; Massalski, T.B., Okamoto, H., Subramanian, P.R., Kacprzak, L., Eds.; ASM International: Geauga County, OH, USA, 1990; Volume 3, pp. 2437–2439. [Google Scholar]
- Nei, J.; Young, K.; Salley, S.O.; Ng, K.Y.S. Determination of C14/C15 phase abundance in Laves phase alloys. Mater. Chem. Phys. 2012, 136, 520–527. [Google Scholar] [CrossRef]
- Nei, J.; Young, K.; Regmi, R.; Lawes, G.; Salley, S.O.; Ng, K.Y.S. Gaseous phase hydrogen storage and electrochemical properties of Zr8Ni21, Zr7Ni10, Zr9Ni11, and ZrNi metal hydride alloys. Int. J. Hydrog. Energy 2012, 37, 16042–16055. [Google Scholar] [CrossRef]
- Züttle, A. Materials for hydrogen storage. Mater. Today 2003, 6, 24–33. [Google Scholar] [CrossRef]
- Huang, T.; Li, J.; Yu, J.; Liu, Z.; Mao, S.; Zhang, Y.; Sun, G.; Han, J.; Ren, H.; Chen, J. Influence of partial substitution of Mo for Cr on structure and hydrogen storage characteristics of non-stoichiometric Laves phase TiCrB0.9 alloy. Int. J. Hydrog. Energy 2013, 38, 11955–11963. [Google Scholar] [CrossRef]
- Young, K.; Nei, J.; Ouchi, T.; Fetcenko, M.A. Phase abundances in AB2 metal hydride alloys and their correlations to various properties. J. Alloys Compd. 2011, 509, 2277–2284. [Google Scholar] [CrossRef]
- Johnston, R.L.; Hoffmann, R. Structure-bonding relationships in the Laves phases. Z. Anorg. Allg. Chem. 1992, 616, 105–120. [Google Scholar] [CrossRef]
- Boettinger, W.J.; Newbury, D.E.; Wang, K.; Bendersky, L.A.; Chiu, C.; Kattner, U.R.; Young, K.; Chao, B. Examination of multiphase (Zr,Ti)(V,Cr,Mn,Ni)2 Ni-MH electrode alloys: Part I. Dendritic solidification structure. Metall. Mater. Trans. A 2010, 41, 2033–2047. [Google Scholar] [CrossRef]
- Bendersky, L.A.; Wang, K.; Boettinger, W.J.; Newbury, D.E.; Young, K.; Chao, B. Examination of multiphase (Zr,Ti)(V,Cr,Mn,Ni)2 Ni-MH electrode alloys: Part II. Solid-state transformation of the interdendritic B2 phase. Metall. Mater. Trans. A 2010, 41, 1891–1906. [Google Scholar] [CrossRef]
- Wong, D.F.; Young, K.; Nei, J.; Wang, L.; Ng, K.Y.S. Effects of Nd-addition on the structural, hydrogen storage, and electrochemical properties of C14 metal hydride alloys. J. Alloys Compd. 2015, 647, 507–518. [Google Scholar] [CrossRef]
- Lide, D.R. CRC Handbook of Chemistry and Physics, 74th ed.; CRC Press: Boca Raton, FL, USA, 1993; pp. 6–22. [Google Scholar]
- Young, K.; Ouchi, T.; Fetcenko, M.A. Pressure-composition-temperature hysteresis in C14 Laves phase alloys: Part 1. Simple ternary alloys. J. Alloys Compd. 2009, 480, 428–433. [Google Scholar] [CrossRef]
- Kamegawa, A.; Shirasaki, K.; Tamura, T.; Kuriiwa, T.; Takamura, H.; Okada, M. Crystal structure and protium absorption properties of Ti-Cr-X alloys. Mater. Trans. 2002, 43, 470–473. [Google Scholar] [CrossRef]
- Kaiya, H.; Ookawa, T. Improvement in cycle life performance of high capacity nickel-metal hydride battery. J. Alloys Compd. 1995, 231, 598–603. [Google Scholar] [CrossRef]
- Kong, L.; Chen, B.; Young, K.; Koch, J.; Chan, A.; Li, W. Effects of Al- and Mn-contents in the negative MH alloy on the self-discharge and long-term storage properties of Ni/MH battery. J. Power Sources 2012, 213, 128–139. [Google Scholar] [CrossRef]
- Kim, S.; Chourashiya, M.G.; Park, C.; Park, C. Electrochemical performance of NAFION coated electrodes of hydriding combustion synthesized MgNi based composite hydride. Mater. Lett. 2013, 93, 81–84. [Google Scholar] [CrossRef]
© 2015 by the authors; licensee MDPI, Basel, Switzerland. This article is an open access article distributed under the terms and conditions of the Creative Commons Attribution license (http://creativecommons.org/licenses/by/4.0/).
Share and Cite
Young, K.-H.; Ouchi, T.; Huang, B.; Nei, J. Structure, Hydrogen Storage, and Electrochemical Properties of Body-Centered-Cubic Ti40V30Cr15Mn13X2 Alloys (X = B, Si, Mn, Ni, Zr, Nb, Mo, and La). Batteries 2015, 1, 74-90. https://doi.org/10.3390/batteries1010074
Young K-H, Ouchi T, Huang B, Nei J. Structure, Hydrogen Storage, and Electrochemical Properties of Body-Centered-Cubic Ti40V30Cr15Mn13X2 Alloys (X = B, Si, Mn, Ni, Zr, Nb, Mo, and La). Batteries. 2015; 1(1):74-90. https://doi.org/10.3390/batteries1010074
Chicago/Turabian StyleYoung, Kwo-Hsiung, Taihei Ouchi, Baoquan Huang, and Jean Nei. 2015. "Structure, Hydrogen Storage, and Electrochemical Properties of Body-Centered-Cubic Ti40V30Cr15Mn13X2 Alloys (X = B, Si, Mn, Ni, Zr, Nb, Mo, and La)" Batteries 1, no. 1: 74-90. https://doi.org/10.3390/batteries1010074