Article

Microstructure, Martensitic Transformation, and Inverse Magnetocaloric Effect in Ni48Mn39.5Sn12.5−xAlx Metamagnetic Shape Memory Alloys

1
The Aleksander Krupkowski Institute of Metallurgy and Materials Science, Polish Academy of Sciences, 25 Reymonta St., 30-059 Kraków, Poland
2
Faculty of Materials Science and Engineering, Warsaw University of Technology, 141 Wołoska St., 02-507 Warsaw, Poland
3
Department of Solid State Physics, Faculty of Physics and Applied Computer Science, AGH University of Science and Technology, Al. Mickiewicza 30, 30-059 Krakow, Poland
*
Author to whom correspondence should be addressed.
Magnetochemistry 2018, 4(2), 19; https://doi.org/10.3390/magnetochemistry4020019
Submission received: 12 March 2018 / Revised: 12 March 2018 / Accepted: 13 March 2018 / Published: 23 March 2018

Abstract

:
The effect of Al substitution on microstructure, martensitic transformation and magnetocaloric properties in Ni48Mn39.5Sn12.5−xAlx (x = 0, 1, 2, 3) alloys is reported. At room temperature, depending on Al concentration, the alloys have typical Heusler L21 austenite structure and/or orthorhombic martensite structure with Pmma space group. A secondary Ni-Mn-Al phase also appears already for low Al concentrations (x ≥ 1). On cooling, irrespective of Al substitution, all the samples show ferromagnetic type ordering below 303 K in the austenite phase. The martensitic transition temperature varies with Al content. All the alloys undergo magnetic field-induced reverse martensitic transformation giving rise to an inverse magnetocaloric effect. The largest magnetic entropy change (8.5 J·kg−1·K−1) is observed near 280 K for the Ni48Mn39.5Sn12.5 alloy.

Graphical Abstract

1. Introduction

Heusler Ni-Mn-based magnetic shape memory alloys undergoing a first order reversible martensitic transformation (MT) have aroused considerable attention owing to their various functional properties [1,2] including a magnetocaloric effect (MCE) [3]. MCE results from the unique interplay between structure and magnetism and it holds promise for environmentally friendly magnetic refrigeration [4]. Various Ni-Mn-based materials have been studied in this respect to date [5,6]. Some special focus has been given to the metamagnetic shape memory alloys (MSMA); i.e., Ni-Mn-X (X = Sn, In, Sb) [7] capable of the reverse martensitic transformation (RMT) under magnetic field, which is geared by the difference in the Zeeman energy (µ0ΔM·H) between martensite and austenite [8,9,10]. An abrupt magnetization change accompanying the structural transition provides physical basis for the phenomenon of the inverse magnetocaloric effect (IMCE), occurring in these materials along the conventional MCE, which takes place around the second order paramagnetic (PM)-ferromagnetic (FM) transition [11]. Among the different Ni-Mn-X alloys several literature reports have been concerned with the Ni-Mn-Sn system [12,13,14,15,16,17,18]. Recently it has been experimentally shown that substitution of Al for Sn in off-stoichiometric Ni-Mn-Sn alloys leads to an increase in MT temperature [19,20], and this has been further corroborated using the density-functional theory [21]. The combined effect of Al for Sn substitution and subsequent heat treatment on magnetocaloric properties in Ni-Mn-Sn alloys has been also investigated [22,23]. Nonetheless relatively less attention has so far been directed to the analysis of phase homogeneity of bulk Ni-Mn-Sn-Al alloys and its impact on functional properties, which is particularly relevant given metastability and phase decomposition of heat treated Ni-Mn-Sn alloys [24,25]. In previous letters the current authors discussed the influence of Sn replacement with Al on structure and magnetocaloric properties in Ni48Mn39.5Sn12.5 alloys produced by melt spinning technique [26,27,28], which offers significant advantages over conventional metallurgy originating in microstructure refinement, enhanced chemical homogeneity, and extended solid solubility. This becomes ever more important when considering newly developed multicomponent Ni-Mn-based systems [29]. Therefore, the present work discusses phase homogeneity, employing detailed scanning and transmission electron microscopy analysis, structure and magnetocaloric properties of Ni48Mn39.5Sn12.5−xAlx bulk alloys. The functional properties of bulk and ribbon alloys are then cross examined clearly showing that melt spinning is the preferable method when producing chemically homogenous multielement Ni-Mn-Sn-based alloys.

2. Experimental

Polycrystalline ingots of Ni48Mn39.5Sn12.5−xAlx (x = 0, 1, 2, 3) alloys were prepared by induction melting the appropriate amounts of metals (purity > 99.9%) in argon atmosphere. For homogenization the ingots of 15 mm in diameter were annealed in vacuum for 5.5 h at 1270 K. The ingots were then cut into flakes of 3 mm thickness, sealed in quartz ampules under vacuum and further annealed for 1 h at 1170 K followed by water quenching (WQ). The samples depending on Al concentration are hereafter referred to as 0Al, 1Al, 2Al and 3Al. Thermal effects were investigated by differential scanning calorimetry (DSC) using a Mettler DSC 823 instrument in the temperature range 173–423 K and with heating-cooling rates of 10 K/min. The X-ray diffraction experiment was performed in the temperature range of 250–360 K (Oxford Cryostream Plus cooler) using the Rigaku-Denki D/MAX RAPID II-R diffractometer (Rigaku Corporation, Tokyo, Japan) with a rotating anode Ag Kα tube (λ = 0.5608 Å), an incident beam (002) graphite monochromator and an image plate in the Debye-Scherrer geometry as a detector. The pixel size was 100 µm × 100 µm. The sample was placed inside the glass capillaries (0.3 mm in diameter). The measurements were performed for the sample filled and empty capillaries and the intensity for the empty capillary was then subtracted. The beam width at the sample was 0.3 mm. The two-dimensional diffraction pattern was then converted into the one-dimensional intensity data using suitable software. Microstructure and chemical composition of the samples were examined with a Scanning Electron Microscopy (SEM) FEI Quanta 3D FEGSEM, FEI E-SEM XL30 equipped with an X-ray energy dispersion spectrometer EDAX GEMINI 4000, FEI Quanta 3D FEGSEM integrated with EDAX Trident system (X-ray energy dispersion spectrometer EDAX Genesis, wavelength dispersive X-ray spectrometer WDS Genesis LambdaSpec) and with Transmission Electron Microscopy (TEM) Tecnai G2 operating at 200 kV equipped with an Energy Dispersive X-ray (EDX) microanalyser and a High Angle Annular Dark Field Detector (HAADF). Thin foils for TEM examination were prepared by Focused Ion Beam (FIB) technique using FEI QUANTA 3D Dual Beam. The dc mass magnetic susceptibility (χ) and dc mass magnetization (M) were measured using Quantum Design MPMS-XL SQUID magnetometer in the temperature range 2–370 K. Magnetization isotherms were measured at fields up to 1600 kA/m (2 T), taken with 5 K and 2 K (in the vicinity of the magnetostructural transitions) steps. The magnetic entropy change, ΔSM, as a function of temperature was calculated from M(H) data by integration of the Maxwell equation [30,31]:
Δ S M ( T ,   H m ) =   S M ( T ,   H m ) S M ( T ,   0 ) =   0 H m μ 0 ( M T ) d H .

3. Results and Discussion
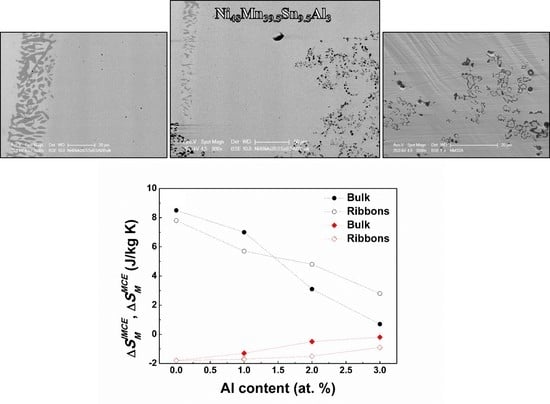
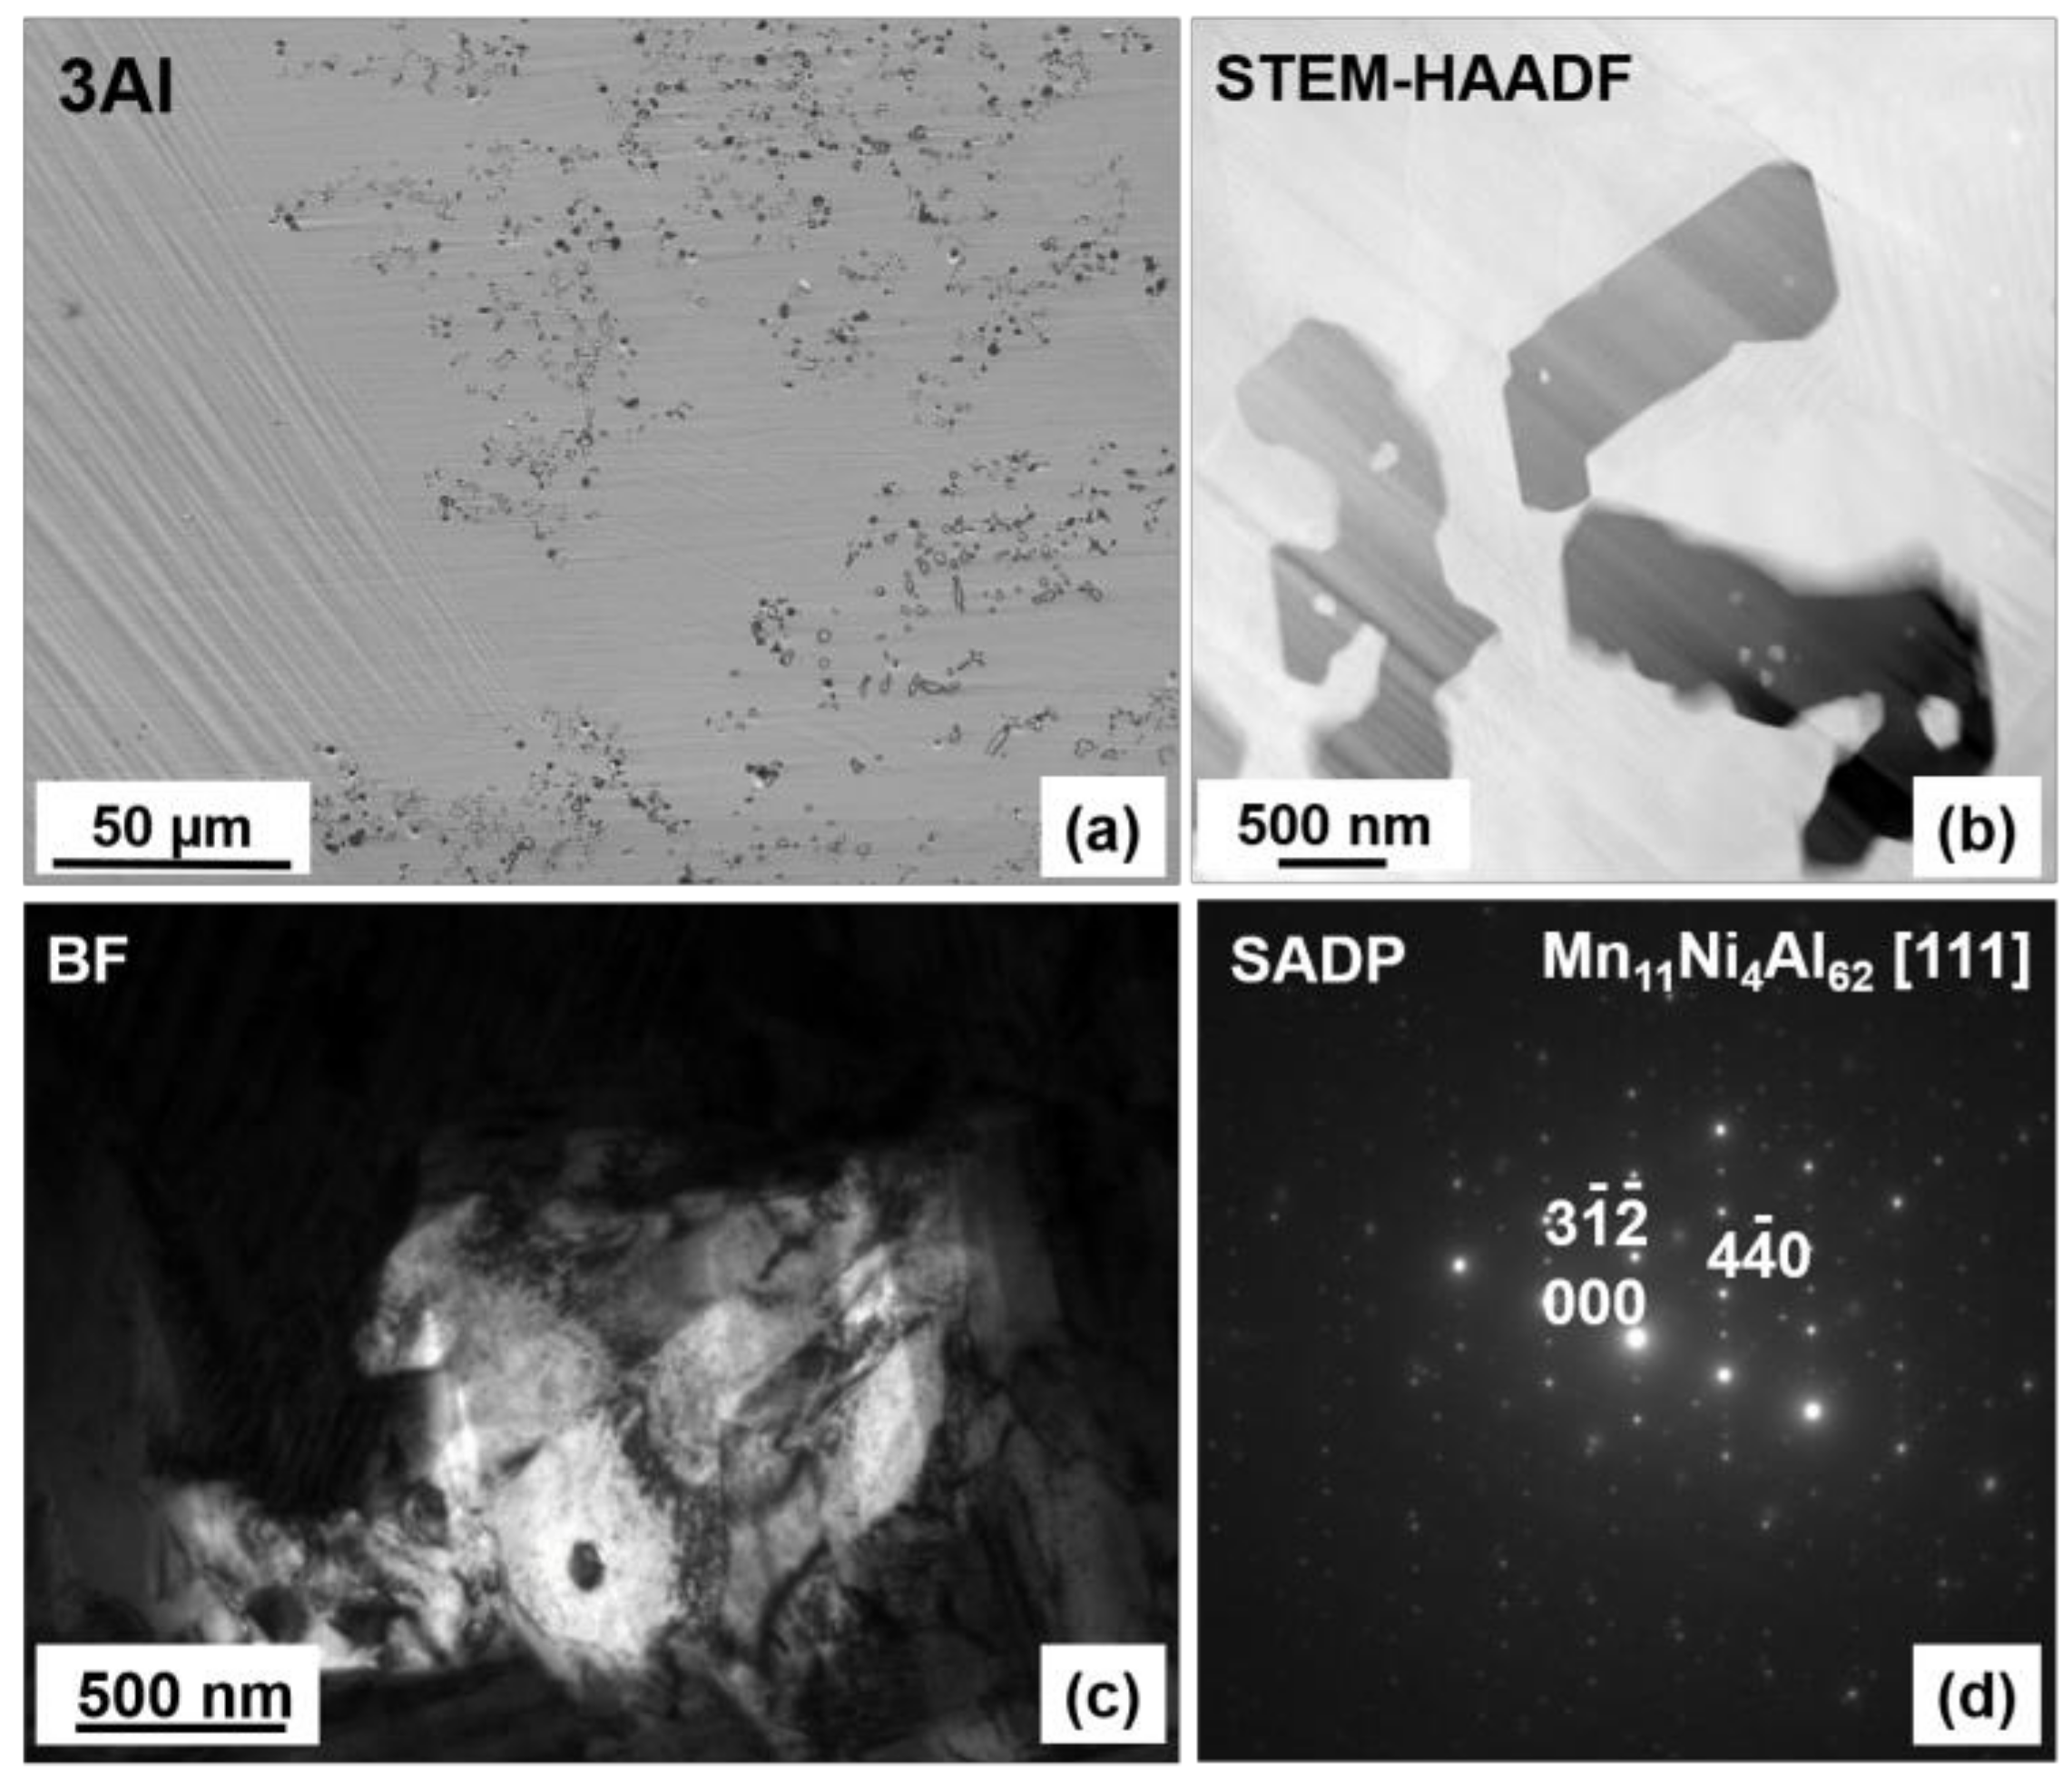
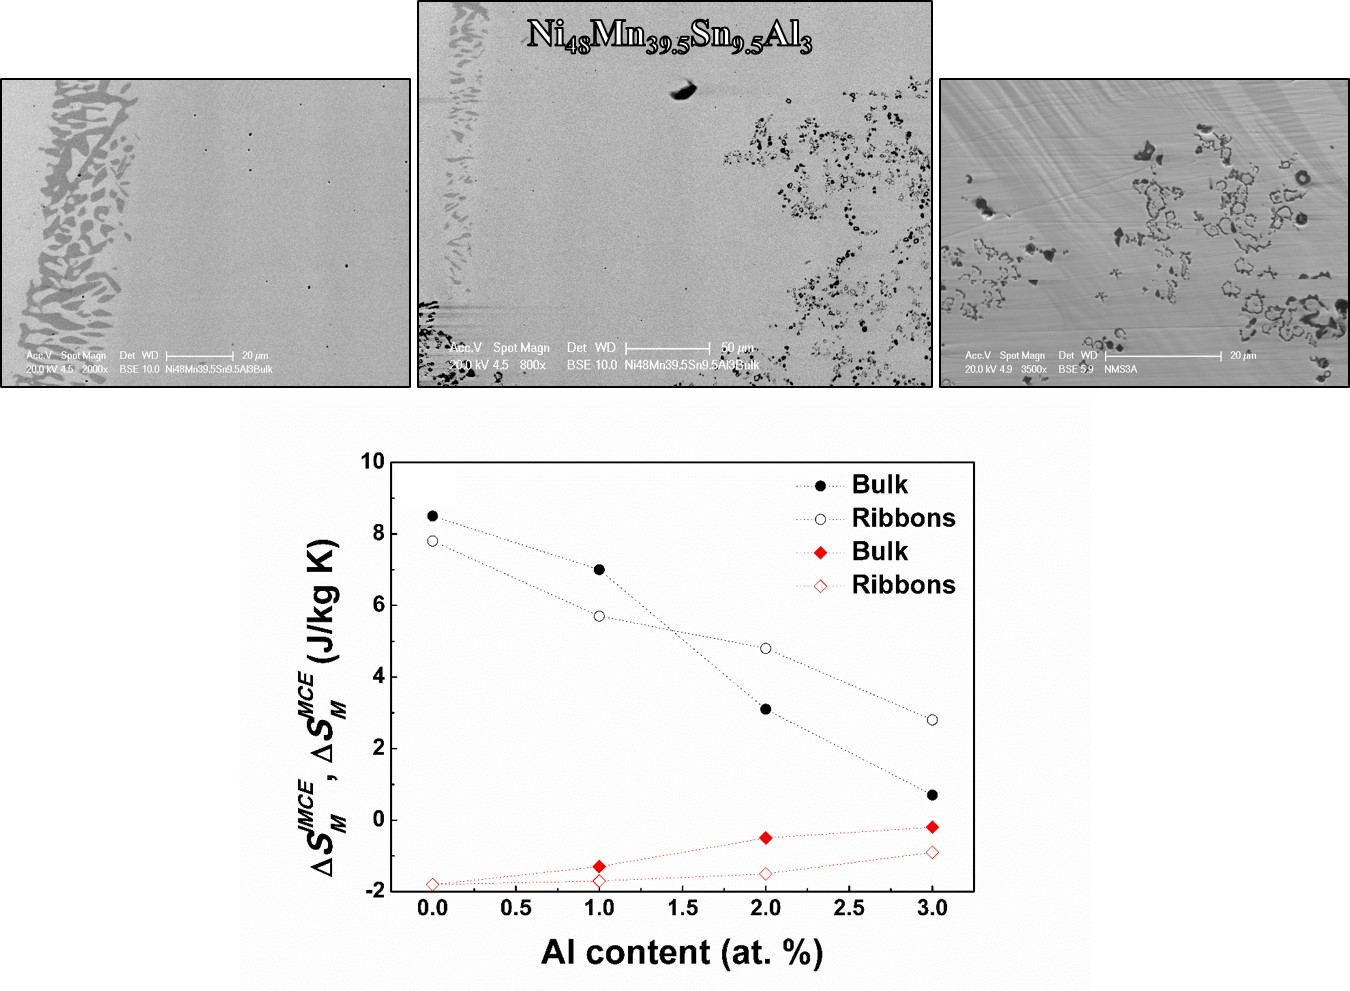
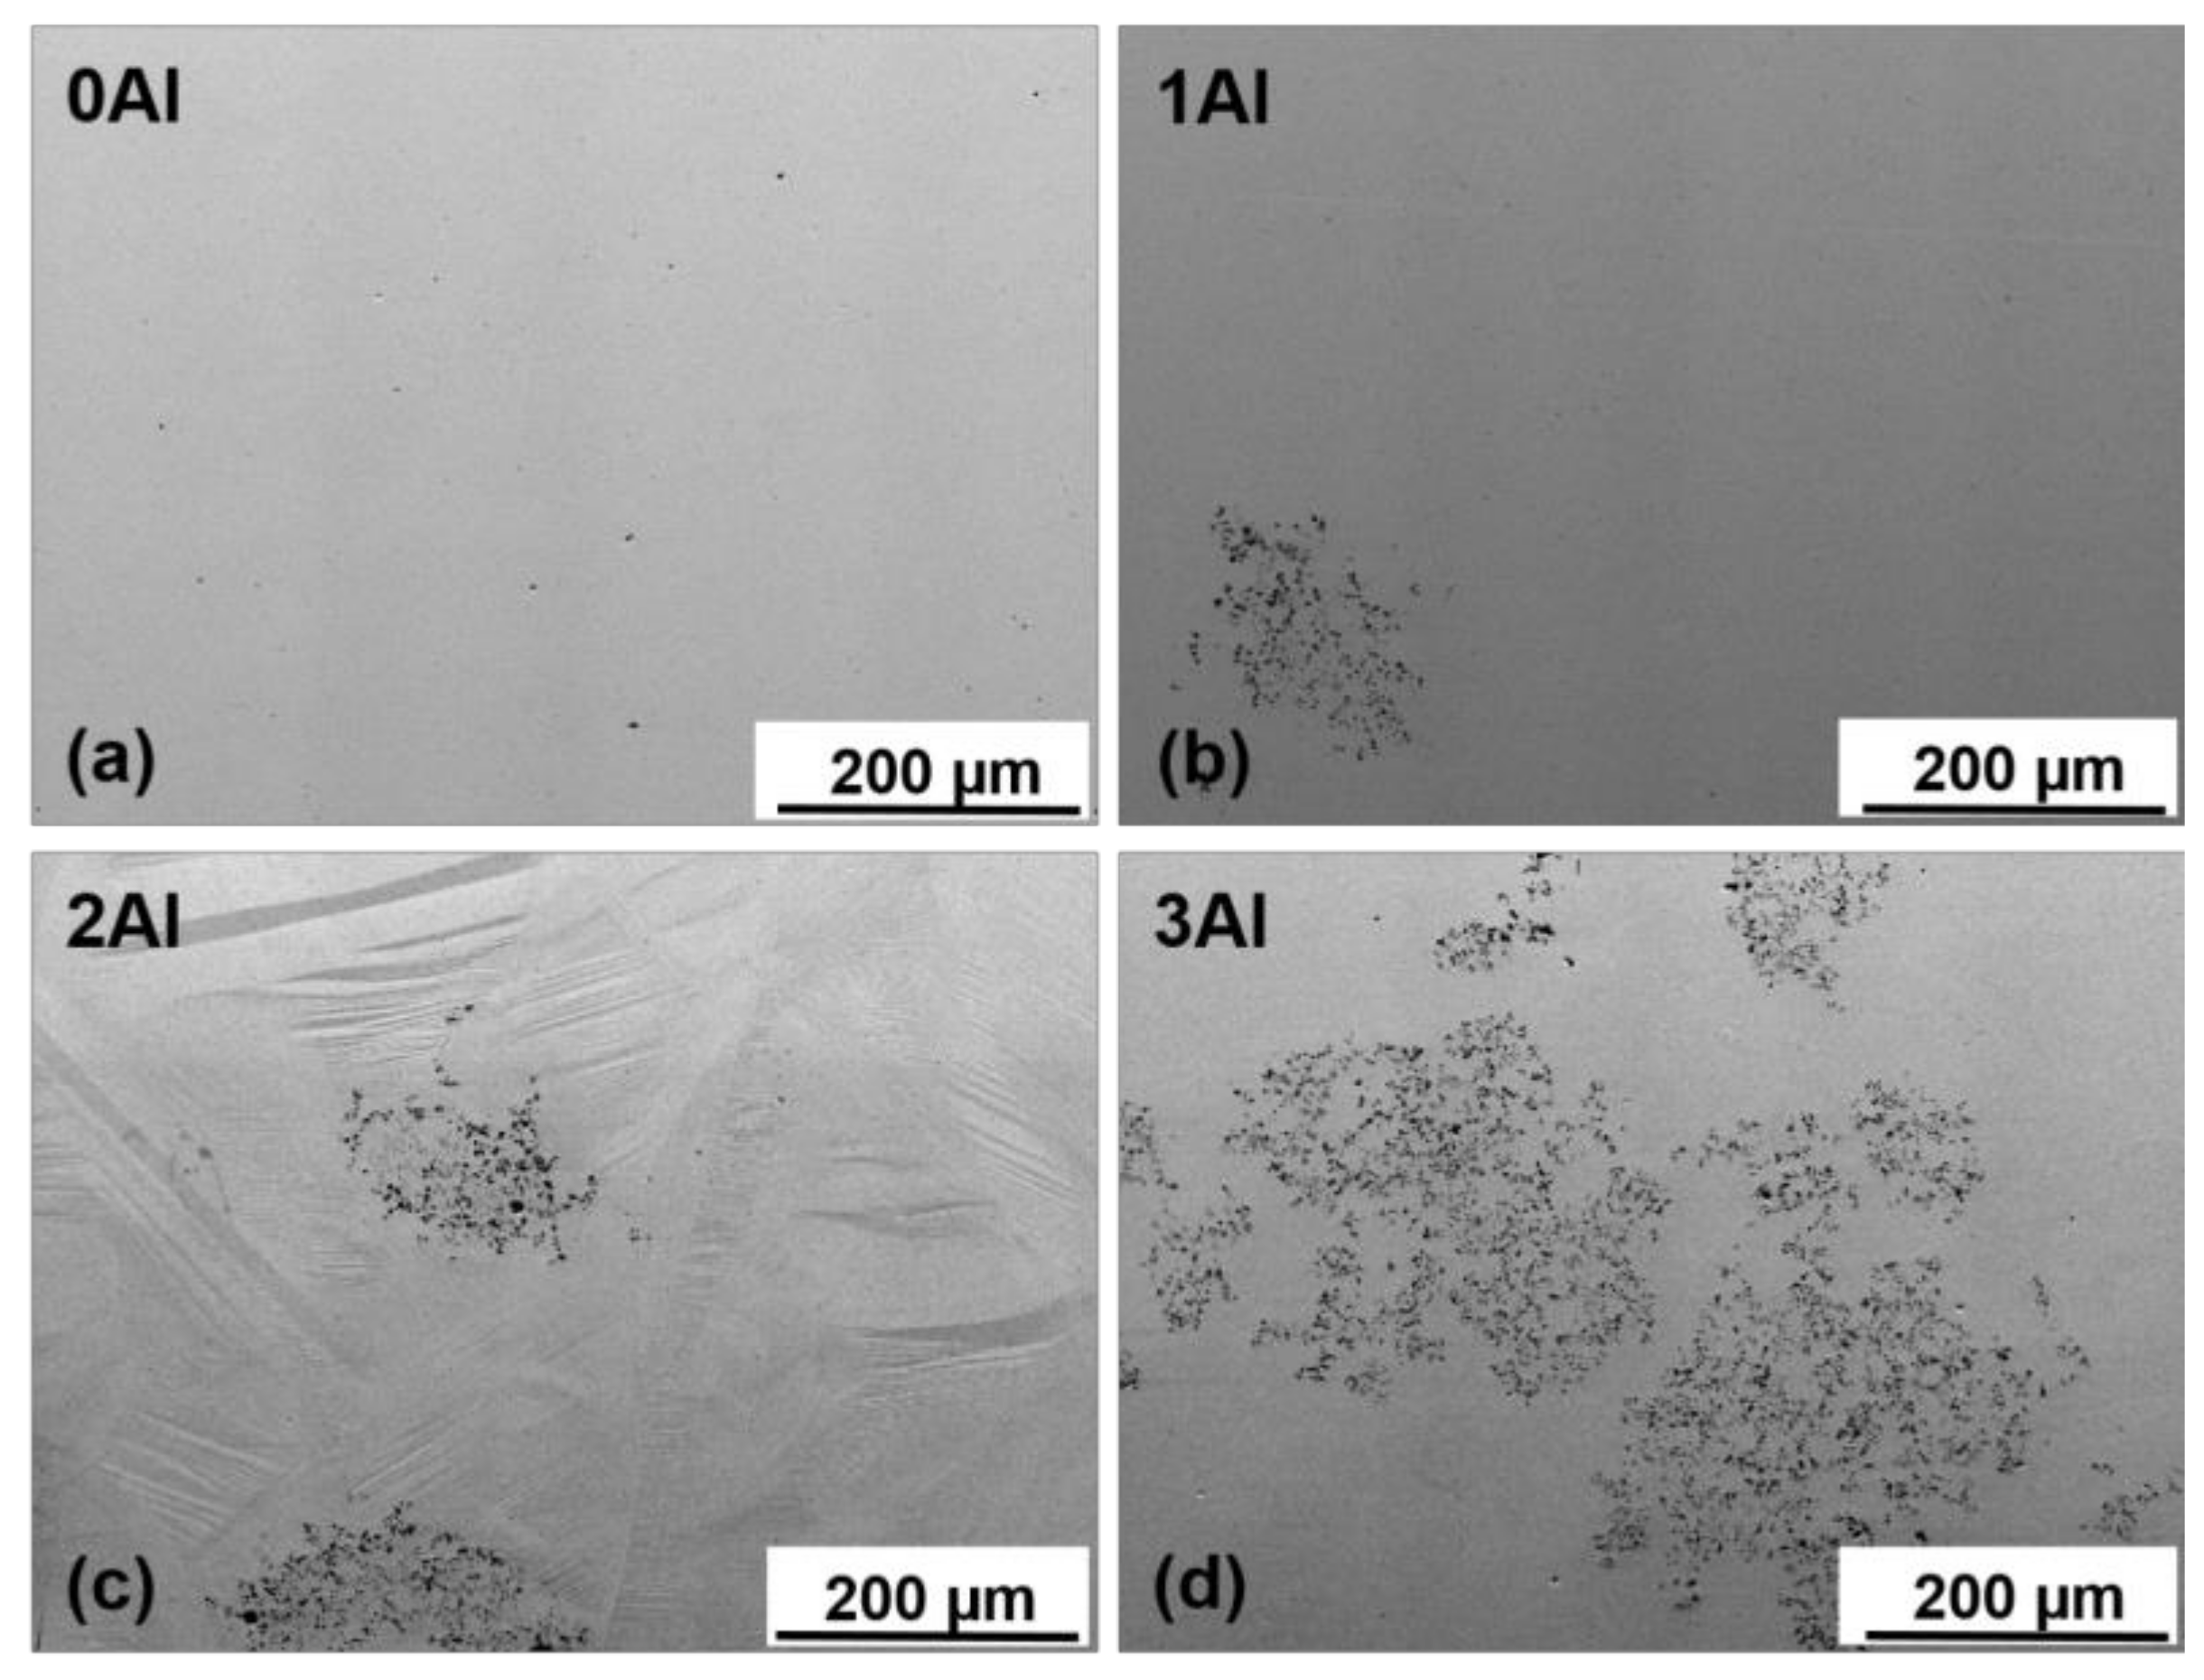
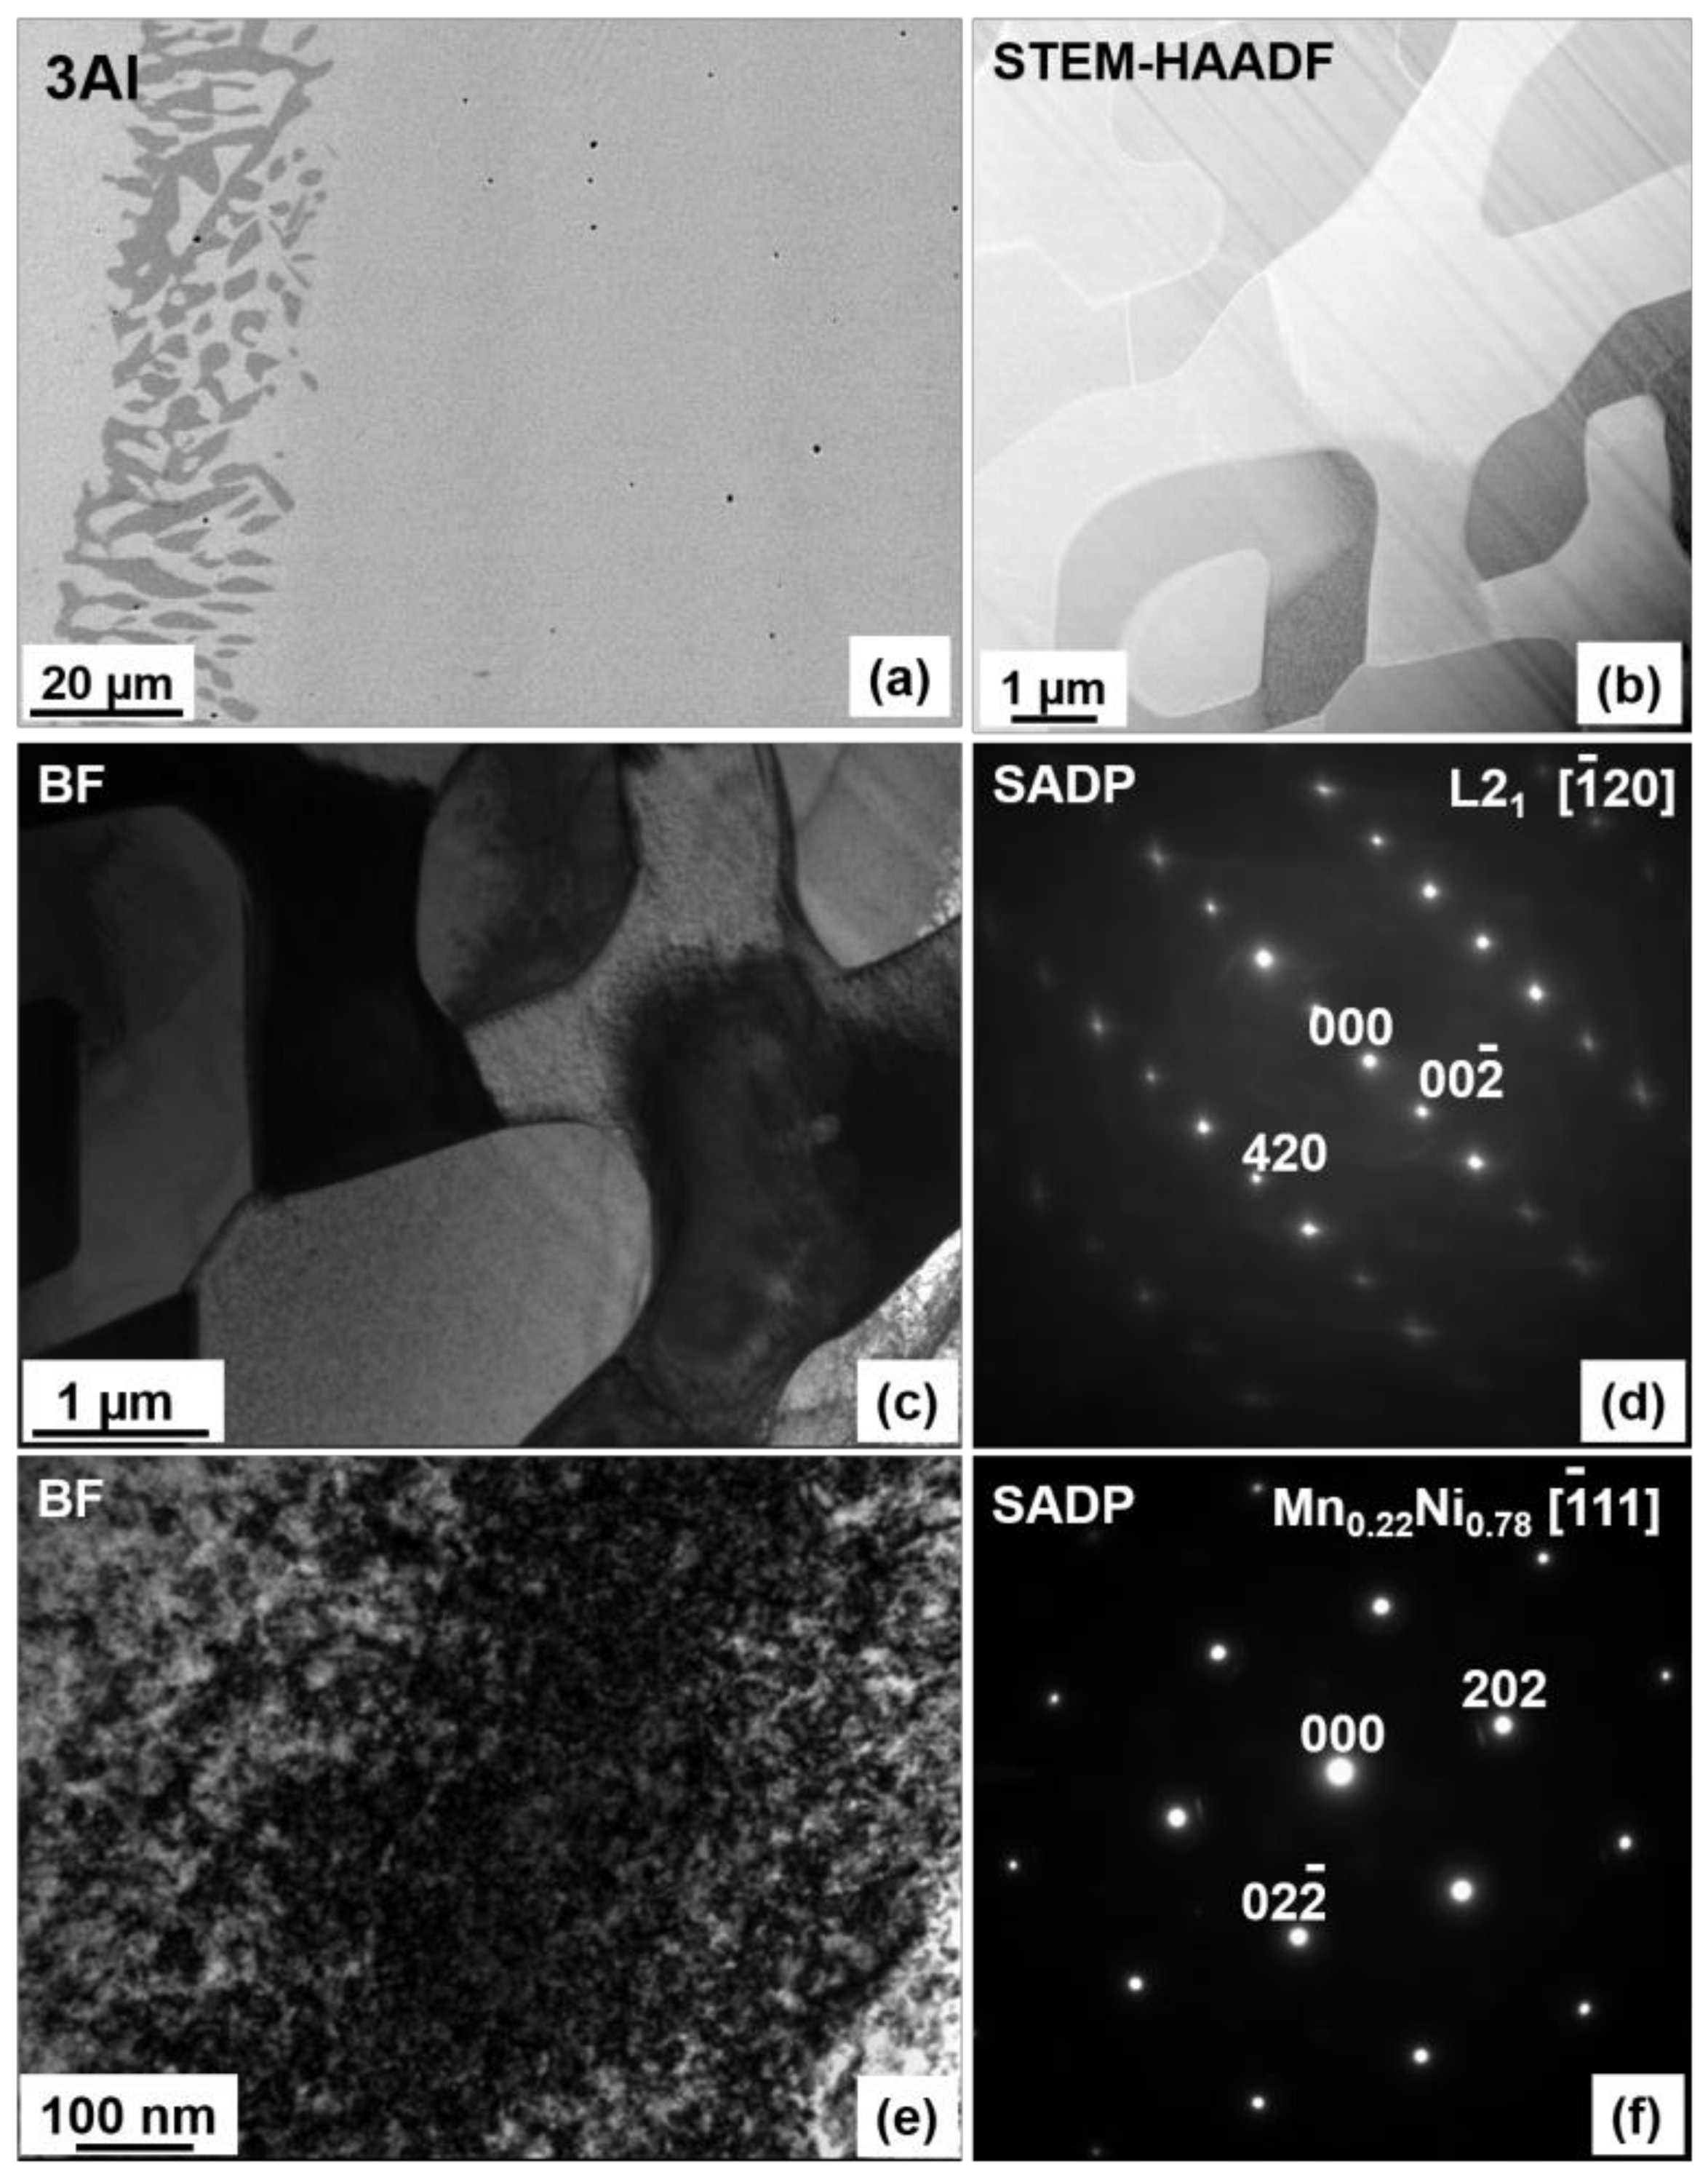
3.1. Microstructure

The microstructure and chemical homogeneity of the alloys were studied using SEM and TEM microscopy. The SEM backscattered electron (BSE) images of 0Al, 1Al, 2Al and 3Al alloys taken at room temperature (RT) are shown in Figure 1. It is easily noticed that the microstructure considerably varies with Al concentration. It appears that only the ternary Ni48Mn39.5Sn12.5 alloy displays the single-phase microstructure, whereas Al containing quaternary alloys also contain the secondary phase with dark contrast in Figure 1. The amount of the secondary phase increases progressively with Al concentration. The chemical composition of the matrix and the secondary phase determined according to SEM- (Energy Dispersive X-ray Spectroscopy) EDX, SEM- Wavelength Dispersive X-ray Spectroscopy (WDS) and TEM-EDX microanalysis as well as the calculated valence electron to atom (e/a) ratio, computed as the valence electron weighted sum of the 3d 4s electrons for Ni, Mn and 5s 5p for Sn etc., are given in Table 1. While examining this Table it is worth noting that the secondary phase, denoted as Al-phase, is enriched in Al as compared to the matrix. Considering the relative ease of Al oxidation SEM-WDS analysis was carried out to determine the oxygen content. It turns out (Table 1) that the oxygen concentration was <3 at %, which then allowed for excluding from phase match any Al-rich oxide phases. It was also confirmed that Al concentration in this phase greatly exceeded the amount of Ni and Mn. The apparent discrepancy between SEM-EDS and SEM-WDS analysis (Table 1) is related to the better accuracy and greater resolution limit of the latter. Detailed analysis of the Al-rich phase for the 3Al sample has been further performed using TEM. The results of chemical microanalysis (Table 1) from this phase are in accordance with the outcomes of SEM-WDS analysis. Figure 2a shows SEM-BSE micrograph taken from the 3Al sample. It is seen that the Al-phase coexists with martensite phase. Figure 2b shows Scanning Transmission Electron Microscopy (STEM-HAADF) image taken from the Al-phase, Figure 2c shows bright field (BF) image taken from this phase and Figure 2d presents the corresponding Selected Area Electron Diffraction Pattern (SADP). It was found according to both Figure 2b,c micrographs that Al-phase is surrounded by martensite plates and that its SADP pattern (Figure 2d) can be well indexed in the orthorhombic Mn11Ni4Al62-type structure (space group Amam) [32]. On the other hand, SEM-EDX results show that the average composition of the matrix, as shown in Table 1, is very close to the nominal composition. This may then suggest that the appearance of the secondary phase is local in nature and takes place in micro areas, most probably due to local concentration fluctuations. This reasoning may be further supported by the results of chemical analysis in micro-areas performed by TEM and collected in Table 1. It is worth noting that in the neighboring areas to the secondary phase the content level of Sn and Al is lowered, whereas the concentration of Mn remains stable and the concentration of Ni is slightly higher as compared to the matrix. Also, as shown in Figure 1 regardless of the Al composition all the alloys feature Mn-rich phase, as confirmed by SEM-EDX analysis, which is visible on SEM-BSE images as spots with dark contrast (Figure 1a). The amount of this phase estimated from the results of SEM-BSE analysis is below 1% and its appearance may be due to a segregation effect similar to the one reported by other authors in Ni-Mn-Sn alloys [17,33]. An additional Ni-enriched phase, has also been found in minute amounts in 1Al and 3Al samples preferentially at ingot’s edges (Figure 3a). The chemical composition of this phase denoted as Ni-phase together with the composition of the neighboring matrix is given in Table 1. Figure 3b presents STEM-HAADF image taken from this phase from the 3Al sample, where the phase is evidenced in darker areas as compared to the surrounding matrix. TEM BF image and the corresponding SADP of the matrix are shown in Figure 3c,d. The SADP can be well indexed in the cubic L21 structure with [ 1 ¯ 20] zone axis. Figure 3e,f show the TEM BF image and the corresponding SADP taken from the Ni-enriched phase, which can be indexed in the cubic Mn0.22Ni0.78 type structure (space group Fm 3 ¯ m) [34] with [ 1 ¯ 11] zone axis. The presence of this phase may be associated with prolonged annealing treatment and matrix decomposition [24,25].

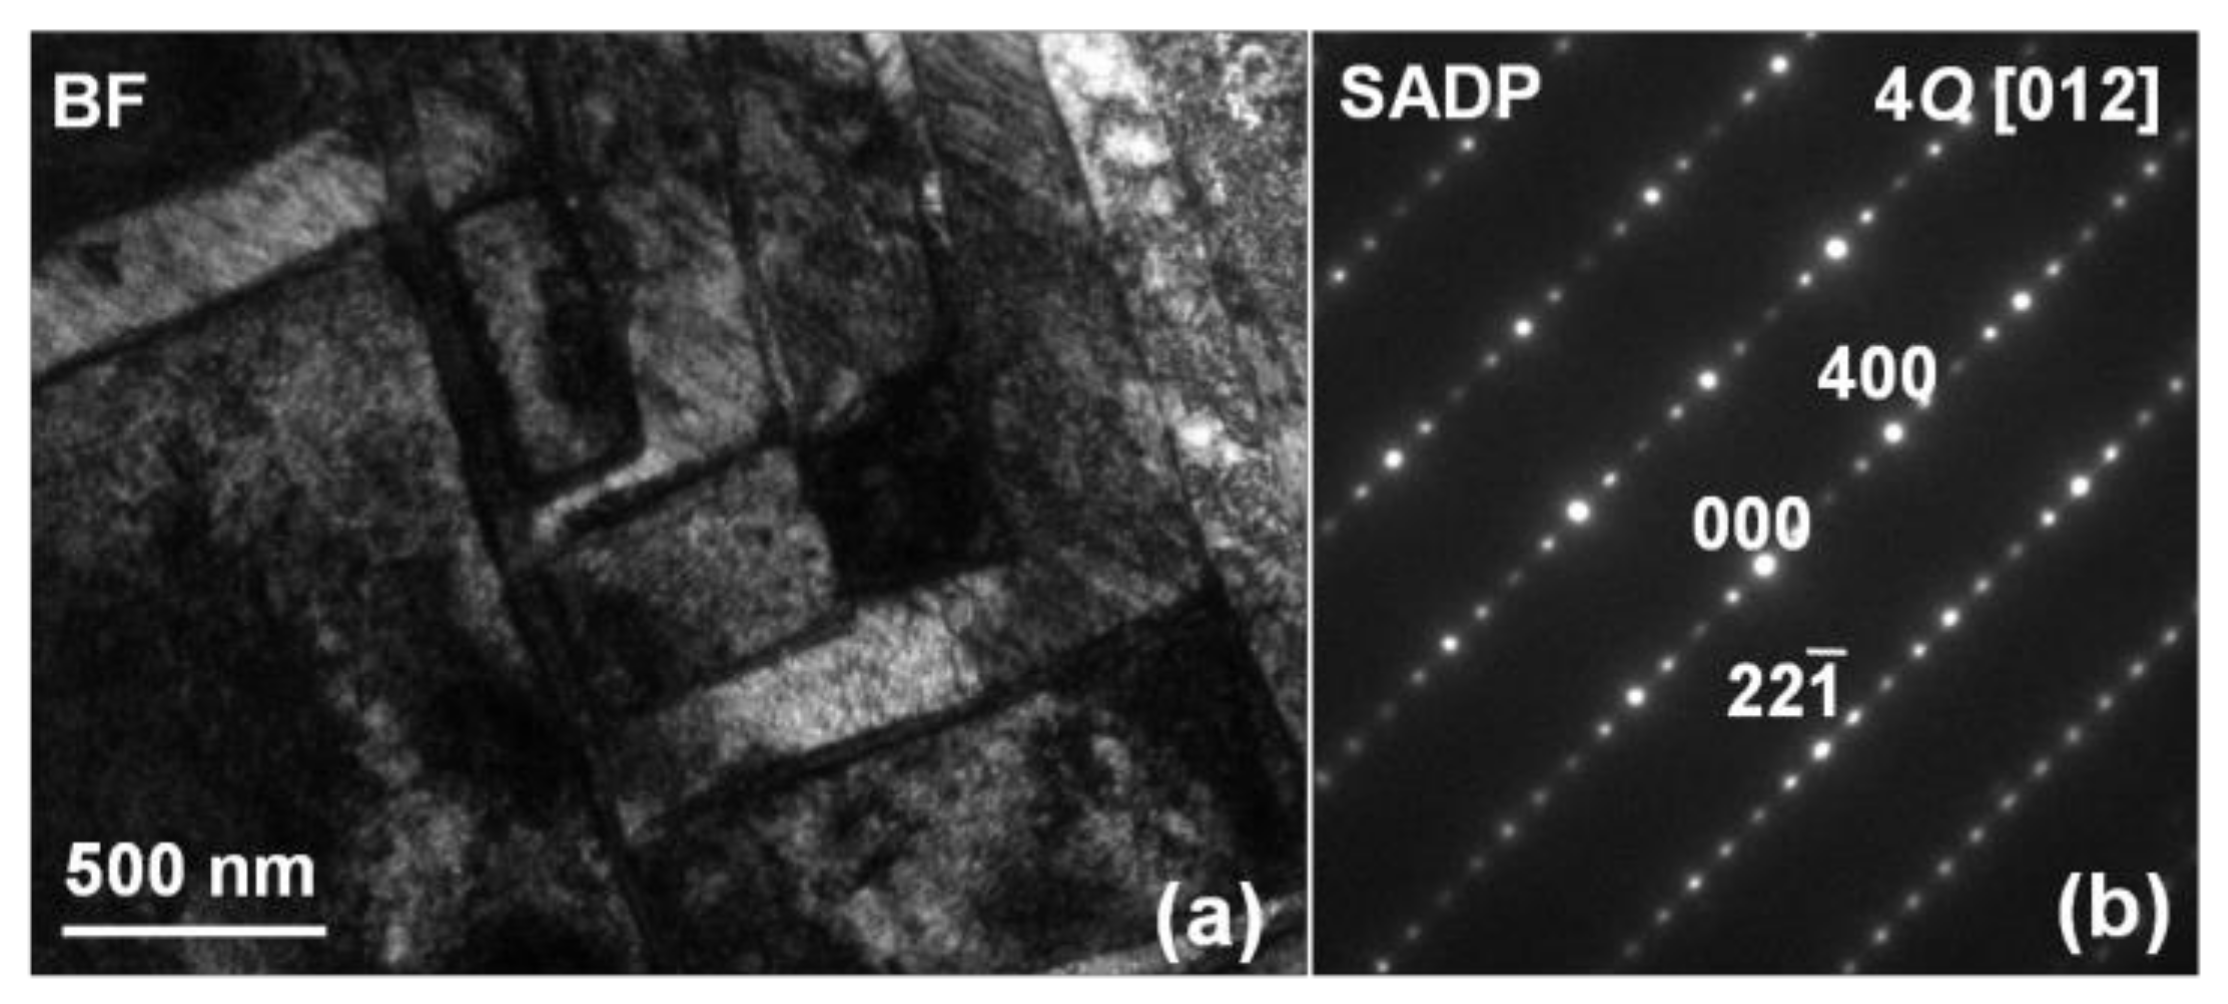
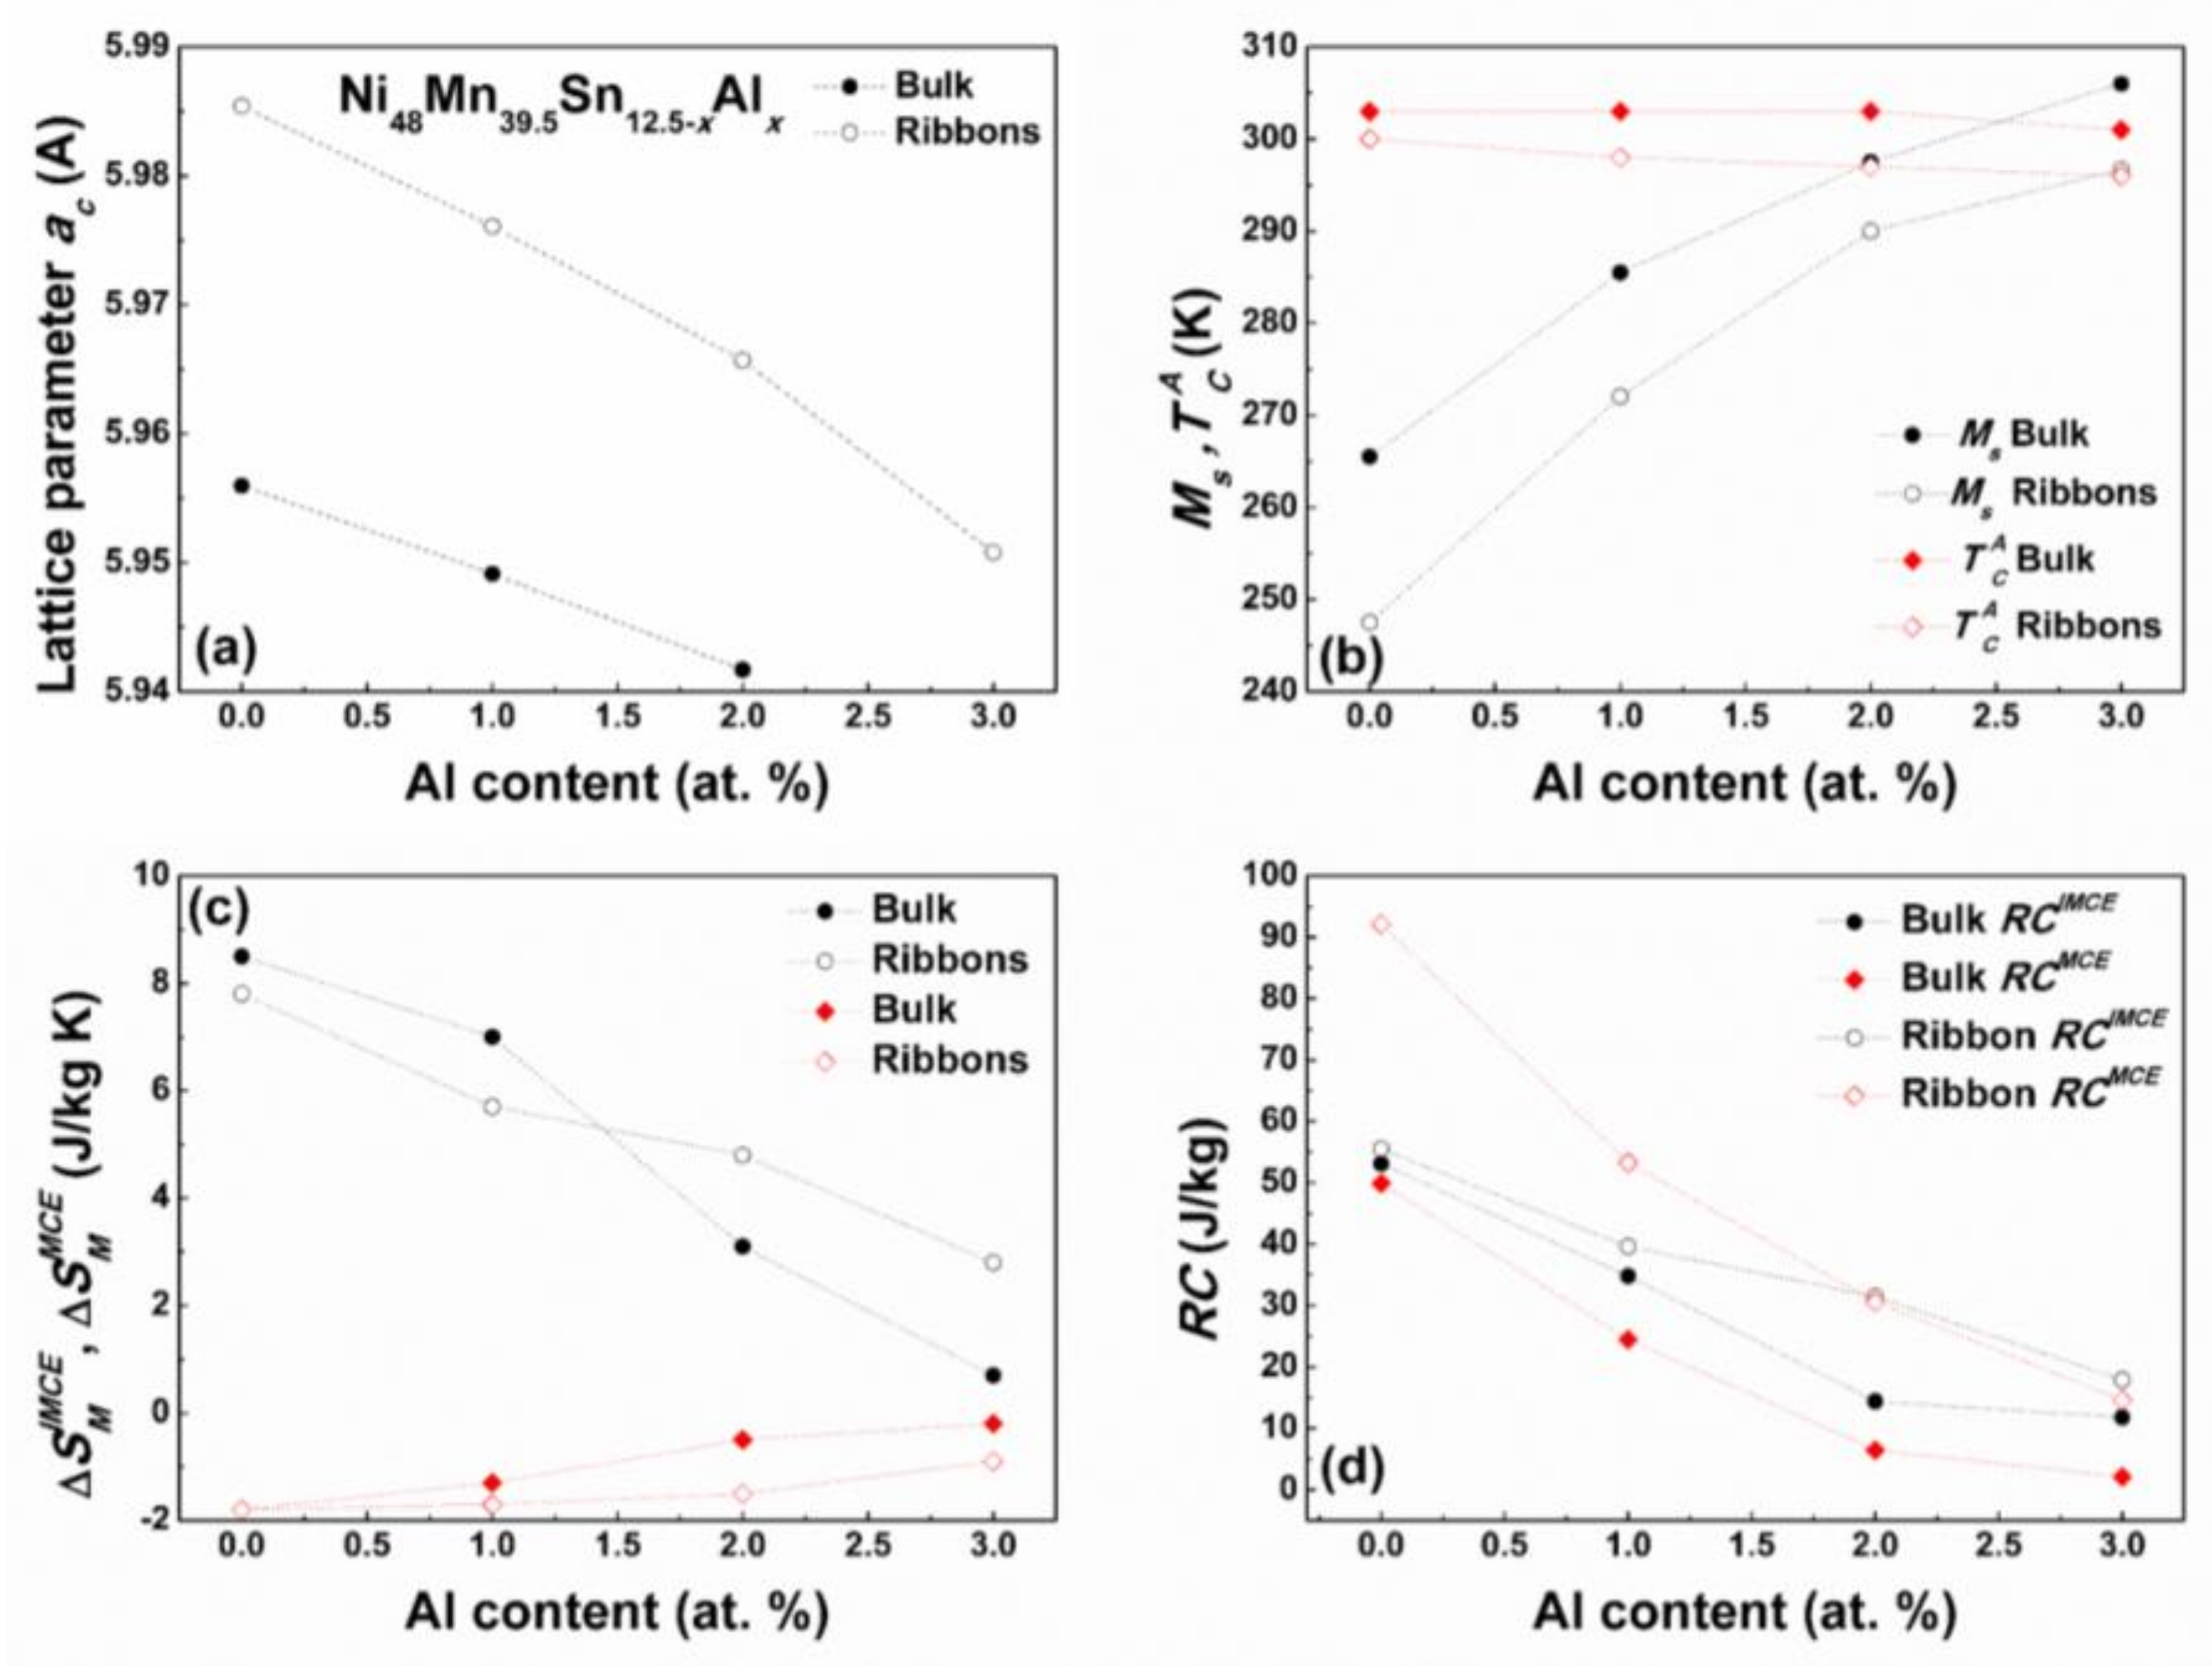
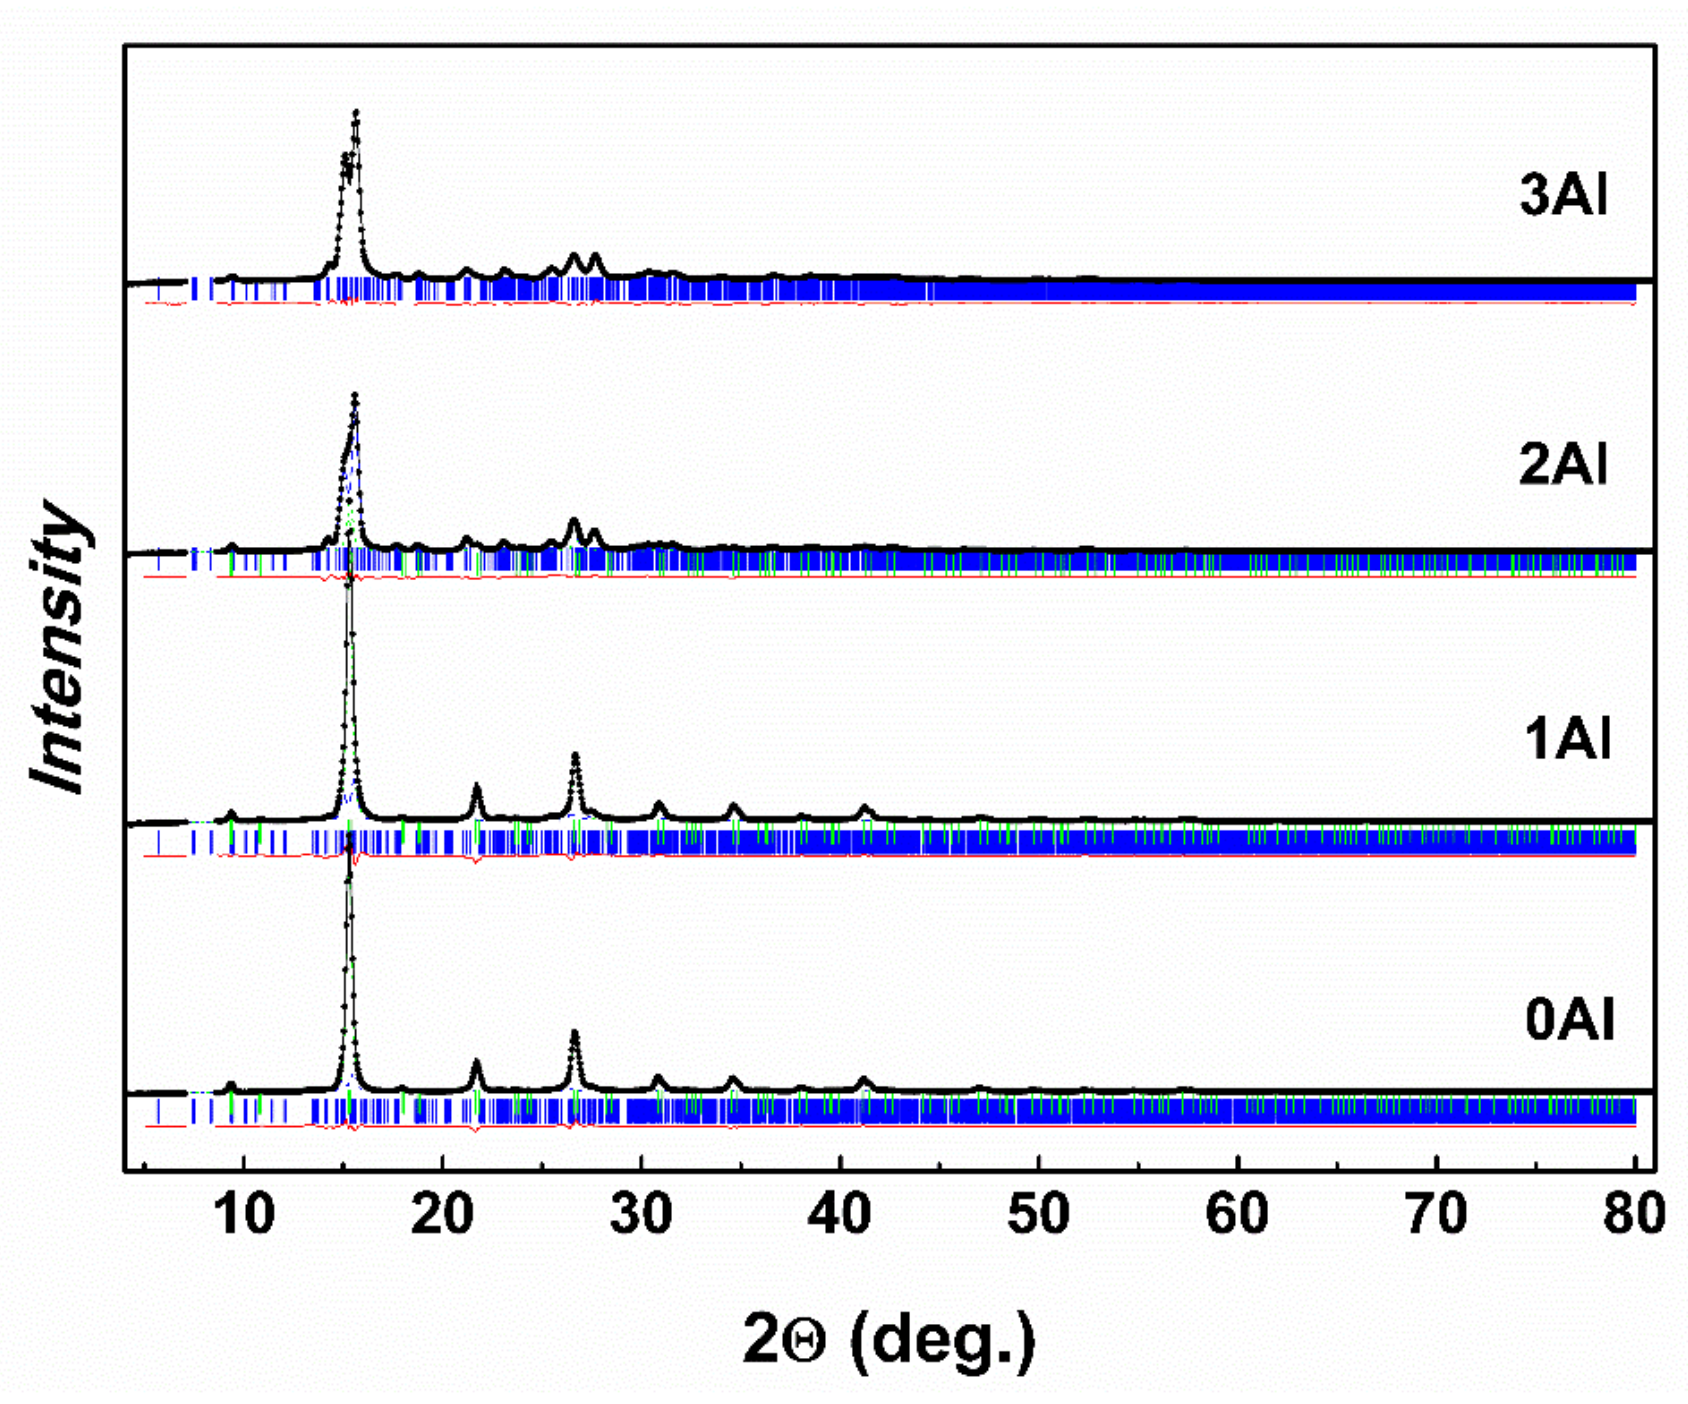
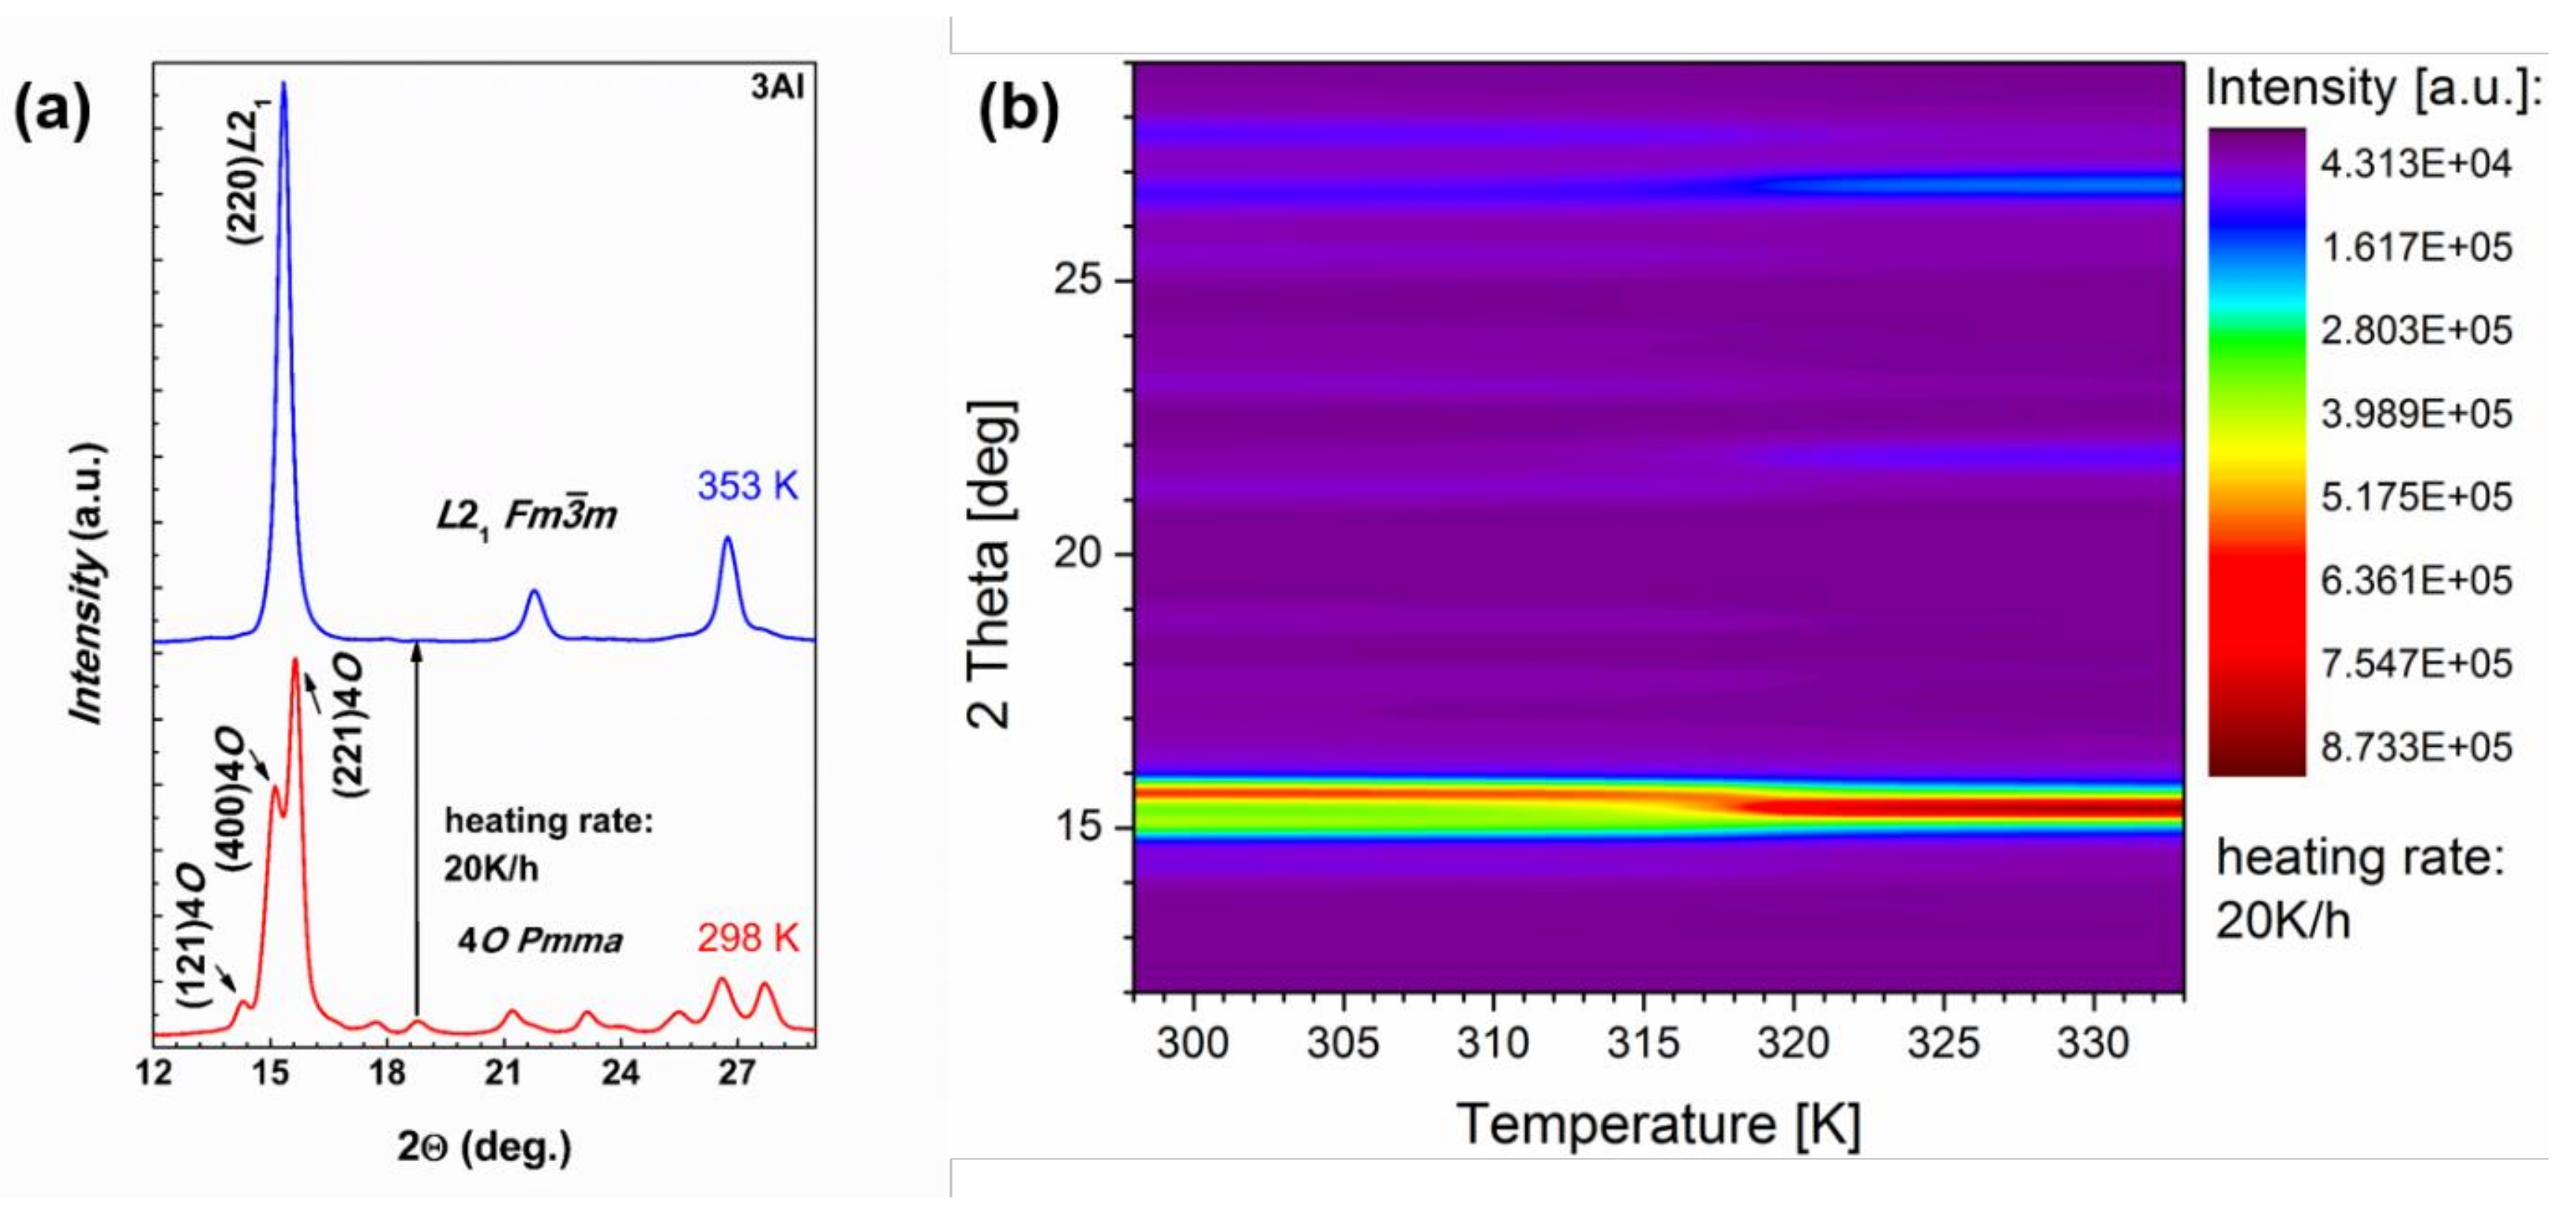
3.2. Crystal Structure

The room temperature XRD patterns for the 0Al, 1Al, 2Al and 3Al alloys along with best Rietveld refined curves are shown in Figure 4. The 3Al pattern was successfully indexed and Rietveld refined solely on the orthorhombic structure (Pmma space group) or monoclinic structure (P12/m1 space group) and unit cell parameters a o = 2 a c , b o = a c and c o = a c / 2 , related approximately to the unit cell parameter (ac) of the L21-type austenite cubic structure [16]. It was found that the low temperature orthorhombic martensite and the high temperature cubic austenite phases coexist in other samples (2Al, 1Al, 0Al) and a gradual decrease of the martensite phase contribution takes place with decreasing Al substitution. Table 2 contains refined structural data for both phases. It is seen that with increasing Al concentration both the unit cell volume as well as the relative mass contribution of the cubic austenite phase decrease progressively. It appears that the transformation to the martensite phase at RT is essentially complete for the 3Al sample. One should however mention that small contribution of the austenite phase to this sample (at the level of few mass %) cannot be also totally excluded. The martensite structure in the studied bulk alloys is the same as the martensite structure observed in melt spun ribbons of the same composition [27]. It must be remarked that no additional phases could be fitted to the obtained RT XRD patterns. This may suggest that the amount of the Al-phase and Ni-phase is at the level below the detection limit of XRD.
These findings are further supported by TEM observations. Figure 5a shows a typical BF image and Figure 5b shows a typical SADP taken from the 3Al sample. On Figure 5a one can easily notice typical for martensite plate-like microstructure. In addition, the SADP taken from the center right darker square area represents typical diffraction features for the orthorhombic 4O martensite structure [14].
To evaluate the character of MT the isothermal XRD patterns of the Ni48Mn39.5Sn9.5Al3 alloy were measured. Patterns were measured in heating process within the 298 and 353 K temperature range and with a 2 K interval. Results of these investigations are shown in Figure 6. It is seen from Figure 6a that at 298 K the alloy is in the orthorhombic martensite state and in the 353 K the alloy had completely transformed to the cubic austenite state. The reverse martensite transformation with increasing temperature can be well traced on Figure 6b by following the gradual disappearance of the intensity of the (400) peak of the martensite phase. It is easily discernible that the (400) peak persists right up to 315 K at which temperature its intensity becomes negligible and above this temperature it is gradually suppressed by the (220) peak. This is in tune with other experiments conducted within this study. In fact the As temperature determined from χ(T) for Ni48Mn39.5Sn9.5Al3 sample is 318 K; this is shown in the following section, which correlates well with these XRD measurements.

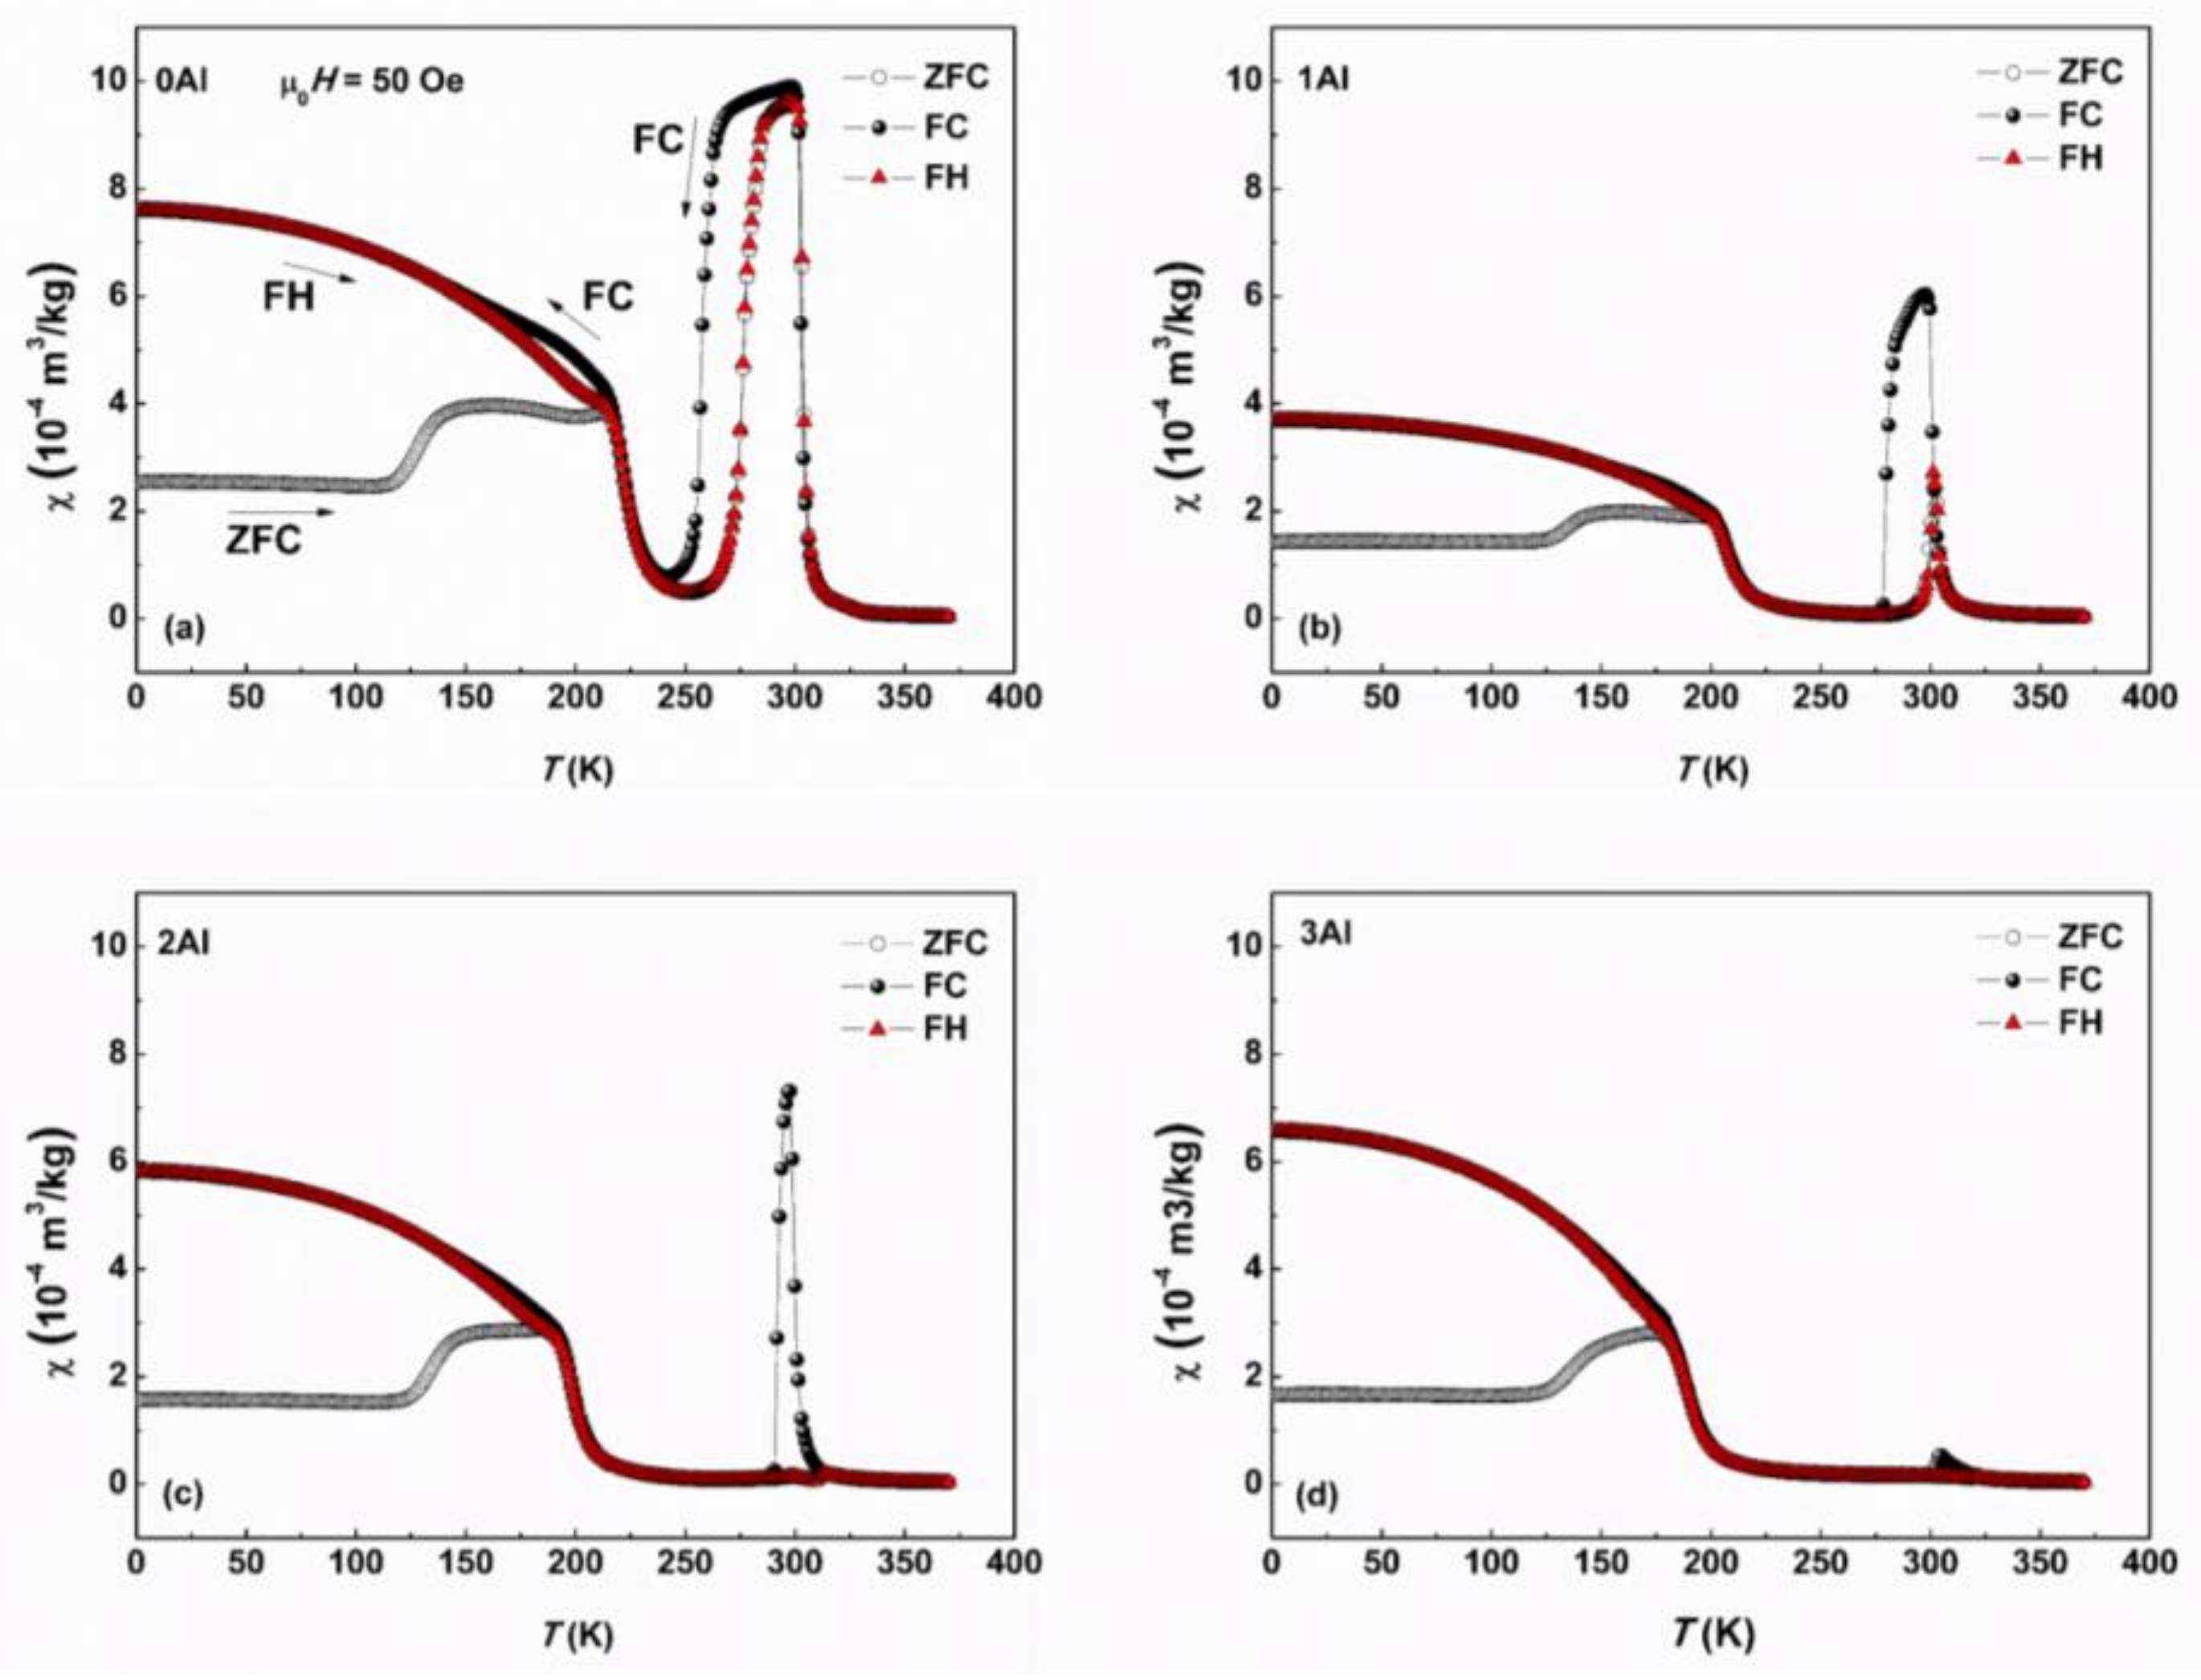
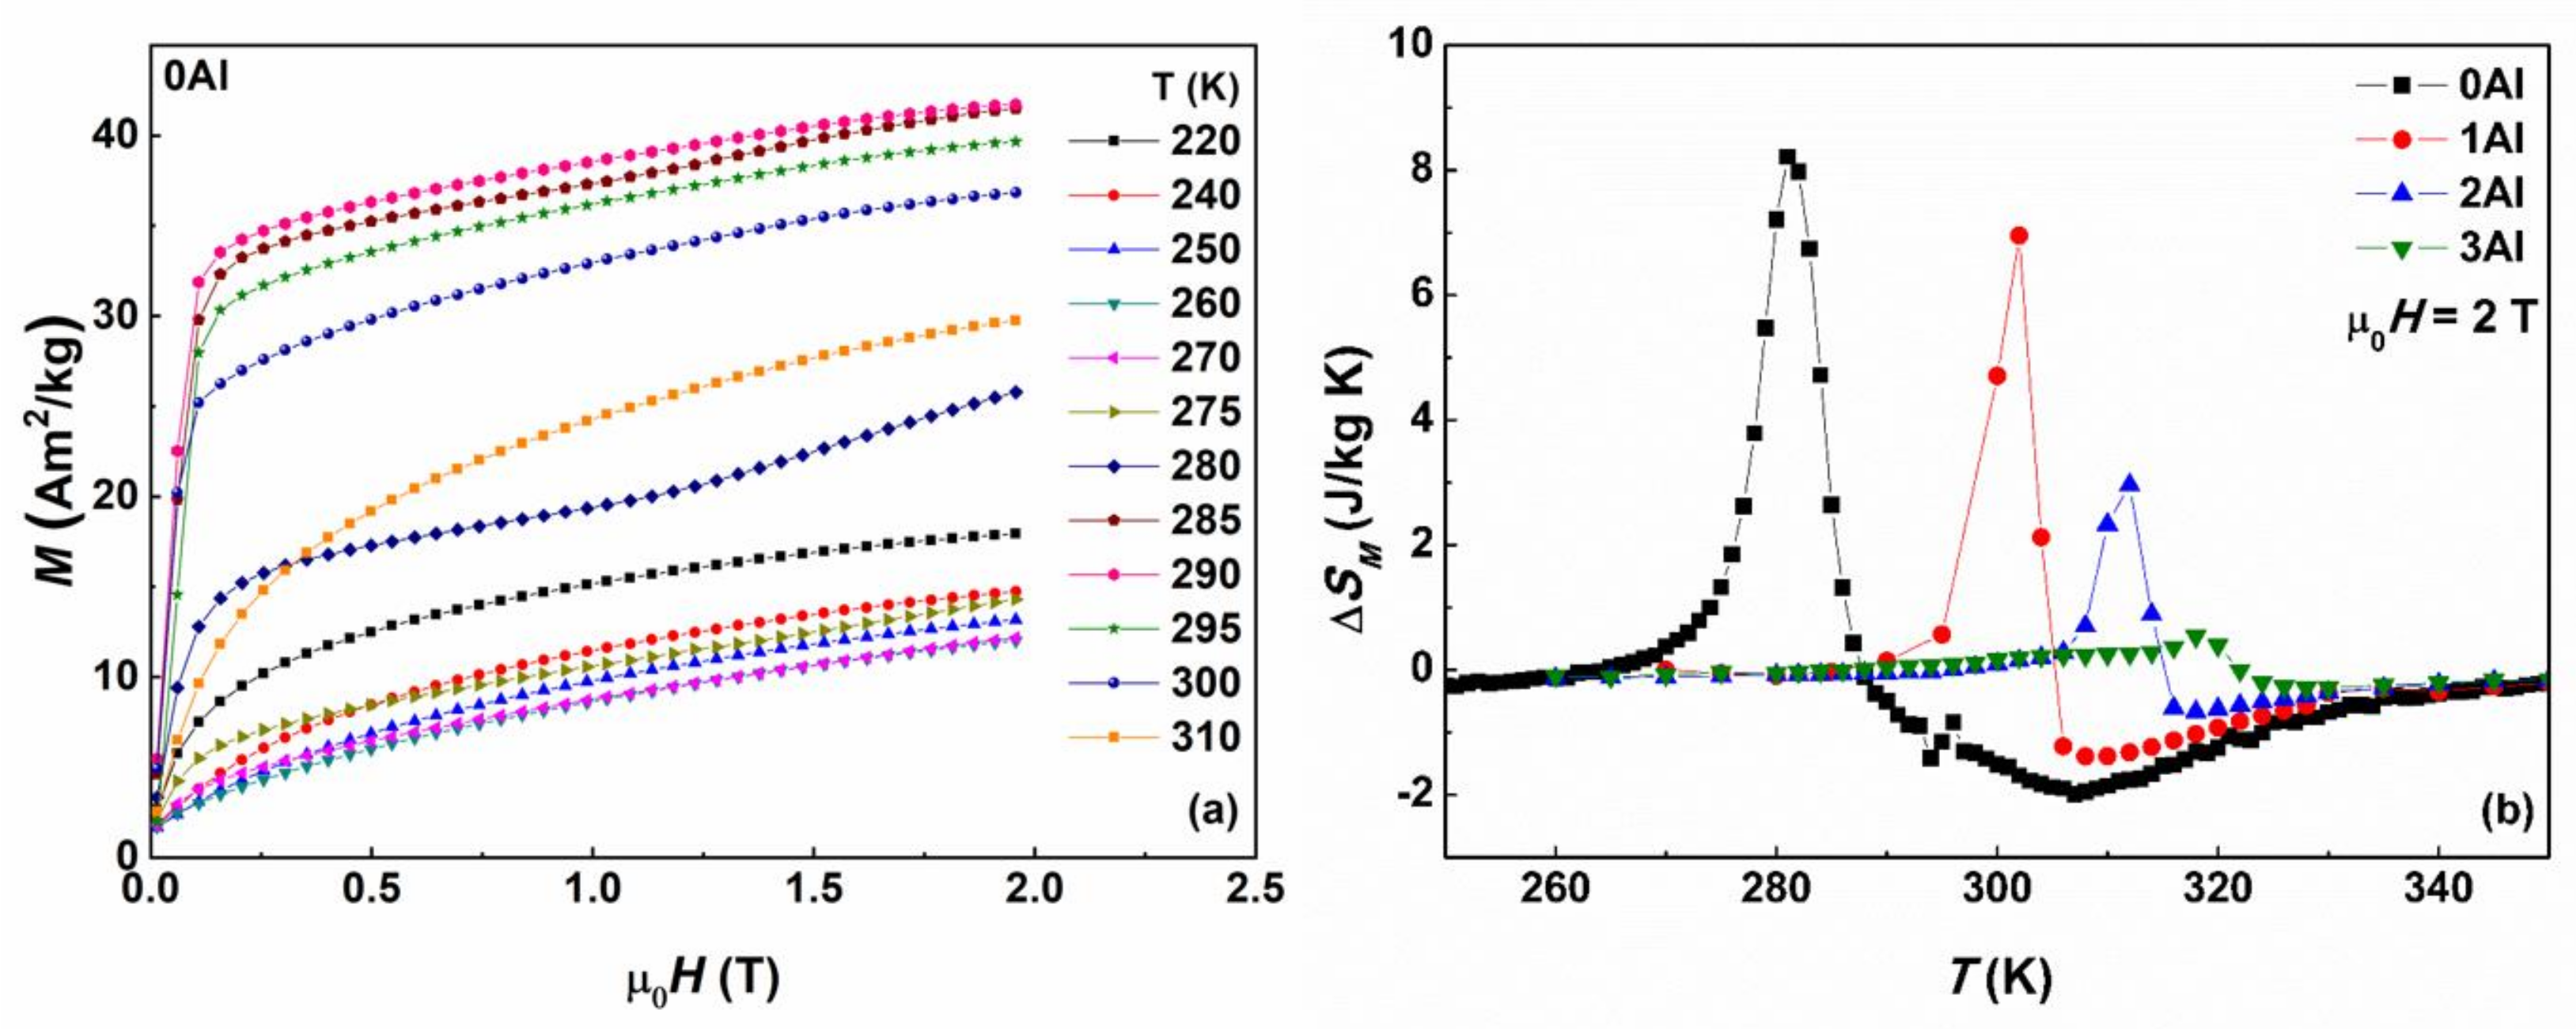
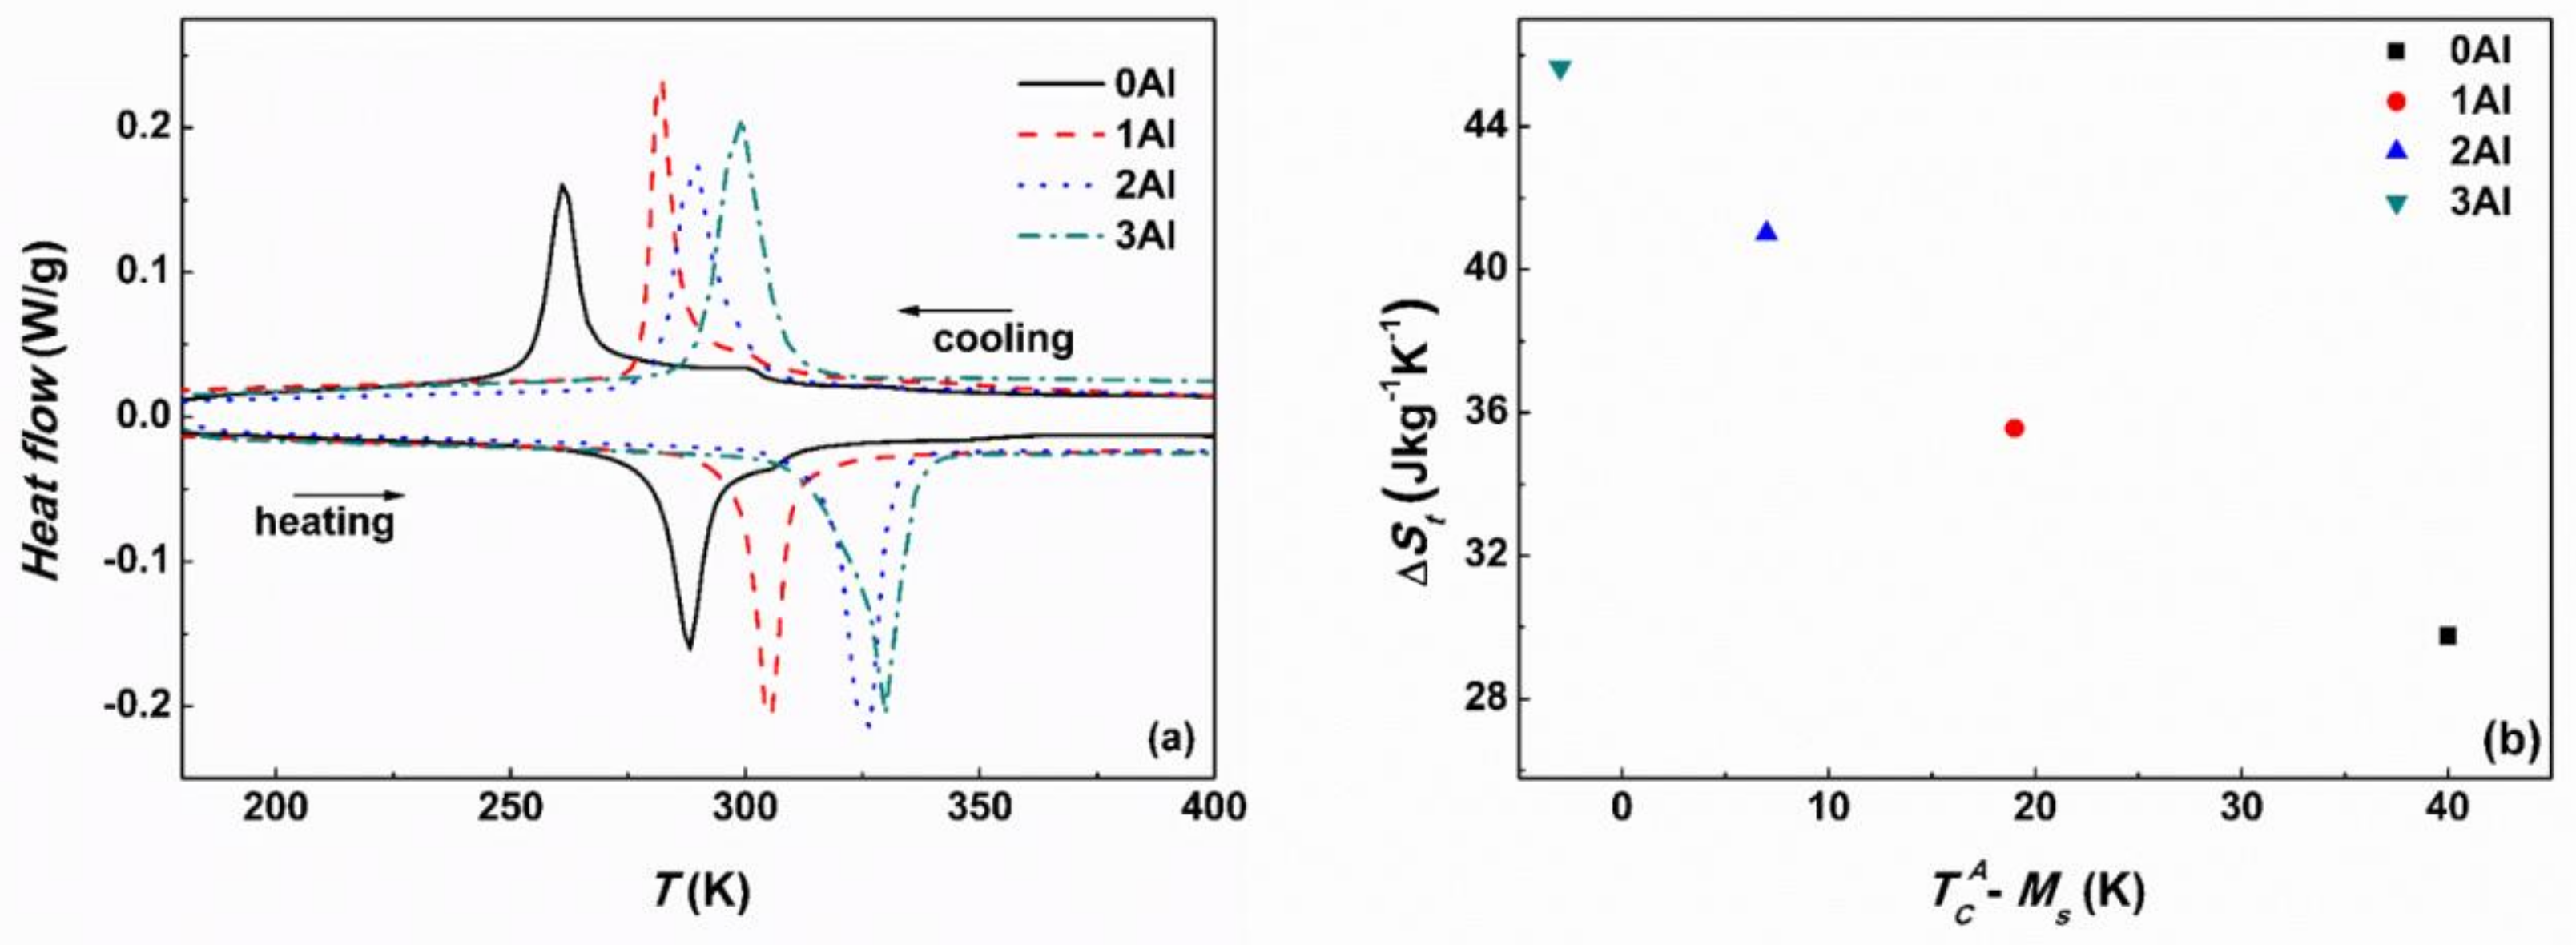
3.3. Martensitic Transformation and Magnetic Properties

The structural and magnetic transitions of the studied alloys were further characterized by DSC and VSM. Figure 7a shows the DSC cooling and heating curves for the four alloys. All the studied alloys undergo forward and reverse MT manifested by the exothermic and endothermic peaks on cooling and on heating. According to DSC curves the MT temperature goes up with increasing Al content despite simultaneous decrease in e/a (Table 1), which is attributable to the shrinkage of the unit cell volume [19,20,27]. It is also seen that the peaks broaden with increasing Al concentration due to the surplus energy term linked to the presence of additional phases [35]. The characteristic martensite start (Ms), martensite finish (Mf) and austenite start (As), austenite finish (Af) temperatures were determined from both DSC and VSM measurements by tangent method and they are summarized in Table 3. The forward (TM) and reverse (TRM) martensitic transformation temperatures determined as peak maxima from DSC scans and from inflection points on field cooled (FC) and field heated (FH) magnetic susceptibility (χ) measurements vs. temperature (Figure 8) are also given in Table 3. The table also contains the magnetic transformation temperatures for martensite T C M and austenite T C A phases determined as the inflection points from the corresponding χ(T) curves (Figure 8). Thermal entropy changes (ΔSt) associated with structural transformations and calculated from the DSC thermograms [36] are also provided. Small exothermic and endothermic peaks on cooling and on heating (Figure 7a) visible on the curves corresponding to the 0Al and 1Al samples are associated with the FM-PM transition in the austenite phase. These peaks are less visible or missing on the DSC temperature scans of the 2Al and 3Al samples, which is related to the coincidence between T C A and Ms. This indicates that with increasing Al for Sn substitution T C A remains unchanged, whereas Ms increases. This effect is well illustrated in Figure 7b, which shows ΔSt vs. T C A Ms. The ΔSt manifests a strong dependence on compositional changes and increases with decreasing T C A Ms. Similar behavior has been confirmed in other Ni-Mn-based systems and it may be qualitatively understood in relation to the magnetic contribution to the Gibbs free energy when TM < T C A [37,38]. The width of the thermal hysteresis, which is a signature of a first order phase transition, in these alloys is in the range between 26 and 30 K.
The Zero Field Cooled (ZFC), FC and FH magnetic susceptibilities of the 0Al, 1Al, 2Al and 3Al alloys were measured as a function of temperature and are presented in Figure 8. Before ZFC measurement the sample was cooled from 360 K to 2 K at zero applied magnetic field. Subsequently the ZFC and FC χ(T) curves were recorded in the magnetic field of 5 mT on heating and on cooling, respectively. The FH χ(T) measurement was finally performed at the same applied field during warming the sample up. In general, the bulk 0-3Al alloys display a typical metamagnetic behavior. On cooling they order FM at the respective T C A temperature, which is followed on further cooling by MT manifested by an abrupt drop in χ at TM. On continuous cooling the martensite phase orders FM at T C M , however with lower χ values than the maximal χ values of the austenite phase, what is related to the larger magnetic anisotropy of the martensite phase and magnetic inhomogeneity often observed in off-stoichiometric Mn rich Ni-Mn alloys [39,40]. The transformation is reversible as is observed from tracing the heating curves. With increasing Al concentration, the FC and FH peaks gradually disappear since Ms nears T C A . It is also worth pointing out that the FC and FH χ values at the lowest temperature initially diminish on substitution of 1 at % of Al for Sn and then pick up on further substitution amounting to 2 and 3 at %. This increase may be attributable to the increasing role of the FM component of the magnetic structure of martensite phase or to the decrease of its magnetic anisotropy.
The isothermal magnetization curves as a function of magnetic field up to 2 T were measured for the 0Al, 1Al, 2Al and 3Al alloys in the vicinity of the TM and T C A temperatures (going from below TM). Selected M(T) curves are shown in Figure 9a for the 0Al sample as an example. Metamagnetic behavior implying magnetic field-induced reverse transformation from the weakly magnetic martensite phase to the austenite phase with higher magnetization is clearly observed in this figure as the temperatures cross As (270 K). Further increase in temperature results in a decrease in magnetization for the isothermal magnetization curves recorded above 290 K, which is indicative of the second order FM-PM transition in austenite at T C A (303 K).
Based on the isothermal magnetization curves the values of the magnetic entropy change ΔSM (in µ0·H = 0.5, 1.0, 1.5 and 2.0 T) were calculated for the studied alloys in the vicinity of the TM and T C A temperatures. The temperature dependences of the computed ΔSM are presented in Figure 9b. On this figure both positive ( Δ S M I M C E ) and negative ( Δ S M M C E ) peaks corresponding to the IMCE around TM and MCE around T C A , respectively, are readily seen. The maximum values of Δ S M I M C E in the magnetic field of 2T are: 8.5, 7, 3.1, 0.7 J kg−1 K−1 for 0Al, 1Al, 2Al, and 3Al, respectively. The maximum values of Δ S M M C E in the same field are: 1.8, 1.3, 0.5, 0.2 J kg−1 K−1 for x = 0, 1, 2, and 3, respectively. The obtained values for both Δ S M I M C E and Δ S M M C E agree with the reported literature values for similar MSMA [17,19,26,41,42,43,44,45,46]. The decreasing ΔSM values with increasing Al concentration may be associated with the coincidence of the TM and T C A temperatures effectively leading to smaller relative magnetization change ΔM/M upon MT.
Together with ΔSM value refrigerant capacity (RC) parameter, which accounts for the amount of heat exchanged by the system during one thermodynamic cycle, was estimated for both IMCE ( R C I M C E ) and MCE ( R C M C E ) according to the following relationship:
R C =     Δ S M m a x ×   δ T F W H M ,
where δ T F W H M denotes full width at half maximum of the ΔSM peak. The calculated R C I M C E (2 T) values for 0Al, 1Al, 2Al and 3Al alloys are as follows: 53.1, 34.8, 14.4 and 11.8 J kg−1, respectively. Whereas the R C M C E values are equal to 49.9, 24.5, 6.5 and 2.1 J kg−1, respectively.

3.4. Bulk vs. Melt Spun Ribbon Alloys

Figure 10 shows the comparison between the bulk and melt spun ribbons of Ni48Mn39.5Sn12.5−xAlx (x = 0, 1, 2, 3) alloys in respect to the change in the lattice parameter of the cubic austenite phase ac (a), the Ms and T C A temperatures (b), magnetic entropy change ΔSM and refrigerant capacity RC at 2 T (d) with increasing Al for Sn substitution. It is seen that the ac decreases with increasing Al content for both bulk and ribbon alloys, which subsequently influences Ms. It has been demonstrated that with decreasing unit cell volume Ms increases due to the enhancement in orbital overlap. An interesting observation is however the difference in ac between the bulk and ribbon alloys. The lattice constant in ribbons appears to be larger than in bulk samples of the same composition. This may be ascribed to the thermodynamics of the rapid quenching process, which introduces quench in vacancies, internal defects, residual stresses, and atoms in non-equilibrium sites, which may then result in lattice strain/distortion [47,48,49]. This in turn impacts the transformation temperatures Ms and T C A , which in the case of ribbons are lower than in bulk alloys. It should also be remarked that melt spinning leads to microstructure refinement and in the present case on average one observes a fifty-fold decrease in the grain size in ribbons as compared to bulk samples. Smaller grain size leads to higher density of grain boundaries, which presents greater constraint for martensite nucleation and growth and in consequence leads to lowering of Ms [50]. The texture and lower degree of atomic order in ribbons should not also be disregarded and their effect is cumulative with decreasing grain size and unit cell volume expansion of the cubic parent phase. Therefore, the lower transformation temperatures Ms in ribbons than in bulk alloys are attributed to the combined effect of lattice parameter increase, grain size decrease, texture, and lower degree of atomic order. On the other hand, it is also observed that T C A in this system is less sensitive to composition and microstructure modification, which is in accordance with literature [19].
The apparent difference in ΔSM between bulk and ribbon alloys is ascribed to the disparity of the structural and magnetic transformation temperatures, which in the case of bulk samples is less pronounced. It is well illustrated for the samples with Al content above 2 at %. It is seen from Figure 10c that in this case the ΔSM change associated with structural transition is lower for bulk than ribbon alloys, because in the former case the mutual temperature overlap is greater in the case of bulk samples. On the other hand, the discrepancy in the ΔSM value between bulk and ribbon samples with Al content below 2 at % related to the structural transition may be due to the decrease in the relative magnetization ΔM/M change between martensite and austenite phases upon MT. This may be linked to the larger than in bulk samples surface area to volume ratio in the ribbons, which may reduce the average magnetization as recently reported by Das et al. [49]. It is also seen from Figure 10d that the microstructure refinement accompanying the melt spinning process influences the ΔSM and RC parameters of the studied alloys. The highest RCMCE value of 92.1 J·kg−1 is obtained for the already reported [26] melt spun Ni48Mn39.5Sn12.5 ribbon. The equivalent composition but bulk alloy shows RCMCE equal to 49.9 J·kg−1, so nearly half that of ribbon’s. This again may be understood in relation to microstructural characteristics. With increasing Al concentration, the difference between RCIMCE and RCMCE parameters for both bulk and ribbon samples decreases but RCIMCE > RCMCE in the case of bulk alloys, where usually the opposite is observed for other MSMA alloys. This again is related to the proximity of TM and T C A temperatures.

4. Conclusions

In summary microstructure, martensitic transformation, and MCE properties of Ni48Mn39.5Sn12.5−xAlx (x = 0, 1, 2, 3) alloys have been investigated. It is observed that with increasing Al substitution for Sn the TM temperature increases to the ambient temperature range. It was found that at room temperature the austenite and the martensite phases coexist in the x = 0, 1 and 2 alloys but the x = 3 alloy is an exclusive martensite phase. It was also found that the secondary Ni-Mn-Al phase appears in increasing amount with increasing Al concentration. A trace amount of binary Ni-Mn phase was also detected, and its origin may be due to decomposition of Ni-Mn-Sn phase upon thermal treatment. Limited amount of the secondary phase has marginal effect on the magnetocaloric properties of the studied system. The ΔSt increases with Al concentration, which may be associated with the occurrence of spin-lattice coupling in response to the shortening distance between Ms and T C A temperatures upon Al for Sn substitution. The largest ΔSM > 0 value is obtained for the x = 0 sample and it is equal to 8.5 J·kg−1·K−1 under 2T. Comparison of melt spun and bulk Ni-Mn-Sn-Al alloys shows that melt spinning is a favorable production technique allowing for more uniform chemical homogeneity and larger controllability of the MCE properties.

Acknowledgments

Financial support by the Polish National Centre for Research and Development NCBiR (Project number: PBS/A5/36/2013) is gratefully acknowledged.

Author Contributions

P. Czaja and W. Maziarz. conceived and designed the experiments; P. Czaja, R. Wróblewski, J. Grzonka., J. Przewoźnik, W. Maziarz performed the experiments; P. Czaja, R. Wróblewski, J. Przewoźnik and W. Maziarz analyzed the data; P. Czaja wrote the paper

Conflicts of Interest

The authors declare no conflicts of interests.

References

  1. Soderberg, O.; Aaltio, I.; Ge, Y.; Heczko, O.; Hannula, S.P. Ni-Mn-Ga multifunctional compounds. Mater. Sci. Eng. A 2008, 481–482, 80–85. [Google Scholar] [CrossRef]
  2. Khan, M.; Pathak, A.K.; Paudel, M.R.; Dubenko, I.; Stadler, S.; Ali, N. Magnetoresistance and field-induced structural transitions in Ni50Mn50−xSnx Heusler alloys. J. Magn. Magn. Mater. 2008, 320, L21–L25. [Google Scholar] [CrossRef]
  3. Planes, A.; Manosa, L.; Moya, X.; Krenke, T.; Acet, M.; Wassermann, E.F. Magnetocaloric effect in Heusler shape-memory alloys. J. Magn. Magn. Mater. 2007, 310, 2767–2769. [Google Scholar] [CrossRef]
  4. Smith, A.; Bahl, C.R.; Bjork, R.; Engelbrecht, K.; Nielsen, K.K.; Pryds, N. Materials challenges for high performance magnetocaloric refrigeration devices. Adv. Eng. Mater. 2012, 2, 1288–1318. [Google Scholar] [CrossRef]
  5. Manosa, L.; Moya, X.; Planes, A.; Krenke, T.; Acet, M.; Wassermann, E.F. Ni-Mn-based magnetic shape memory alloys: Magnetic properties and martensitic transition. Mater. Sci. Eng. A 2008, 481–482, 49–56. [Google Scholar] [CrossRef]
  6. Pons, J.; Cesari, E.; Segui, C.; Masdeu, F.; Santamarta, R. Ferromagnetic shape memory alloys: Alternatives to Ni-Mn-Ga. Mater. Sci. Eng. A 2008, 481–482, 57–65. [Google Scholar] [CrossRef]
  7. Sutou, Y.; Imano, Y.; Koeda, N.; Omori, T.; Kainuma, R.; Ishida, K.; Oikawa, K. Magnetic and martensitic transformations of NiMnX(X = In, Sn, Sb) ferromagnetic shape memory alloys. Appl. Phys. Lett. 2004, 85, 4358–4360. [Google Scholar] [CrossRef]
  8. Koyama, K.; Watanabe, K.; Kanomata, T.; Kainuma, R.; Oikawa, K.; Ishida, K. Observation of field-induced reverse transformation in ferromagnetic shape memory alloy Ni50Mn36Sn14. Appl. Phys. Lett. 2006, 88, 132505. [Google Scholar] [CrossRef]
  9. Moya, X.; Manosa, L.; Planes, A.; Krenke, T.; Acet, M.; Wassermann, E.F. Martensitic transition and magnetic properties in Ni-Mn-X alloys. Mater. Sci. Eng. A 2006, 438–440, 911–915. [Google Scholar] [CrossRef]
  10. Kainuma, R.; Imano, Y.; Ito, W.; Sutou, Y.; Morito, H.; Okamoto, S.; Kitakami, O.; Oikawa, K.; Fujita, A.; Kanomata, T.; et al. Magnetic-field-induced shape recovery by reverse phase transformation. Nat. Lett. 2006, 439, 957–960. [Google Scholar] [CrossRef] [PubMed]
  11. Chernenko, V.A.; Barandiaran, J.M.; Fernandez, J.R.; Rojas, D.P.; Gutierrez, J.; Lazpita, P.; Orue, I. Magnetic and magnetocaloric properties of martensitic Ni2Mn1.4Sn0.6 Heusler alloy. J. Magn. Magn. Mater. 2012, 324, 3519–3523. [Google Scholar] [CrossRef]
  12. Koyama, K.; Kanomata, T.; Kainuma, R.; Oikawa, K.; Ishida, K.; Watanabe, K. High-field X-ray diffraction measurements of novel ferromagnetic shape-memory alloy Ni50Mn36Sn14. Physica B 2006, 383, 24–25. [Google Scholar] [CrossRef]
  13. Mukadam, M.D.; Yusuf, S.M.; Bhadtt, P. Tuning the magnetocaloric properties of the Ni2+xMn1−xSn Heusler alloys. J. Appl. Phys. 2013, 113, 173911. [Google Scholar] [CrossRef]
  14. Zheng, H.; Wang, W.; Xue, S.; Zhai, Q.; Frenzel, J.; Luo, Z. Composition-dependent crystal structure and martensitic transformation in Heusler Ni-Mn-Sn alloys. Acta Mater. 2013, 61, 4648–4656. [Google Scholar] [CrossRef]
  15. McAlister, S.P.; Shiozaki, I.; Hurd, C.M.; Stager, C.V. Galvanomagnetic effects in the Ni2MnSn Heusler alloy. J. Phys. F Metal Phys. 1981, 11, 2129. [Google Scholar] [CrossRef]
  16. Brown, P.J.; Gandy, A.P.; Ishida, K.; Kainuma, R.; Kanomata, T.; Neumann, K.U.; Oikawa, K.; Ouladdiaf, B.; Ziebeck, K.R.A. The magnetic and structural properties of the magnetic shape memory compound Ni2Mn1.44Sn0.56. J. Phys. Condens. Matter. 2006, 18, 2249–2259. [Google Scholar] [CrossRef]
  17. Krenke, T.; Acet, M.; Wassermann, E.F. Martensitic transitions and the nature of ferromagnetism in the austenitic and martensitic states of Ni-Mn-Sn alloys. Phys. Rev. B 2005, 72, 014412. [Google Scholar] [CrossRef]
  18. Wang, R.L.; Yan, J.B.; Xiao, H.B.; Xu, L.S.; Marchenkov, V.V.; Xu, L.F.; Yang, C.P. Effect of electron density on the martensitic transition in Ni-Mn-Sn alloys. J. Alloys Compd. 2011, 509, 6834–6837. [Google Scholar] [CrossRef]
  19. Chen, J.; Han, Z.; Qian, B.; Zhang, P.; Wang, D.; Du, Y. The influence of Al substitution on the phase transitions and magnetocaloric effect in Ni43Mn46Sn11−xAlx alloys. J. Magn. Magn. Mater. 2011, 323, 248–251. [Google Scholar] [CrossRef]
  20. Wang, R.L.; Yan, J.B.; Xu, L.S.; Marchenkov, V.V.; Chen, S.S.; Tang, S.L.; Yang, C.P. Effect of Al doping on the martensitic transition and magnetic entropy change in Ni-Mn-Sn alloys. Solid State Commun. 2011, 151, 1196–1199. [Google Scholar] [CrossRef]
  21. Xiao, H.B.; Yang, C.P.; Wang, R.L.; Marchenkov, V.V.; Barner, K. Effect of alloying element Al substitution on Ni-Mn-Sn shape memory alloy by first-principle calculations. J. Appl. Phys. 2012, 112, 123723. [Google Scholar] [CrossRef]
  22. Agarwal, S.; Mukhopadhyay, P.K. The effect of Al replacement and heat treatment on magnetocaloric properties of Ni2Mn-Sn ferromagnetic shape memory alloys. J. Alloys Compd. 2014, 608, 329–333. [Google Scholar] [CrossRef]
  23. Agarwal, S.; Stern-Taulats, E.; Manosa, L.; Mukhopadhyay, P.K. Effect of low temperature annealing on magneto-caloric effect of Ni-Mn-Sn-Al ferromagnetic shape memory alloy. J. Alloys Compd. 2015, 641, 244–248. [Google Scholar] [CrossRef]
  24. Yuhasz, W.M.; Schlagel, D.L.; Xing, Q.; McCallum, R.W.; Lograsso, T.A. Metastability of ferromagnetic Ni-Mn-Sn Heusler alloys. J. Alloys Compd. 2010, 492, 681–684. [Google Scholar] [CrossRef]
  25. Yuhasz, W.M.; Schlagel, D.L.; Xing, Q.; Dennis, K.W.; McCallum, R.W.; Lograsso, T.A. Influence of annealing and phase decomposition on the magnetostructural transitions in Ni50Mn39Sn11. J. Appl. Phys. 2009, 105, 07A921. [Google Scholar] [CrossRef]
  26. Czaja, P.; Maziarz, W.; Przewoźnik, J.; Kapusta, C.; Hawelek, L.; Chrobak, A.; Drzymała, P.; Fitta, M.; Kolano-Burian, A. Magnetocaloric properties and exchange bias effect in Al for Sn substituted Ni48Mn39.5Sn12.5 Heusler alloy ribbons. J. Magn. Magn. Mater. 2014, 358–359, 142–148. [Google Scholar] [CrossRef]
  27. Maziarz, W.; Czaja, P.; Szczerba, M.J.; Przewoźnik, J.; Kapusta, C.; Żywczak, A.; Stobiecki, T.; Cesari, E.; Dutkiewicz, J. Room temperature magneto-structural transition in Al for Sn substituted Ni-Mn-Sn melt spun ribbons. J. Magn. Magn. Mater. 2013, 348, 8–16. [Google Scholar] [CrossRef]
  28. Czaja, P.; Maziarz, W.; Przewoźnik, J.; Żywczak, A.; Ozga, P.; Bramowicz, M.; Kulesza, S.; Dutkiewicz, J. Surface topography, microstructure and magnetic domains in Al for Sn substituted metamagnetic Ni-Mn-Sn Heusler alloy ribbons. Intermetallics 2014, 55, 1–8. [Google Scholar] [CrossRef]
  29. Guo, Z.; Pan, L.; Yasir Rafique, M.; Zheng, X.; Qiu, H.; Liu, Z. Metamagnetic phase transformation and magnetocaloric effect in quinary Ni45Co5Mn40InxSn10−x Heusler alloy. J. Alloys Compd. 2013, 577, 174–178. [Google Scholar] [CrossRef]
  30. Caron, L.; Ou, Z.Q.; Nguyen, T.T.; Cam Thanh, D.T.; Tegus, O.; Bruck, E. On the determination of the magnetic entropy change in materials with first-order transitions. J. Magn. Magn. Mater. 2009, 321, 3559–3566. [Google Scholar] [CrossRef]
  31. Tocado, L.; Palacios, E.; Burriel, R. Entropy determinations and magnetocaloric parameters in systems with first-order transitions: Study of MnAs. J. Appl. Phys. 2009, 105, 093918. [Google Scholar] [CrossRef]
  32. Robinson, K. The Determination of the Crystal Structure of Ni4Mn11Al60. Acta Crystallogr. 1954, 7, 494–497. [Google Scholar] [CrossRef]
  33. Passamani, E.C.; Xavier, F.; Favre-Nicolin, E.; Larica, C.; Takeuchi, A.Y.; Castro, I.L.; Proveti, J.R. Magnetic properties of NiMn-based Heusler alloys influenced by Fe atoms replacing Mn. J. Appl. Phys. 2009, 105, 033919. [Google Scholar] [CrossRef]
  34. Mishima, Y.; Ochiai, S.; Suzuki, T. Lattice parameters of Ni(γ), Ni3Al(γ′) and Ni3Ga(γ′) solid solutions with additions of transition and B-subgroup elements. Acta Metall. 1985, 33, 1161–1169. [Google Scholar] [CrossRef]
  35. Sanchez-Alarcos, V.; Recarte, V.; Perez-Landazabal, J.I.; Chapelon, J.R.; Rodriguez-Velamazan, J.A. Structural and magnetic properties of Cr-doped Ni-Mn-In metamagnetic shape memory alloys. J. Phys. D Appl. Phys. 2011, 44, 395001. [Google Scholar] [CrossRef]
  36. Ingale, B.D.; Kuo, Y.K.; Ram, S. Phase Transformation, Microstructure and Magnetocaloric Properties in Polycrystalline Bulk Ni50Mn50−zSnzAlloys. IEEE Trans. Magn. 2011, 47, 3395–3398. [Google Scholar] [CrossRef]
  37. Cesari, E.; Salas, D.; Kustov, S. Entropy Changes in Ferromagnetic Shape Memory Alloys. Mater. Sci. Forum 2011, 684, 49–60. [Google Scholar] [CrossRef]
  38. Recarte, V.; Perez-Landazabal, J.I.; Sanchez-Alcaros, V.; Zablotskii, V.; Cesari, E.; Kustov, S. Entropy change linked to the martensitic transformation in metamagnetic shape memory alloys. Acta Mater. 2012, 60, 3168–3175. [Google Scholar] [CrossRef]
  39. Tao, Q.; Han, Z.D.; Wang, J.J.; Qian, B.; Zhang, P.; Jiang, X.F.; Wang, D.H.; Du, Y.W. Phase stability and magnetic-field-induced martensitic transformation in Mn-rich NiMnSn alloys. AIP Adv. 2012, 2, 042181. [Google Scholar] [CrossRef]
  40. Phan, T.L.; Zhang, P.; Dan, N.H.; Yen, N.H.; Thanh, P.T.; Thanh, T.D.; Phan, M.H.; Yu, S.C. Coexistence of conventional and inverse magnetocaloric effects and critical behaviors in Ni50Mn50−xSnx (x = 13 and 14) alloy ribbons. Appl. Phys. Lett. 2012, 101, 212403. [Google Scholar] [CrossRef]
  41. Han, Z.D.; Wang, D.H.; Zhang, C.L.; Xuan, H.C.; Gu, B.X.; Du, Y.W. Low-field inverse magnetocaloric effect in Ni50−xMn39+xSn11 Heusler alloys. Appl. Phys. Lett. 2007, 90, 042507. [Google Scholar] [CrossRef]
  42. Liu, F.S.; Wang, Q.B.; Li, S.P.; Ao, W.Q.; Li, J.Q. The martensitic transition and magnetocaloric properties of Ni51Mn49−xSnx. Phys. B 2013, 412, 74–78. [Google Scholar] [CrossRef]
  43. Xuan, H.C.; Wang, D.H.; Zhang, C.L.; Han, Z.D.; Gu, B.X.; Du, Y.W. Boron’s effect on martensitic transformation and magnetocaloric effect in Ni43Mn46Sn11Bx alloys. Appl. Phys. Lett. 2008, 92, 102503. [Google Scholar] [CrossRef]
  44. Chatterjee, S.; Giri, S.; De, S.K.; Majumdar, S. Giant magneto-caloric effect near room temperature in Ni-Mn-Sn-Ga alloys. J. Alloys Compd. 2010, 503, 273–276. [Google Scholar] [CrossRef]
  45. Fukushima, K.; Sano, K.; Kanomata, T.; Nishihara, H.; Furutani, Y.; Shishido, T.; Ito, W.; Umetsu, R.Y.; Kainuma, R.; Oikawa, K.; et al. Phase diagram of Fe-substituted Ni-Mn-Sn shape memory alloys. Scr. Mater. 2009, 61, 813–816. [Google Scholar] [CrossRef]
  46. Han, Z.D.; Wang, D.H.; Zhang, C.L.; Xuan, H.C.; Zhang, J.R.; Gu, B.X.; Du, Y.W. Effect of lattice contraction on martensitic transformation and magnetocaloric effect in Ge doped Ni-Mn-Sn alloys. Mater. Sci. Eng. B 2009, 157, 40–43. [Google Scholar] [CrossRef]
  47. Donner, P. Microstructure and phase-transformation in meltspun shape memory alloys. J. Phys. IV France 1991, 1, C4-355–C4-360. [Google Scholar] [CrossRef]
  48. Bai, J.; Raulot, J.M.; Zhang, Y.D.; Esling, C.; Zhao, X.; Zuo, L. Defect formation energy and magnetic structure of shape memory alloys Ni-X-Ga (X = Mn, Fe, Co) by first principle calculation. J. Appl. Phys. 2010, 108, 064904. [Google Scholar] [CrossRef]
  49. Das, R.; Perumal, A.; Srinivasan, A. Effect of particle size on the magneto-caloric properties of Ni51Mn34In14Si1 alloy. J. Alloys Compd. 2013, 572, 192–198. [Google Scholar] [CrossRef]
  50. Quintana-Nedelcos, A.; Sanchez Llamazares, J.L.; Rios-Jara, D.; Lara-Rodriguez, A.G.; Garcia-Fernandez, T. Effect of quenching rate on the average grain size and martensitic transformation temperature in rapidly solidified polycrystalline Ni50Mn37Sn13 alloy ribbons. Phys. Status Solidi A 2013, 210, 2159–2165. [Google Scholar] [CrossRef]
Figure 1. Room temperature SEM-BSE micrographs taken from the 0Al (a), 1Al (b), 2Al (c) and 3Al (d) alloys. The 0Al, 1Al and 2Al alloys contain austenite and martensite phases, typical plate-like martensite microstructure is visible in (c), whereas the 3Al alloy is predominantly martensitic.
Magnetochemistry 04 00019 g001
Figure 2. Room temperature SEM-BSE (a), STEM-HAADF (b), BF (c) images and the corresponding SADP (d) taken from Al rich phase from the 3Al alloy. Plate-like martensitic microstructure dominating the 3Al alloy is visible in (a) or in the matrix in (b).
Magnetochemistry 04 00019 g002
Figure 3. SEM-BSE (a), STEM-HAADF (b) images taken at RT from the 3Al sample with the Ni-phase. BF image (c) and the corresponding SADP (d) taken from the matrix area, BF (e) and SADP (f) taken from the Ni-phase of the same sample.
Magnetochemistry 04 00019 g003
Figure 4. The refined XRD patterns for 0Al, 1Al, 2Al and 3Al alloys at RT. The 0Al, 1Al and 2Al samples are a mixture of austenite and martensite phases, whereas the 3Al sample appears fully martensitic.
Magnetochemistry 04 00019 g004
Figure 5. Experimental BF (a) and SADP of the martensite phase (b) taken at RT from the martensite phase of the 3Al alloy.
Magnetochemistry 04 00019 g005
Figure 6. The X-ray diffraction patterns of 3Al alloy in the martensite phase at 298 K and in the austenite phase at 353 K after heating with the heating rate 20 K/h (a); the temperature dependent X-ray diffraction map of 3Al alloy in the temperature range from 298 K to 333 K (b).
Magnetochemistry 04 00019 g006
Figure 7. DSC cooling and heating curves for 0Al, 1Al, 2Al and 3Al alloys (a). EXO UP ↑. Thermal entropy change ΔSt upon MT as a function of T C A Ms for 0Al, 1Al, 2Al and 3Al alloys (b).
Magnetochemistry 04 00019 g007
Figure 8. Temperature dependence of the ZFC, FC, FH mass magnetic susceptibility, χ, under an external magnetic field of 0.005 T for 0Al, 1Al, 2Al and 3Al alloys.
Magnetochemistry 04 00019 g008
Figure 9. Magnetization isotherms measured around the structural and magnetic phase transitions in 0Al alloy (a). Temperature dependence of magnetic entropy change, ΔSM, around the structural and magnetic transitions: in 0Al, 1Al, 2Al and 3Al alloys at the applied magnetic field of 2 T (b).
Magnetochemistry 04 00019 g009
Figure 10. Lattice parameter ac of the cubic L21 austenite phase (a), Ms and T C A temperatures (b), Δ S M I M C E and Δ S M I M C E and Δ S M M C E values (c) and RC parameters at 2 T (d) for Ni48Mn39.5Sn12.5−xAlx (x = 0, 1, 2, 3) bulk and melt spun ribbons [26,27]. Dotted lines are guides for eyes.
Magnetochemistry 04 00019 g010
Table 1. Chemical composition and valence electron concentration (e/a) of the detected phases for the studied 0Al, 1Al, 2Al and 3Al alloys.
Alloy Ni (at %)Mn (at %)Sn (at %)Al (at %)O (at %)e/a
0AlNominal4839.512.5--8.065
SEM-EDSMatrix49.338.412.3--8.109
Al-phase------
1AlNominal4839.511.51-8.055
SEM-EDSMatrix48.53911.51-8.071
Al-phase33.827.28.130.9-6.533
Ni-phase63.730.64.71-8.731
2AlNominal4839.510.52-8.045
SEM-EDSMatrix48.83910.41.8-8.081
Al-phase34.627.87.430.2-6.61
3AlNominal4839.59.53-8.035
SEM-EDSMatrix48.3399.73-8.036
Al-phase37.531.57.823.2-6.967
Ni-phase66.228.232.6-8.794
SEM-WDSAl-phase14.810.62.269.72.7-
TEM-EDXAl-phase13.511.11.174.3-4.397
Matrix51.939.66.81.7-8.288
Ni-phase66.829.12.51.5-8.87
Matrix5528.114.82.1-8.124
Table 2. The RT unit cell parameter (ac), unit cell volume (Vc), relative mass contribution (pc) of the austenite phase and the unit cell parameters (ao, bo, co) and unit cell volume (Vo) of the martensite phase obtained from the analysis of X-ray diffraction patterns of the 0Al, 1Al, 2Al and 3Al alloys.
AlloyAusteniteMartensite
ac (Å)Vc3)pc (%)ao (Å)bo (Å)co (Å)Vc3)
0Al5.9560 (4)211.28 (2)87 (5)8.585 (15)5.656 (10)4.320 (10)209.7 (7)
1Al5.9491 (5)210.55 (3)79 (5)8.562 (10)5.643 (8)4.321 (6)208.8 (5)
2Al5.942 (2)209.77 (12)16 (3)8.546 (3)5.615 (2)4.334 (2)208.0 (1)
3Al---8.524 (2)5.6093 (2)4.3306 (2)207.1 (1)
Table 3. The characteristic forward (Ms, Mf) and reverse (As, Af) martensitic transformation temperatures, the temperature hysteresis (∆Th. = AfMs), the forward (TM) and reverse (TRM) peak MT temperatures, the Curie temperatures of austenite ( T C A ) and martensite ( T C M ) and thermal entropy (ΔSt) changes in absolute values determined from DSC and VSM scans for 0Al, 1Al, 2Al and 3Al alloys.
Alloy MethodMsMfAsAf∆Th.TMTRM T C A T C M ΔSt
CoolHeat
(K) (J kg−1 K−1)
0Alχ(T)26325327028320257276303222--
DSC26825428029426261288--29.837.4
1Alχ(T)28427729730218280300303207--
DSC28727829831124282305--35.631.9
2Alχ(T)29629030931317292311303197--
DSC29928231833132290327--41.036.7
3Alχ(T)30430131832117302320301189--
DSC30829032233729299330--45.639.9

