Article

Accelerating NMR-Based Structural Studies of Proteins by Combining Amino Acid Selective Unlabeling and Fast NMR Methods

by
Bankala Krishnarjuna
1,
Kousik Chandra
1,* and
Hanudatta S. Atreya
1,2,*
1
NMR Research Centre, Indian Institute of Science, Bangalore 560012, India
2
Solid State and Structural Chemistry Unit, Indian Institute of Science, Bangalore 560012, India
*
Authors to whom correspondence should be addressed.
Magnetochemistry 2018, 4(1), 2; https://doi.org/10.3390/magnetochemistry4010002
Submission received: 30 October 2017 / Revised: 4 December 2017 / Accepted: 7 December 2017 / Published: 26 December 2017
(This article belongs to the Special Issue Nuclear Magnetic Resonance Spectroscopy)

Abstract

:
In recent years, there has been a growing interest in fast acquisition and analysis of nuclear magnetic resonance (NMR) spectroscopy data for high throughput protein structure determination. Towards this end, rapid data collection techniques and methods to simplify the NMR spectrum such as amino acid selective unlabeling have been proposed recently. Combining these two approaches can speed up further the structure determination process. Based on this idea, we present three new two-dimensional (2D) NMR experiments, which together provide 15N, 1HN, 13Cα, 13Cβ, 13C′ chemical shifts for amino acid residues which are immediate C-terminal neighbors (i + 1) of residues that are selectively unlabeled. These experiments have high sensitivity and can be acquired rapidly using the methodology of G-matrix Fourier transform (GFT) NMR spectroscopy combined with non-uniform sampling (NUS). This is a first study involving the application of fast NMR methods to proteins samples prepared using a specific labeling scheme. Taken together, this opens up new avenues to using the method of selective unlabeling for rapid resonance assignment of proteins.

Graphical Abstract

1. Introduction

During the last decade, there has been a growing emphasis on speeding up the structure determination process of proteins by NMR spectroscopy, especially in the context of structural genomics projects, which require high throughput structure determination [1,2,3,4]. This is due to the fact that the conventional approaches for NMR data acquisition and analysis are time consuming. Typically, protein samples enriched uniformly with 13C and/or 15N isotopes are prepared and a suite of 2D and 3D heteronuclear spectra are acquired for sequence specific resonance assignments [5]. With the conventional approach of data collection (e.g., linear sampling) this requires a few days to weeks of measurement time. Acquiring data in two different ways can accelerate this. One involves the rapid collection of multidimensional data using the recently proposed methods for fast data acquisition [1,2,3,4,6,7,8,9]. These methods reduce the time taken for data collection by an order of magnitude or more. The second approach involves augmenting the data acquired using uniformly 13C, 15N labeled protein sample with those acquired with selectively labeled/unlabeled samples [10,11,12]. Selective unlabeling or ”reverse” labeling involves the 13C/15N enrichment of all but specific chosen amino acids in a protein, which are rendered unlabeled (12C/14N) [11,13,14,15,16,17]. This helps in simplifying the NMR spectrum by reducing the number of peaks in the spectrum, and thereby, aiding unambiguous resonance assignments.
We propose here a novel approach, which combines different methods for fast data acquisition with amino acid selective unlabeling to accelerate NMR data collection and analysis. Three new NMR experiments are proposed, two of which involve G-matrix Fourier transform (GFT) NMR spectroscopy [18,19] applicable to a selectively unlabeled protein sample. The experiments together provide the chemical shifts of 15N, 1HN, 13Cα, 13Cβ, 13C′ nuclei of the C-terminal neighbor (‘i + 1’) of amino acid residue, ‘i’, which is selectively unlabeled. The experiments, namely, 2D HN(CA)(i + 1), GFT (3,2)D HNCACB(i + 1) and GFT (3,2)D HNCACO(i + 1) are further accelerated by employing non-uniform sampling (NUS) [20,21,22,23,24,25,26]. The methodology is demonstrated on a selectively unalabeled protein sample of ubiquitin. Its application to larger proteins is discussed.

2. Results

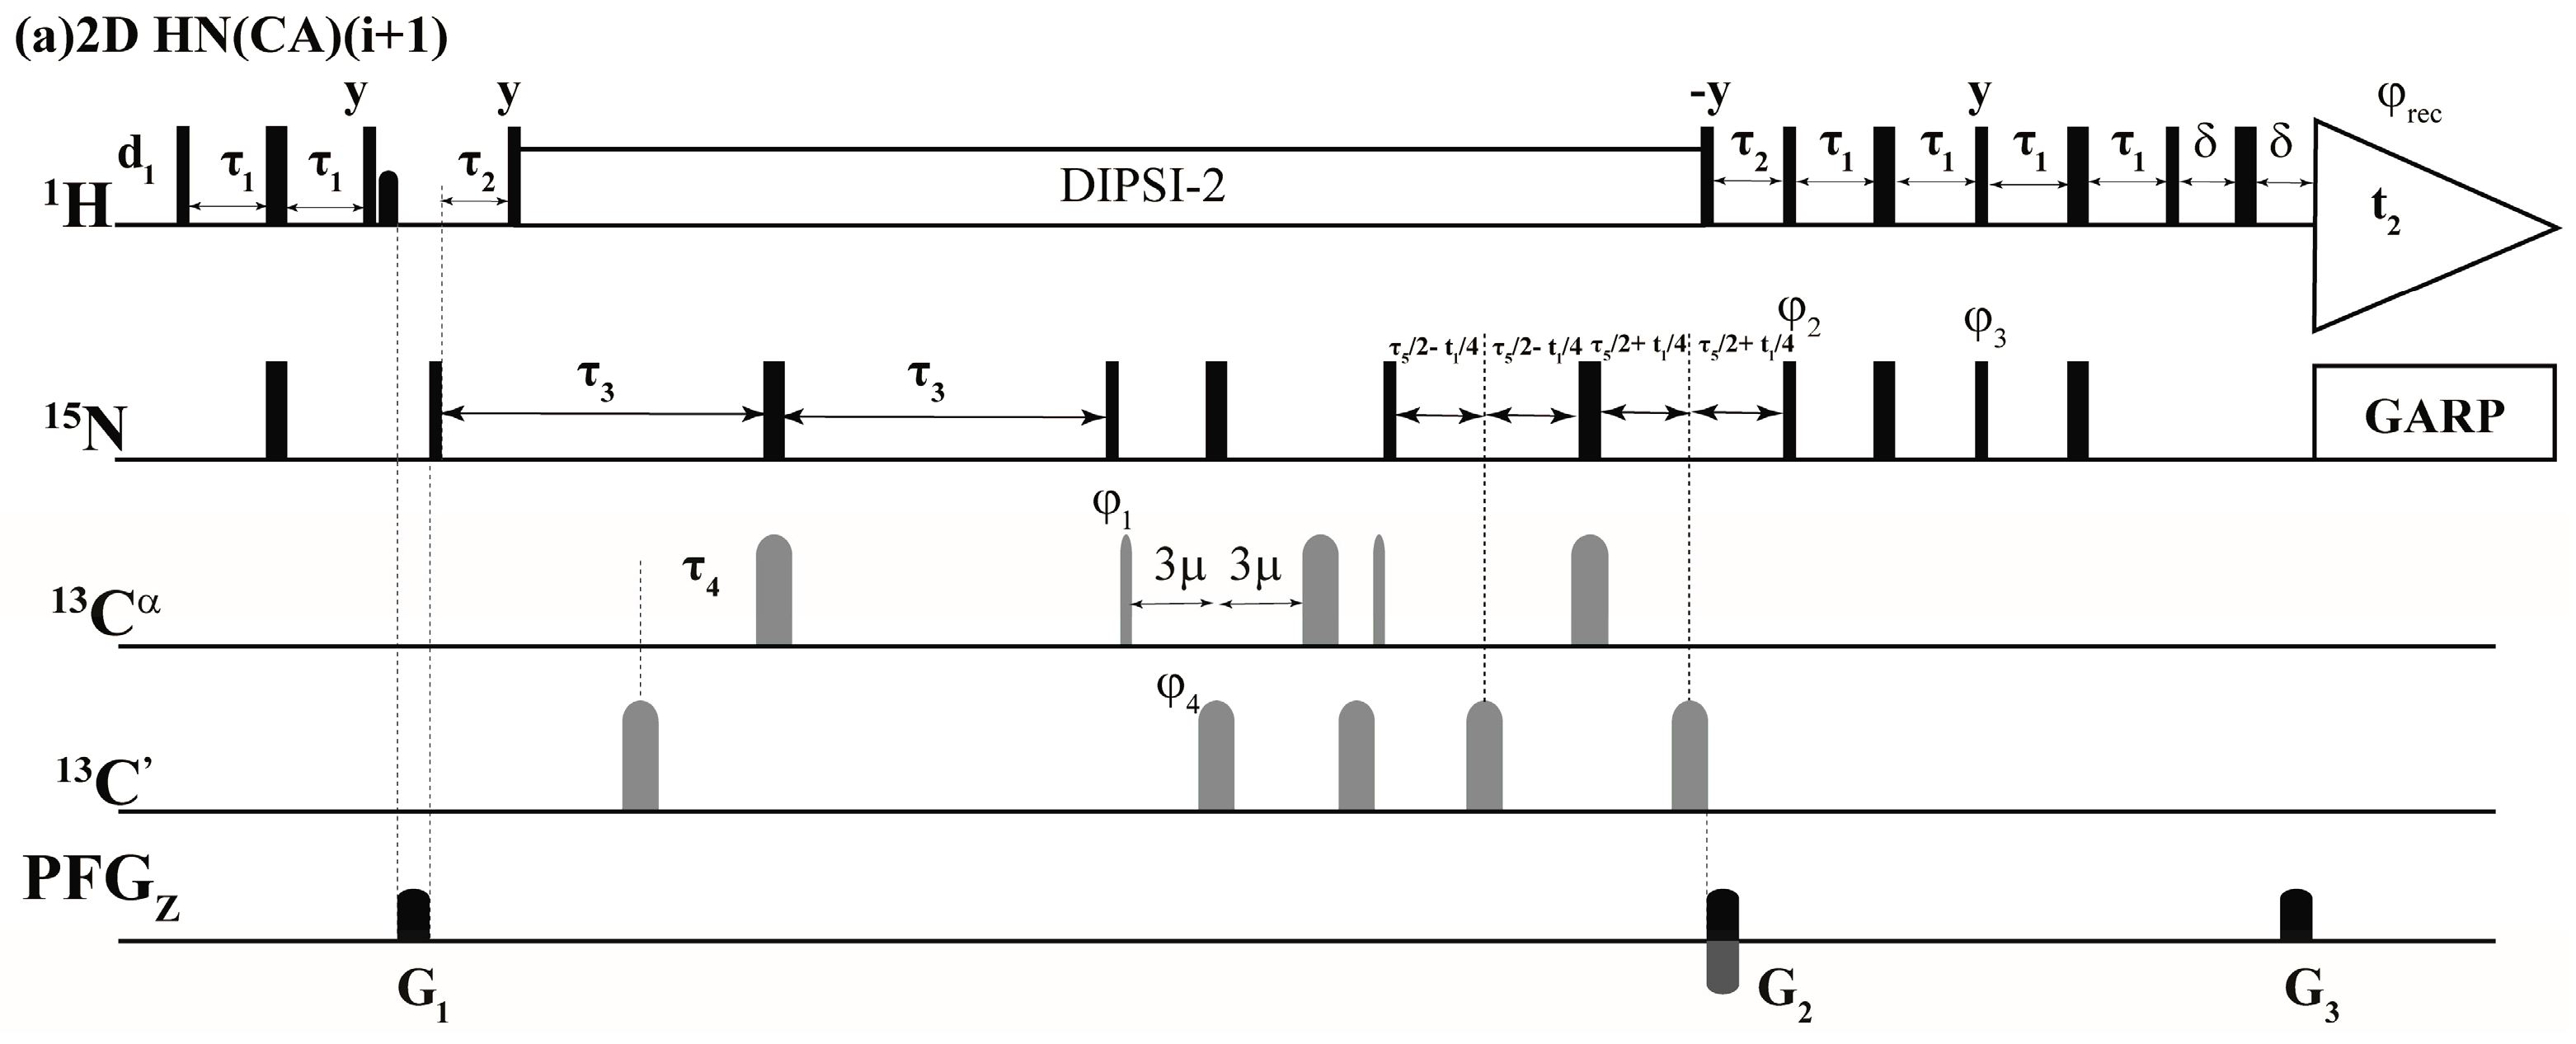
2.1. Implementation of NMR Experiments

All the experiments proposed are “HNCA” [5] based and involve the transfer of 15N magnetization of residue i + 1 (15Ni+1) to 13Cαi+1 or 13COi+1. They, however, detect selectively the resonances (1H/13C/15N) of residue i + 1 corresponding to the selectively unlabeled residue, i. This selection is achieved by tuning the delay periods in the radio frequency (r.f.) pulse sequence appropriately such that the magnetization on 15Ni+1 is attenuated by coupling to both 13COi and 13Cαi by one-bond and two-bond scalar couplings, 1JNCO (~15 Hz) and 2JNCα (~7 Hz), respectively. For this purpose, a delay period of 1/2J (J is the scalar coupling) is used which converts an in-phase magnetization of a nuclei to anti-phase magnetization with respect to its J-coupled partner. This is depicted schematically in Figure 1a. In the case where both residues i and i + 1 are 13C, 15N labeled, 15Ni+1 magnetization is attenuated by the scalar coupling evolution to 13COi and 13Cαi (passive coupling via 2JNCα). Thus, if residue i is a labeled (13C/15N) residue the chemical shift correlations from its neighbor: i + 1 are not detected. However, if the residue i among a given pair (i, i + 1) is unlabeled (i.e., 12C/14N), 15Ni+1 is coupled only to 13Cαi+1 and hence the delay period of 1/2J corresponding to 1JNCO and 2JNCα has no effect and 15Ni+1 magnetization gets selected (product operator treatment is discussed below).
The delay periods used in the r.f. pulse schemes are thus optimized to achieve minimal selection of labeled (i, i + 1) pair while maximizing the intensity of unlabeled (i)-labeled (i + 1) pair. Since the experiments are “HNCA” type, the transfer function for the desired or selected 15Ni+1 magnetization (from unlabeled i-labeled i + 1 pair) and undesired or suppressed 15Ni+1 magnetization (in case of labeled i, i + 1 pair) during the filter element ‘a’ shown in Figure 1a can be expressed (ignoring relaxation) as:
Г(selected): sin(π 1JNCα τNCα)
Г(suppressed): sin(π 1JNCα τNCα) × cos(π 2JNCα τNCα)
where τNCα is the delay period during which 15Ni+1 is coupled passively to 13Cαi via 2JNCα if residue i is labeled. Next, during this period the 15Ni+1 is also allowed to couple with 13COi (for labeled ii + 1 pair) for the duration τHNC′ (~1/21JNCO) and the transfer function above gets modified as:
Г(selected): sin(π 1JNCα τNCα)
Г(supressed): sin(π 1JNCα τNCα) × cos(π 2JNCα τNCα) × cos(π 1JNCO τNCO)
where τNCO is the delay period during which 15Ni+1 is coupled to 13COi via 1JNCO. Figure 1b depicts a plot of the transfer function as a function of τNCα delays. Also shown in the figure is a plot of ratio of Г(selected)/Г(suppressed), which is maximum for τNCα ~ 43 ms and τNCO ~ 33 ms (assuming 1JNCO = 15 Hz, 1JNCα = 11 Hz and 2JNCα = 7 Hz). Variations in 1JNCO, 1JNCα and 2JNCα among different secondary structural elements has been ignored.
The above selection scheme was implemented in the 2D HN(CA)(i + 1), GFT (3,2)D HNCACB(i + 1) and GFT (3,2)D HN(CA)CO(i + 1) the r.f. pulse schemes of which are shown in Figure 2. The first experiment, 2D HN(CA)(i + 1) provides a 2D [15Ni+1, 1Hi+1] correlation spectrum analogues to a 2D [15N, 1H] HSQC spectrum. The delay periods τNCα and τNCO in Equations (1)–(4) above correspond to 2 * τ3 and 2 * (τ3 − τ4) and, respectively. In the (3,2)D GFT experiments, for nuclei shown underlined (e.g., N and CO in (3,2)D HN(CA)CO(i + 1)), chemical shifts are jointly sampled. That is, the chemical shift evolution periods of 15N and 13CO are co-incremented resulting in sums and differences of chemical shifts [1,2,18]. Thus, the following shift correlations are detected in the GFT (ω1) dimension: (i) Ω(15Ni+1 ± κ * 13Cαi+1), Ω(15Ni+1 ± κ * 13Cβi+1) in (3,2)D HNCACB(i + 1) and (ii) Ω(15Ni+1 ± κ * 13COi+1) in (3,2)D HN(CA)CO(i + 1). The factor, κ, scales the relative shifts of 13Cαi+1, 13Cβi+1 in (3,2)D HNCACB(i + 1) and COi+1 in (3,2)D HN(CA)CO(i + 1) with respect 15Ni+1 (Figure 2). In all spectra acquired in the present study κ = 0.5 was used. The 15Ni+1 serves as the center shift and hence 2D HN(CA)(i + 1) providing [1Hi+1, 15Ni+1] shift correlations serves the central peak spectrum.

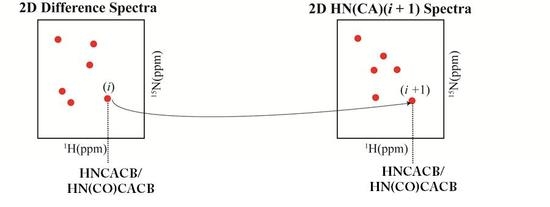
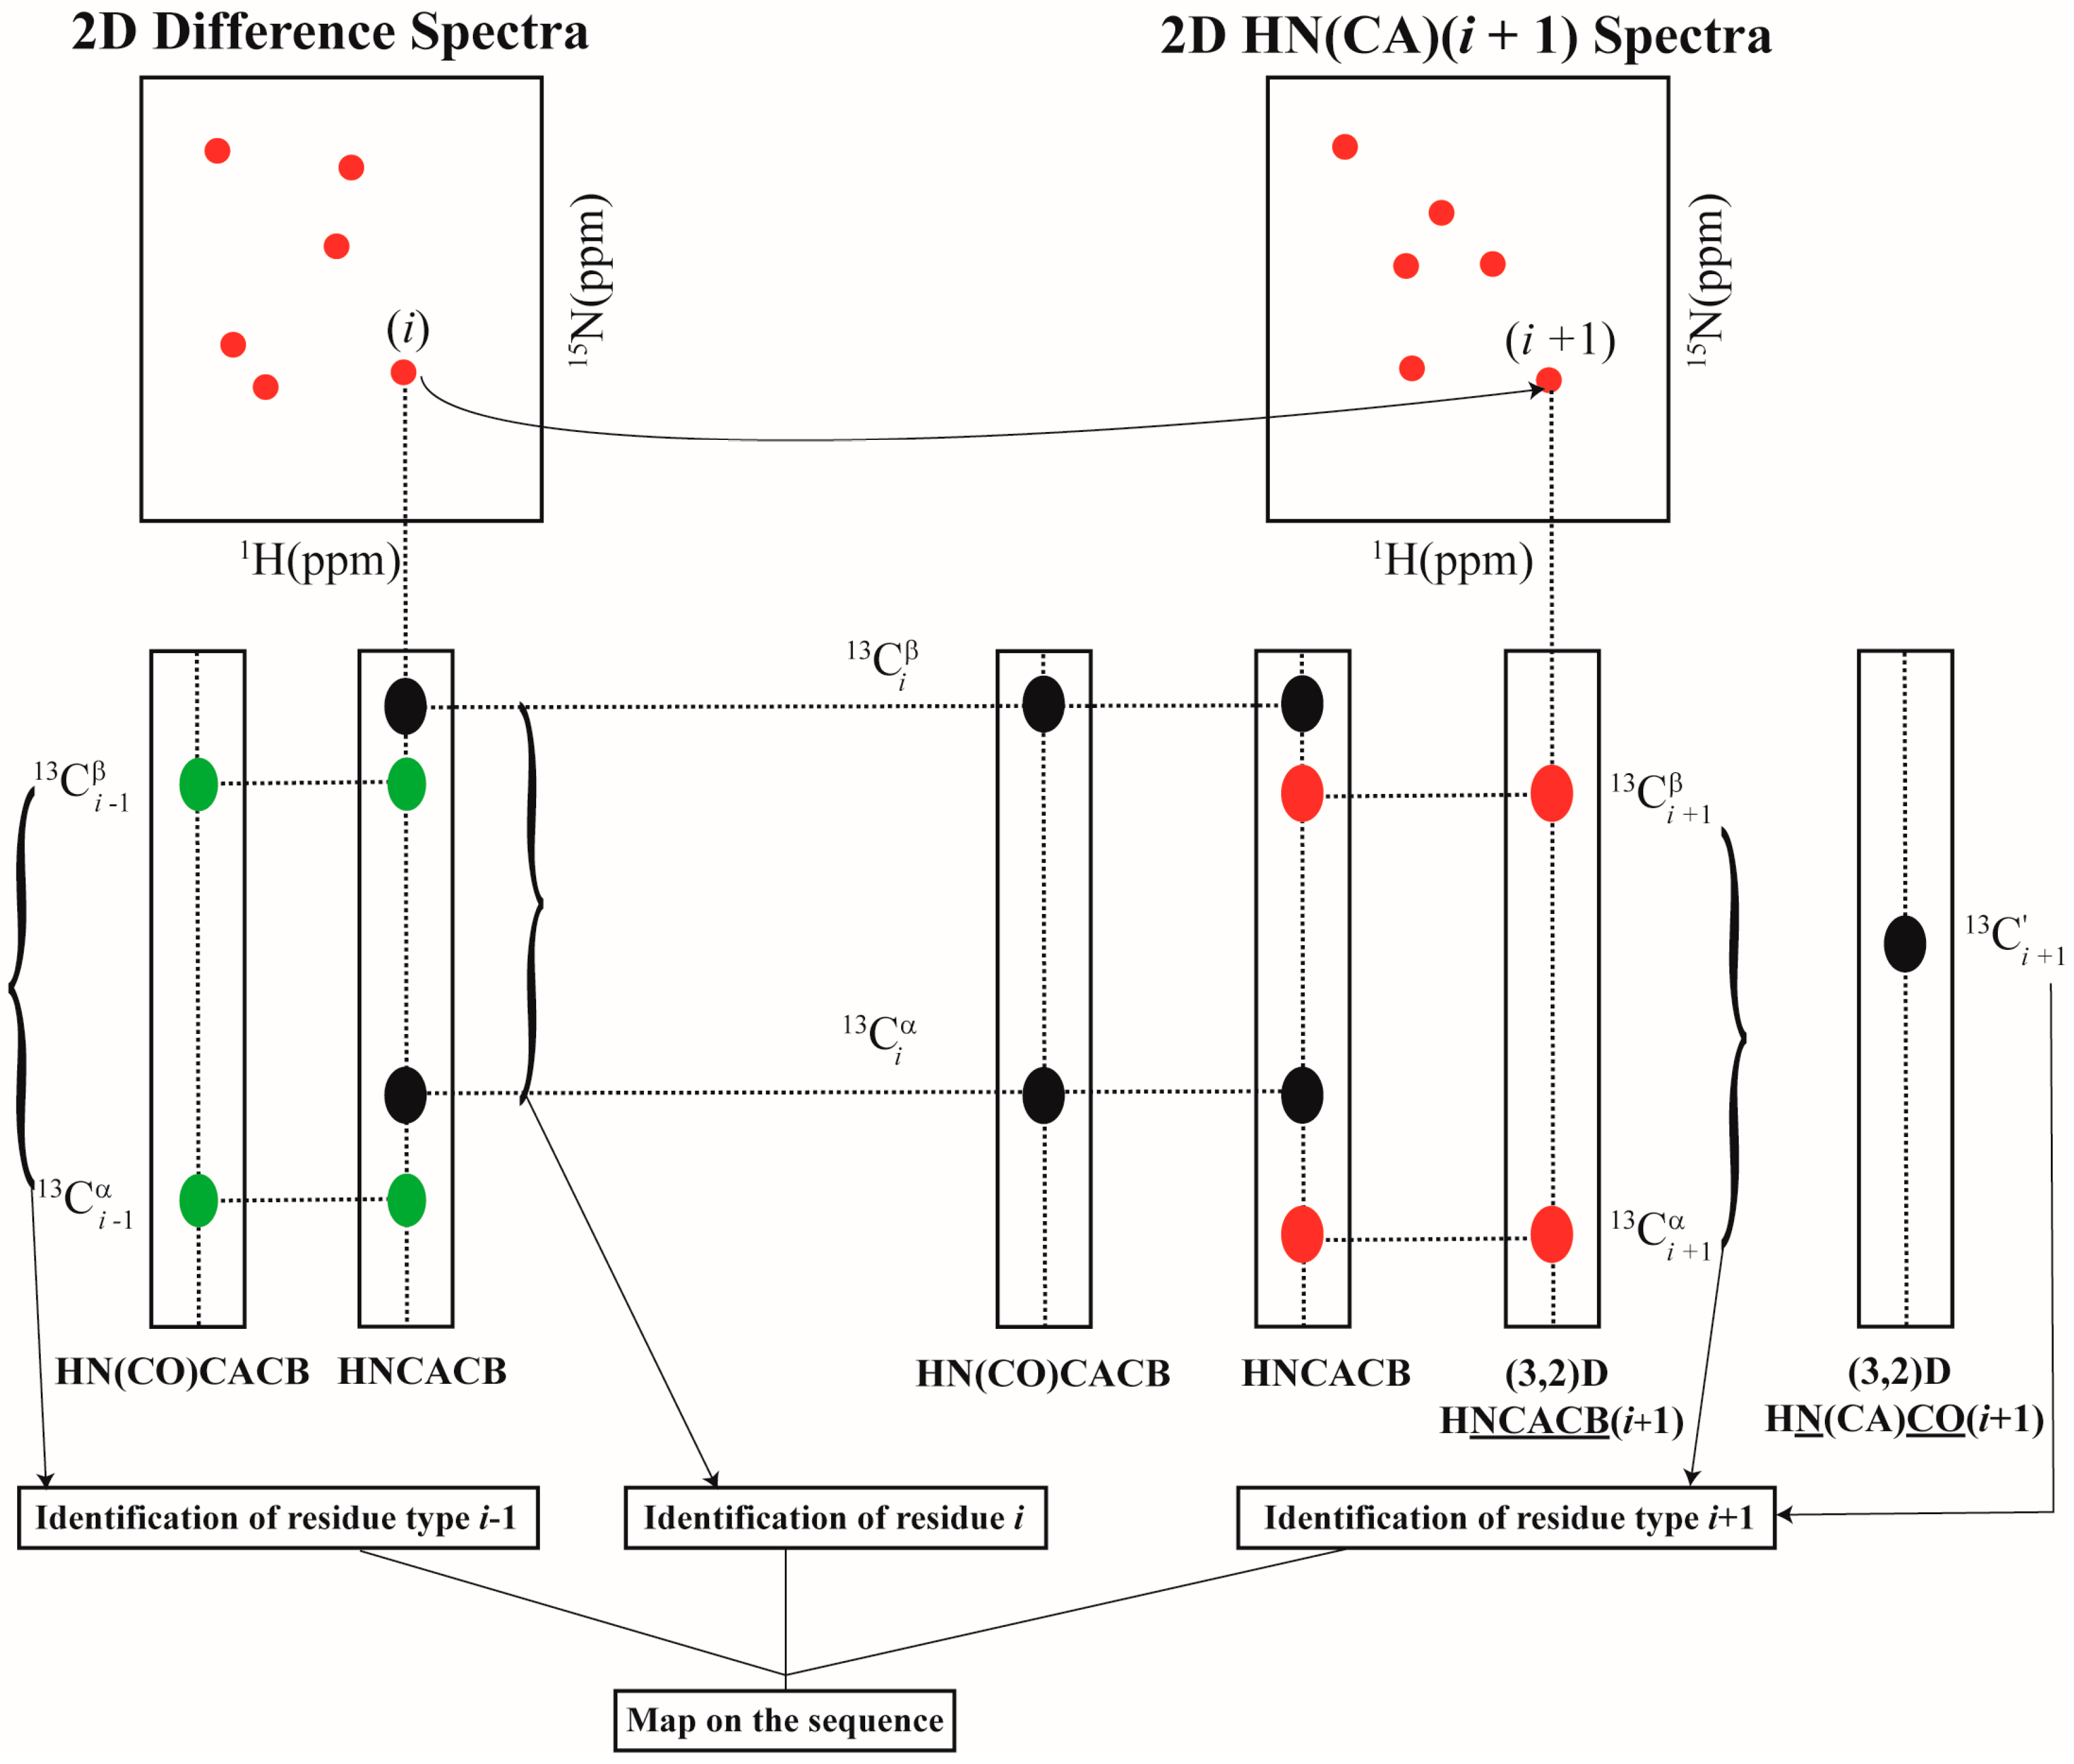
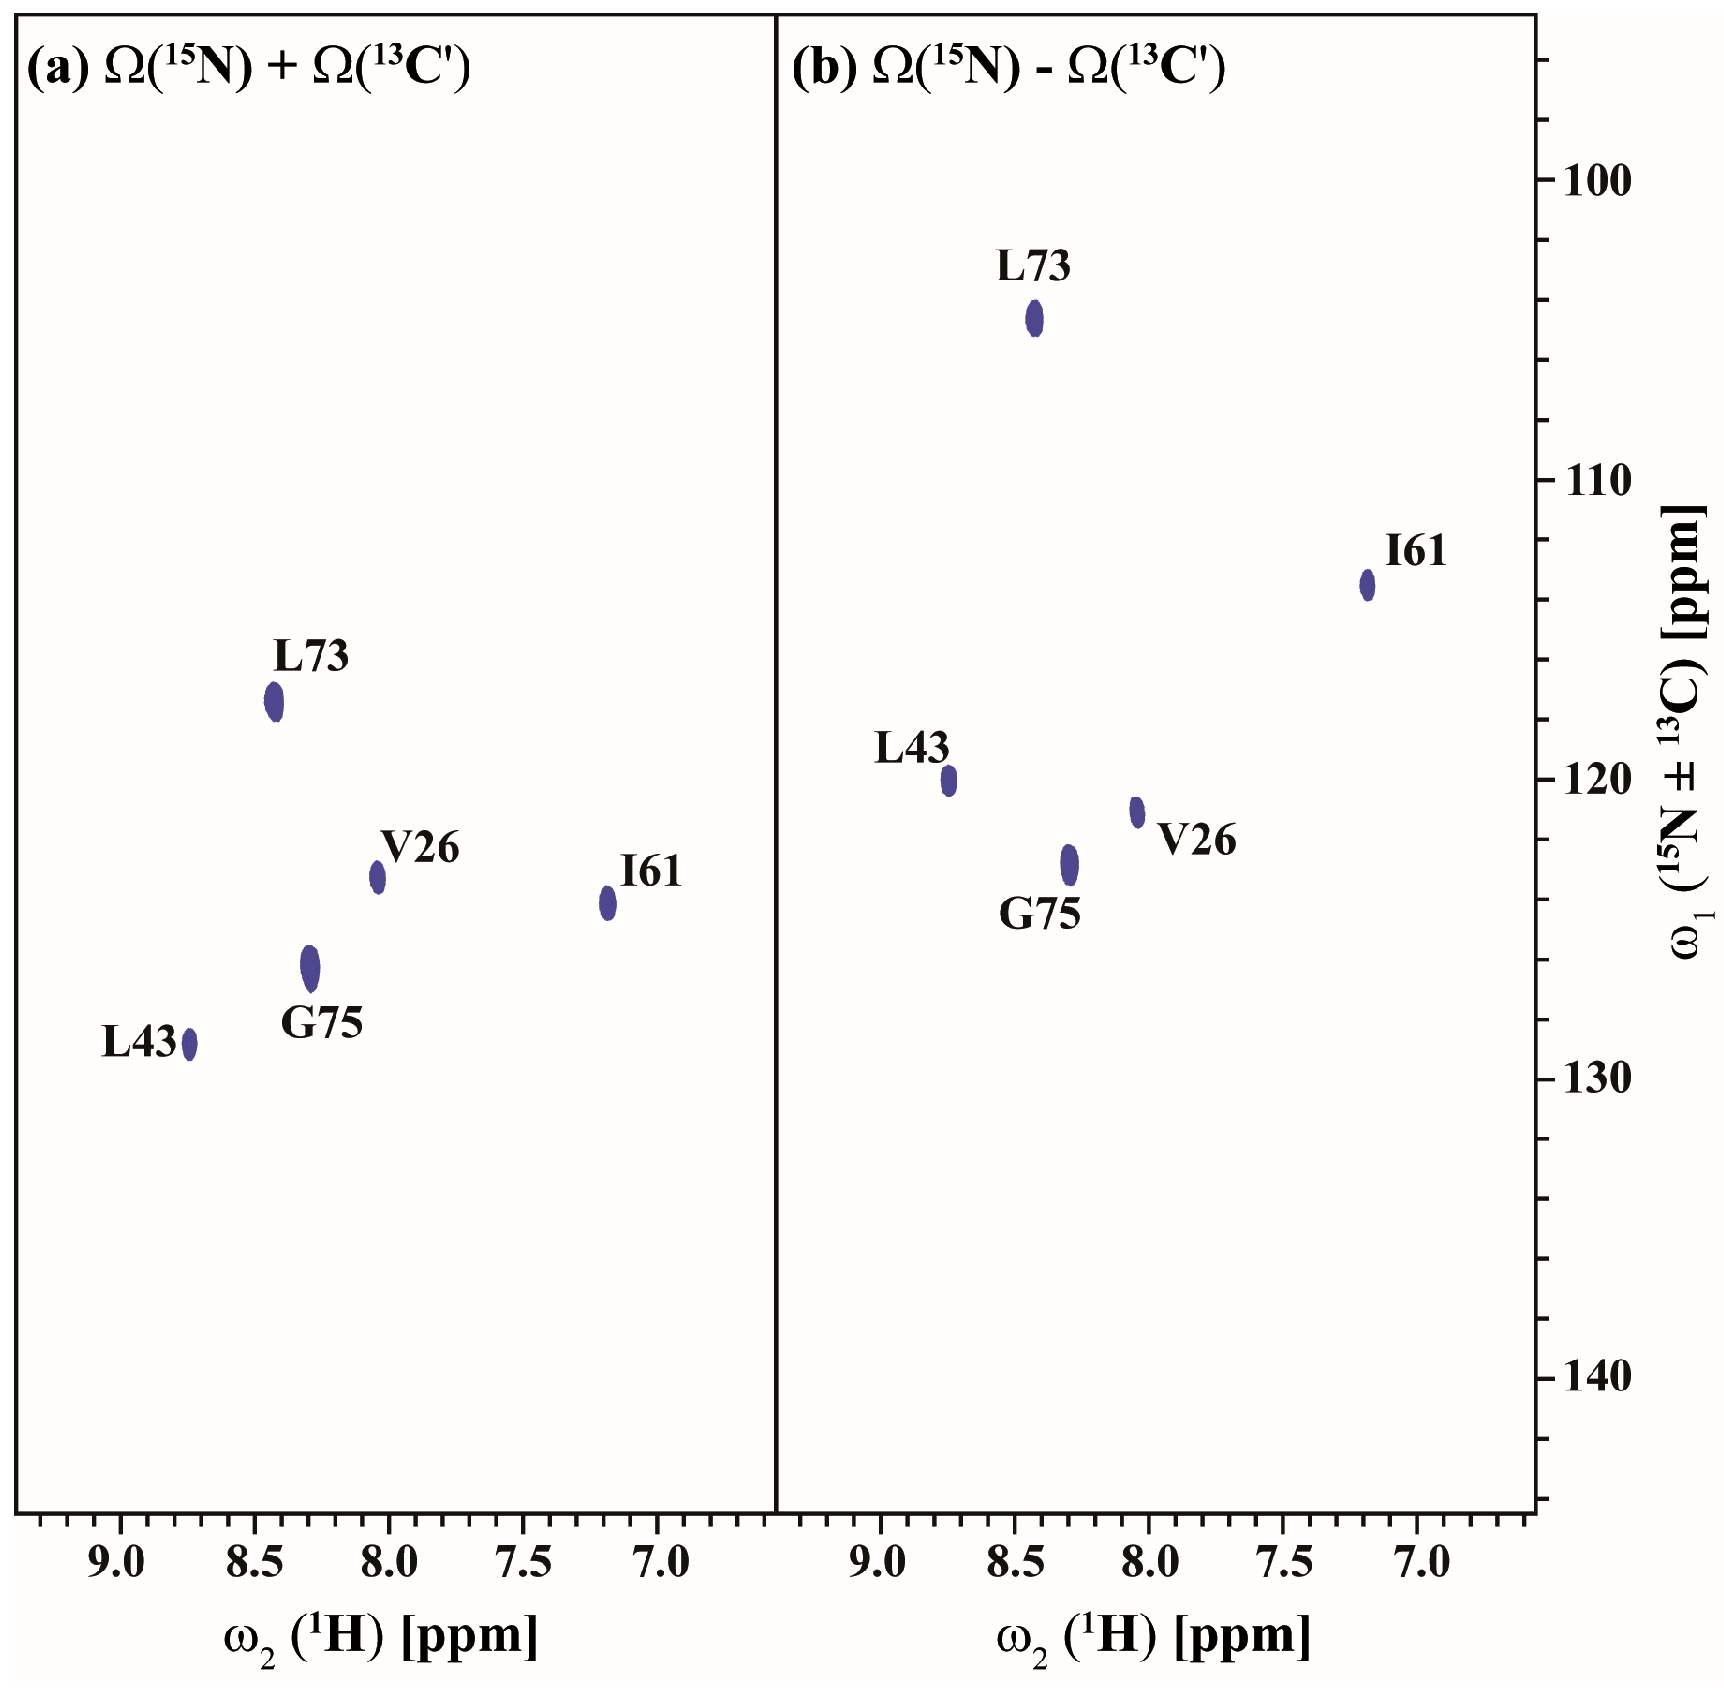
2.2. Resonance Assignment Strategy

Using the above set of experiments, resonance assignment is carried out as follows. For each [15Ni+1, 1Hi+1] chemical shifts identified in 2D HN(CA)(i + 1), the amino acid type corresponding to residue i + 1 (self) is identified using (3,2)D HNCACB(i + 1) based on 13Cαi+1, 13Cβi+1 values. Similarly using the (3,2)D HN(CA)CO(i + 1) the COi+1 shifts are identified. Once the identity of the amino acid type corresponding to i + 1 is identified, and given that the amino acid type of i is known which is selectively unlabeled, the dipeptide pair ii + 1 can be mapped onto the primary sequence for sequence-specific resonance assignment. Note that this is approach, that is different from the conventional strategy where the di-peptide pairs ii − 1 are identified using 3D HNCACB and 3D CBCA(CO)NH for given residue i. Thus, the GFT experiments using selectively unlabeling can augment the conventional assignment approach resulting in a tri-peptide stretch (i − 1, i, i + 1) around a selectively unlabeled residue i. This is depicted in Figure 3. The experiments presented here thus increase the assignment speed compared to the approach presented earlier which did not yield directly the 13Cαi+1, 13Cβi+1 shifts.
In a given sample, more than one amino acid type can be chosen for simultaneous selective unlabeling so that the number of samples to be prepared is minimized. Two or more amino acid types are chosen for selectively unlabeling such that their 13Cβi+1 shifts lie in distinct spectral regions enabling their type identification. For instance, in the current study, Arg and Asn were used for selective unlabeling in the same sample due to their distinct 13Cβi+1 shifts. However, in such cases the [15Ni+1, 1Hi+1] pair of shifts obtained from 2D HN(CA)(i + 1) do not provide any information directly on the type of amino acid residue i. Hence, a 3D CBCA(CO)NH spectrum acquired on the uniformly 13C, 15N labeled sample is needed. In the 3D CBCA(CO)NH spectrum, at a given [15Ni+1, 1Hi+1] pair of shifts, the amino acid type corresponding to residue i can be identified based on 13Cαi, 13Cβi values (Figure 3).

2.3. Data Acquisition Using Non-Uniform Sampling (NUS)

The measurement time required for acquiring the GFT spectra can be reduced further by using the non-uniform sampling (NUS) approach [24,25,26]. The NUS approach is based on the premise that the conventional method involving linear sampling of interferogram in the inderct dimension requires a lot more number of points although the number of frequencies encoded in the interferogram is much less. Thus, by reducing the number of sampling points in the indirect dimensions the total measurement time can be proportionately reduced. The dataset obtained using NUS is then reconstructed either in the time domain using the multiway decomposition method (MDD) or directly in the frequency domain using the maximum entropy reconstruction (MER) approach. The sampling points are chosen based on the decay of the Free Induction Decay (FID). In case of a constant time experiment, the NUS points can be chosen randomly. In the present study, the MDD approach was used for spectral reconstruction in the time domain. The data were acquired a random sampling of 25% of the points (i.e., the omission of 75% of the time domain points) in the GFT dimension.
Figure 4a shows an overlay of the 2D [15N, 1H] HSQC spectrum of the uniformly 13C, 15N labeled (shown in red) and Arg, Asn selectively unlabeled (in blue) ubiquitin. The resonances, which are absent in the selectively unlabeled sample, corresponding to Arg and Asn residues as indicated. No other residues were observed to be absent indicating minimal mis-incorporation of 14N isotope of Arg and Asn (also referred to as ‘isotope scrambling’). Figure 4b shows 2D HN(CA)(i + 1) spectrum acquired on the Arg, Asn selectively unlabeled sample. All expected [15Ni+1, 1Hi+1] correlations are observed in the spectrum as indicated.
Figure 5 and Figure 6 show the (3,2)D HNCACB(i + 1) and (3,2)D HN(CA)CO(i + 1) of Arg, Asn selectively unlabeled sample of ubiquitin acquired in 54 and 35 min with 8 scans each for both datasets, respectively. All expected 13Cαi+1, 13Cβi+1 and 13COi+1 correlations except that of 55T are observed. The correlation of 55T is presumably absent due to its weak intensity in the HSQC spectrum and shorter transverse relaxation time of its 13C nuclei. The 13Cαi+1, 13Cβi+1 and 13COi+1 chemical shifts values are obtained by linearly combining the sums and differences of the chemical shifts observed in the two GFT sub-spectra of each experiment and taking into account the appropriate scaling factor. Note that a 3D spectrum with an equivalent resolution would have taken more than 3 days of measurement time (2 days 7 h 9 min for 3D HNCACB(i + 1) and 19 h 23 min for 3D HN(CA)CO(i + 1)). Thus, the GFT experiments potentially reduce the measurement time by about an order of magnitude.
The acquisition of GFT spectra is further accelerated using the NUS approach. Figure 7 and Figure 8 show the 25% NUS spectrum of (3,2)D HNCACB(i + 1) and (3,2)D HN(CA)CO(i + 1) experiments acquired in less than 14 and 9 min respectively. All expected correlations as observed in the non-NUS counterparts are observed without any spectral distortions or artifacts. The signal-to-noise ratio (S/N) by NUS is not compromised as shown in Figure 7c,d and Figure 8c,d which compares the 1D traces from the non-NUS and NUS GFT data.

3. Discussion

Amino acid selective unlabeling has been shown to be a robust, easy and cost-effective method for simplifying NMR spectrum and obtaining useful structural information in proteins [11,15,27,28,29,30]. On the other hand, GFT NMR is a powerful technique for speeding up NMR data acquisition and has been shown to be useful in various applications [2,18,19,31,32,33,34,35,36,37,38,39,40,41,42,43,44,45,46]. In the present study, the application of two fast NMR methods, namely GFT NMR and non-uniform sampling to selectively unlabeled protein samples expands the repertoire of applications possible with selective unlabeling. In our previous study, we reported an experiment for identification of [15Ni+1, 1Hi+1] shifts based on a 2D 12CO-filtered [15N, 1H] HSQC. The new experiment proposed herein, namely, 2D HN(CA)(i + 1) improves upon the selection of unlabeled (i)-labeled (i + 1) pair by incorporating two filters simultaneously. That is, attenuating the 15Ni+1 magnetization by allowing its scalar coupling to both 13COi and 13Cαi. The delay periods used in the r.f. pulse sequences are appropriately tuned to achieve the desired selection. The only limitation of the approach is the additional sample requirement. Additionally, not all the amino acids can be used for unlabeling as cross metabolism is an issue. However, we have extensively studied on the cross metabolism issue and came up with excellent solutions of many different combinations of amino acids which can be used as starting point. These combinations greatly cover a large percentage of residues in the sequences and the resonance assignment strategies can be simplified to a large extent. Considering the cost-effective solution this approach is much better than selective labeling as the cross metabolism is also an issue there.
Having thus achieved a selection of [15Ni+1, 1Hi+1] resonances, the application of GFT NMR and NUS methodology helps to provide high dimensional spectral information, namely 13Cαi+1, 13Cβi+1 and 13COi+1 correlations, rapidly. The two (3,2)D GFT experiments proposed thus augment the conventional assignment strategy involving 3D HNCACB and 3D CBCA(CO)NH without severely increasing the overall measurement time. Further, the information obtained can be used for automated resonance assignment strategies to speed up data analysis. Since the experiments are based on the “HNCA” based approach, the methodology can be extended in a straightforward manner to detect 1Hα or measure scalar/dipolar couplings, which involve HNCA type editing.

4. Materials and Methods

4.1. Sample Preparation

The plasmid (PGLUB) coding for ubiquitin was transformed into E. coli BL21 cells (New England Biolabs, Ipswich, MA, USA). Cells were grown at 37 °C in M9 medium containing 1 g/L of 15NH4Cl (Cambridge Isotope Laboratories, Tewksbury, MA, USA) and 4 g/L of 13C-Glucose (Cambridge Isotope Laboratories, Tewksbury, MA, USA). For selective unlabeling, 1.0 g/L each of desired unlabeled amino acid(s): Arg and Asn (stock solution of 1.0 g in 50 mL of H2O was prepared and filter sterilized) was added to the growth medium. To induce protein expression, 1.0 mM isopropyl β-d-thiogalactoside (IPTG) (Sigma-Aldrich, St. Louis, MO, USA) was added at midlog phase (O.D600 ~ 0.6). Cells were harvested by centrifugation and suspended in acetate buffer (5 mM EDTA (Sigma-Aldrich, St. Louis, MO, USA), 50 mM Na acetate (Sigma-Aldrich, St. Louis, MO, USA), pH 5) and taken up for sonication. Following sonication, the supernatant containing the protein was loaded on to a pre-equilibrated ion exchange column (SP Sepharose fast flow from GE) and the protein eluted with a salt gradient of 0–0.6 M NaCl. The protein sample was further purified using size-exclusion chromatography with Superdex 75 (Sigma-Aldrich, St. Louis, MO, USA). For NMR data acquisition, a sample containing ~1.0 mM of protein in 50 mM phosphate buffer (10% 2H2O, pH 6.0) was prepared.

4.2. NMR Data Collection

All NMR data were acquired at 298 K on a Bruker Avance 800 MHz NMR spectrometer (Billerica, MA, USA) equipped with a room temperature triple resonance probe with a z-axis shielded gradient. Data were processed with NMRPipe [47] and analyzed using XEASY [48].

5. Conclusions

Three new NMR experiments are presented which are applicable to protein samples prepared with amino acid selective unlabeling. The experiments provide 15N, 1HN, 13Cα, 13Cβ, 13C′ chemical shifts for amino acid residues which are immediate C-terminal neighbors (i + 1) of selectively unlabeled residues. Two of the experiments provide 3D shift correlations rapidly using the methodology of GFT NMR and non-uniform sampling. The data acquisition time can be further reduced using the method of longitudinal 1H relaxation optimization [19]. The spectral simplification obtained combined with rapid data collection will help in reducing the time required for data analysis. In addition to resonance assignments, the proposed methodology can also be used for studies such as protein-ligand and protein-protein interactions, which involve monitoring the changes in shifts of certain residues against a background of unshifted resonances. Taken together, the proposed methodology expands the repertoire of applications possible with amino acid selective unlabeling for rapid protein structural studies.

Acknowledgments

The facilities provided by NMR Research Centre at IISc supported by Department of Science and Technology (DST), India is gratefully acknowledged. K.C. acknowledges support from DST Inspire Faculty Scheme (IFA 13-CH 106). H.S.A. acknowledges support from DBT and DAE-BRNS research awards.

Author Contributions

H.S.A. and K.C. conceived and designed the experiments; B.K. and K.C. performed the experiments and analyzed the data; B.K., K.C. and H.S.A. wrote the paper.

Conflicts of Interest

The authors declare no conflict of interest.

References

  1. Atreya, H.S.; Szyperski, T. Rapid NMR data collection. Methods Enzymol. 2005, 394, 78–108. [Google Scholar] [PubMed]
  2. Szyperski, T.; Atreya, H.S. Principles and applications of GFT projection NMR spectroscopy. Magn. Reson. Chem. 2006, 44, S51–S60. [Google Scholar] [CrossRef] [PubMed]
  3. Schanda, P. Fast-pulsing longitudinal relaxation optimized techniques: Enriching the toolbox of fast biomolecular NMR spectroscopy. Prog. NMR Spectrosc. 2009, 55, 238–265. [Google Scholar] [CrossRef]
  4. Felli, I.C.; Brutscher, B. Recent Advances in Solution NMR: Fast Methods and Heteronuclear Direct Detection. ChemPhysChem 2009, 10, 1356–1368. [Google Scholar] [CrossRef] [PubMed]
  5. Cavanagh, J.; Fairbrother, W.J.; Palmer, A.G.; Skelton, N.J. Protein NMR Spectroscopy; Academic Press: San Diego, CA, USA, 1996. [Google Scholar]
  6. Pudakalakatti, S.; Chandra, K.; Thirupathi, R.; Atreya, H.S. Rapid Characterization of Molecular Diffusion by NMR. Chem. Eur. J. 2014, 20, 15719–15722. [Google Scholar] [CrossRef] [PubMed]
  7. Mulleti, S.; Singh, A.; Brahmkhatri, V.P.; Chandra, K.; Raza, T.; Mukherjee, S.P.; Seelamantula, C.S.; Atreya, H.S. Super-resolved nuclear magnetic resonance spectroscopy. Sci. Rep. 2017, 7, 9651. [Google Scholar]
  8. Khaneja, N.; Dubey, A.; Atreya, H.S. Ultra broadband NMR spectroscopy using multiple rotating frame technique. J. Magn. Reson. 2016, 265 (Suppl. C), 117–128. [Google Scholar] [CrossRef] [PubMed]
  9. Atreya, H.S. Isotope labeling in Biomolecular NMR. In Advances in Experimental Medicine and Biology; Springer: Amsterdam, The Netherlands, 2012; pp. 1–219. [Google Scholar]
  10. Krishnarjuna, B.; Jaipuria, G.; Thakur, A.; D’Silva, P.; Atreya, H.S. Amino acid selective unlabeling for sequence specific resonance assignments in proteins. J. Biomol. NMR 2011, 49, 39–51. [Google Scholar] [CrossRef] [PubMed]
  11. Prasanna, C.; Dubey, A.; Atreya, H.S. Amino acid selective unlabeling in protein nmr spectroscopy. In Methods in Enzymology; Kelman, Z., Ed.; Academic Press: Cambridge, MA, USA, 2015; pp. 167–189. [Google Scholar]
  12. Vuister, G.W.; Kim, S.J.; Wu, C.; Bax, A. 2D and 3D NMR-Study of Phenylalanine Residues in Proteins by Reverse Isotopic Labeling. J. Am. Chem. Soc. 1994, 116, 9206–9210. [Google Scholar] [CrossRef]
  13. Shortle, D. Assignment of amino acid type in 1H-15N correlation spectra by labeling with 14N-amino acids. J. Magn. Reson. 1994, 105, 88–90. [Google Scholar] [CrossRef]
  14. Atreya, H.S.; Chary, K.V.R. Amino acid selective ‘unlabelling’ for residue-specific NMR assignments in proteins. Curr. Sci. 2000, 79, 504–507. [Google Scholar]
  15. Atreya, H.S.; Chary, K.V.R. Selective ‘unlabeling’ of amino acids in fractionally 13C labeled proteins: An approach for stereospecific NMR assignments of CH3 groups in Val and Leu residues. J. Biomol. NMR 2001, 19, 267–272. [Google Scholar] [CrossRef] [PubMed]
  16. Dubey, A.; Kadumuri, R.V.; Jaipuria, G.; Vadrevu, R.; Atreya, H.S. Rapid NMR assignments of proteins by using optimized combinatorial selective unlabeling. ChemBioChem 2016, 17, 334–340. [Google Scholar] [CrossRef] [PubMed]
  17. Kim, S.; Szyperski, T. GFT NMR, a new approach to rapidly obtain precise high-dimensional NMR spectral information. J. Am. Chem. Soc. 2003, 125, 1385–1393. [Google Scholar] [CrossRef] [PubMed]
  18. Atreya, H.S.; Szyperski, T. G-matrix Fourier transform NMR spectroscopy for complete protein resonance assignment. Proc. Natl. Acad. Sci. USA 2004, 101, 9642–9647. [Google Scholar] [CrossRef] [PubMed]
  19. Orekhov, V.Y.; Ibraghimov, I.V.; Billeter, M. MUNIN: A new approach to multi-dimensional NMR spectra interpretation. J. Biomol. NMR 2001, 20, 49–60. [Google Scholar] [CrossRef] [PubMed]
  20. Orekhov, V.Y.; Ibraghimov, I.; Billeter, M. Optimizing resolution in multidimensional NMR by three-way decomposition. J. Biomol. NMR 2003, 27, 165–173. [Google Scholar] [CrossRef] [PubMed]
  21. Rovnyak, D.; Frueh, D.P.; Sastry, M.; Sun, Z.Y.J.; Stern, A.S.; Hoch, J.C.; Wagner, G. Accelerated acquisition of high resolution triple-resonance spectra using non-uniform sampling and maximum entropy reconstruction. J. Magn. Reson. 2004, 170, 15–21. [Google Scholar] [CrossRef] [PubMed]
  22. Hoch, J.C.; Stern, A.S. Maximum entropy reconstruction, spectrum analysis and deconvolution in multidimensional nuclear magnetic resonance. In Nuclear Magnetic Resonance of Biologica Macromolecules; Academic Press: Cambridge, MA, USA, 2001; Part A; pp. 159–178. [Google Scholar]
  23. Hoch, J.C.; Maciejewski, M.W.; Filipovic, B. Randomization improves sparse sampling in multidimensional NMR. J. Magn. Reson. 2008, 193, 317–320. [Google Scholar] [CrossRef] [PubMed]
  24. Jaravine, V.A.; Orekhov, V.Y. Targeted acquisition for real-time NMR spectroscopy. J. Am. Chem. Soc. 2006, 128, 13421–13426. [Google Scholar] [CrossRef] [PubMed]
  25. Tugarinov, V.; Kay, L.E.; Ibraghimov, I.; Orekhov, V.Y. High-resolution four-dimensional H-1-C-13 NOE spectroscopy using methyl-TROSY, sparse data acquisition, and multidimensional decomposition. J. Am. Chem. Soc. 2005, 127, 2767–2775. [Google Scholar] [CrossRef] [PubMed]
  26. Rasia, R.M.; Brutscher, B.; Plevin, M.J. Selective isotopic unlabeling of proteins using metabolic precursors: Application to NMR assignment of intrinsically disordered proteins. ChemBioChem 2012, 13, 732–739. [Google Scholar] [CrossRef] [PubMed]
  27. Kelly, M.J.S.; Krieger, C.; Ball, L.J.; Yu, Y.; Richter, G.; Schmieder, P.; Bacher, A.; Oschkinat, H. Application of amino acid type-specific 1H and 14N labeling in a 2H-, 15N-labeled background to a 47 kDa homodimer: Potential for NMR structure determination of large proteins. J. Biomol. NMR 1999, 14, 79–83. [Google Scholar] [CrossRef] [PubMed]
  28. Mohan, P.M.K.; Barve, M.A.; Chatteljee, A.; Ghosh-Roy, R.V. Hosur, NMR comparison of the native energy landscapes of DLC8 dimer and monomer. Biophys. Chem. 2008, 134, 10–19. [Google Scholar] [CrossRef] [PubMed]
  29. Tugarinov, V.; Kay, L.E. Stereospecific NMR assignments of prochiral methyls, rotameric states and dynamics of valine residues in malate synthase G. J. Am. Chem. Soc. 2004, 126, 9827–9836. [Google Scholar] [CrossRef] [PubMed]
  30. Mukherjee, S.; Mustafi, S.M.; Atreya, H.S.; Chary, K.V.R. Measurement of 1J(Ni,Cαi), 1J(Ni,C′i−1), 2J(Ni,Cαi−1), 2J(HNi,C′i−1) and 2J(HNi,Cαi) values in 13C/15N-labeled proteins. Magn. Reson. Chem. 2005, 43, 326–329. [Google Scholar] [CrossRef] [PubMed]
  31. Rout, M.; Mishra, P.; Atreya, H.S.; Hosur, R.V. Reduced dimensionality 3D HNCAN for unambiguous HN, CA and N assignments in proteins. J. Magn. Reson. 2012, 216, 161–168. [Google Scholar] [CrossRef] [PubMed]
  32. Chandra, K.; Jaipuria, G.; Shet, D.; Atreya, H.S. Efficient sequential assignments in proteins with reduced dimensionality 3D HN(CA)NH. J. Biomol. NMR 2011, 52, 115–126. [Google Scholar] [CrossRef] [PubMed]
  33. Franks, W.T.; Atreya, H.S.; Szyperski, T.; Rienstra, C.M. GFT projection NMR spectroscopy for proteins in the solid state. J. Biomol. NMR 2010, 48, 213–223. [Google Scholar] [CrossRef] [PubMed]
  34. Jaipuria, G.; Thakur, A.; D’Silva, P.; Atreya, H.S. High-resolution methyl edited GFT NMR experiments for protein resonance assignments and structure determination. J. Biomol. NMR 2010, 48, 137–145. [Google Scholar] [CrossRef] [PubMed]
  35. Swain, M.; Atreya, H.S. CSSI-PRO: A method for secondary structure type editing, assignment and estimation in proteins using linear combination of backbone chemical shifts. J. Biomol. NMR 2009, 44, 185–194. [Google Scholar] [CrossRef] [PubMed]
  36. Barnwal, R.P.; Atreya, H.S.; Chary, K.V.R. Chemical shift based editing of CH3 groups in fractionally C-13-labelled proteins using GFT (3,2)D CT-HCCH-COSY: Stereospecific assignments of CH3 groups of Val and Leu residues. J. Biomol. NMR 2008, 42, 149–154. [Google Scholar] [CrossRef] [PubMed]
  37. Barnwal, R.P.; Rout, A.K.; Atreya, H.S.; Chary, K.V.R. Identification of C-terminal neighbours of amino acid residues without an aliphatic C-13(gamma) supercript stop as an aid to NMR assignments in proteins. J. Biomol. NMR 2008, 41, 191–197. [Google Scholar] [CrossRef] [PubMed]
  38. Barnwal, R.P.; Rout, A.K.; Chary, K.V.R.; Atreya, H.S. Rapid measurement of pseudocontact shifts in paramagnetic proteins by GFT NMR spectroscopy. Open Magn. Reson. J. 2008, 1, 16–28. [Google Scholar] [CrossRef]
  39. Zhang, Q.; Atreya, H.S.; Kamen, D.E.; Girvin, M.E.; Szyperski, T. GFT projection NMR based resonance assignment of membrane proteins: Application to subunit c of E. coli F1F0 ATP synthase in LPPG micelles. J. Biomol. NMR 2008, 40, 157–163. [Google Scholar] [CrossRef] [PubMed]
  40. Atreya, H.S.; Garcia, E.; Shen, Y.; Szyperski, T. J-GFT NMR for precise measurement of mutually correlated nuclear spin-spin couplings. J. Am. Chem. Soc. 2007, 129, 680–692. [Google Scholar] [CrossRef] [PubMed]
  41. Barnwal, R.P.; Rout, A.K.; Chary, K.V.R.; Atreya, H.S. Rapid measurement of 3J(HN-Hα) and 3J(N-Hβ) coupling constants in polypeptides. J. Biomol. NMR 2007, 39, 259–263. [Google Scholar] [CrossRef] [PubMed]
  42. Atreya, H.S.; Eletsky, A.; Szyperski, T. Resonance assignment of proteins with high shift degeneracy based on 5D spectral information encoded in G2FT NMR experiments. J. Am. Chem. Soc. 2005, 127, 4554–4555. [Google Scholar] [CrossRef] [PubMed]
  43. Eletsky, A.; Atreya, H.S.; Liu, G.H.; Szyperski, T. Probing structure and functional dynamics of (large) proteins with aromatic rings: L-GFT-TROSY (4,3)D HCCHNMR spectroscopy. J. Am. Chem. Soc. 2005, 127, 14578–14579. [Google Scholar] [CrossRef] [PubMed]
  44. Liu, G.H.; Aramini, J.; Atreya, H.S.; Eletsky, A.; Xiao, R.; Acton, T.; Ma, L.C.; Montelione, G.T.; Szyperski, T. GFT NMR based resonance assignment for the 21 kDa human protein UFC1. J. Biomol. NMR 2005, 32, 261. [Google Scholar] [CrossRef] [PubMed]
  45. Liu, G.H.; Shen, Y.; Atreya, H.S.; Parish, D.; Shao, Y.; Sukumaran, D.K.; Xiao, R.; Yee, A.; Lemak, A.; Bhattacharya, A.; et al. NMR data collection and analysis protocol for high-throughput protein structure determination. Proc. Natl. Acad. Sci. USA 2005, 102, 10487–10492. [Google Scholar] [CrossRef] [PubMed]
  46. Shen, Y.; Atreya, H.S.; Liu, G.H.; Szyperski, T. G-matrix Fourier transform NOESY-based protocol for high-quality protein structure determination. J. Am. Chem. Soc. 2005, 127, 9085–9099. [Google Scholar] [CrossRef] [PubMed]
  47. Delaglio, F.; Grzesiek, S.; Vuister, G.W.; Zhu, G.; Pfeifer, J.; Bax, A. NMRpipe—A Multidimensional Spectral Processing System Based on Unix Pipes. J. Biomol. NMR 1995, 6, 277–293. [Google Scholar] [CrossRef] [PubMed]
  48. Bartels, C.; Xia, T.H.; Billeter, M.; Güntert, P.; Wüthrich, K. The Program Xeasy for Computer-Supported NMR Spectral-Analysis of Biological Macromolecules. J. Biomol. NMR 1995, 6, 1–10. [Google Scholar] [CrossRef] [PubMed]
Figure 1. (a) Schematic illustration of the selection of magnetization in all the filter experiments employing one-bond and two-bond scalar couplings, 1JNCO (~15 Hz) and 2JNCα (~7 Hz), respectively; (b) Figure 1b shows a plot of the transfer function as a function of τNCα delays. Panels (I), (II) and (III) shows variation of Г(selected), Г(suppressed) the ratio of Г(selected)/Г(suppressed) as a function of τNCα delays respectively.
Magnetochemistry 04 00002 g001
Figure 2. Radio frequency (r.f.) pulse sequences of (a) 2D HN(CA)(i + 1); (b) GFT (3,2)D HN(CA)CO(i + 1) and (c) GFT (3,2)D HNCACB(i + 1). Rectangular 90° and 180° hard pulses on 1H and 15N channel are indicated by thin and thick vertical bars, respectively and the same thin and thick notations are used for 90° and 180° shape pulses in 13C channel. The representative 90° pulse widths are 11.5 μs, 37.5 μs and 9.8 μs for 1H, 15N and 13C channels respectively. The corresponding phases of the applied pulses are indicated above and in places where no r.f. phase is marked, the pulse is applied along x. The 1H offset is placed at the position of the solvent line at 4.7 ppm and the 15N carrier was adjusted according to the spectral width observed in 15N dimension which was 119.5 ppm for Ubiquitin. The 13Cα r.f. carrier was placed at 54 ppm throughout the sequence and 13C′ carrier frequency was set at 176.0 ppm. The shaped pulse on 13Cα are of Gaussian cascade type with a pulse width of 240 μs and 196 μs, respectively, for 90° and 180° on resonance. The 180° off resonance pulse (Gaussian cascade) on 13C′ was applied for duration of 192 μs. In (a) DIPSI-2 is employed for decoupling 1H during 15N shift evolution periods and in other cases (b,c), 15N and 13C chemical shifts were jointly incremented. GARP was employed to decouple 15N during acquisition (r.f. strength = 3 kHz) all the sequences. All pulsed z-field gradients (PFGs) are sinc shaped with gradient recovery delay of 200 μs. The duration of gradient was 1.0 ms each and the strengths of the PFGs were G1: 16 G/cm, G2: 43 G/cm, G3: 4.3 G/cm. The delays and the phase cycling employed were as follows: For (a) 2D HN(CA)(i + 1), delays employed were τ1 = 2.3 m, τ2 = 5.5 m, τ3 = 21.5 m, τ4 = 4.5 m, τ5 = 12 m and Phase cycling: φ2 = 2(x), 2(−x); φ3 = 2(−y), 2(y); φ4 = 4(x), 4(−x); φ5 = 8(x), 8(−x) and φrec = 2(x,−x,−x,x), 2(−x,x,x,−x). For (b) GFT (3,2)D HN(CA)CO(i + 1), same delays were employed and Phase cycling: φ1 = x, −x; φ2 = 2(x), 2(−x); φ3 = 2(−y), 2(y); φ4 = 4(x), 4(−x) and φrec = 2(x,−x,−x,x), 2(−x,x,x,−x). For GFT NMR: two data sets with phase cycle φ1 = (x), (−x) and (y), (−y) were acquired, in conjunction with quadrature detection in 15N which were linearly combined later employing a G-matrix transformation. For (c) GFT (3,2)D HNCACB(i + 1), delays employed were τ1 = 2.3 m, τ2 = 5.5 m, τ3 = 21.5 m, τ4 = 1 m, τ5 = 12.5 m and τ6 = 3.6 m. Phase cycling: φ1 = x; φ2 = 2(x), 2(−x); φ3 = 2(−y), 2(y); φ4 = 2(x), 2(−x) and φrec = 2(x,−x,−x,x), 2(-x,x,x,−x). For GFT NMR: two data sets with phase cycle φ5 = (−y), (y) along with φ6 = 2(x,−x), 2(−x,x) and φ5 = (x), (−x) along with φ6 = 2(y,−y), 2(−y,y) were acquired, in conjunction with quadrature detection in 15N and later were linearly combined employing a G-matrix transformation. Quadrature detection in t2(15N) is accomplished using the sensitivity enhanced scheme by inverting the sign of gradient G2 in concert with phases φ3. Chemical shift evolution in 15N channel (t2) is achieved in a constant manner ‘κ’ is the scaling factor. For GFT experiments, at the same time 13C chemical shift evolution period is co-incremented leading to the linear combination: (b) Ω(15Ni+1 ± κ * 13COi+1) in (3,2)D HN(CA)CO(i + 1) and (c) Ω(15Ni+1 ± κ * 13Cαi+1), Ω(15Ni+1 ± κ * 13Cβi+1) in (3,2)D HNCACB(i + 1) respectively. In all spectra acquired in the present study κ = 0.5 was used.
Magnetochemistry 04 00002 g002aMagnetochemistry 04 00002 g002b
Figure 3. Schematic illustration of the sequential assignment strategy used with selective unlabeling.
Magnetochemistry 04 00002 g003
Figure 4. (a) overlay of the 2D [15N, 1H] HSQC spectrum of the uniformly 13C, 15N labeled ubiquitin as shown in red and Arg, Asn selectively unlabeled sample as shown in blue; (b) 2D HN(CA)(i + 1) spectrum acquired on the Arg, Asn selectively unlabeled sample. Assignments are indicated on the spectra. The sequence is shown above and the unlabeled residues are highlighted in red.
Magnetochemistry 04 00002 g004
Figure 5. (a,b) shows the different linear combinations of (3,2)D HNCACB(i + 1) of Arg, Asn selectively unlabeled sample of ubiquitin. Total measurement time for two spectra was 54 min with 8 scans each. Peaks shown in blue and green correspond to Ω(15Ni+1 ± κ * 13Cαi+1) and Ω(15Ni+1 ± κ * 13Cβi+1), respectively. The scaling factor κ was set to 0.5.
Magnetochemistry 04 00002 g005
Figure 6. (a,b) shows the different linear combinations of (3,2)D HN(CA)CO(i + 1) of Arg, Asn selectively unlabeled sample of ubiquitin. Total measurement time for two spectra was 35 min with 8 scans each. Peaks shown in blue in figure (a,b) correspond to Ω(15Ni+1 + κ * 13Ci+1) and Ω(15Ni+1-κ * 13Ci+1), respectively. The scaling factor κ was set to 0.5.
Magnetochemistry 04 00002 g006
Figure 7. (a,b) shows the different linear combinations of non-uniformly sampled (3,2)D HNCACB(i + 1) of Arg, Asn selectively unlabeled sample of ubiquitin. Total measurement time for two spectra was 14 min with 8 scans each. Peaks shown in blue and green correspond to Ω(15Ni+1 ± κ * 13Cαi+1) and Ω(15Ni+1 ± κ * 13Cβi+1), respectively. The scaling factor κ was set to 0.5. The NUS time increments in the shared dimension which was actually acquired in the experiment are shown in blue bars; (c,d), represents the overlay of 1D projection of linearly acquired data (red) and non-uniformly acquired data (blue) along ω1 for Ω(15Ni+1 + κ * 13Cαi+1/13Cβi+1) and Ω(15Ni+1 – κ * 13Cαi+1/13Cβi+1) respectively. There is 28% reduction in signal to noise (SNR) ratio ongoing from linearly acquired data to NUS data as measured by the SNR of the projections. We also have calculated SNR of G75 (highlighted in red) individually and there also we have seen ~30% decrease in SNR on going from linearly acquired data to NUS data.
Magnetochemistry 04 00002 g007
Figure 8. (a,b) shows the different linear combinations of non-uniformly sampled (3,2)D HN(CA)CO(i + 1) of Arg, Asn selectively unlabeled sample of ubiquitin. Total measurement time for two spectra was ~9 min with 8 scans each. Peaks shown in blue in figure (a,b) correspond to Ω(15Ni+1 + κ * 13Ci+1) and Ω(15Ni+1 − κ * 13Ci+1), respectively. The scaling factor κ was set to 0.5. The NUS time increments in the shared dimension which was actually acquired in the experiment are shown in blue bars; (c,d), represents the overlay of 1D projection of linearly acquired data (cyan) and non-uniformly acquired data (blue) along ω1 for Ω(15Ni+1 + κ * 13Ci+1) and Ω(15Ni+1 − κ * 13Ci+1) respectively. There is 27% reduction in signal to noise ratio ongoing from linearly acquired data to NUS data as measured by the SNR of the projections.
Magnetochemistry 04 00002 g008

