Review

Antiferromagnetic Insulating Ground State of Molecular π-d System Λ-(BETS)2FeCl4 (BETS = Bis(ethylenedithio)tetraselenafulvalene): A Theoretical and Experimental Review

Condensed Molecular Materials Laboratory, RIKEN, Hirosawa 2‐1, Wako, Saitama 351‐0198, Japan
*
Author to whom correspondence should be addressed.
Magnetochemistry 2017, 3(1), 10; https://doi.org/10.3390/magnetochemistry3010010
Submission received: 23 January 2017 / Accepted: 22 February 2017 / Published: 24 February 2017
(This article belongs to the Special Issue Magnetism of Molecular Conductors)

Abstract

:
The π-d molecular conductor λ-(BETS)2FeCl4, where BETS is bis(ethylenedithio) tetraselenafulvalene, has attracted considerable interest for the discovery of its field induced superconducting state. A mystery of this system is its antiferromagnetic insulating ground state. The point still under strong debate is whether the d spins in Fe3+ are ordered or not. Here, we review experimental and theoretical studies on the antiferromagnetic insulating phase in λ-(BETS)2FeCl4 and mention our perspective based on our ESR measurements for λ-(BETS)2FexGa1−xCl4. Our ESR results indicate that the π-d interaction in the system is very strong and there is no sign of paramagnetic Fe spins in the antiferromagnetic ground state.

1. Introduction

Molecular conductors with finite π-d interactions have attracted many interests for the past few decades since interaction between the itinerant π-electron and localized d-electron yields some intriguing physical phenomena. For instance, a characteristic magnetoresistance that is related to the spin state in Fe ions was reported for (DMET)2FeBr4 (DMET = 4′,5′-dimethyl-4,5-(ethylenedithio)-1′,3′-diselena-1,3-dithiafulvalene) [1], and giant negative magnetoresistance was observed in Fe phthalocyanine complexes [2]. Among others, λ-(BETS)2FeCl4, where BETS is bis(ethylenedithio)tetraselenafulvalene, is one of the most studied and well-known π-d molecular conductors for the appearance of superconductivity in a high magnetic field [3,4]. An excellent review about the field-induced superconducting state by Uji and Brooks can be found elsewhere [5].
In contrast to the superconducting state in a high magnetic field, this system also shows cooperative conducting and magnetic properties in the low-field region thanks to the strong interaction between π- and d-electrons, namely, π-d interaction. In the high temperature phase, λ-(BETS)2FeCl4 is a metal where the magnetic property shows the paramagnetic behavior. At TN = 8.3 K, λ-(BETS)2FeCl4 becomes antiferromagnetic and simultaneously shows a metal to insulator (MI) transition [6,7,8].
In contrast with the non-magnetic analog compound λ-(BETS)2GaCl4 which becomes superconducting below 6 K, the MI transition of λ-(BETS)2FeCl4 has been thought for a long time to be triggered by the long-range ordering of Fe spins [7,8]. On the other hand, some theoretical works claim that the Mott transition of the π-electrons is an origin of the MI transition, and then, the π-d coupling forces the Fe moments to be antiferromagnetically ordered [9,10]. However, Akiba et al. revealed a completely different role of the Fe spins based on the heat capacity measurement, where the Fe spins remain paramagnetic below TN [11]. This ‘chicken or egg’ problem of the antiferromagnetic insulating (AFI) phase (which orders first, the d-electrons or the π-electrons), coupled with the ground state of the Fe spins is still open question under strong debate.
We here review cornerstone measurements and theoretical studies for the AFI phase of λ-(BETS)2FeCl4, and present our ESR measurements on the mixed compounds λ-(BETS)2FexGa1−xCl4 (x = 0.2~1.0). The main point of studying the mixed compounds by ESR is to microscopically investigate the role of Fe spins in the ground state by gradually introducing the Fe spins in the system. Our results have revealed that the Fe spins play a decisive role in the magnetic ground state, where a gradual transition from the paramagnetic to antiferromagnetic ground state is observed by increasing the Fe content. In contrast to the heat capacity measurement, the ESR measurements for the salts with x ≥ 0.6 do not indicate any sign of paramagnetic Fe spins in the AFI phase. This suggests that more attention should be paid to a metastable state within the AFI phase to explain the previous experimental results.
This paper is organized as follows: the crystal structure and phase diagram are mentioned in the next section, and some of the previous experimental and theoretical results are described in Section 3, followed by the ESR results in Section 4. Conclusions and future prospects are presented in the final section.

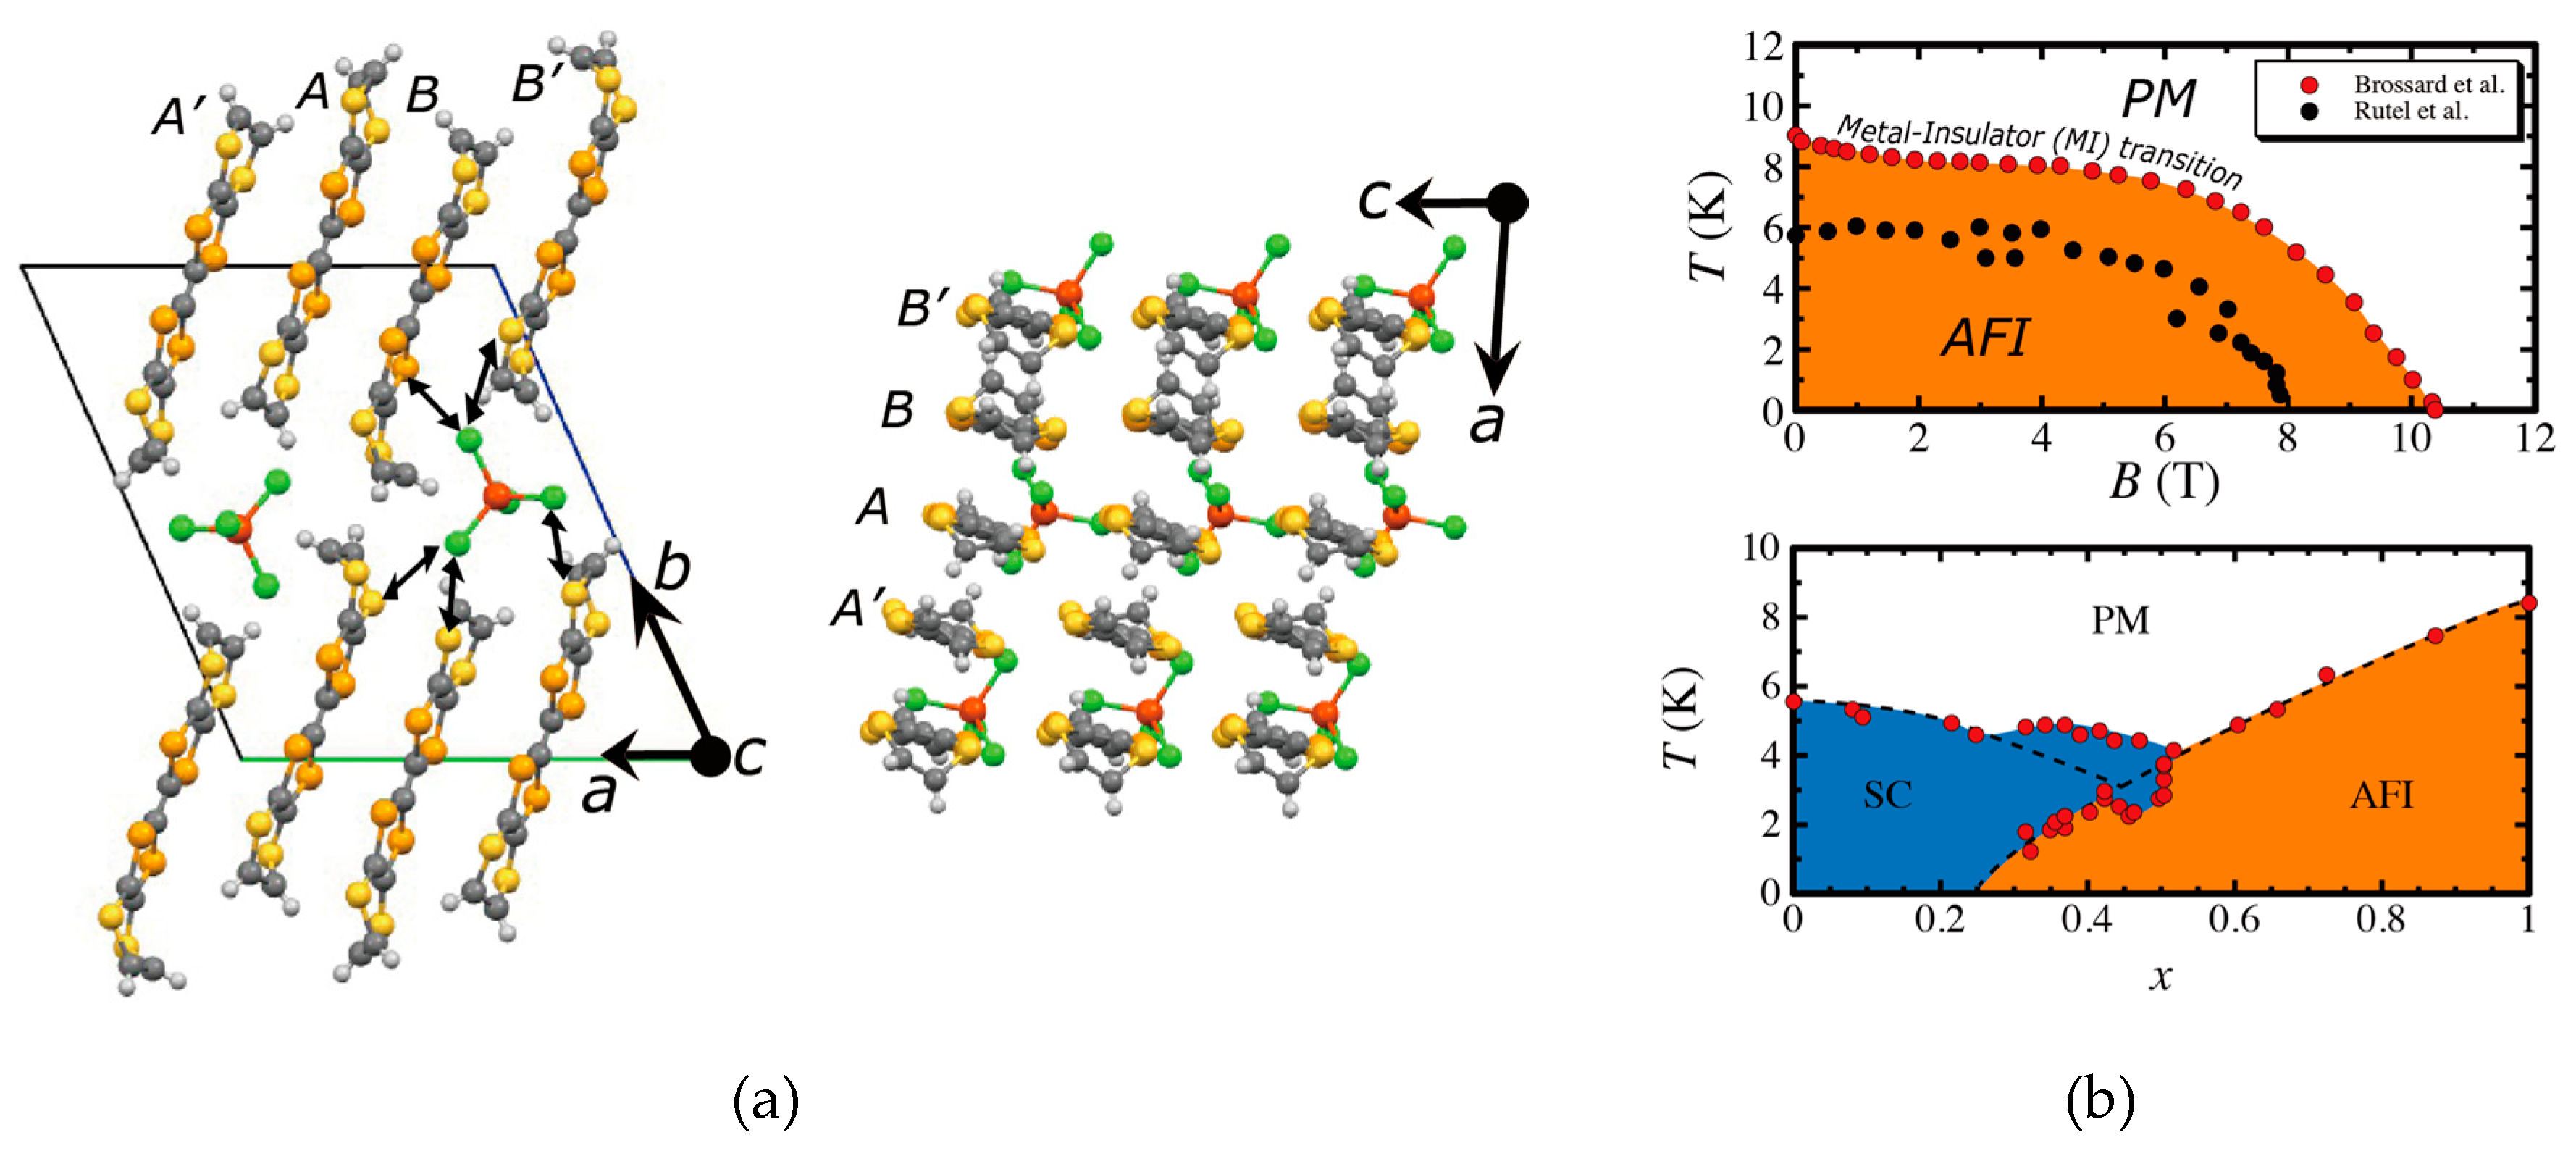
2. Crystal Structure and Phase Diagram

Single crystals of λ-(BETS)2FeCl4 are prepared by electrochemical oxidation of BETS in organic solvent such as chlorobenzene containing 10% ethanol, with the tetraethylammonium salt of FeCl4 as a supporting electrolyte [6]. The mixed system λ-(BETS)2FexGa1−xCl4 is prepared from a mixed electrolyte of [(C2H5)4N][GaCl4] and [(C2H5)4N][FeCl4] with fine tuning of the mixing ratio. Needle-shaped single crystals are obtained, and the crystallographic c-axis corresponds to the needle axis.
The crystal structure is presented in Figure 1a. The crystal has a triclinic unit cell with space group P 1 ¯ . The lattice constants at 10 K were determined as a = 15.880, b = 18.378, c = 6.529 Å, α = 98.66°, β = 95.830°, γ = 112.13° [6].
Two BETS molecules and one FeCl4 anion are crystallographically independent. Each independent BETS molecule (A and B in Figure 1a) forms a dimer, and these BETS dimers are stacked two-dimensionally in the ac-plane, and consequently form conducting layers. The interplanar distance between the BETS molecules A···B is 3.683 Å, and those between A···A’, B···B’ are about 4.0 Å. The overlap integral is the strongest, 76.8 × 10 3 , between BETS molecules A···B, and the overlap integrals are 37.1 × 10 3 and 23.1 × 10 3 for A···A’ and B···B’, respectively. The tight-binding calculation based on the extended Hückel method yields a 2D closed Fermi surface with 23% of the Brillouin zone [6]. This estimation is in good agreement with the Shubnikov-de Haas oscillation measurement [14]. On the other hand, the fairly large dimerization of the BETS molecules leads to a splitting of the HOMO (highest occupied molecular orbital) band, and the electronic state can be interpreted as effectively half-filling of the upper HOMO band. In the case of half-filling with substantial on-site Coulomb interaction U, the π-electron system could turn into a Mott insulating state. Meanwhile, the FeCl4 anions, which are magnetic with a high-spin state (Fe3+, S = 5/2), are located between the BETS layers and form 1D chains along the c-axis. The shortest Fe···Fe distance is 6.593 Å at room temperature, and there are many short Cl···S(Se) contacts of about 3.43–3.67 Å (double headed arrows in Figure 1a). Therefore, strong π-d interactions are expected in λ-(BETS)2FeCl4.
The first transport and magnetic properties of λ-(BETS)2FeCl4 were reported by Kobayashi et al. and Tokumoto et al., respectively [6,7]. A complementary study was performed by Brossard et al. [8]. This compound is metallic in the high temperature phase, and the magnetic susceptibility, where the dominant magnetic contribution originating from the Fe3+ ion, shows the paramagnetic behavior. With lowering temperature, λ-(BETS)2FeCl4 shows a metal to insulator (MI) transition at TN = 8.3 K, while the magnetic susceptibility shows the antiferromagnetic (AF) behavior down to the lowest temperature. Furthermore, a paramagnetic metal (PM) state is recovered when all the magnetic moments are polarized in the magnetic field above Bc = 10.5 T. The phase diagram is presented in the top panel of Figure 1b. The field-induced superconducting state, which appears above 17 T when B is parallel to the conducting plane, is not shown in Figure 1b since it is beyond the scope of this paper. We refer to the review paper about the field-induced superconductivity in λ-(BETS)2FeCl4 for readers who might be interested [5].
As mentioned above, the non-magnetic and isostructural analog, λ-(BETS)2GaCl4, shows a superconducting transition at Tc = 6 K, whereas λ-(BETS)2FeCl4 becomes insulating at TN = 8.3 K. Therefore, the mixed compound, λ-(BETS)2FexGa1−xCl4, is an excellent system to study the effect of magnetic ion on the ground state with a minimum structural disorder effect since FeCl4 and GaCl4 have almost the same size. The bottom panel of Figure 1b shows the phase diagram for the mixed λ-(BETS)2FexGa1−xCl4 system. The Néel temperature TN decreases with the Fe content, and the AFI phase is not present in the region of x < 0.25. The superconducting transition temperature Tc in the small x region (i.e., x < 0.25) decreases slightly with increasing x. In the intermediate region (0.3 < x < 0.5), a complicated phase diagram accompanied by small changes of Tc and TN is observed [13,15].

3. Previous Experimental and Theoretical Studies

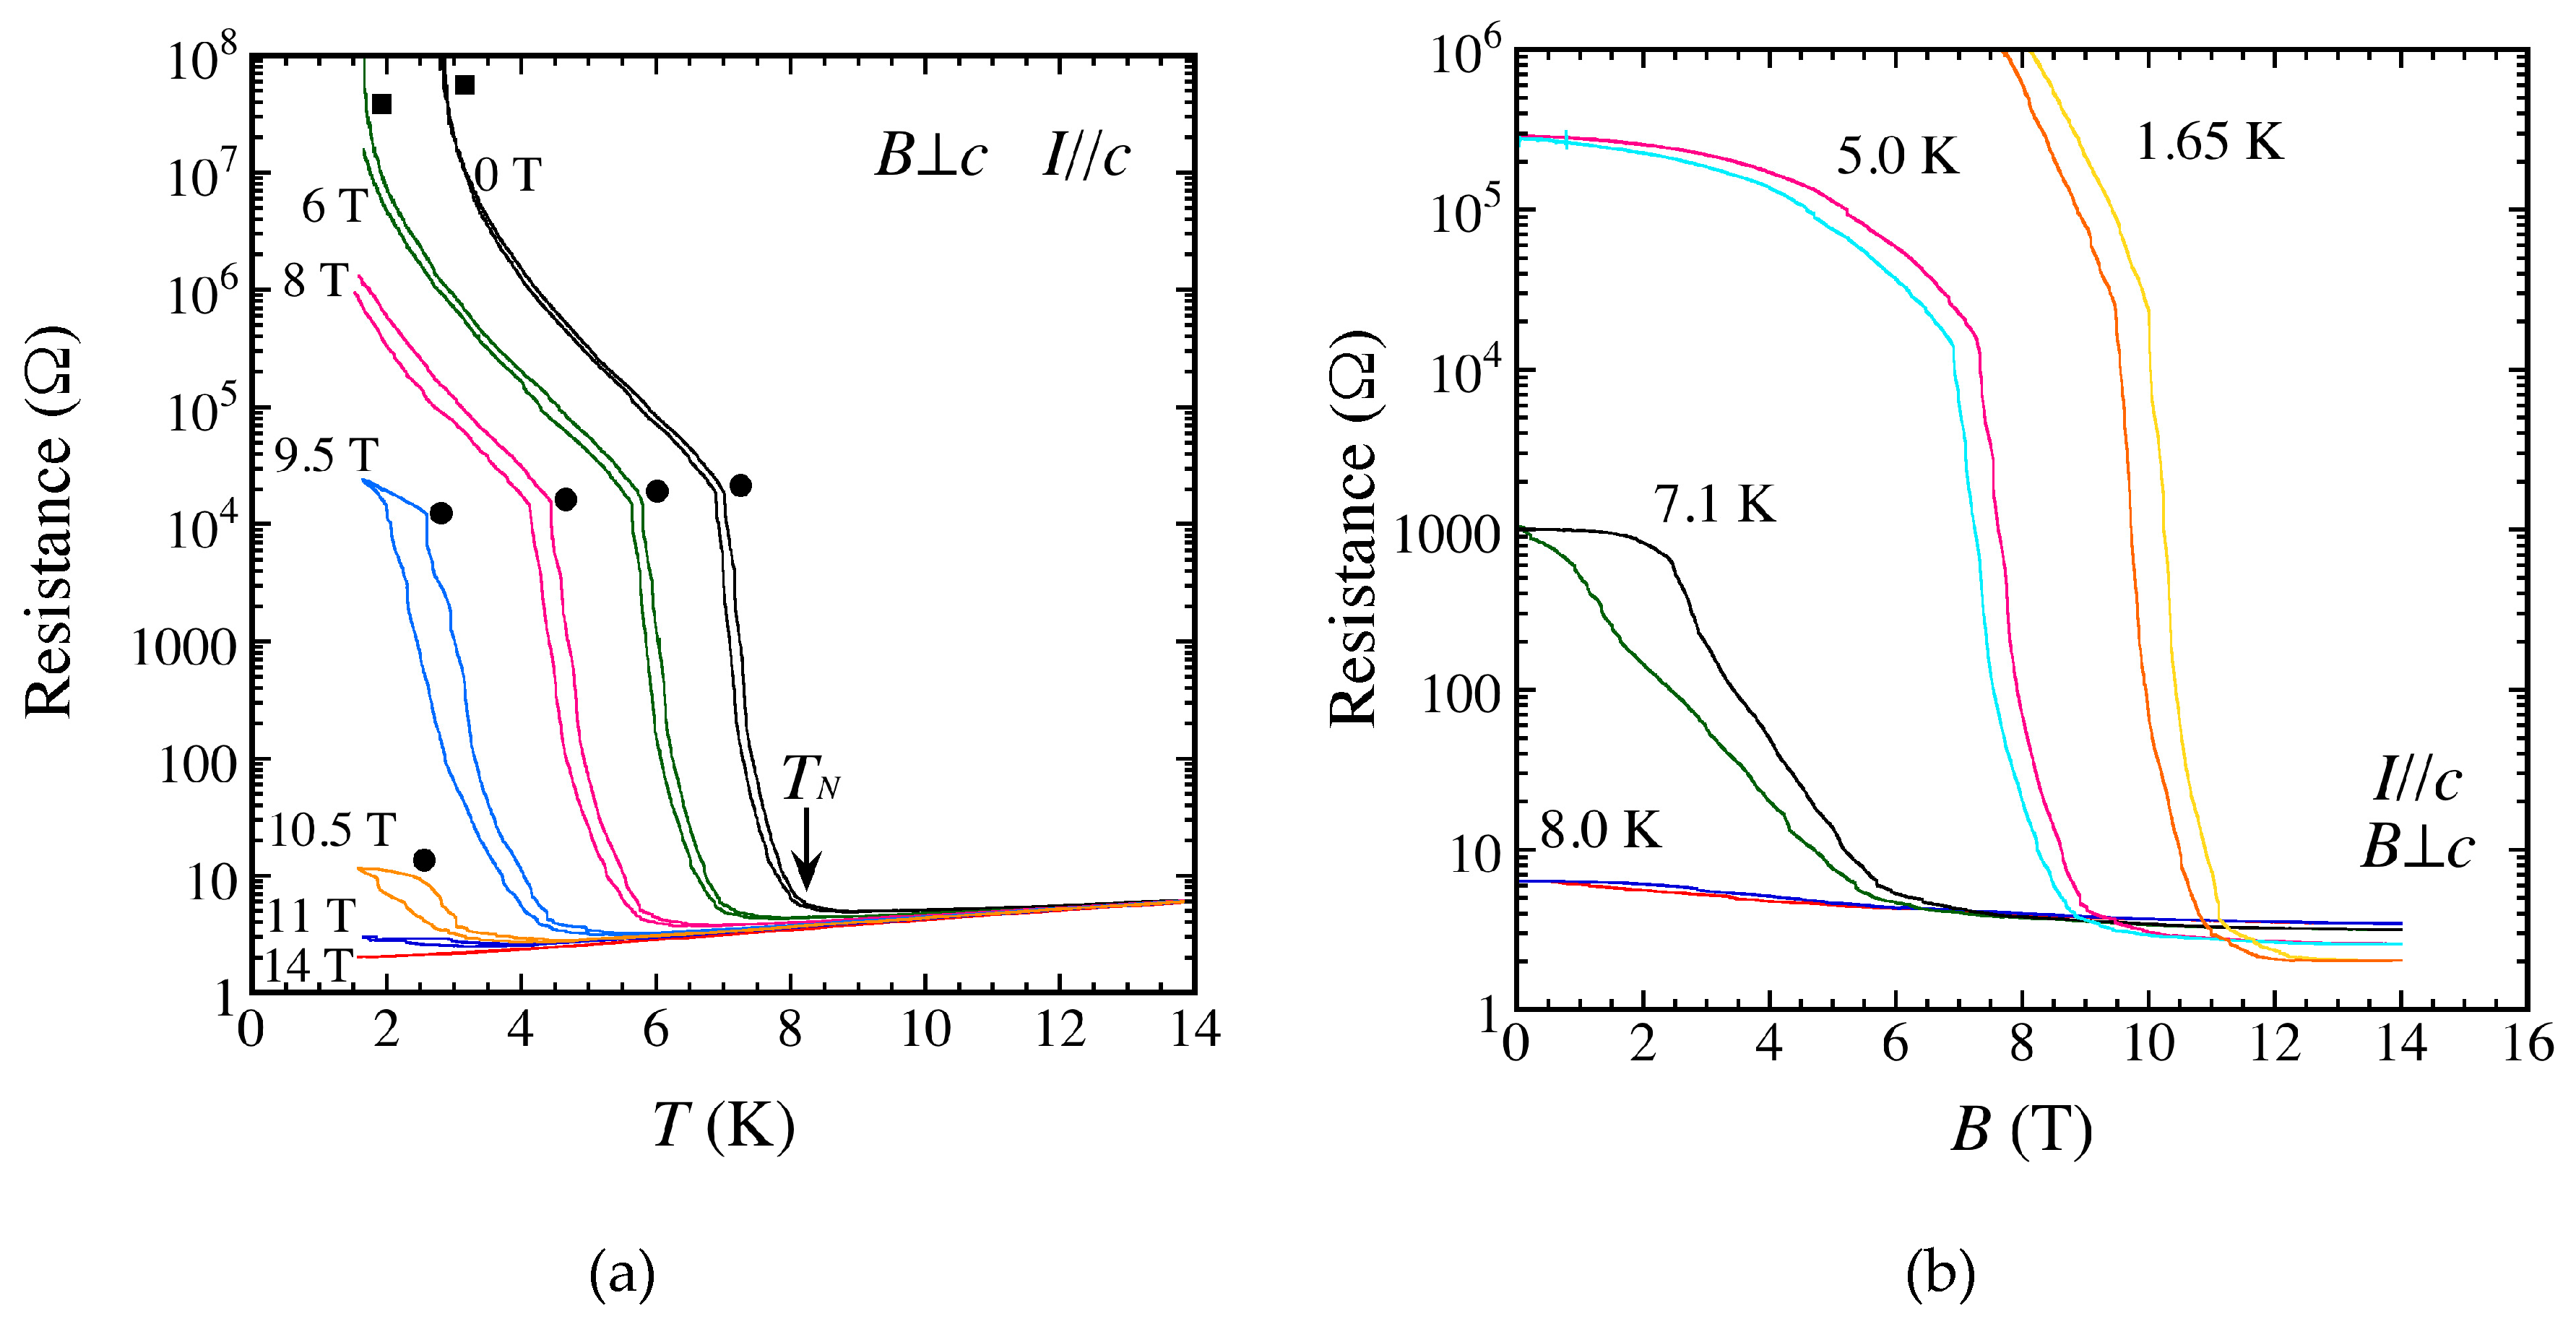
3.1. Transport and Magnetic Properties

Temperature dependent resistivity for λ-(BETS)2FeCl4 shows a small maximum around 100 K, and decreases with lowering temperature [6]. Such a maximum of the resistivity is common in other BETS salts. As mentioned in the previous section, the MI transition is found at 8.3 K at ambient pressure. The small maximum observed around 100 K shifts to higher temperatures with increasing pressure and is completely suppressed at 2 kbar. Moreover, the MI transition temperature decreases when increasing the pressure, and the metallic state is stabilized above 3.5 kbar [6].
The first magnetoresistance measurement using a pulsed magnetic field was reported by Goze et al. [16]. The authors found that the MI transition temperature is suppressed by applying a high magnetic field, and a metallic state is recovered above 10 T. They also found that the magnetoresistance strongly depends on the direction of the magnetic field above the critical field (Bc) [16]. Brossard et al. also reported that the magnetoresistance shows hysteresis at the MI transition, which becomes larger as the magnetic field increases [8]. Our transport and magnetotransport measurements are shown in Figure 2. As mentioned by Brossard et al., the hysteresis at the MI transition becomes larger as the field increases (Figure 2a) and as temperature increases (Figure 2b), namely, near the AFI phase boundary. Additionally, kink structures in the resistance below the MI transition are observed (shown as solid circles and squares in Figure 2a).
The magnetic susceptibility χ follows the Curie-Weiss law in the PM phase, where the Weiss temperature is about −15 K and the Curie constant yields an effective magnetic moment of 5.83 µB [7,8]. This value is very close to that of the magnetic moment of Fe3+ in the high spin state (i.e., 5.92 µB for S = 5/2 and L = 0), suggesting the dominant magnetic contribution originates from the Fe3+ spins. The Weiss temperature of −15 K and S = 5/2 leads to the exchange coupling between the spins Fe3+ of Jd-d~2.3 K [8]. The magnetic susceptibility for the field B//c shows a step-like decrease at the MI transition temperature, 8.3 K, and then, shows the behavior typical of the AF ordering for the easy-axis with lowering temperature. The step-like decrease at the MI transition is suppressed in the magnetic field B > 2 T, and is less pronounced for B c. Notably, for λ-(BETS)2FeBr4 where a smaller π-d interaction is expected, the step-like structure disappears and the easy-axis behavior is observed for the field B c [17]. From the comparison of magnetic properties between λ-(BETS)2FeCl4 and λ-(BETS)2FeBr4, it is supposed that the peculiar magnetic behavior observed in λ-(BETS)2FeCl4 is due to the strong interplay between π- and d-electrons [8].
The field-dependence of magnetization (M-H curve) for the field B//c shows a step-like structure around 1 T accompanied by a linear increase at higher fields. This step-like structure was interpreted as a spin-flop transition since it was not observed for the field B c [7,8]. The linear increase of the magnetization above the spin-flop field is due to the canted antiferromagnetic state. More precise magnetic torque measurement preformed by Sasaki et al. indicated a clear spin-flop transition around 1.2 T, where the easy-axis was found to be in the direction tilted by about 30° from the c-axis to the b*-axis [18]. For low temperatures, the M-H curve shows another step structure accompanied with hysteresis around the critical field Bc [8,18]. A metamagnetic-like transition of the π-electrons between AFI and PM phases was proposed since the recovery of the metallic state occurs above Bc [18]. Finally, the magnetization saturates above 10.5 T.
The mixed compound λ-(BETS)2FexGa1−xCl4 shows similar transport property. A small maximum of resistivity is also observed around 100 K for all mixed systems, and resistivity decreases with lowering temperature. Then, superconducting or MI transition is observed depending on the Fe content x (see bottom panel of Figure 1b) [13]. No significant difference is found also in the Fermi surface (similar cylindrical Fermi surface and similar cross-sectional area is observed by the Shubnikov–de Haas oscillation measurement) except that the Fermi surface is split by the internal field due to the π-d interaction for x ≠ 0 [19]. The internal field seems to increase with the Fe content. The magnetic property of the mixed compound λ-(BETS)2FexGa1−xCl4 (x > 0.47) is also similar to the pure λ-(BETS)2FeCl4, where the magnetic susceptibility shows a step-like structure at the MI transition, and the spin-flop is observed for the field B//c [20]. Hence, the overall features suggest there is no serious effect of disorder both on the transport and magnetic properties in the mixed compound.
In summary, the high temperature phase of λ-(BETS)2FeCl4 is a paramagnetic metal. The MI transition occurs at 8.3 K, and the system becomes antiferromagnetic simultaneously. By applying the magnetic field along the easy-axis, the spin flop transition is observed around 1.2 T, and the system goes to a canted antiferromagnetic state. The magnetization saturates (i.e., spins are fully polarized) above 10.5 T, then the metallic state recovers. The magnetic ions are essential to the AFI ground state since the non-magnetic analog λ-(BETS)2GaCl4 is, in contrast, a superconductor. Therefore, in the early studies on λ-(BETS)2FeCl4, it was thought that the insulating state (i.e., localization) of the π-electrons is triggered by the antiferromagnetic long-range ordering of the d-electrons [8].

3.2. Specific Heat Measurements and the Paramagnetic Fe Model

The first specific heat measurement of λ-(BETS)2FeCl4 was reported by Negishi et al. [21]. The specific heat exhibits a sharp peak due to the antiferromagnetic long-range order at TN, and a remarkable jump of the specific heat, which they attributed to the ferroelectric transition, is observed at 70 K (TFM). The ferroelectric property of λ-(BETS)2FeCl4 will be mentioned later in Section 3.4. Additionally, a significant excess heat capacity below TN was reported. Negishi et al. attributed this excess specific heat to a short-range antiferromagnetic ordering since the entropy change of only 60% of R ln2 + R ln6 was observed at TN.
On the other hand, Akiba et al. proposed a completely different model to explain this excess specific heat [11]. They showed from their result that the excess specific heat observed below TN can be fit with the six-level Schottky peak of the paramagnetic Fe spins. They proposed that the sharp peak at TN is due to the antiferromagnetic ordering of the π-electrons (Mott transition), and the 3d spins, which remain paramagnetic, feel the internal field from the localized π-electrons through the π-d interaction. The authors concluded that an internal field of about 4 T is created from the localized π-electrons, and this internal field induces the six energy levels of d-electron leading to the Schottky-type anomaly. Hence, this model suggests that π and 3d spins do not cooperatively form an antiferromagnetic order, and the Fe spins remain paramagnetic.
Akiba et al. also claimed that a model with two canted Fe spins exposed to the internal field of 4 T along the easy-axis can reproduce the results of the susceptibility measurements [22]. The specific heat measurements of the mixed compound λ-(BETS)2FexGa1−xCl4 (x = 0.4~1.0) can also be fit with this model, where the internal field increases with the Fe content [23]. They proposed that the difference of TN by the Fe content is due to the fluctuation of the π-electron that is suppressed by the magnetic anisotropy introduced by the Fe spins [23]. The paramagnetic Fe model was further extended by introducing 2D Ising-like transition and double Schottky model, to explain the heat capacity behavior nearby TN and the field dependence, respectively [24,25].
Mössbauer measurement partially supports the paramagnetic Fe model [26]. Above TN, the Mössbauer spectra presents a single line typical of the paramagnetic Fe; and below TN, sextet splitting that is typical of long-range ordering is observed. However, the spectrum at 8 K still shows a small fraction of about 13% of paramagnetic atoms, which can be ascribed to the slow dynamics of the transition. Moreover, two additional magnetic splittings with identical isomer shift but slightly different hyperfine fields (i.e., two sextets) are observed in the temperature range between 3.2 and 8.0 K, which suggests two different magnetic environments for the Fe sites. In addition, a significant development of the hyperfine field by decreasing temperature is also observed. Although the change in the Mössbauer spectra below TN is indicative of a slow magnetic ordering process, these results cannot discriminate the paramagnetic model in the case of fast relaxation. Actually, the computed hyperfine fields assuming a fast relaxation model, where the Fe spins exhibit the Zeeman splitting by the internal field, are in good agreement with the specific heat measurements. The estimated internal field from the fitting is dependent on temperature, increasing from 2.45 T at 8 K to 4.2 T at 1.5 K [26].
Recent transport (including non-linear transport) and magnetic torque measurements by Sugiura et al. also support the paramagnetic model [27,28]. They observed a small dip of the magnetoresistance at 1.2 T for B nearly parallel to the easy axis, which can be ascribed to the spin-flop transition. The resistance dip at the spin-flop transition was explained, not with the scattering mechanism due to the antiparallel Fe, but from the electron-hole excitation model with up and down spins in the BETS layers [27]. Furthermore, Sugiura et al. investigated in detail the angular dependence of the magnetic torque that shows a sinusoidal dependence, and found the zero-crossing angle—the magnetic field direction where the magnetic torque becomes zero—significantly changes with field and temperature [28]. In comparison with the zero-crossing angle of the magnetic torque in the PM phase, and that of the non-magnetic GaCl4 salt, they concluded that the origin of the change in the zero-crossing angle is due to the antiferromagnetic order of the π-electrons [28].

3.3. Theoretical Studies

The first model to explain the AFI ground state of λ-(BETS)2FeCl4 was proposed by Ziman in Reference [8]. A Hubbard-Kondo model—where four conduction bands associated with the BETS layers, the Coulomb repulsion U on the BETS molecule, and a Kondo coupling between the localized S = 5/2 spins on Fe3+ and the conduction π-electrons were taken into account—was introduced. For small U, the periodic potential due to the magnetic ordering of Fe3+ opens energy gaps at the Fermi surface, then, by applying the magnetic field, the fully-polarized magnetic moments destroy the periodic potential, restoring the Fermi surface. Although this model qualitatively explains the AFI and PM ground states of λ-(BETS)2FeCl4, a Kondo coupling of J > 70 K is needed to suppress the entire Fermi surface and the on-site Coulomb U is empirically not small [8].
Another model of the AFI phase was introduced by Hotta and Fukuyama [9]. From a mean-field calculation including the Hubbard model and the π-d interaction, they categorized the BETS system into a unified phase diagram, and proposed that λ-(BETS)2FeCl4 and λ-(BETS)2GaCl4 are very close to the MI boundary of the Mott insulator, and its ground state is easily influenced by the π-d interaction. Moreover, the authors pointed out a lack of degeneracy in the energy dispersion of the two anti-bonding HOMO bands owing to the molecular arrangement and the fairly large dimerization of the BETS molecules in the λ-type system. This splitting makes it easier to form a gap between the two anti-bonding bands where the Fermi level is situated, which means only a small on-site Coulomb U is needed to be an insulator. Therefore, the MI transition at 8.3 K is proposed to be a Mott transition of the π-electrons, and long-range order of the Fe spins is induced through the π-d interaction [9]. Even though this model could also drive the system into the AFI ground state, it cannot explain why a strong magnetic field restores the metallic state. To resolve this problem, Cépas et al. proposed a more effective Hubbard-Kondo model with Zeeman energies [10]. The AFI phase of λ-(BETS)2FeCl4 is explained by the picture where the Kondo coupling drives the system into an insulating phase in order to gain some magnetic energy. The energy of a metallic state crosses that of the insulator as the field increases, leading to a first-order transition into a PM state.
These two scenarios of the MI transition lead to different physical pictures: spin-density-wave (SDW)-like insulator and Mott insulator. Therefore, Cépas et al. proposed that the measurement of the charge gap as a function of the field would distinguish the SDW or Mott insulator scenario [10].
Furthermore, Mori and Katsuhara estimated the exchange energies in λ-(BETS)2FeCl4 by means of the extended Hückel method [29]. The antiferromagnetic exchange interaction between π, π-d, and d electrons are estimated to be J π π = 448 K, J π d = 14.6 K, and J d d = 0.64 K, respectively. The internal field created by the Fe spins H i n t   =   J π d S d / g μ B is about 33 T in agreement with the experiment on the field-induced superconductivity [4]. Based on the mean-field calculation, the Néel temperature of TN = 6.22 K is also deduced from these exchange couplings, which also agrees with the experimental result [29].
The above theoretical works suppose that both π- and d-electrons are long-range ordered. In this sense, the paramagnetic Fe model of Akiba et al. is quite striking. However, Ito and Shimahara examined by mean field theory a uniaxially-coupled Heisenberg antiferromagnet model with two subsystems, where the two subsystems consist of strongly interacting small spins and weakly interacting large spins [30]. In the case of J π π J π d J d d , their model successfully reproduces the specific heat and the magnetic susceptibility measurements. Moreover, the magnetic anisotropy, which is essential to the easy-axis of the antiferromagnetic state, is found to originate from the π-d interaction and is described as approximately 26–27° from the c-axis which is in total agreement with the experimental result [30]. The same authors also studied the spin structure from a similar model, and discussed that a tilted canted antiferromagnetic state, where the canted spins are tilted from the magnetic field direction, can only appear in a narrow range of the magnetic field for λ-(BETS)2FeCl4 [31].

3.4. Other Experimental Studies

Anomalous dielectric response at TFM = 70 K was first reported by Matsui et al. [32]. As mentioned above, the specific heat also shows some anomaly at this temperature [21]. By means of cavity perturbation technique at 16.3 GHz, Matsui et al. found an anomaly in the cavity response with a large dielectric constant. They ascribed it to a transition to a ferroelectric state. Although the dc resistivity indicates a highly metallic state, the microwave loss is enhanced anomalously in the range of TN < T < TFM. It should be noted that this work was criticized on the basis that this anomaly is due to the analysis artifact, which was soon denied by the same authors [33,34]. Moreover, the dielectric constant along the c-axis shows a broad maximum around 30 K for 44.5 GHz, which the authors attributed to a relaxor ferroelectric behavior [35]. They proposed that dielectric domains or stripes with less metallic conduction emerge inhomogeneously in the π-electron system. The X-ray diffraction data support this interpretation since the width of (007) Bragg reflection becomes broader and the peak splits around TFM [36,37]. This structural anomaly was ascribed to an appearance of heterogeneous structure with dielectric relaxor domains of about 0.4 µm in size. Furthermore, unnatural values in the anisotropic atomic displacement parameters were found, although no significant evidence of a phase transition or structural changes at TFM was found. The charge density map obtained by Fourier synthesis shows a distorted electron density distribution in the BETS molecule [37].
Related to those experiments in the PM phase, I-V characteristic in the AFI state was investigated by Toyota et al. [38]. A drastic non-linear transport phenomenon, known as the negative resistance effect, was observed in the I-V curve, which indicates that some carrier decondensation occurs by applying electric field. They supposed that these dielectric states are intrinsic instabilities in the charge degree of freedom of the π-electronic system, which may be strongly influenced by applying electric field. Similar to this study, Rutel and co-workers measured the high-frequency cavity response of λ-(BETS)2FeCl4 by sweeping the field and temperature, and observed a huge change in the cavity response inside the AFI phase [12]. The transitions from a skin-depth regime to a depolarization regime, where a huge change of the cavity response is observed, are plotted in the top panel of Figure 1b. They explained that this behavior is due to the metastable state in the π-electronic system within the AFI phase. Negishi and co-workers obtained similar results by measuring the capacitance and conductance in the AFI phase [39]. A huge dielectric change by sweeping the field was observed inside the AFI phase, called ‘colossal magnetodielectricity’. The magnetic field where the divergence of the dielectric constant occurs is similar to the results on the depolarization regime by Rutel et al. (see Figure 1b) [12,39]. Such a sub-phase inside the AFI phase is confirmed from other studies [35,40].
Based on the above measurements, Negishi et al. proposed a charge ordering-induced polarization model [39]. Due to the exclusively large π-d super-exchange interaction between the π-orbitals at selective Se sites in BETS molecules labeled B (B’) in Figure 1a and 3d-orbital via Cl, the charge as well as the spin of the π-electrons are expected to be localized at these Se sites. Therefore, they expect a partial charge ordering occurs in BETS molecules A (A’) and B (B’), and such charge disproportionation yields a local polarization inside the BETS molecules. The antiferromagnetic order could be associated with the energy gain of magnetic ordering of the π- and d-electrons, which overcompensates the intersite Coulomb energy V in the BETS layer. This indicates that charge ordering is the primary origin of the AFI state. At low field and low temperature, the π-electrons are locked at the Se sites to keep J π d as effectively as possible, then, these π-electrons are considered to be unlocked or melted by applying the magnetic field [39].
Endo et al. performed the first 1H-NMR measurement, where a single peak splits into three asymmetric peaks at TFM related to the charge disproportionation [41]. Due to local fields that are dependent on each proton site (16 independent sites) and dynamical fluctuation, the NMR line rapidly broadens and contains many different peaks below TN, which makes the analysis difficult. 1H-NMR spin-echo measurement at 9 T was performed by Wu et al. [42]. A large slow beat structure in the spin-echo decay is observed, which originates from a large inhomogeneous local field generated by the Fe3+ moments. They also observed a discontinuous drop in 1/T2 at 3.5 K (PM to AFI transition for 9 T), which is due to the change in the orientation of the Fe spins at the transition. Besides the 1H-NMR, the 77Se-NMR is performed by Hiraki and co-workers in the high-field PM phase and field-induced superconducting state [43]. However, it seems that neither 77Se- nor 13C-NMR study of the AFI state has been reported thus far. This suggests that NMR line might also be very broad even for 77Se or 13C due to the effects of many local fields and the disproportionation of the π-electrons nearby the phase boundary.
In summary, two types of insulating mechanisms were proposed for the AFI state of λ-(BETS)2FeCl4: the spin-driven insulating mechanism and the charge-driven insulating mechanism. In the former one, the Fe spins become magnetically ordered thanks to Kondo couplings, and the periodic potential of the magnetic ordering opens a gap at the Fermi surface (i.e., SDW-like insulator). This mechanism was supported in the early stage. The latter one claims that the π-electrons make the insulating state by the Mott transition or charge ordering, and then, the Fe spins become antiferromagnetic or remain paramagnetic. Recent studies seem to support the latter mechanism rather than the former one.

4. ESR Measurements

4.1. Previous ESR Studies

The first ESR measurements for λ-(BETS)2FeCl4 with polycrystalline and single crystal samples were reported by Kobayashi et al. and by Brossard et al., respectively [6,8]. Brossard et al. reported temperature dependence of the g-value and ESR linewidth for two magnetic field orientations (B//c and B//u, where u is an undefined axis). The authors explained that the u-axis could not be determined due to the small sample size, but we suppose that the u-axis is in fact the b*-axis which is perpendicular to the c-axis. At room temperature, large anisotropy was observed for both linewidth and g-factor. The ESR linewidth is about 18 mT, and the g-factor is around 2.05 for the field B//u. The linewidth becomes very broad (c.a. 70 mT), and the g-factor is around 2.22 for the field B//c [8].
In general, such an ESR signal with large anisotropy and broad linewidth can be attributed to the paramagnetic resonance from the Fe spins, whereas the π-electrons usually give a weak ESR signal with narrow linewidth around g~2. In fact, the ESR signal of λ-(BETS)2GaCl4 is g = 1.99~2.02 with the linewidth of about 10 mT at T = 20 K [44]. For λ-(BETS)2FeCl4, it should be noted that the ESR signal of the π-electron and the d-electron should merge to a single ESR line thanks to the strong π-d interaction known as the ‘exchange narrowing’. This is due to the fast exchange between π- and d-electrons where the local field is averaged out, and the spectra merge to a single line. However, the contribution of the Fe spins should be dominant in the PM state since the magnetic moment of Fe3+ is larger and the π-electrons are not localized.
Besides the ESR signal around g = 2.0~2.2, Brossard et al. observed an additional ESR signal around g~2.6, which clearly appears around 70 K [8]. Such a characteristic signal was also reported for the mixed compound λ-(BETS)2Fe0.6Ga0.4Cl4 by Kawamata et al., however, they did not observe the g~2.6 signal for the pure λ-(BETS)2FeCl4 [44]. In that paper, they separately observed the ESR signals from the π- and d-electrons for λ-(BETS)2Fe0.6Ga0.4Cl4. Oshima et al. reported a cooling dependence of the π-d interaction in the same compound. Two ESR signals originating from the π- and d-electrons were observed for a rapid cooling (100 K/min), but these signals are merged into a single ESR line due to the exchange narrowing for a slow cooling (1 K/min) [45]. Although the detailed mechanism remains an open question, the phase separation of the normal metallic and ferroelectric domains at TFM might be the origin of the additional signal around g~2.6 [44].
Below 10 K, the broadening of ESR linewidth accompanied with a shift of g-values, typical to the development of the antiferromagnetic correlation, was observed [8,44]. Below TN, the paramagnetic resonance near g~2 disappears, and the antiferromagnetic resonance (AFMR) appears. Brossard et al. observed a typical bubble-like structure of the spin-flop resonance in the angular dependence of the AFMR. The spin-flop resonance was detected around 1.2 T and inclined at 25° from the c-axis, which is in good agreement with the magnetic torque measurements and theory [8,18,30]. The easy-axis and the hard-axis modes of the AFMR were also reported by Suzuki et al. and by Rutel et al. [12,46]. Although a slight deviation from the conventional AFMR mode was observed, the system seems to have an antiferromagnetic state with biaxial anisotropy [12,46]. The slight deviation might be due to the misalignment from the easy- or the hard-axis.

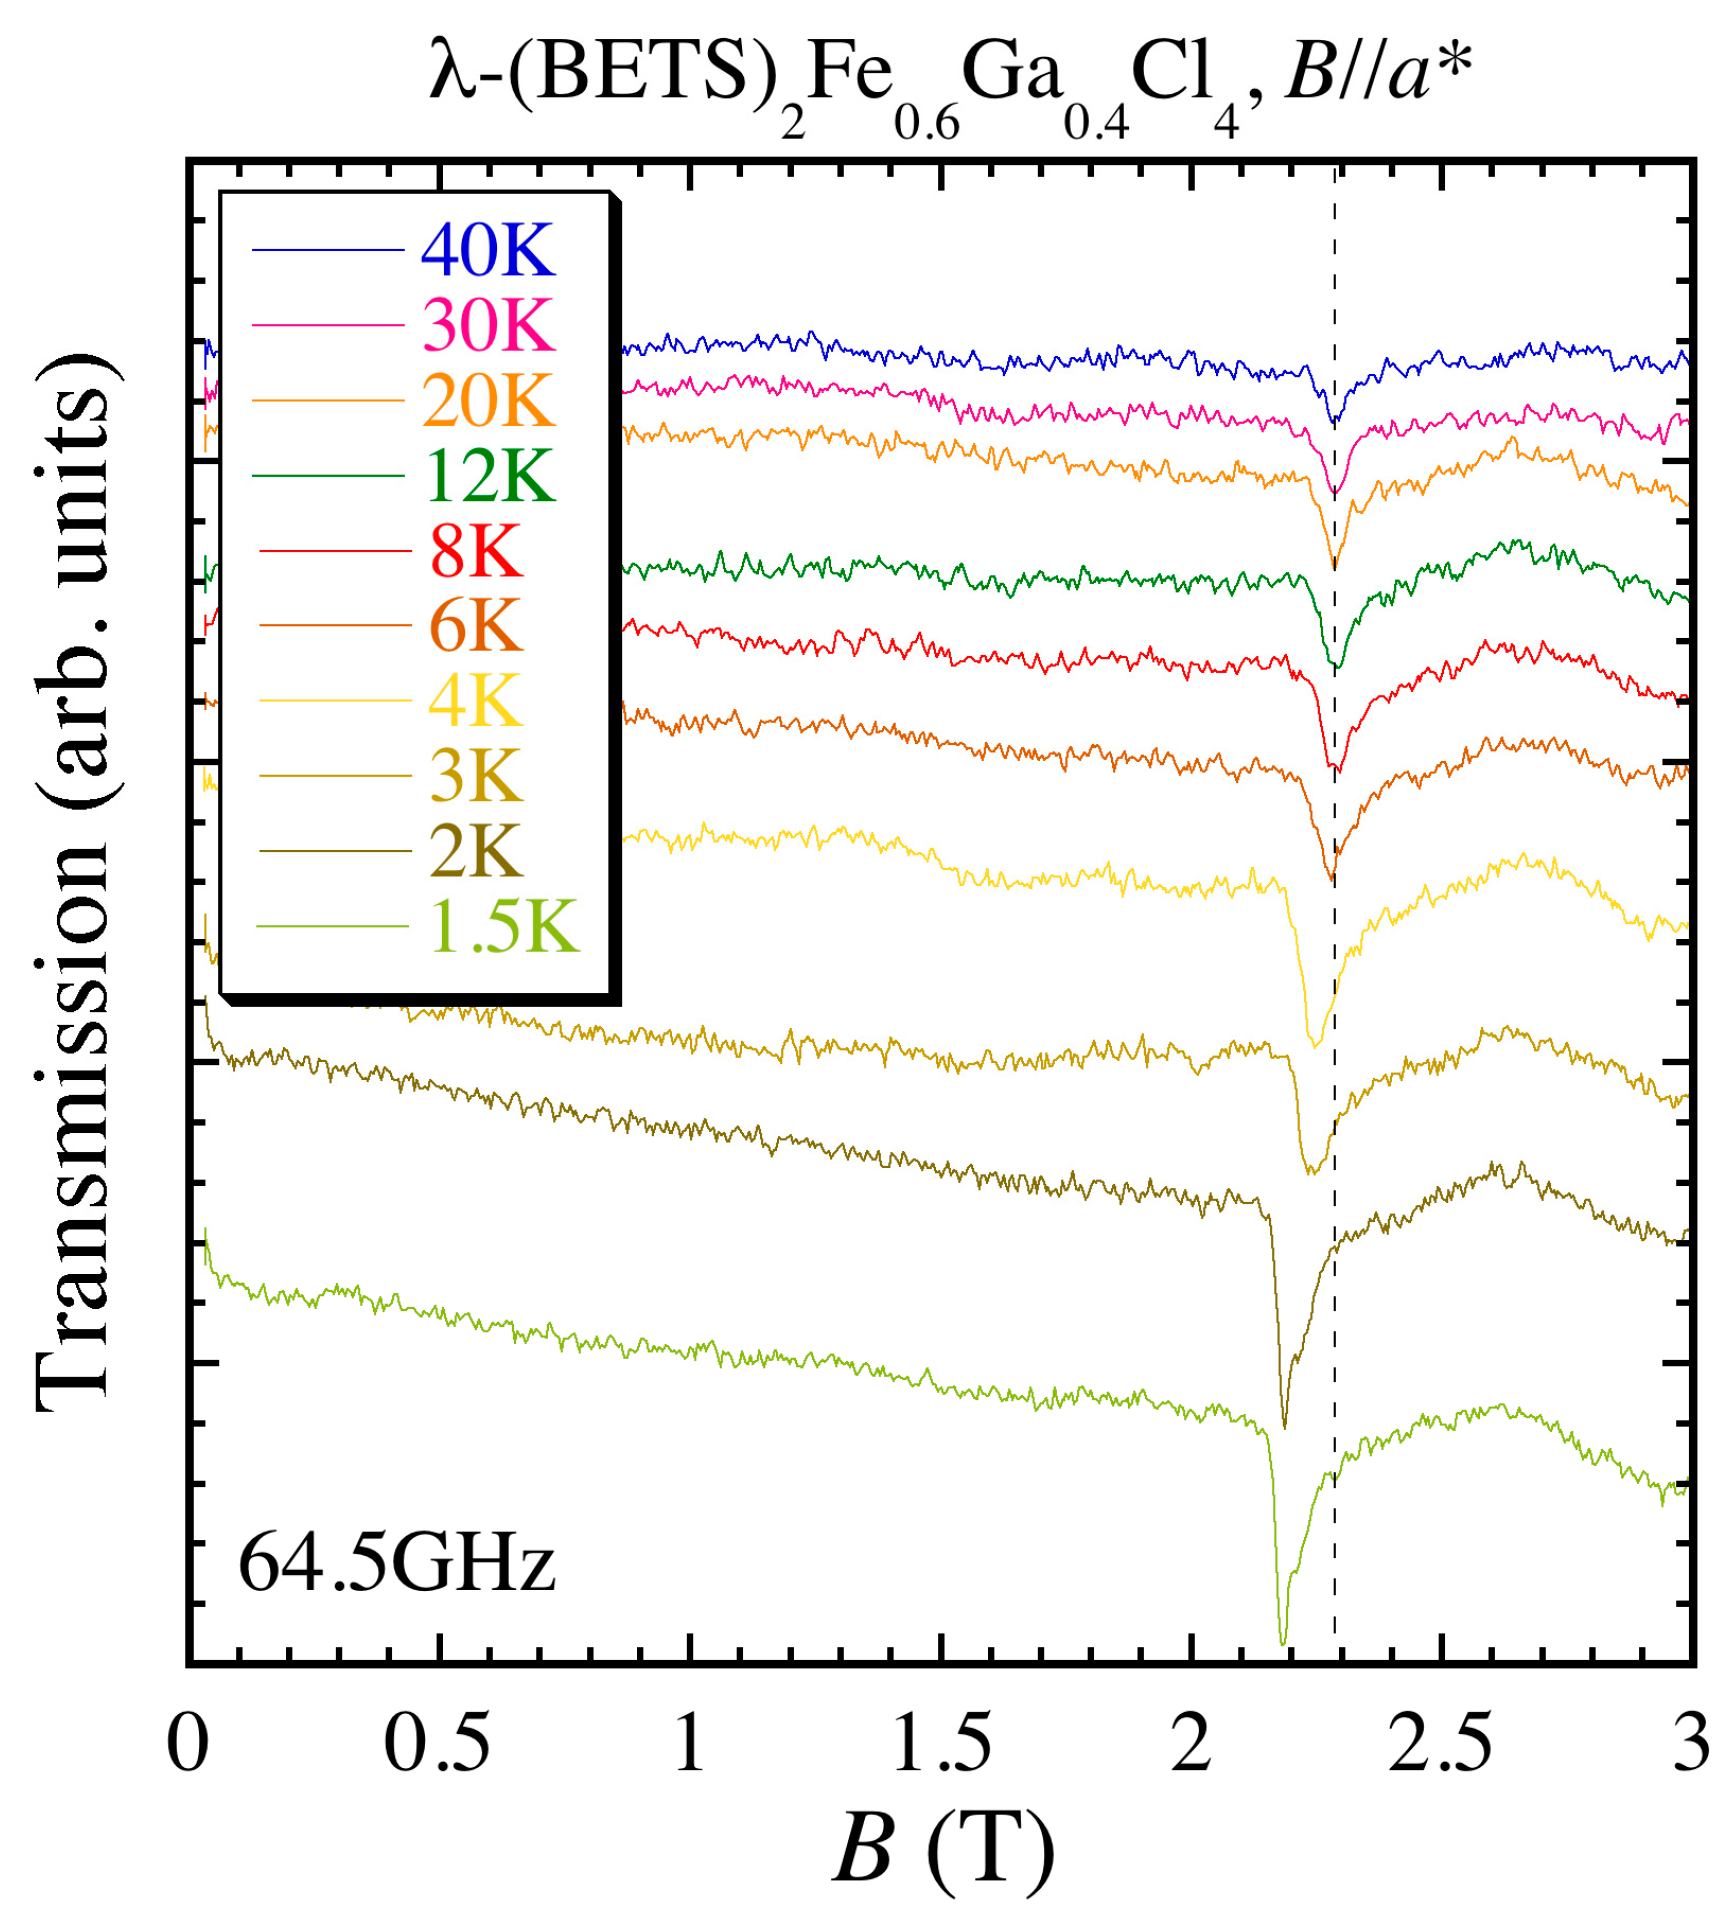
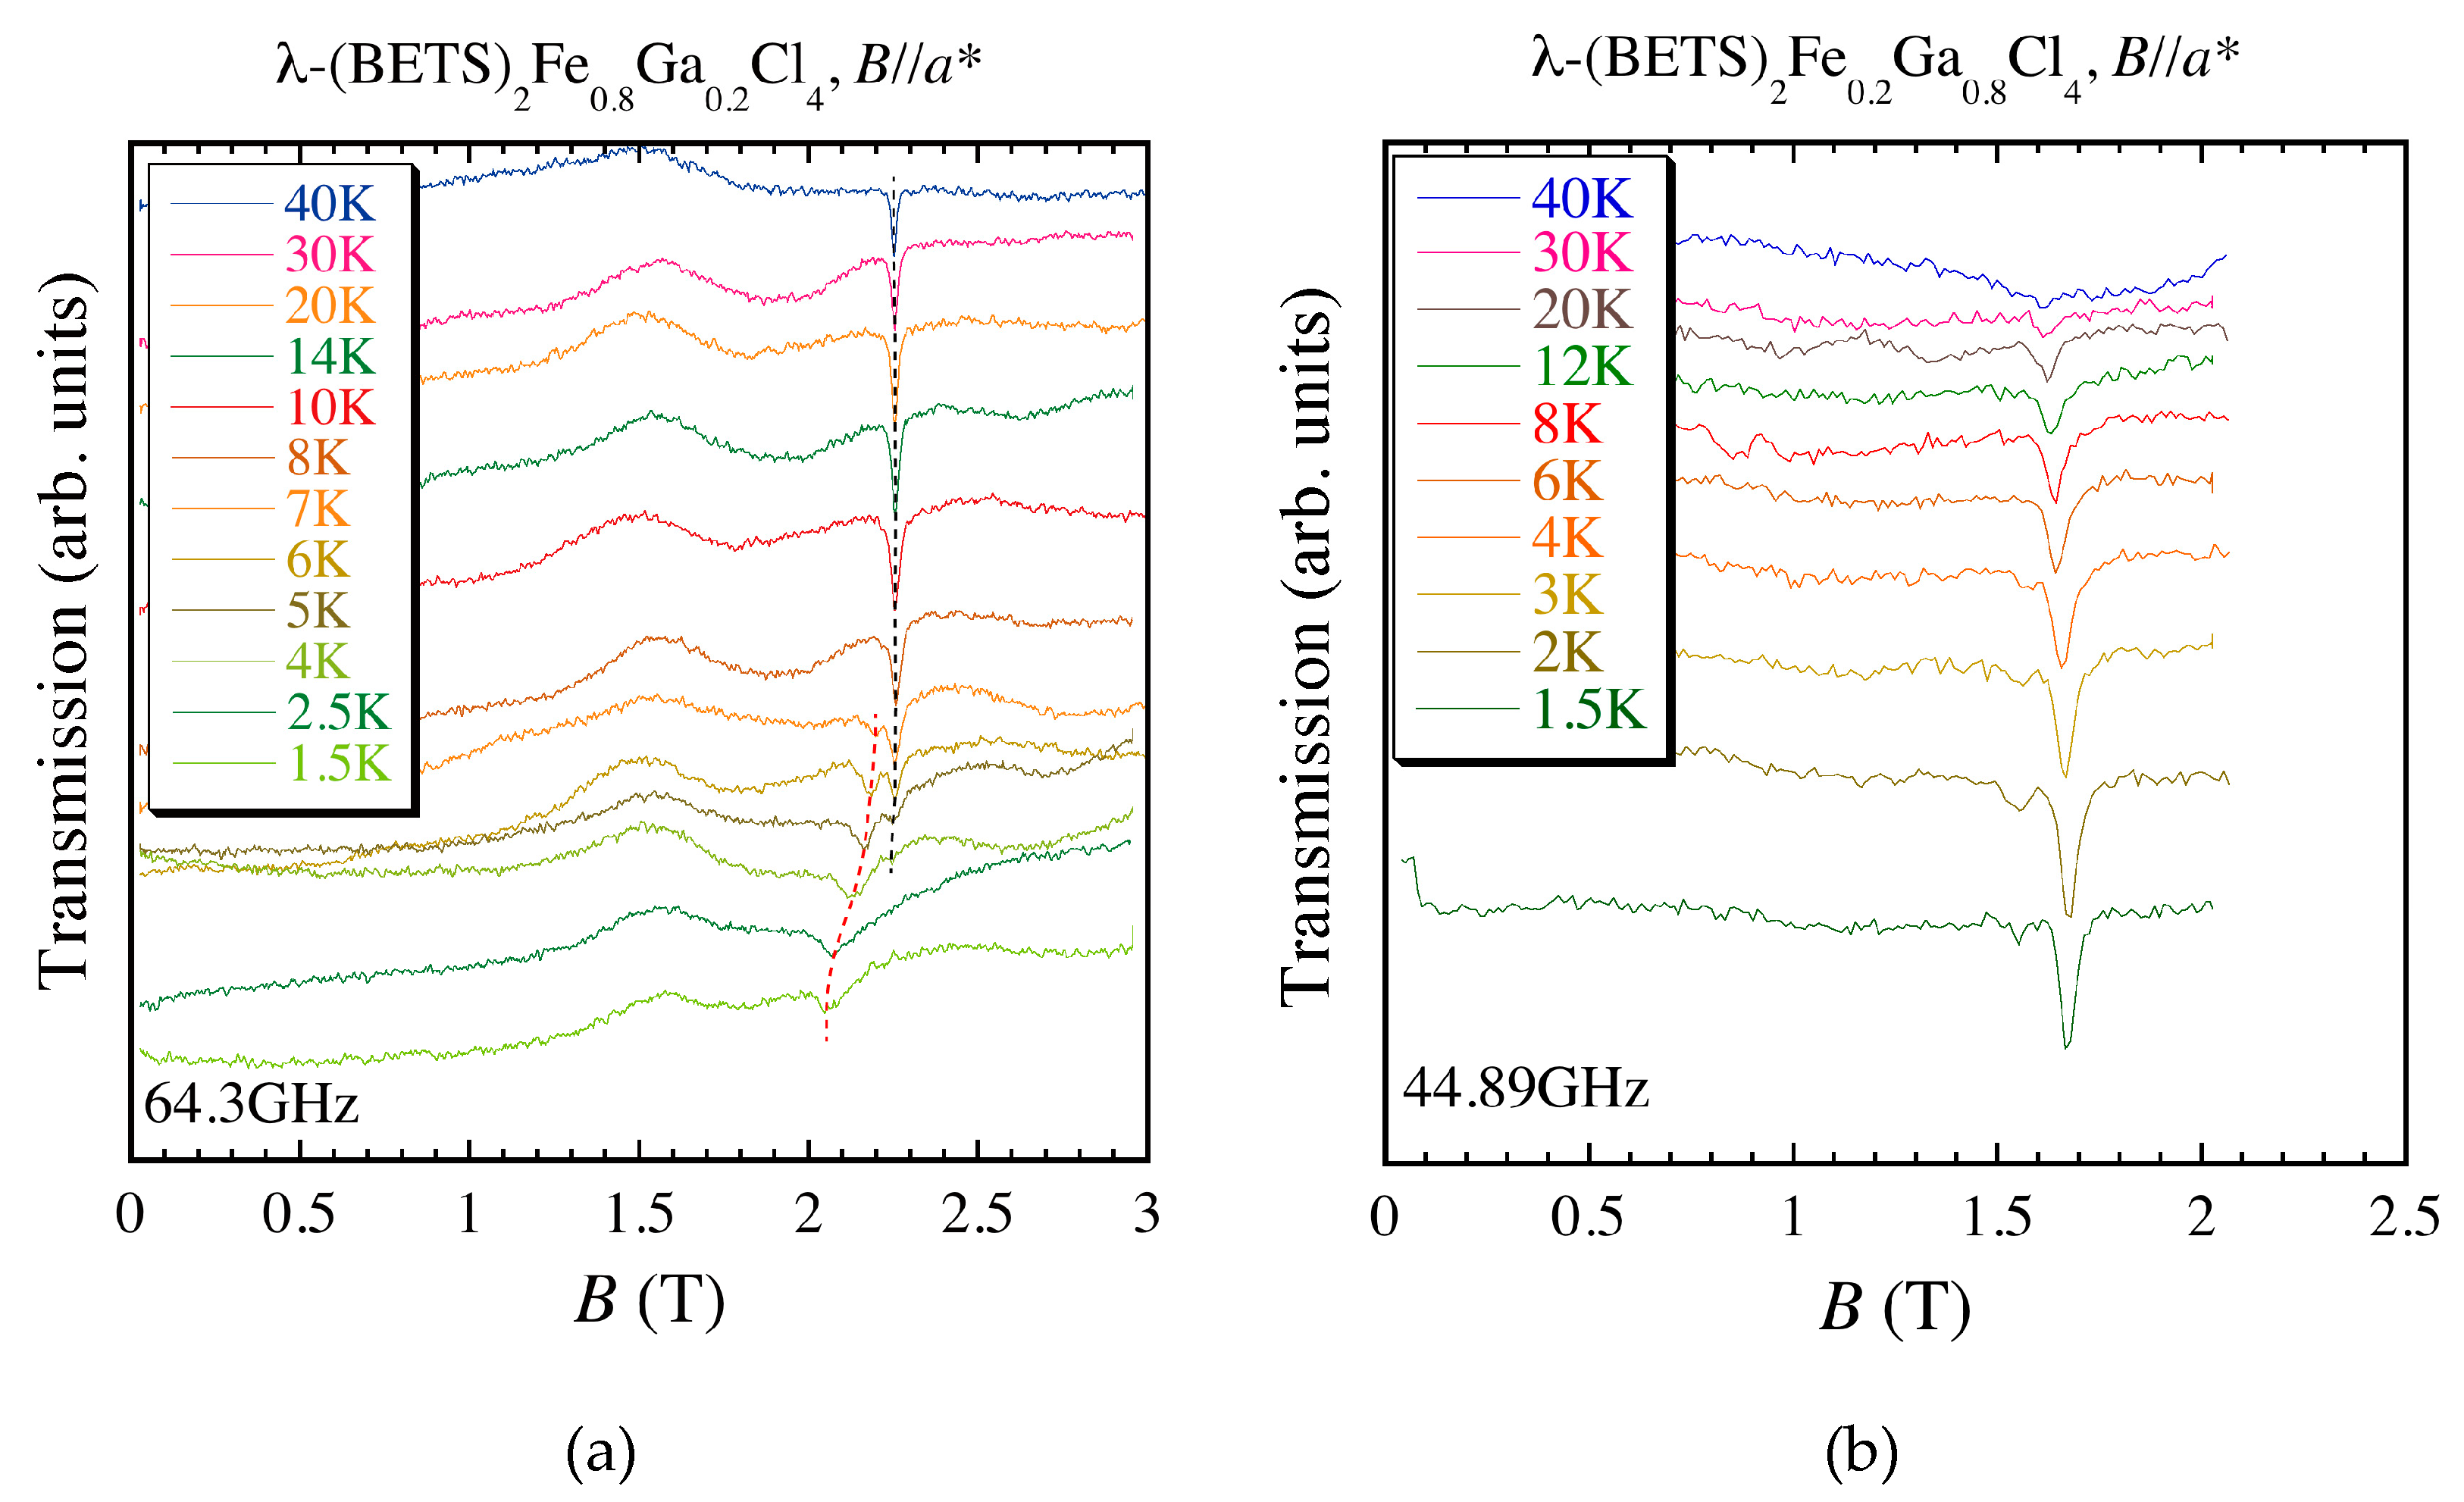
4.2. ESR Results of λ-(BETS)2FexGa1−xCl4 (x = 0.2~1.0)

As mentioned in the previous section, many ESR studies have already been performed for the pure λ-(BETS)2FeCl4 using microwave and millimeter-wave [6,8,12,44,46]. Here in this paper, we present our millimeter-wave and submillimeter-wave ESR results for the mixed compound λ-(BETS)2FexGa1−xCl4 (x = 0.2, 0.4, 0.5, 0.6, 0.8) and the pure λ-(BETS)2FeCl4, respectively. The millimeter-wave ESR measurements were performed by using a conventional cavity perturbation technique. The combination of an 8 T superconducting magnet and a millimeter-wave vector network analyzer (MVNA-8-350-2 of AB millimetre, France) was used. The MVNA includes a tunable millimeter-wave source and detector that cover the frequency range from 30 to 110 GHz. The sample was set on the end-plate of the cavity so that the oscillatory magnetic field is applied to the sample. For the mixed compound, the ESR results on the PM and AFI ground states for the field B//a* (the hard-axis in the antiferromagnetic state) are shown. We chose the a*-axis since it usually gives the strongest ESR signal owing to the needle shape of the single crystal, and other orientations usually give poor signals when using the millimeter-wave cavity. Moreover, it is always difficult to correctly find the easy-axis of the sample, which is tilted at 30° from the c-axis to the b*-axis. For these reasons, we discuss the results for the field B//a*. For the submillimeter-wave ESR measurement, we used a simple transmission technique. The 25 T resistive magnet and the backward wave oscillator (BWO) light source were used with the transmission technique. The BWO can cover the frequency range from 200 to 700 GHz by using several vacuum tubes. The sample was placed in the Voigt configuration (i.e., the dc magnetic field is perpendicular to the propagation of the light). Therefore, the geometry of B//c is convenient for the needle-shaped single crystal.
Let us start from the x = 0.8 and x = 0.2 salts of the mixed compound λ-(BETS)2FexGa1−xCl4. Temperature dependences of ESR spectra for x = 0.8 and 0.2 are presented in Figure 3a,b, respectively. As shown in the bottom panel of Figure 1b, the MI transition temperature TN for x = 0.8 and the superconducting critical temperature Tc for x = 0.2 are about 7 K and 5 K, respectively. A single ESR line is observed for the spectrum in the high temperature region for x = 0.8 as shown with a black broken eye-guide line in Figure 3a. The g-value is around 2.05, which is consistent with the previous results [6,8,44]. The ESR intensity increases as temperature decreases down to 10 K, and neither g-value nor linewidth show significant change, which is a typical behavior of electron paramagnetic resonance (EPR). Although the EPR line does not shift significantly, a small shift to a higher field with decreasing temperature is observed. Such slight g-shift of the EPR line is also observed in λ-(BETS)2FeCl4, and is supposed to indicate the development of the spin correlation between π- and d-electrons. [8,44]. The EPR intensity starts to diminish below 10 K, and disappears around 4 K. In turn, an additional broad resonance is observed at lower magnetic field of the EPR line at TN = 7 K as shown with a red broken line in Figure 3a. The intensity of this additional resonance increases and shifts to lower magnetic field with decreasing temperature. In principle, the AFMR mode for the hard-axis appears at the lower field from the EPR line. Hence, the additional peak observed below TN = 7 K is attributed to the AFMR since the a*-axis is the hard-axis. The shift of the AFMR is due to the development of the internal field. The important point is that the EPR line does not significantly shift with temperature, and the AFMR appears at the lower field than the EPR line and shifts to the lower field as temperature decreases. The ESR behavior for x = 0.8 is similar to that observed for the pure λ-(BETS)2FeCl4 (i.e., x = 1.0) as mentioned in the previous section. In contrast, the x = 0.2 salt only shows a single EPR line, intensity of which grows as the temperature decreases. Although the EPR slightly shifts to the higher field with decreasing temperature below 40 K, there is no drastic change (no g-shift and no linewidth broadening) at Tc = 5 K. This suggests that the magnetic flux is well penetrated in the sample even in the superconducting state. The superconducting state might be inhomogeneous with the coexistence of the paramagnetic domain since the Fe3+ spins are randomly introduced to the sample. As mentioned above, the ESR signals of the π- and d-electrons are averaged and merged into a single line due to the exchange narrowing. For both x = 0.2 and 0.8 salts, a single EPR line was observed. This suggests that the microscopic π-d interaction is strong and does not change with the content of the Fe3+ ions. Moreover, one can see that the S/N ratio of EPR spectra is different between the x = 0.2 and 0.8 salts with almost the same sample size. For instance, the x = 0.2 salt shows weaker EPR signal at 40 K. Furthermore, the noise level of the transmission for the x = 0.2 salt is larger than that for the x = 0.8 salt, although each EPR intensity looks almost the same. These results suggest that the EPR signal is weaker for the x = 0.2 salt than for the x = 0.8 salt. This is just because the Fe3+ content is smaller for the x = 0.2 salt. In turn, it suggests that the EPR signal from the Fe3+ spins is dominant.
Next, temperature dependences of the ESR spectra for the x = 0.4 and 0.5 salts are shown in Figure 4a,b, respectively. The MI transition occurs at about TN = 2.5 K for x = 0.4 and 4 K for x = 0.5, respectively. Both salts show the EPR down to the lowest temperature, and the AFMR, which appears at the lower field of the EPR line, starts to be observed at each TN. This suggests that the paramagnetic and antiferromagnetic states coexist. This coexistence is due to the random distribution of the Fe3+ spins in the anion layers. In the domain where the aggregation of the Fe3+ spins exist and the spin wave can propagate, the AFMR signal is observed. However, in the domain where the Fe3+ spins are isolated from each other, the EPR signal is observed. It means that the smaller the Fe content gets, the smaller the antiferromagnetic domain becomes. This picture can be justified from the observation of the smaller AFMR signal for the x = 0.4 salt in comparison with that for the x = 0.5 salt.
For the x = 0.6 salt, where TN is around 5 K, the EPR is observed in the high temperature region, and the AFMR starts to be observed at TN (Figure 5). In contrast to the x = 0.8 salt, the difference of the resonance field between the EPR and AFMR is smaller for the x = 0.6 salt. This is associated with the gradual transition from EPR to AFMR in the x = 0.6 salt. Such a small difference of the resonance field might be due to the difference in the exchange field by the Fe content. It is clear that there is no EPR signal down to the lowest temperature (1.5 K) for the x = 0.6 and 0.8 salts, although there is a slow transition from the PM state to the AFI state (i.e., coexistence of the AFMR and EPR signals is observed around TN). No EPR signal was also observed below TN for the pure x = 1.0 salt [8,12,46]. The lack of EPR at the lowest temperature suggests that there is no sign of paramagnetic Fe as a ground state of the mixed compound with x ≥ 0.6. These observations contradict the ‘paramagnetic Fe model’ where the Fe3+ spins remain paramagnetic in the AFI state. Since the intensity of the EPR signal, which mainly comes from the Fe3+ spins, is almost the same with that of the AFMR signal, the dominant contribution of the AFMR originates from the Fe3+ spins. Namely, if there is a ‘paramagnetic Fe’, it should be noticed from the EPR. Therefore, the lack of EPR signal below TN suggests the Fe3+ spins in the λ-(BETS)2FexGa1−xCl4 (x ≥ 0.6) are antiferromagnetically ordered.
Furthermore, a hump is observed around 1.5~1.6 T in the ESR spectra for the x = 0.8 salt (Figure 3a). This magnetic field position corresponds to g~2.9, which is similar to the peculiar ESR observed for the x = 0.6 and 1.0 salts (see the previous section) [8,44]. Kawamata et al. mentioned that such an ESR signal is due to the phase separation of the normal metallic and ferroelectric state. Although it depends on the frequency and the Fe content, similar hump structures are observed around 0.8 and 2.6 T for the x = 0.5 and 0.6 salts, respectively (Figure 4b and Figure 5). These humps are observed especially for the salts with higher Fe content (x ≥ 0.5). In contrast to the genuine ESR signal, whose transmission amplitude and phase of the millimeter-wave response change, the phase does not significantly change at the hump. Therefore, the hump is not actually an ESR signal, and is due to some high-frequency response of the sample, which might be related to the relaxor ferroelectric domain as mentioned in Section 3.4.
Let us finish this section by introducing our submillimeter-wave ESR measurements of the pure λ-(BETS)2FeCl4 in the high-field PM phase. As shown in Figure 6a, the submillimeter-wave transmission shows a huge change from 4 to 8 T, which is well below the Bc of the AFI phase. It is clear that this high-frequency response is not related to the MI transition. Although this change of the transmission is dependent on frequency and has some structures, it is similar to the observation of the depolarization regime reported by Rutel et al. [12]. With the higher magnetic field in the PM phase, where the transmission baseline becomes relatively flat, a single ESR signal is observed (arrows in Figure 6a and inset). This ESR corresponds to the EPR of the high-field PM phase. In the paramagnetic Fe model, it is expected that an internal field of about 4 T induces the splitting of the six energy levels of S = 5/2 [11]. The Zeeman splitting of 4 T corresponds to the energy gap of about 112 GHz (for g = 2). Therefore, ESR transitions with a gap of about 112 GHz at zero-field should be observed (shown as a broken line in Figure 6b). The observed ESR transition does not have a gap of 112 GHz.

5. Conclusions and Future Prospects

We have revisited the previous studies on the AFI phase of λ-(BETS)2FeCl4, which is still under strong debate, and have presented our high-frequency ESR measurements for λ-(BETS)2FexGa1−xCl4 (x = 0.2~1.0). The x = 0.2 salt shows a EPR signal down to the lowest temperature since the Fe spins are isolated each other and the spin wave cannot propagate due to the low content of magnetic ions. This suggests that the ground state of the x = 0.2 salt is a ‘paramagnetic’ superconductor. Both EPR and AFMR were observed for the x = 0.4 and 0.5 salts, and only AFMR was observed for the x = 0.6 and 0.8 salts at the lowest temperature. Note that the x = 1.0 salt also shows only AFMR below TN [8,12,46]. These results suggest that the 3D magnetic network starts to be formed in the system by the increase of the Fe content. The paramagnetic and antiferromagnetic domains coexist around x = 0.4~0.5, and finally, the system becomes totally antiferromagnetic in the x ≥ 0.6 region. It is clear that the Fe spins play an important role in the magnetic ground state.
To explain the excess specific heat below TN, Akiba et al. proposed that the π-electrons create an internal field of 4 T, which induces the degenarated six energy levels of Fe3+ (S = 5/2). Although such a gap should be detected by ESR, we could not observe the corresponding resonance in our submillimeter-wave measurements (estimated observation line shown in Figure 6b). Moreover, no EPR signal was found at the lowest temperature (1.5 K) in the x ≥ 0.6 region. Therefore, the paramagnetic Fe model needs reconsideration [11].
We point out that the huge change of the high-frequency response within the AFI phase, the colossal magnetodielectricity, and nonlinear transport should be considered more seriously [12,38,39]. As shown in Figure 2a, we observed kink structures in the resistance below TN (MI transition). Below the MI transition, the resistance gradually increases with decreasing temperature. The same kind of behavior was also observed by Toyota et al. and Sugiura et al. [27,38]. These results suggest that the π-electrons are not fully localized below the MI transition. We think such metastable nature of the π-electrons within the AFI phase is an origin of the high frequency response. In turn, such gradual localization of the π-electrons will affect the magnetic state of the Fe3+ spins through the π-d interaction, which explains the gradual transition from PM to AFI observed in ESR, and the gradual increase of the internal field in the Mössbauer measurement. The excess specific heat also could be due to such a metastable state of the π-electrons, which affects the magnetic state of the Fe3+ spins. The origin of this gradual localization of π-electrons needs further investigation and theoretical support.
The ‘chicken or egg problem’ of the AFI phase, whether the insulating mechanism is spin-driven or charge-driven, remains an open question. It is probably worth noting that the λ-(BETS)2GaCl4, which is an isostructural analog without the 3d spins, does not have the AFI ground state. Furthermore, the intermediate region (0.3 < x < 0.5) of the mixed compound shows a superconducting state, then, becomes insulating at the lowest temperature in association with the long-range order (see Figure 1b at the bottom). This suggests that the 3d spins play an important role for the MI transition, and the superconducting state is destroyed by the internal field of the antiferromagnetic long-range order. Our ESR results revealed that the π-d magnetic network is essential for the long-range order. If the Fe content is too small to form a magnetic network, the magnetic ground state is just paramagnetic, and the superconducting state remains at the lowest temperature. Therefore, the long-range order of the Fe spins seems to be essential for the MI transition, which favors the SDW-like transition scenario. As for the Mott transition scenario, theoretical studies suggest that the π-d interaction facilitates the Mott transition, which explains the different ground state between λ-(BETS)2GaCl4 and λ-(BETS)2FeCl4 [9,10]. Akiba et al. also proposed that the change of TN by the Fe content is due to the magnetic anisotropy of Fe which suppresses the fluctuation of the π system through the π-d interaction [23]. Therefore, both scenarios are not decisive, and this issue remains to be solved. The charge ordering-induced polarization model also remains a strong candidate [39]. As proposed by Cépas et al., the measurement of the charge gap as a function of the field would distinguish between the SDW and Mott insulator scenarios [10]. Microscopic measurements such as NMR, ESR, and µSR should be suitable for solving this problem. At present, it is still difficult to conclude from just the temperature dependence of the ESR spectra in the low-field region. Although it is still preliminary, we have recently found that the single AFMR mode for the hard-axis splits at the high magnetic field. We suppose it is due to the delocalization of the π-electrons by the magnetic field. Hence, multi-frequency ESR (i.e., magnetic field dependence) measurements, which cover the whole AFI phase, are highly desirable to resolve this problem.

Acknowledgments

This study was performed in collaboration with the late James S. Brooks. Y.O. would like to deeply acknowledge his support and guidance for this study. Y.O. would like to also express sincere gratitude to H. Kobayashi and A. Kobayashi for their long-standing supports providing the samples. Y.O. also acknowledges T. Tokumoto, E. Jobiliong, S. A. Zvyagin, J. Krzystek, S. Uji, K. Hiraki, H. Akiba, Y. Nishio, K. Shimada, S. Sugiura for valuable discussions. This work was partly supported by the Grant-in-Aid for Scientific Research on Innovative Areas (No. 20110004) and for Young Scientist (No. 17740207).

Author Contributions

Y.O. conceived, designed, and performed the experiments and analyzed the data; H.B.C. and R.K. prepared the sample; Y.O. and R.K. wrote the paper, and all authors critically reviewed the paper.

Conflicts of Interest

The authors declare no conflict of interest.

References

  1. Enomoto, K.; Yamaura, J.-I.; Miyazaki, A.; Enoki, T. Electronic and magnetic properties of organic conductors (DMET)2MBr4 (M = Fe, Ga). Bull. Chem. Soc. Jpn. 2003, 76, 945–959. [Google Scholar] [CrossRef]
  2. Hanasaki, N.; Tajima, H.; Matsuda, M.; Naito, T.; Inabe, T. Giant negative magnetoresistance in quasi-one-dimensional conductor TPP[Fe(Pc)(CN)2]2: Interplay between local moments and one-dimensional conduction electrons. Phys. Rev. B 2000, 62, 5839. [Google Scholar] [CrossRef]
  3. Uji, S.; Shinagawa, H.; Terashima, T.; Yakabe, T.; Terai, Y.; Tokumoto, M.; Kobayashi, A.; Tanaka, H.; Kobayashi, H. Magnetic0field-induced superconductivity in a two-dimensional organic conductor. Nature 2001, 410, 908–910. [Google Scholar] [CrossRef] [PubMed]
  4. Balicas, L.; Brooks, J.S.; Storr, K.; Uji, S.; Tokumoto, M.; Tanaka, H.; Kobayashi, H.; Kobayashi, A.; Barzykin, V.; Gor’kov, L.P. Superconductivity in an organic insulator at very high magnetic field. Phys. Rev. Lett. 2001, 87, 067002. [Google Scholar] [CrossRef] [PubMed]
  5. Uji, S.; Brooks, J.S. Magnetic-field-induced superconductivity in organic conductors. J. Phys. Soc. Jpn. 2006, 75, 051014. [Google Scholar] [CrossRef]
  6. Kobayashi, H.; Tomita, H.; Naito, T.; Kobayashi, A.; Sakai, F.; Watanabe, T.; Cassoux, P. New BETS Conductors with Magnetic Anions (BETS = bis (ethylenedithio)tetraselenafulvalene). J. Am. Chem. Soc. 1996, 118, 368–377. [Google Scholar] [CrossRef]
  7. Tokumoto, M.; Naito, T.; Kobayashi, H.; Kobayashi, A.; Laukhin, V.N.; Brossard, L.; Cassoux, P. Magnetic anisotropy of organic conductor λ-(BETS)2FeCl4. Synth. Met. 1997, 86, 2161–2162. [Google Scholar] [CrossRef]
  8. Brossard, L.; Clerac, R.; Coulon, C.; Tokumoto, M.; Ziman, T.; Petrov, D.K.; Laukhin, V.N.; Naughton, M.J.; Audouard, A.; Goze, F.; et al. Interplay between chains of localised spins and two-dimensional sheets of organic donors in the synthetically built magnetic multilayer. Eur. Phys. J. B 1998, 1, 439–452. [Google Scholar] [CrossRef]
  9. Hotta, C.; Fukuyama, H. Effects of localized spins in quasi-two dimensional organic conductors. J. Phys. Soc. Jpn. 2000, 69, 2577–2596. [Google Scholar] [CrossRef]
  10. Cépas, O.; McKenzie, R.H.; Merino, J. Magnetic-field-induced superconductivity in layered organic molecular crystals with localized magnetic moments. Phys. Rev. B 2002, 65, 100502R. [Google Scholar] [CrossRef]
  11. Akiba, H.; Nakano, S.; Nishio, Y.; Kajita, K.; Zhou, B.; Kobayashi, A.; Kobayashi, H. Mysterious Paramagnetic States of Fe 3d Spin in Antiferromagnetic Insulator of λ-BETS2FeCl4 System. J. Phys. Soc. Jpn. 2009, 78, 033601. [Google Scholar] [CrossRef]
  12. Rutel, I.; Okubo, S.; Brooks, J.S.; Jobiliong, E.; Kobayashi, H.; Kobayashi, A.; Tanaka, H. Millimeter-wave investigation of the antiferromagnetic phase in λ-(BETS)2FeCl4 in high magnetic fields. Phys. Rev. B 2003, 68, 144435. [Google Scholar] [CrossRef]
  13. Cui, H.-B.; Kobayashi, H.; Kobayashi, A. Phase diagram and anomalous constant resistivity state of a magnetic organic superconducting alloy, λ-(BETS)2FexGa1−xCl4. J. Mat. Chem. 2007, 17, 45–48. [Google Scholar] [CrossRef]
  14. Uji, S.; Shinagawa, H.; Terakura, C.; Terashima, T.; Yakabe, T.; Terai, Y.; Tokumoto, M.; Kobayashi, A.; Tanaka, H.; Kobayashi, H. Fermi surface studies in the magnetic-field-induced superconductor λ-(BETS)2FeCl4. Phys. Rev. B 2001, 64, 024531. [Google Scholar] [CrossRef]
  15. Sato, A.; Ojima, E.; Akutsu, H.; Kobayashi, H.; Kobayashi, A.; Cassoux, P. Temperature-Composition Phase Diagram of the Organic Alloys, λ-BETS2(FexGa1−x)Cl4, with Mixed Magnetic and Non-Magnetic Anions. Chem. Lett. 1998, 27, 673. [Google Scholar] [CrossRef]
  16. Goze, F.; Laukhin, V.N.; Brossard, L.; Audouard, A.; Ulmet, J.P.; Askenazy, S.; Naito, T.; Kobayashi, H.; Kobayashi, A.; Tokumoto, M.; et al. Magnetotransport Measurements on the λ-Phase of the Organic Conductors (BETS)2MCl4 (M = Ga, Fe). Magnetic-Field-Restored Highly Conducting State in λ-(BETS)2FeCl4. Eur. Phys. Lett. 1994, 28, 427–432, ibid. Physica B 1995, 211, 290–292. [Google Scholar] [CrossRef]
  17. Akutsu, H.; Kato, K.; Ojima, E.; Kobayashi, H.; Tanaka, H.; Kobayashi, A.; Cassoux, P. Coupling of metal-insulator and antiferromagnetic transitions in the highly correlated organic conductor incorporating magnetic anions, λ-BETS2FeBrxCl4−x [BETS = Bis (ethylenedithio) tetraselenafulvalene]. Phys. Rev. B 1998, 58, 9294–9302. [Google Scholar] [CrossRef]
  18. Sasaki, T.; Uozaki, H.; Endo, S.; Toyota, N. Magnetic torque of λ-(BETS)2FeCl4. Synth. Met. 2001, 120, 759–760. [Google Scholar] [CrossRef]
  19. Uji, S.; Terakura, C.; Terashima, T.; Yakabe, T.; Terai, Y.; Tokumoto, M.; Kobayashi, A.; Sakai, F.; Tanaka, H.; Kobayashi, H. Fermi surface and internal magnetic field of the organic conductor λ-(BETS)2FexGa1−xCl4. Phys. Rev. B 2002, 65, 113101. [Google Scholar] [CrossRef]
  20. Sato, A.; Ojima, E.; Akutsu, H.; Nakazawa, Y.; Kobayashi, H.; Tanaka, H.; Kobayashi, A.; Cassoux, P. Magnetic properties of λ-BETS2(FexGa1−x)Cl4 exhibiting a superconductor-to-insulator transition (0.35 < x < 0.5). Phys. Rev. B 2000, 61, 111–114. [Google Scholar]
  21. Negishi, E.; Uozaki, H.; Ishizaki, Y.; Tsuchiya, H.; Endo, S.; Abe, Y.; Matsui, H.; Toyota, N. Specific heat studies for λ-(BEDT-TSF)2FeCl4. Synth. Met. 2003, 133–134, 555–556. [Google Scholar] [CrossRef]
  22. Akiba, H.; Nobori, K.; Shimada, K.; Nishio, Y.; Kajita, K.; Zhou, B.; Kobayahshi, A.; Kobayashi, H. Magnetic and Thermal Properties of λ-(BETS)2FeCl4 System—Fe 3d Spin in Antiferromagnetic Insulating Phase—. J. Phys. Soc. Jpn. 2011, 80, 063601. [Google Scholar] [CrossRef]
  23. Akiba, H.; Sugawara, H.; Nobori, K.; Shimada, K.; Tajima, N.; Nishio, Y.; Kajita, K.; Zhou, B.; Kobayashi, A.; Kobayashi, H. Paramagnetic Metal—Antiferromagnetic Insulator Transition of λ-BETS2FexGa1−xCl4 System. J. Phys. Soc. Jpn. 2012, 81, 053601. [Google Scholar] [CrossRef]
  24. Shimada, K.; Akiba, H.; Tajima, N.; Kajita, K.; Nishio, Y.; Kato, R.; Kobayashi, A.; Kobayashi, H. Temperature Dependence of Internal Field by Analysis of Specific Heat on an Organic Conductor λ-BETS2FeCl4. JPS Conf. Proc. 2014, 1, 012110. [Google Scholar]
  25. Shimada, K.; Tajima, N.; Kajita, K.; Nishio, Y. Effective Field Study of Canted Antiferromagnetic Insulating Phase in Magnetic Organic Conductor λ-(BETS)2FeCl4 through Specific Heat Measurement. J. Phys. Soc. Jpn. 2016, 85, 023601. [Google Scholar] [CrossRef]
  26. Waerenborgh, J.C.; Rabaça, S.; Almeida, M.; Lopes, E.B.; Kobayashi, A.; Zhou, B.; Brooks, J.S. Mössbauer spectroscopy and magnetic transition of λ-(BETS)2FeCl4. Phys. Rev. B 2010, 81, 060413R. [Google Scholar] [CrossRef]
  27. Sugiura, S.; Shimada, K.; Tajima, N.; Nishio, Y.; Terashima, T.; Isono, T.; Kobayashi, A.; Zhou, B.; Kato, R.; Uji, S. Charge Transport in Antiferromagnetic Insulating Phase of Two-Dimensional Organic Conductor λ-(BETS)2FeCl4. J. Phys. Soc. Jpn. 2016, 85, 064703. [Google Scholar] [CrossRef]
  28. Sugiura, S.; Shimada, K.; Tajima, N.; Nishio, Y.; Terashima, T.; Isono, T.; Kato, R.; Uji, S. Magnetic Torque Studies in Two-Dimensional Organic Conductor λ-(BETS)2FeCl4. J. Phys. Soc. Jpn. 2017, 86, 014702. [Google Scholar] [CrossRef]
  29. Mori, T.; Katsuhara, M. Estimation of πd-Interactions in Organic Conductors Including Magnetic Anions. J. Phys. Soc. Jpn. 2002, 71, 826–844. [Google Scholar] [CrossRef]
  30. Ito, K.; Shimahara, H. Mean Field Theory of a Coupled Heisenberg Model and Its Application to an Organic Antiferromagnet with Magnetic Anions. J. Phys. Soc. Jpn. 2016, 85, 024704. [Google Scholar] [CrossRef]
  31. Shimahara, H.; Ito, K. Spin-Flop Transition and a Tilted Canted Spin Structure in a Coupled Antiferromagnet. J. Phys. Soc. Jpn. 2016, 85, 043708. [Google Scholar] [CrossRef]
  32. Matsui, H.; Tsuchiya, H.; Negishi, E.; Uozaki, H.; Ishizaki, Y.; Abe, Y.; Endo, S.; Toyota, N. Anomalous dielectric response in the π-d correlated metallic state of λ-(BEDT-TSF)2FeCl4. J. Phys. Soc. Jpn. 2001, 70, 2501–2504. [Google Scholar] [CrossRef]
  33. Kitano, H.; Maeda, A. Comment on “Anomalous dielectric response in the π-d correlated metallic state of λ-(BEDT-TSF)2FeCl4”. J. Phys. Soc. Jpn. 2002, 71, 666–667. [Google Scholar] [CrossRef]
  34. Matsui, H.; Tsuchiya, H.; Toyota, N. Reply to Comment by H. Kitano and A. Maeda. J. Phys. Soc. Jpn. 2002, 71, 668–669. [Google Scholar] [CrossRef]
  35. Matsui, H.; Tsuchiya, H.; Suzuki, T.; Negishi, E.; Toyota, N. Relaxor ferroelectric behavior and collective modes in the π-d correlated anomalous metal λ-(BEDT-TSF)2FeCl4. Phys. Rev. B 2003, 68, 155105. [Google Scholar] [CrossRef]
  36. Watanabe, M.; Komiyama, S.; Kiyanagi, R.; Noda, Y.; Negishi, E.; Toyota, N. Evidence of the First-Order Nature of the Metal–Insulator Phase Transition in λ-(BEDT-TSF)2FeCl4. J. Phys. Soc. Jpn. 2003, 72, 452–453. [Google Scholar] [CrossRef]
  37. Komiyama, S.; Watanabe, M.; Noda, Y.; Negishi, E.; Toyota, N. Relaxor-like Behavior in λ-(BEDT-TSF)2FeCl4 Studied by SR X-ray Diffraction. J. Phys. Soc. Jpn. 2004, 73, 2385–2388. [Google Scholar] [CrossRef]
  38. Toyota, N.; Abe, Y.; Matsui, H.; Negishi, E.; Ishizaki, Y.; Tsuchiya, H.; Uozaki, H. Nonlinear electrical transport in λ-(BEDT-TSF)2FeCl4. Phys. Rev. B 2002, 66, 033201. [Google Scholar] [CrossRef]
  39. Negishi, E.; Kuwabara, T.; Komiyama, S.; Watanabe, M.; Noda, Y.; Mori, T.; Matsui, H.; Toyota, N. Dielectric ordering and colossal magnetodielectricity in the antiferromagnetic insulating state of λ-(BEDT-TSF)2FeCl4. Phys. Rev. B 2005, 71, 012416. [Google Scholar] [CrossRef]
  40. Oh, J.I.; Naughton, M.J.; Courcet, T.; Malfant, I.; Cassoux, P.; Tokumoto, M.; Akutsu, H.; Kobayashi, H.; Kobayashi, A. Torque anisotropy in λ-(BEDT-TSF)2FeCl4. Synth. Met. 1999, 103, 1861–1864. [Google Scholar] [CrossRef]
  41. Endo, S.; Goto, T.; Fukase, T.; Matsui, H.; Uozaki, H.; Tsuchiya, H.; Negishi, E.; Ishizaki, Y.; Abe, Y.; Toyota, N. Anomalous Splitting of 1H-NMR Spectra in λ-(BEDT-TSF)2FeCl4. J. Phys. Soc. Jpn. 2002, 71, 732–734. [Google Scholar] [CrossRef]
  42. Wu, G.; Ranin, P.; Gaidos, G.; Clark, W.G.; Brown, S.E.; Balicas, L.; Montgomery, L.K. 1H-NMR spin-echo measurements of the spin dynamic properties in λ-(BETS)2FeCl4. Phys. Rev. B 2007, 75, 174416. [Google Scholar] [CrossRef]
  43. Hiraki, K.; Mayaffre, H.; Horvatic, M.; Berthier, C.; Uji, S.; Yamaguchi, T.; Tanaka, H.; Kobayashi, A.; Kobayashi, H.; Takahashi, T. 77Se NMR Evidence for the Jaccarino–Peter Mechanism in the Field Induced Superconductor, λ-(BETS)2FeCl4. J. Phys. Soc. Jpn. 2007, 76, 124708. [Google Scholar] [CrossRef]
  44. Kawamata, S.; Kizawa, T.; Suzuki, T.; Negishi, E.; Matsui, H.; Toyota, N.; Ishida, T. π-d Correlation in λ-(BEDT-TSF)2Fe1−xGaxCl4 by ESR Measurements. J. Phys. Soc. Jpn. 2006, 75, 104715. [Google Scholar] [CrossRef]
  45. Oshima, Y.; Jobiliong, E.; Brooks, J.S.; Zvyagin, S.A.; Krzystek, J.; Tanaka, H.; Kobayashi, A.; Cui, H.; Kobayashi, H. EMR Measurements of Field-Induced Superconductor λ-(BEDT-TSF)2Fe1−xGaxCl4. Synth. Met. 2005, 153, 365–368. [Google Scholar] [CrossRef]
  46. Suzuki, T.; Matsui, H.; Tsuchiya, H.; Negishi, E.; Koyama, K.; Toyota, N. Antiferromagnetic resonance in λ-(BETS)2FeCl4. Phys. Rev. B 2003, 67, 020408R. [Google Scholar] [CrossRef]
Figure 1. (a) Left: Crystal structure of λ-(BETS)2FeCl4. A and B denote two crystallographically independent BETS molecules, and the double headed arrows represent short Cl···S(Se) contacts. Right: Molecular arrangement of the BETS molecules and the anions in λ-(BETS)2FeCl4; (b) Top: T-B phase diagram of λ-(BETS)2FeCl4 extracted from Reference [8,12]. Bottom: T-x phase diagram of λ-(BETS)2FexGa1−xCl4 extracted from Reference [13]. Antiferromagnetic insulator (AFI) and superconductor (SC) phases are determined from the metal-insulator and superconducting transitions, respectively (red circles). PM = paramagnetic metal. A metastable state in the AFI phase (see Section 3.4 for detail) was claimed from high-frequency measurements (black circles) [12].
Magnetochemistry 03 00010 g001
Figure 2. Resistance at zero-field and the magnetoresistance of λ-(BETS)2FeCl4. (a) resistance versus temperature; (b) resistance versus magnetic field. The current is applied along the c-axis, and the magnetic field perpendicular to the c-axis. Hysteresis and kink structures are observed below the MI transition temperature (solid circles and squares).
Magnetochemistry 03 00010 g002
Figure 3. Temperature dependences of the ESR spectra of λ-(BETS)2FexGa1-xCl4 (a) for x = 0.8 and (b) for x = 0.2. The magnetic field is applied parallel to the a*-axis. The black and red broken lines are the eye-guide of the EPR and AFMR lines, respectively.
Magnetochemistry 03 00010 g003
Figure 4. Temperature dependences of the ESR spectra of λ-(BETS)2FexGa1−xCl4 (a) for x = 0.4 and (b) for x = 0.5. The magnetic field is applied parallel to the a*-axis.
Magnetochemistry 03 00010 g004
Figure 5. Temperature dependences of the ESR spectra of λ-(BETS)2FexGa1−xCl4 for the x = 0.6 salt. The magnetic field is applied parallel to the a*-axis. The broken line is the eye-guide of the EPR line’s resonance field at 40 K.
Magnetochemistry 03 00010 g005
Figure 6. (a) Frequency dependences of the ESR spectra of λ-(BETS)2FeCl4 using submillimeter-wave at 2 K. The inset is the zoomed spectra around the EPR line; (b) The frequency-resonance field plots at 2 K. The magnetic field is applied parallel to the c-axis. The circles and triangles represent the EPR signal at the high-field PM phase and the AFMR signal in the AFI phase, respectively. The purple curve is the typical AFMR mode for the easy-axis, and the orange broken line is the expected ESR line for the paramagnetic Fe model (with a gap of 112 GHz~4 T at zero-field).
Magnetochemistry 03 00010 g006

