
Vibrational Coupling of Nearest Neighbors in 1-D Spin Crossover Polymers of Rigid Bridging Ligands. A Nuclear Inelastic Scattering and DFT Study

 ,
,
Abstract
:
1. Introduction
2. Materials and Methods
3. Results and Discussion
4. Conclusions
Supplementary Materials
Acknowledgments
Author Contributions
Conflicts of Interest
Abbreviations
| DFT | Density Functional Theory |
| NIS | Nuclear Inelastic Scattering |
| SCO | Spin Crossover |
References
- Garcia, Y.; Niel, V.; Muñoz, M.C.; Real, J.-A. Spin Crossover in 1D, 2D and 3D Polymeric Fe(II) Networks. Top. Curr. Chem. 2004, 233, 229–257. [Google Scholar]
- Roubeau, O. Triazole-Based One-Dimensional Spin-Crossover Polymers. Chem. Eur. J. 2012, 18, 15230–15244. [Google Scholar] [CrossRef] [PubMed]
- Gütlich, P.; Goodwin, H.A. Spin Crossover in Transition Metal Compounds I–III; Springer: Berlin Heidelberg, Germany, 2004. [Google Scholar]
- Bousseksou, A.; Molnar, G.; Salmon, L.; Nicolazzi, W. Molecular spin crossover phenomenon: recent achievements and prospects. Chem. Soc. Rev. 2011, 40, 3313–3335. [Google Scholar] [CrossRef] [PubMed]
- Gütlich, P. Spin Crossover—Quo Vadis? Eur. J. Inorg. Chem. 2013, 581–591. [Google Scholar] [CrossRef]
- Halcrow, M. (Ed.) Spin-Crossover Materials: Properties and Aplications; Wiley: Chichester, UK, 2013.
- Kahn, O.; Kröber, J.; Jay, C. Spin Transition Molecular Materials for Displays and Data Recording. Adv. Mat. 1992, 4, 719–728. [Google Scholar] [CrossRef]
- Kröber, J.; Audière, J.P.; Claude, R.; Codjovi, E.; Khan, O.; Haasnoot, J.G.; Grolière, F.; Jay, F.; Bousseksou, A.; Linares, J.; et al. Spin Transitions and Thermal Hysterseses in the Molecular-Based Materials [Fe(Htrz)2(trz)](BF4) and [Fe(Htrz)2(trz)](BF4)∙H2O (Htrz=1,2,4-4H-triazole; trz = 1,2,4-triazolato). Chem. Mater. 1994, 6, 1404–1412. [Google Scholar] [CrossRef]
- Kahn, O.; Jay-Martinez, C. Spin-Transition Polymers: From Molecular Materials Toward Memory Devices. Science 1998, 279, 44–48. [Google Scholar] [CrossRef]
- Dîrtu, M.M.; Rotaru, A.; Gillard, D.; Linares, J.; Codjovi, E.; Tinant, B.; Garcia, Y. Prediction of the spin transition temperature in Fe(II) one-dimensional coordination polymers: An anion based database. Inorg. Chem. 2009, 48, 7838–7852. [Google Scholar] [CrossRef] [PubMed]
- Lavrenova, L.G.; Shakirova, O.G.; Ikorskii, V.N.; Varnek, V.A.; Sheludyakova, L.A.; Larionov, S.V. 1A1 → 5T2 Spin Transition in New Thermochromic Iron(II) Complexes with 1,2,4-Triazole and 4-Amino-1,2,4-Triazole. Russ. J. Coord. Chem. 2003, 29, 24–30. [Google Scholar]
- Dîrtu, M.M.; Schmidt, F.; Naik, D.A.; Rusu, I.; Rotaru, A.; Rackwitz, S.; Wolny, J.A.; Schünemann, V.; Spinu, L.; Garcia, B.Y. Two-Step Spin Transition in a 1D FeII 1,2,4-Triazole Chain Compound. Chem. Eur. J. 2014, 21, 5843–5856. [Google Scholar] [CrossRef] [PubMed]
- Müller, D.; Knoll, C.; Stöger, B.; Reissner, M.; Weinberger, P. A Modified Synthetic Pathway for the Synthesis of so far Inaccessible N1-Functionalized Tetrazole Ligands—Synthesis and Characterization of the 1D Chain-Type Spin Crossover Compound [Fe(3ditz)3](BF4)2. Eur. J. Inorg. Chem. 2013, 5–6, 984–991. [Google Scholar] [CrossRef] [PubMed]
- Forestier, T.; Mornet, S.; Daro, N.; Nishihara, T.; Mouri, S.-I.; Tanaka, K.; Fouche, O.; Freysz, E.; Letard, J.-F. Nanoparticles of iron(II) spin-crossover. Chem. Commun. 2008, 4327–4329. [Google Scholar] [CrossRef] [PubMed]
- Salmon, L.; Molnar, G.; Thibault, C.; Salmon, L.; Bousseksou, A.; Vieu, C. Soft lithographic patterning of spin crossover nanoparticles. Langmuir 2010, 26, 1557–1560. [Google Scholar]
- Tokarev, A.; Salmon, L.; Guari, Y.; Nicolazzi, W.; Molnar, G.; Bousseksou, A. Cooperative spin crossover phenomena in [Fe(NH2trz)3](tosylate)2 nanoparticles. Chem. Commun. 2010, 46, 8011–8013. [Google Scholar] [CrossRef] [PubMed]
- Zitouni, D.; Quintero, C.; Bergaud, C.; Micheau, J.-C.; Bousseksou, A. A novel approach for fluorescent thermometry and thermal imaging purposes using spin crossover nanoparticles. J. Mater. Chem. 2010, 20, 5499–5503. [Google Scholar]
- Coronado, E.; Galan-Mascaros, J.R.; Monrabal-Capilla, M.; Garcia-Martinez, J.; Pardo-Ibanez, P. Bistable Spin-Crossover Nanoparticles Showing Magnetic Thermal Hysteresis near Room Temperature. Adv. Mater. 2007, 19, 1359–1361. [Google Scholar] [CrossRef]
- Galan-Mascaros, J.R.; Coronado, E.; Forment-Aliaga, A.; Monrabal-Capilla, M.; Pinilla-Cienfuegos, E.; Ceolin, M. Tuning size and thermal hysteresis in bistable spin crossover nanoparticles. Inorg. Chem. 2010, 49, 5706–5714. [Google Scholar] [CrossRef] [PubMed]
- Tokarev, A.; Salmon, L.; Guari, Y.; Molnar, G.; Bousseksou, A. Synthesis of spin crossover nano-objects with different morphologies and properties. New. J. Chem. 2011, 35, 2081–2088. [Google Scholar] [CrossRef]
- Forestier, T.; Mornet, S.; Kaiba, A.; Pechev, S.; Denux, D.; Guionneau, P.; Daro, N.; Nishihara, T.; Mouri, S.-I.; Tanaka, K.; et al. Nanoparticles of [Fe(NH2-trz)3]Br2 3H2O (NH2-trz = 4-amino-1,2,4-triazole) prepared by the reverse micelle technique: Influence of particle and coherent domain size on spin-crossover properties. Chem. Eur. J. 2009, 25, 6122–6130. [Google Scholar] [CrossRef] [PubMed]
- Enanescu, C.; Nishino, M.; Miyashita, S. Spin-Crossover Materials; Halcrow, M., Ed.; Wiley: Chichester, UK, 2013. [Google Scholar]
- Gudyma, I.; Maksymov, A.; Enanescu, C. Phase transition in spin-crossover compounds in the breathing crystal field model. Phys. Rev. B 2014, 89, 224412–224419. [Google Scholar] [CrossRef]
- Spiering, H. Elastic Interaction in Spin Crossover Compounds. Top. Curr. Chem. 2004, 235, 171–195. [Google Scholar]
- Grosjean, A.; Daro, N.; Pechev, S.; Moulet, L.; Etrillard, C.; Chastanet, G.; Guinneau, P. The Spin-Crossover Phenomenon at the Coherent-Domains Scale in 1D Polymeric Powders: Evidence for a Structural Fatigability. Eur. J. Inorg. Chem. 2016. [Google Scholar] [CrossRef]
- Linares, J.; Spiering, H.; Varret, F. Analytical solution of 1D Ising-like systems modified by weak long range interaction. Eur. J. Phys. B 1999, 10, 271–275. [Google Scholar]
- Klokishner, S.; Linares, J.; Varret, F. Effect of hydrostatic pressure on phase transitions in spin-crossover 1D systems. Chem. Phys. 2000, 255, 317–323. [Google Scholar] [CrossRef]
- Rackwitz, S.; Klopper, W.; Schünemann, V.; Wolny, J.A. Quantification of intramolecular cooperativity in polynuclear spin crossover Fe(II) complexes by density functional theory calculations. Phys. Chem. Chem. Phys. 2013, 15, 15450–15458. [Google Scholar] [CrossRef] [PubMed]
- Rackwitz, S.; Wolny, J.A.; Muffler, K.; Achterhold, K.; Rüffer, R.; Garcia, Y.; Diller, R.; Schünemann, V. Vibrational properties of the polymeric spin crossover (SCO) Fe(II) complexes [{Fe(4-amino-1,2,4-triazole)3}X2]n: A nuclear inelastic scattering (NIS), Raman and DFT study. Phys. Chem. Chem. Phys. 2012, 14, 14650–14660. [Google Scholar] [CrossRef] [PubMed]
- Wolny, J.A.; Diller, R.; Schünemann, V. Vibrational Spectroscopy of Mono- and Polynuclear Spin-Crossover Systems. Eur. J. Inorg. Chem. 2012, 16, 2635–2648. [Google Scholar] [CrossRef]
- Felix, G.; Mikolasek, M.; Peng, H.; Nicolazzi, W.; Molnar, G.; Chumakov, A.I.; Salmon, L.; Bousskesou, A. Lattice dynamics in spin-crossover nanoparticles through nuclear inelastic scattering. Phys. Rev. B. 2015, 91, 024422–024425. [Google Scholar]
- Wolny, J.A.; Rackwitz, S.; Chumakov, A.I.; Faus, I.; Huang, H.; Rüffer, R.; Schlage, K.; Wille, H.-C.; Schünemann, V. Experimental evidence of the vibrational coupling of nearest neighbours in 1D spin crossover polymers of rigid bridging ligands. Hyperfine Inter. 2014, 226, 193–197. [Google Scholar] [CrossRef]
- Wolny, J.A.; Rackwitz, S.; Achterhold, K.; Muffler, K.; Schünemann, V. Nuclear inelastic scattering of 1D polymeric Fe(II) complexes of 1,2,4-aminotriazole in their high-spin and low-spin state. Hyperfine Interact. 2012, 204, 129–132. [Google Scholar] [CrossRef]
- Reiher, M.; Salomon, O.; Hess, B.A. Reparametrization of hybrid functionals based on energy differences of states of different multiplicity. Theor. Chim. Act. 2001, 107, 48–55. [Google Scholar] [CrossRef]
- Salomon, O.; Reiher, M.; Hess, B.A. Assertion and validation of the performance of the B3LYP⋆ functional for the first transition metal row and the G2 test set. J. Chem. Phys. 2002, 117, 4729–4737. [Google Scholar] [CrossRef]
- Stevens, W.J.; Basch, H.; Krauss, J. Compact effective potentials and efficient shared-exponent basis-sets for the 1st-row and 2nd-row atoms. J. Phys. Chem. 1984, 81, 6026–6033. [Google Scholar] [CrossRef]
- Stevens, W.J.; Krauss, M.; Basch, H.; Jasien, P.G. Relativistic compact effective potentials and efficient, shared-exponent basis-sets for the 3rd-row, 4th-row, and 5th-row atoms. Can. J. Chem. 1992, 70, 612–630. [Google Scholar]
- Cundari, T.R.; Stevens, W.J. Effective core potential methods for the lanthanides. J. Chem. Phys. 1993, 98, 5555–5565. [Google Scholar] [CrossRef]
- Frisch, M.J.; Trucks, G.W.; Schlegel, H.B.; Scuseria, G.E.; Robb, M.A.; Cheeseman, J.R.; Scalmani, G.; Barone, V.; Mennucci, B.; Petersson, G.A. Gaussian 09, Revision D.01; Gaussian: Wallingford, CT, USA, 2013. [Google Scholar]
- Paulsen, H.; Winkler, H.; Trautwein, A.X.; Grünstreudel, H.; Rusanov, V.; Toftlund, H. Measurement and simulation of nuclear inelastic-scattering spectra of molecular crystals. Phys. Rev B. 1999, 59, 975–984. [Google Scholar] [CrossRef]
- Murakami, Y.; Komatsu, T.; Kojima, N. Control of Tc and spin bistability in the spin-crossover system, [Fe(4-NH2trz) 3](R-SO3)2. Synth. Metals 1999, 103, 2157–2158. [Google Scholar] [CrossRef]
- Codjovi, E.; Sommier, L.; Kahn, O.; Jay, C. A spin transition molecular material with an exceptionally large thermal hystersisi loop at room temperature. New J. Chem. 1996, 20, 503–505. [Google Scholar]
- Sorai, M. Heat Capacity Studies of Spin Crossover Systems. Top. Curr. Chem. 2004, 235, 153–170. [Google Scholar]
- Sorai, M.; Ensling, J.; Gütlich, P. Mössbauer Effect Study on Low Spin 1A1 <-> High-Spin 5T2 Transition in tris(2-picolylamine) iron chloride I. Dilution Effect in [FexZn1−x(2-pic)3]Cl2 C2H5OH. Chem. Phys. 1976, 19, 199–209. [Google Scholar]
- Molnár, T.; Galetm, A.; Molnár, G.; Carmen Munoz, M.; Zwick, A.; Tanaka, K.; Real, J.-A.; Bousseksou, A. Metal Dilution Effects on the Spin-Crossover Properties of the Three-Dimensional Coordination Polymer Fe(pyrazine)[Pt(CN)4]. J. Phys.Chem. B 2005, 109, 14859–14867. [Google Scholar]
- Tuchagues, J.-P.; Bousseksou, A.; Molnár, G.; McGarvey, J.J.; Varret, F. The Role of Molecular Vibrations in the Spin Crossover Phenomenon. Top. Curr. Chem. 2004, 235, 85–103. [Google Scholar]
- Benda, R.; Bousseksou, A.; Chumakov, A.I.; Dennis, A.; Hert, C.; Gütlich, P.; Höfer, A.; McGarvey, J.J.; Paulsen, H.; Ronayne, K.L.; et al. Vibrational spectrum of the spin crossover complex [Fe(phen)2(NCS)2] studied by IR and Raman spectroscopy, nuclear inelastic scattering and DFT calculations. Phys. Chem. Chem. Phys. 2006, 8, 4685–4693. [Google Scholar]
- Paulsen, H.; Schünemann, V.; Wolny, J. Progress in Electronic Structure Calculations on Spin-Crossover Complexes. Eur. J. Inorg. Chem. 2013, 628–641. [Google Scholar] [CrossRef]
- Zimmerman, R.; König, E. A Model for High-Spin/Low-Spin Transitions in Solids Including the Effect of Lattice Vibrations. J. Phys. Chem. Solids 1977, 38, 779–798. [Google Scholar] [CrossRef]
- Spiering, H.; Boukhaddaden, K.; Linares, J.; Varret, F. Total free energy of a spin-crossover molecular system. Phys. Rev. B 2004, 70, 184106–184115. [Google Scholar] [CrossRef]
- Bousskesou, A.; Constant-Machado, H.; Varret, F. A Simple Ising-Like Model for Spin Conversion Including Molecular Vibration. J. Phys. I France 1995, 5, 747–760. [Google Scholar] [CrossRef]
- Chernyshov, D.; Hostettler, M.; Törnroos, K.W.; Bürgi, H.-B. Ordering Phenomena and Phase Transitions in a Spin-Crossover Compound—Uncovering the Nature of the Intermediate Phase of [Fe(2-pic)3]Cl2-EtOH. Angew. Chem. Int. Ed. 2003, 42, 3825–3830. [Google Scholar] [CrossRef] [PubMed]
- Neville, S.M.; Halder, G.J.; Chapman, W.; Duriska, M.B.; Moubaraki, B.; Murray, K.S.; Kepert, C.J. Guest tunable structure and spin crossover properties in a nanoporous coordination framework material. J. Am. Chem. Soc. 2009, 131, 12106–12108. [Google Scholar] [CrossRef] [PubMed]


| Experiment | Pentameric Model | Heptameric Model | Nonameric Model | ||||
|---|---|---|---|---|---|---|---|
| Sample Spin of neighbours | |||||||
| LS (1) (1) | LS in Zn matrix (3) | LS | HS | LS | HS | LS | HS |
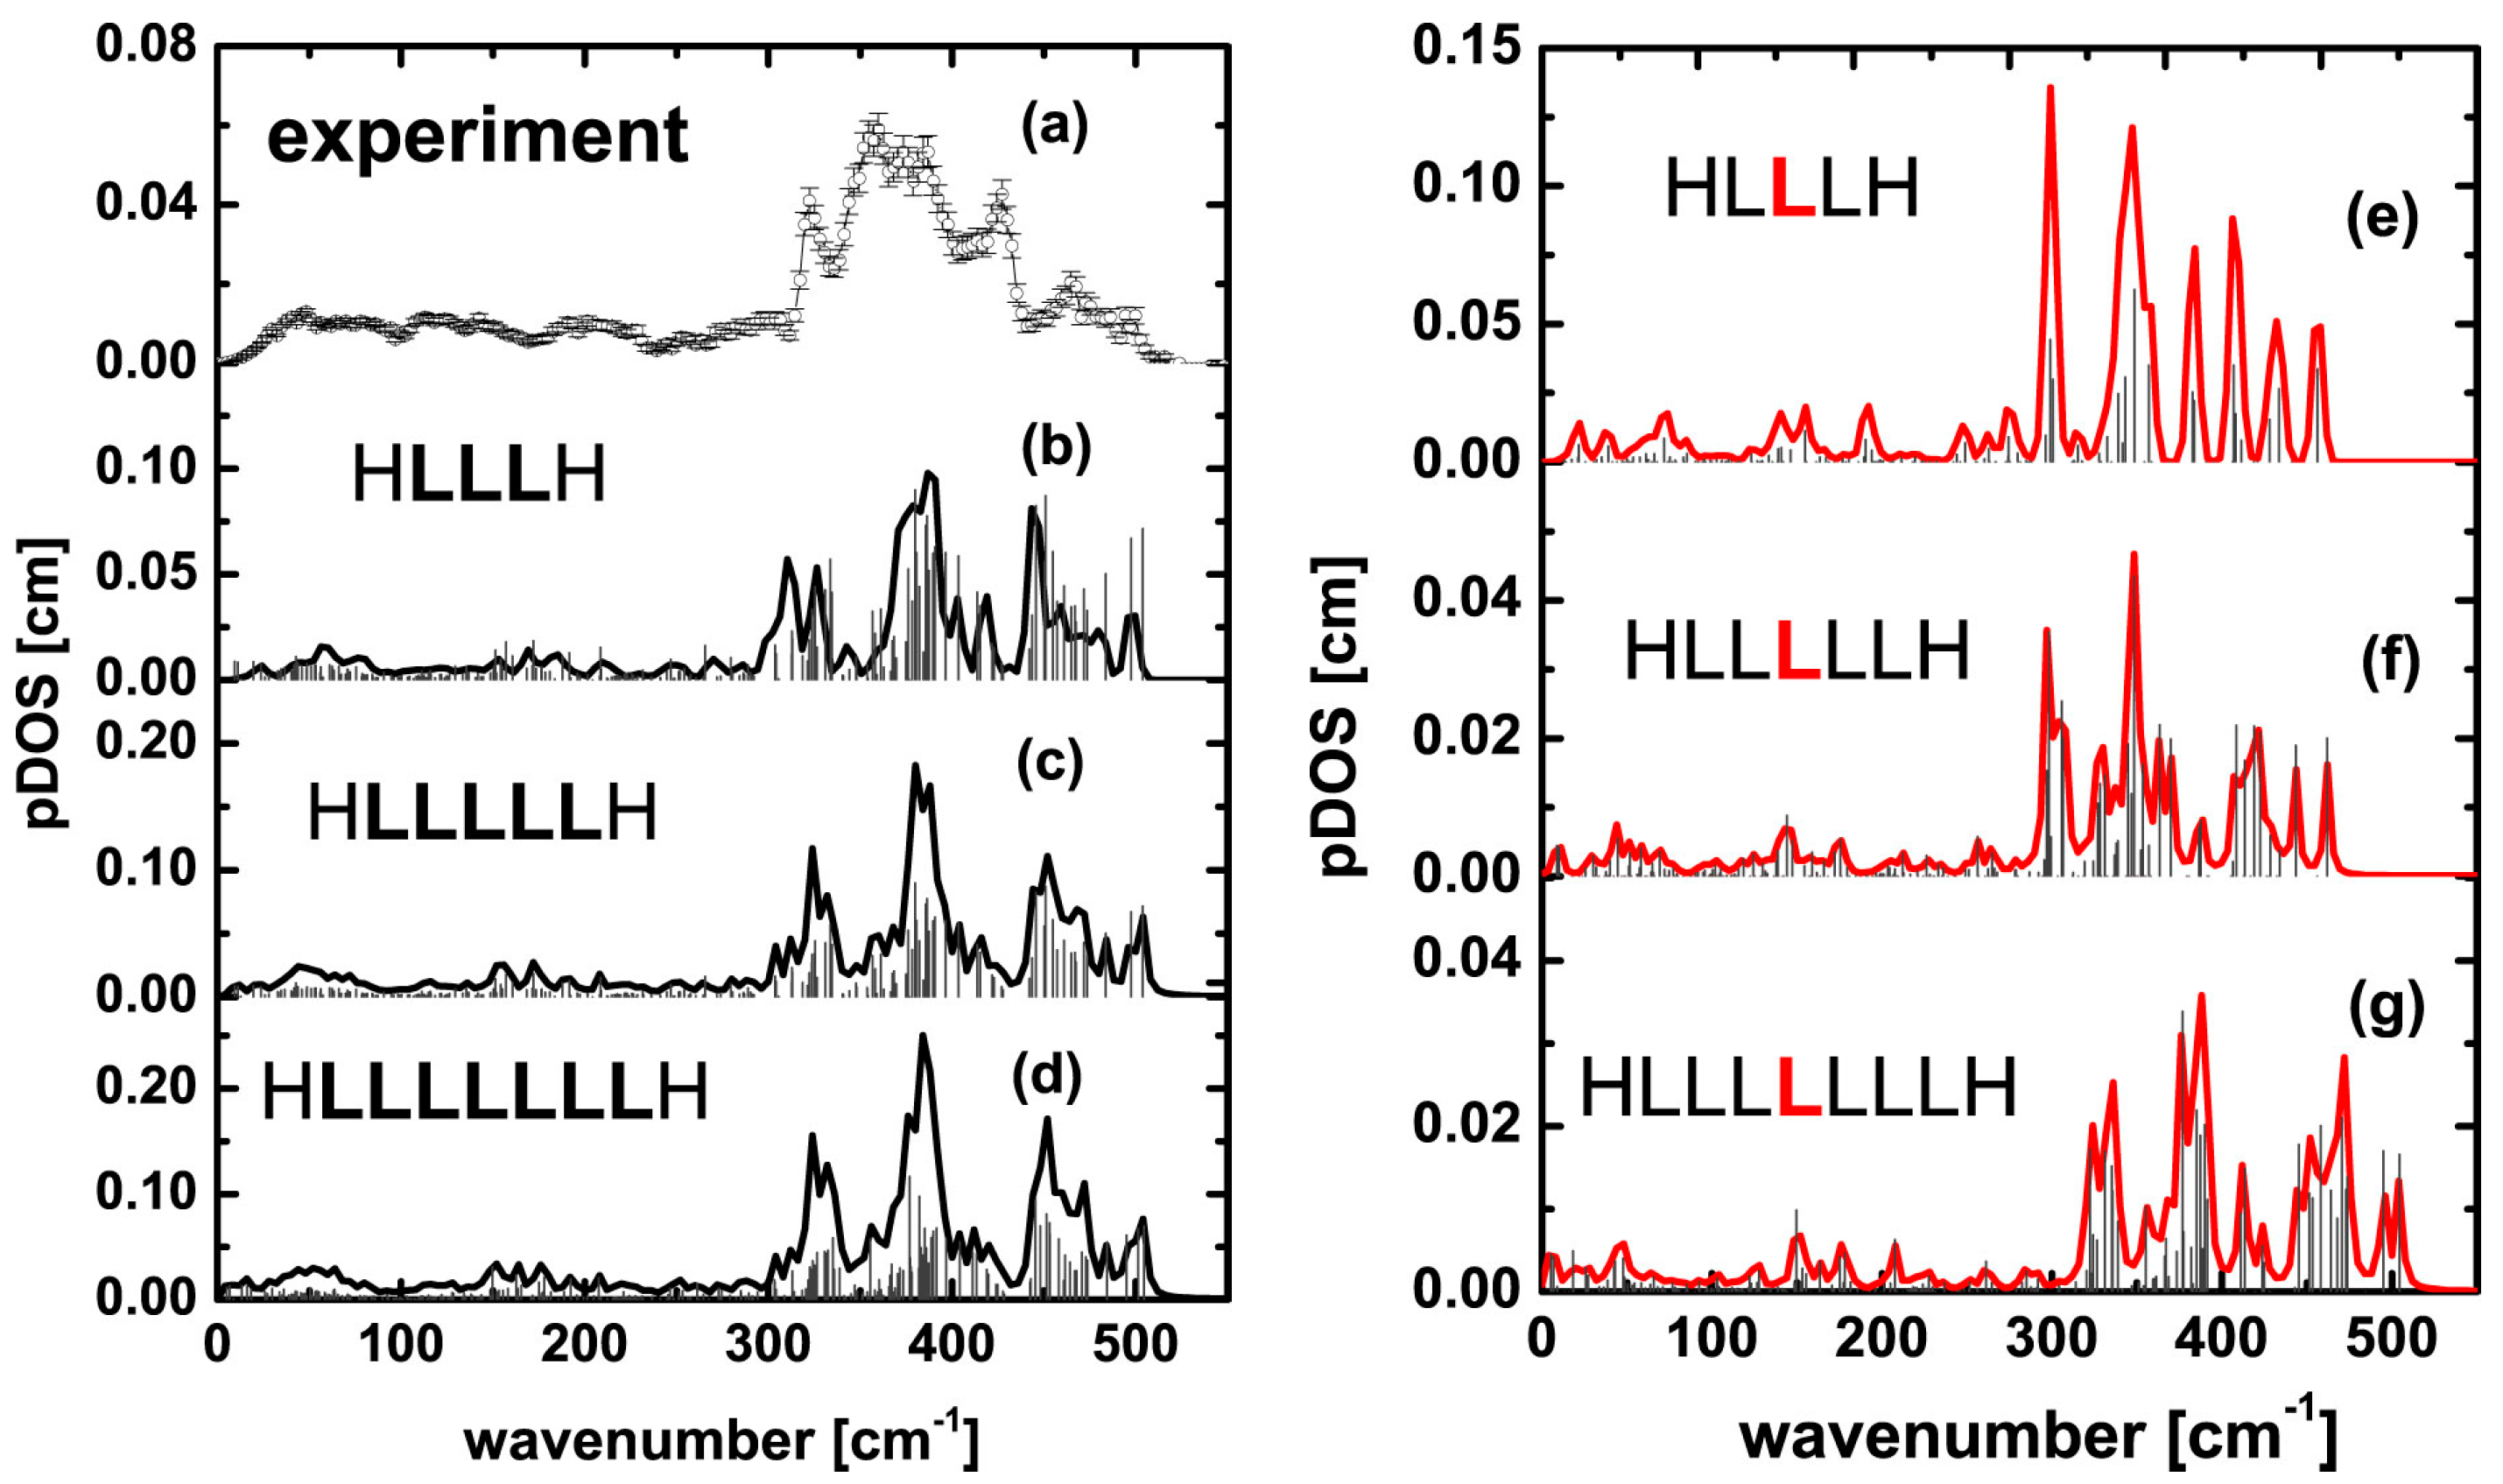
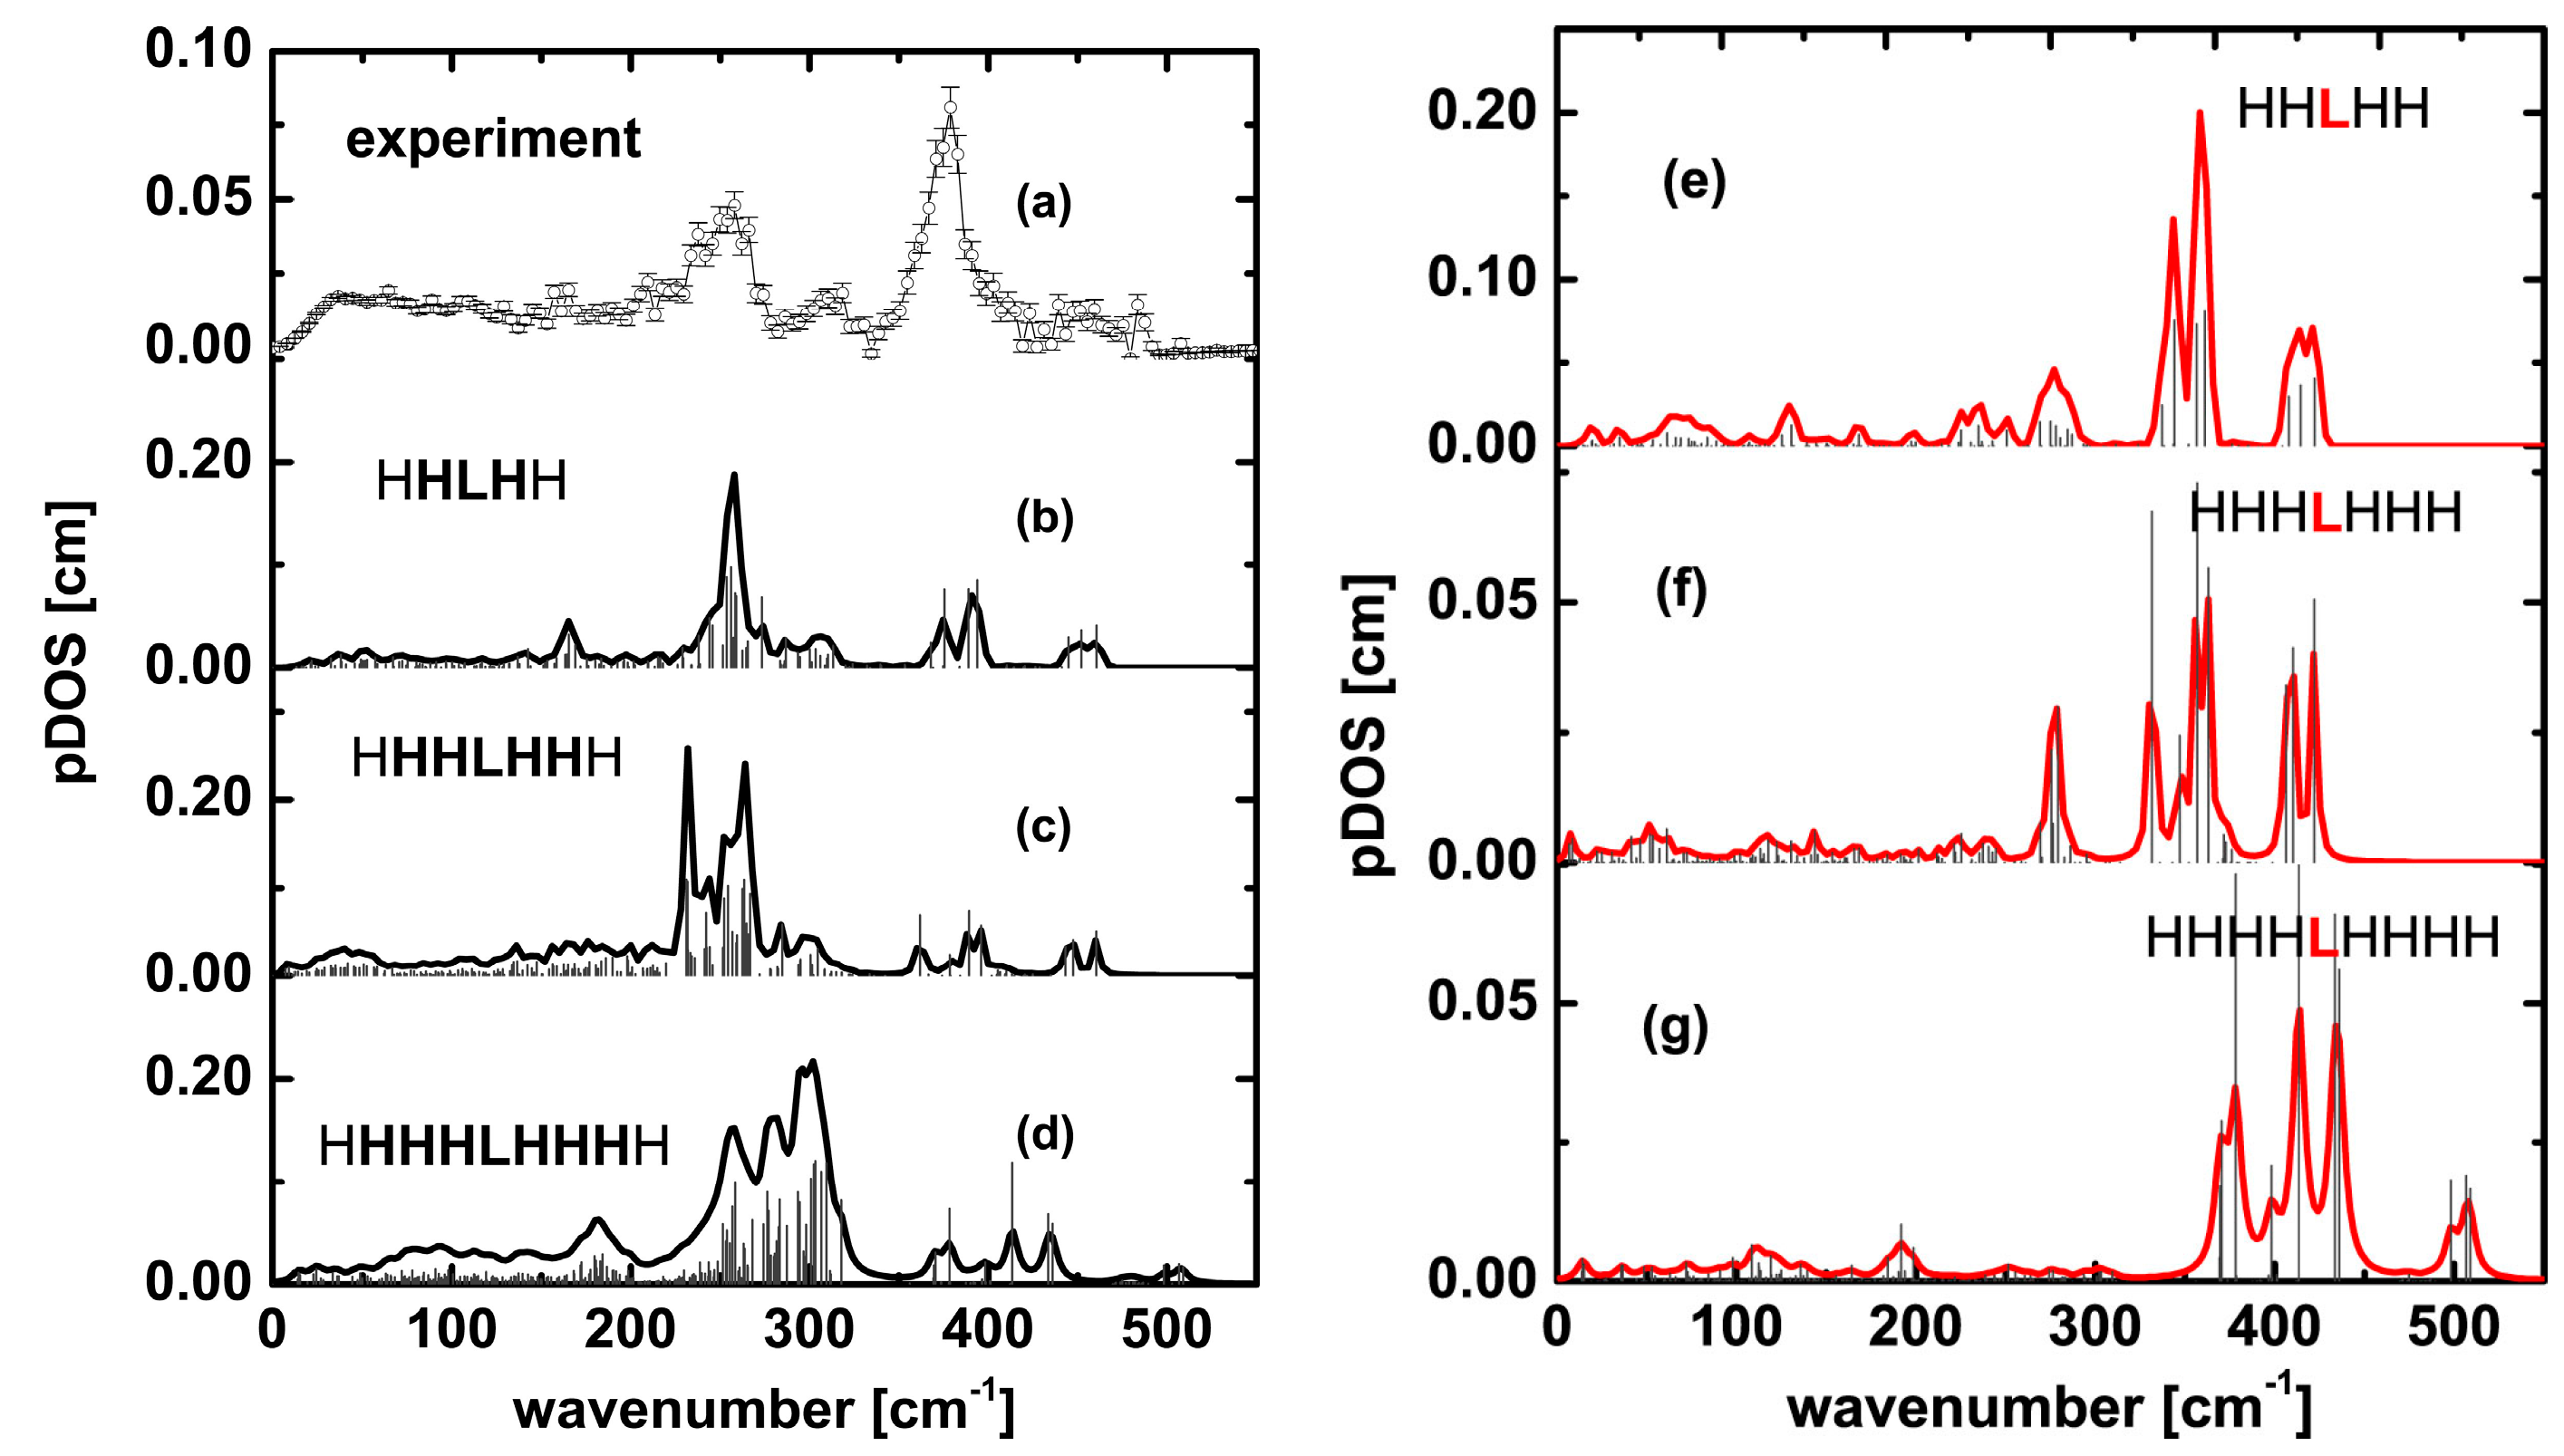
| 321 | 318 | 311 (ls_pent_311) 326 (ls_pent_326) | 302 303 (HHLHH_303) | 324 325 (ls_hept_325) | 301 305 (HHHLHHH_305) | 327 (ls_non_327) | Not observed |
| 465 | Weak peaks in 450–495 cm−1 region | 467 | 445 | 461 | 448 | 471 (ls_non_471) | 435 (HHHHLHHHH_non_435) |
| 496 | Weak peaks in 450–495 cm−1 region | 498 (ls_pent_498) | 461 | 504 | 460 (HHHLHHH_460) | 505 (ls_non_505) | 509 |
© 2016 by the authors; licensee MDPI, Basel, Switzerland. This article is an open access article distributed under the terms and conditions of the Creative Commons by Attribution (CC-BY) license (http://creativecommons.org/licenses/by/4.0/).
Share and Cite
Wolny, J.A.; Faus, I.; Marx, J.; Rüffer, R.; Chumakov, A.I.; Schlage, K.; Wille, H.-C.; Schünemann, V. Vibrational Coupling of Nearest Neighbors in 1-D Spin Crossover Polymers of Rigid Bridging Ligands. A Nuclear Inelastic Scattering and DFT Study. Magnetochemistry 2016, 2, 19. https://doi.org/10.3390/magnetochemistry2020019
Wolny JA, Faus I, Marx J, Rüffer R, Chumakov AI, Schlage K, Wille H-C, Schünemann V. Vibrational Coupling of Nearest Neighbors in 1-D Spin Crossover Polymers of Rigid Bridging Ligands. A Nuclear Inelastic Scattering and DFT Study. Magnetochemistry. 2016; 2(2):19. https://doi.org/10.3390/magnetochemistry2020019
Chicago/Turabian StyleWolny, Juliusz A., Isabelle Faus, Jennifer Marx, Rudolf Rüffer, Aleksandr I. Chumakov, Kai Schlage, Hans-Christian Wille, and Volker Schünemann. 2016. "Vibrational Coupling of Nearest Neighbors in 1-D Spin Crossover Polymers of Rigid Bridging Ligands. A Nuclear Inelastic Scattering and DFT Study" Magnetochemistry 2, no. 2: 19. https://doi.org/10.3390/magnetochemistry2020019