New Approaches to Irrigation Scheduling of Vegetables

1
University of California, Cooperative Extension, Monterey County, 1432 Abbott St., Salinas, CA 93901, USA
2
NASA ARC-CREST/CSUMB, MS 232-21, Moffett Field, CA 94035, USA
*
Author to whom correspondence should be addressed.
Horticulturae 2017, 3(2), 28; https://doi.org/10.3390/horticulturae3020028
Submission received: 19 February 2017
/
Revised: 31 March 2017
/
Accepted: 12 April 2017
/
Published: 18 April 2017
(This article belongs to the Special Issue Refining Irrigation Strategies in Horticultural Production)
Abstract
:Using evapotranspiration (ET) data for scheduling irrigations on vegetable farms is challenging due to imprecise crop coefficients, time consuming computations, and the need to simultaneously manage many fields. Meanwhile, the adoption of soil moisture monitoring in vegetables has historically been limited by sensor accuracy and cost, as well as labor required for installation, removal, and collection of readings. With recent improvements in sensor technology, public weather-station networks, satellite and aerial imaging, wireless communications, and cloud computing, many of the difficulties in using ET data and soil moisture sensors for irrigation scheduling of vegetables can now be addressed. Web and smartphone applications have been developed that automate many of the calculations involved in ET-based irrigation scheduling. Soil moisture sensor data can be collected through wireless networks and accessed using web browser or smartphone apps. Energy balance methods of crop ET estimation, such as eddy covariance and Bowen ratio, provide research options for further developing and evaluating crop coefficient guidelines of vegetables, while recent advancements in surface renewal instrumentation have led to a relatively low-cost tool for monitoring crop water requirement in commercial farms. Remote sensing of crops using satellite, manned aircraft, and UAV platforms may also provide useful tools for vegetable growers to evaluate crop development, plant stress, water consumption, and irrigation system performance.
1. Introduction
1.1. Water Scarcity and Commercial Vegetable Production
Most economically important vegetable production regions of the world have Mediterranean, semi-arid, or desert climates in which supplemental irrigation is required to maximize yield and quality. Efficient irrigation management has become a major concern for vegetable farmers in these areas as water supplies have become more restricted and environmental impairments to ground and surface water from agricultural run-off and drainage has received more attention from regulatory agencies. Agricultural water resources have become increasingly stressed in the vegetable producing regions of Australia, Southern Europe, Chile, the Middle East, North Africa, China, and the western United States. California has been under severe drought conditions for four years since 2012 [1,2], and ground water supplies have been depleted to historically low levels on the central coast, where most of the salad vegetables are grown for the US and export markets. Lowering of the ground water table below sea-level through agricultural pumping has caused salt water to intrude into coastal aquifers and threatened the sustainability of thousands of hectares of prime farmland used for vegetable production [3]. Australia also experienced a severe decade-long drought during the early 2000’s that impacted vegetable farmers in the Murray-Darling Basin in New South Wales and Queensland [4]. The vegetable production regions of Chile [5] and Spain [6] have also experienced recurring multiyear droughts.
Since many vegetables require high rates of nitrogen fertilizer and have shallow root systems, leaching of nitrate during the irrigation season and during periods of heavy precipitation has resulted in nitrate contamination of aquifers in many key vegetable production regions [7,8,9]. Irrigation run-off from vegetable fields also contaminates surface water bodies such as rivers, creeks, estuaries, and lakes with nutrients and pesticides [10,11,12]. Growers in California and Europe must report on the amount of fertilizer nitrogen that they apply to their crops to comply with environmental regulations [13,14]. They are also required to implement best practices to minimize nitrate losses, which will require improving irrigation management.
1.2. Challenges for Irrigation Scheduling in Modern Vegetable Operations
Vegetable production poses several unique challenges in managing irrigation water efficiently. One of the major challenges for growers is the number of fields that must be concurrently managed in a medium to large size vegetable operation. Fields sizes for vegetable crops tend to be small (<5 ha) relative to agronomic crops, especially fields planted with leafy green, crucifer, and other salad vegetables. Large vegetable growing operations in the Salinas valley of California manage 1–2 thousand ha of vegetables, with an average field size of just 4 ha. Small fields permit intensive management, allowing plantings to be staggered so that a steady supply of vegetables can be delivered to buyers and shippers. However, smaller field sizes means that farming decisions must be coordinated for many fields that may vary with respect to maturity, soil texture, cultural practices, microclimate, or other site-specific conditions.
In addition to field size, the diversity of vegetables and number of crop rotations per season increases management complexity. Most diversified operations will produce more than 30 types of vegetables, each with unique nutrient and water requirements. Many vegetables are grown over short cropping cycles. Leafy green salad mixes like leaf and crisphead lettuce, for instance, reach maturity over just 30–65 day intervals during the summer. As a result, farmers in Mediterranean climates often grow two to three rotations of vegetable crops per year. Fields often are intensively tilled between crops to remove compacted zones caused by traffic from harvest machinery and to prepare raised beds for seeding or transplanting the next crop. These activities require that crews retrieve drip tape or sprinkler pipe after each crop is harvested.
Another irrigation scheduling challenge is the number of field operations that must be coordinated during a crop cycle. Fields are typically sprayed to protect against insect and disease pests several times per crop cycle, and must be periodically cultivated to control weeds. Fertilizer applications are made several times during the growth cycle to satisfy the nutrient requirements of vegetables. Irrigations must be timed to accommodate access for tractor and hoeing crews so that activities can be completed on schedule. There may be several extended periods when a vegetable crop cannot be irrigated to permit the soil to dry sufficiently to allow tractor access. Irrigation equipment, such as sprinkler and mainline pipes, may need to be moved before each pass of a tractor through a field.
Irrigation scheduling is also complicated by the numerous methods that vegetable growers use to supply water to their crops. Depending on the crop type, plant density, development stage, water source, and field and soil characteristics, growers may choose to irrigate using overhead sprinklers, drip, furrow, or a combination of methods. In California, leafy green vegetables harvested for salad mixes are seeded at high densities (8.5 million plants per hectare) [15] on 2 m wide raised beds and are irrigated almost exclusively with sprinklers. Small seeded vegetables such as crisphead and romaine lettuce are typically germinated with sprinklers, and after several weeks, irrigated with surface drip until harvest. Celery transplants may be established using overhead sprinklers, then drip irrigated, and occasionally flood irrigated to rewet the shoulders of raised beds.
Since vegetable production is frequently characterized by short crop cycles, intensive crop rotations, and numerous small fields at different stages of maturity, farm managers are challenged to schedule and coordinate all the field activities while taking time to carefully schedule irrigations to optimize water use. Consequently, many farm managers may follow predetermined irrigation schedules to simplify water management and make small adjustments during the cropping season depending on their observations of the crop, soil, and weather conditions. Usually the amount of water applied to high value vegetables exceeds crop evapotranspiration (ET) to avoid water stress. In the Salinas Valley of California, for example, applied water amounts on broccoli, cauliflower, and cabbage averaged >200% of the estimated crop evapotranspiration (ETc) requirement [16]. While these applications rates may avoid water stress so that yield and quality are maximized, over-irrigating may strain water supplies and result in the leaching of nitrate and/or generate run-off that degrades the quality of receiving surface water bodies.
Considering the numerous challenges and limitations of managing vegetables, growers, farm managers, and irrigators need convenient methods to schedule irrigations so that they can better determine how much water to apply to match the requirements of their crops. During the past few decades, significant improvements and lower costs for wireless communications, computing power, sensor technology, and aerial and satellite imagery have increased the potential to develop accurate and intuitive approaches for scheduling irrigations in vegetables.
2. Advances in Soil Moisture Sensor Technology
2.1. Recent Developments in Soil Moisture Sensing
The monitoring of soil moisture has long been a standard way to determine when crops need to be irrigated. Growers and farm managers typically evaluate soil moisture by probing with a shovel or auger or monitoring with sensors. Sensors for volumetric moisture content and soil water tension have been commercially available for more than 40 years but were originally used more in research than for commercial crop production. Volumetric soil moisture sensors provide readings in units of m3·m−3, and tension-based sensors readings are typically in units of kPa, where a greater absolute value corresponds to drier soil conditions [17]. In the past, the primary barriers to more widespread use of soil moisture sensors in irrigation management have included both cost as well as labor required for the installation, removal, and collection of readings [18]. In recent years, there has been a proliferation of commercially available soil moisture monitoring systems for agriculture. Many sensors interface with dataloggers and wireless communication systems to provide near real-time status of soil moisture from several depths and locations within a field. Data are automatically uploaded by radio or cell phone communications to cloud-based computer servers and are accessible through apps on smartphones and tablet computers. These communication advancements greatly improve the convenience of accessing data and can be configured to provide timely alerts when crops require irrigation. Many of these wireless communication systems for soil moisture sensors also support on-farm weather stations, digital flow meters, and control valves, which facilitates the monitoring of irrigation system operations.
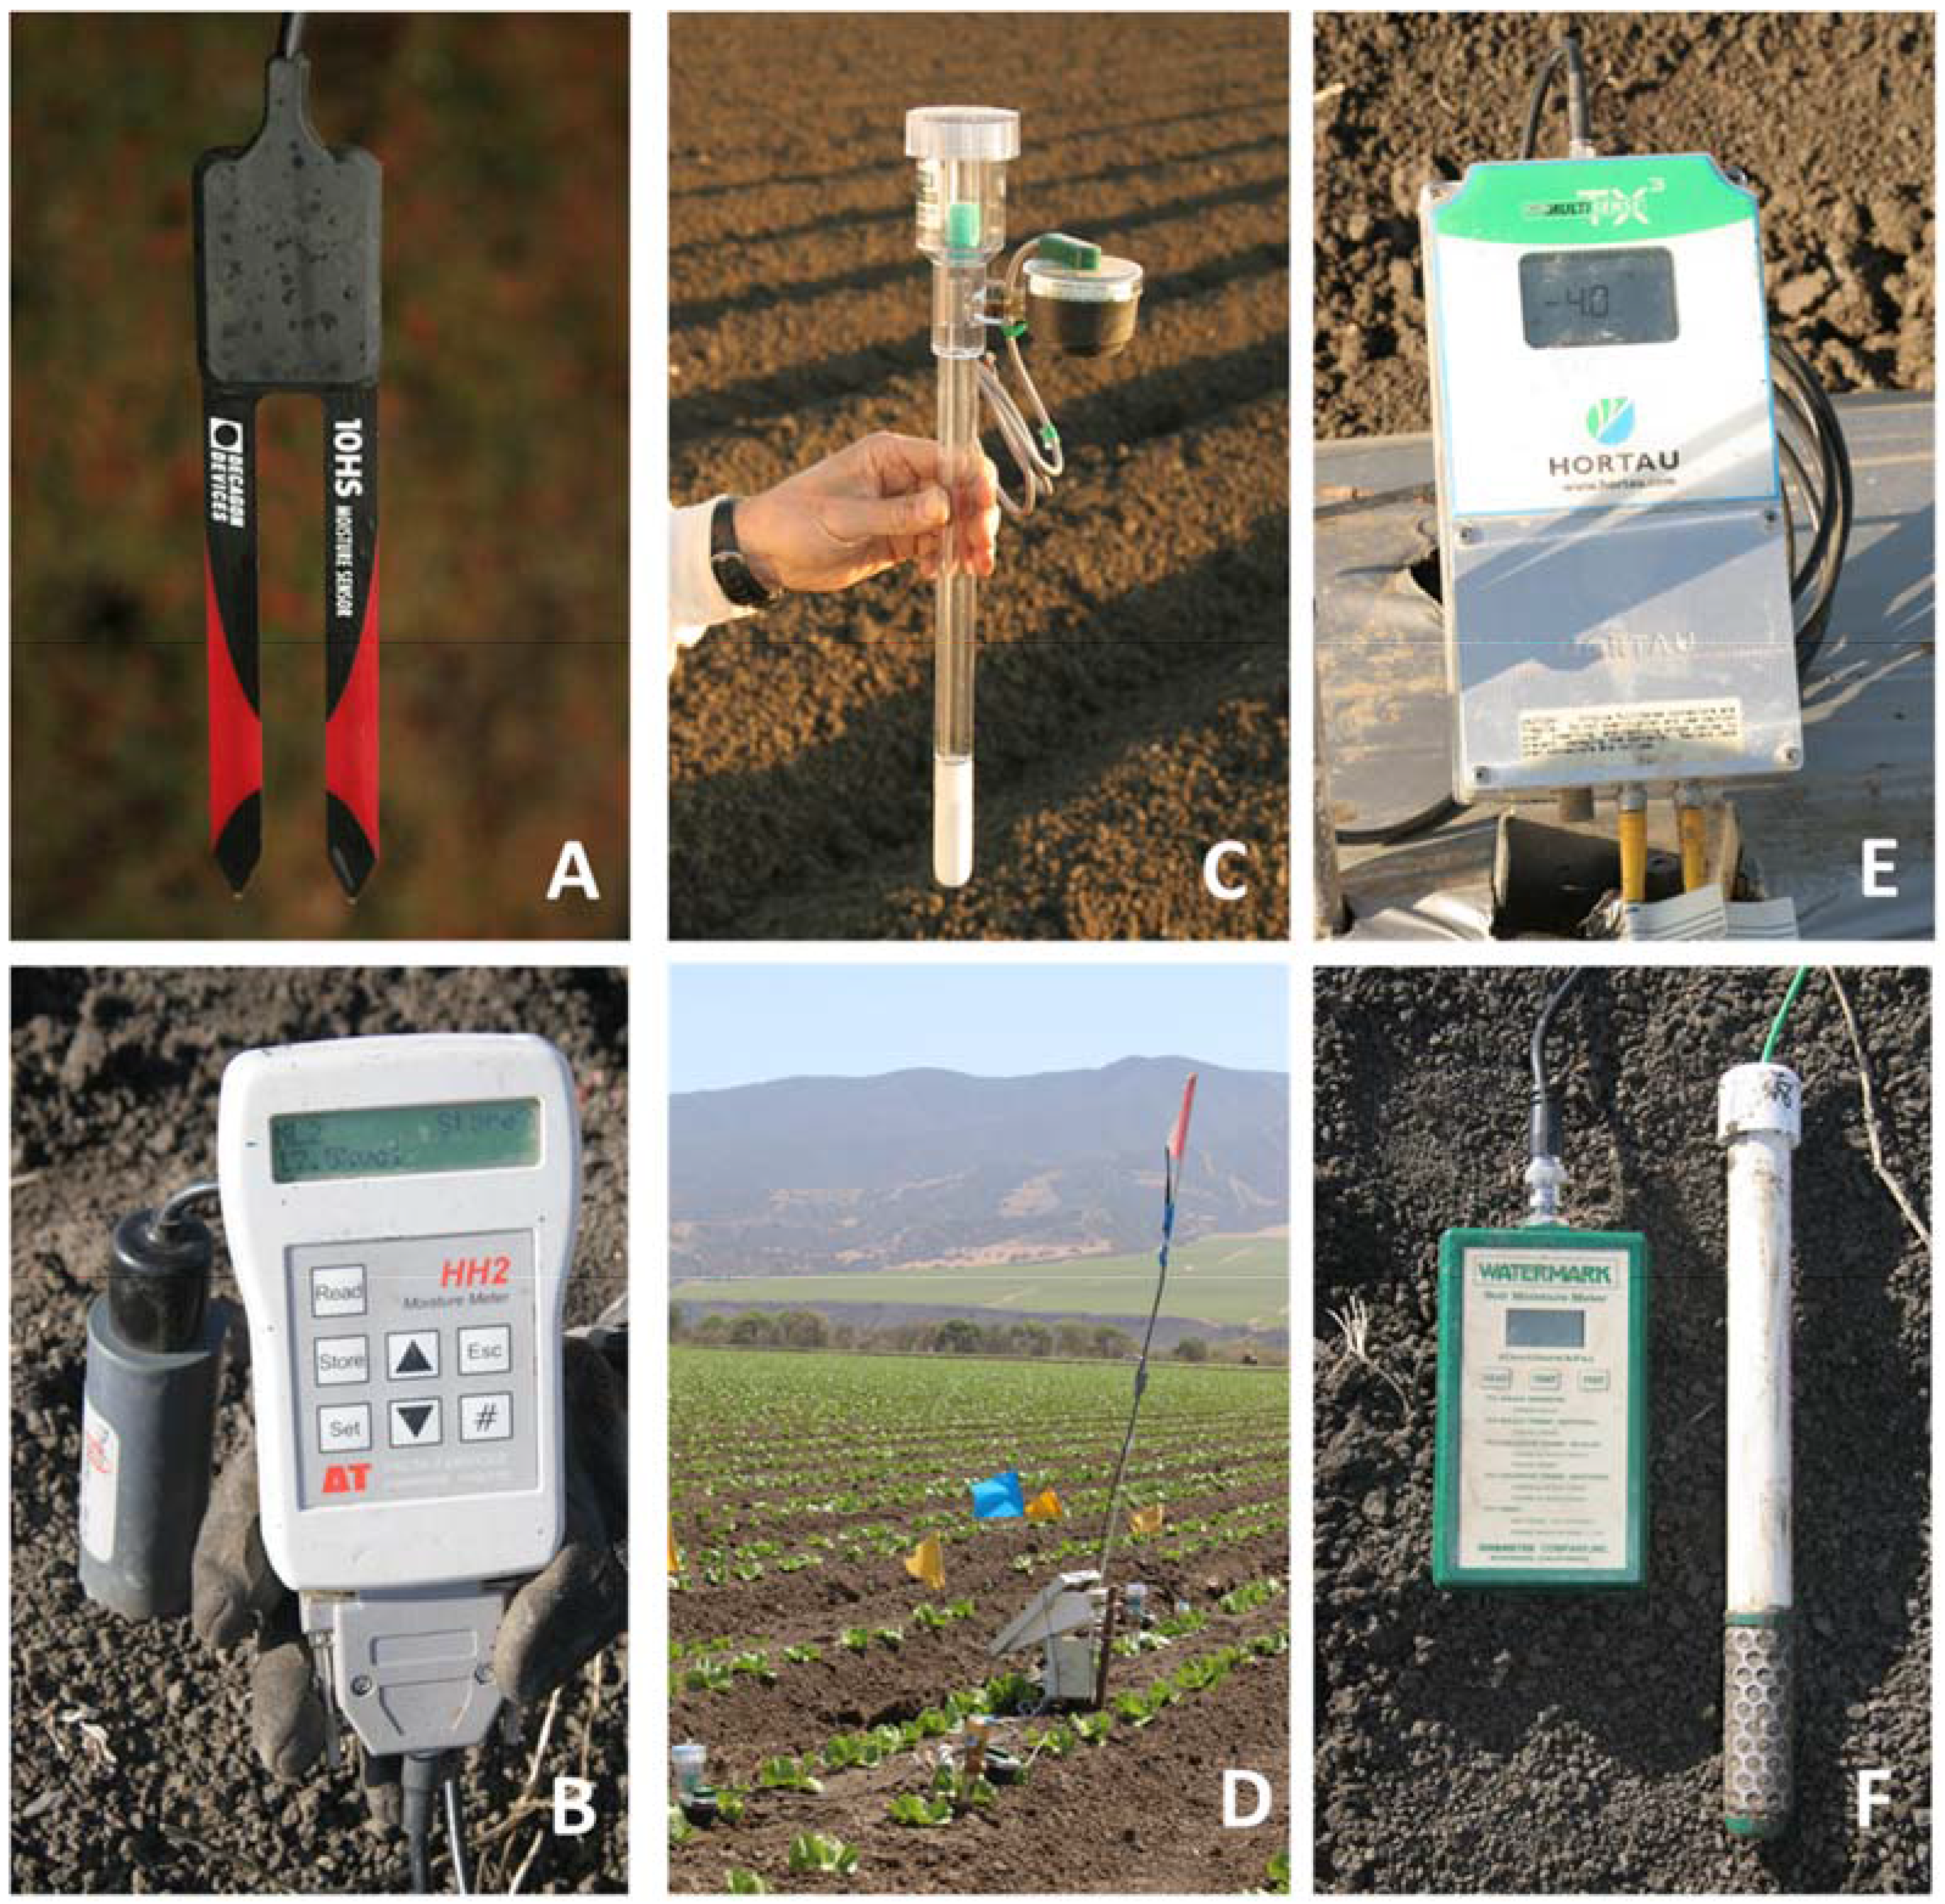
Soil moisture sensors have also evolved during the last few decades in terms of size, cost, and accuracy. Electromagnetic (EM) soil moisture sensors, used to determine volumetric soil moisture content, include time domain reflectometry (TDR) and capacitance sensors. These were once bulky and expensive instruments. With improvements in electronic manufacturing and better designs, current EM sensors (Figure 1A,B) are generally much smaller, cheaper, and more accurate than earlier models. Some versions are integrated with soil temperature and salinity sensors (e.g., Model 5TE, Decagon Devices Inc., Pullman, WA, USA). Others are integrated with dataloggers and radio communications (e.g., Model gStake, gThrive Inc., Santa Clara, CA, USA) to facilitate field installation and removal.
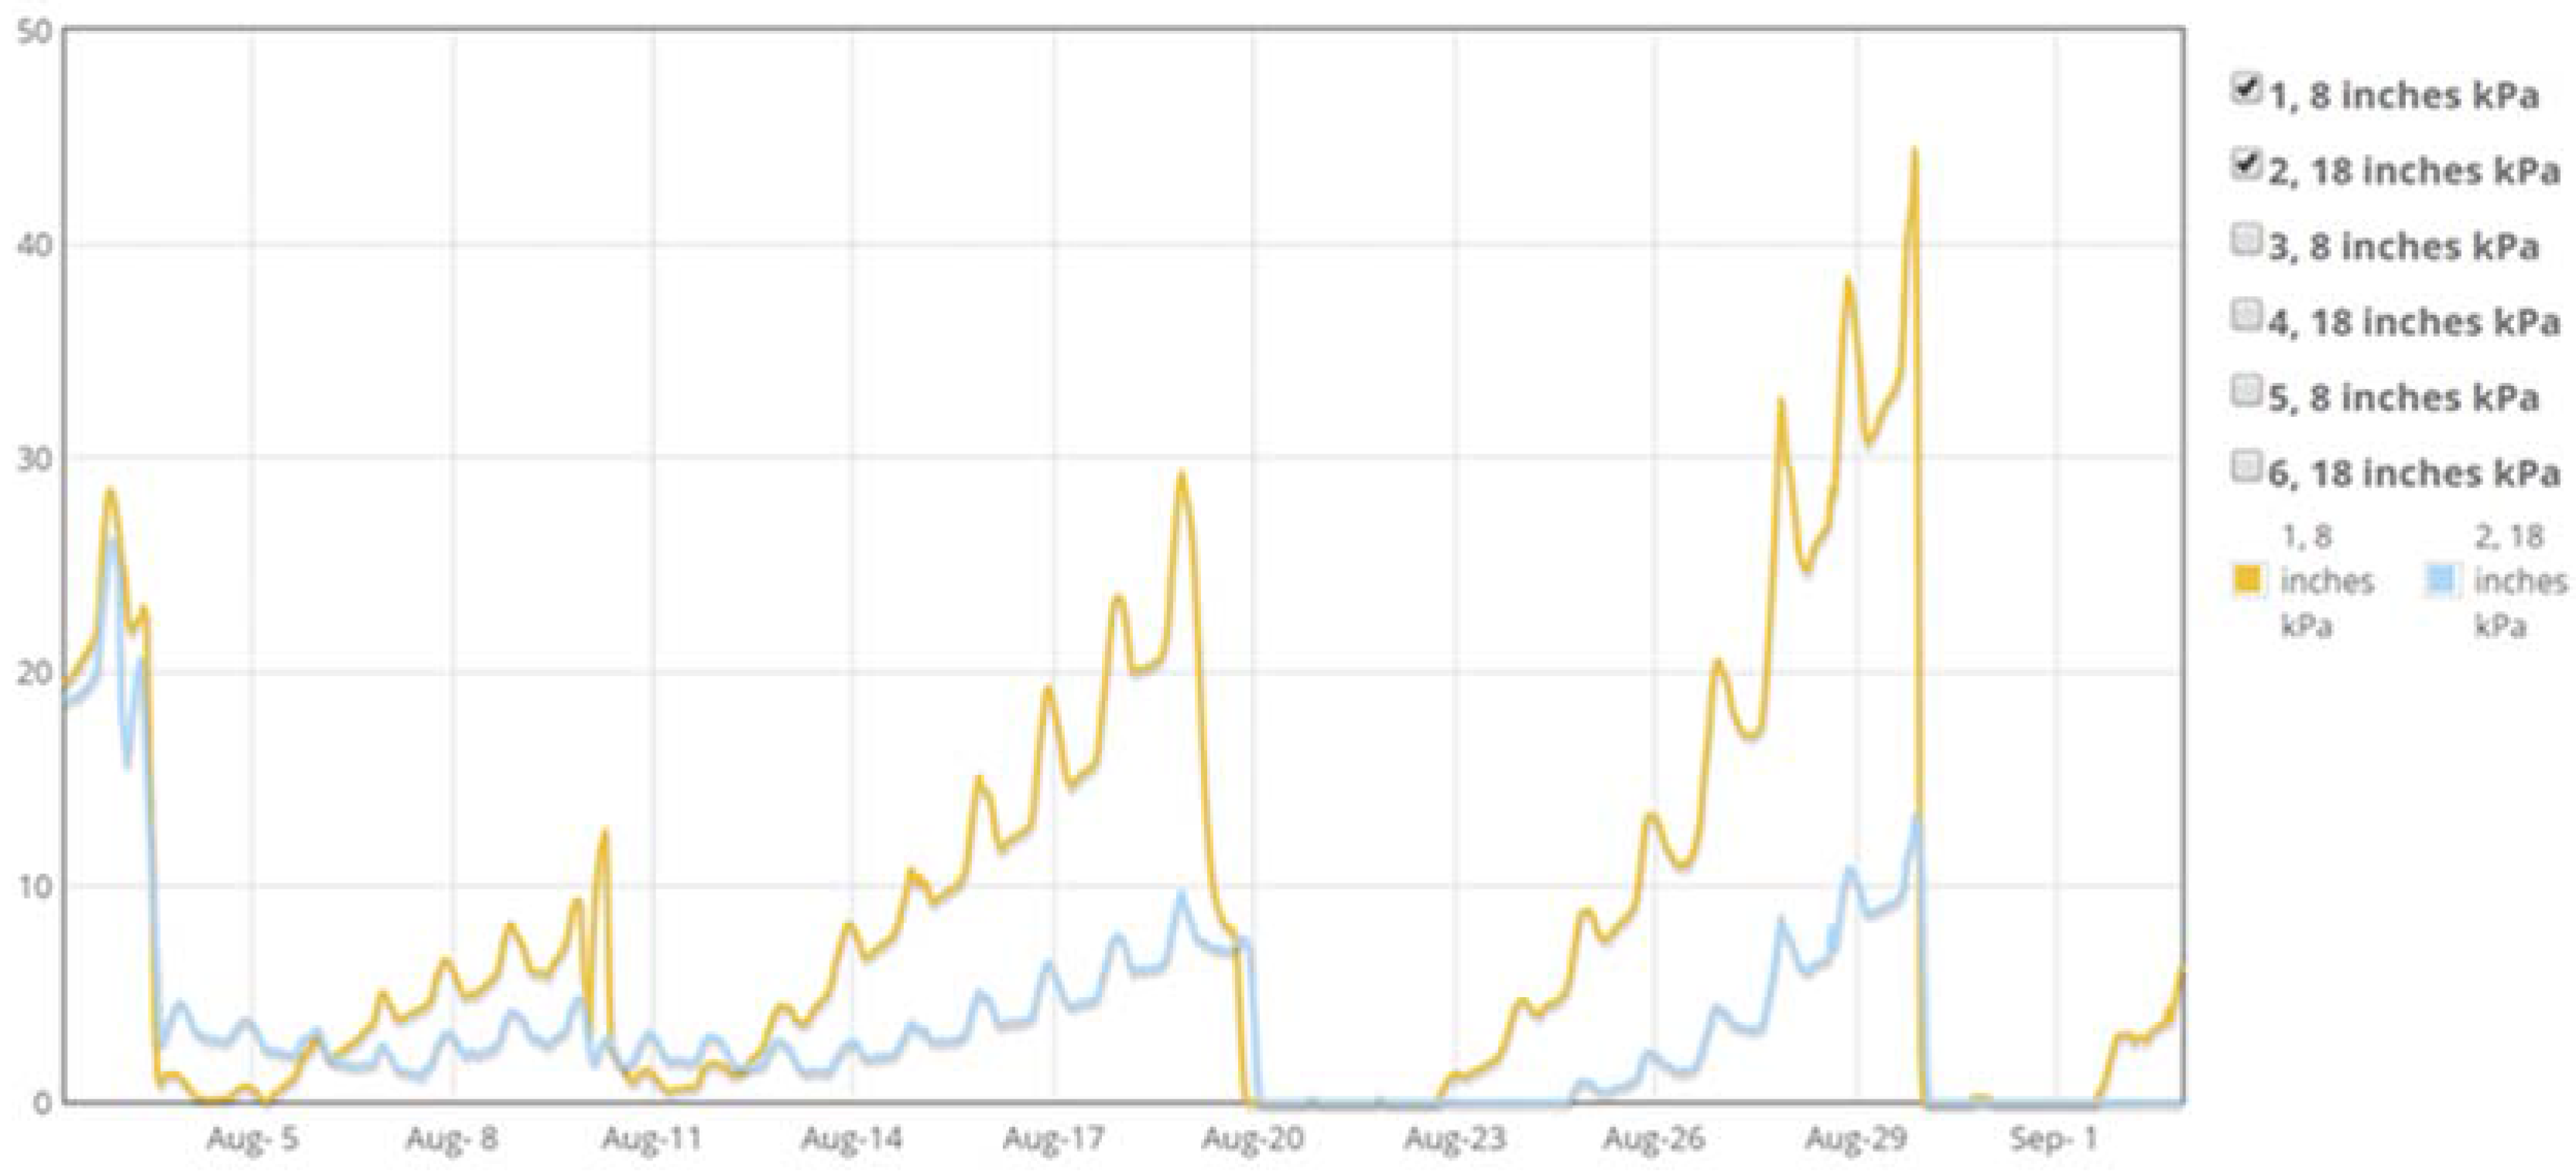
Tension-based soil moisture sensors have been considered the best method to determine if a crop needs water since most vegetables experience reductions in yield and quality under prolonged periods of high soil water tensions. Tension thresholds that optimize production have been determined for many vegetable species [17,19], including broccoli [20], cabbage [21], cauliflower [22], lettuce [23,24], potato [25], and tomato [26]. An advantage of tension thresholds is that they are less influenced by soil texture than volumetric moisture thresholds. Tensiometers can accurately measure soil water tension in a range of 0–85 kPa using a mechanical vacuum gauge attached to a water filled tube with a porous ceramic cup [17] (Figure 1C). Tensiometers must be installed without air gaps between the ceramic cup and soil to function properly. To reduce labor for collecting readings, several recent models have sensitive electronic pressure transducers that measure vacuum pressure and can be interfaced to dataloggers and wireless communication services (Figure 1D,E) so that data may be monitored remotely (Figure 2) (e.g., Hortau Inc., Lévis, QC, Canada). Though tensiometers do not need calibration, they usually require periodic maintenance to assure that they are functioning properly. Entrapped air that develops at high tensions must be replaced with de-aired water. Adding a weak solution of algaecide or bleach can prevent biological growth inside the tensiometer tube, which may potentially clog the ceramic cup [26].
Granular matrix sensors (GMS) (Figure 1F) indirectly measure soil water tension using electrical resistance and are often used as an alternative to tensiometers (e.g., Model watermark 200SS, Irrometer Company Inc., Riverside, CA, USA). Most GMS can be interfaced to dataloggers and wireless communications [26]. An advantage of GMS compared to tensiometers is that they do not require regular servicing. These sensors retain sensitivity at higher soil moisture tensions (up to 200 kPa) but are less accurate at low soil moisture tensions (0–15 kPa) than tensiometers [17,26]. GMS readings are also affected by fluctuations in soil temperature [17]. Another limitation of GMS is that the response time to wetting and drying cycles is slower compared to tensiometers [26,27].
A number of studies have evaluated automated irrigation scheduling based on soil moisture readings for improving the water use efficiency of vegetables irrigated with drip tape. Automatic controllers used in these studies irrigated crops for short durations several times per day when soils dried below a predetermined threshold [28,29]. Some control systems have relied on tension based sensors [26,28], while others have used volumetric soil moisture sensors [28,30,31,32,33,34] to determine when to irrigate. The use of TDR soil moisture sensors for triggering irrigations in sub-surface drip irrigated sweet corn resulted in an 11% savings in water use with similar yields compared to a standard sprinkler irrigated treatment [30]. Small plot trials have demonstrated water savings, reduced nitrate leaching, and improvements in yield in drip irrigated fresh market tomatoes, bell peppers, and zucchini squash using capacitance soil moisture sensors to trigger irrigations [31,32,33,34,35]. Using tensiometers, Mũnoz-Carpena et al. [26] were able to reduce water use in fresh market tomato by 67% compared to the grower standard practice without significant reductions in marketable yield. Most of the water savings were during the early crop stages when evapotranspiration rates were low. Capacitance soil moisture sensors were generally found to be more reliable for automated irrigation scheduling than tensiometers and GMS. As discussed earlier, tensiometers require regular maintenance, and the GMS response to changes in soil moisture was too slow to use these sensors for triggering irrigations. While these studies have demonstrated the potential for water savings in small plots, automated irrigation scheduling may have several limitations in commercial vegetable fields. The optimal volumetric soil moisture threshold for triggering an irrigation would need to be empirically determined for different soil types. Pressurized water would need to be continuously available to accommodate frequent short irrigations. In large fields, short irrigation cycles could lead to significant drainage at the lower end of a field when drip lines depressurize.
2.2. Limitations of Soil Moisture Sensors for Irrigation Scheduling in Vegetables
While much progress has been made in improving the accuracy and utility of soil moisture sensors, several factors still limit their use for irrigation scheduling of vegetables. Though costs for individual sensors may be less than in the past, the addition of dataloggers, cell phone modems, and radio communications, which facilitate real-time monitoring, has added to the total costs. Labor for installation and removal of sensors remains a significant cost, especially in vegetable crops with short production cycles. Considering labor and capital costs, many growers elect to use soil moisture monitoring equipment in a small percentage of their vegetable fields.
Though soil moisture sensors are useful for determining when to irrigate vegetables, they are less useful for estimating how much water to apply. Soil moisture tension readings must be converted to volumetric moisture to estimate soil water depletion since a previous irrigation or rain event. Volumetric soil moisture sensors may also need calibration. Most capacitance sensors use the manufacturer’s calibration equations to convert readings to volumetric water content. Clay content, organic matter, salinity, bulk density, and temperature can affect the accuracy of capacitance sensors [36,37,38,39,40]. The effect of these factors on water content readings can vary in different soil types. For example, Kargas and Soulis [38] evaluated the accuracy of the 10HS capacitance sensor, and found that temperature had a larger effect on soil water content readings in clay than course textured soils. They concluded that calibration for specific soil types was needed to achieve accurate readings.
Even with accurate sensors, spatial variability can limit the reliability of soil moisture estimates if readings are collected from only a few locations, especially if soil hydraulic properties vary within a field or the irrigation system applies water unevenly. Soil maps can be useful for guiding the placement of soil moisture sensors in locations that represent the dominant soil properties of fields. In drip-irrigated fields, determining the optimal location to accurately monitor soil moisture depletion can be particularly challenging. Soil moisture is typically higher under drip tape than adjacent to the plants, where root activity is concentrated. Placing sensors too close to a drip line may lead to under-irrigating a crop, and placing sensors too far away may result in over-irrigating [41]. Through computer modeling experiments, Soulis et al. [42] concluded that the optimal positioning of soil moisture sensors in drip-irrigated crops was influenced by soil hydraulic properties, crop evapotranspiration rate, and the configuration of the irrigation system. An additional consideration is the ideal depth at which to place sensors relative to the crop root zone. Broccoli roots can reach depths greater than 1.2 m at maturity [16], while roots of many leafy greens such as spinach may reach less than 0.5 m by harvest [43].
3. ET-Based Approaches to Scheduling Irrigations in Vegetables
Water requirements of vegetable crops can also be determined from estimates of crop evapotranspiration (ETc). Using Penman-Monteith [44,45], or similar equations [46], evapotranspiration (ET0) of a well-watered reference crop, such as grass, or alfalfa, is commonly estimated from measurements of air temperature, relative humidity, wind speed, and solar radiation [47]. The evapotranspiration of a well-watered vegetable crop can be estimated relative to a reference crop by multiplying ET0 by a crop coefficient (Kc). Crop coefficients for most major vegetable crops were summarized by Allen et al. [48], Guerra et al. [49], and Grattan et al. [50].
Networks of public weather stations to monitor reference ET have been established in many vegetable production regions of the world where irrigation is commonly used. The California Irrigation and Information System (CIMIS) is operated by the Department of Water Resources in California and consists of more than 145 weather stations sited on reference crops throughout the state. ET0 and other meteorological data, including precipitation, air and soil temperature, wind speed, solar radiation, and relative humidity, are available for users to download from the state operated website. Similar networks have been developed for other states including Arizona (AZMET), Colorado (CoAgMet), Florida (FAWN), Nevada (NICENET), Oklahoma (MesoNet), Oregon (AgriMet), and Washington (AgWeatherNet). Most European countries also have weather station networks that provide daily ET0 data through public websites (e.g., Spain [51], Italy [52]). In addition, CIMIS offers a satellite based product that estimates ET0 at a 2 km resolution based on data from the Geostationary Operational Environmental Satellite [53].
Many commercial companies also offer affordable weather stations (e.g., ET107, Campbell Sci. Inc., Logan, UT, USA; WatchDog 2900ET Weather Station, Spectrum Technologies, Aurora, IL, USA; HOBO U30-NRC Weather Station, Onset Computer Corp. Bourne, MA, USA) that can be used to estimate ET0 on a farm. These systems offer a way to monitor ET0 in regions not covered by a public network, or for farms that are not located reasonably near an established station. However, in practice, few growers site or maintain stations in accordance with World Meteorological Organization standards for reference evapotranspiration measurements. Many growers site weather stations near trees, buildings, or parking lots, which limits the fetch and can influence the micro-climate, and potentially bias estimates of ET0. Stations are infrequently sited on a suitable well-watered reference crop. Most farmers do not allocate time to regularly maintain and calibrate meteorological instrumentation on their stations. Commercially available atmometers (ETgage Co., Loveland, CO, USA) can be used to monitor ET0 but must also be sited over a reference crop.
Although ET0 data have been useful for water agencies to estimate the seasonal water use of crops at a regional scale, growers have generally considered this approach to be impractical for scheduling irrigations in vegetable systems. A major difficulty is that the Kc value can change daily as vegetables grow and leaf area increases. During the establishment phase, when crop foliage covers a small percentage of the soil surface, ET is mostly from soil evaporation rather than from crop transpiration. For many vegetable crops, such as leafy greens and brassicas, the canopy cover is less than 10% until halfway through the crop cycle. The Kc during this early stage will depend on factors influencing evaporative losses from the soil, such as method and frequency of irrigations, and soil physical properties [48]. Later, in the rapid growth phase, Kc values increase daily as the canopy cover develops and covers the soil.
Solutions for calculating a daily Kc for lettuce were proposed by Gallardo et al. [54] in which soil evaporation from unshaded soil (E) is estimated separately from the water lost by transpiration and soil evaporation under the crop canopy (T). Using this approach, Kc is proportional to the fractional cover (Fc) of the leaf canopy shading the soil, and E is related to the hydraulic properties of the soil and the time since the crop was irrigated. The general approach is consistent with Allen et al. [48,55], who also proposed separating the Kc of crops that have a significant period of minimal canopy cover into dual components consisting of a basal crop coefficient (Kcb) that represents water loss by transpiration and an evaporation coefficient (Ke), representing loss from soil evaporation. Direct relationships between Fc and Kcb have been reported for several crops such as broccoli [56], wheat [57], cotton [58], sugar beets [58], and grapes [59].
Both Gallardo et al. [54] and Allen et al. [48] describe calculations for estimating soil evaporation, which divide Ke into stage 1 and stage 2 periods. Stage 1 occurs immediately following an irrigation or rain event that saturates the soil to field capacity. During stage 1, water loss is limited by the energy available for evaporation. Stage 2 occurs after the soil is visibly dry and water loss is limited by soil hydraulic properties. The Stage 2 rate of evaporation diminishes with time as the soil water content declines.
4. Software for ET Based Scheduling of Vegetables
4.1. Overview of Sofware Tools
Even with publicly available ET0 data and accurate Kc models, the implementation of ET-based irrigation scheduling at the scale of a commercial vegetable farm may be difficult for growers. Daily ET0 values need to be retrieved from a location representative of the field of interest. An estimate of canopy cover is needed to determine the average Kc for each irrigation event. Soil evaporation calculations require knowledge of the soil properties of the field, irrigation method, and interval between irrigations or rainfall events. To convert crop ET into an irrigation recommendation, the application rate and distribution uniformity of the irrigation system, and in some cases the leaching fraction, also needs to be integrated into the calculations.
Recognizing that most growers have limited time to dedicate to making decisions on water management, several universities and public institutions have developed computer programs to facilitate ET based scheduling. Spreadsheet and Windows-based irrigation scheduling programs, such as CROPWAT [60], KanSched 2.0, Basic Irrigation Scheduling (BIS) [61], and consumptive use program (CUP) [62] automate the irrigation scheduling calculations but require users to retrieve and enter daily ET0 values. Since separate spreadsheet files maybe needed for each crop, these programs may be difficult to implement in large growing operations that manage many fields. Washington Irrigation Scheduling Expert (WISE) [63,64] is a downloadable JavaScript application that runs on personal computers. More recently developed web-based applications such as Irrigation Scheduler mobile (Washington State University) [65], Irrigation Management Online (Oregon State University) [66], Wateright (Fresno State University) [67,68], and CropManage (University of California, Division of Agriculture and Natural Resources) [69,70] were developed to automatically retrieve ET0 data from weather station networks such as AgWeatherNet and CIMIS and support irrigation scheduling of multiple fields. These applications are accessed through web browsers, some of which automatically resize the user interface to smartphone screens. Colorado State University WISE Irrigation Scheduler [71] and SmartIrrigation (University of Florida, University of Georgia) [72,73,74] have similar capabilities but can operate exclusively on smartphones through downloadable applications. Outside of the United States, several public agencies have developed online irrigation scheduling services including IRRINET in Italy [75], ISS-ITAP in Spain [76], IRRISA in France [77], and IrriSatSMS [78] in Australia. In addition, a growing number of ET-based software tools are commercially available. Two examples are Probe Schedule (IRRinet LLC, Dalles, OR, USA) and Irrigation Advisor (PowWow Energy Inc., San Mateo, CA, USA). Further details of these commercial products are not provided here since they are proprietary and usually not documented in the scientific literature.
Most online irrigation scheduling tools have cloud-based databases that retain information associated with each planting, such as soil type, planting and harvest dates, weather station name, and irrigation system application rate, so that the user does not need to reenter critical information for each irrigation event. After entering the information required to initiate a new planting, users can quickly look up how long to irrigate their crops. Some scheduling software provides weekly or daily summaries of how much water to apply (e.g., IrrigationScheduler, Wateright, SmartIrrigation, etc.), while others such as CropManage enable the user to input specific dates for each irrigation [70]. The online format facilitates automated retrieval of current and forecasted weather data in advance of planned irrigation events, so that growers can be alerted when a field will need water. In addition to linking with weather station networks, decision support tools can also incorporate other online services such as UC Davis SoilWeb for identifying the soil physical properties of a field using the United States Department of Agriculture (USDA) Soil Survey Geographic (SSURGO) database [79] or Google Maps, which can be customized for determining the longitude and latitude of a field or viewing locations of nearby weather stations. CropManage can also be customized to automatically retrieve flowmeter and soil moisture data from internet-accessible dataloggers.
While many of these irrigation-scheduling programs will provide recommendations for multiple commodities, few have been developed or tested specifically for vegetables. Most irrigation scheduling applications use single Kc values for the four crop growth stages described by Doorenbos and Pruitt [80] to simplify calculations of ETc. CropManage was initially developed for vegetable irrigation and employs a dual crop coefficient approach for estimating crop ET similar to Gallardo et al. (1996), as described in Johnson et al. [81] and Smith et al. [16]. The vegetable crops currently supported include broccoli, cabbage, cauliflower, lettuce, and spinach. Since the user enters the date of each irrigation event, CropManage adjusts watering recommendations for the frequency and method of irrigation. Empirical models of fractional cover are included for each supported vegetable crop so that the user can customize the Kcb curves for a specific season, bed width, and planting configuration. Replicated field trials demonstrated that the CropManage irrigation recommendations using the ET based algorithm with a dual crop coefficient optimized water use and yield in crisp head lettuce and broccoli [81].
4.2. Achieving Widescale Adoption of Irrigation Software
Despite significant progress in developing ET-based irrigation scheduling software for commercial vegetable farms, many challenges exist that will need to be addressed to achieve large-scale adoption by growers. Although public ET weather station networks have been established in many vegetable producing regions of the US and Europe, they are less common in other regions such as India, China, and Latin America. In areas where ET0 data are available, the density or siting of weather stations may not provide sufficient resolution to fully capture regional variation in microclimates. In these instances, growers may choose to install and operate their own weather stations, as described above.
Another challenge is to deliver accurate irrigation recommendations without requiring users to provide excessive details about their crop, irrigation system, and field conditions. Morrison [82] found that time constraints and concerns about data entry errors were factors that deterred grower adoption of the irrigation scheduling software. Irrigation scheduling apps also need to be intuitive for irrigators and farm managers to use in the field. The user-interface displayed on smartphones and tablet computers must be easy to read and to understand, while providing sufficient detail for the user to verify that the values for ET0, Kc, and other variables used in the scheduling calculations are accurate. Also, since the principal language of many irrigators in the western US is Spanish, irrigation scheduling applications need to support multiple languages.
The cost of computer programming services is also a major barrier to developing and maintaining irrigation scheduling software. As software has become more sophisticated, and needs to be compatible with personal and tablet computers and smartphones, the complexity and consequently costs of development have increased. Software products will incur annual costs associated with updating to new technology, introducing new features, and troubleshooting identified errors. Most publicly available irrigation scheduling applications were initially developed under research grants, and need either continued grant funding or income generated from user subscriptions to support updating and maintenance costs. Several online irrigation scheduling services that were initially funded by the European Union became inactive after grants ended [83]. It may be cost-effective for institutions to collaborate on the development of software products that are sufficiently flexible to be customized for different growing regions and commodities. SmartIrrigation is an example of such collaboration between the University of Florida and University of Georgia. There also may be opportunities for public agencies, commodity boards, and commercial companies to partner on the development of commercial irrigation scheduling software. For instance, SureHarvest Inc. (Santa Cruz, CA, USA) recently developed an online irrigation-scheduling tool for almonds in collaboration with the University of California and the Almond Board of California.
5. Field Measurements of Crop ET
Field measurements of crop ET are needed to develop and verify crop coefficients as well as to investigate the interaction of water stress on crop yield and quality. Several reviews detail the advantages and disadvantages of various methods of measuring crop ET [84,85]. Weighing lysimeters have often been used to measure crop water use [85,86]. While considered the most accurate ET measurement method, the expense of these instruments limits their use to research stations and constrains the range of sites, crops, and management practices that can reasonably be evaluated. Energy balance methods such as Bowen ratio [85], eddy covariance [85], and surface renewal [87] are more affordable alternatives to lysimetry for evaluating crop ET and can be deployed in commercial fields for evaluating crop water use under a wide range of growing conditions. Instrumentation costs for these methods can exceed $10,000 USD per station, which has limited their use primarily to research studies. Energy balance methods involve monitoring of net radiation, soil heat flux, and sensible heat flux to estimate the latent heat flux (Wm−2), which can be converted to water flux or evapotranspiration rate through the latent heat of vaporization. Generally, the sensors used for energy balance measurements have become more reliable, cheaper, and more accurate in recent years. The capabilities of dataloggers used for operating the instrumentation have also improved, with more memory and faster computation speeds, while post-processing software modules have become more accessible. Energy balance methods have been used for evaluating the water use of vegetable crops in commercial fields, including artichokes, broccoli, beans, lettuce, onions, and processing tomatoes [50,88,89,90,91,92]. These methods have been useful for reevaluating existing crop coefficients, as production practices and varieties have improved during recent years [93]. However, considering the diversity of vegetables and production methods, relatively few ET studies have been published using these techniques during the last decade. Surface renewal, which uses thermocouples to measure rapid changes in air temperature, has greatly reduced the costs of estimating sensible heat flux and may be well suited to vegetable fields due to a smaller fetch requirement compared to eddy covariance. Advances in surface renewal methodology [94] have culminated in a commercial service that provides growers with ET estimates and irrigation recommendations via a web application (Tule Technology Inc., Oakland, CA, USA). However, this tool has primarily been used in perennial crops such as trees, grapes, and strawberries.
6. Satellite-Based Crop ET Determination
6.1. Energy Balance
Researchers have developed satellite-based energy balance models to estimate ET at various spatial and temporal scales (e.g., reviews of Courault et al. [95]; Kalma et al. [96]; Gonzalez-Dugo et al. [97]). The Surface Energy Balance Algorithm for Land (SEBAL) and the Mapping EvapoTranspiration at high Resolution with Internalized Calibration (METRIC) are two widely used approaches [98,99]. Optical and thermal band data from Landsat or other satellites is used to help parameterize the energy balance equation [100]. At the moment of satellite overpass, latent heat flux (LE) is retrieved through the calculation of surface energy balance that is based on radiative, aerodynamic, and energy balance physics. LE is converted to ET for the corresponding hour and subsequently to reference ET fraction (ETrF) by comparison with the measured reference ET for the hour. Finally, daily (2) ET is derived as the product of ETrF and reference ET for the day, under the assumption that ETrF approximates the average daylight evaporative fraction. The energy balance approach accounts for the effects of ET reduction in water-stressed crops, due to stomatal regulation and increased ET due to bare-soil evaporation. Linear or spline interpolation can be used to estimate ETrF (hence daily ET) between satellite overpasses, which occur every eight days in the case of Landsat, assuming clear-sky conditions. Manual intervention is used to calibrate the sensible heat flux computation by identifying portions of the image (hot and cold ‘anchor’ pixels) that represent extreme ET conditions, where ET can be estimated and assigned a priori. In a typical agricultural situation, cold pixels are associated with well-irrigated agricultural fields with high Fc and hot pixels with bare dry fields. Overall the ET retrieval error for the satellite-based energy balance is typically 5–15%, when estimates are produced by an experienced operator, and rises to 30–40% when operated by non-specialists or novices to the fields of hydrologic science, environmental physics, remote sensing, or agricultural systems [85]. An automated calibration method has been recently developed to facilitate and improve operation by non-specialists [101].
6.2. Vegetation Index
Hybrid approaches estimate fractional cover (Fc) from remote sensing and use ground-based ET0 data. Fc is a good indicator of light interception, which is a strong driver of ETc [48]. Weighing lysimeter observations by Bryla et al. [102] revealed a strong relationship between Fc and ETc for vegetable crops in California’s San Joaquin Valley, and the potential for using satellite-based Fc to estimate ETc in vegetable crops was demonstrated by Johnson and Trout [103]. Fc can be estimated from various spectral visible-region bands, where chlorophyll absorption dominates, combined with near-infrared (NIR), where vegetation is highly reflective. A common formulation is the normalized difference vegetation index, or NDVI, which is derived as (NIR − red)/(NIR + red) [104]. Trout et al. [105] and Johnson and Trout [103] found a strong relationship between NDVI and Fc for vegetables and other crop types in California’s San Joaquin Valley. NDVI began to lose sensitivity above 80 percent cover, a point generally regarded as effective full cover for water management applications [106]. As above, interpolation can be applied to estimate NDVI, and hence ETc, for days between satellite overpasses as needed.
7. Satellite Based Irrigation Management Services
7.1. Prototype Systems
By furnishing field scale estimates of Fc, a key factor for estimating Kcb and basal ETc (ETcb), optical remote sensing may potentially improve the accuracy of ET estimates in vegetables. Several satellite-based models have been developed for irrigation management. An early proof-of-capability satellite demonstration on wheat and corn was undertaken by the DEMETER project in Europe, which involved timely delivery of Landsat-based crop coefficients to agricultural end-users, with available online visualization and analysis capabilities [107].
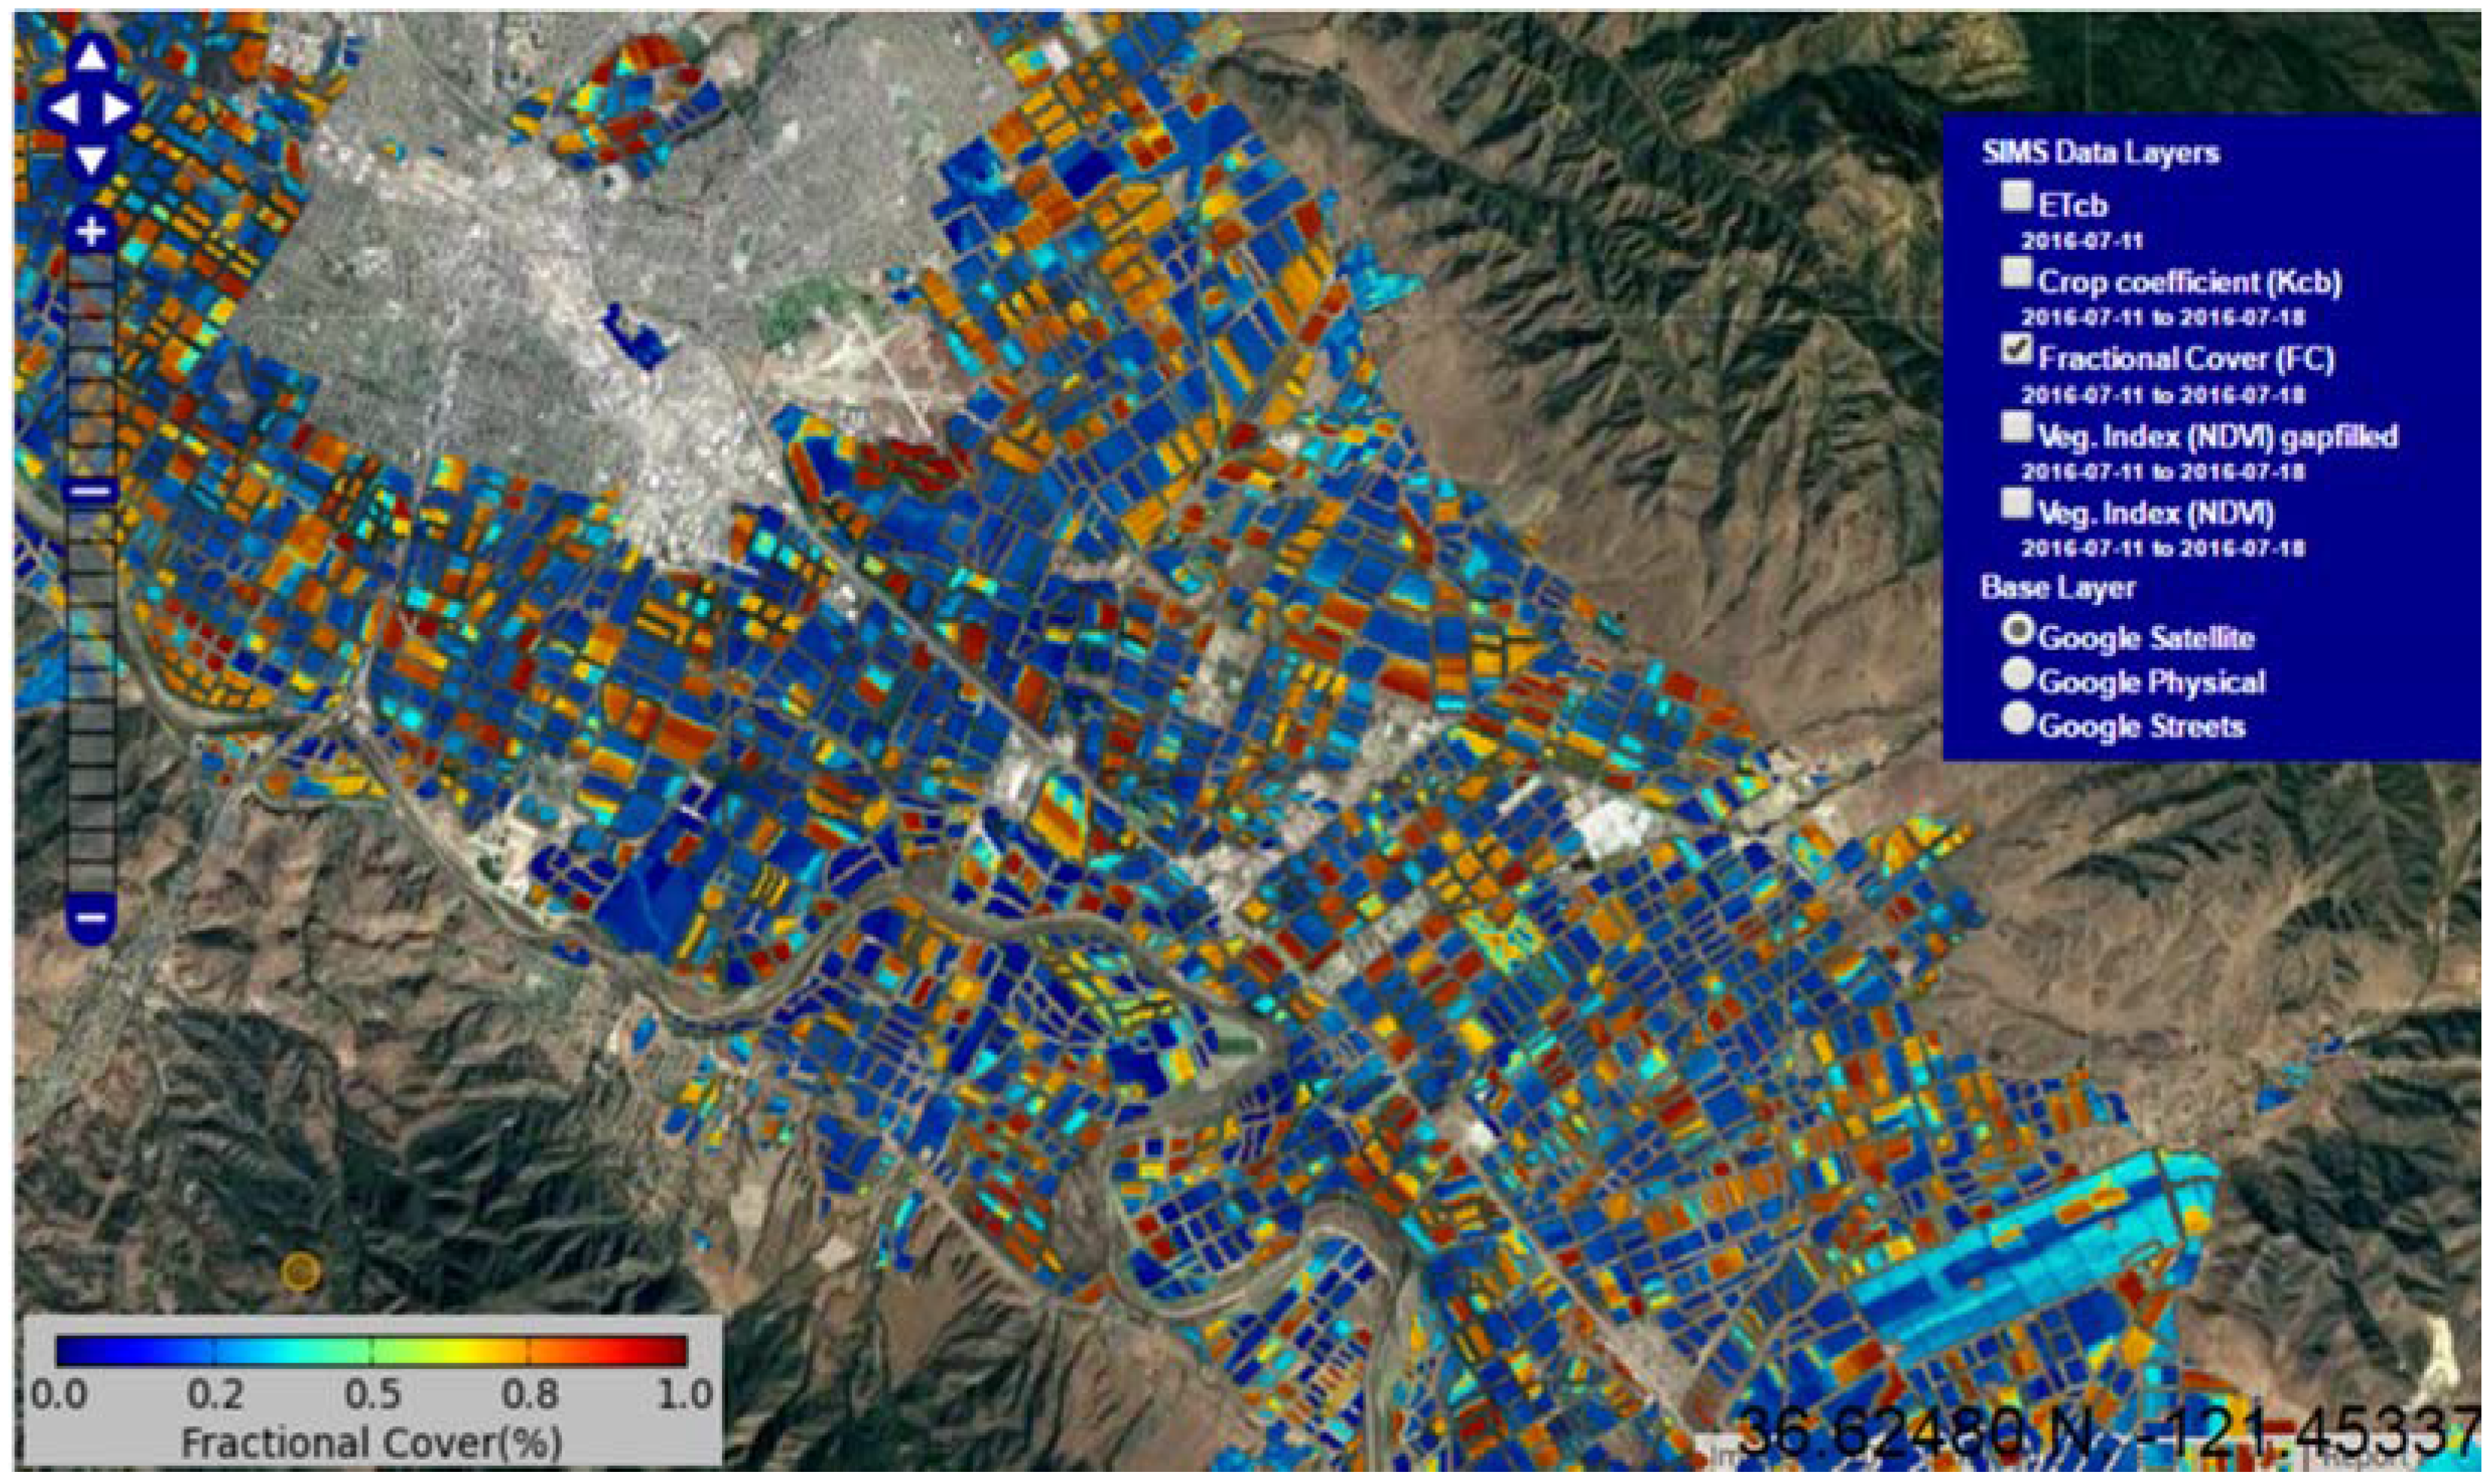
More recently, the fully-automated Satellite Irrigation Management Support (SIMS) [108] uses atmospherically corrected Landsat data to map NDVI, Fc, and Kcb for multiple crop types, including vegetables across about eight million acres of California irrigated farmland [109]. These variables are updated every eight days at 30 m spatial resolution (cloud cover and data availability permitting) from 2010 to the present. The SIMS uses daily 2 km ET0 statewide grids produced by the California Irrigation Management Information System [53] to generate basal crop ET. Web data services allow users to display annual time-series graphs and download data for any given location (Figure 3). An application programming interface (API) enables on-demand transfer of SIMS data products to support external irrigation advisory services such as CropManage and also allows the user and other software tools to specify the crop type via the API and retrieve crop-specific Kcb data from SIMS. Where information is available on applied water, an FAO56 based soil water balance model can be used to adjust for soil evaporation and crop stress and to retrospectively derive agricultural water use fractions at the field scale for the evaluation of irrigation management and system performance [110].
IrriSAT [111] is a weather based irrigation management and benchmarking technology that uses satellite remote sensing to generate crop water management information in Australia, primarily for grape and cotton growers at present [112,113]. As with SIMS, Landsat is used to estimate Kc at a 30 m resolution. Unlike SIMS, Kc is derived directly from a single linear relationship with satellite NDVI. Daily crop water use is determined as the product of Kc and ET0 observations from nearby weather stations, and a seven-day ET0 forecast is also produced. The delivery platform, which is built on the Google App Engine helps irrigators track soil moisture and better manage irrigation schedules. In addition, IrriSAT facilitates the calculation of seasonal agronomic performance metrics, including the irrigation water use index and gross production water use index.
Additional satellite-based services have been implemented Europe and Australia [114]. These include IRRISAT-Italy (as distinct from IrriSAT-Australia described above), EO4Water (Austria), and IrriEye (southern Australia). These services generally involve the use of optical DEIMOS 20 m satellite imagery to generate and deliver leaf area index with derived Kc and related map overlays within a browsing and querying toolbox [115]. Personalized irrigation guidance regarding crop water requirement is dispensed through a secure website, SMS, and email. End-users are able to provide evaluative feedback. A variety of crops are being tested, including vegetables, sugar beet, corn, alfalfa, and orchards.
Earth Engine Evapotranspiration Flux (EEFlux) [116] is a METRIC implementation on the Google Earth Engine cloud computing platform [117]. Landsat scenes from 1984 to the present are combined with gridded weather data to allow the analysis of most land areas worldwide. The products include maps of ET, associated energy balance flux components, and land cover. A time-series can be constructed by processing several scenes and interpolating between image dates. Automated image calibration for anchor pixels is offered in a Level 1 version to accommodate operation by non-experts, with some sacrifice in accuracy. A Level 2 version, which allows custom calibration by the operator, requires an annual license fee. EEFlux is a general tool that operates on both agricultural and non-agricultural land cover types.
7.2. Satellite Remote Sensing Considerations for Irrigation Scheduling
Satellite observation is recognized as a useful tool that will continue to support crop coefficient development and ET monitoring for new types and varieties of crops, as facilitated by the wider availability of gridded weather data and continued advancement in convenient and user-friendly mapping technologies [118]. The use of public domain satellites with open-data policies, i.e., the data source is available at no charge, is an advantage of this approach, as is the capability to collect data for many fields simultaneously. Vegetable crops, however, do present some unique challenges for satellite-based evaluation. The frequency of satellite overpasses, presence of cloud cover, and added time needed to perform custom atmospheric correction (e.g., Vermote and Saleous [119]) may limit the use of remote sensing for real time irrigation scheduling of fast-growing vegetable crops. As more satellite platforms become available, such as the European Space Agency Sentinel-2 system, the observation interval between images may soon decrease to four to five days for NDVI-based ET models. Also, upon further testing, it may be shown that use of a simplified atmospheric correction approach (e.g., Tasumi et al. [120]) may be adequate for application in some or most regions. Where real-time irrigation scheduling operations are unsupported, remote sensing may still prove useful for the retrospective evaluation of irrigation system performance or compilation of water use metrics. Another challenge is the typically small field size for vegetables as noted above (4–5 ha), which is near the minimum land area recommended for evaluation by Landsat or other public Earth observation satellites. An additional challenge is posed by leaf color, especially for crops such as red lettuce that depart widely from the green-leaf norm. A recent study has also shown that while NDVI was strongly related to Fc in both leafy greens (r2 = 0.88) and cole crops (r2 = 0.93), the relationships were different [121]. Thus, the development of customized relationships between NDVI and Fc by crop category is recommended to increase the accuracy of Fc estimates.
8. Remote Sensing Using Manned Aircraft and Unmanned Aerial Vehicles (UAV)
The use of manned aircraft and UAVs for monitoring vegetables has become a viable alternative or complement to satellite observation. Image resolution is generally much finer than that of Landsat or other open-data satellites, and passes over fields can be scheduled on a more frequent and flexible basis. However, data calibration to assure image consistency in support of time-series observations may be lacking. Several commercial companies offer NDVI and thermal spectrum images at <1 m resolution taken at weekly intervals using small planes in California and elsewhere (e.g., CERESimaging Inc., Oakland, CA, USA; TerrAvion Inc., San Leandro, CA, USA). Images can be accessed from the web generally within 24 h of collection. The high resolution of these scenes can provide enhanced information about within-field spatial variability in crop growth and water stress and for determining Fc used to parameterize ET equations. Patterns can show when a crop is under-irrigated such as in Figure 4, where the NDVI values for a romaine lettuce crop are lowest midway between sprinkler lines, presumably caused by poor irrigation distribution uniformity.
The acquisition costs of UAVs and the training needed for mission planning, flight operation, and image processing have diminished significantly during recent years. A number of studies describe the use of UAVs for monitoring water stress [122,123] and vegetative cover [124,125] of crops, though few have specifically focused on vegetables. Due to the ease of operation, arranging flights at specific times and locations with UAVs may be simpler than with manned aircraft, which usually need to image a minimal number of fields to justify flight costs. This flexibility may be useful in vegetables when timely field scouting is needed to make decisions or diagnose a problem with a fast-growing crop. UAVs can fly at very low altitudes and carry sensor packages that can provide high-resolution imagery in the order of a few centimeters. A disadvantage of UAV operation, in the case of an owned system, would be a higher up-front cost than the engagement of a manned aircraft provider and additional time required for data retrieval and image processing.
9. Conclusions
Water scarcity will most likely continue to be a significant problem in many of the important vegetable production regions of the world [126]. Improving water use efficiency through more accurate scheduling of irrigation can conserve water and address water quality impacts associated with commercial vegetable operations. However, irrigation scheduling in vegetables presents some unique challenges due to the diversity of crop types, intensive rotations, and number of fields that must be managed, as well as competing cultural operations that are involved in growing marketable crops. Advances in soil moisture sensors, wireless communications, ET measurements, remote sensing, computer technology, and cloud computing offer many potential opportunities to develop robust irrigation advisory tools to help farmers accurately determine and meet crop water needs. While much progress has already been made in soil moisture sensing and ET-based irrigation scheduling, achieving wide-scale adoption in the vegetable industry will require continued innovation. Continued collaboration between public research institutions, universities, commodity boards, and commercial firms will likely be needed to develop simple-to-use tools that will be broadly accepted by vegetable growers.
Acknowledgments
The authors wish to thank Forrest Melton, Richard Smith, and Rick Snyder for their careful review and edits in the preparation of this manuscript.
Author Contributions
Conflicts of Interest
The authors declare no conflict of interest. Mention of companies, proprietary products, or trade names does not imply endorsement by the authors or their associated institutions and does not imply approval to the exclusion of other products or vendors that may also be suitable.
Abbreviations
The following abbreviations are used in this manuscript:
| API | application programming interface |
| BIS | basic irrigation scheduling |
| CIMIS | California irrigation management and information system |
| CUP | consumptive use program |
| EEFlux | earth engine evapotranspiration flux |
| EM | electromagnetic |
| ET | evapotranspiration |
| ET0 | reference evapotranspiration |
| ETc | crop evapotranspiration |
| Fc | fractional cover |
| GMS | granular matrix sensor |
| Kc | crop coefficient |
| LE | latent heat flux |
| METRIC | mapping evapotranspiration at high resolution with internalized calibration |
| NDVI | normalized difference vegetation index |
| NIR | near infra-red |
| SEBAL | surface energy balance algorithm for land |
| SIMS | satellite irrigation management system |
| SSURGO | soil survey geographic database |
| UAV | unmanned aerial vehicle |
| UC | University of California |
| USDA | United States Department of Agriculture |
| WISE | Washington irrigation scheduling expert |
References
- Mount, J.; Chappelle, C.; Gray, B.; Hanak, E.; Howitt, R.; Lund, J.; Frank, R.; Gartrell, G.; Grantham, T.; Medellín-Azuara, J.; et al. California’s Water: Managing Droughts. Public Policy Institute of California, Water Policy Center, 2016; p. 4. Available online: http://www.ppic.org/content/pubs/report/R_1016JM2R.pdf (accessed on 18 February 2017).
- Hanak, E.; Mount, J.; Chappelle, C.; Lund, J.; Medellín-Azuara, J.; Moyle, P.; Thompson, B.; Viers, J.; Seavy, N. What If California’s Drought Continues? Public Policy Institute of California, Water Policy Center, 2015; p. 20. Available online: http://www.ppic.org/content/pubs/report/R_815EHR.pdf (accessed on 18 February 2017).
- Pedrero, F.; Alarcon, J.J.; Nicolas, E.; Asano, T. Monterey Regional Water Pollution Control Agency (MRWPCA): Transforming wastewater into a profitable resource. Agric. Vergel Frutic. Hortic. Floric. Citric. Vid Arroz 2009, 28, 464–469. [Google Scholar]
- Khan, S. Managing climate risks in Australia: Options for water policy and irrigation management. Aust. J. Exp. Agric. 2008, 48, 265–273. [Google Scholar] [CrossRef]
- Arumí, J.L.; Rivera, D.; Holzapfel, E.; Muñoz, E. Effect of drought on groundwater in a Chilean irrigated valley. Proc. Inst. Civ. Eng. Water Manag. 2013, 166, 231–241. [Google Scholar] [CrossRef]
- Ortega-Reig, M.; Palau-Salvador, G.; Cascant i Sempere, M.J.; Benitez-Buelga, J.; Badiella, D.; Trawick, P. The integrated use of surface, ground and recycled waste water in adapting to drought in the traditional irrigation system of Valencia. Agric. Water Manag. 2014, 133, 55–64. [Google Scholar] [CrossRef]
- Harter, T.; Lund, J.R. Addressing Nitrate in California’s Drinking Water with a Focus on Tulare Lake Basin and Salinas Valley Groundwater. Report for the State Water Resources Control Board Report to the Legislature; Center for Watershed Sciences, University of California: Davis, CA, USA, 2012; p. 78. [Google Scholar]
- Hallberg, G.R. Nitrate in Ground Water in the United States; Follett, R.F., Ed.; Elsevier Science Publishers: Amsterdam, The Netherlands, 1989. [Google Scholar]
- Zhang, L.; Ju, X.; Liu, C.; Kou, C. A study on nitrate contamination of ground water sources in areas of protected vegetables-growing fields—A case study in Huimin County, Shandong Province. Sci. Agric. Sin. 2010, 43, 4427–4436. [Google Scholar]
- Howarth, R.W.; Sharpley, A.; Walker, D. Sources of nutrient pollution to coastal waters in the United States: Implications for achieving coastal water quality goals. Estuaries 2002, 25, 656–676. [Google Scholar] [CrossRef]
- Ng, C.M.; Weston, D.P.; Lydy, M.J. Pyrethroid insecticide transport into Monterey Bay through riverine suspended solids. Arch. Environ. Contam. Toxicol. 2012, 63, 461–470. [Google Scholar] [CrossRef] [PubMed]
- Anderson, B.S.; Hunt, J.W.; Phillips, B.M.; Nicely, P.A.; Gilbert, K.D.; Vlaming, V.D.; Connor, V.; Richard, N.; Tjeerdema, R.S. Ecotoxicologic impacts of agricultural drain water in the Salinas River, California, USA. Environm. Toxicol. Chem. 2003, 22, 2375–2384. [Google Scholar] [CrossRef]
- Agricultural Order No. R3-2012-0011 Conditional Waiver of Waste Discharge Requirements for Discharges from Irrigated Lands. 2012; p. 94. Available online: http://www.waterboards.ca.gov/centralcoast/water_issues/programs/ag_waivers/docs/ag_order/agorder_final_011014.pdf (accessed on 20 January 2017).
- Council Directive 91/676/EEC of 12 December 1991 Concerning the Protection of Waters against Pollution Caused by Nitrates from Agricultural Sources. 1991. Available online: http://eur-lex.europa.eu/legal-content/EN/TXT/?uri=CELEX%3A31991L0676 (accessed on 20 January 2017).
- Koike, S.; Cahn, M.D.; Cantwell, M.; Fennimore, S.; LeStrange, M.; Natwick, E.; Smith, R.; Takale, E. Spinach production in California. In Vegetable Production Series; Vol. ANR Publication 7212; UCANR: Richmond, CA, USA, 2011. [Google Scholar]
- Smith, R.; Cahn, M.; Hartz, T.; Love, P.; Farrara, B. Nitrogen dynamics of cole crop production: Implications for fetility management and environmental protection. HortScience 2016, 51, 1586–1591. [Google Scholar] [CrossRef]
- Shock, C.C.; Wang, F. Soil water tension, a powerful measurement for productivity and stewardship. HortScience 2011, 46, 178–185. [Google Scholar]
- Pardossi, A.; Incrocci, L. Traditional and New Approaches to Irrigation Scheduling in Vegetable Crops. HortTechnology 2011, 21, 309–313. [Google Scholar]
- Shock, C.; Pereira, A.; Hanson, B.; Cahn, M. Vegetable irrigation. In Irrigation of Agricultural Crops, 2nd ed.; Lanscano, R., Sojka, R., Eds.; ASA-CSSA-SSSA (American Society of Agronomy-Crop Science Society of America-Soil Science Society of America): Madison, WI, USA, 2007; pp. 535–606. [Google Scholar]
- Thompson, T.L.; Doerge, T.A.; Godin, R.E. Subsurface drip irrigation and fertigation of broccoli: I. Yield, quality, and nitrogen uptake. Soil Sci. Soc. Am. J. 2002, 66, 186–192. [Google Scholar] [CrossRef]
- Smittle, D.A.; Dickens, W.L.; Stansell, J.R. Irrigation regimes affect cabbage water use and yield. J. Am. Soc. Hortic. Sci. 1994, 119, 20–23. [Google Scholar]
- Thompson, T.L.; Doerge, T.A.; Godin, R.E. Nitrogen and water interactions in subsurface drip-irrigated cauliflower: I. Plant response. Soil Sci. Soc. Am. J. 2000, 64, 406–411. [Google Scholar] [CrossRef]
- Gallardo, M.; Jackson, L.E.; Schulbach, K.; Snyder, R.L.; Thompson, R.B.; Wyland, L.J. Production and water use in lettuces under variable water supply. Irrig. Sci. 1996, 16, 125–137. [Google Scholar] [CrossRef]
- Thompson, T.L.; Doerge, T.A. Nitrogen and water rates for subsurface trickle-irrigated romaine lettuce. HortScience 1995, 30, 1233–1237. [Google Scholar]
- Wang, F.-X.; Wu, X.-X.; Shock, C.C.; Chu, L.-Y.; Gu, X.-X.; Xue, X. Effects of drip irrigation regimes on potato tuber yield and quality under plastic mulch in arid Northwestern China. Field Crops Res. 2011, 122, 78–84. [Google Scholar] [CrossRef]
- Munoz-Carpena, R.; Dukes, M.D.; Li, Y.C.; Klassen, W. Field comparison of tensiometer and granular matrix sensor automatic drip irrigation on tomato. HortTechnology 2005, 15, 584–590. [Google Scholar]
- Markovic, M.P.; Josipovic, M.A.; Sostaric, J.I.; Zebec, V.B.; Rapcan, I.A. Effectiveness of granular matrix sensors in different irrigation treatments and installation depths. J. Agric. Sci. Belgrad. 2016, 61, 257–269. [Google Scholar] [CrossRef]
- Munoz-Carpena, R.; Dukes, M.D.; Li, Y.; Klassen, W. Design and Field Evaluation of a New Controller for Soil-Water Based Irrigation. Appl. Eng. Agric. 2008, 24, 183–191. [Google Scholar] [CrossRef]
- Phene, C.J.; Howell, T.A. Soil sensor control of high-frequency irrigation systems. Trans. Am. Soc. Agric. Eng. 1984, 27, 392–396. [Google Scholar] [CrossRef]
- Dukes, M.D.; Scholberg, J.M. Soil moisture controlled subsurface drip irrigation on sandy soils. Appl. Eng. Agric. 2005, 21, 89–101. [Google Scholar] [CrossRef]
- Zotarelli, L.; Dukes, M.D.; Barreto, T.P. Use of Soil Moisture Sensor-based Irrigation on Vegetable Crops. Proc. Fla. State Hort. Soc. 2009, 122, 218–220. [Google Scholar]
- Zotarelli, L.; Dukes, M.D.; Scholberg, J.M.S.; Femminella, K.; Munoz-Carpena, R. Irrigation scheduling for green bell peppers using capacitance soil moisture sensors. J. Irrig. Drain. Eng. 2011, 137, 73–81. [Google Scholar] [CrossRef]
- Zotarelli, L.; Dukes, M.D.; Scholberg, J.M.S.; Munoz-Carpena, R.; Icerman, J. Tomato nitrogen accumulation and fertilizer use efficiency on a sandy soil, as affected by nitrogen rate and irrigation scheduling. Agric. Water Manag. 2009, 96, 1247–1258. [Google Scholar] [CrossRef]
- Zotarelli, L.; Scholberg, J.M.; Dukes, M.D.; Munoz-Carpena, R.; Icerman, J. Tomato yield, biomass accumulation, root distribution and irrigation water use efficiency on a sandy soil, as affected by nitrogen rate and irrigation scheduling. Agric. Water Manag. 2009, 96, 23–34. [Google Scholar] [CrossRef]
- Zotarelli, L.; Dukes, M.D.; Scholberg, J.M.; Hanselman, T.; Le Femminella, K.; Muñoz-Carpena, R. Nitrogen and water use efficiency of zucchini squash for a plastic mulch bed system on a sandy soil. Sci. Hortic. 2008, 116, 8–16. [Google Scholar] [CrossRef]
- Thompson, R.B.; Gallardo, M.; FerncLndez, M.D.; Valdez, L.C.; Martcnez-GaitcLn, C. Salinity Effects on Soil Moisture Measurement Made with a Capacitance Sensor. Soil Sci. Soc. Am. J. 2007, 71, 1647–1657. [Google Scholar] [CrossRef]
- Visconti, F.; de Paz, J.M.; Martcnez, D.; Molina, M.J. Laboratory and field assessment of the capacitance sensors Decagon 10HS and 5TE for estimating the water content of irrigated soils. Agric. Water Manag. 2014, 132, 111–119. [Google Scholar] [CrossRef]
- Kargas, G.; Soulis, K.X. Performance analysis and calibration of a new low-cost capacitance soil moisture sensor. J. Irrig. Drain. Eng. 2012, 138, 632–641. [Google Scholar] [CrossRef]
- Kelleners, T.J.; Soppe, R.W.O.; Ayars, J.E.; Skaggs, T.H. Calibration of capacitance probe sensors in a saline silty clay soil. Soil Sci. Soc. Am. J. 2004, 68, 770–778. [Google Scholar] [CrossRef]
- Parvin, N.; Degré, A. Soil-specific calibration of capacitance sensors considering clay content and bulk density. Soil Res. 2016, 54, 111–119. [Google Scholar] [CrossRef]
- Soulis, K.X.; Elmaloglou, S. Optimum soil water content sensors placement in drip irrigation scheduling systems: Concept of time stable representative positions. J. Irrig. Drain. Eng. 2016, 142, 04016054. [Google Scholar] [CrossRef]
- Soulis, K.X.; Elmaloglou, S.; Dercas, N. Investigating the effects of soil moisture sensors positioning and accuracy on soil moisture based drip irrigation scheduling systems. Agric. Water Manag. 2015, 148, 258–268. [Google Scholar] [CrossRef]
- Heinrich, A.; Smith, R.; Cahn, M. Nutrient and water use of fresh market spinach. HortTechnology 2013, 23, 325–333. [Google Scholar]
- Penman, H.L. Natural evaporation from open water, bare soil and grass. Proc. R. Soc. 1948, 120–145. [Google Scholar] [CrossRef]
- Monteith, J.L. Evaporation and the environment. Symp. Soc. for Exp. Biol. 1965, 19, 205–234. [Google Scholar]
- Allen, R.G.; Walter, I.A.; Elliot, R.; Itenfisu, D.; Brown, P.; Jensen, M.E.; Mecham, B.; Howell, T.A.; Snyder, R.; Eching, S.; et al. The ASCE standardized reference evapotranspiration equation. In Water for a Sustainable World, Limited Supplies and Expanding Demand, Proceedings of the Second International Conference on Irrigation and Drainage, Phoenix, AZ, USA, 12–15 May 2003. [Google Scholar]
- Allen, R.G.; Pruitt, W.O.; Wright, J.L.; Howell, T.A.; Ventura, F.; Snyder, R.; Itenfisu, D.; Steduto, P.; Berengena, J.; Baselga Yrisarry, J.; et al. A recommendation on standardized surface resistance for hourly calculation of reference ETo by the FAO56 Penman-Monteith method. Agric. Water Manag. 2006, 81, 1–22. [Google Scholar] [CrossRef]
- Allen, R.G.; Pereira, L.S.; Raes, D.; Smith, M. Crop evapotranspiration: Guidelines for computing crop water requirements. In FAO Irrigation and Drainage Paper; Food and Agriculture Organization (FAO): Rome, Italy, 1998. [Google Scholar]
- Guerra, E.; Ventura, F.; Snyder, R.L. Crop coefficients: A literature review. J. Irrig. Drain. Eng. 2016, 142, 06015006. [Google Scholar] [CrossRef]
- Grattan, S.R.; Bowers, W.; Dong, A.; Snyder, R.L.; Carroll, J.J.; George, W. New crop coefficients estimate water use of vegetables, row crops. Calif. Agric. 1998, 52, 16–21. [Google Scholar] [CrossRef]
- Estaciones Agroclimáticas, Consejería de Agricultura, Pesca y Desarrollo Rural. Available online: http://www.juntadeandalucia.es/agriculturaypesca/ifapa/ria/servlet/FrontController?action=Init (accessed on 27 January 2017).
- Rete Agrometeorologica Nazionale, Ministero delle Politiche Agricole Alimentari e Forestali. Available online: https://www.politicheagricole.it/flex/FixedPages/Common/miepfy200_reteAgrometeorologica.php/L/IT (accessed on 27 January 2017).
- Hart, Q.; Brugnach, M.; Temesgen, B.; Rueda, C.; Ustin, S.; Frame, K. Daily reference evapotranspiration for California using satellite imagery and weather station measurement interpolation. Civ. Eng. Environ. Syst. 2009, 26, 19–33. [Google Scholar] [CrossRef]
- Gallardo, M.; Snyder, R.L.; Schulbach, K.; Jackson, L.E. Crop growth and water use model for lettuce. J. Irrig. Drain. Eng. 1996, 122, 354–359. [Google Scholar] [CrossRef]
- Allen, R.G.; Pereira, L.S.; Smith, M.; Raes, D.; Wright, J.L. FAO-56 dual crop coefficient method for estimating evaporation from soil and application extensions. (Special Issue: Evapotranspiration prediction in irrigated agriculture). J. Irrig. Drain. Eng. 2005, 131, 2–13. [Google Scholar] [CrossRef]
- El-Shikha, D.W.P.; Hunsaker, D.; Clarke, T.; Barnes, E. Ground-based remote sensing for assessing water and nitrogen status of broccoli. Agric. Water Manag. 2007, 92, 183–193. [Google Scholar] [CrossRef]
- Hunsaker, D.F.G.; French, A.; Clarke, T.; Ottman, M.; Pinter, P. Wheat irrigation management using multispectral crop coefficients. Trans. ASABE 2007, 50, 2017–2033. [Google Scholar] [CrossRef]
- Gonzalez-Dugo, M.M.L. Spectral vegetation indices for benchmarking water productivity of irrigated cotton and sugarbeet crops. Agric. Water Manag. 2008, 95, 48–58. [Google Scholar] [CrossRef]
- Campos, I.N.C.; Calera, A.; Balbontin, C.; Gonzalez-Piqueras, J. Assessing satellite-based basal crop coefficients for irrigated grapes. Agric. Water Manag. 2010, 98, 45–54. [Google Scholar] [CrossRef]
- Smith, M. CROPWAT. A computer program for irrigation planning and management. In FAO Irrigation and Drainage Paper; FAO Land and Water Development Division: Rome, Italy, 1992. [Google Scholar]
- Snyder, R.L.; Orang, M.N.; Bali, K.M.; Eching, S. Basic Irrigation Scheduling (BIS), 2000. p. 10. Available online: https://www.researchgate.net/publication/255580842_BASIC_IRRIGATION_SCHEDULING_BIS (accessed on 20 January 2017).
- Orang, M.N.; Matyac, J.S.; Snyder, R.L. Consumptive use program (CUP) model. Acta Hortic. 2004, 664, 461–468. [Google Scholar] [CrossRef]
- Lieb, B. Washington Irrigation Scheduling Expert. Available online: https://sourceforge.net/projects/wsuwise/ (accessed on 20 January 2017).
- Leib, B.G.; Elliott, T.V. Washington Irrigation Scheduling Expert (WISE) Software. In National Irrigation Symposium, Proceedings of the 4th Decennial Symposium, Phoenix, AZ, USA, 14–16 November 2000; pp. 540–548. [Google Scholar]
- Washington State University IrrigationScheduler Mobile. Available online: http://weather.wsu.edu/is/ (accessed on 20 January 2017).
- Hillyer, C.; English, M. Irrigation Management Online. Available online: http://oiso.bioe.orst.edu/RealtimeIrrigationSchedule/index.aspx (accessed on 20 January 2017).
- Wateright. Available online: http://www.wateright.org (accessed on 20 January 2017).
- Thompson, W. Irrigation scheduling made simple(r): Wateright website does the hard work for you. Calif. Grow. Avocados Citrus Subtrop. 1998, 22, 22–23. [Google Scholar]
- CropManage. Available online: https://cropmanage.ucanr.edu (accessed on 20 January 2017).
- Cahn, M.; Smith, R.; Farrara, B.; Hartz, T.; Johnson, L.; Melton, F.; Post, K. Irrigation and nitrogen management decision support tool for vegetables and berries. In Proceedings of the U.S Committee on Irrigation and Drainage Conference: Groundwater Issues and Water Management—Strategies Addressing the Challenges of Sustainability USCID, Sacramento, CA, USA, 4–7 March 2014; pp. 53–64. [Google Scholar]
- Bartlett, A.C.; Andales, A.A.; Arabi, M.; Bauder, T.A. A smartphone app to extend use of a cloud-based irrigation scheduling tool. Comput. Electron. Agric. 2015, 111, 127–130. [Google Scholar] [CrossRef]
- SmartIrrigation Apps. Available online: http://smartirrigationapps.org/ (accessed on 20 January 2017).
- Migliaccio, K.W.; Morgan, K.T.; Vellidis, G.; Zotarelli, L.; Fraisse, C.; Zurweller, B.A.; Andreis, J.H.; Crane, J.H.; Rowland, D.L. Smartphone apps for irrigation scheduling. Trans. ASABE 2016, 59, 291–301. [Google Scholar]
- Vellidis, G.; Liakos, V.; Andreis, J.H.; Perry, C.D.; Porter, W.M.; Barnes, E.M.; Morgan, K.T.; Fraisse, C.; Migliaccio, K.W. Development and assessment of a smartphone application for irrigation scheduling in cotton. Comput. Electron. Agric. 2016, 127, 249–259. [Google Scholar] [CrossRef]
- Mannini, P.; Genovesi, R.; Letterio, T. IRRINET: Large Scale DSS Application for On-farm Irrigation Scheduling. Procedia Environ. Sci. 2013, 19, 823–829. [Google Scholar] [CrossRef]
- Montoro, A.; Lopez-Fuster, P.; Fereres, E. Improving on-farm water management through an irrigation scheduling service. Irrig. Sci. 2011, 29, 311–319. [Google Scholar] [CrossRef]
- Deumier, J.M.; Leroy, P.; Peyremorte, P. Tools for improving management of irrigated agricultural crop systems. Water Rep. 1996, 8, 39–49. [Google Scholar]
- Car, N.J.; Christen, E.W.; Hornbuckle, J.W.; Moore, G.A. Using a mobile phone Short Messaging Service (SMS) for irrigation scheduling in Australia Farmers participation and utility evaluation. Comput. Electron. Agric. 2012, 84, 132–143. [Google Scholar] [CrossRef]
- USDA SSURGO. Available online: https://sdmdataaccess.nrcs.usda.gov/ (accessed on 20 January 2017).
- Doorenbos, J.; Pruitt, W.O. Guidelines for Predicting Crop-Water Requirements, 2nd ed.; Food and Agriculture Organization of the United Nations: Rome, Italy, 1977; p. 156. [Google Scholar]
- Johnson, L.F.; Cahn, M.; Martin, F.; Melton, F.; Benzen, S.; Farrara, B.; Post, K. Evapotranspiration-based irrigation scheduling of head lettuce and broccoli. HortScience 2016, 51, 935–940. [Google Scholar]
- Morrison, M. Encouraging The Adoption of Decision Support Systems by Irrigators. Rural Soc. 2009, 19, 17–31. [Google Scholar] [CrossRef]
- Giannakis, E.; Bruggeman, A.; Djuma, H.; Kozyra, J.; Hammer, J. Water pricing and irrigation across Europe: Opportunities and constraints for adopting irrigation scheduling decision support systems. Water Sci. Technol. Water Supply 2016, 16, 245–252. [Google Scholar] [CrossRef]
- Rana, G.; Katerji, N. Measurement and estimation of actual evapotranspiration in the field under Mediterranean climate: A review. Eur. J. Agron. 2000, 13, 125–153. [Google Scholar] [CrossRef]
- Allen, R.G.; Pereira, L.S.; Howell, T.A.; Jensen, M.E. Evapotranspiration information reporting: I. Factors governing measurement accuracy. Agric. Water Manag. 2011, 98, 899–920. [Google Scholar] [CrossRef]
- Allen, R.G. Lysimeters for Evapotranspiration and Environmental Measurements; American Society of Civil Engineers: New York, NY, USA, 1991. [Google Scholar]
- Snyder, R.L.; Spano, D. Using surface renewal measurements to estimate crop evapotranspiration. In Proceedings of the Third Congress of the European Society for Agronomy, Abano Padova, Italy, 18–22 September 1994. [Google Scholar]
- Hanson, B.R.; May, D.M. Crop coefficients for drip-irrigated processing tomato. Agric. Water Manag. 2006, 81, 381–399. [Google Scholar] [CrossRef]
- Cahn, M.; Snyder, R.; Hanson, B. Estimating evapotranspiration in processing tomato. Acta Hortic. 1999, 487, 493–497. [Google Scholar] [CrossRef]
- Hanson, B.R.; May, D.M. Crop evapotranspiration of processing tomato in the San Joaquin Valley of California, USA. Irrig. Sci. 2006, 24, 211–221. [Google Scholar] [CrossRef]
- Rosa, R.; Dicken, U.; Tanny, J. Estimating evapotranspiration from processing tomato using the surface renewal technique. (Special Issue: Sensing technologies for sustainable agriculture.). Biosyst. Eng. 2013, 114, 406–413. [Google Scholar] [CrossRef]
- Lopez Avendano, J.E.; Diaz Valdes, T.; Watts Thorp, C.; Rodriguez, J.C.; Castellanos Villegas, A.E.; Partida Ruvalcaba, L.; Velazquez Alcaraz, T.D.J. Evapotranspiration and crop coefficient of bell pepper in Culiacan Valley, Mexico. Terra Latinoam. 2015, 33, 209–219. [Google Scholar]
- Hanson, B.R.; May, D.M. New crop coefficients developed for high-yield processing tomatoes. Calif. Agric. 2006, 60, 95–99. [Google Scholar] [CrossRef]
- Shapland, T.M.; McElrone, A.J.; Khaw Tha Paw, U.; Snyder, R.L. A turnkey data logger program for field-scale energy flux density measurements using eddy covariance and surface renewal. Ital. J. Agrometeorol. 2013, 18, 5–16. [Google Scholar]
- Courault, D.; Seguin, B.; Olioso, A. Review on estimation of evapotranspiration from remote sensing data: From empirical to numerical modeling approaches. Irrig. Drain. Syst. 2005, 19, 223–249. [Google Scholar] [CrossRef]
- Kalma, J.; McVicar, T.; McCabe, M. Estimating land surface evaporation: A review of methods using remotely sensed surface temperature data. Surv. Geophys. 2008, 29, 421–469. [Google Scholar] [CrossRef]
- Gonzalez-Dugo, M.; Neale, C.; Mateos, L.; Kustas, W.; Prueger, J.; Anderson, M.; Li, F. A comparison of operational remote sensing-based methods for estimating crop evapotranspiration. Agric. For. Meteorol. 2009, 149, 1843–1853. [Google Scholar] [CrossRef]
- Bastiaanssen, W.; Meneti, M.; Feddes, R.; Holtslag, A. A remote sensing surface energy balance algorithm for land (SEBAL). J. Hydrol. 1998, 212, 198–212. [Google Scholar] [CrossRef]
- Allen, R.G.; Tasumi, M.; Trezza, R. Satellite-based energy balance for mapping evapotranspiration with internalized calibration (METRIC) Model. J. Irrig. Drain. Eng. 2007, 133, 380–394. [Google Scholar] [CrossRef]
- Teixeira, A.; Bastiaanssen, W.; Ahmad, M.; Bos, M. Reviewing SEBAL input parameters for assessing evapotranspiration and water productivity for the Lower-Middle Sao Francisco river basin, Brazil, Part A: Calibration and validation. Agric. For. Meteorol. 2008, 149, 462–476. [Google Scholar] [CrossRef]
- Allen, R.; Burnett, B.; Kramber, W.; Huntington, J.; Kjaersgaard, J.; Kilic, A.; Kelly, C.; Trezza, R. Automated calibration of the METRIC-Landsat evapotranspiration process. J. Am. Water Resour. Assoc. 2013, 49, 563–576. [Google Scholar] [CrossRef]
- Bryla, D.R.; Trout, T.J.; Ayars, J.E. Weighing Lysimeters for Developing Crop Coefficients and Efficient Irrigation Practices for Vegetable Crops. HortScience 2010, 45, 1597–1604. [Google Scholar]
- Johnson, L.F.; Trout, T. Satellite NDVI assisted monitoring of vegetable crop evapotranspiration in California’s San Joaquin Valley. Remote Sens. 2012, 4, 439–455. [Google Scholar] [CrossRef]
- Tucker, C. Red and photographic infrared linear combinations for monitoring vegetation. Remote Sens. Environ. 1979, 8, 127–150. [Google Scholar] [CrossRef]
- Trout, T.; Johnson, L.; Gartung, J. Remote sensing of canopy cover in horticultural crops. HortScience 2008, 43, 333–337. [Google Scholar]
- Neale, C.; Jayanthi, H.; Wright, J. Irrigation water management using high resolution airborne remote sensing. Irrig. Drain. Syst. 2005, 19, 321–326. [Google Scholar] [CrossRef]
- Calera-Belmonte, A.; Jochum, A. Operational Tools for Irrigation Water Management Based on Earth Observation: The DEMETER Project. In Remote Sensing for Agriculture, Ecosystems, and Hydrology VIII; SPIE: Stockholm, Sweden, 2006. [Google Scholar]
- Melton, F.; Johnson, L.F. Satellite Irrigation Management System. Available online: https://ecocast.arc.nasa.gov/dgw/sims (accessed on 27 January 2017).
- Melton, F.; Johnson, L.; Lund, C.; Pierce, L.; Michaelis, A.; Hiatt, S.; Guzman, A.; Adhikari, D.; Purdy, A.; Rosevelt, C.; et al. Satellite Irrigation Management Support with the Terrestrial Observation and Prediction System. IEEE J. Sel. Top. Appl. Earth Obs. Remote Sens. 2012, 5, 1709–1721. [Google Scholar] [CrossRef]
- Johnson, L.; Cassel-Sharma, F.; Goorahoo, D.; Melton, F. Landsat-based calculation of agricultural water use fractions in California. In Proceedings of the 19th William T. Pecora Memorial Remote Sensing Symposium, Denver, CO, USA, 17–20 November 2014. [Google Scholar]
- IrriSat. Available online: https://irrisat-cloud.appspot.com/ (accessed on 27 January 2017).
- Montgomery, J.; Hornbuckle, J.; Hume, I.; Vleeshouwer, J. IrriSAT—Weather based scheduling and benchmarking technology. In Proceedings of the 17th ASA Conference, Hobart, Australia, 20–24 September 2015. [Google Scholar]
- Hornbuckle, J.; Vleeshouwer, J.; Ballester, C.; Montgomery, J.; Hoogers, R.; Bridgart, R. IrriSAT Technical Reference; Deakin University: Victoria, Australia, 2016. [Google Scholar]
- Vuolo, F.; D’Urso, G.; De Michele, C.; Bianchi, B.; Cutting, M. Satellite-based irrigation advisory services: A common tool for different experiences from Europe to Australia. Agric. Water Manag. 2015, 147, 82–95. [Google Scholar] [CrossRef]
- D’Urso, G. Current status and perspectives for the estimation of crop water requirements from earth observation. Ital. J. Agron. 2010, 5, 107–120. [Google Scholar] [CrossRef]
- EEflux. Available online: http://eeflux-level1.appspot.com/ (accessed on 27 January 2017).
- Allen, R.; Morton, C.; Kamble, B.; Kilic, A.; Huntington, J.; Thau, D.; Ratcliffe, I. EEFlux: A Landsat-based evapotranspiration mapping tool on the Google Earth Engine. In Proceedings of the ASABE/IA Irrigation Symposium, Long Beach, CA, USA, 10–12 November 2015. [Google Scholar]
- Pereira, L.; Allen, R. Crop evapotranspiration estimation with FAO56: Past and future. Agric. Water Manag. 2015, 147, 4–20. [Google Scholar] [CrossRef]
- Vermote, E.; Saleous, N. LEDAPS Surface Reflectance Product Description; University of Maryland: College Park, MD, USA, 2007. [Google Scholar]
- Tasumi, M.; Allen, R.; Trezza, R. At-surface albedo from Landsat and MODIS satellites for use in energy balance studies of evapotranspiration. J. Hydrol. Eng. 2008, 13, 51–63. [Google Scholar] [CrossRef]
- Johnson, L.; Cahn, M.; Rosevelt, C.; Guzman, A.; Melton, F.; Lockhart, T.; Farrara, B.; Melton, F. Satellite Estimation of Fractional Cover in Several California Specialty Crops; American Geophysical Union: San Francisco, CA, USA, 2016. [Google Scholar]
- Gago, J.; Douthe, C.; Coopman, R.E.; Gallego, P.P.; Ribas-Carbo, M.; Flexas, J.; Escalona, J.; Medrano, H. UAVs challenge to assess water stress for sustainable agriculture. Agric. Water Manag. 2015, 153, 9–19. [Google Scholar] [CrossRef]
- Gonzalez-Dugo, V.; Zarco-Tejada, P.; Nicolas, E.; Nortes, P.A.; Alarcon, J.J.; Intrigliolo, D.S.; Fereres, E. Using high resolution UAV thermal imagery to assess the variability in the water status of five fruit tree species within a commercial orchard. Precis. Agric. 2013, 14, 660–678. [Google Scholar] [CrossRef]
- Torres-Sanchez, J.; Pena, J.M.; de Castro, A.I.; Lopez-Granados, F. Multi-temporal mapping of the vegetation fraction in early-season wheat fields using images from UAV. Comput. Electron. Agric. 2014, 103, 104–113. [Google Scholar] [CrossRef]
- Torres-Sanchez, J.; Lopez-Granados, F.; Pena, J.M. An automatic object-based method for optimal thresholding in UAV images: Application for vegetation detection in herbaceous crops. Comput. Electron. Agric. 2015, 114, 43–52. [Google Scholar] [CrossRef]
- Food and Agriculture Organization of the United Nations; The World Water Council. Toward a Water and Food Secure Future: Critical Perspectives for Policy-Makers. 2015, p. 61. Available online: http://www.fao.org/nr/water/docs/FAO_WWC_white_paper_web.pdf (accessed on 20 January 2017).
Figure 1.
Examples of various soil moisture sensors: (A,B) capacitance sensors; (C) tensiometer with an electronic gauge; (D) tensiometers with electronic gauges installed in a lettuce field and interfaced with a datalogger and radio communications; (E) tensiometer integrated with pressure transducer, datalogger, and radio communications; (F) granular matrix sensor and reader.

Figure 2.
Fifteen minute readings (kPa) from tensiometers installed in a lettuce field at 8 (20 cm) and 18 inch (46 cm) depths are displayed in an online irrigation scheduling application.
Figure 2.
Fifteen minute readings (kPa) from tensiometers installed in a lettuce field at 8 (20 cm) and 18 inch (46 cm) depths are displayed in an online irrigation scheduling application.

Figure 3.
SIMS map of fractional cover of vegetable crops near Salinas, California as of mid-July 2016.
Figure 3.
SIMS map of fractional cover of vegetable crops near Salinas, California as of mid-July 2016.

Figure 4.
NDVI image of a romaine lettuce field irrigated with sprinklers on lateral pipes (A) spaced 12.2 m apart; Plants were frequently smaller in areas midway between pipes (B) where the NDVI values were low. Photo credit: CERESimaging Inc., Oakland, CA, USA.
Figure 4.
NDVI image of a romaine lettuce field irrigated with sprinklers on lateral pipes (A) spaced 12.2 m apart; Plants were frequently smaller in areas midway between pipes (B) where the NDVI values were low. Photo credit: CERESimaging Inc., Oakland, CA, USA.
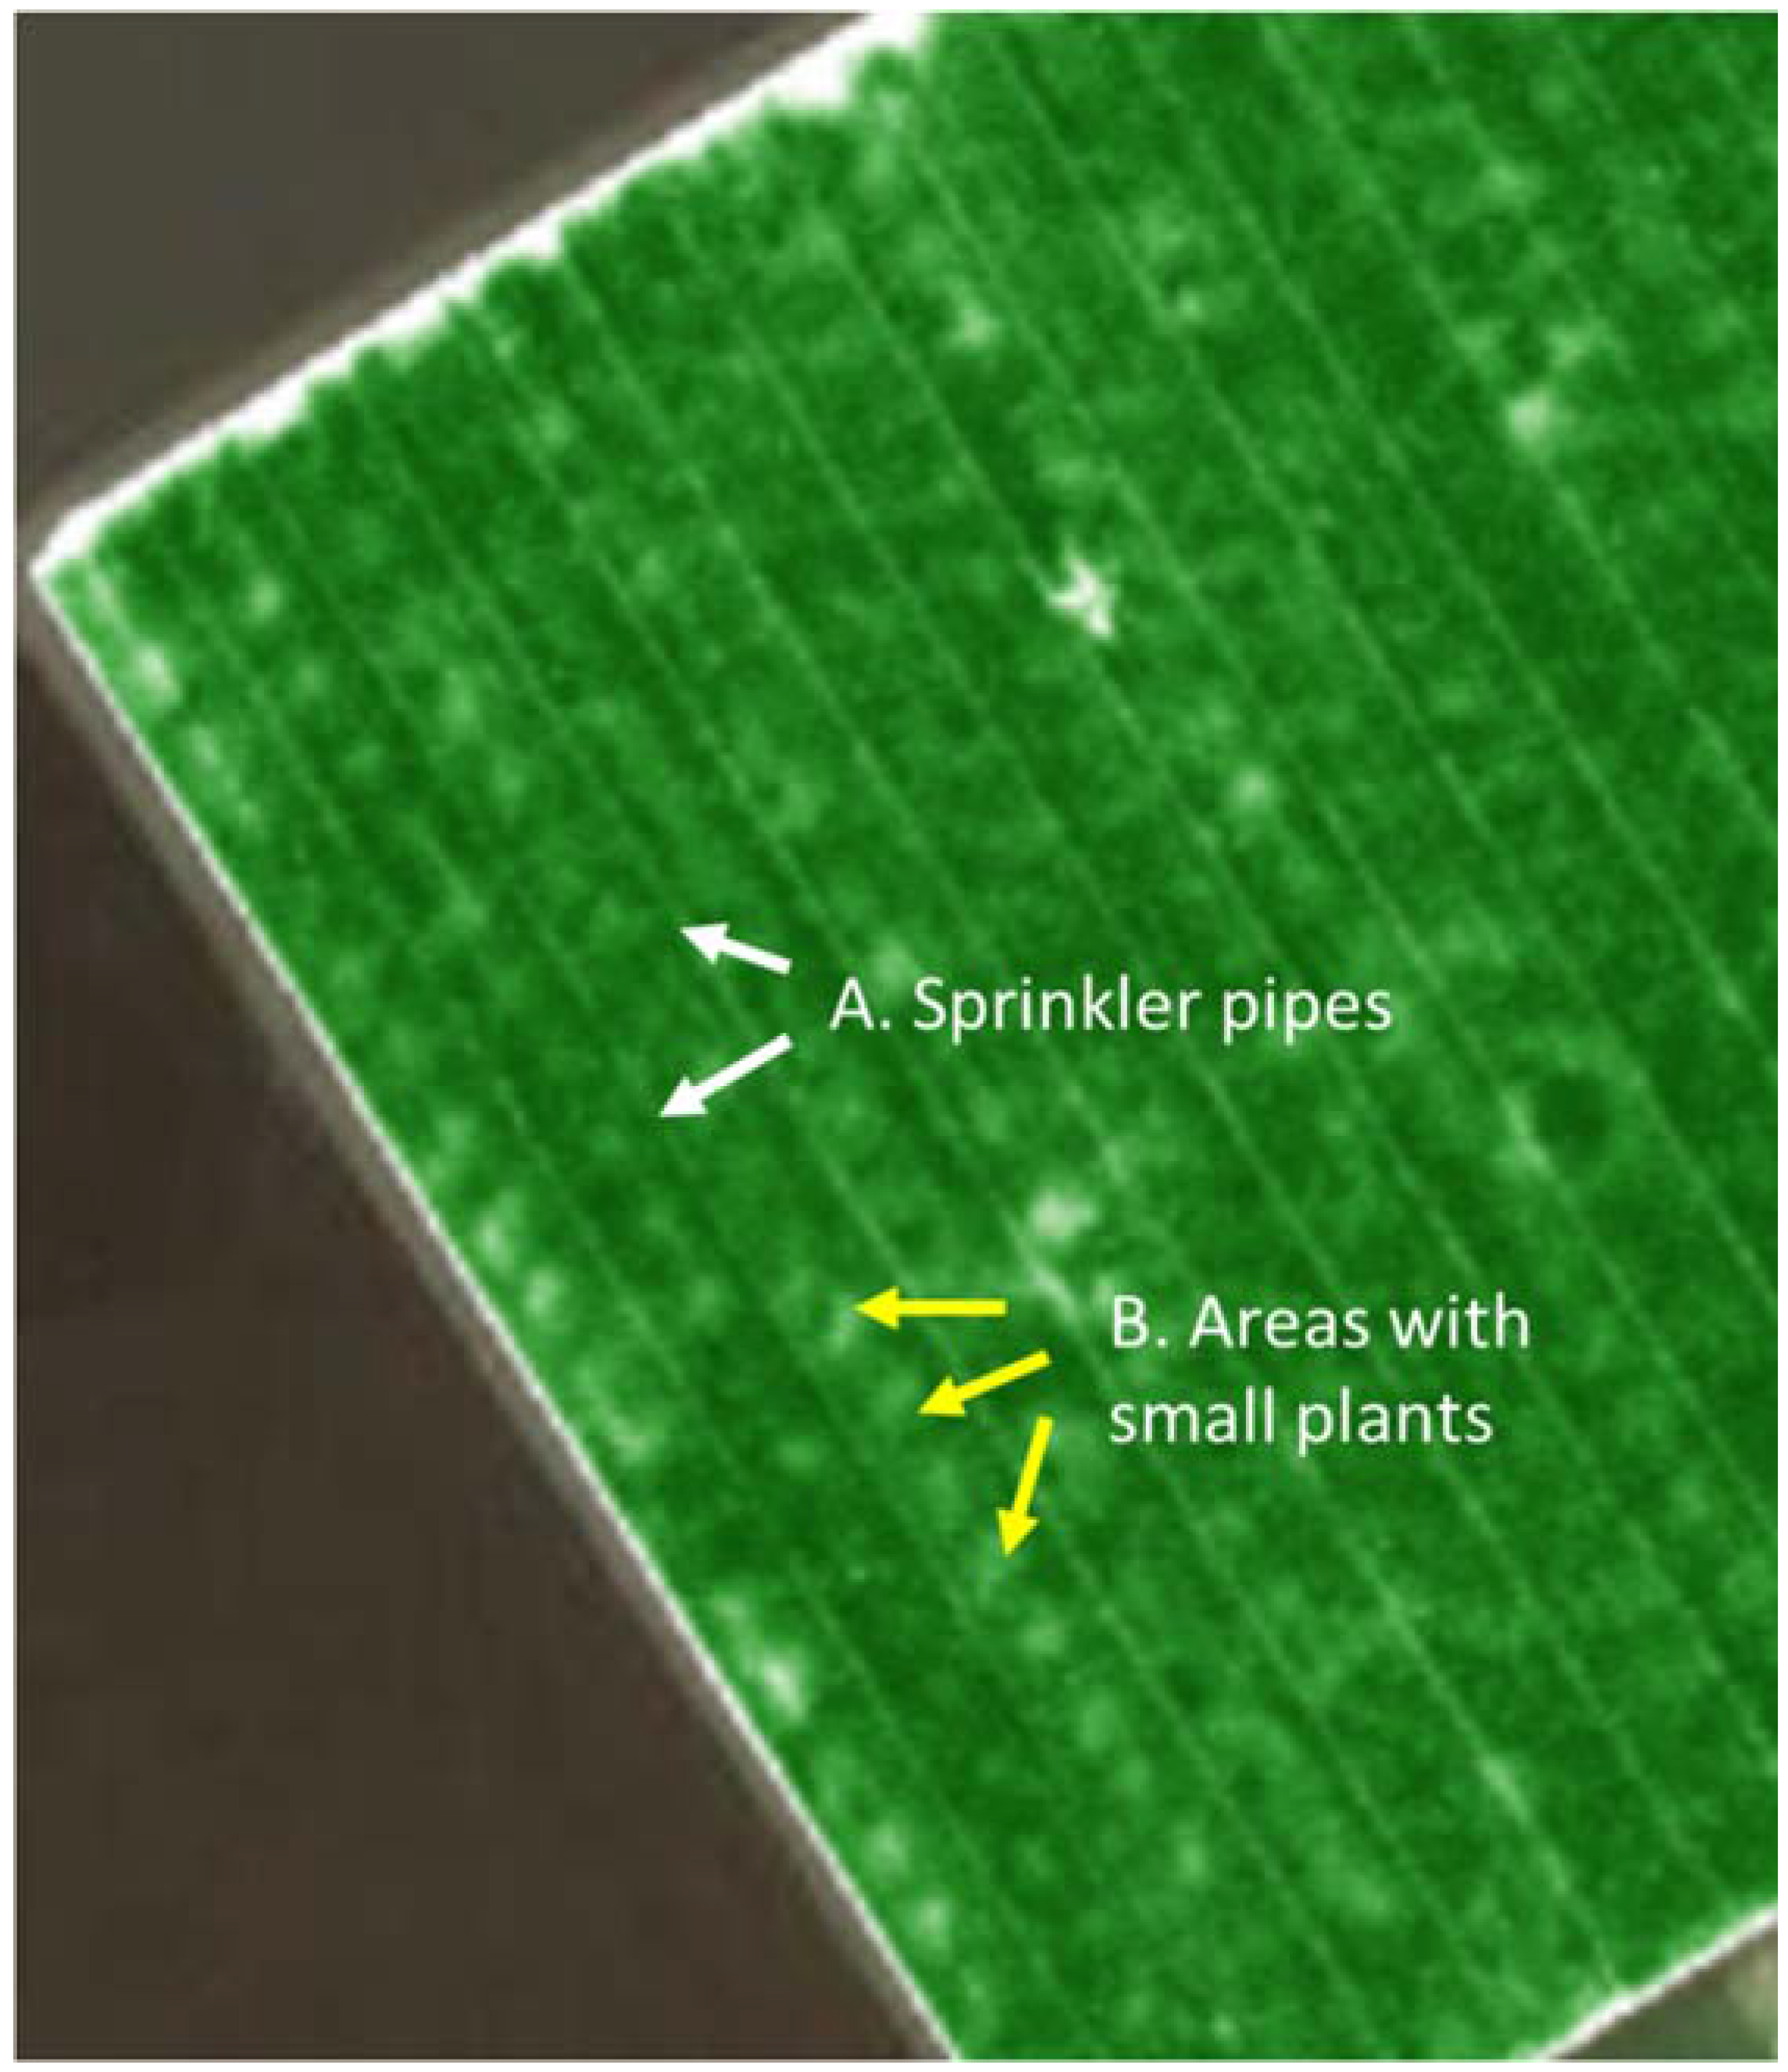
© 2017 by the authors. Licensee MDPI, Basel, Switzerland. This article is an open access article distributed under the terms and conditions of the Creative Commons Attribution (CC BY) license (http://creativecommons.org/licenses/by/4.0/).
Share and Cite
MDPI and ACS Style
Cahn, M.D.; Johnson, L.F. New Approaches to Irrigation Scheduling of Vegetables. Horticulturae 2017, 3, 28. https://doi.org/10.3390/horticulturae3020028
AMA Style
Cahn MD, Johnson LF. New Approaches to Irrigation Scheduling of Vegetables. Horticulturae. 2017; 3(2):28. https://doi.org/10.3390/horticulturae3020028
Chicago/Turabian StyleCahn, Michael D., and Lee F. Johnson. 2017. "New Approaches to Irrigation Scheduling of Vegetables" Horticulturae 3, no. 2: 28. https://doi.org/10.3390/horticulturae3020028
Note that from the first issue of 2016, this journal uses article numbers instead of page numbers. See further details here.