Impact of Organic Acids Supplementation to Hardwood Spent Sulfite Liquor as Substrate for the Selection of Polyhydroxyalkanoates-Producing Organisms

 , , ,
, , ,
Abstract
:
1. Introduction
2. Material and Methods
2.1. Culture Medium
2.2. Reactor Operation
2.3. Accumulation Tests
2.4. Analytical Methods
2.5. Microbial Community Analysis
2.5.1. Nile Blue Staining
2.5.2. Fluorescence in Situ Hybridization (FISH)
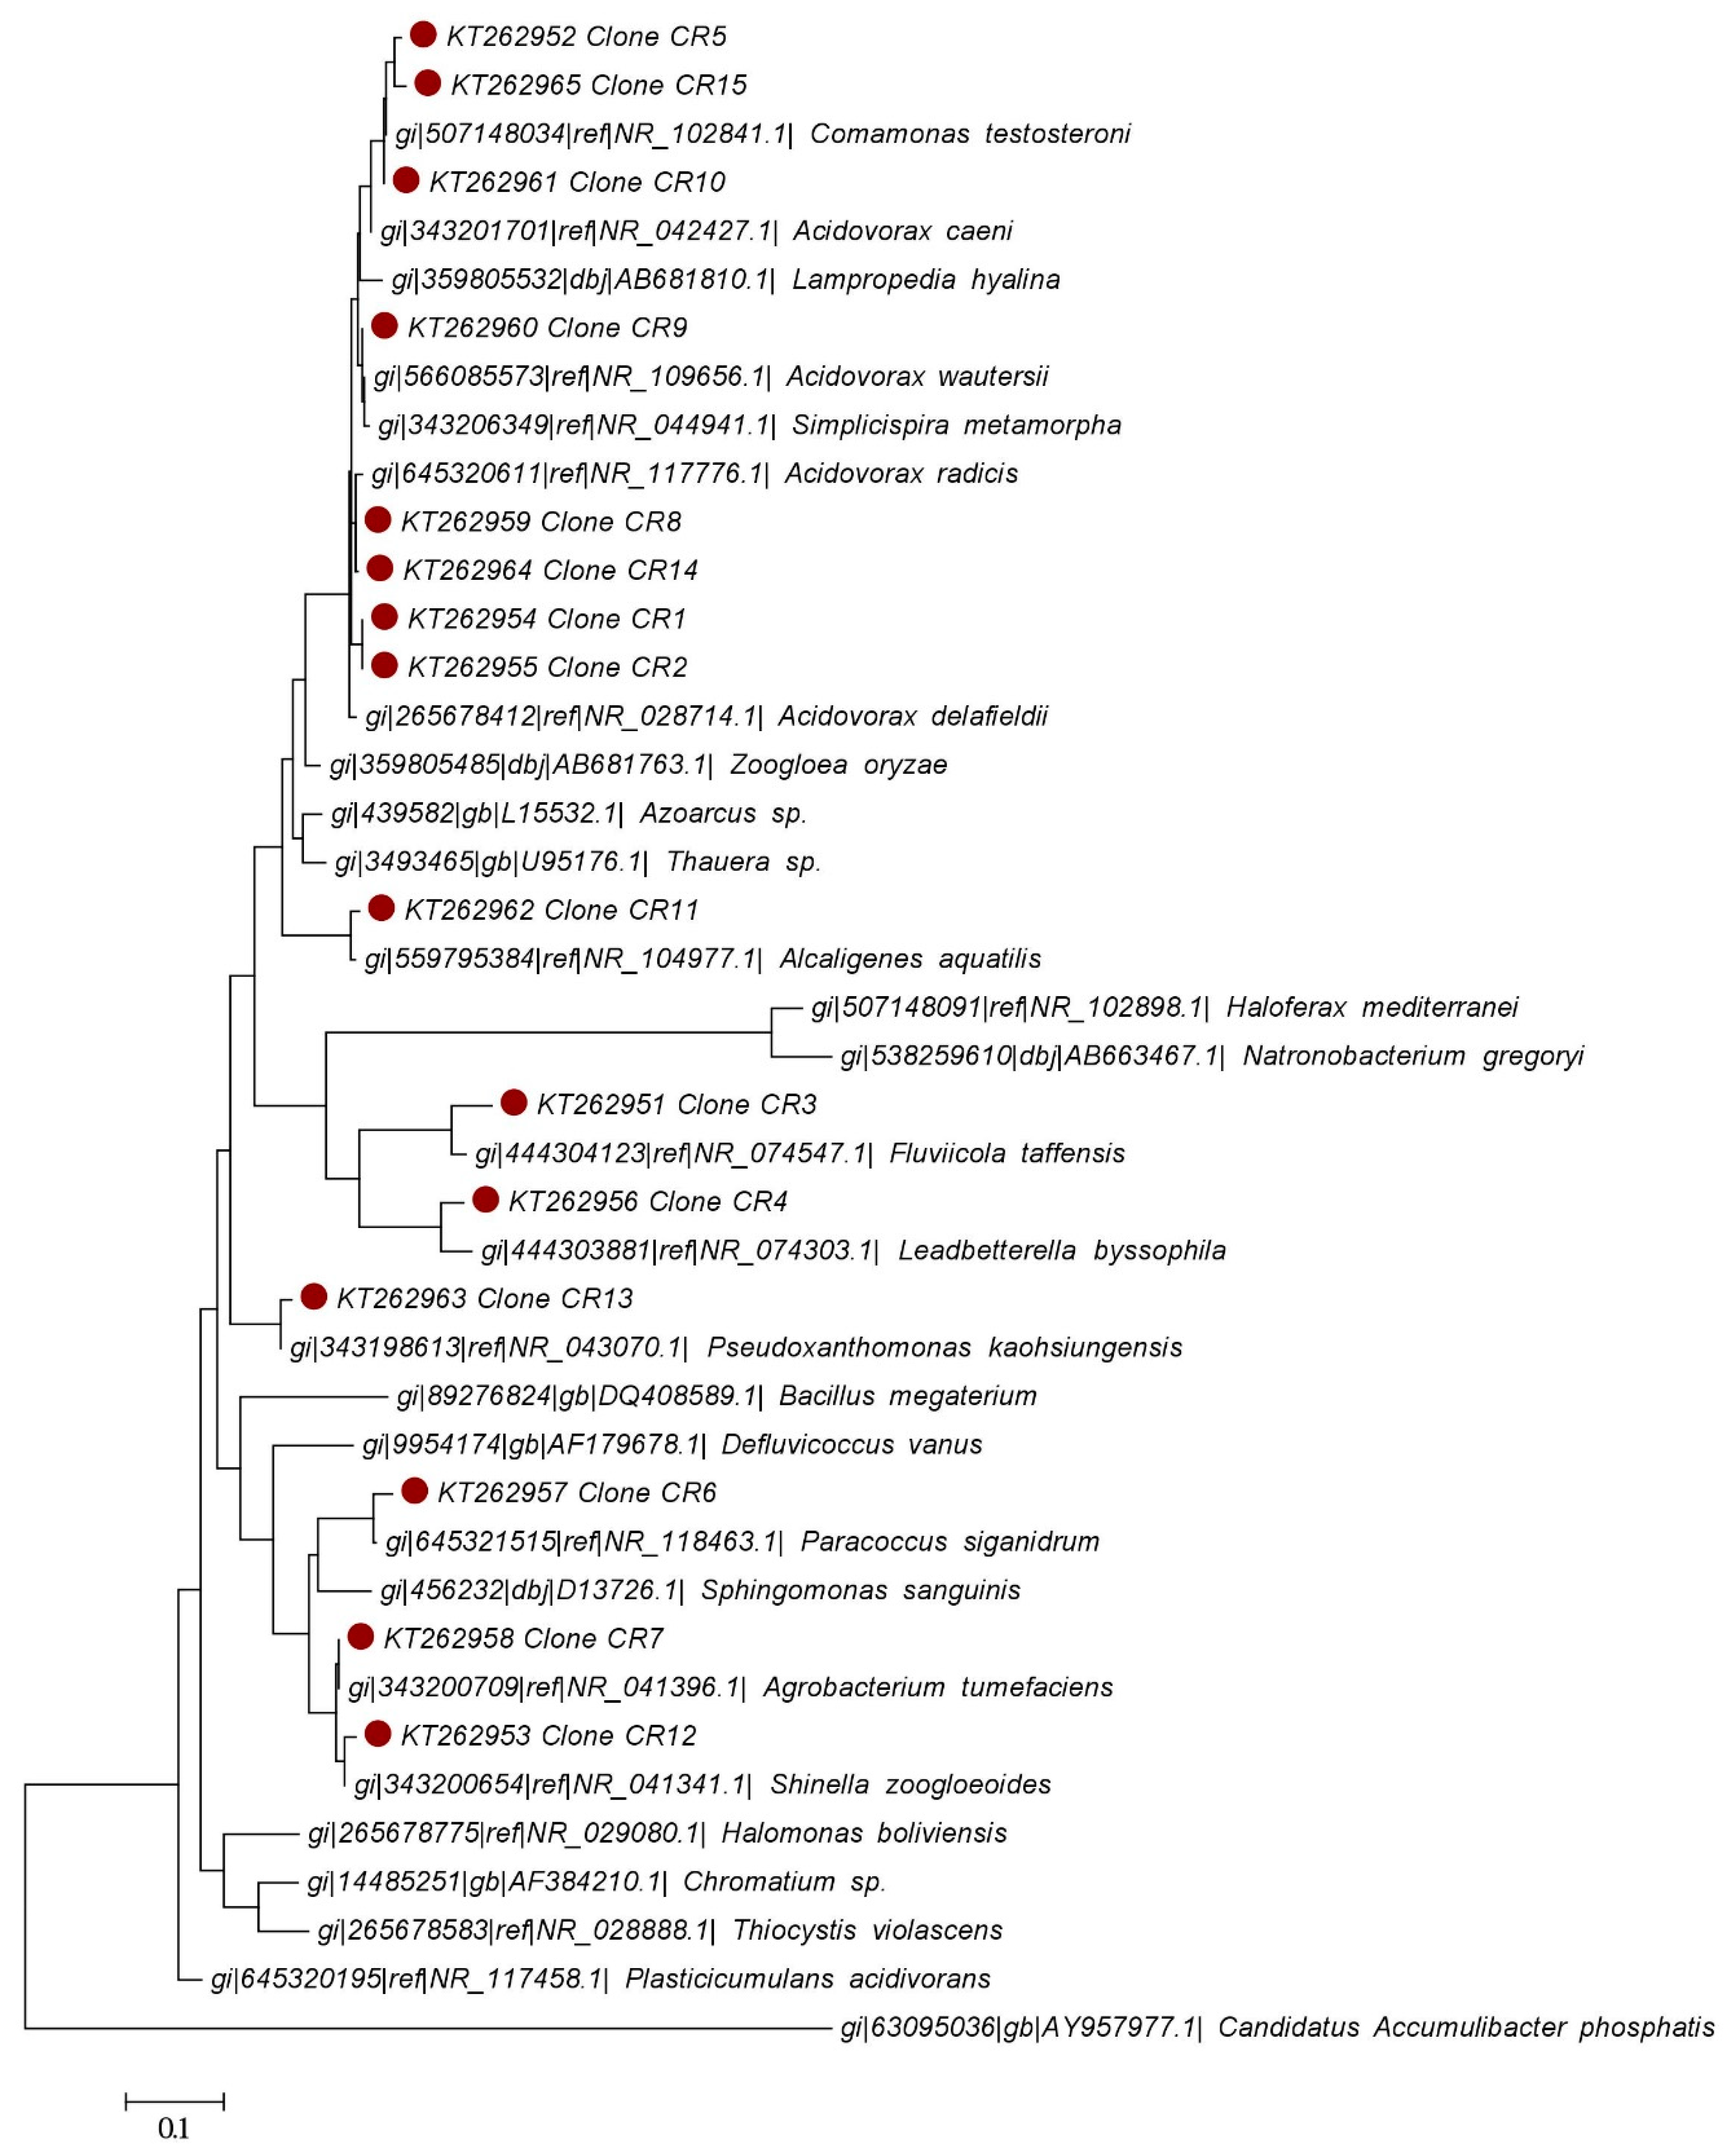
2.5.3. 16S r.DNA Clone Library
3. Calculations
4. Results and Discussion
4.1. SBR Operation
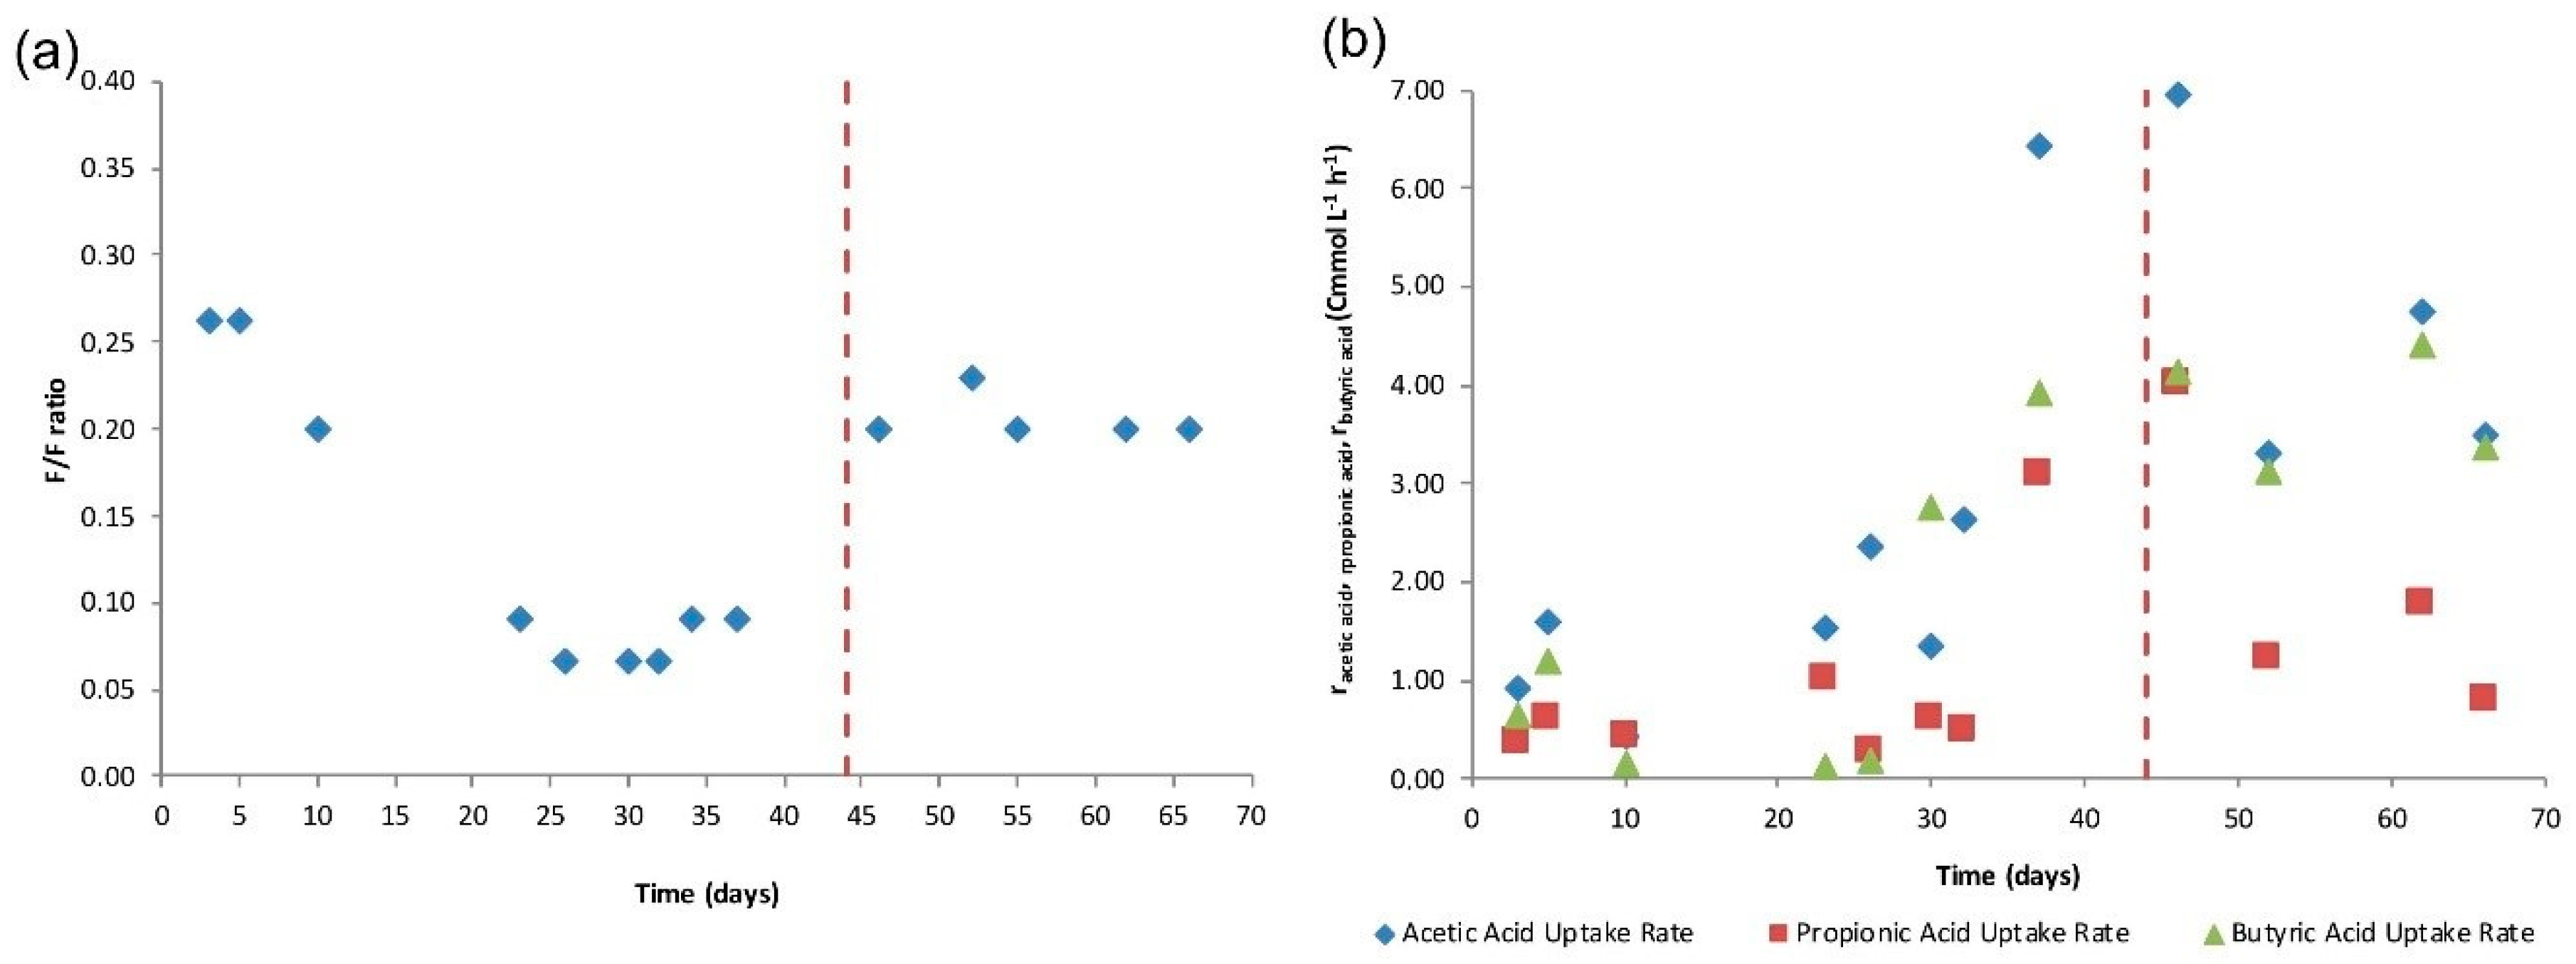
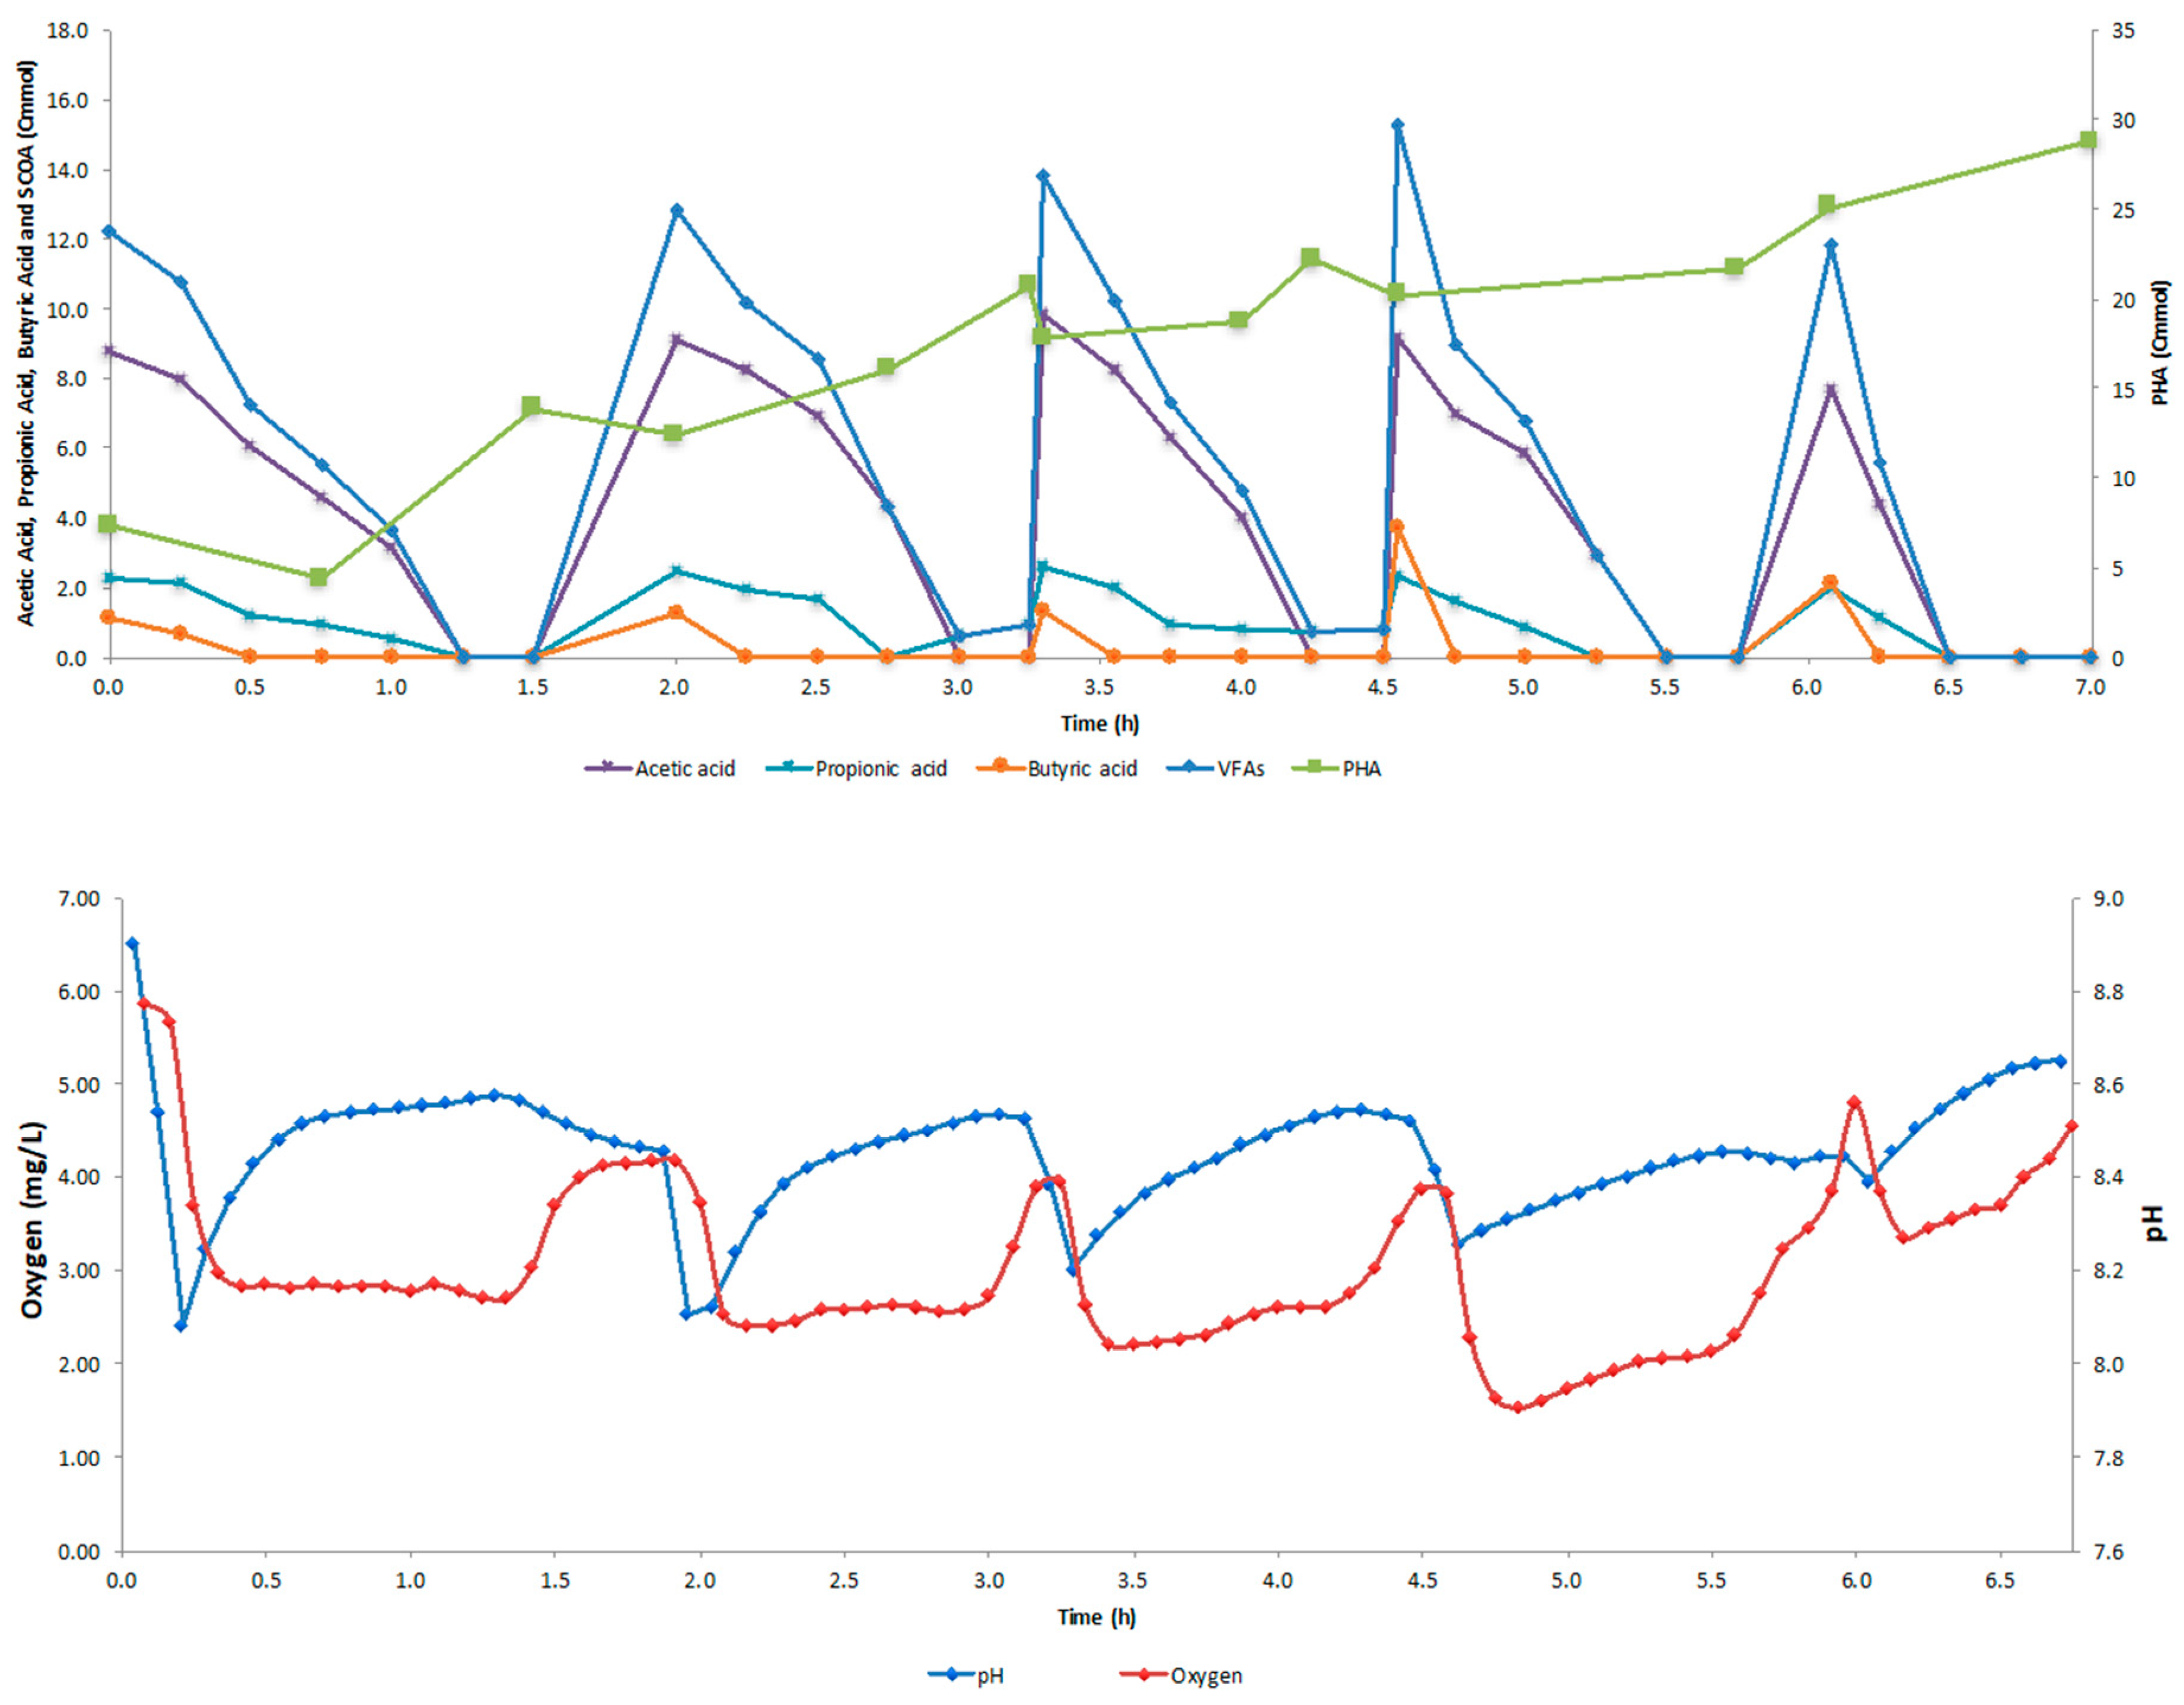
4.2. SBR Cycle
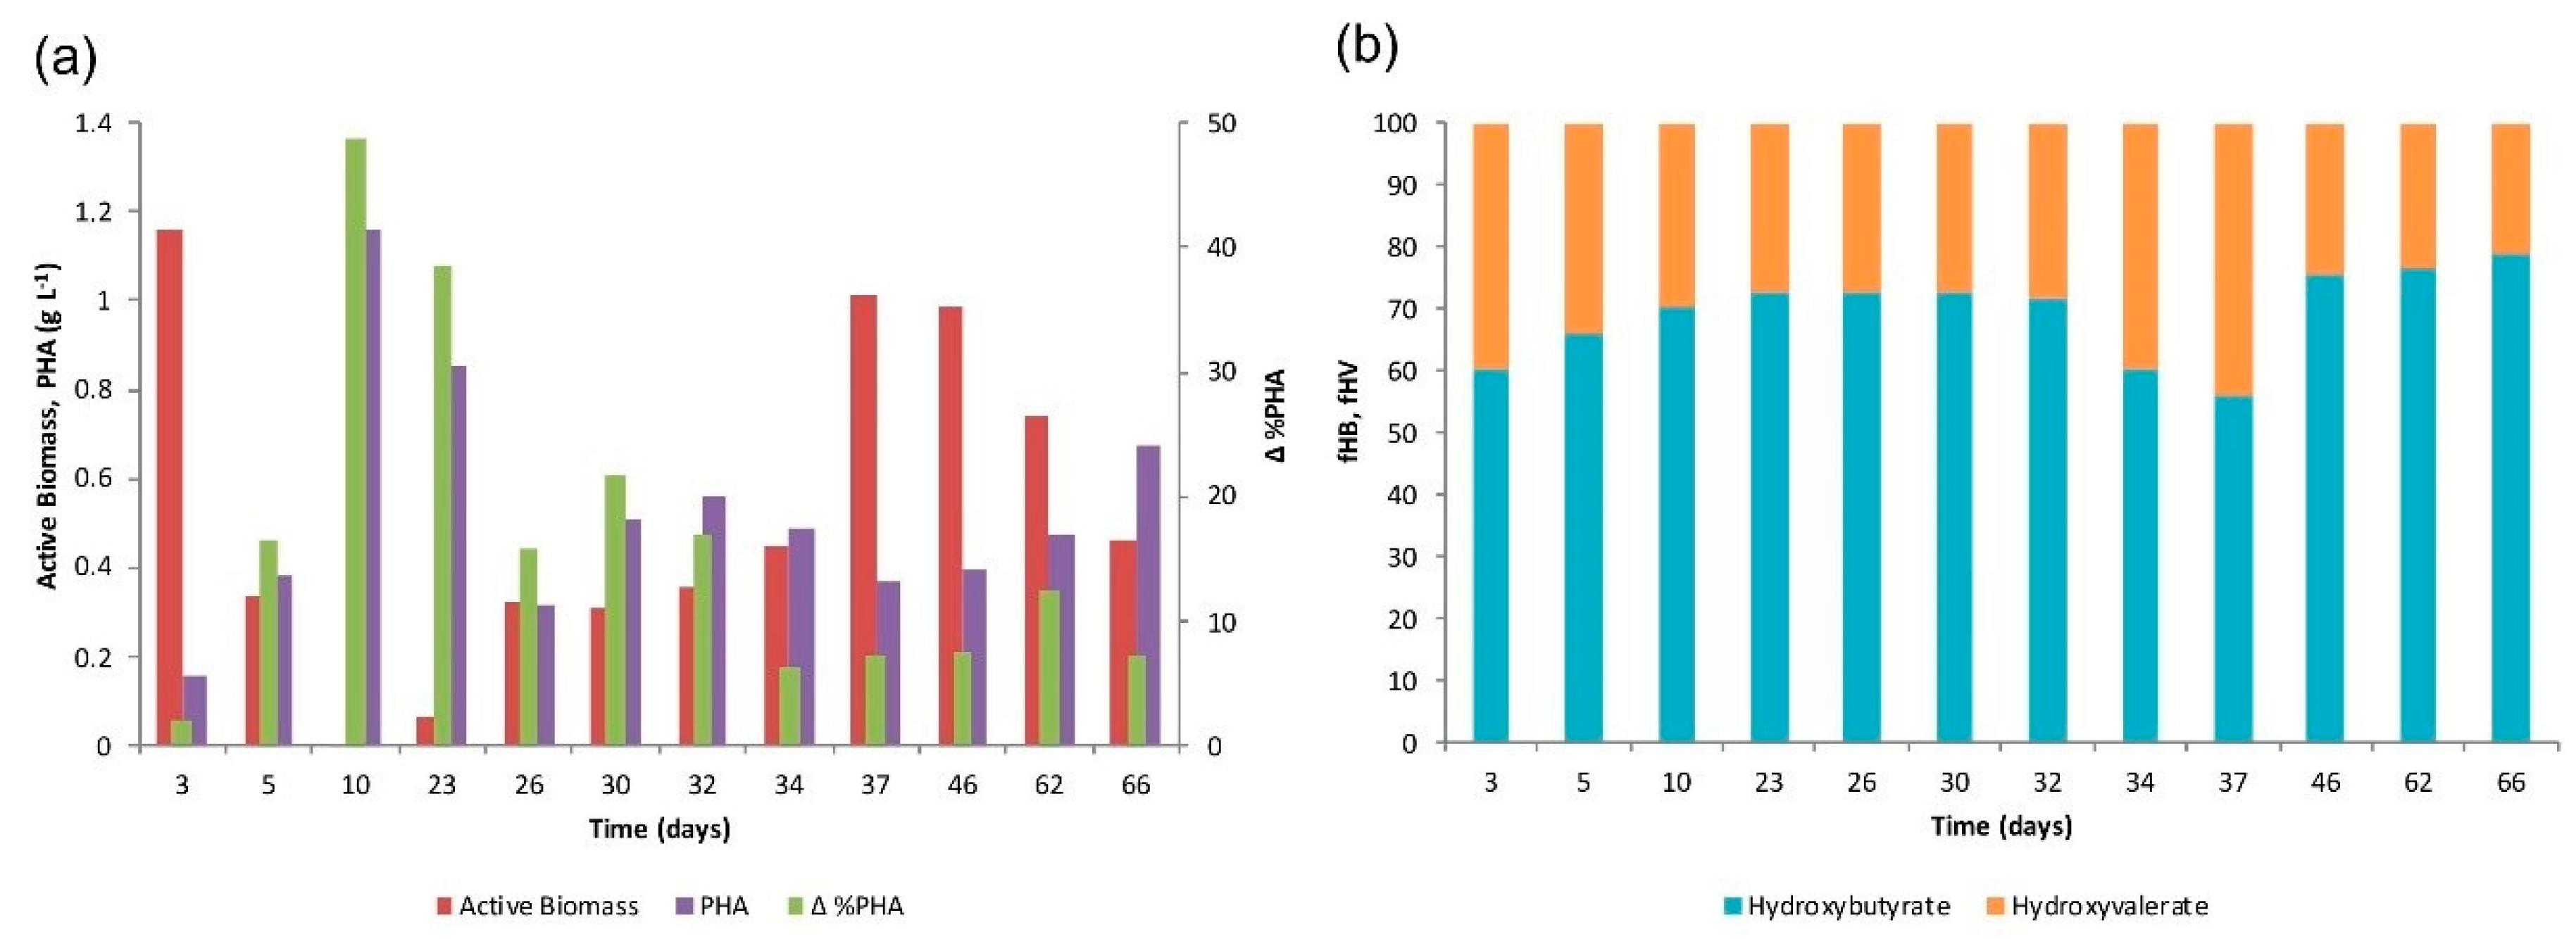
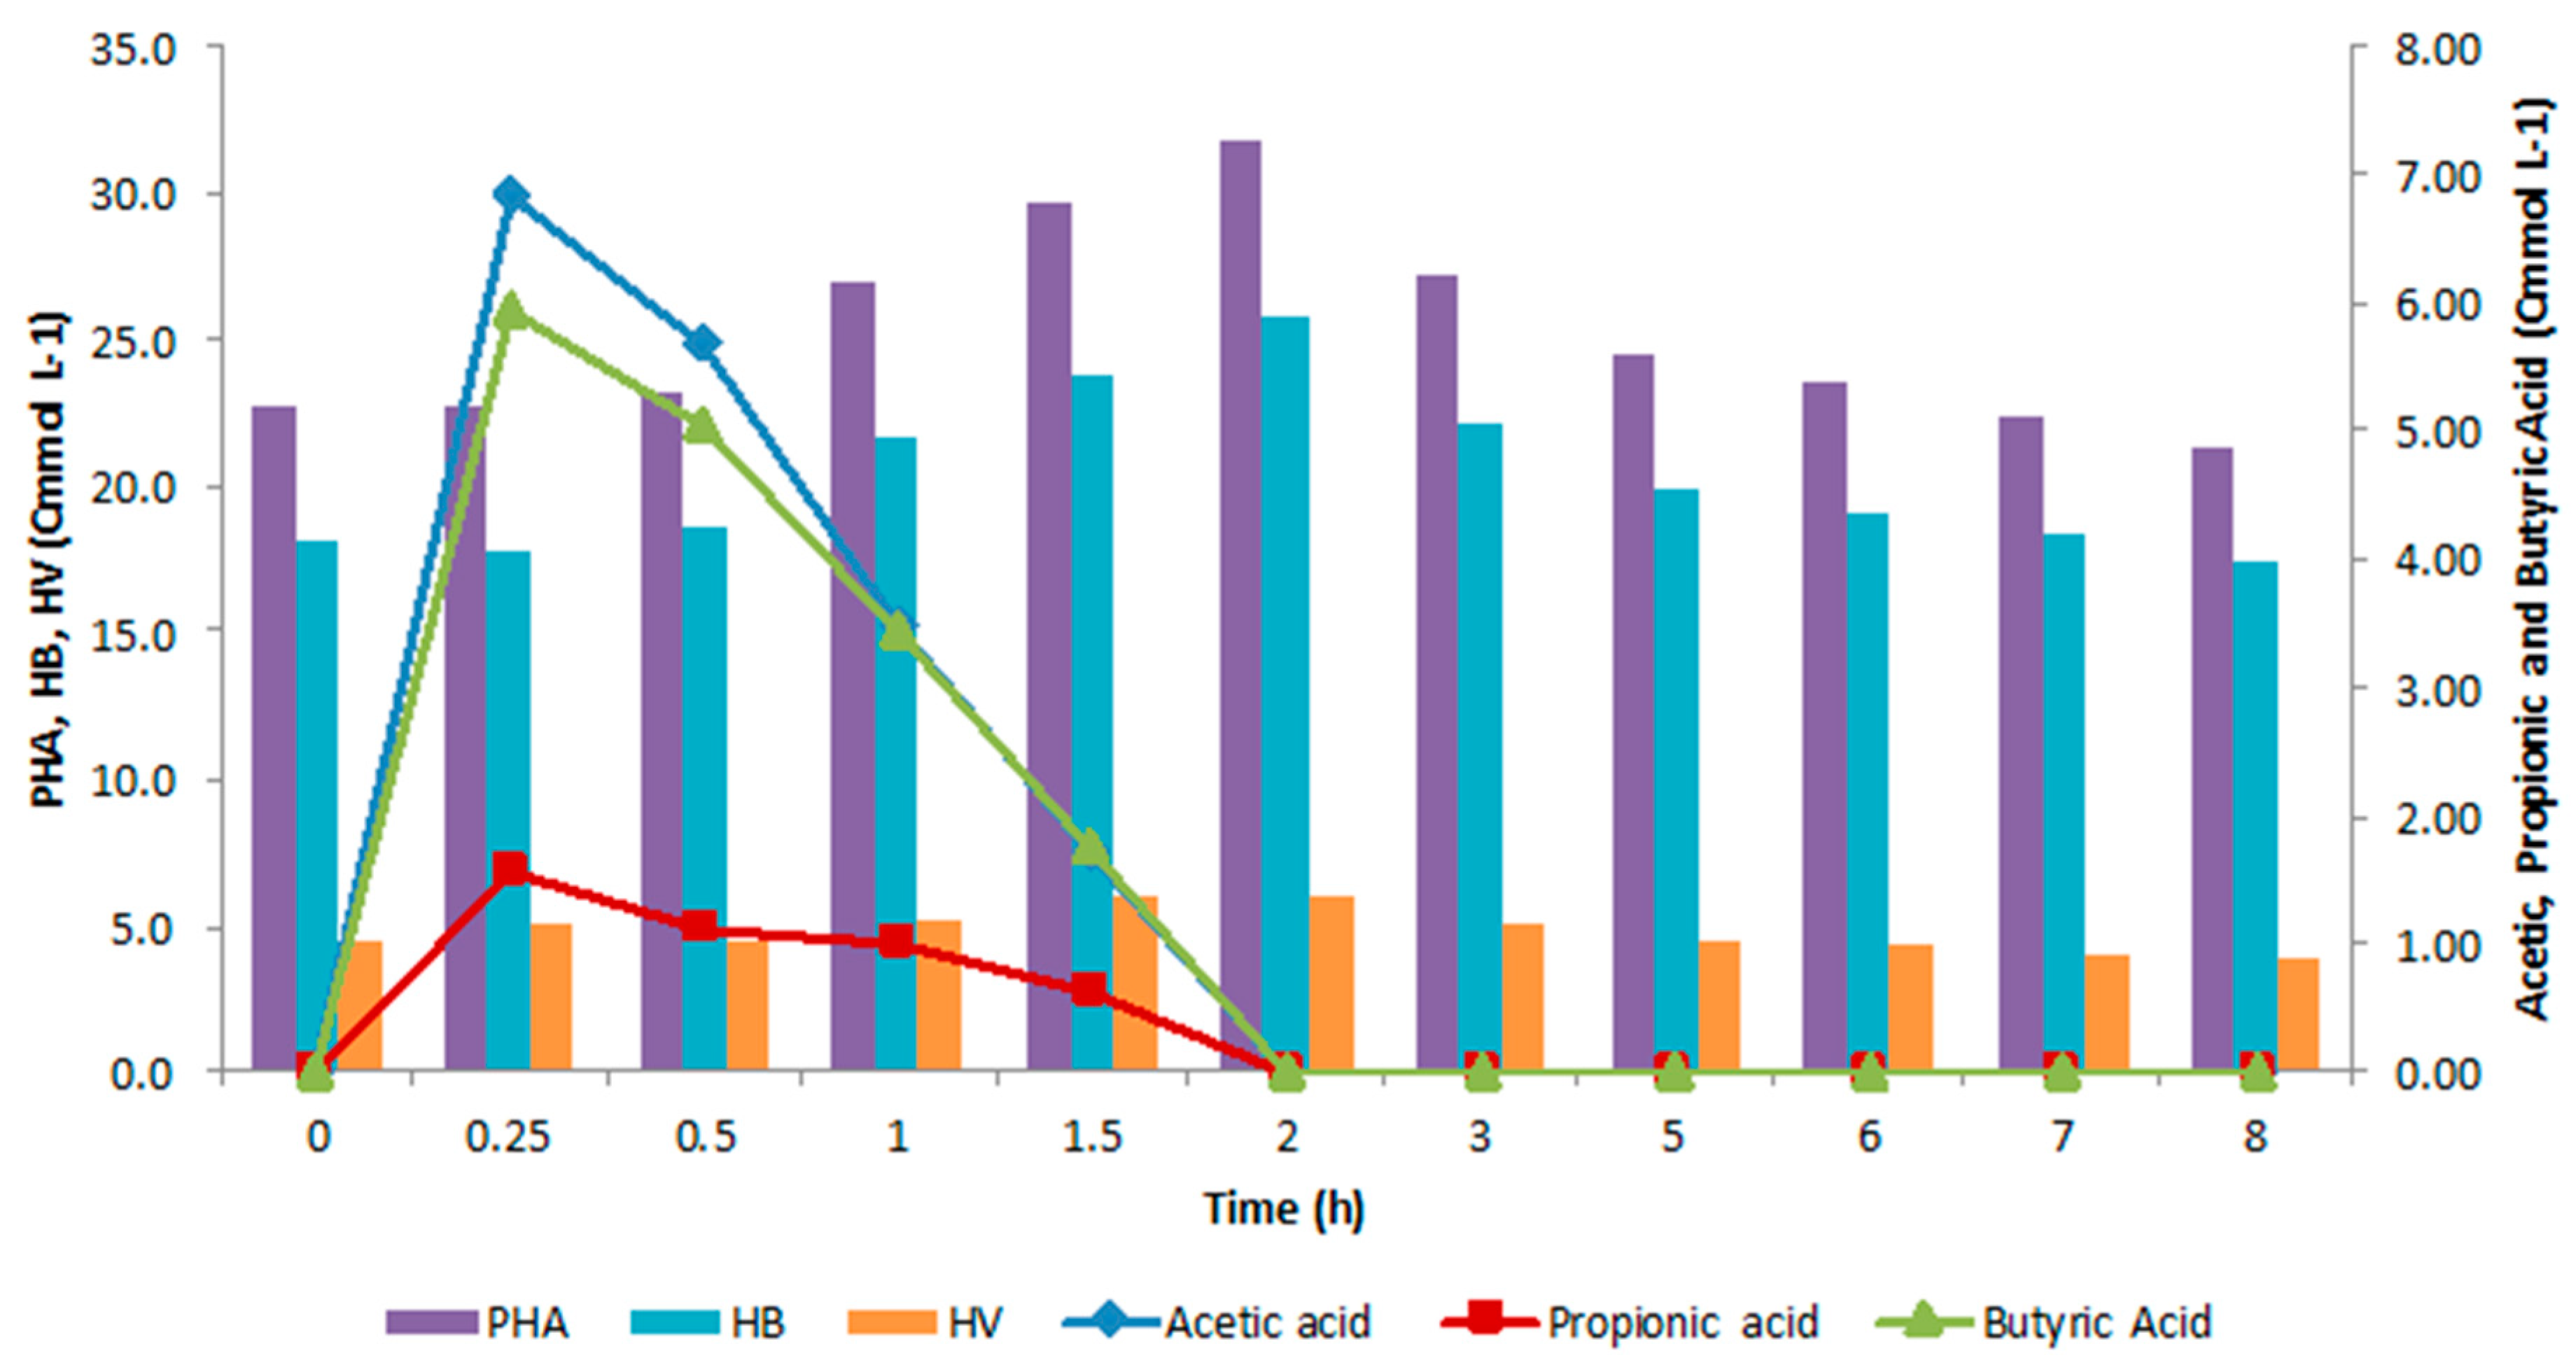
4.3. Accumulation Tests
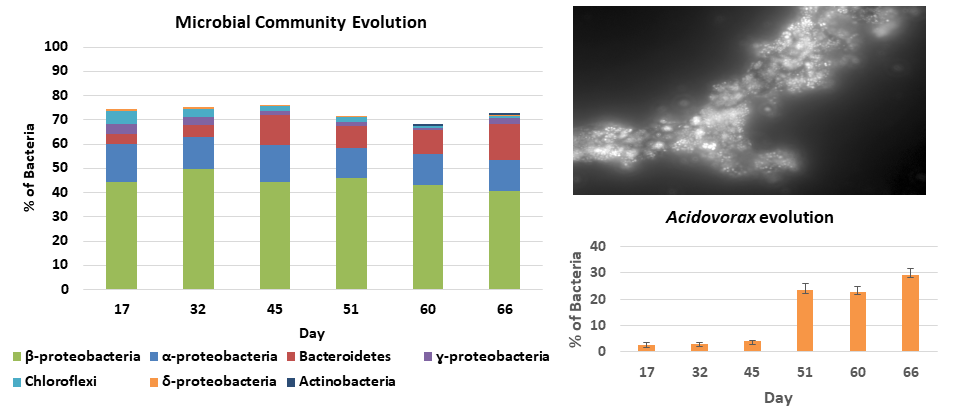
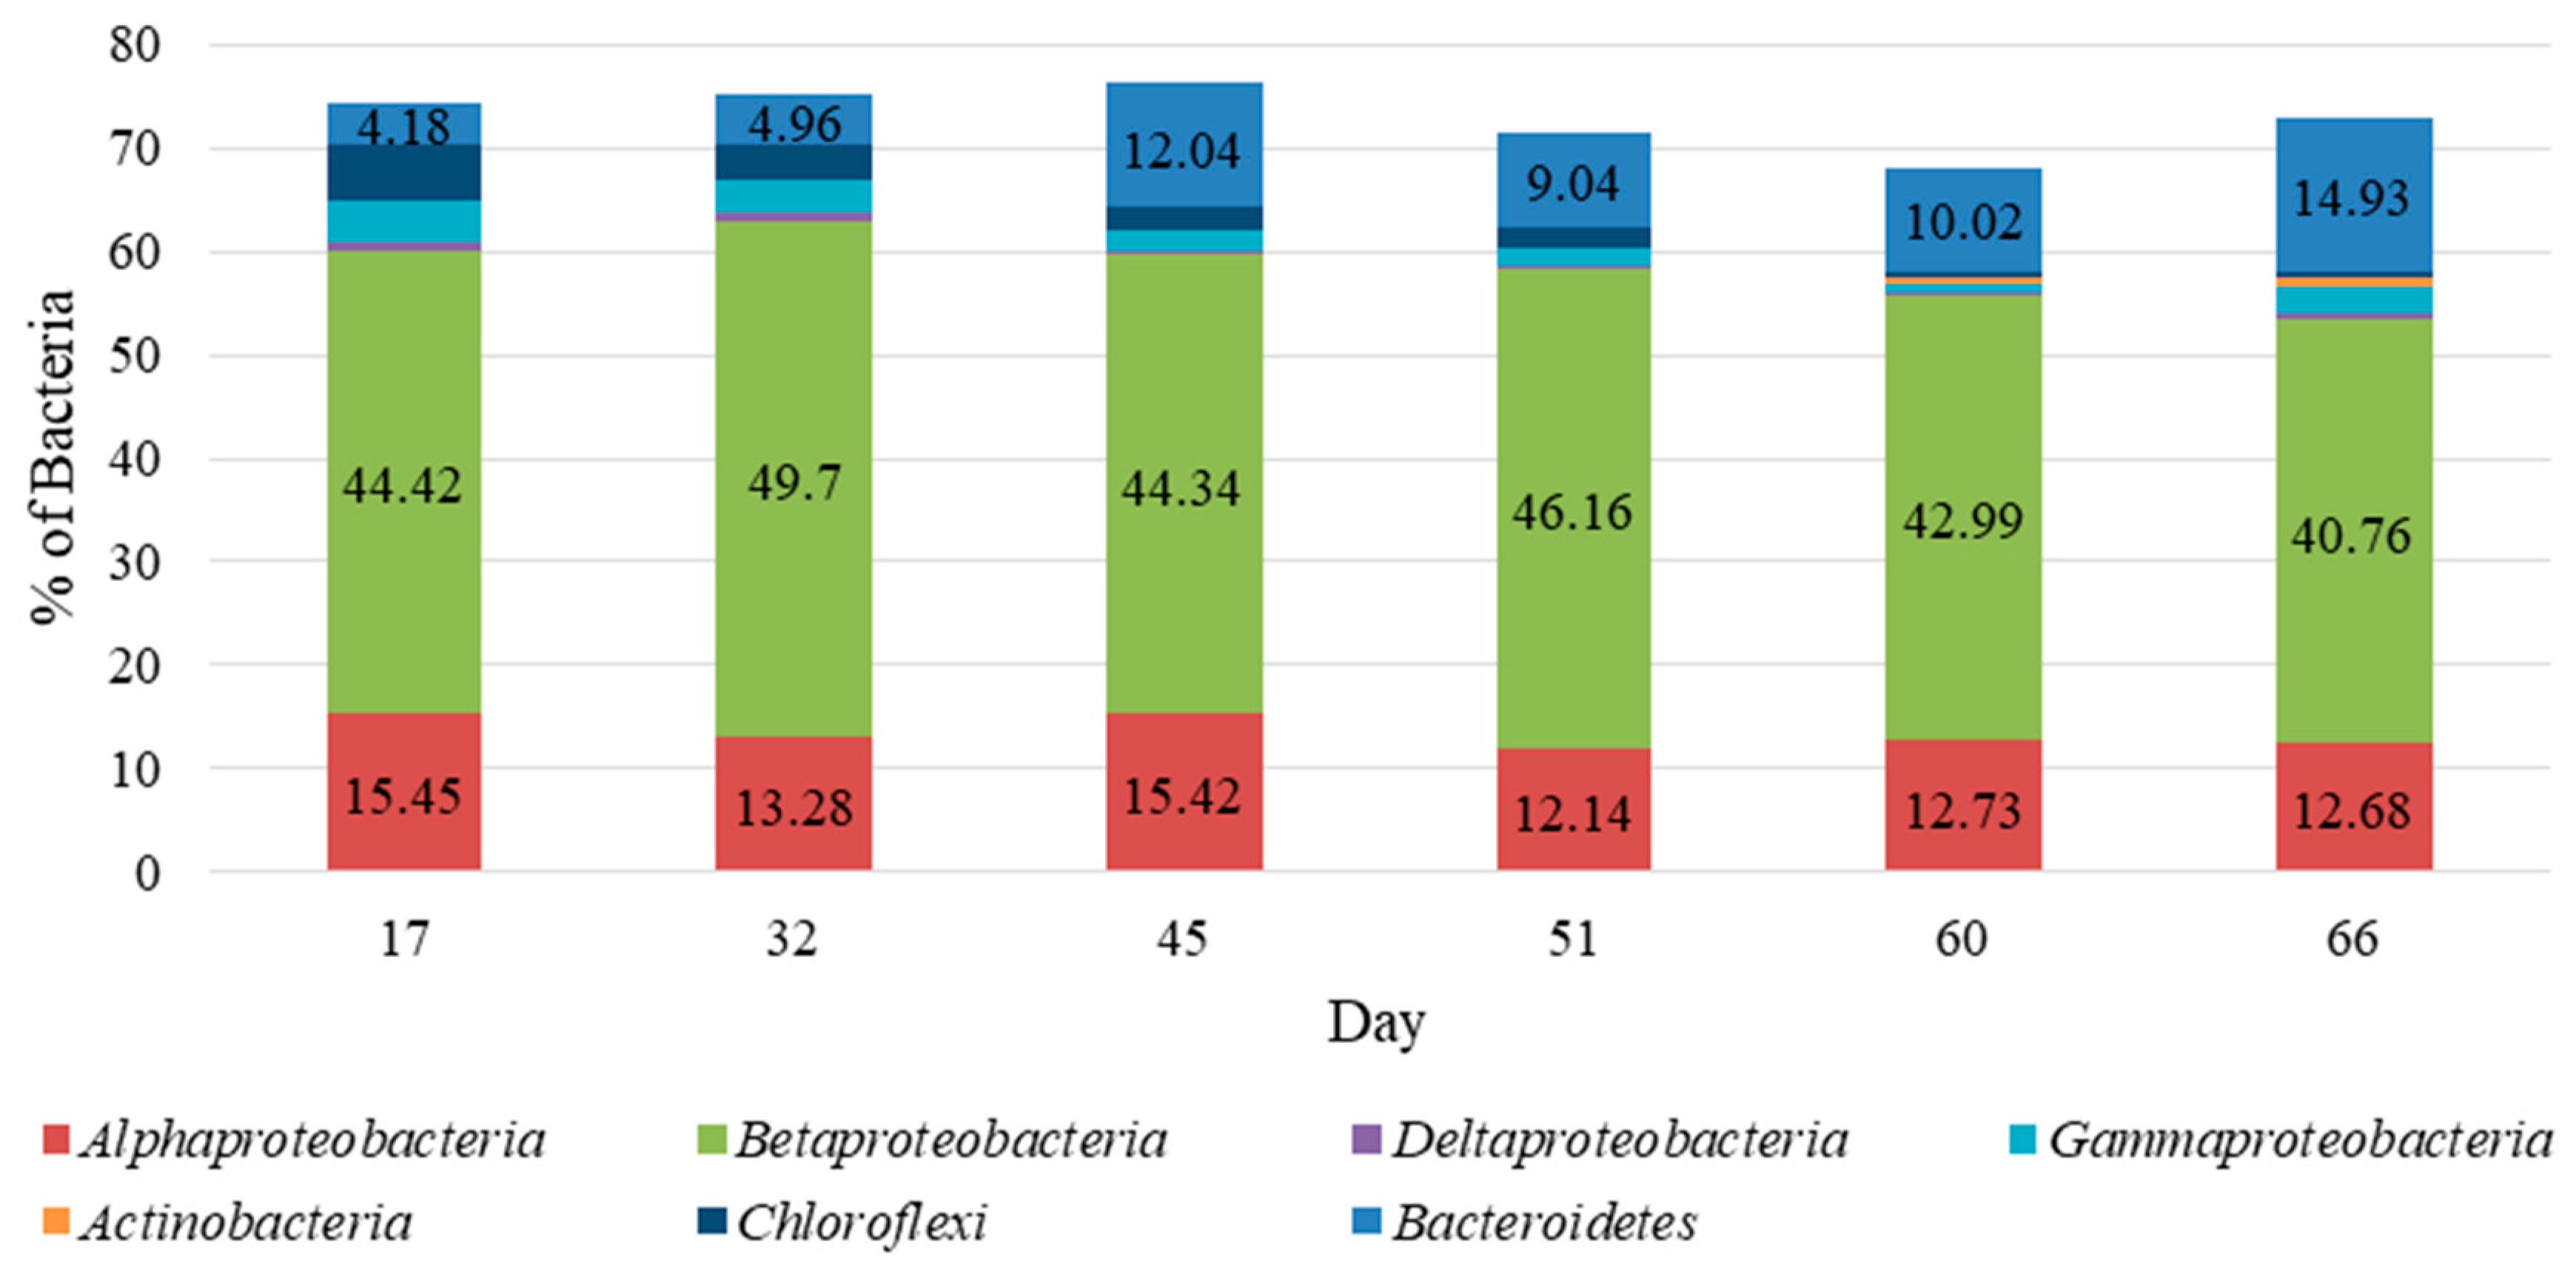
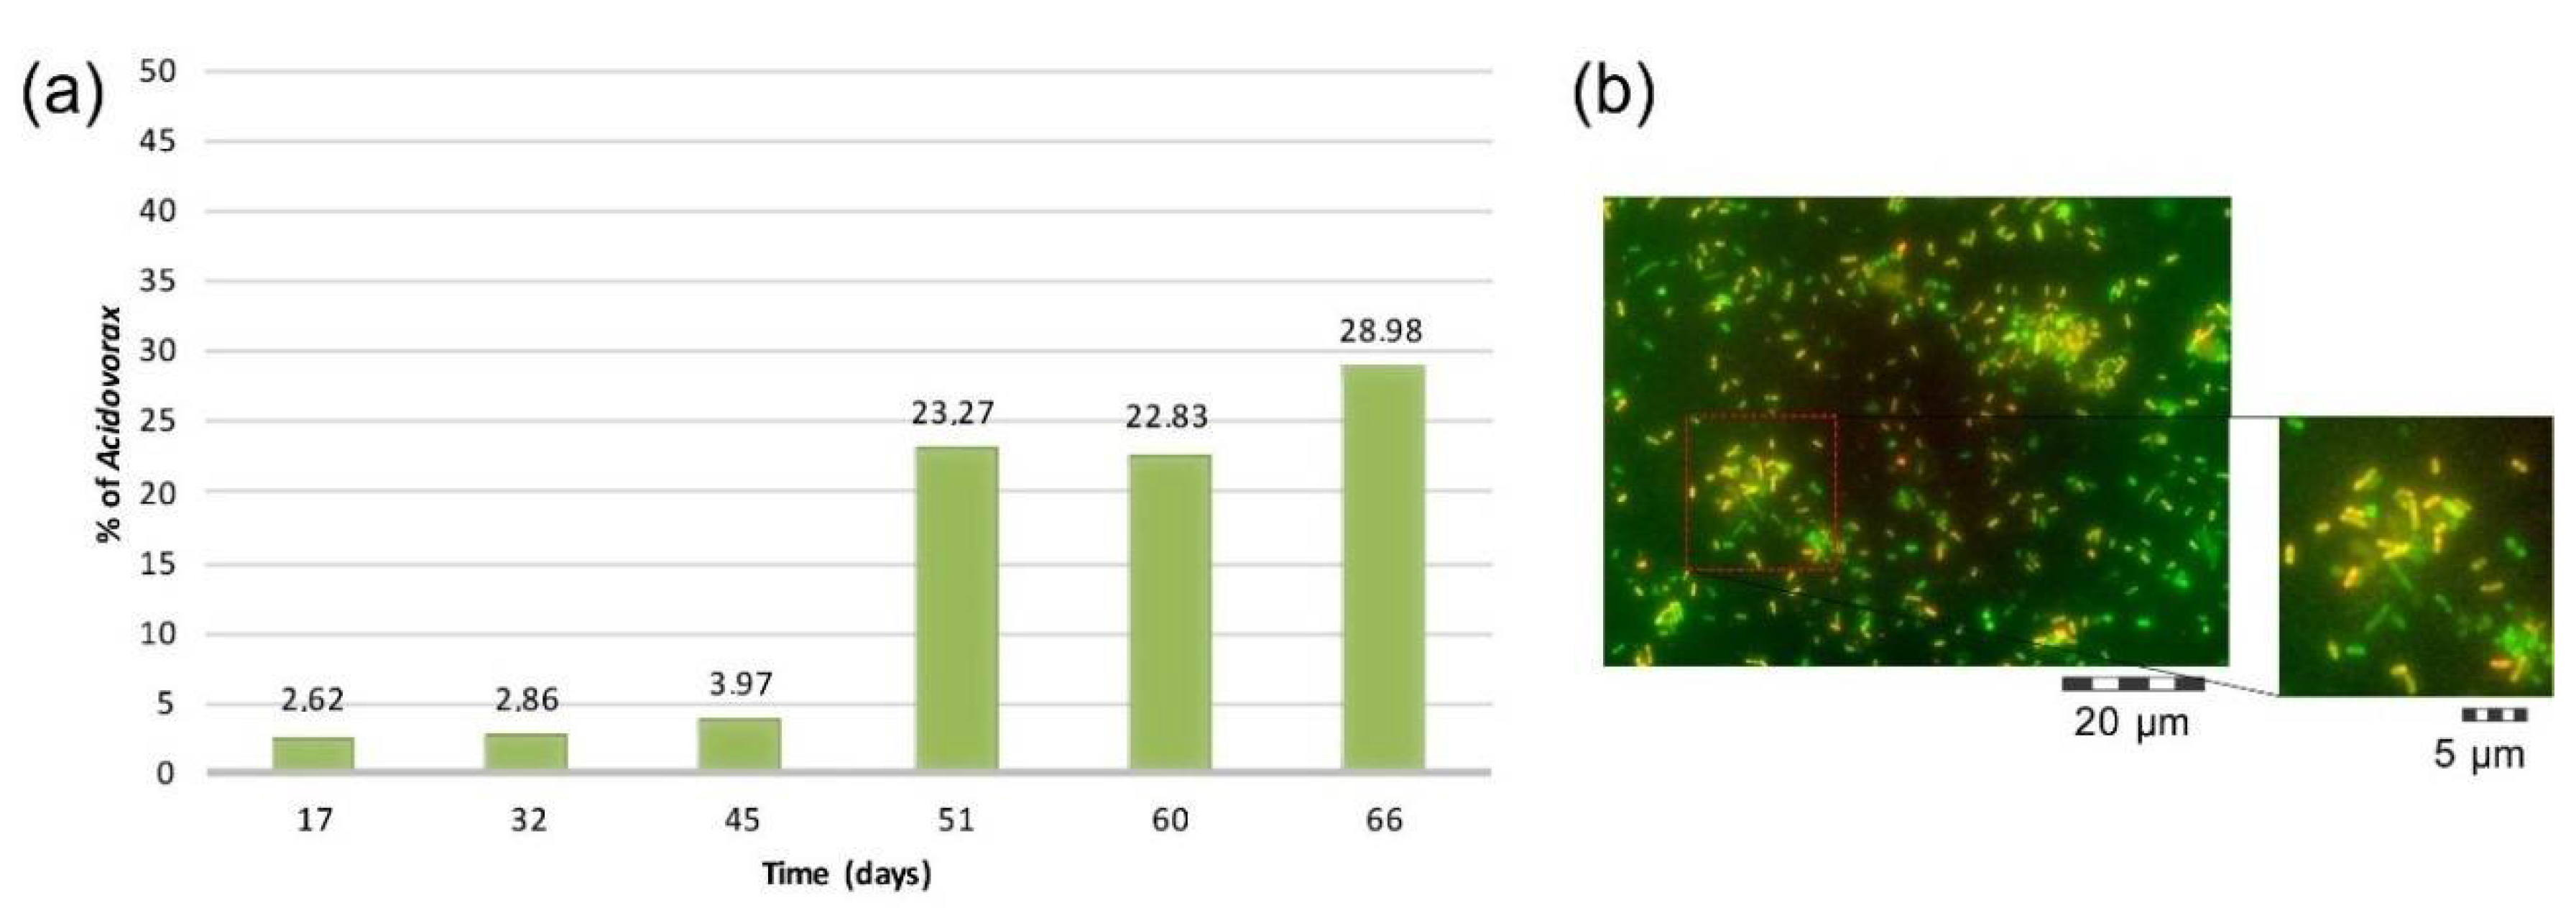
4.4. Microbial Community Characterization
5. Conclusions
Supplementary Materials
Author Contributions
Funding
Acknowledgments
Conflicts of Interest
References
- CEPI Preliminary Statistics of 2015—Paper and Board Production. Available online: http://www.cepi.org/taxonomy/term/26 (accessed on 21 July 2017).
- Fava, F.; Totaro, G.; Diels, L.; Reis, M.; Duarte, J.; Carioca, O.B.; Poggi-Varaldo, H.M.; Ferreira, B.S. Biowaste biorefinery in Europe: Opportunities and research & development needs. New. Biotechnol. 2015, 32, 100–108. [Google Scholar] [CrossRef]
- Koutinas, A.A.; Vlysidis, A.; Pleissner, D.; Kopsahelis, N.; Lopez Garcia, I.; Kookos, I.K.; Papanikolaou, S.; Kwan, T.H.; Lin, C.S.K. Valorization of industrial waste and by-product streams via fermentation for the production of chemicals and biopolymers. Chem. Soc. Rev. 2014, 43, 2587. [Google Scholar] [CrossRef] [PubMed]
- Norgren, M.; Edlund, H. Lignin: Recent advances and emerging applications. Curr. Opin. Colloid Interface Sci. 2014, 19, 409–416. [Google Scholar] [CrossRef]
- Alexandri, M.; Papapostolou, H.; Vlysidis, A.; Gardeli, C.; Komaitis, M.; Papanikolaou, S.; Koutinas, A.A. Extraction of phenolic compounds and succinic acid production from spent sulphite liquor. J. Chem. Technol. Biotechnol. 2016, 91, 2751–2760. [Google Scholar] [CrossRef]
- Queirós, D.; Sousa, R.; Pereira, S.; Serafim, L.S. Valorization of a Pulp Industry By-Product through the Production of Short-Chain Organic Acids. Fermentation 2017, 3, 20. [Google Scholar] [CrossRef]
- Pereira, S.R.; Ivanuša, Š.; Evtuguin, D.V.; Serafim, L.S.; Xavier, A.M.R.B. Biological treatment of eucalypt spent sulphite liquors: A way to boost the production of second generation bioethanol. Bioresour. Technol. 2012, 103, 131–135. [Google Scholar] [CrossRef] [PubMed]
- Queirós, D.; Rossetti, S.; Serafim, L.S. PHA production by mixed cultures: A way to valorize wastes from pulp industry. Bioresour. Technol. 2014, 157, 197–205. [Google Scholar] [CrossRef] [PubMed]
- Queirós, D.; Fonseca, A.; Lemos, P.C.; Serafim, L.S. Long-term operation of a two-stage polyhydroxyalkanoates production process from hardwood sulphite spent liquor. J. Chem. Technol. Biotechnol. 2016, 91, 2480–2487. [Google Scholar] [CrossRef]
- Serafim, L.S.; Lemos, P.C.; Albuquerque, M.G.E.; Reis, M.A.M. Strategies for PHA production by mixed cultures and renewable waste materials. Appl. Microbiol. Biotechnol. 2008, 81, 615–628. [Google Scholar] [CrossRef] [PubMed]
- Dionisi, D.; Majone, M.; Papa, V.; Beccari, M. Biodegradable polymers from organic acids by using activated sludge enriched by aerobic periodic feeding. Biotechnol. Bioeng. 2004, 85, 569–579. [Google Scholar] [CrossRef] [PubMed]
- Albuquerque, M.G.E.; Torres, C.A.V.; Reis, M.A.M. Polyhydroxyalkanoate (PHA) production by a mixed microbial culture using sugar molasses: Effect of the influent substrate concentration on culture selection. Water Res. 2010, 44, 3419–3433. [Google Scholar] [CrossRef] [PubMed]
- Jiang, Y.; Marang, L.; Tamis, J.; van Loosdrecht, M.C.M.; Dijkman, H.; Kleerebezem, R. Waste to resource: Converting paper mill wastewater to bioplastic. Water Res. 2012, 46, 5517–5530. [Google Scholar] [CrossRef] [PubMed]
- Moita, R.; Freches, A.; Lemos, P.C. Crude glycerol as feedstock for polyhydroxyalkanoates production by mixed microbial cultures. Water Res. 2014, 58, 9–20. [Google Scholar] [CrossRef] [PubMed]
- Queirós, D.; Lemos, P.C.; Rossetti, S.; Serafim, L.S. Unveiling PHA-storing populations using molecular methods. Appl. Microbiol. Biotechnol. 2015. [Google Scholar] [CrossRef] [PubMed]
- Dionisi, D.; Majone, M.; Vallini, G.; Di Gregorio, S.; Beccari, M. Effect of the applied organic load rate on biodegradable polymer production by mixed microbial cultures in a sequencing batch reactor. Biotechnol. Bioeng. 2005. [Google Scholar] [CrossRef] [PubMed]
- Reis, M.A.M.; Albuquerque, M.G.E.; Villano, M.; Majone, M. Mixed culture processes for polyhydroxyalkanoate production from agro-industrial surplus/wastes as feedstocks. In Renewable Polymers: Synthesis, Processing, and Technology; Wiley-Scrivener: Hoboken, NJ, USA, 2011; Volume 6, pp. 669–683. ISBN 978-0-08-088504-9. [Google Scholar]
- Johnson, K.; Jiang, Y.; Kleerebezem, R.; Muyzer, G.; Van Loosdrecht, M.C.M. Articles Enrichment of a Mixed Bacterial Culture with a High Polyhydroxyalkanoate Storage Capacity. Biomacromolecules 2009, 670–676. [Google Scholar] [CrossRef] [PubMed]
- Carta, F.; Beun, J.; Van Loosdrecht, M.; Heijnen, J. Simultaneous storage and degradation of PHB and glycogen in activated sludge cultures. Water Res. 2001, 35, 2693–2701. [Google Scholar] [CrossRef]
- Albuquerque, M.G.E.; Carvalho, G.; Kragelund, C.; Silva, A.F.; Barreto Crespo, M.T.; Reis, M.A.M.; Nielsen, P.H. Link between microbial composition and carbon substrate-uptake preferences in a PHA-storing community. ISME J. 2013, 7, 1–12. [Google Scholar] [CrossRef] [PubMed]
- Carvalho, G.; Oehmen, A.; Albuquerque, M.G.E.; Reis, M.A.M. The relationship between mixed microbial culture composition and PHA production performance from fermented molasses. New. Biotechnol. 2014, 31, 257–263. [Google Scholar] [CrossRef] [PubMed]
- Clesceri, L.; Eaton, A.D.; Greenberg, A.E. Standard Methods for the Examination of Water and Wastewater, 20th ed.; Association, A.P.H., Association, A.W.W., Federation, W.E., Eds.; American Public Health Association: Washington, DC, USA, 1998. [Google Scholar]
- Lemos, P.C.; Serafim, L.S.; Reis, M.A.M. Synthesis of polyhydroxyalkanoates from different short-chain fatty acids by mixed cultures submitted to aerobic dynamic feeding. J. Biotechnol. 2006, 122, 226–238. [Google Scholar] [CrossRef] [PubMed]
- Restolho, J.A.; Prates, A.; de Pinho, M.N.; Afonso, M.D. Sugars and lignosulphonates recovery from eucalyptus spent sulphite liquor by membrane processes. Biomass Bioenergy 2009, 33, 1558–1566. [Google Scholar] [CrossRef]
- Xavier, A.M.R.B.; Correia, M.F.; Pereira, S.R.; Evtuguin, D.V. Second-generation bioethanol from eucalypt sulphite spent liquor. Bioresour. Technol. 2009, 101, 2755–2761. [Google Scholar] [CrossRef] [PubMed]
- Amann, R.I.; Ludwig, W.; Schleifer, K.H. Phylogenetic identification and in situ detection of individual microbial cells without cultivation. Microbiol. Rev. 1995, 59, 143–169. [Google Scholar] [PubMed]
- Ostle, A.; Holt, J. Fluorescent Stain for Poly-3-Hydroxybutyrate. Appl. Environ. Microbiol. 1982, 44, 238–241. [Google Scholar] [PubMed]
- Albuquerque, M.G.E.; Martino, V.; Pollet, E.; Averous, L.; Reis, M.A.M. Mixed culture polyhydroxyalkanoate (PHA) production from volatile fatty acid (VFA)-rich streams: Effect of substrate composition and feeding regime on PHA productivity, composition and properties. J. Biotechnol. 2011, 151, 66–76. [Google Scholar] [CrossRef] [PubMed]
- Valentino, F.; Morgan-Sagastume, F.; Fraraccio, S.; Corsi, G.; Zanaroli, G.; Werker, A.; Majone, M. Sludge minimization in municipal wastewater treatment by polyhydroxyalkanoate (PHA) production. Environ. Sci. Pollut. Res. 2015, 22, 7281–7294. [Google Scholar] [CrossRef] [PubMed]
- Marang, L.; Jiang, Y.; van Loosdrecht, M.C.M.; Kleerebezem, R. Impact of non-storing biomass on PHA production: An enrichment culture on acetate and methanol. Int. J. Biol. Macromol. 2014, 71, 74–80. [Google Scholar] [CrossRef] [PubMed]
- Dionisi, D.; Majone, M.; Vallini, G.; Gregorio, S.D.; Beccari, M. Effect of the Length of the Cycle on Biodegradable Polymer Production and Microbial Community Selection in a Sequencing Batch Reactor. Biotechnol. Programs 2007, 1064–1073. [Google Scholar] [CrossRef] [PubMed]
- Laycock, B.; Halley, P.; Pratt, S.; Werker, A.; Lant, P. The chemomechanical properties of microbial polyhydroxyalkanoates. Prog. Polym. Sci. 2013, 38, 536–583. [Google Scholar] [CrossRef]
- Philip, S.; Keshavarz, T.; Roy, I. Polyhydroxyalkanoates: Biodegradable polymers with a range of applications. J. Chem. Technol. Biotechnol. 2007, 82, 233–247. [Google Scholar] [CrossRef]
- Tan, G.Y.A.; Chen, C.L.; Li, L.; Ge, L.; Wang, L.; Razaad, I.M.N.; Li, Y.; Zhao, L.; Mo, Y.; Wang, J.Y. Start a research on biopolymer polyhydroxyalkanoate (PHA): A review. Polymers 2014, 6, 706–754. [Google Scholar] [CrossRef]
- Chua, A.; Takabatake, H.; Satoh, H.; Mino, T. Production of polyhydroxyalkanoates (PHA) by activated sludge treating municipal wastewater: Effect of pH, sludge retention time (SRT), and acetate concentration in influent. Water Res. 2003, 37, 3602–3611. [Google Scholar] [CrossRef]
- Serafim, L.; Lemos, P.; Oliveira, R.; Reis, M. Optimization of polyhydroxybutyrate production by mixed cultures submitted to aerobic dynamic feeding conditions. Biotechnol. Bioeng. 2004. [Google Scholar] [CrossRef] [PubMed]
- Oehmen, A.; Pinto, F.V.; Silva, V.; Albuquerque, M.G.E.; Reis, M.A.M. The impact of pH control on the volumetric productivity of mixed culture PHA production from fermented molasses. Eng. Life Sci. 2013, 14, 143–152. [Google Scholar] [CrossRef]
- Cavaillé, L.; Grousseau, E.; Pocquet, M.; Lepeuple, A.; Uribelarrea, J.-L.; Hernandez-Raquet, G.; Paul, E. Polyhydroxybutyrate production by direct use of waste activated sludge in phosphorus-limited fed-batch culture. Bioresour. Technol. 2013, 149, 301–309. [Google Scholar] [CrossRef] [PubMed]
- Albuquerque, M.G.E.; Eiroa, M.; Torres, C.; Nunes, B.R.; Reis, M.A.M. Strategies for the development of a side stream process for polyhydroxyalkanoate (PHA) production from sugar cane molasses. J. Biotechnol. 2007, 130, 411–421. [Google Scholar] [CrossRef] [PubMed]
- Bengtsson, S.; Werker, A.; Christensson, M.; Welander, T. Production of polyhydroxyalkanoates by activated sludge treating a paper mill wastewater. Bioresour Technol. 2008, 99, 509–516. [Google Scholar] [CrossRef] [PubMed]
- Dionisi, D.; Carucci, G.; Papini, M.P.; Riccardi, C.; Majone, M.; Carrasco, F. Olive oil mill effluents as a feedstock for production of biodegradable polymers. Water Res. 2005, 39, 2076–2084. [Google Scholar] [CrossRef] [PubMed]
- Ferreira, A.M.; Queirós, D.; Gagliano, M.C.; Serafim, L.S.; Rossetti, S. Polyhydroxyalkanoates-accumulating bacteria isolated from activated sludge acclimatized to hardwood sulphite spent liquor. Ann. Microbiol. 2016, 66, 833–842. [Google Scholar] [CrossRef]
- Schulze, R.; Spring, S.; Amann, R.; Huber, I.; Ludwig, W.; Schleifer, K.H.; Kämpfer, P. Genotypic diversity of Acidovorax strains isolated from activated sludge and description of Acidovorax defluvii sp. nov. Syst. Appl. Microbiol. 1999, 22, 205–214. [Google Scholar] [CrossRef]
- Lee, W.H.; Azizan, M.N.M.; Sudesh, K. Effects of culture conditions on the composition of poly(3-hydroxybutyrate-co-4-hydroxybutyrate) synthesized by Comamonas acidovorans. Polym. Degrad. Stab. 2004, 84, 129–134. [Google Scholar] [CrossRef]
- Chanprateep, S.; Abe, N.; Shimizu, H.; Yamane, T.; Shioya, S. Multivariable control of alcohol concentrations in the production of polyhydroxyalkanoates (PHAs) by Paracoccus denitrificans. Biotechnol. Bioeng. 2001, 74, 116–124. [Google Scholar] [CrossRef] [PubMed]
- Doi, Y.; Segawa, A.; Kunioka, M. Biosynthesis and characterization of poly(3-hydroxybutyrate-co-4-hydroxybutyrate) in Alcaligenes eutrophus. Int. J. Biol. Macromol. 1990, 12, 106–111. [Google Scholar] [CrossRef]
- Yu, P.H.; Chua, H.; Huang, A.-L.; Ho, K.-P. Conversion of Industrial Food Wastes by Alcaligenes latus into Polyhydroxyalkanoates. Appl. Biochem. Biotechnol. 1999, 78, 445–454. [Google Scholar] [CrossRef]


© 2018 by the authors. Licensee MDPI, Basel, Switzerland. This article is an open access article distributed under the terms and conditions of the Creative Commons Attribution (CC BY) license (http://creativecommons.org/licenses/by/4.0/).
Share and Cite
Queirós, D.; Rangel, C.; Costa Lemos, P.; Rossetti, S.; Seuanes Serafim, L. Impact of Organic Acids Supplementation to Hardwood Spent Sulfite Liquor as Substrate for the Selection of Polyhydroxyalkanoates-Producing Organisms. Fermentation 2018, 4, 58. https://doi.org/10.3390/fermentation4030058
Queirós D, Rangel C, Costa Lemos P, Rossetti S, Seuanes Serafim L. Impact of Organic Acids Supplementation to Hardwood Spent Sulfite Liquor as Substrate for the Selection of Polyhydroxyalkanoates-Producing Organisms. Fermentation. 2018; 4(3):58. https://doi.org/10.3390/fermentation4030058
Chicago/Turabian StyleQueirós, Diogo, Catarina Rangel, Paulo Costa Lemos, Simona Rossetti, and Luísa Seuanes Serafim. 2018. "Impact of Organic Acids Supplementation to Hardwood Spent Sulfite Liquor as Substrate for the Selection of Polyhydroxyalkanoates-Producing Organisms" Fermentation 4, no. 3: 58. https://doi.org/10.3390/fermentation4030058