Article

Yeast Diversity and Physicochemical Characteristics Associated with Coffee Bean Fermentation from the Brazilian Cerrado Mineiro Region

by
Dão Pedro De Carvalho Neto
1,
Gilberto Vinícius De Melo Pereira
1,
Valcineide O. A. Tanobe
1,
Vanete Thomaz Soccol
1,
Bruno José G. da Silva
2,
Cristine Rodrigues
1 and
Carlos Ricardo Soccol
1,*
1
Bioprocess Engineering and Biotechnology Department, Federal University of Paraná (UFPR), 81531-970 Curitiba-PR, Brazil
2
Chemistry Department, Federal University of Paraná (UFPR), 81531-970 Curitiba-PR, Brazil
*
Author to whom correspondence should be addressed.
Fermentation 2017, 3(1), 11; https://doi.org/10.3390/fermentation3010011
Submission received: 20 January 2017 / Revised: 3 March 2017 / Accepted: 12 March 2017 / Published: 16 March 2017
(This article belongs to the Special Issue Microbiology and Food Hygiene)

Abstract

:
The aim of this study was to evaluate the yeast diversity and physicochemical characteristics of spontaneous coffee bean fermentation conducted in the coffee-producing region in Cerrado Mineiro, Brazil. During 48 h of fermentation, yeast population increased from 6.60 to 7.89 log CFU·g−1, with concomitant pulp sugar consumption and organic acids production (mainly lactic (3.35 g·L−1) and acetic (1.27 g·L−1) acids). According to ITS-rRNA gene sequencing, yeast population was mainly represented by Saccharomyces sp., followed by Torulaspora delbrueckii, Pichia kluyveri, Hanseniaspora uvarum, H. vineae and Meyerozyma caribbica. SPME-GC-MS analysis revealed a total of 25 volatile organic compounds with predominance of hydrocarbons (9 compounds) and higher alcohols (6 compounds). The resulting fermented, roasted coffee beans were analyzed by diverse chemical analysis methods, including Fourier Transform Infrared (FTIR) spectroscopy and mineral and thermogravimetric analysis. The thermal decomposition of the coffee beans occurred in four stages between 90 and 390 °C, with significant mass loss (68%) after the second stage at 190 °C. FTIR spectroscopy confirmed the presence of the main organic functions associated with coffee aroma, such as aromatic acids, ketones, aldehydes and aliphatic esters. The results presented in this study enrich our knowledge concerning yeast diversity and physicochemical characteristics associated with coffee bean fermentation, and can be used to promote a controlled on-farm processing.

Graphical Abstract

1. Introduction

Coffea is a genus of flowering plants whose seeds are used to make coffee beverage. Although there are many steps in the manufacturing of coffee beverage, microbial fermentation plays an important role with great impacts on product quality and value [1,2,3,4,5]. Coffee fermentation consists of an on-farm process, occurring in the so-called wet processing, during which microorganisms grow in the pulp material that surrounds the seeds of the coffee fruit [6]. In this processing method, the pulp (the exocarp and a part of the mesocarp) is removed mechanically. Subsequently, the beans are submitted to 24–48 h of underwater tank fermentation to allow the microbial degradation of the remaining mesocarp layer (called mucilage) adhering to the parchment. In addition, the microbiota responsible for the fermentation (e.g., yeasts and lactic acid bacteria) may also contribute to the beverage’s sensory characteristics and other qualities due to the excretion of metabolites produced during this process [6]. The main chemical changes that occur during coffee fermentation are pectin degradation and microbial production of organic acids, ethanol, esters and other metabolites from the carbohydrates [1,7,8].
Yeasts are among the most frequently isolated microorganisms from fermenting coffee beans. They are considered to be important to the fermentation performance and coffee flavor development. Consequently, yeast is the microbial group most widely studied in coffee fermentations, which metabolic function has been elucidated in recent studies [1,2]. The most frequently occurring yeast species during coffee processing are Pichia kluyveri, Pichia anomala, Hanseniaspora uvarum, Saccharomyces cerevisiae, Debaryomyces hansenii and Torulaspora delbrueckii [9,10,11].
Recent studies published by our research group have reported the yeast and bacteria diversity associated with coffee bean fermentation in Brazil [1,4,5,6]. Pichia fermentans (YC5.2), Saccharomyces sp. (YC9.15) and Lactobacillus plantarum (LPBR01) were studied as having a potential for use as starter cultures for coffee wet fermentation [4,5]. However, studies still are needed to improve the knowledge of the microbiota present in coffee processing due to the variation in climate and altitude [3]. Cerrado Mineiro is one of the largest coffee-producing regions in Brazil, located at Alto Paranaíba, Mineiro Triangle and Northwest Minas Gerais state. This region presents a uniform edaphoclimatic pattern with an average temperature of 23 °C and flat relief situated at 800–1300 m, which enables the production of high-quality coffees [12]. To the best of our knowledge, there is no study on the yeast diversity and physicochemical characteristics associated with coffee bean fermentation performed in this coffee-producing region. In this regard, the aim of this study was to study the yeast diversity and physicochemical characteristics associated with coffee bean fermentation during on-farm wet processing in the Cerrado Mineiro region.

2. Materials and Methods

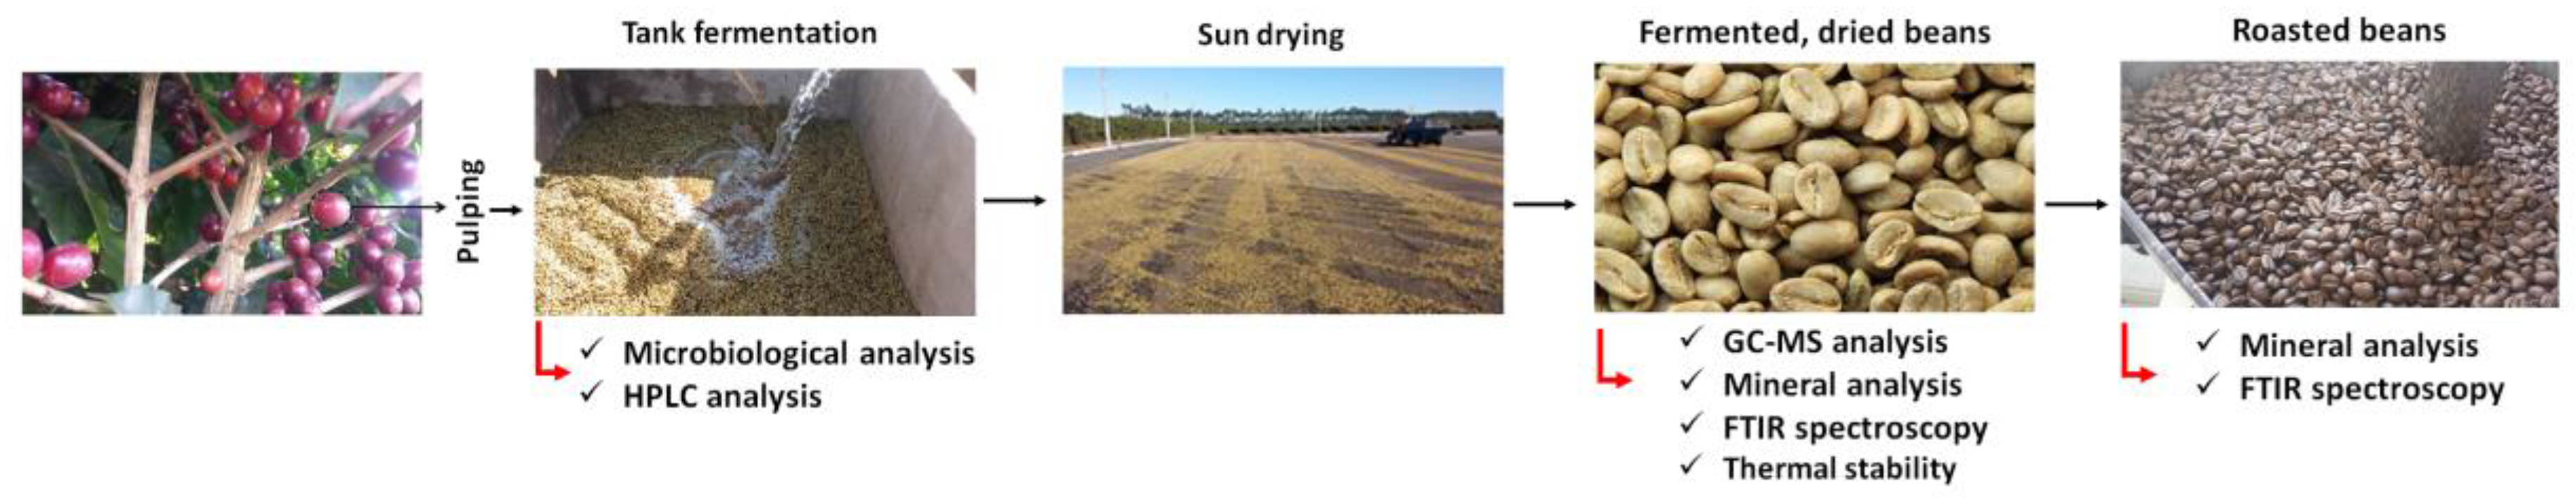
2.1. Spontaneous Coffee Bean Fermentation and Sampling

Coffee cherries (Coffea arabica) were manually harvested at the mature stage from the Fazenda Shalon localized in the Cerrado Mineiro region (Patrocínio, Minas Gerais State, Brazil). Figure 1 shows the experimental setup and analytical procedures of each step conducted in this study. The fruits were mechanically depulped and approximately 75 kg of depulped beans were conveyed in a clear water stream to tanks and left to ferment for 48 h in accordance with local wet processing method [4,5]. Every 12 h, liquid fraction samples were withdrawn from the middle depth of the tank fermentation and transferred to the laboratory in ice boxes for microbiological and chemical analyses.

2.2. Yeast Isolation

Ten milliliters of each sample was added to 90 mL sterile saline-peptone water, followed by serial dilutions. Yeasts were enumerated by surface inoculation on Yeast extract peptone glucose (YEPG) agar containing 100 mg·L−1 chloramphenicol to inhibit bacterial growth. Plating was performed with 100 μL of each dilution and cultures were incubated at 30 °C for 5 days [1]. According to the macroscopic observations, colonies of different types on YEPG medium were counted separately, and representatives isolated from different fermentation times were purified by repetitive streaking. The purified isolates were stored at −80 °C in YEPG broth containing 20% (v/v).

2.3. Identification of Yeast Isolates

Yeast cultures were grown under appropriate conditions, collected from agar plates with a sterile pipette tip and resuspended in 50 µL of ultra-pure water. The suspension was heated for 15 min at 95 °C, and 1 µL of this suspension was used as a DNA template in PCR experiments. The 5.8S ITS rRNA gene region of yeast isolates was amplified using the primers ITS1 and ITS4. The 55 µL volume reaction consisted of 5.5 µL of 10× PCR buffer (Invitrogen, Carlsbad, CA, USA), 2 µL of MgCl2 (50 mM), 1.21 µL of dNTP Mix (10 mM), 4 µL of the combined forward and reverse primers (ITS1 and ITS4), 0.4 µL of 5 U·µL−1 Platinum® Taq DNA polymerase (Invitrogen, Waltham, MA, USA). The 5.8S ITS rRNA gene region was sequenced using an ABI3730 XL automatic DNA sequencer. The sequences obtained were compared with sequences available in the GenBank database through a basic local alignment search tool (BLAST).

2.4. High Performance Liquid Chromatography (HPLC) Analysis of Fermenting Coffee Beans Samples

The concentration of the reducing sugars (glucose and fructose) and organic acids (acetic, citric, succinic, lactic, propionic and butyric acids) of fermenting coffee-pulp bean mass was monitored during the course of fermentation. Samples of each time were centrifuged at 6000 g and filtered through 0.22-µm pore size filter (Sartorius Stedim, Goettingen, Germany). The samples were analyzed through a HPLC apparatus (Aglient Technologies 1260 Infinity Series; Aglient Technologies, Santa Clara, CA, USA) equipped with a Hi-Plex H column (300 mm × 7.7 mm; Aglient Technologies, Santa Clara, CA, USA) connected to a refractive index (RI) detector (Aglient Technologies, Santa Clara, CA, USA). The column was eluated with a mobile phase containing 5 mM H2SO4 at 60 °C and a flow rate of 0.6 mL·min−1.

2.5. Physicochemical Characterization of Fermented and Roasted Coffee Beans

2.5.1. Volatile Organic Compounds Determination by Gas Chromatography Coupled to Mass Spectrophotometry (GC-MS)

The resulting parchment coffee was sun dried until a water content of 12% (wet basis) was achieved. The extraction of volatile compounds from the fermented, dried coffee samples (Figure 1) was performed using a headspace vial coupled to an Solid phase microextraction (SPME) fiber (5% Carboxen [CARB]/95% Polydimethylsiloxane [PDMS] df75 μm partially crosslinked, Supelco, St. Louis, MI, USA). For each determination, 1 g of sample was stored in a 20 mL HS vial. The flask was heated at 70 °C for 10 min without shaking, followed by 15 min of fiber exposure in COMBI-PAL system for balancing the volume within the vial. The compounds adsorbed by the fiber were desorbed into the gas chromatograph injection system gas phase (CGMS-gun TQ Series 8040 and 2010 Plus GC-MS Shimadzu, Tokyo, Japan) at 250 °C. The compounds were separated on a column 95% PDMS/5% PHENYL (30 m × 0.25 mm, 0.25 mm film thickness). The GC was equipped with an HP 5972 mass selective detector (Hewlett Packard Enterprise, Palo Alto, CA, USA). Helium was used as carrier gas at a rate of 1.0 mL·min−1. Mass spectra were obtained by electron impact at 70 eV. The compounds were identified by comparison to the mass spectra from the library database (Nist’98 and Wiley7n).

2.5.2. Mineral Analysis

Mineral analysis was performed of fermented, dried and roasted coffee beans (Figure 1). The fermented, dried coffee samples were roasted in a semi-industrial roaster (Probatino, Leogap model, Brazil) at 140 °C for 30 min. For sample preparation, fermented and roasted cocoa samples were transferred to a 250 mL volumetric flask and acidified with 5 mL of concentrated P.A. HNO3 and H2O2 30%. Subsequently, the system was allowed to heating for 40 min at 80 °C. The extract was filtered by a 0.45 µm pore size filter and the volume was completed to 100 mL. Reference solutions were prepared using deionized water with resistivity of 18.2 MΩ·cm−1 through a Milli-Q water purification system linked to a water distillatory Fisatom (Model 534, Brazil). Glassware used in this procedure was subjected to a decontamination treatment with HNO3 10% (w/v) for 24 h prior to use.
For mineral content determination, an ICP-OES (Varian, Model ES 720, Palo Alto, CA, USA) was used simultaneously with axial arrangement and solid-state detector. The torch was aligned horizontally and vertically with a Mn2+ standard solution concentration of 5.0 mg·L−1. The optical system of the ICP OES was calibrated with multi-element stock solution of the scanned patterns. Spectral lines were selected considering the absence of interferences and appropriate sensitivity for determining elements in high and low concentrations. The operation conditions were as follows: power of 1.10 kW, plasma gas flow of 15 L·min−1, auxiliary gas flow of 1.5 L·min−1, nebulizer pressure of 180 kPa, triplicate time read of 3 s, stabilization time of 15 s, sample delay of 30 s, pump speed of 15 rpm and sample washing time of 3 s.

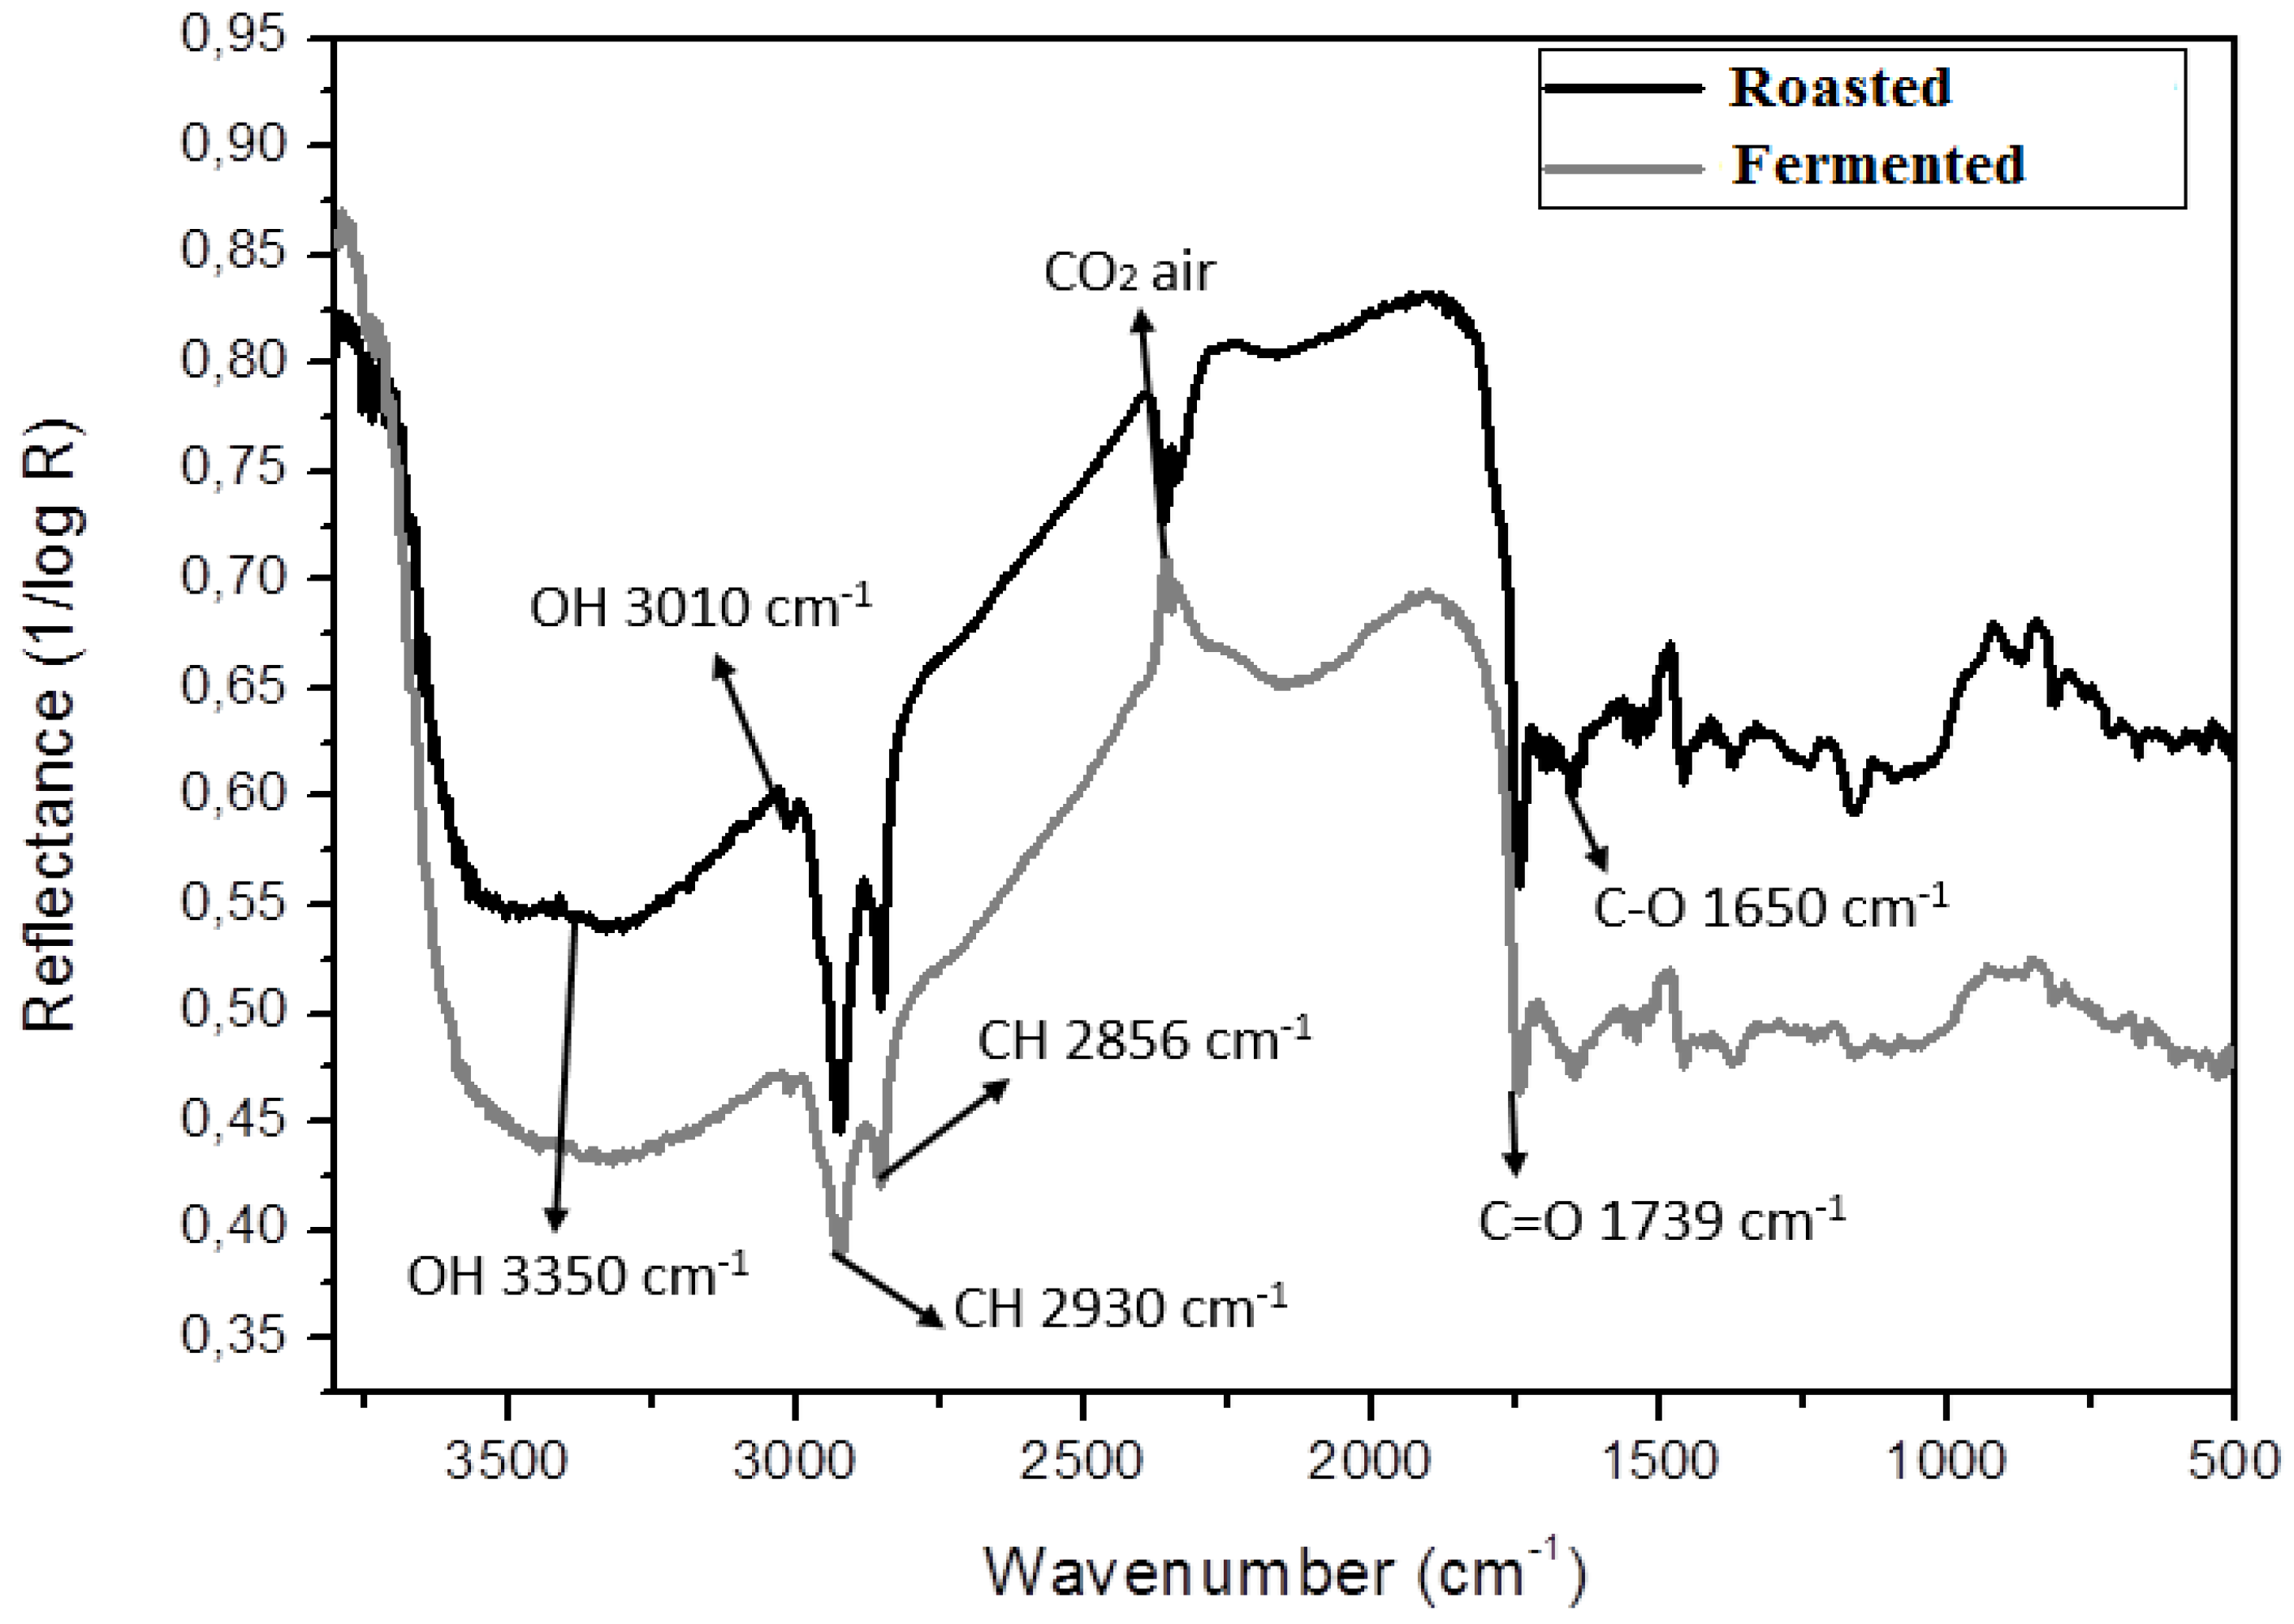
2.5.3. Fourier Transform Infrared (FTIR) Spectroscopy

Functional groups in samples of grounded coffee beans (fermented and roasted) were determined by FTIR on a VERTEX 70 (Bruker, Billerica, MA, USA) containing a DRIFT accessory with 64 scans and a 4 cm−1 resolution at the 4000 to 400 cm−1 wave length region. The samples were crushed, pulverized and oven dried. Before determination, about 20 mg of the samples were mixed and homogenized with 100 mg of Potassium bromide (KBr), and the reads were recorded.

2.5.4. Thermal Stability

Thermal stability of fermented, dried coffee beans was evaluated by Thermogravimetry (TG) analysis. Analyzes were performed under an O2 (g) atmosphere at 20 °C·min−1 rates to a maximum temperature of 800 °C in a Setsys Evolution TG/DTA/DSC (SETARAM, Hillsborough, NJ, USA) system.

3. Results and Discussion

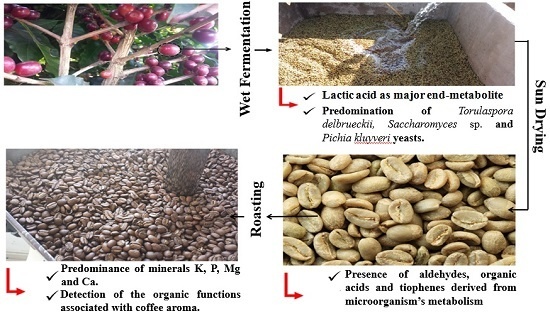
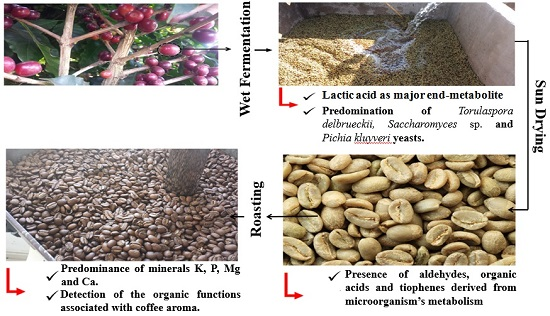
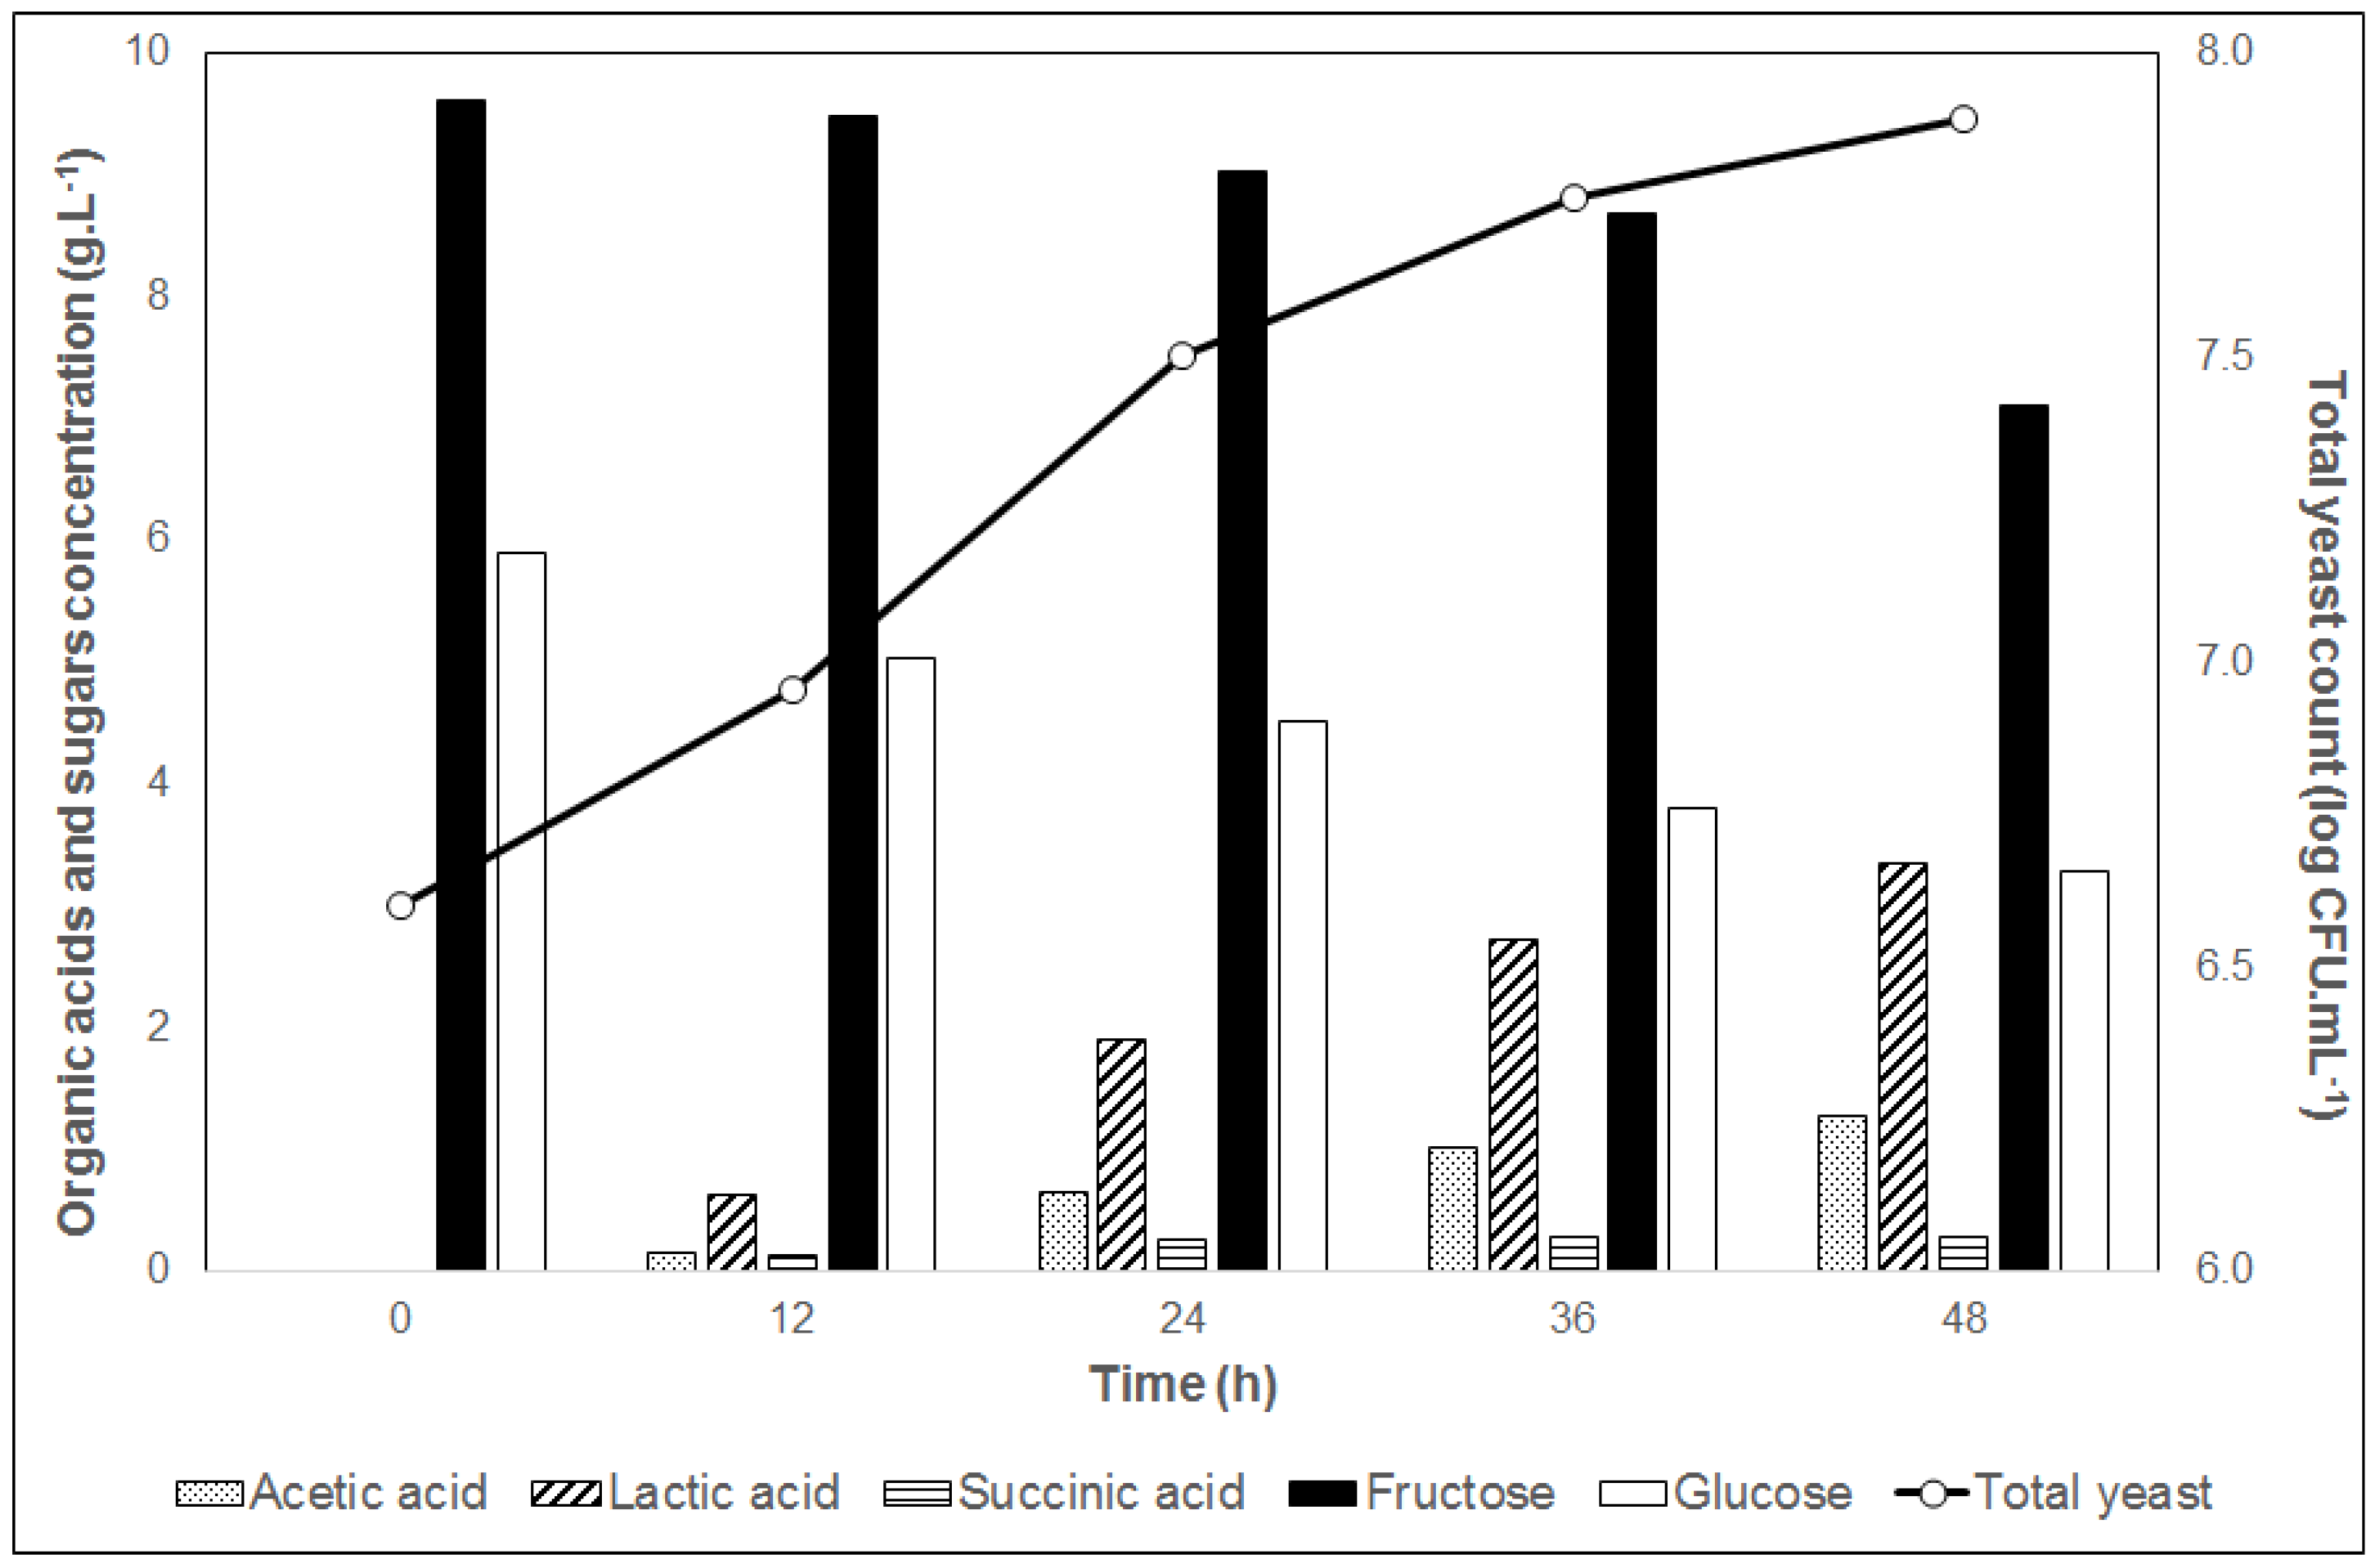
3.1. Microbiological and Chemical Characterization of Coffee Bean Fermentation

Descriptions of the load of yeast in coffee fermentation have been provided by some studies [9,10,13,14]. This has been reported to range between 2 to 7 log CFU·mL−1, depending on the study. Factors affecting the initial yeast load include the quality and integrity of the coffee beans and the hygiene of fermentation tank, utensils and water used at the commencement of the fermentation process [6]. In this study, the average number of yeast, which was 6.60 log CFU·mL−1 early in the fermentation process, increased to 7.89 log CFU·mL−1 by the end of 48 h of fermentation (Figure 2). This growth is favored by the ability of yeast cells to metabolize coffee pulp sugars as well to adapt and to cope with the hostile environment and stress conditions prevailing in coffee fermentation matrix [1].
The yeast growth was accompanied by a regular consumption of pulp sugars (glucose and fructose) and their conversion into organic acids. Lactic acid was the major metabolite produced, reaching a concentration of 3.28 g·L−1 at 48 h, followed by acetic and succinic acids (1.27 and 0.30 g·L−1, respectively). The low production of acetic acid (<1.5 g·L−1) and the absence of butyric and propionic acids minimize the formation of off-flavors in the final beverage [15,16]. On the other hand, lactic acid production can assist in the coffee-pulp acidification process without interfering in the final product quality [6]. Such organic acids production during coffee fermentation is mainly associated with lactic acid bacteria metabolism [5]. However, yeasts of the genera Saccharomyces, Pichia and Hanseniaspora may also have produced a fraction of the concentration of organic acids found in the coffee pulp beans mass in this study [17,18,19].

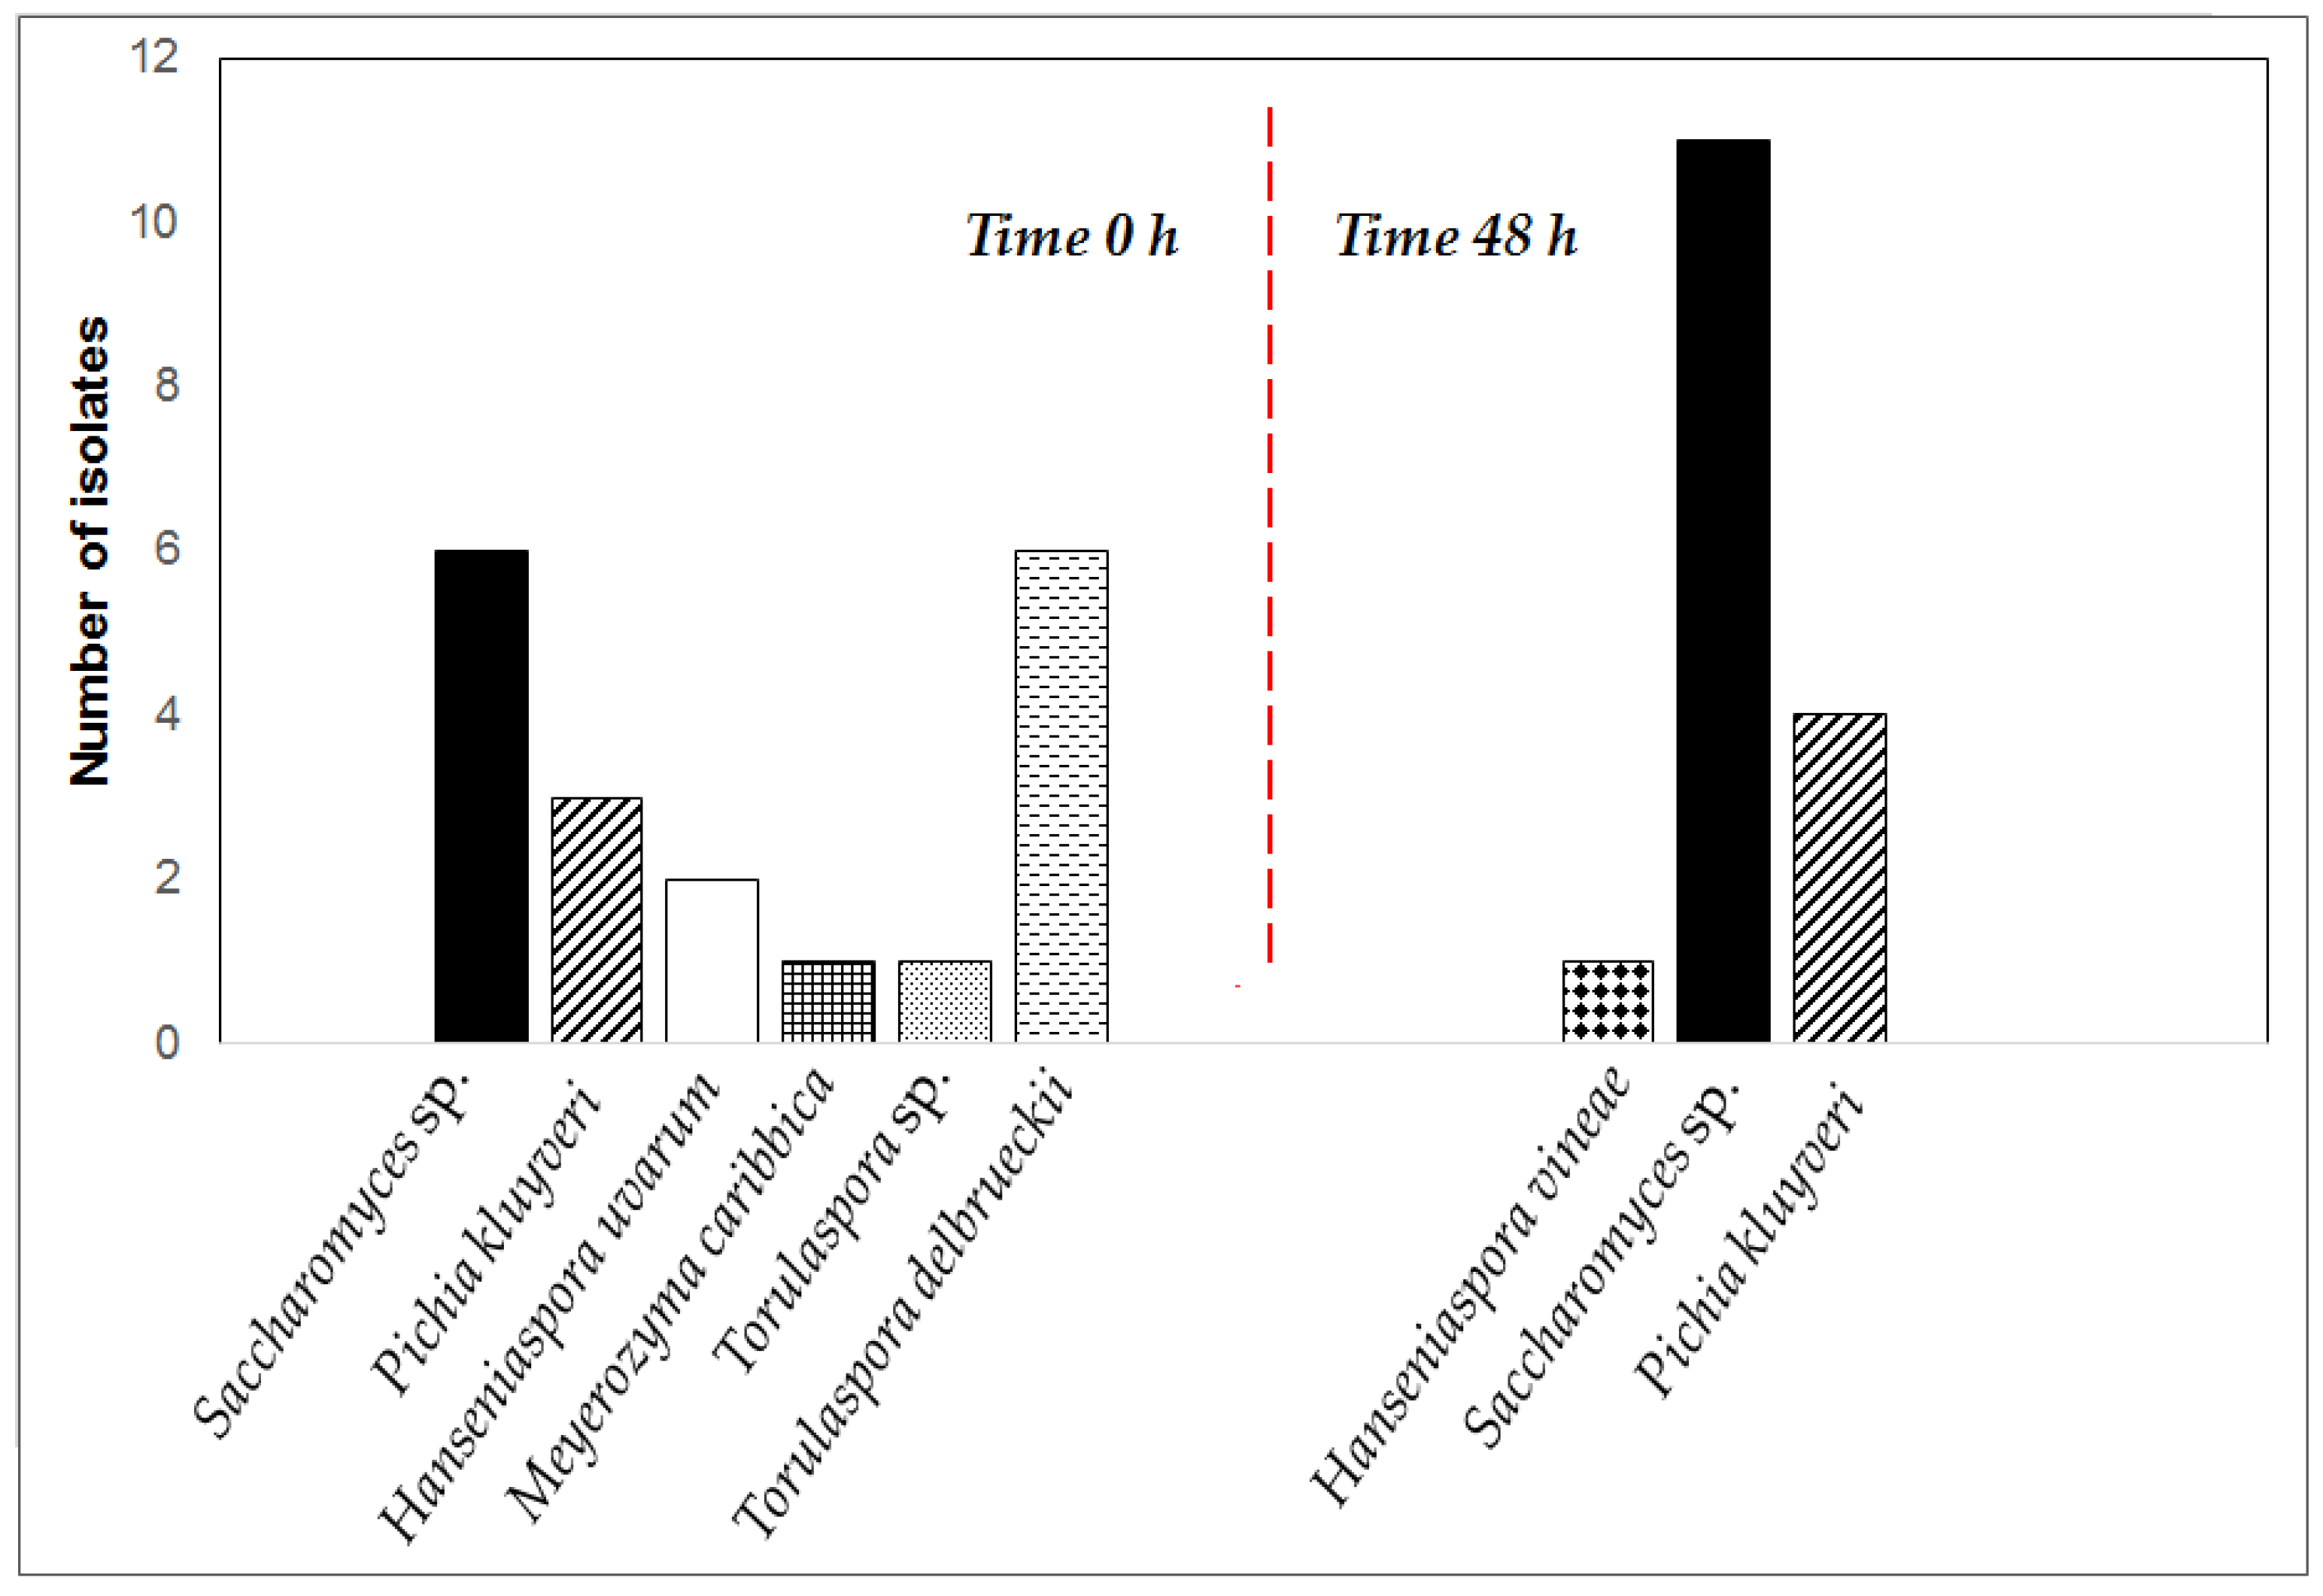
3.2. Yeast Identification

A total of 35 yeasts were isolated at the beginning and end of the fermentation process and identified by ITS-rRNA gene sequencing (Figure 3). The most frequently detected species were Saccharomyces sp. (17 isolates), Torulaspora delbrueckii (6 isolates) and Pichia kluyveri (7 isolates). However, Saccharomyces sp. was found to be dominant at the end of the fermentation process proving its easy adaptation to the coffee fermentation environment. In addition, the ability to metabolize pulp coffee pectin showed by some Saccharomyces species might be considered an advantage over other non-pectinolytic yeasts [1].
Two isolates of Hanseniaspora uvarum and one isolate of each Meyerozyma caribbica, Torulaspora sp. and Hanseniaspora vineae were identified at the beginning of the fermentation process. These yeast species have been previously found in coffee processing environments [1,9,11], except for H. vineae which was isolated for the first time. H. vineae is mainly associated with grapes and has been demonstrated to increase fruity aromas of wine by producing a high amount of acetate esters, such as 2-phenylethyl acetate and ethyl [20,21,22]. For coffee fermentation, these flavor-active esters could attribute distinct fruity sensory notes to the coffee bean through their diffusion during the fermentation process, enriching the flavor of the final beverage [6]. Thus, this yeast species should be included in research programs for the selection and development of functional starter cultures.

3.3. Volatile Organic Compounds Determination of Fermented Cocoa Beans by Gas Chromatography Coupled to Mass Spectrophotometry (GC-MS)

Yeast fermentation of pulp sugars produces a vast array of volatile metabolites that are well known for their aromatic and flavorant properties [4,23]. These volatiles can diffuse into the coffee beans which may influence in its chemical composition [4]. In this study, a total of 25 volatile organic compounds were identified in the fermented, dried coffee bean samples by SPME-GC-MS analysis, with predominance of hydrocarbons (9 compounds) and higher alcohols (6 compounds) (Table 1). Although most of the compounds identified originate from the bean itself, some are known to be related bacteria (i.e., nonanal, citric acid and heptanal) and yeast (i.e., hexane, heptane and thiophenes) metabolism [24]. Despite the diffusion mechanism have not yet been elucidated, it is often referenced in the literature that these volatile organic compounds diffuse into the beans [1,5,25]. Further research to understand how these volatiles are conserved during roasting operation and reach the final coffee product is required.

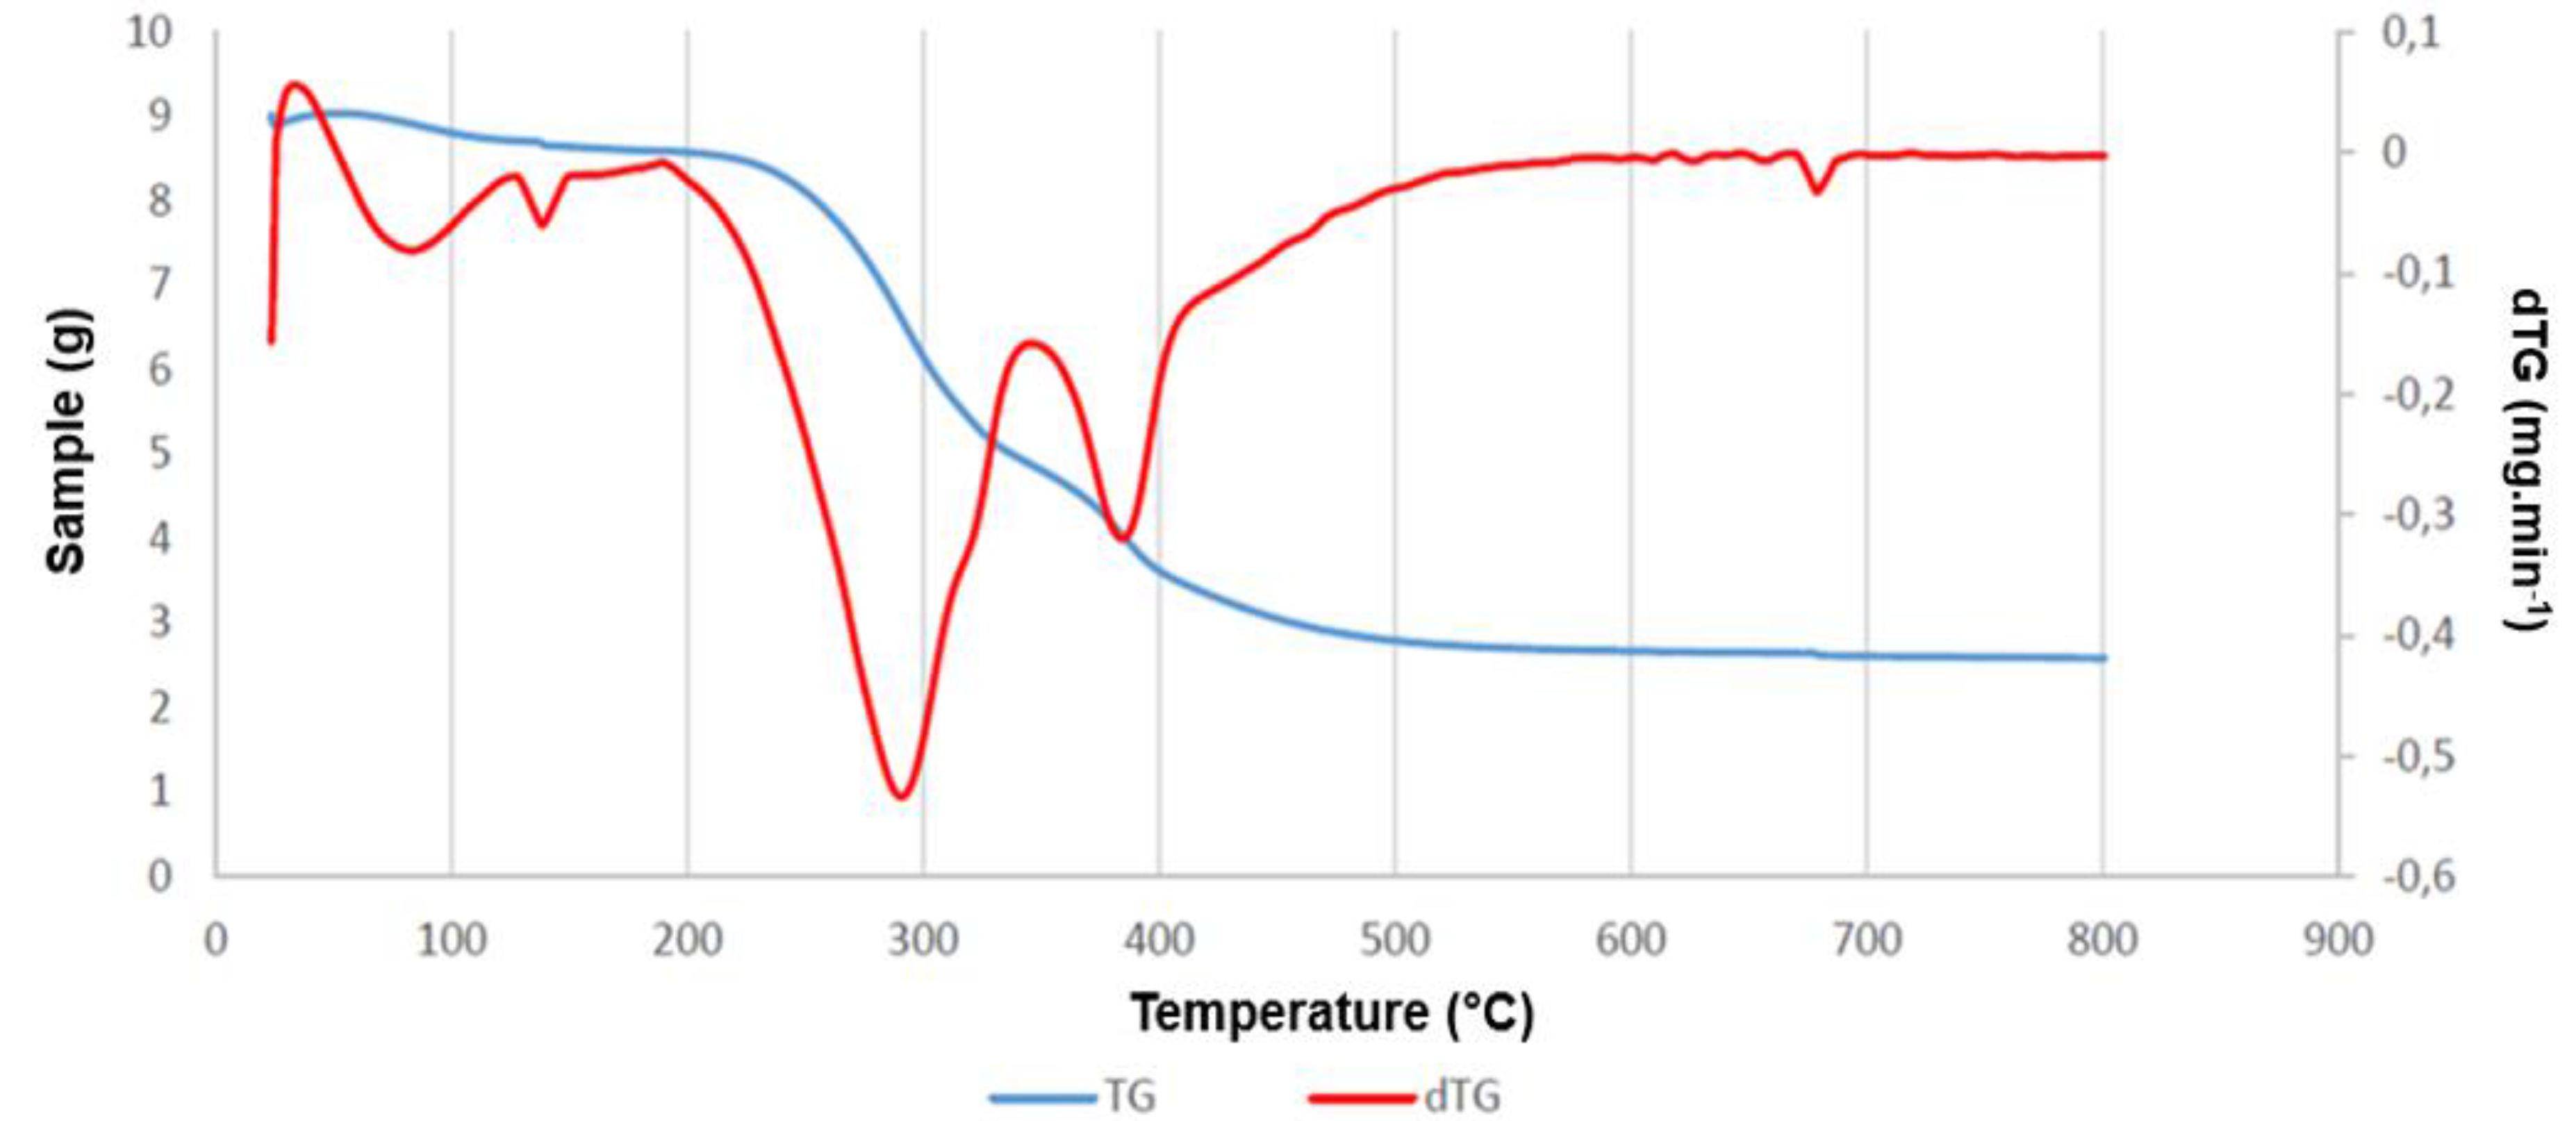
3.4. Physicochemical Characterization of Coffee Beans

The mineral composition of fermented, dried and roasted samples is shown in Table 2. Potassium displayed the higher amount among the minerals analyzed in fermented and roasted coffee samples (12,453.10 and 13,117.50 mg·kg−1, respectively), followed by phosphorus (1932.76 and 2110.71 mg·kg−1, respectively), magnesium (1554.31 and 1772.65 mg·kg−1, respectively) and calcium (1360.19 and 1192.32 mg·kg−1, respectively). These results are in agreement with those found by Martín et al. [26], except for the high aluminum content present in our samples. Although the Coffea arabica is not reported as an aluminum accumulator, the levels of such metal in the analyzed samples may be indicative of a soil with high availability of this metal for plant [27].
Over the last two decades, vibrational spectroscopy methods have proven to be a reliable and fast technique for the identification and quantification of several primary and secondary metabolites generated during fermentation processes or to estimate the quality of the food itself [28,29,30,31,32]. In this study, FTIR spectroscopy analysis showed a quite similar spectrum for both fermented, dried and roasted coffee beans (Figure 4). It was possible to verify the presence of the main organic functions associated with the coffee aroma, such as aromatic acids (1700–1680 cm−1), ketones (1725–1705 cm−1), aldehydes (1739–1724 cm−1) and aliphatic esters (1755–1740 cm−1). Those results corroborate the wide variety of volatile organic compounds identified by the SPME-GC-MS technique (Table 1).
Thermoanalytical methods, especially thermogravimetry/differential thermogravimetry (TG/dTG), are already being utilized to measure the physical and chemical properties of coffee samples as a function of temperature or time. For the coffee samples analyzed in this study, the thermal decomposition occurred in four stages between 90 and 390 °C (Figure 5). A significant mass loss (68%) can be observed after the second stage at 190 °C. At temperatures above 420 °C only ashes remain in the final matter.
The first two thermal degradation events that occurs at the temperatures of 90 and 138 °C are associated with loss of free water and volatiles compounds (i.e., alcohols, aldehydes and organic acids) and absorbed water, respectively. A small variation (9%) in the total weight loss within this temperature range corresponds to the water content in fermented beans [33]. A study performed by Yeretzian et al. [34] monitored the emission of volatile components during the roasting step of the fermented beans which observed that during the endothermic phase the loss of water and volatile compounds that are not derived from Maillard’s reaction or non-volatile precursors is prominent. The latter thermal degradation events represent a significant loss in mass (68%) of the fermented beans correspond to depolymerisation of hemicelluloses or pectin and cellulose decomposition, which occurs at 240–315 °C and 370–400 °C, respectively [35].

4. Conclusions

The results of the present study indicated that Saccharomyces sp. is a dominant, well-adapted yeast found in coffee fermentation at Brazilian Cerrado Mineiro region. In addition, this study is the first to report the presence of aroma-producing yeast Hanseniaspora vineae in coffee bean fermentation. Physicochemical analyses showed that different organic compounds present in coffee bean samples may be derived from microbial metabolism during the fermentation process. Future studies should focus on the dynamic of diffusion of these compounds into the beans, and to determine the actual role of the microbial fermentation for coffee beverage quality. Our findings are relevant as a support for the development of usual starter cultures and controlled batch processes.

Acknowledgments

The authors thank Conselho Nacional de Desenvolvimento Cientíıfico e Tecnológico do Brasil (CNPq) for the research scholarship.

Author Contributions

Carlos Ricardo Soccol idealized wrote the research project and obtained research scholarship; Dão Pedro de Carvalho Neto and Gilberto Vinícius de Melo Pereira designed the experiments; Dão Pedro de Carvalho Neto and Vanete Thomaz Soccol conducted the yeast isolation and molecular sequencing experiments; Cristine Rodrigues, Valcineide O. A. Tanobe and Bruno José G. da Silva conducted the physicochemical characterization experiments; Dão Pedro de Carvalho Neto and Gilberto Vinícius de Melo Pereira analyzed the results and wrote the paper.

Conflicts of Interest

The authors declare no conflict of interests.

References

  1. Pereira, G.V.M.; Soccol, V.T.; Pandey, A.; Medeiros, A.B.P.; Lara, J.M.R.A.; Gollo, A.L.; Soccol, C.R. Isolation, selection and evaluation of yeasts for use in fermentation of coffee beans by the wet process. Int. J. Food Microbiol. 2014, 188, 60–66. [Google Scholar] [CrossRef] [PubMed]
  2. Evangelista, S.R.; Silva, C.R.; Miguel, M.G.P.C.; Cordeiro, C.S.; Pinheiro, A.C.M.; Duarte, W.F.; Schwan, R.F. Improvement of coffee beverage quality by using selected yeasts strains during the fermentation in dry process. Food Res. Int. 2014, 61, 183–195. [Google Scholar] [CrossRef]
  3. Evangelista, S.R.; Miguel, M.G.C.P.; Silva, C.P.; Pinheiro, A.C.M.; Schwan, R.F. Microbiological diversity associated with the spontaneous wet method of coffee fermentation. Int. J. Food Microbiol. 2015, 210, 102–112. [Google Scholar] [CrossRef]
  4. Pereira, G.V.M.; Neto, E.; Soccol, V.T.; Medeiros, A.B.P.; Woiciechowski, A.L.; Soccol, C.R. Conducting starter culture-controlled fermentations of coffee beans during on-farm wet processing: Growth, metabolic analyses and sensorial effects. Food Res. Int. 2015, 75, 348–356. [Google Scholar] [CrossRef]
  5. Pereira, G.V.M.; Carvalho-Neto, D.P.; Medeiros, A.B.P.; Soccol, V.T.; Neto, E.; Woiciechowski, A.L.; Soccol, C.R. Potential of lactic acid bacteria to improve the fermentation of coffee during on-farm processing. Int. J. Food Sci. Technol. 2016, 51, 1689–1695. [Google Scholar] [CrossRef]
  6. Pereira, G.V.M.; Soccol, V.T.; Brar, S.K.; Neto, E.; Soccol, C.R. Microbial ecology and starter culture technology in coffee processing. Crit. Rev. Food Sci. 2015. [Google Scholar] [CrossRef]
  7. Wootton, A.E. The fermentation of coffee. Kenya Coffee 1963, 28, 239–249. [Google Scholar]
  8. Sivetz, M. Coffee Processing Technology; AVI: Westport, CT, USA, 1963; Volume 2. [Google Scholar]
  9. Masoud, W.; Cesar, L.B.; Jespersen, L.; Jakobsen, M. Yeast involved in fermentation of Coffea arabica in East Africa determined by genotyping and by direct denaturating gradient gel electrophoresis. Yeast 2004, 21, 549–556. [Google Scholar] [CrossRef]
  10. Silva, C.F.; Batistam, L.R.; Abreu, L.M.; Dias, E.S.; Schwan, R.F. Succession of bacterial and fungal communities during natural coffee (Coffea arabica) fermentation. Food Microbiol. 2008, 25, 951–957. [Google Scholar] [CrossRef] [PubMed]
  11. Vilela, D.M.; Pereira, G.V.M.; Silva, C.F.; Batista, L.R.; Schwan, R.F. Molecular ecology and polyphasic characterization of the microbiota associated with semi-dry processed coffee (Coffea arabica L.). Food Microbiol. 2010, 27, 1128–1135. [Google Scholar] [CrossRef] [PubMed]
  12. The Association of Brazilian Coffee Producing Regions. Available online: http://www.abopcafe.com.br/cerrado-mineiro/ (accessed on 19 January 2017).
  13. Avallone, S.; Guyot, B.; Brillouet, J.M.; Olguin, E.; Guiraud, J.P. Microbiological and biochemical study of coffee fermentation. Curr. Microbiol. 2001, 42, 252–256. [Google Scholar] [CrossRef]
  14. Velmourougane, K. Impact of natural fermentation on physicochemical, microbiological and cup quality characteristics of Arabica and Robusta coffee. Proc. Natl. Acad. Sci. USA 2013, 83, 233–239. [Google Scholar] [CrossRef]
  15. Lopez, C.I.; Bautista, E.; Moreno, E.; Dentan, E. Factors related to the formation of “overfermented coffee beans” during the wet processing method and storage of coffee. In Proceedings of the 13th International Scientific Colloquium on Coffee, Paipa, Colombia, 21–25 August 1989.
  16. Silva, C.F.; Vilela, D.M.; de Souza, C.C.; Duarte, W.F.; Dias, D.R.; Schwan, R.F. Evaluation of a potential starter culture for enhance quality of coffee fermentation. World J. Microbiol. Biotechnol. 2013, 29, 235–247. [Google Scholar] [CrossRef]
  17. Blomberg, A.; Alder, L. Physiology of osmotolerance in fungi. Adv. Microbiol. Phys. 1992, 33, 145–212. [Google Scholar]
  18. Sauer, M.; Porro, D.; Mattanovich, D.; Branduardi, P. Microbial production of organic acids: Expanding the markets. Trends Biotechnol. 2008, 26, 100–108. [Google Scholar] [CrossRef] [PubMed]
  19. Ciani, M.; Beco, L.; Comitini, F. Fermentation behaviour and metabolic interactions of multistarter wine yeast fermentations. Int. J. Food Microbiol. 2006, 108, 239–245. [Google Scholar] [CrossRef] [PubMed]
  20. Viana, F.; Belloch, C.; Vallés, S.; Manzanares, P. Monitoring a mixed starter of Hanseniaspora vineae-Saccharomyces cerevisiae in natural must: Impact on 2-phenylethyl acetate production. Int. J. Food Microbiol. 2011, 151, 235–240. [Google Scholar] [CrossRef] [PubMed]
  21. Medina, K.; Boido, E.; Fariña, L.; Gioia, O.; Gomez, M.E.; Barquet, M. Increased flavour diversity of Chardonnay wines by spontaneous fermentation and co-fermentation with Hanseniaspora vineae. Food Chem. 2013, 141, 2513–2521. [Google Scholar] [CrossRef] [PubMed]
  22. Lleixà, J.; Martín, V.; Portillo, M.C.; Carrau, F.; Beltran, G.; Mas, A. Comparison of fermentation and wines produced by inoculation of Hanseniaspora vineae and Saccharomyces cerevisiae. Front. Microbiol. 2016, 7, 1–12. [Google Scholar] [CrossRef] [PubMed]
  23. Swiegers, J.H.; Pretorius, I.S. Yeast modulation of wine flavor. Adv. Appl. Microbiol. 2005, 57, 131–175. [Google Scholar] [PubMed]
  24. Damiani, P.; Gobbetti, M.; Cossignani, L.; Corsetti, A.; Simonetti, M.S.; Rossi, J. The sourdrough microflora. Characterization of hetero- and homofermentative lactic acid bacteria, yeasts and their interactions on the basis of the volatile compounds produced. LWT Food Sci. Technol. 1996, 29, 63–70. [Google Scholar] [CrossRef]
  25. Owusu, M.; Petersen, M.A.; Heimdal, H. Effect of fermentation method, roasting and conching conditions on the aroma volatiles of dark chocolate. J. Food Process. Preserv. 2012, 36, 446–456. [Google Scholar] [CrossRef]
  26. Martín, M.J.; Pablosm, F.; González, A.G. Characterization of green coffee varieties according to their metal content. Anal. Chim. Acta 1998, 358, 177–183. [Google Scholar]
  27. Franková, A.; Drábekm, O.; Havlík, J.; Száková, J.; Vanek, A. The effect of beverage preparation method on aluminum content in coffee infusions. J. Inorg. Biochem. 2009, 103, 1480–1485. [Google Scholar]
  28. Sinija, V.; Mishra, H. FT-NIR spectroscopy for caffeine estimation in instant green tea powder and granules. LWT Food Sci. Technol. 2009, 42, 998–1002. [Google Scholar] [CrossRef]
  29. Paradkar, M.M.; Irudayaraj, J. A rapid FTIR spectroscopic method for estimation of caffeine in soft drinks and total methylxanthines in tea and coffee. J. Food Sci. 2002, 67, 2507–2511. [Google Scholar] [CrossRef]
  30. Giovenzana, V.; Beghi, R.; Guidetti, R. Rapid evaluation of craft beer quality during fermentation process by Vis/NIR spectroscopy. J. Food Eng. 2014, 142, 80–86. [Google Scholar] [CrossRef]
  31. Krähmer, A.; Engel, A.; Kadow, D.; Ali, N.; Umaharan, P.; Kroh, L.W.; Schulz, H. Fast and neat—Determination of biochemical quality parameters in cocoa using near infrared spectroscopy. Food Chem. 2015, 181, 152–159. [Google Scholar] [CrossRef] [PubMed]
  32. Lyman, D.J.; Benck, R.; Dell, S.; Merle, S.; Murray-Wijelath, J. FTIR-ATR analysis of brewed coffee: Effect of roasting conditions. J. Agric. Food Chem. 2003, 51, 3268–3272. [Google Scholar] [CrossRef]
  33. Yeretzian, C.; Jordan, A.; Badoud, R.; Lindinger, W. From the green bean to cup of coffee: Investigating coffee roasting by on-line monitoring of volatiles. Eur. Food Res. Technol. 2002, 214, 92–104. [Google Scholar] [CrossRef]
  34. Jakab, E.; Faix, O.; Till, F. Thermal decomposition of milled wood lignins studied by thermogravimetry/mass spectrometry. J. Anal. Appl. Pyrolysis 1997, 40–41, 171–186. [Google Scholar] [CrossRef]
  35. Ouajai, S.; Shanks, R.A. Composition, structure and thermal degradation of hemp cellulose after chemical treatments. Polym. Degrad. Stabil. 2005, 89, 237–335. [Google Scholar] [CrossRef]
Figure 1. Experimental setup of the case study of coffee-processing experiments carried out at the Cerrado Mineiro region (Brazil).
Fermentation 03 00011 g001
Figure 2. Total yeast count, organic acids production and pulp-sugar consumption during coffee bean fermentation.
Fermentation 03 00011 g002
Figure 3. Distribution and frequency of yeast isolated during coffee bean fermentation.
Fermentation 03 00011 g003
Figure 4. Functional groups present in fermented, dried and roasted samples of coffee beans determined by Fourier transform of infrared (FTIR) spectroscopy on range of 400–4000 wavenumber. The main bands identified and organic functions associated were: O–H (3350 and 3010 cm−1; alcohols); C–H (2930 and 2856 cm−1; alkanes); C=O (1739 cm−1; carboxylic acids and esters); C–O (1650 cm−1; alcohols or phenols).
Fermentation 03 00011 g004
Figure 5. Thermostability of fermented coffee cherries submitted to an oxygen atmosphere heated up to 800 °C. dTG: profiles of main volatile products; TG: mass loss rate curve.
Fermentation 03 00011 g005
Table 1. Volatile compounds identified in fermented coffee samples by Gas Chromatography Coupled to Mass Spectrophotometry (GC-MS).
Organic Functional GroupVolatile Organic Compound
Aldehydes (2)Nonanal
Heptanal
Alcohol (6)5-tert-Butyl-1,3-cyclohexanediol
2-Propyl-1-pentanol
4-Ethyl-1-octyn-3-ol
2-ethyl-1-Decanol
Carboxylic acid (4)13-(Benzyloxy) tridecanoic acid
Dodecanoic acid, 3-hydroxy-
Methacrylic acid
Acetic acid
Ester (1)Heptyl valerate
Hydrocarbons (9)Heptane, 2,2,3,5-tetramethyl-Pentane, 2,2,3,4-tetramethyl-Heptane, 2,2,6,6-tetramethyl-Hexane, 2,2,5-trimethyl-Eicosane, 3-methyl-Dodecane, 2,6,11-trimethyl-Heptane, 5-ethyl-2,2,3-trimethyl-Hexadecane 9-Octadecene, 1,1-dimethoxy-
Sulfur Compounds (1)2-Allyl-3-methyl-4-(phenylsulfanyl)-2,5-dihydrothiophene, 1,1-dioxide
Ketone (1)p-Benzoquinone
Pyrazine (1)2-Isobutyl-3-methoxypyrazine
Table 2. Content of minerals on fermented and roasted coffee samples.
Minerals (mg·kg−1)Trait
Fermented CoffeeRoasted Coffee
Al234.71 ± 29.22 a362.56 ± 106.12 b
Ba3.40 ± 0.49 c2.61 ± 0.09 c
B7.28 ± 0.30 c6.26 ± 0.21 c
CdND cND c
Ca1360.19 ± 20.53 d1192.32 ± 0.88 e
CoND cND c
Cu16.51 ± 0.38 c17.57 ± 0.25 c
Fe33.75 ± 1.32 c33.12 ± .44 c
P1932.76 ± 43.56 f2110.71 ± 28.40 g
LiND cND c
Mg1554.31 ± 17.47 h1772.65 ± 24.87 i
Mn16.32 ± 0.01c17.43 ± 0.07 c
MoND cND c
NiND cND c
K12453.10 ± 8.35 j13117.50 ± 16.41 k
SeND cND c
Na350.565 ± 17.83 b380.99 ± 16.40 b
V0.86 ± 0.05 c0.47 ± 0.04 c
Zn10.15 ± 0.12 c9.78 ± 0.30 c
* Means of triplicate in each row bearing the same letters are not significantly different (p > 0.05) from one another using Duncan’s Test (mean ± standard variation). ND: not detectable. Al = Aluminum; Ba = Barium; B = Boron; Cd = Cadmium; Ca = Calcium; Co = Cobalt; Cu = Copper; Fe = Iron; P = Phosphorus; Li = Lithium; Mg = Magnesium; Mn = Manganese; Mo = Molybdenum; Ni = Nickel; K = Potassium; Se = Selenium; Na = Sodium; V = Vanadium; Zn = Zinc.

