Article

Modeling the Growth of Lactococcus lactis NCIM 2114 under Differently Aerated and Agitated Conditions in Broth Medium

1
Visiting Scientist (UNCP), Division of Food Science & Post harvest Technology, NRL Building 3rd Floor, Pusa campus, Indian Agricultural Research Institute, New Delhi 110012, India
2
Head, Division of Forecasting and Agricultural Systems Modeling, Indian Agricultural Statistics Research Institute, Library Avenue, Pusa, New Delhi 110012, India
3
Department of Chemistry and Physics, PO Box 1510, Pembroke, NC 28372, USA
*
Author to whom correspondence should be addressed.
These authors contributed equally to this work.
Fermentation 2015, 1(1), 86-97; https://doi.org/10.3390/fermentation1010086
Submission received: 15 June 2015 / Revised: 20 October 2015 / Accepted: 22 October 2015 / Published: 29 October 2015
(This article belongs to the Special Issue Beneficial Fermentation Microbes and Their Functional Compounds)

Abstract

:
The study of growth of Lactococcus lactis NCIM 2114, a nisin producer, was modeled using continuously generated concentration data for growth in fermenter. The sigmoidal growth functions, Logistic, Gompertz, and Richards were used to fit the data. A nonlinear regression method was used to fit the data and estimate growth parameter values of L. lactis, using Marquardt algorithm with Statistical Software SPSS, version 20. Bacterial growth data from the exponential phase of the bacteria’s growth was analyzed. An F test showed that the Gompertz and Logistic functions were acceptable 92% and 67% of times respectively in the batch fermenter runs where this particular application was used to derive the lag time, growth rates, and time to maximum growth rates of L. lactis. The maximal specific growth rate ranged between 0.23 h−1 to 0.30 h−1 and the lag time lasted up to a maximum of 1.63 h depending upon aeration conditions provided to the organism. This study will help to estimate specific growth rates and lag time of L. lactis under different growth conditions. Predicted values can be accurately determined.

Graphical Abstract

1. Introduction

The growth of an organism in a growth medium can be monitored by measuring absorbance, cell biomass (BM as cell dry weight) or cell counts per unit cell volume. Cell plate counts and increase in metabolites of interest, as well as indirect measures can also be correlated to growth rate of an organism. The lag time determined from absorbance units are inaccurate and of insufficient precision [1]. Growth of Pseudomonas putida has been modeled and found suitable when recorded in terms of absorbance units for different cell mass versus versus time [2] using a Logistic function. For the bacterium, Lactobacillus plantarum, the relative population size against time has been applied to predict growth dynamics by the Gompertz function [3]. Modeling cell population increase has been successfully utilized [4]. Modified equations for bacterial growth can be derived for conditions to determine the lag time and growth rate of an organism. Modeling can predict growth when microbial interactions are studied in common environments [5]. For instance, if a lactic bacterium first converts glucose to pyruvate followed by lactate production, a competing organism present in the medium may attempt to take up glucose and survive. Now, populations due to such interactions can then be compared and interpreted by the use of a statistical modeling approach. Other statistical software such as “grofit” available from Comprehensive R Archive Network (CRAN), have also been used to estimate parameters in different growth models and dose response growth curves [6,7].
In the present study, there was no nutrient limitation in the medium for growth of L. lactis. This organism also produced nisin as a primary metabolite [8]. Thus, to model the growth of this organism, we studied it during its exponential growth phase. The maximum specific growth rate of the organism and lag time to enter exponential growth was determined under the different levels of agitation and aeration. Growth modeled by (1) Logistic, (2) Gompertz, and (3) Richards sigmoidal functions were all found suitable for curve fits of bacterial concentration data. For growth of L. lactis, all the models were strong fits, with high multiple correlation coefficients (R2 values at p ≤ 0.01). Because the Gompertz function is a general (dynamic) deterministic model used with differential equations at constant temperature [9], it was used most successfully to determine lag time (λ) and specific growth rate maxima µm of the organism [3]. Our results also point to the acceptability of Gompertz function as compared to Logistic function.

2. Experimental Section

2.1. Growth of L. lactis NCIM 2114

Cultivation of L. lactis was carried out in a 2-l vessel (STR Sartorius A+, Germany), coupled to Multi Fermenter Control System with Data Acquisition Software, controlling the temperature, airflow rate (flow meter), and agitation (Rushton). A Hamilton Dissolved Oxygen probe [10] monitored O2 % as DO [11,12] at 30 °C. Sterile silicone solution antifoam was added as required. L. lactis cell growth was monitored using an Optek NIR sensor probe mounted in the fermenter vessel detecting at 700 nm in concentration units “CU”. After completion of each of the 24 h batch runs, data collected on an Optek Model FC 20 data logger unit was downloaded to a PC via FC-PC transfer software.

2.2. Bacterial Strains, Media, and Culture Conditions

The bacterial strain was procured from National Collection of Industrial Microorganisms, NCL, Pune, India as Streptococcus lactis NCIM 2114, a nisin producer (now classified as Lactococcus lactis [13] and was maintained by bimonthly sub-culturing. A 48 h growth of culture in de-Mann Rogosa Sharpe (MRS) agar slants [14] (incubated at 30 °C), was preserved at 4 °C. The MRS medium used for growth and nisin production contained (g/L): proteose peptone 10; beef extract 10; yeast extract 5; dextrose 20; polysorbate-80 1; ammonium citrate 2; sodium acetate 5; magnesium sulfate 0.10; manganese sulfate 0.05; di-potassium phosphate 2.0; and agar 12.0 (when required for slants/plates), at a final pH 6.5 ± 0.2. The medium was autoclaved at 121 °C for 20 min. Stock cultures were maintained at −4 °C in nutrient agar and sub-cultured at bimonthly intervals. A uniformly dispersed inoculum of L. lactis NCIM 2114 (loopful in a 0.2 mL MRS broth) was inoculated into 3.5 mL MRS broth and incubated 3 h at 30 °C. Transfer of inoculum from 3.5 mL to 75 mL starter inoculum and then adding to 1500 mL fermenting medium ensured synchronous growth of inoculum with an absorbance of ~6.0 (at 600 nm). The working volume of fermenting medium was always 50% of total vessel capacity.

2.3. Experimental Runs

The experiments were randomized and designed using a Box Behnken design [15,16]. This approach required 15 design points/experimental runs, according to:
N= k2 + k + cp
where k is the factor number which is 3 in this case and cp is the number of replications at the center point, which is also 3 in this design.The design is single block with the combination(s) of 3 factors x1, x2 and x3, at three coded levels: −1, 0 and +1: x1 {aeration: 0 vvm (−1); 0.2 vvm (0); 0.4 vvm (+1)}; x2 {agitation: 25 rpm (−1); 50 rpm (0); 100 rpm (+1)}; and x3 {harvest periods (h) during growth 4 h (−1), 7 h (0) and 24 h (+1)}, respectively. This configuration includes 12 factorial points and three center points (as replications of control). Three different harvest periods were used to obtain samples for production of nisin. This study reports the bacterial growth using concentration units (CU) data, collected in 15 min intervals over a 24 h period in each of the experimental runs. The mathematical parameters were obtained after statistical analysis of the sigmoidal growth functions, using SPSS version 20 software. Lag periods and specific growth rates of the bacteria under different growth conditions in batch scale were then calculated after analysis using SPSS version 20 software.

2.4. Fitting of Data and Modeling Growth of L. lactis as a Function of Time

The growth of L. lactis in CU units that was recorded in 15 min intervals in all the batch runs was plotted against time. The Logistic, Gompertz, and Richards sigmoidal functions used to model growth Equations (2)–(4) were:
Logistic   y = a [ 1 + exp ( b c t ) ]
Gompertz   y = a exp [ exp ( b c t ) ]
Richards   y = a { 1 + b exp [ c ( d t ) ] } 1 / b

2.5. F Test

Using the SPSS software for fitting data, the RSS (residual sum of squares) values were calculated for the three functions. To discriminate among the three-parameter functions (Logistic/Gompertz) or four-parameter functions (Richards), they were compared statistically by the F test. As previously reported [3], Schnute’s sigmoidal function encompassed all other sigmoidal functions for growth [3] and also defined four parameters as Richards functions. A function that can define more number of parameters to growth is always advantageous in modeling. The residual sum of squares RSS1 (of Richards function) can be used as a measuring error [3], was taken as a reference, to compare Logistic and Gompertz functions, in this study.
Fitted data was analyzed and used in calculating fd values (Equation (5)) as given below, for Logistic vs. vs. Richards and Gompertz vs. vs. Richards functions and then tested against F [3,16]:
Where DF2—DF1 was 1 and Table F values, of 1 as numerator and DF1 denominator were used to obtain F distribution [15].
f d = R S S 2 R S S 1 R S S 1 / D F 1   calculated and tested against   F D F 2 D F 1 D F 1
The terms RSS denotes the residual sum of squares where RSS2 was from the three-parameter model/function (Gompertz or Logistic function) and RSS1 was from the four-parameter model /function (Richards function). Similarly DF denotes the degree of freedom (regression), where DF1 was from the four parameters Richards function and DF2 was from three-parameters Logistic and Gompertz functions.
The fd values also were then tested against F Table values for acceptability of the sigmoidal function(s) used to model growth of L. lactis [3].
In our study, MRS medium was the growth medium for L. lactis and substrate was not a limiting factor. Thus, growth was not based on Monod’s equation where substrate is a limiting factor for growth.

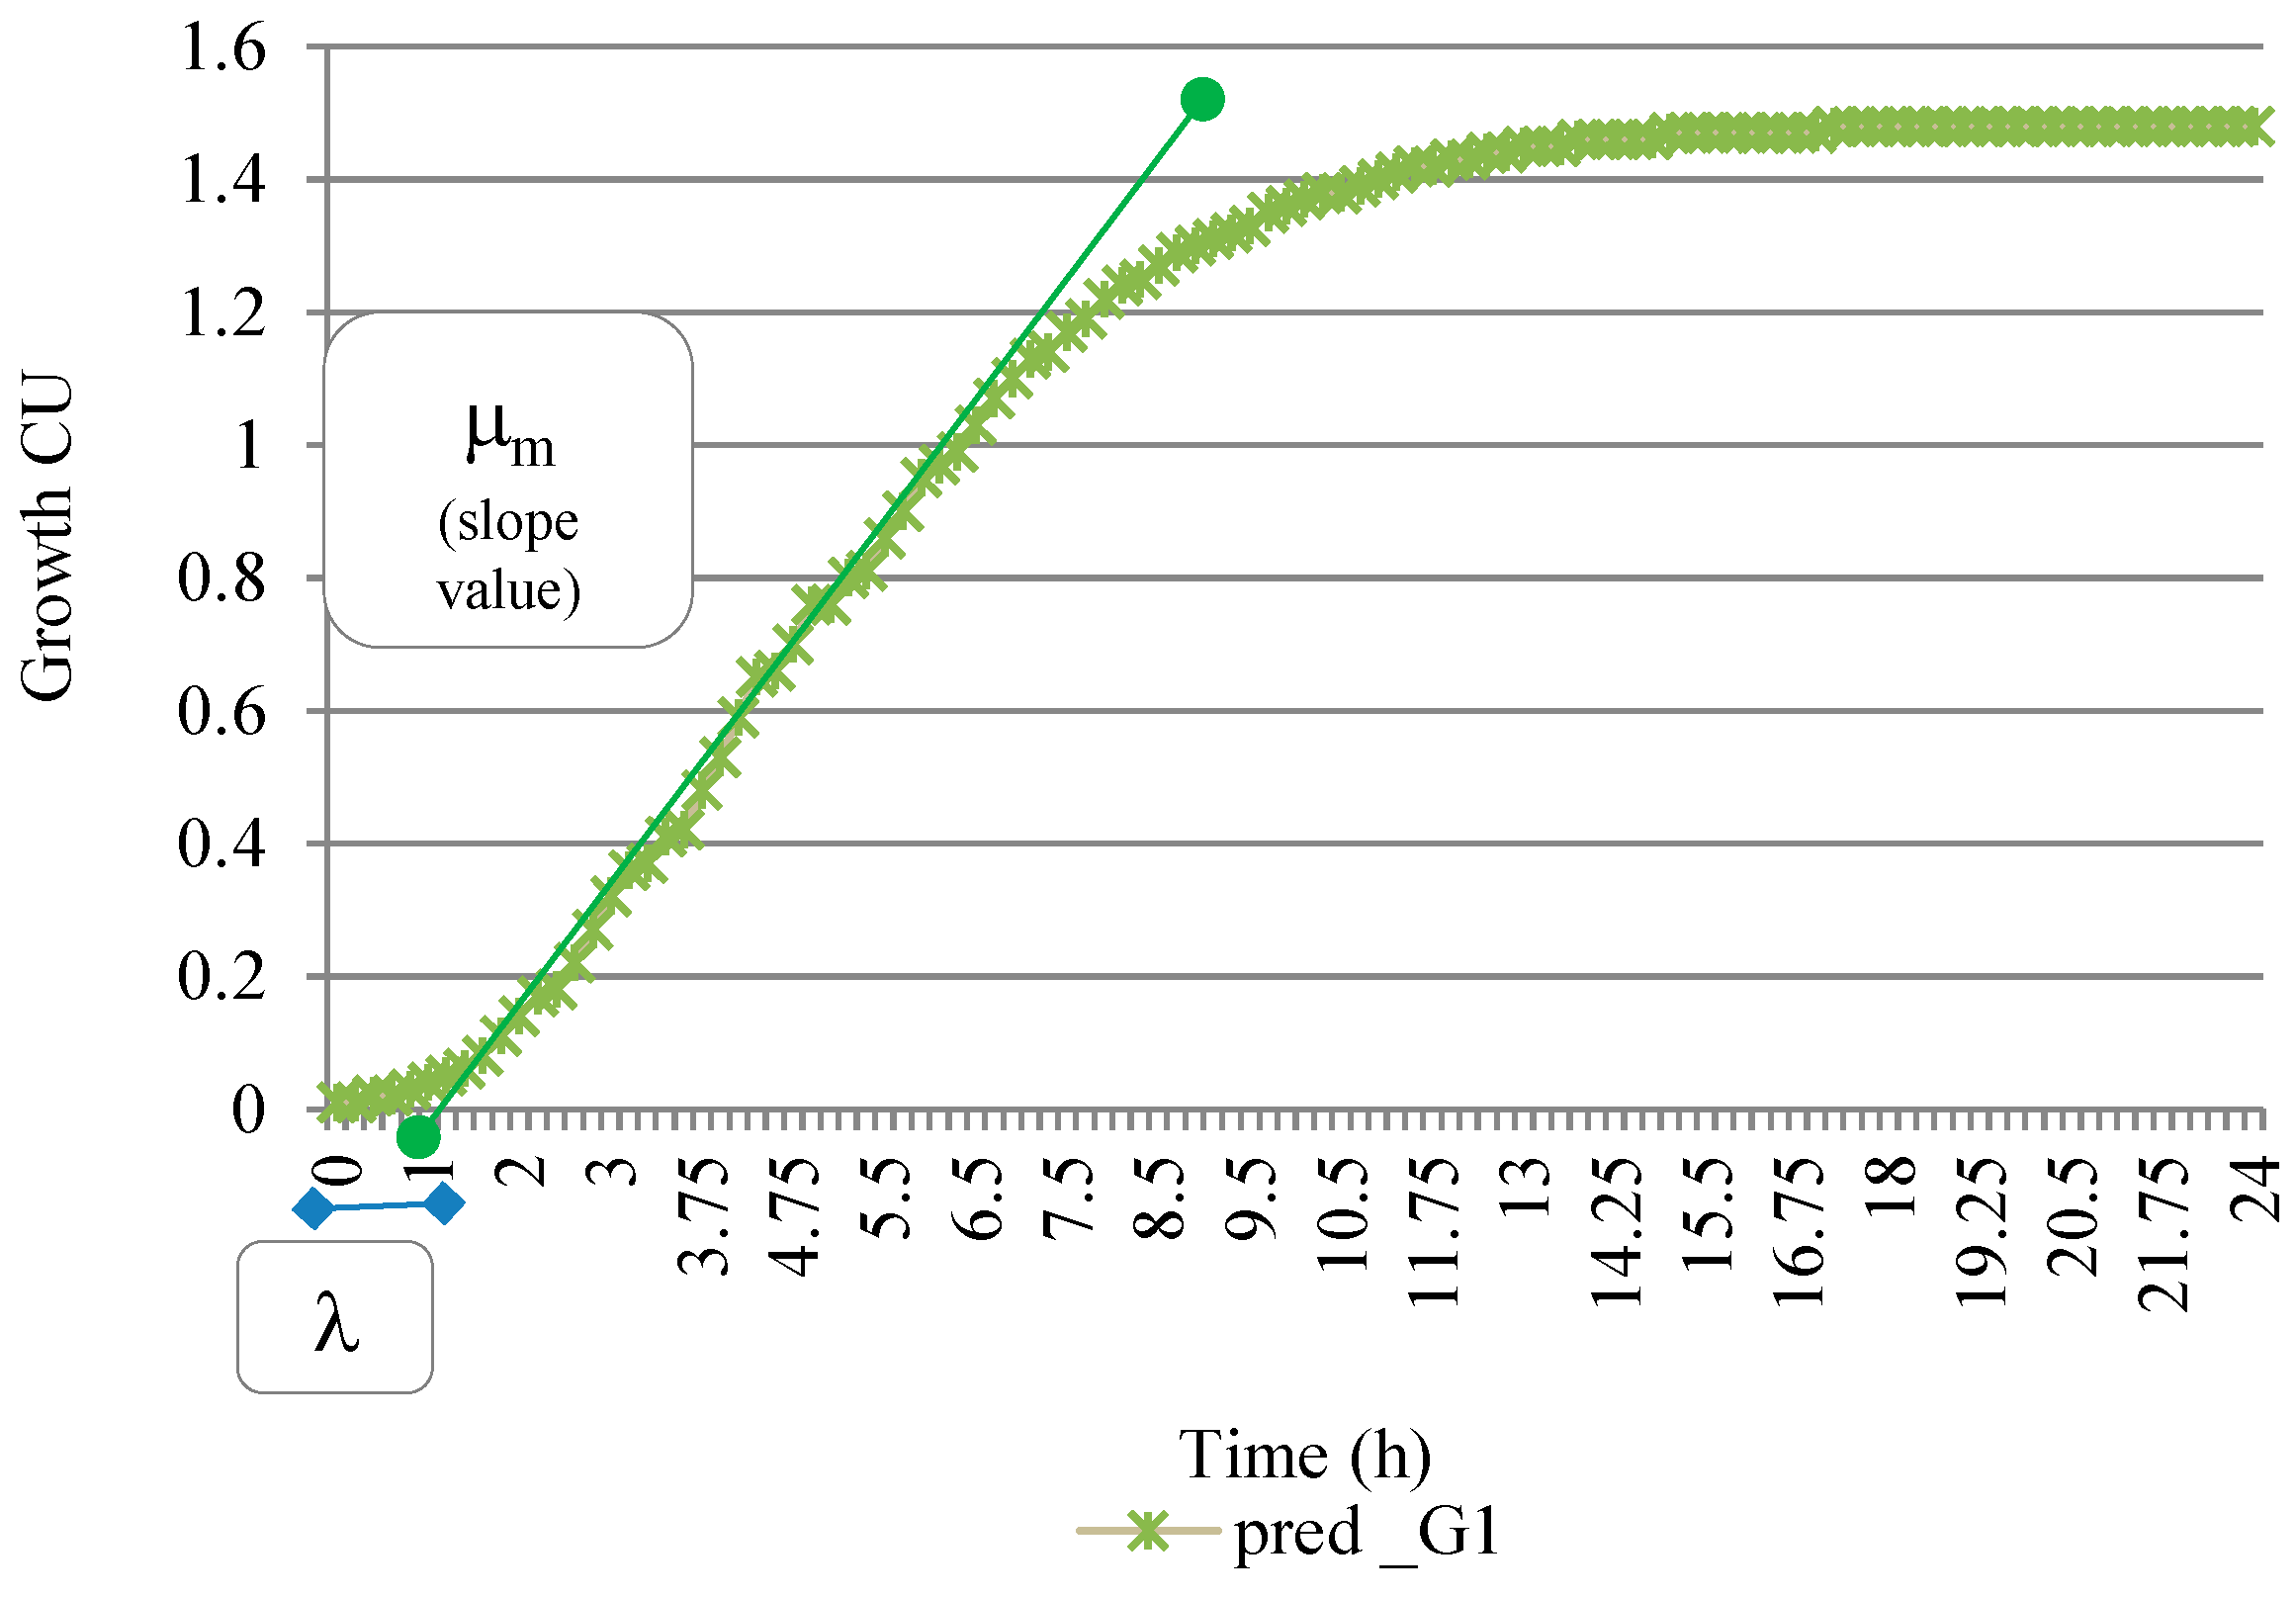
2.6. Growth Characteristics

The three sigmoidal functions were employed to analyze data points obtained on bacterial growth in 24 h in MRS medium to give best-fit exponential curves for each set of data. For all batch runs, the organism entered the stationary phase by 24 h. Since nisin, a primary metabolite of practical significance, is produced by L. lactis NCIM 2114 during its exponential phase this phase was of significant interest to model its growth. Thus, the growth parameters studied for L. lactis were
  • The specific growth rate maxima μ, the slope of the line when the organism grows exponentially and is drawn on the inflection point of the tangent drawn;
  • The lag time, λ, as t, on X-axis intercept of this tangent passed through inflection point on exponential curve;
  • The asymptote (A = “a” computed) as the maximal value of growth reached, t approaching infinity. The decline of growth was not studied.
To derive the above growth parameters, growth data were fitted by nonlinear regression on the original sigmoidal functions: Logistic, Gompertz, and Richards [3,17] with Marquardt algorithm [18] using software SPSS version 20. The algorithm calculated the set of parameter values a, b, c and d within the 95% confidence intervals of the lower and upper bound values of a, b, c and d [3]. The re-parameterized values: a, b, and c derived on the Gompertz function were further used to determine the growth parameters by conversion formulas (see (6), (7) and (8) below) on the modified Gompertz function. The ANOVA tables of the regression sum of squares and residual sum of squares were used for F test.
The conversion formulas for the Gompertz function selected to model growth were:
a = A (asymptotic level A of the growth curve)
c = μ max e a
b = μ max e a λ + 1
The Gompertz function was used to determine the lag time (λ) (elapsed time after inoculation and before the start of exponential growth) and specific growth rate maxima μm, (time from the exponential growth phase) of the organism in each of the batch runs using different agitation and aerations factors, as designed. The formulas used and derived values of the three parameters a, b, and c so obtained was calculated as:
  • Using Equation (6)   a = A
  • Using Equation (7)   μm = ac/e   {Specific growth rate maxima, h−1}
  • Using Equations (7) and (8)   λ = (b − 1)/c   {lag time, h}

3. Results and Discussion

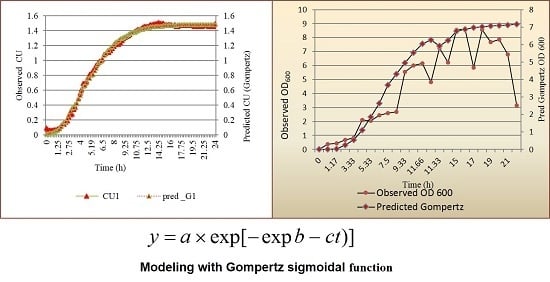
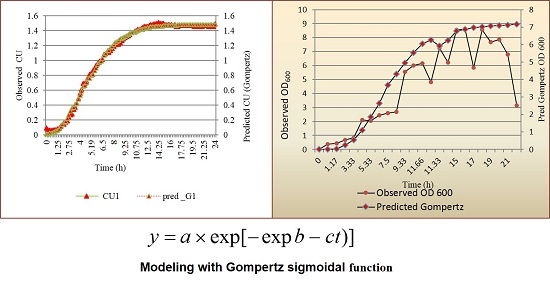
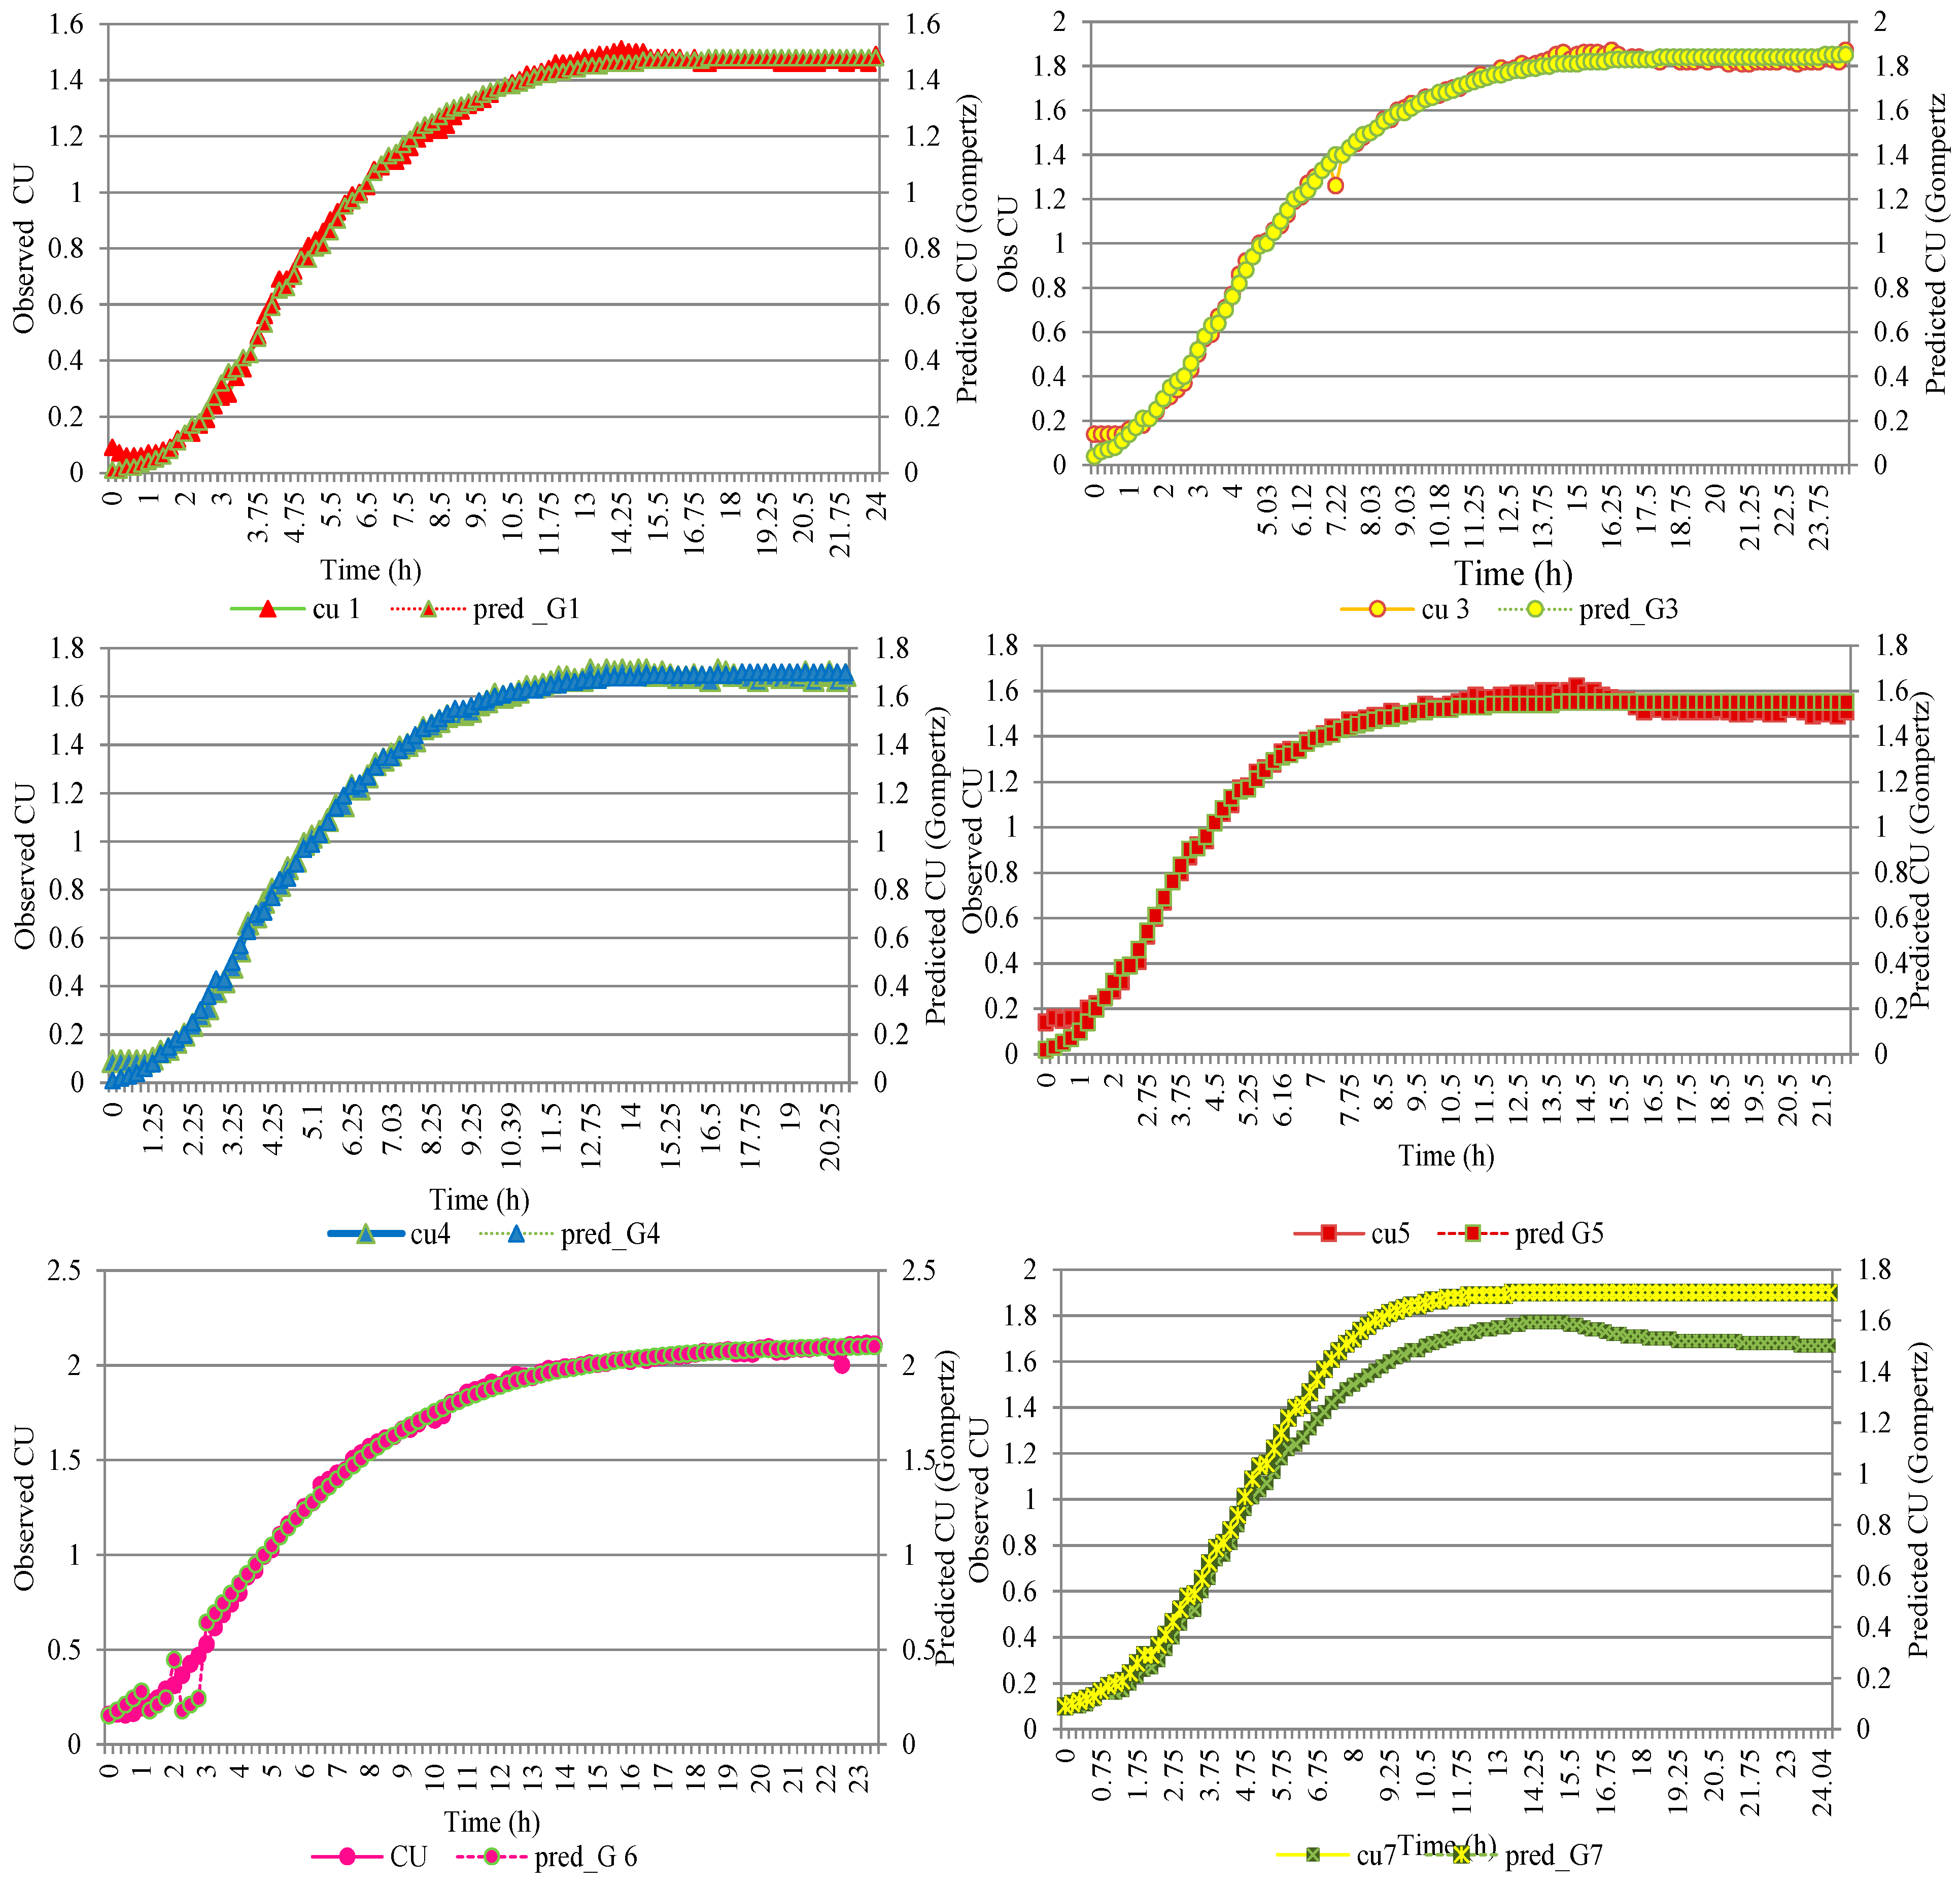
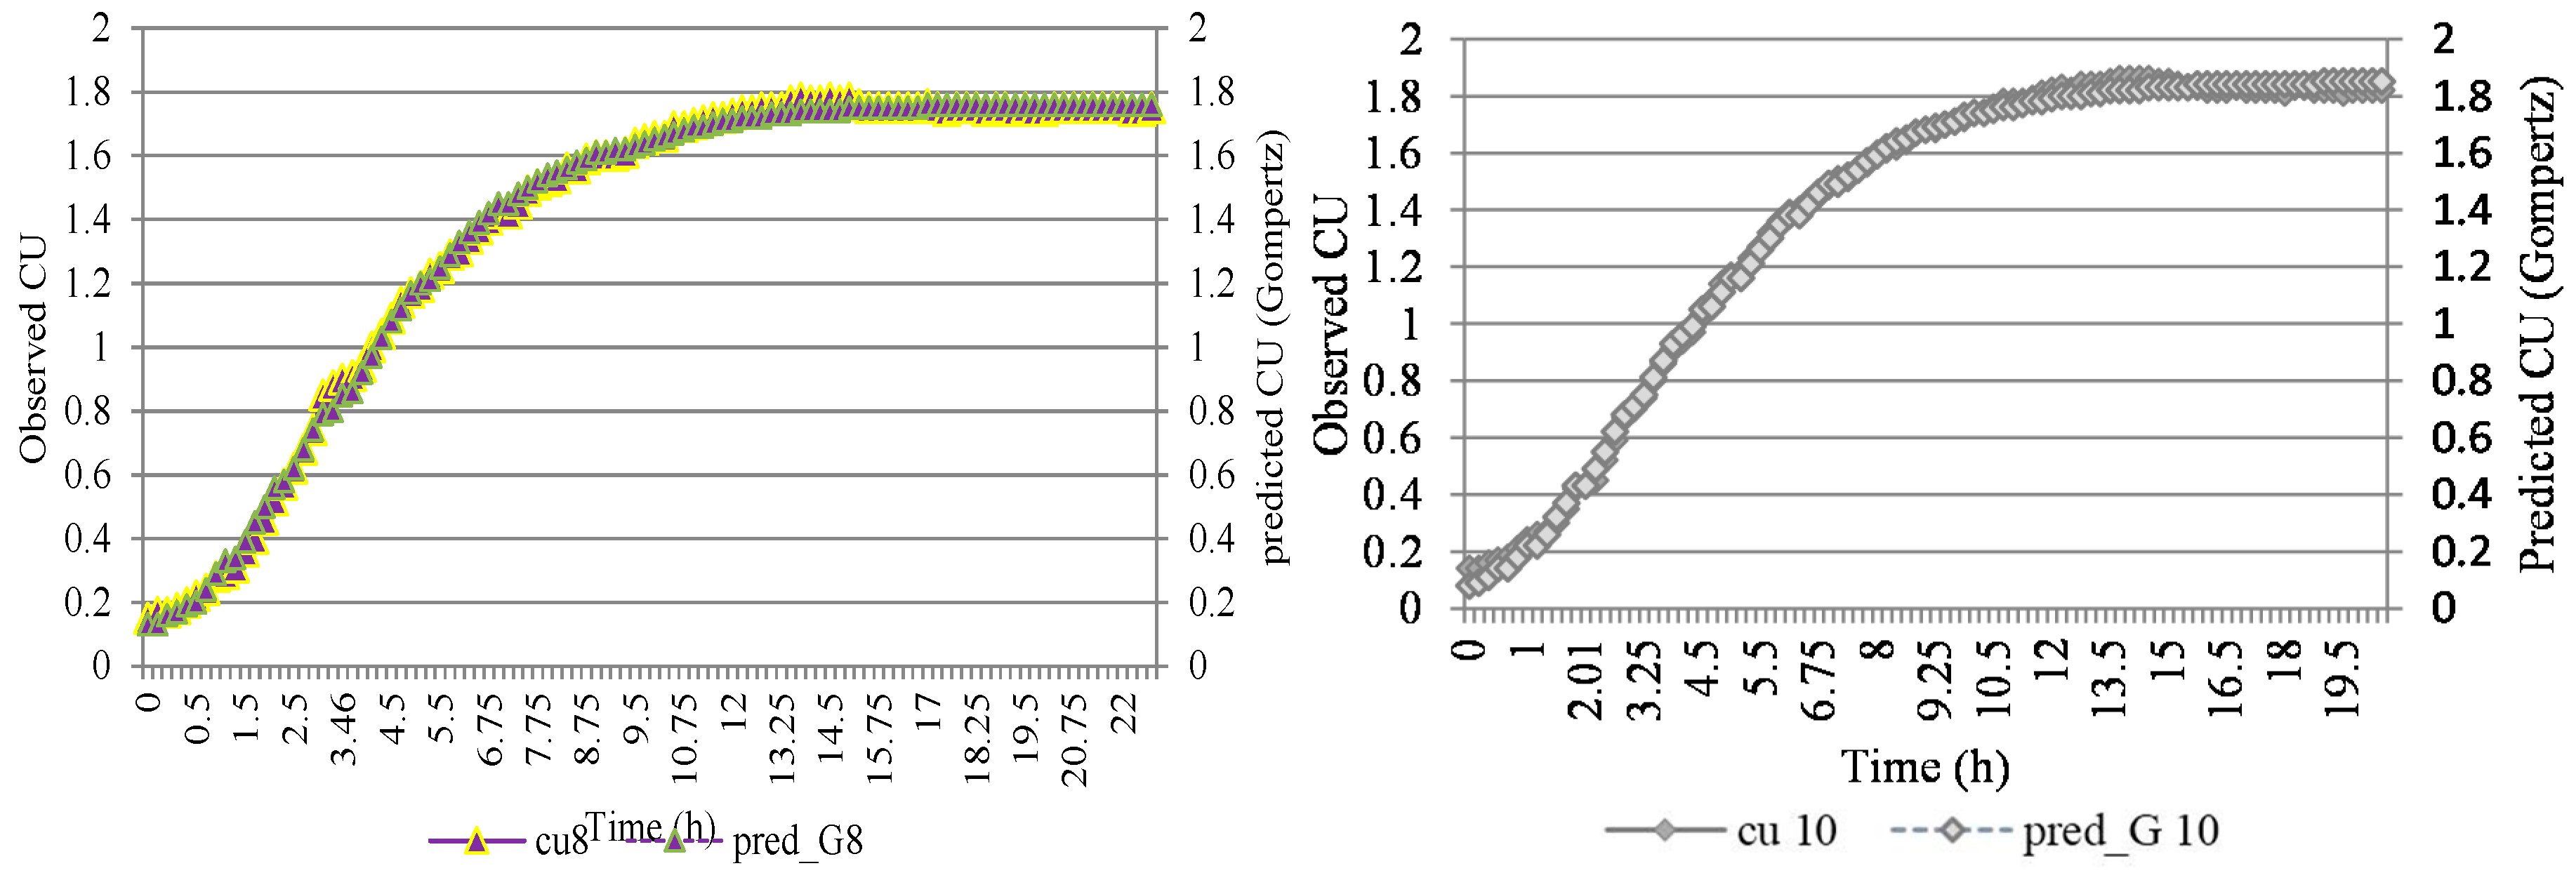
3.1. Modeling Growth of L. lactis

The exponential growth phase of L. lactis was of interest as it produces nisin, a primary antimicrobial metabolite. Growth was followed by recording “CU” as measured spectroscopically. By modeling the exponential phase of the growth period, the parameters a, b, c and d were determined as per the sigmoidal functions shown below (Table 1).
For the nonlinear functions (Logistic, Gompertz, and Richards) used here, the growth data was fitted to determine mathematical parameters, using a Marquardt algorithm with least-squares estimation. It removed the divergence of successive iterates while fitting data points, by the nearest neighborhood method, as it assumed local linearity at each iteration (as in Taylor series) [18]. This algorithm also had the ability to close in rapidly when the converged values were reached, which were usually extremely slow in converging after the first few iterations, if the gradient method was used. Thus this algorithm used for modeling growth by the three nonlinear sigmoidal functions will provide adequate representation of the nonlinear growth. The models fitted by nonlinear regression gave reliable estimates of the multiple correlation coefficients (R2 values at p ≤ 0.01) for the three functions used. They also assess the degree of fit of the models, to each of the experimental data sets, that fell close to 1 (Table 2), where R2 = 1 − (residual sum of squares)/(corrected sum of squares) on the growth curves modeled.
Table 1. Mathematical parameter estimates for all the sigmoidal functions used.
S. NoFactors Used in Different Batch RunsSigmoidal functions
LogisticGompertzRichards
Agitation (rpm)Aeration (vvm)
abcabcabcd
1250.01.463.040.601.481.680.421.480.030.424.09
2250.01.762.920.642.041.340.342.54−0.550.183.30
3250.21.683.000.581.701.620.401.75−1.540.210.70
4250.41.683.020.651.701.660.451.700.140.473.88
5500.01.542.780.761.551.530.534.82−3.410.060.13
6500.02.052.270.432.091.160.302.09−0.070.293.75
7500.21.712.840.621.731.510.431.77−2.090.22−0.36
8500.01.741.970.531.760.970.371.82−1.170.220.04
9500.42.032.040.442.051.020.312.050.333.530.14
10100 0.01.972.610.492.001.340.331.990.140.354.32
111000.21.822.280.561.851.140.381.840.320.443.42
121000.41.822.670.541.841.400.371.88−1.100.241.64
e = 2.71828; Among all the batch runs the maximum nisin content was observed at 4.55 h at S. No 1 run (25 rpm × 0 vvm).
Table 2. Multiple correlation coefficients for all the sigmoidal functions used in different batch runs.
S. NoFactorsR2
Agitation (rpm)Aeration (vvm)
LogisticGompertzRichards
1250.00.9930.9930.997
2250.00.9950.9910.986
3250.20.9920.9980.992
4250.40.9960.9980.998
5500.00.9950.992ND
6500.00.9940.9990.999
7500.20.9970.9950.967
8500.00.9940.9980.989
9500.40.8830.8850.885
101000.00.9960.9980.998
111000.20.9970.9980.999
121000.40.9960.9990.992

3.2. F Test

Of the two three-parameter functions used, the Gompertz function showed a higher acceptance (92%), to model the growth of L. lactis, than the Logistic function (67%), when each was compared to the four-parameter Richards function on fd values (Table 3).
Table 3. Statistical-analytical data for growth curves of L. lactis NCIM 2114.
S. NoRun with Factorsfd Logisticfd GompertzF Valuep Value #
Agitation (rpm)Aeration (vvm)
1250.04.9103.980.05
2250.0−2.07−0.557.000.05
3250.22.18−2.323.980.05
4250.46.120.256.640.22
5500.05.0710.046.970.05
6500.012.440.153.960.05
7500.2−2.89−2.143.980.05
8500.0−0.74−2.937.000.05
9500.40.070.0033.890.05
101000.06.270.303.970.05
111000.25.942.063.960.05
121000.4−0.22−2.533.980.05
% Acceptance of given model: among the 12 batch runs67%92%
Boldface values of fd indicate acceptance of Logistic and Gompertz functions used to model growth as tested against Richards function (at p ≤ 0.05); # Calculated using p value calculator [19]. Among the 15 design points the 12 batch runs shown above: 2 control (center) points and 10 experimental runs, where design points at S. Nos 5, 8, 9, 10, have 2 harvest points in common.

3.3. Derivation of the Growth Characteristics of the Organism

The growth characteristics determined on the non-linear modified Gompertz function could help to calculate A, λ and µ accurately (Figure 1).
The specific growth rates maxima (μmax) and lag time (λ) of the organism, derived by Gompertz function [3], under differently agitated and aerated conditions, were in the range of 0.23 h−1 to 0.30 h−1 and 0 h to 1.63 h respectively (Table 4). It was observed in a different study [20] that the specific growth rate maxima of L. lactis can be as high as 0.91 h−1 under low aeration conditions. They observed more than 90% of the glucose converted to lactate, whereas our study showed about 36% glucose utilization up to five hours and ~57% utilization by eight hours after inoculation during exponential growth (details not reported). The growth of L. lactis modeled by the Gompertz function thus facilitated estimation of the lag time “λ” of the growth and μm of L. lactis, under the conditions in which it was allowed to grow. This information will also help us to study the important primary metabolite nisin that is produced by L. lactis under exponential growth as related to its growth characteristics.
Figure 1. Growth curve of the data “CU” predicted from Gompertz sigmoidal function used to fit curve, showing the tangent on the exponential phase and lag time (λ), and data modeled (data of the curve at S No 1 of Table 2 has been used here).
Fermentation 01 00086 g001
Table 4. The derived maximal specific growth rate and lag time and associate information on the tangent line of exponential growth period of L. lactis under different factors of growth in different batch runs.
S. NoGrowth Factors UsedSpecific Growth Rate Maxima µmax (h−1)Inf pt: t (h)Lag Time λ (h)Time between Lag Time and Inflection Point T (h)
Agitation (rpm)Aeration (vvm)
1250.00.234.041.632.41
2250.00.253.991.022.98
3250.20.254.111.582.53
4250.40.283.711.482.24
5500.00.302.870.991.87
6500.00.233.890.533.36
7500.20.273.521.192.33
8500.00.242.61−0.082.68
9500.40.233.280.063.23
10100 0.00.244.091.033.06
111000.20.262.990.372.62
121000.40.253.801.092.71
The estimated specific growth rate maxima, correlated to the time between lag time and inflection point. The difference between the time of inflection point and the time of lag, correlated significantly (with a coefficient of −0.77) (p ≤ 0.01). In other words, a decrease in time between lag time and inflection point showed an increase in the maximum maximal specific growth rate of the organism. On the other hand, if the lag time increased, the time at which the inflection point formed was also delayed correlated to as much as 0.69 (p ≤ 0.01) coefficient of correlation (Table 5).
Table 5. Correlations between the different growth characteristics under batch runs.
One Tailed Correlations Specific Growth Rate Maxima: µmax(h−1)Inflection Point: t (h)Lag Time: λ (h)Time between Lag Time and Inflection Point: T (h)
Maximum specific growth rate µmax1
Infpt: t−0.391
Lag time: λ(h)0.230.691
Time between lag time and inflection point: T(h)−0.770.30−0.491
The three functions used to model growth showed high R2 values on the predicted data sets of growth modeled (Table 2) indicate high predictability. The Gompertz function to model growth of the L. lactis as observed (in CU). See the close/overlapping predicted values on (Figure 2) the growth data.
Figure 2. Growth curves of the data “CU” observed and predicted values on data fitted with Gompertz sigmoidal function to model growth (Data of the curves at S No 1, 3, 4, 5, 6, 7, 8, 10 of Table 1 and Table 2 are shown).
Fermentation 01 00086 g002aFermentation 01 00086 g002b
This study is a new report on the use of concentration units “CU” as a measure of growth of L. lactis, modeled using sigmoidal growth functions on statistical software to derive its growth characteristics λ, µ and inflection point of L. lactis. The method involved measurements of “CU” at close intervals of time with a probe inserted directly into the bioreactor. The growth data was then downloaded and used to compute mathematical parameters a, b, c and d instantaneously on the three sigmoidal functions used to fit growth data, by Marquardt algorithm. The SPSS software package was used. This method calculated accurate, reliable values. Gompertz function yielded the most acceptable values.

4. Conclusions

The sigmoidal functions used to model the growth of L. lactis, showed their suitability to fit growth data of L. lactis. Since the Gompertz function had higher acceptability to model growth of L. lactis, it was used to derive the growth characteristics. Under the different growth factors (of aeration and agitation), the specific growth rates and lag time were derived from the mathematical parameters a, b and c on the Gompertz Sigmoidal function used. Thus, we have demonstrated that the use of a stochastic model along with the use of a statistical package software that can be a very precise and useful tool to study the exponential growth of L. lactis. Since the organism is an important lactic acid bacterium that produces a primary metabolite “nisin” early in the exponential phase, this study helps to understand lag and specific growth rate(s) which can be used to best grow the organism. This report offers a novel mechanistic approach to determine such growth characteristics.

Acknowledgments

The study was conducted under a collaborative research program that was generously funded by The University of North Carolina at Pembroke, NC, USA. The work was carried out at The Sartorius Stedium Biotechnology Lab, UNCP, NC USA. The authors are thankful to ICAR. The authors are also thankful to ICAR for allowing the collaboration program to happen. The author is grateful to Laboratory Managers Floyd Inman and Carolyn Parsons for their assistance.

Author Contributions

Conceptualization and experimental work: Sunita Singh, Leonard Holmes and Siva Mandjiny; Manuscript preparation: Singh Sunita, Leonard Holmes; Statistical data analysis: Kamalesh N. Singh.

Conflicts of Interest

The authors declare no conflict of interest.

References

  1. Dalgaard, P.; Koutsoumanis, K. Comparison of maximum specific growth rates and lag time estimated from absorbance and viable count data by different mathematical models. J. Microbiol. Methods 2001, 43, 183–196. [Google Scholar] [CrossRef]
  2. Annadurai, G.; Rajesh Babu, S.; Srinivasamurthy, V.R. Development of mathematical models (Logistic, Gompertz and Richards models) describing the growth pattern of Pseudomonas putida (NICM 2174). Bioproc. Eng. 2000, 23, 607–612. [Google Scholar] [CrossRef]
  3. Zwiettering, M.H.; Jongenburger, I.; Rombouts, F.M.; van’T Riet, K. Modeling of the bacterial growth curve. Appl. Environ. Microbiol. 1990, 56, 1875–1881. [Google Scholar]
  4. Kristel, B.; Els, D.; Karen, V.; Geeraerd, A.H.; Standaert, A.R.; Devlieghere, F.; Debevere, J.; van Impe, J.F. Concepts and Tools for Predictive Modeling of Microbial Dynamics. J. Food Prot. 2004, 67, 2041–2052. [Google Scholar]
  5. Frederick, B.; Fleming, H.P. Modeling of the Competitive Growth of Listeria monocytogenes and Lactococcus lactis in Vegetable Broth. Appl. Environ. Microbiol. 1998, 64, 3159–3165. [Google Scholar]
  6. Matthias, K.; Guido, H.; Hella, L.-F.; Jost, L.; Maik, K. Grofit: Fitting Biological Growth Curves with R. J. Stat. Softw. 2010, 33, 1–21. [Google Scholar]
  7. Birch, C.A. new generalized logistic sigmoid growth equation compared with the Richards growth equation. Ann. Bot. 1999, 83, 713–723. [Google Scholar] [CrossRef]
  8. De Vuyst, L.; Vandamme, E.J. Influence of the carbon source on nisin production in Lactococcus lactis subsp. lactis batch fermentations. J. Gen. Microbiol. 1992, 138, 571–578. [Google Scholar] [CrossRef] [PubMed]
  9. Van Impe, J.F.; Nicolaï, B.M.; Martens, T.; de Baerdemaeker, J.; Vandewalle, J. Dynamic mathematical model to predict microbial growth and inactivation during food processing. Appl. Environ. Microbiol. 1992, 58, 2901–2909. [Google Scholar]
  10. STR, Sartorius. BIOSTAT Fermenter Systems Handbook—Laboratory Scale Fermenters, Pilot and Production Plant Fermenters: BIOSTAT- A-plus; Sartorius BBI Systems GmbH: Melsungen, Germany, 2005; pp. 1–14. [Google Scholar]
  11. American Public Health Association. Standard Methods for the Examination of Water and Wastewater, 19th ed.; Eaton, A.D., Clesceri, L.S., Greenberg, A.E., Eds.; Washington, DC, USA, 1995; pp. 4–99. [Google Scholar]
  12. Senese, F. How can I Predict Oxygen Solubility in Water? Available online: http://antoine.frostburg.edu/chem/senese/101/solutions/faq/predictingDO.shtml (accessed on 2 May 2014).
  13. Schleifer, K.H.; Kraus, J.; Dvorak, C.; Kilpper-Bälz, R.; Collins, M.D.; Fischer, W. Transfer of Streptococcus lactis and related streptococci to the genus Lactococcus gen. nov. System. Appl. Microbiol. 1985, 6, 183–195. [Google Scholar] [CrossRef]
  14. De Man, J.C.; Rogosa, M.; Sharpe, M.E. A medium for the cultivation of lactobacilli. J. Appl. Microbiol. 1960, 23, 130–135. [Google Scholar] [CrossRef]
  15. Behnken, D.W.; Draper, N.R. Residuals and their variance patterns. Technometrics 1972, 14, 101–111. [Google Scholar] [CrossRef]
  16. Timm, N.H. Appendix Tables -Upper percentage points of the F distribution. In Applied Multivariate Analysis; Pub Springer: Secaucus, NJ, USA, 2002. [Google Scholar]
  17. Gompertz, B. On the nature of the function expressive of the law of human mortality, and on a new mode determining the value of life contingencies. Philos. Trans. R. Soc. Lond. 1825, 115, 513–585. [Google Scholar] [CrossRef]
  18. Marquardt, D.W. An algorithm for least-squares estimation of nonlinear parameters. J. Soc. Ind. Appl. Math. 1963, 11, 431–441. [Google Scholar] [CrossRef]
  19. Soper, D. p Value Calculator. Available online: http://www.danielsoper.com/statcalc3/calc.aspx?id=7 (accessed on 23 August 2014).
  20. Mikkel, N.; Jensen, S.; Bang, N.; John, W. Glucose metabolism in Lactococcus lactis MG1363 under different aeration conditions: Requirement of acetate to sustain growth under microaerobic conditions. Appl. Environ. Microbiol. 2003, 69, 3462–3468. [Google Scholar]

