1. Introduction
In recent years, polymer nanocomposites fiber microstructures have received great attention due to improved physical properties, such as higher mechanical stability, improved thermal properties, non-toxicity, and more possibilities of modification than the original polymer matrix. This allows the use of these composites in various commercial applications, such as biomedical materials [
1], gas filtration membranes [
2], water harvesting [
3,
4,
5], catalytic membrane [
6], polymer electrolytes [
7,
8,
9], and energy harvesting [
10,
11,
12,
13].
One of the best polymers such as polyvinylidene fluoride (PVDF) and copolymers of poly(vinylidene fluoride) and poly trifluoroethylene viz. P(VDF-TrFE) are perspective materials to produce flexible lightweight piezoelectric materials to be utilized in energy harvesting applications [
13,
14]. Organic materials which possess notable piezoresponse are highly demanded by industry to produce piezoelectric sensors, actuators, transducers as well as bioMEMS [
15]. During the last years, the nanocomposites based on PVDF and graphene (graphene oxides) became a subject of particular scientific interest [
16].
In spite of a number of studies dedicated to chemical, electric and pyroelectric properties of P(VDF-TrFE) based nanocomposites, the effect of GO adding on the mentioned properties is still unclear. Influence of the surface and boundary effects, especially in composite materials can significantly enhance the ability to tune their fundamental properties. Adding of graphene oxide into the PVDF nanofibers leads to a change in transport properties of the composites as GO flakes act as charge trapping centers which is perspective for production of charge storage materials [
17].
Many investigations focus on relevant experimental studies and theoretical modeling of the state of polarization and electrical characteristics of nanocomposites with P(VDF-TrFE) under the influence of various external factors such as electric field, illumination, thermal and mechanical gradients, and will allow to reveal the mechanism of dipole ordering of the polymer matrix, changing its degree of crystallinity in the presence of graphene inclusions, and will evaluate the stability of their functional properties, especially piezoelectric and pyroelectric [
18].
The main objective of the study is focused on the synthesis of nanocomposite fiber materials based on polymer polyvinylidene fluoride and its copolymers with graphene oxide using atomic/piezo force microscopy.
2. Experimental and Computational Details
Graphene oxide (GO) was prepared by the chemical exfoliation of graphite (Graphite powder, size < 45 μm, purity ≥ 99.99%, Sigma-Aldrich, St. Louis, MO, USA) [
19]. Briefly, a controlled reaction of graphite flakes with concentrated H
2SO
4 and KMnO
4 was done to obtain individual sheets of graphene oxide. After extensive washing with distilled water, the resultant suspension was subjected to filtration and centrifugation before dialyses to remove ionic contaminants. Finally, the resulting GO slurry was dried by lyophilization to avoid aggregation.
For the composite sample preparation, copolymer of poly (vinylidene fluoride-trifluoroethylene) with 30% TrFE content was used as it favors a crystallization of PVDF directly into the ferroelectric phase. In 100 mL solvent of dimethyl sulfoxide (DMSO) and acetone in 80/20 ratio, 4 grams of copolymer powder was dissolved and stirred for 2 h at a temperature of 100 °C. The solution was then carefully filtered to remove impurities. Different mixture with varying concentrations of GO were prepared by adding dried GO powder in the prepared solvent. The mixtures were then sequentially subjected to magnetic stirring for 30 min at 50 °C, ultrasonication for 1 h and magnetic stirring for 3 h at 50 °C to obtain a homogeneous distribution of GO in the solution. Nanocomposite fibers were prepared by electrospinning method (NANON-01A) using P(VDF-TrFE)/GO (0–20 wt %) solutions. The polymer composite solution placed in a plastic syringe was deposited on aluminum substrate via electrospinning method with a rate of 0.2–0.4 mL/h.
Atomic Force Microscopy (AFM) measurements were performed using Veeco Multimode Nanoscope microscope (Michigan Tech, Houghton, MI, USA). During EFM (Electric Force Microscopy, Park System, Suwon, Korea) measurements a conducting AFM tip senses an electric force gradient due to a difference in phase shift estimated at first pass (topography scan) and second pass when the tip is lifted to about 100 nm height. The map of the electric field gradient was constructed using the phase difference signal. To measure the work function of the sample surface the Kelvin Probe Force Microscopy (KPFM, Park System, Suwon, Korea) mode was utilized. Local piezoresponse of the fibers were measured using piezoresponse force microscopy (PFM) method [
20].
Piezoresponse force microscopy relies on the linear strain response as a function of the external electric field. Regardless of this linear response that is inherent to materials without center of inversion symmetry, all materials dispose of a quadratic strain response in the electric field, known as electrostriction. Electrostriction, therefore, provides a local electromechanical response at the second harmonic of the AC (alternating current) voltage in piezoresponse force microscopy. This electrostrictive response itself provides valuable insight into the material properties. It becomes particularly interesting for the systems where the symmetry of the crystal does not allow a distinctive mode of deflection of the AFM, especially for lateral deflections. In this scenario, this type of microscopy provides a powerful imaging tool for local material defects like misfit dislocations.
Several molecular models for PVDF (in usual β-phase, which can be in polar ferroelectric phase) and graphene oxide as common composite ferroelectrics systems were developed and investigated using software HyperChem 7.51 and 8.0 (Gainesville, FL, USA) [
21]. Different computational methods were used, such as the molecular mechanics (MM) methods (including MM+, Amber, BIO CHARM), quantum mechanical (QM) self-consistent field (SCF) Hartree-Fock (HF) calculations, as well as semi-empirical methods (such as AM1, PM3, ZINDO-1), in the restricted Hartree-Fock (RHF) and unrestricted Hartree-Fock (UHF) approximations. The aim of the usage of both the MM and QM methods used for molecular modeling is to search and to obtain the minimum of total or potential energy surface (PES), of the investigated molecular systems which correspond to optimal atomic configuration of the system. The optimization of molecular systems and finding of their optimal geometry is executed in this work using the Polak–Ribere (conjugate gradient method) algorithm, which determines an optimized geometry at their minimum total energy point (using PES). These various computational methods were used for the detailed debugging, validation and testing of the models. But for final current calculations of the optimized models the next methods—BIO CHARM and PM3 in RHF approximations were used.
For randomly oriented grain the components of piezoelectric tensor
dij are the linear combination of the tensor components associated with principal crystal axes and Euler angles [
22]. For unclamped grain with electrodes, the measured piezoresponse is determined by relative piezoelectric coefficients (viz.
d33,
d31, and
d15) and also depending on the orientation of the grain at the substrate. For grains oriented along the
c-axes the piezoelectric strain is associated with
d33 coefficient and depends on the phase shift between the applied field and obtained displacement. Zero phase shift corresponds to upward orientation of the displacement and respectively a “positive” orientation of piezoresponse signal, while 180 degree of the phase shift corresponds to “negative” orientation of the polarization in the grains.
3. Results
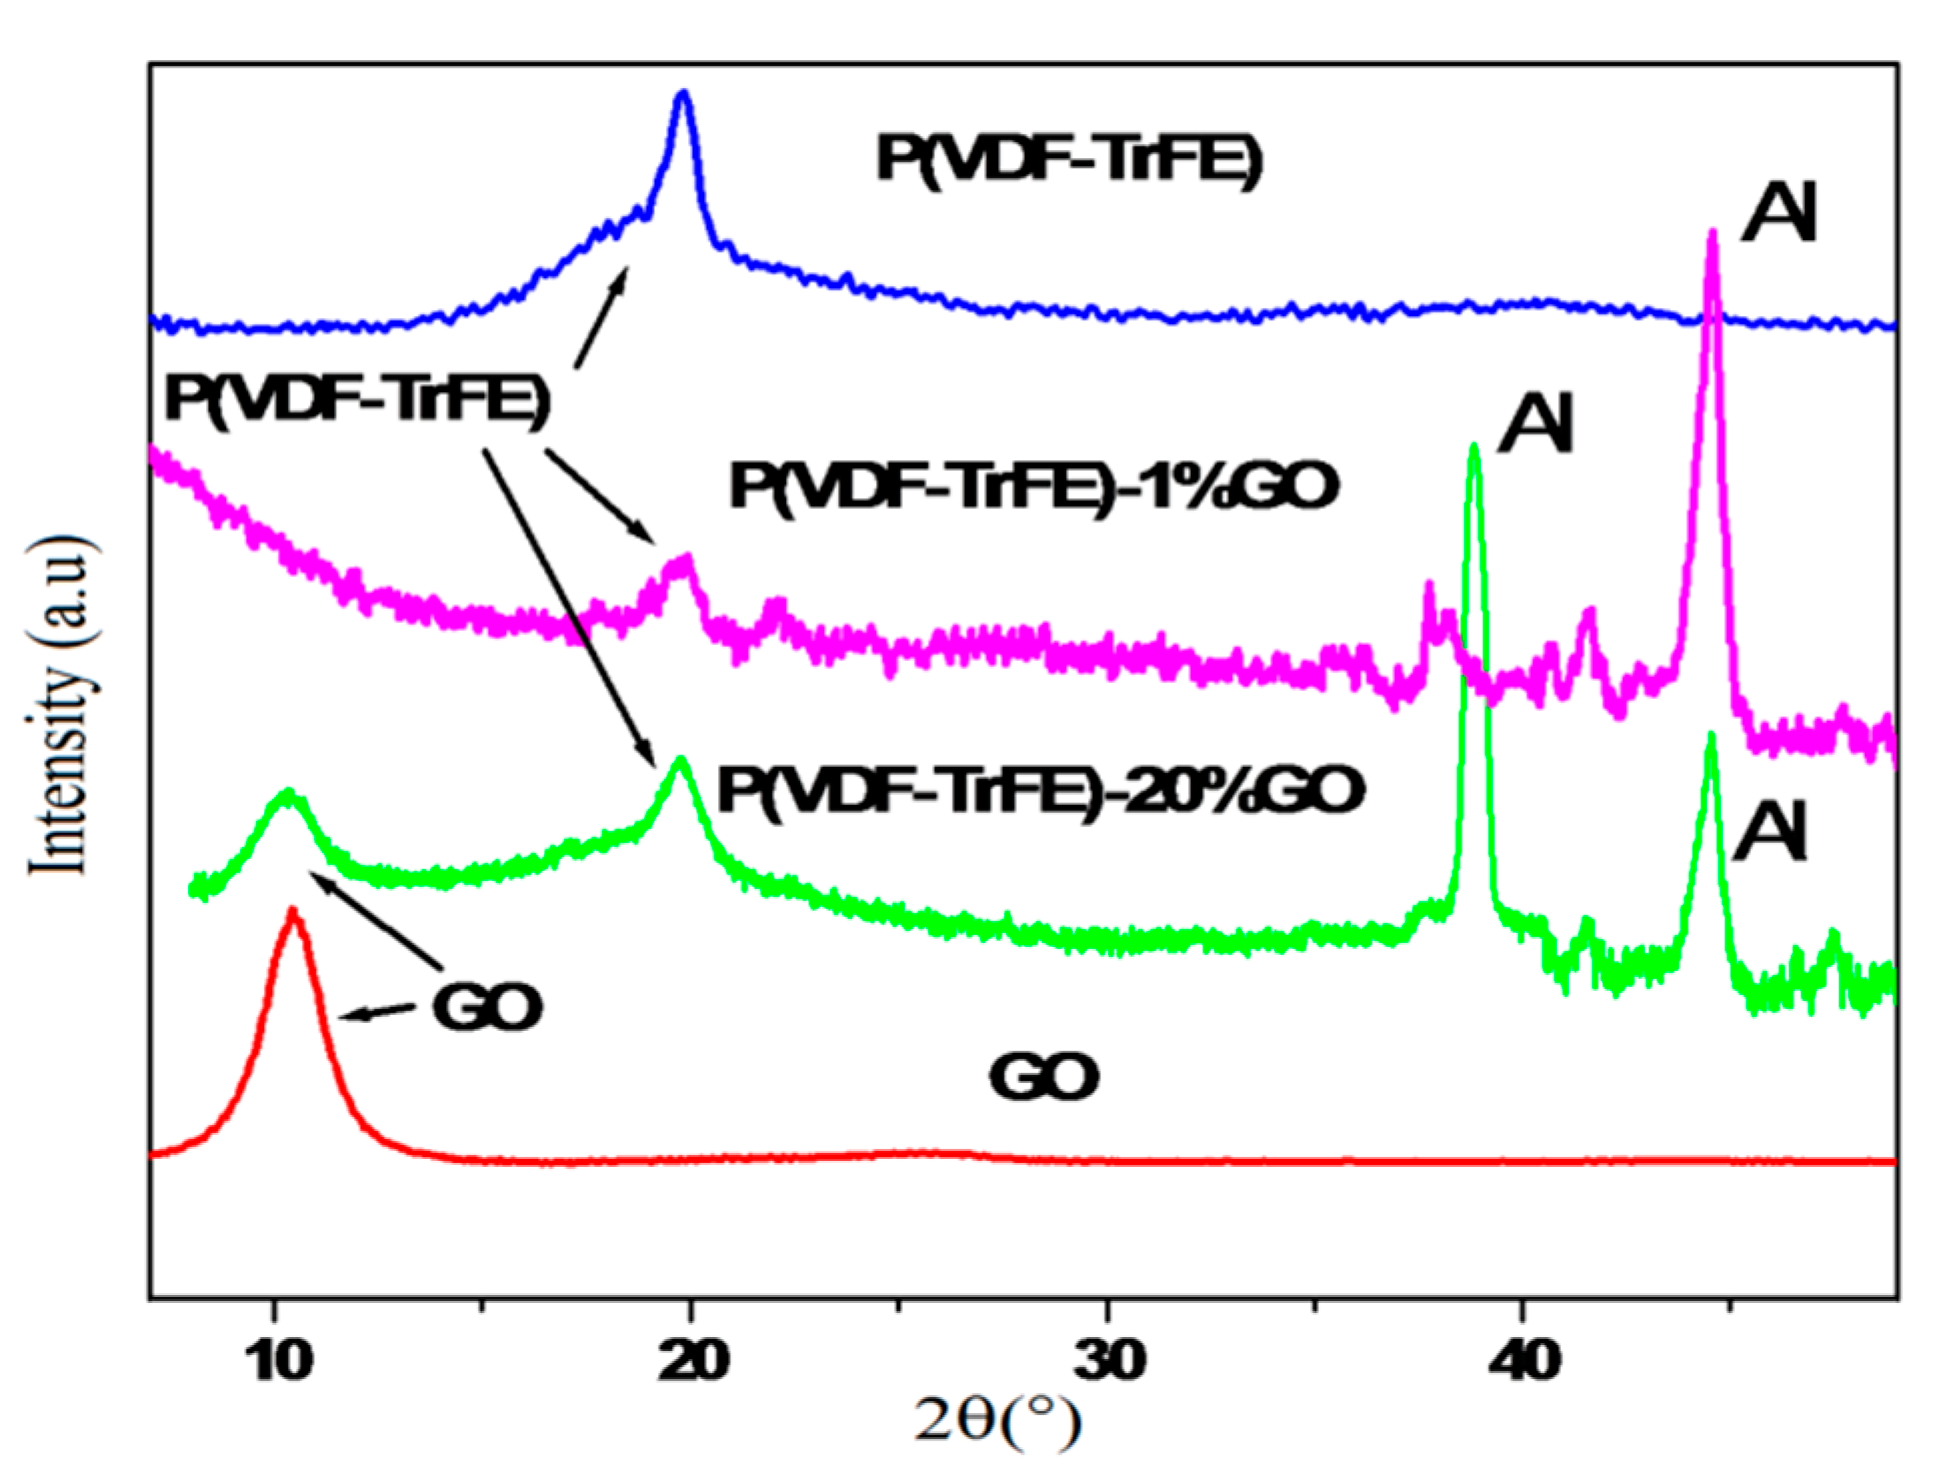
Figure 1 shows X-ray diffraction (XRD) pattern (2θ = 8–50° scan) for P(VDF-TrFE)-Graphene oxide/Al, P(VDF-TrFE) and Graphene oxide. The strong peaks on these diffraction patterns corresponding to GO, Al and P(VDF-TrFE) can distinctively be seen. The XRD patterns of GO contain broad diffraction peak (002) located at 10.3°. It corresponds to d = 8.15Å. In the mixed sample (20% GO) we can observe the peaks from Al, P(VDF-TrFE) and GO phases. Initial P(VDF-TrFE) and P(VDF-TrFE)-Graphene oxide/Al fibers contain two main phases: polar active phase—named α and non-polar phase—β-phase [
23].
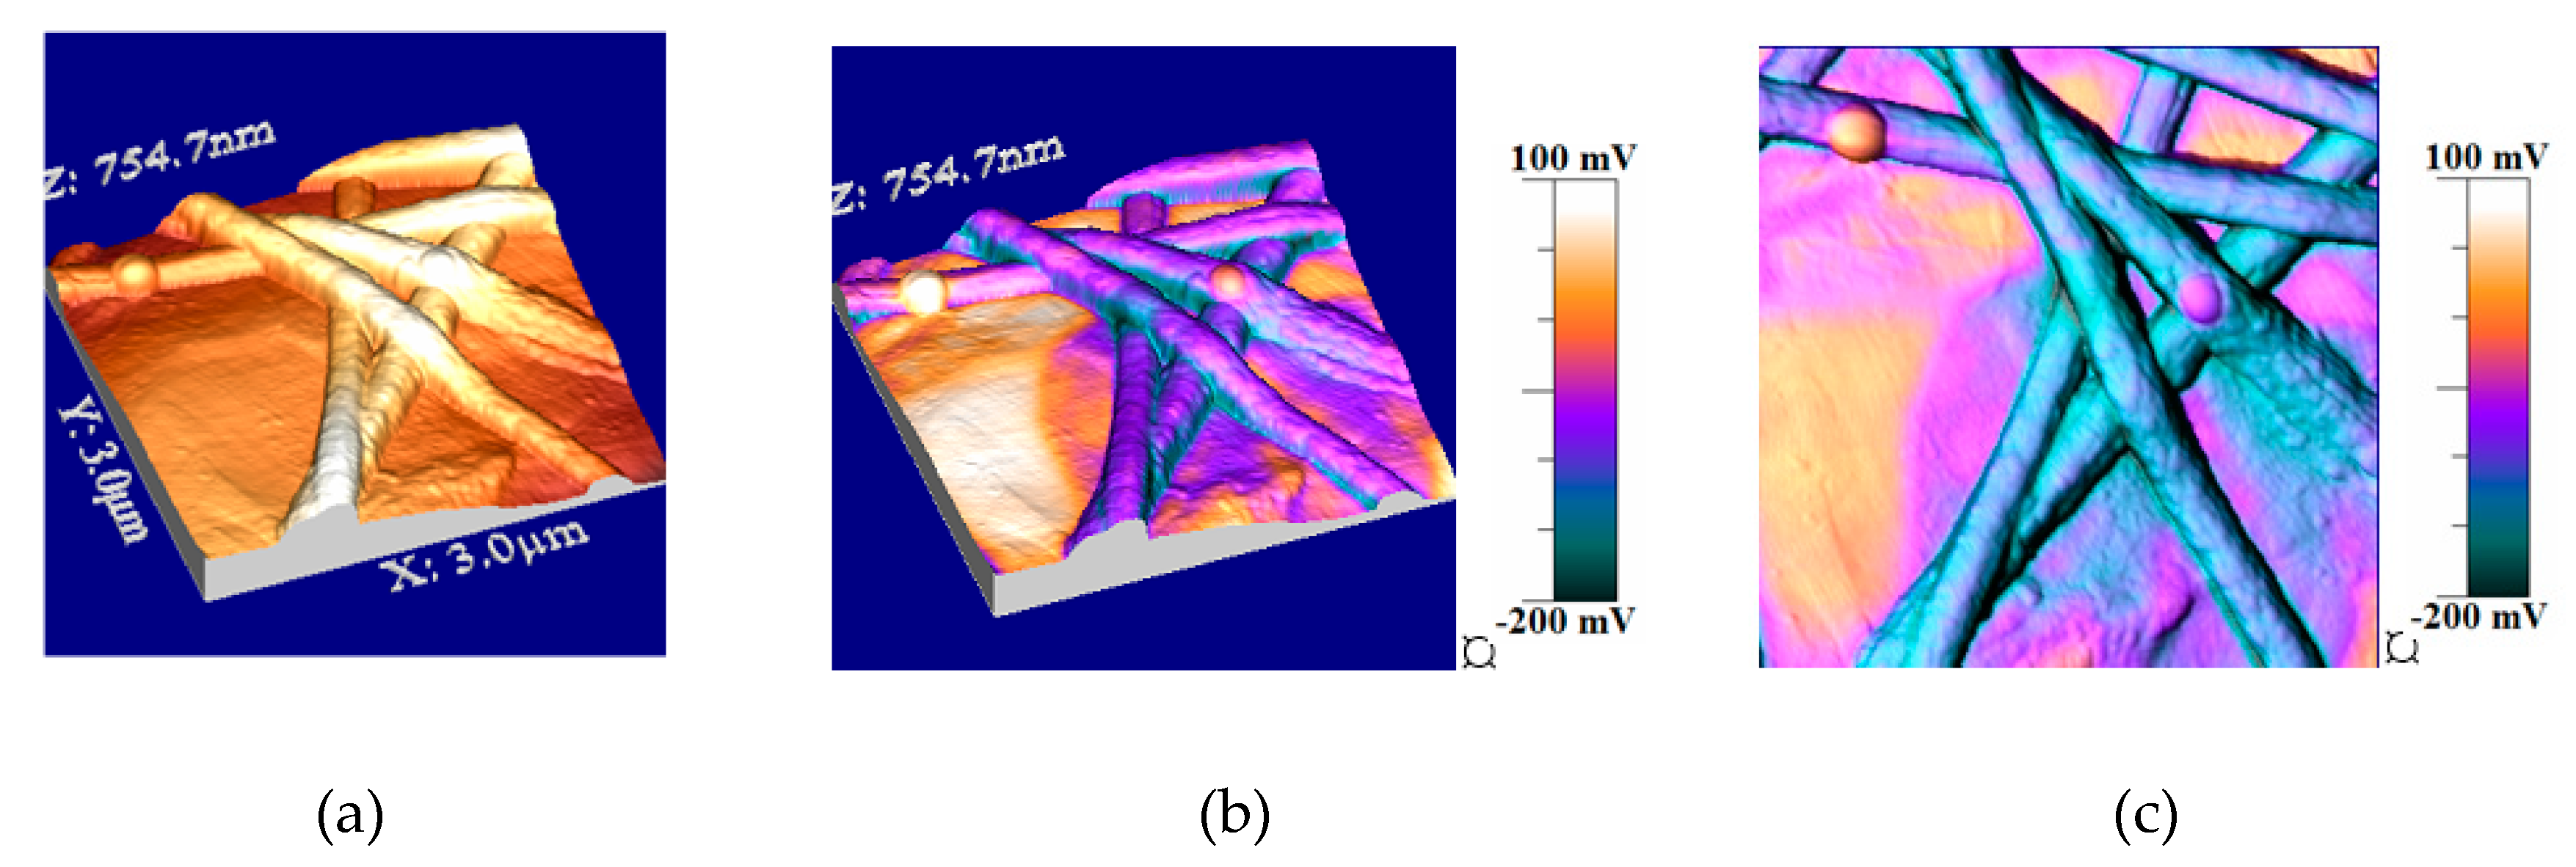
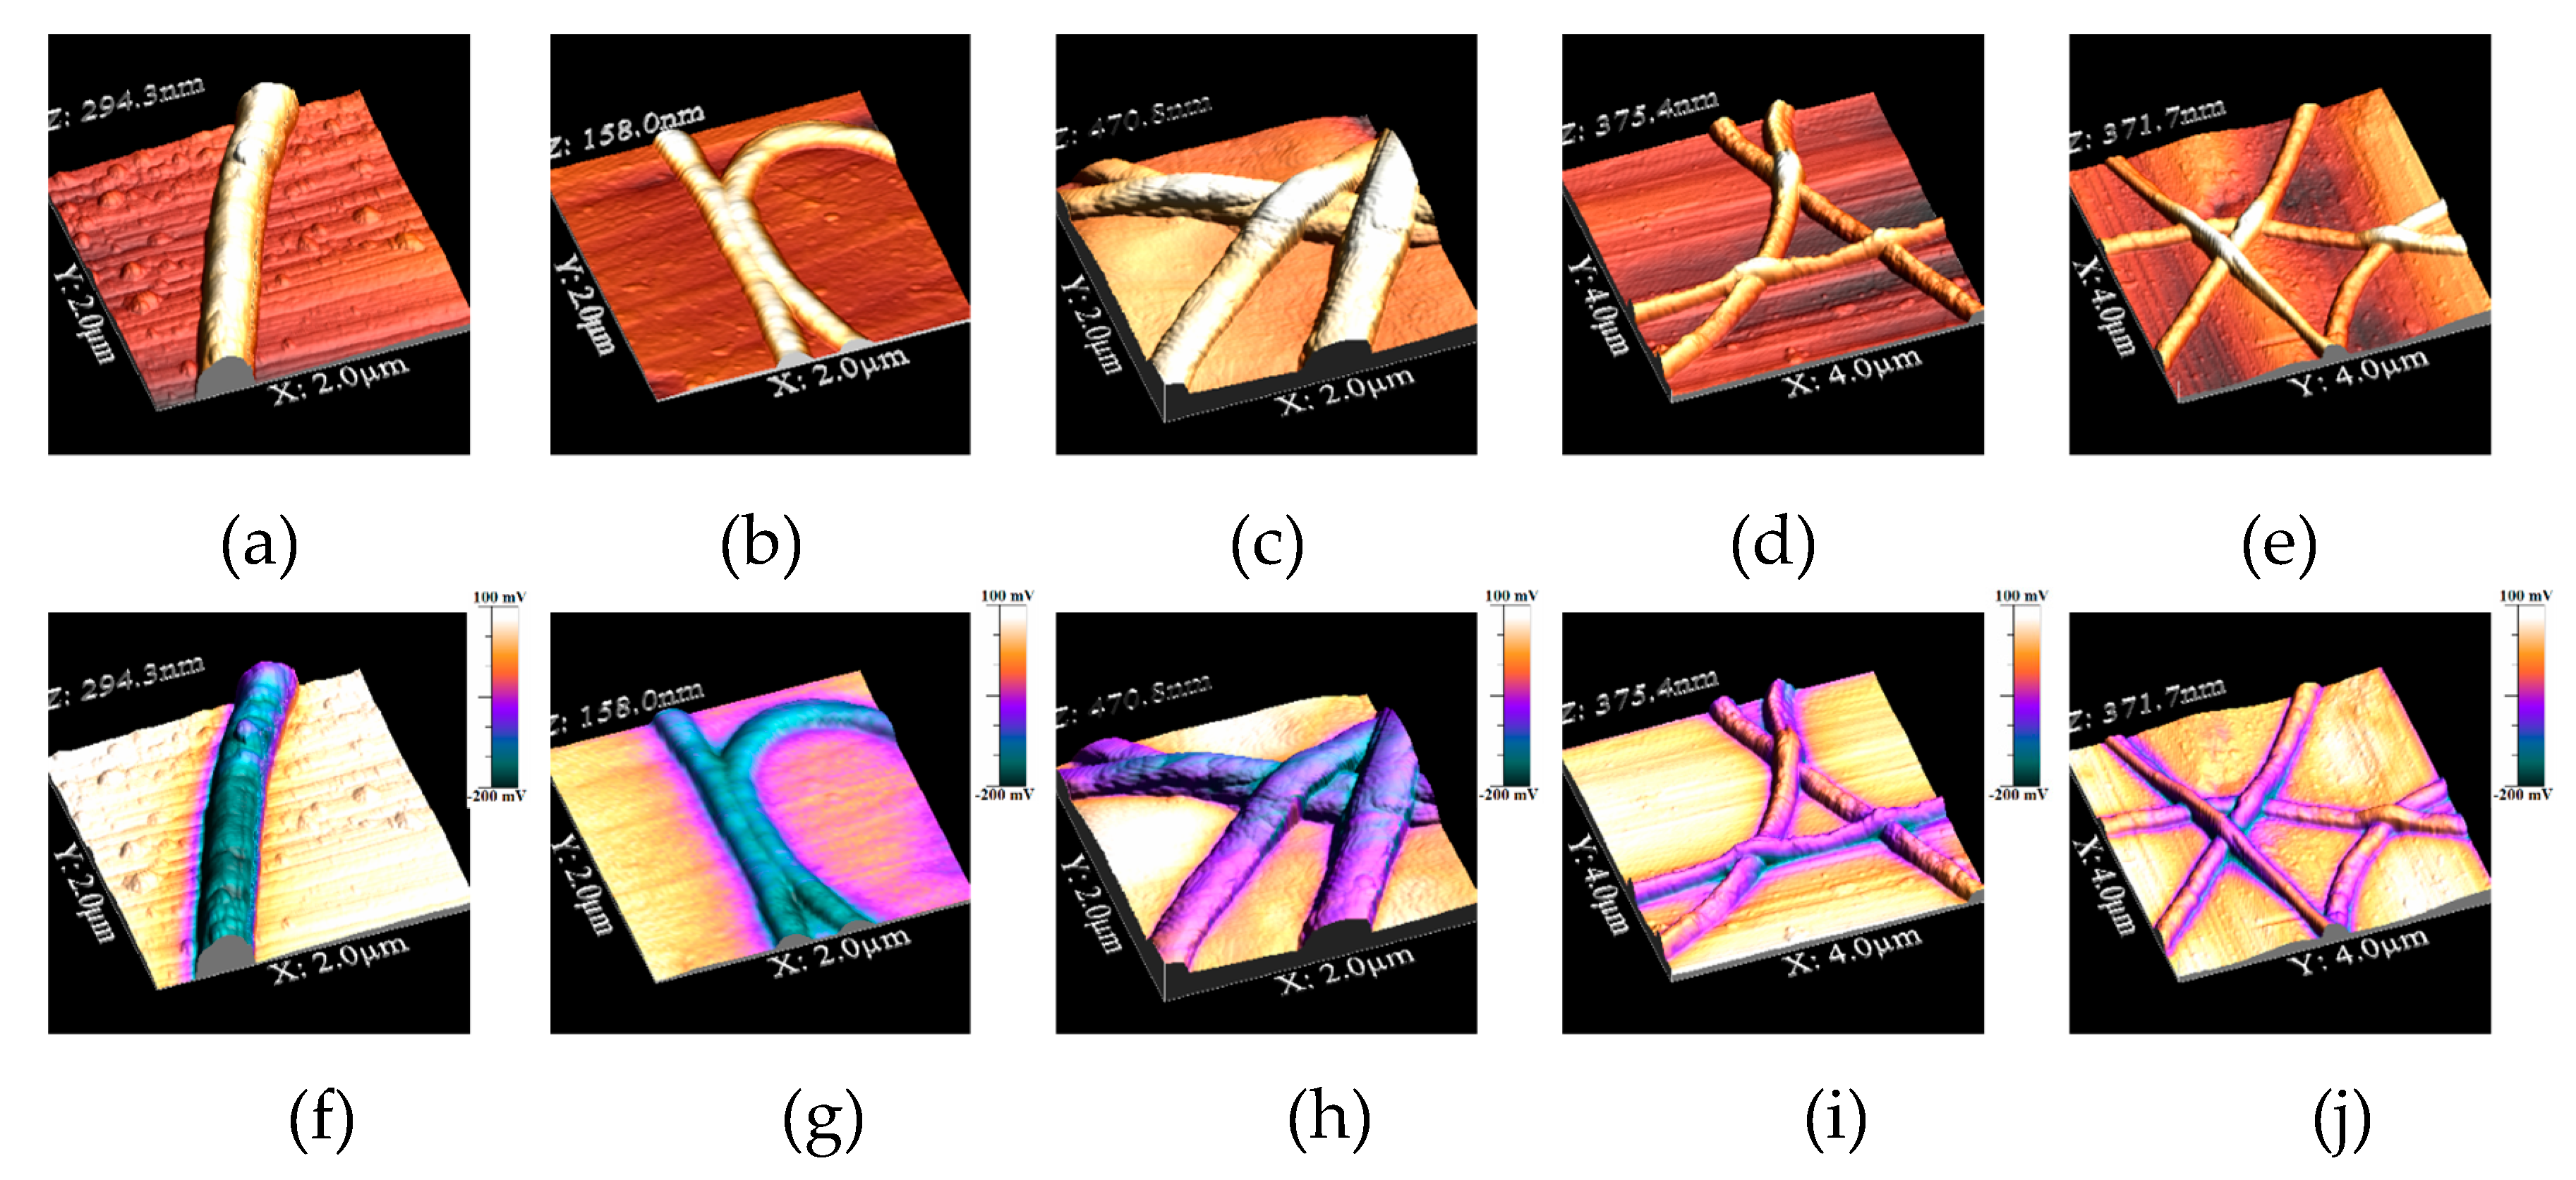
The surface morphologies of the P(VDF-TrFE)-Graphene oxide/Al fibers were observed by AFM (
Figure 2 and
Figure 3). The topography image of single PVDF electrospun fibers (
Figure 2a) shows an average diameter of about 500 nm.
The observed AFM topography image demonstrates the morphology of P(VDF-TrFE)/GO fibers. These images did not show any individual GO particles on the surface of fibers. After analyzing topographic image for each composition, average roughness (RMS roughness) of fiber surface was calculated and found to increase from 4.8 to 8.6 nm for an increase in GO concentration from 0% to 20 %, respectively. This increase in roughness could be attributed to the creation of irregular stresses during the crystallization of the fibers due to the presence of randomly distributed GO flakes having different average size.
Kelvin Probe Force Microscopy method was used to visualize the potential at the sample surface [
24]. A combination of the data obtained from KPFM with AFM method was used to reveal a surface charge potential signal. Two-passes KPFM technique was performed for imaging of the contact potential difference between the AFM tip and the surface (
Figure 2b,c). During the first pass of KPFM scan a topographic image is acquired [
24,
25]. The second pass is performed at ~100 nm lift height tip to follow the topographic profile whereas a sum of a variable
dc voltage
Vtip-dc and an AC voltage,
Vtip-ac is applied to the tip. The value of
Vtip-dc voltage is adjusted to cancel the force component and thus is equal to the surface potential. To calculate the charge density value a correlation between the surface charge density and the obtained potential was analyzed.
Figure 3 shows the topography and surface potential image as a function of GO content.
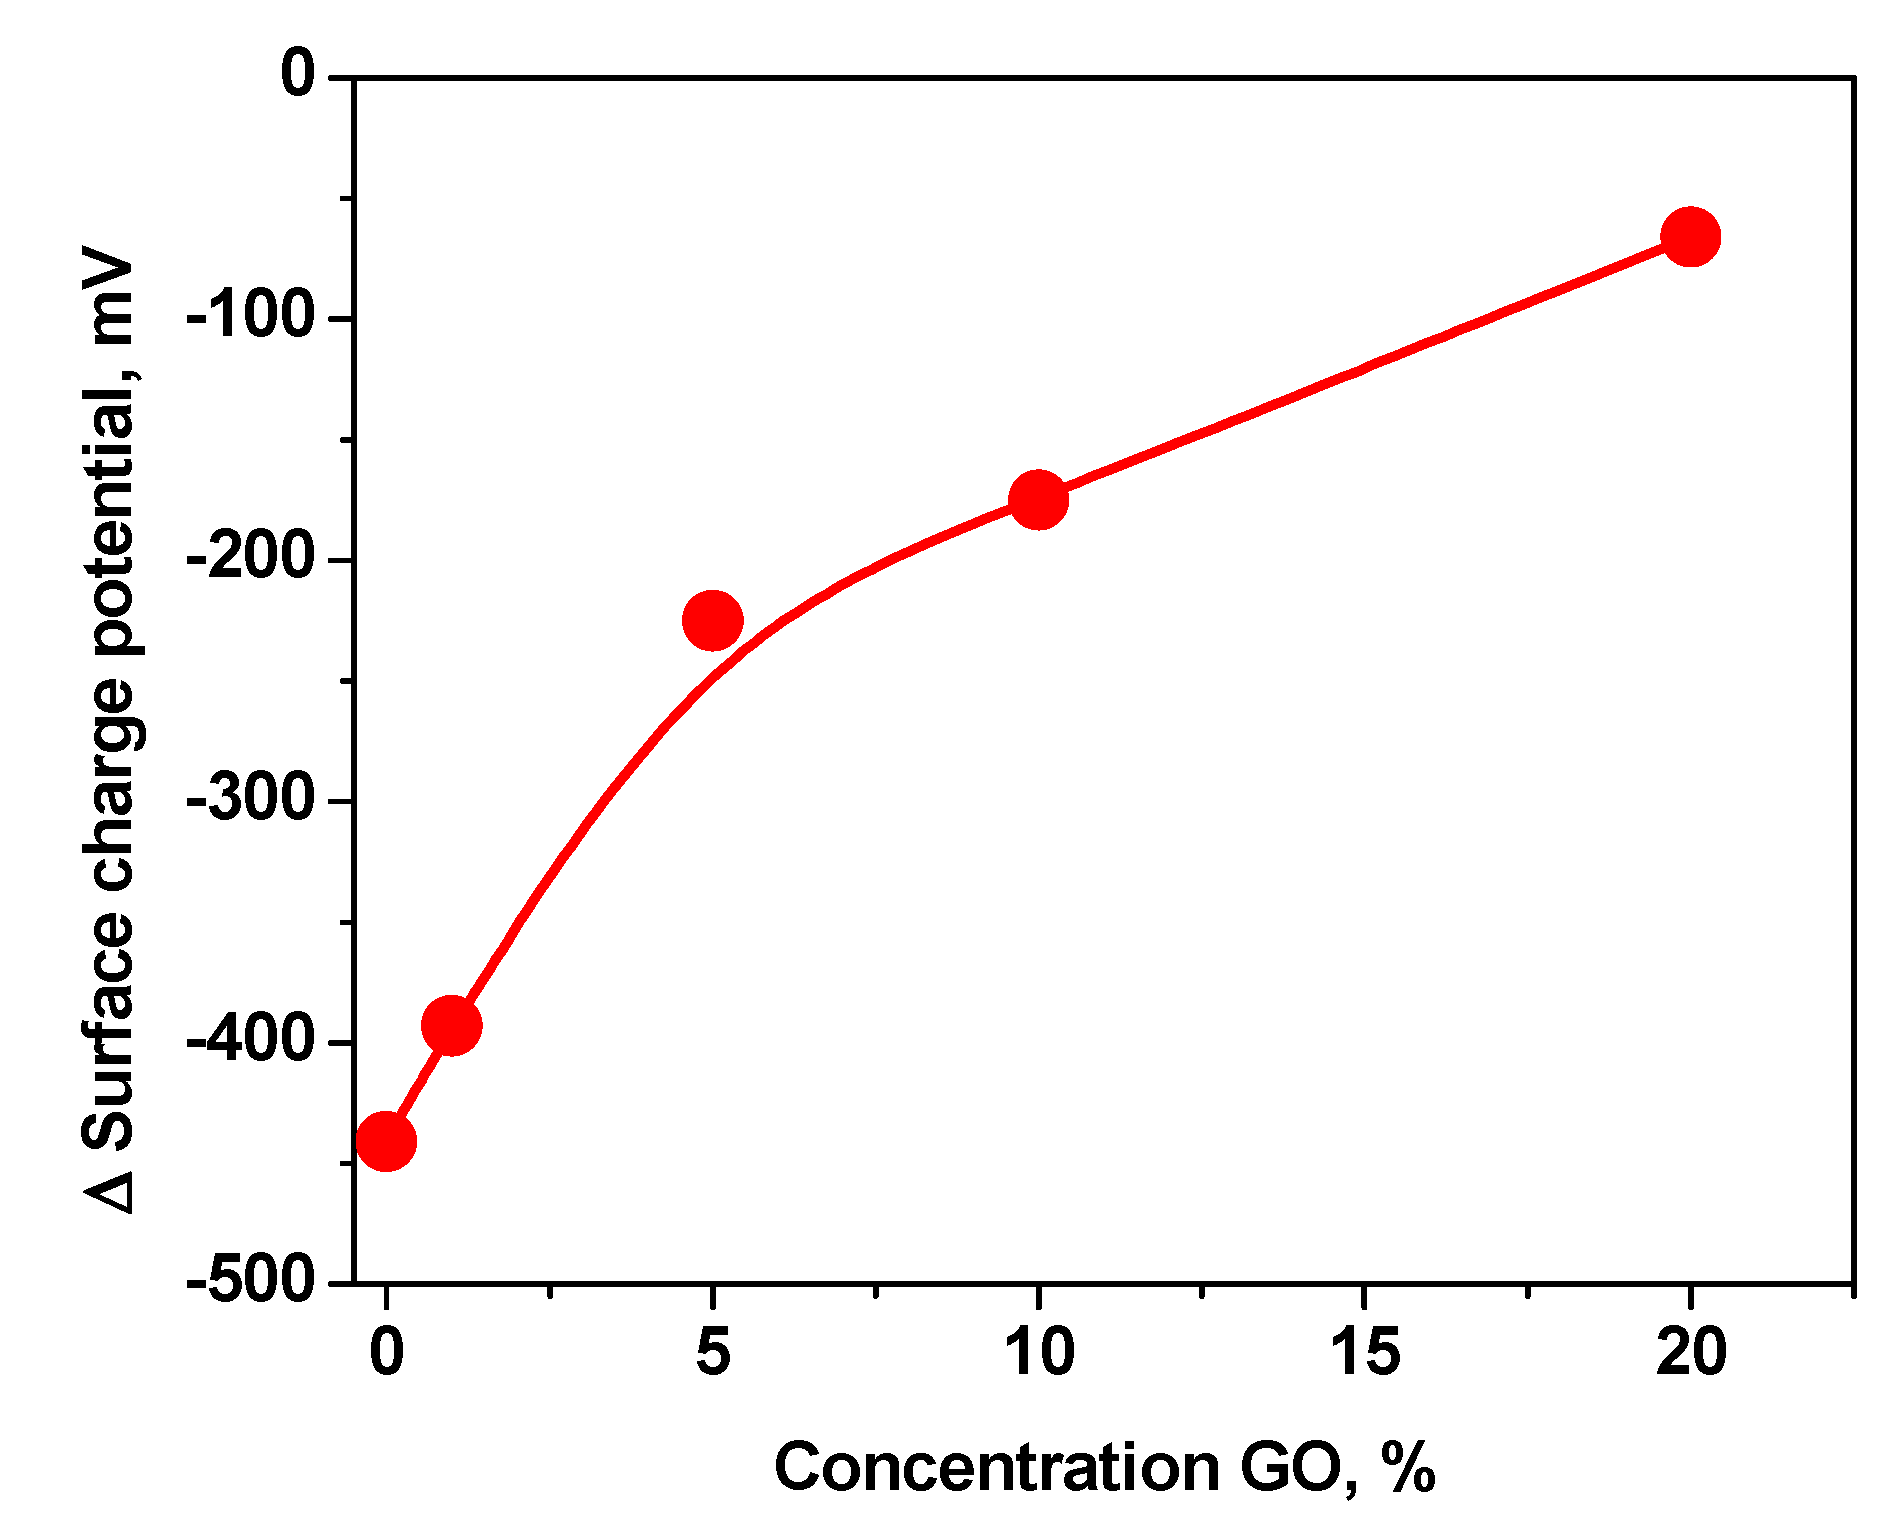
An increase in GO content leads to an increase in the surface potential as the GO inclusions act as charge trappers which is estimated from KPFM measurements, the surface potential difference as a function of GO concentration in P(VDF-TrFE)/Graphene oxide composite fibers is presented in
Figure 4.
In addition, depending on the distance from the center of the fiber, cross-sections perpendicular to the fibers (
Figure 5a–c), indicates change in the surface potential. Moreover, at the edges of the fiber (position 2), the potentials are significantly reduced, which is pictorially represented in
Figure 5d.
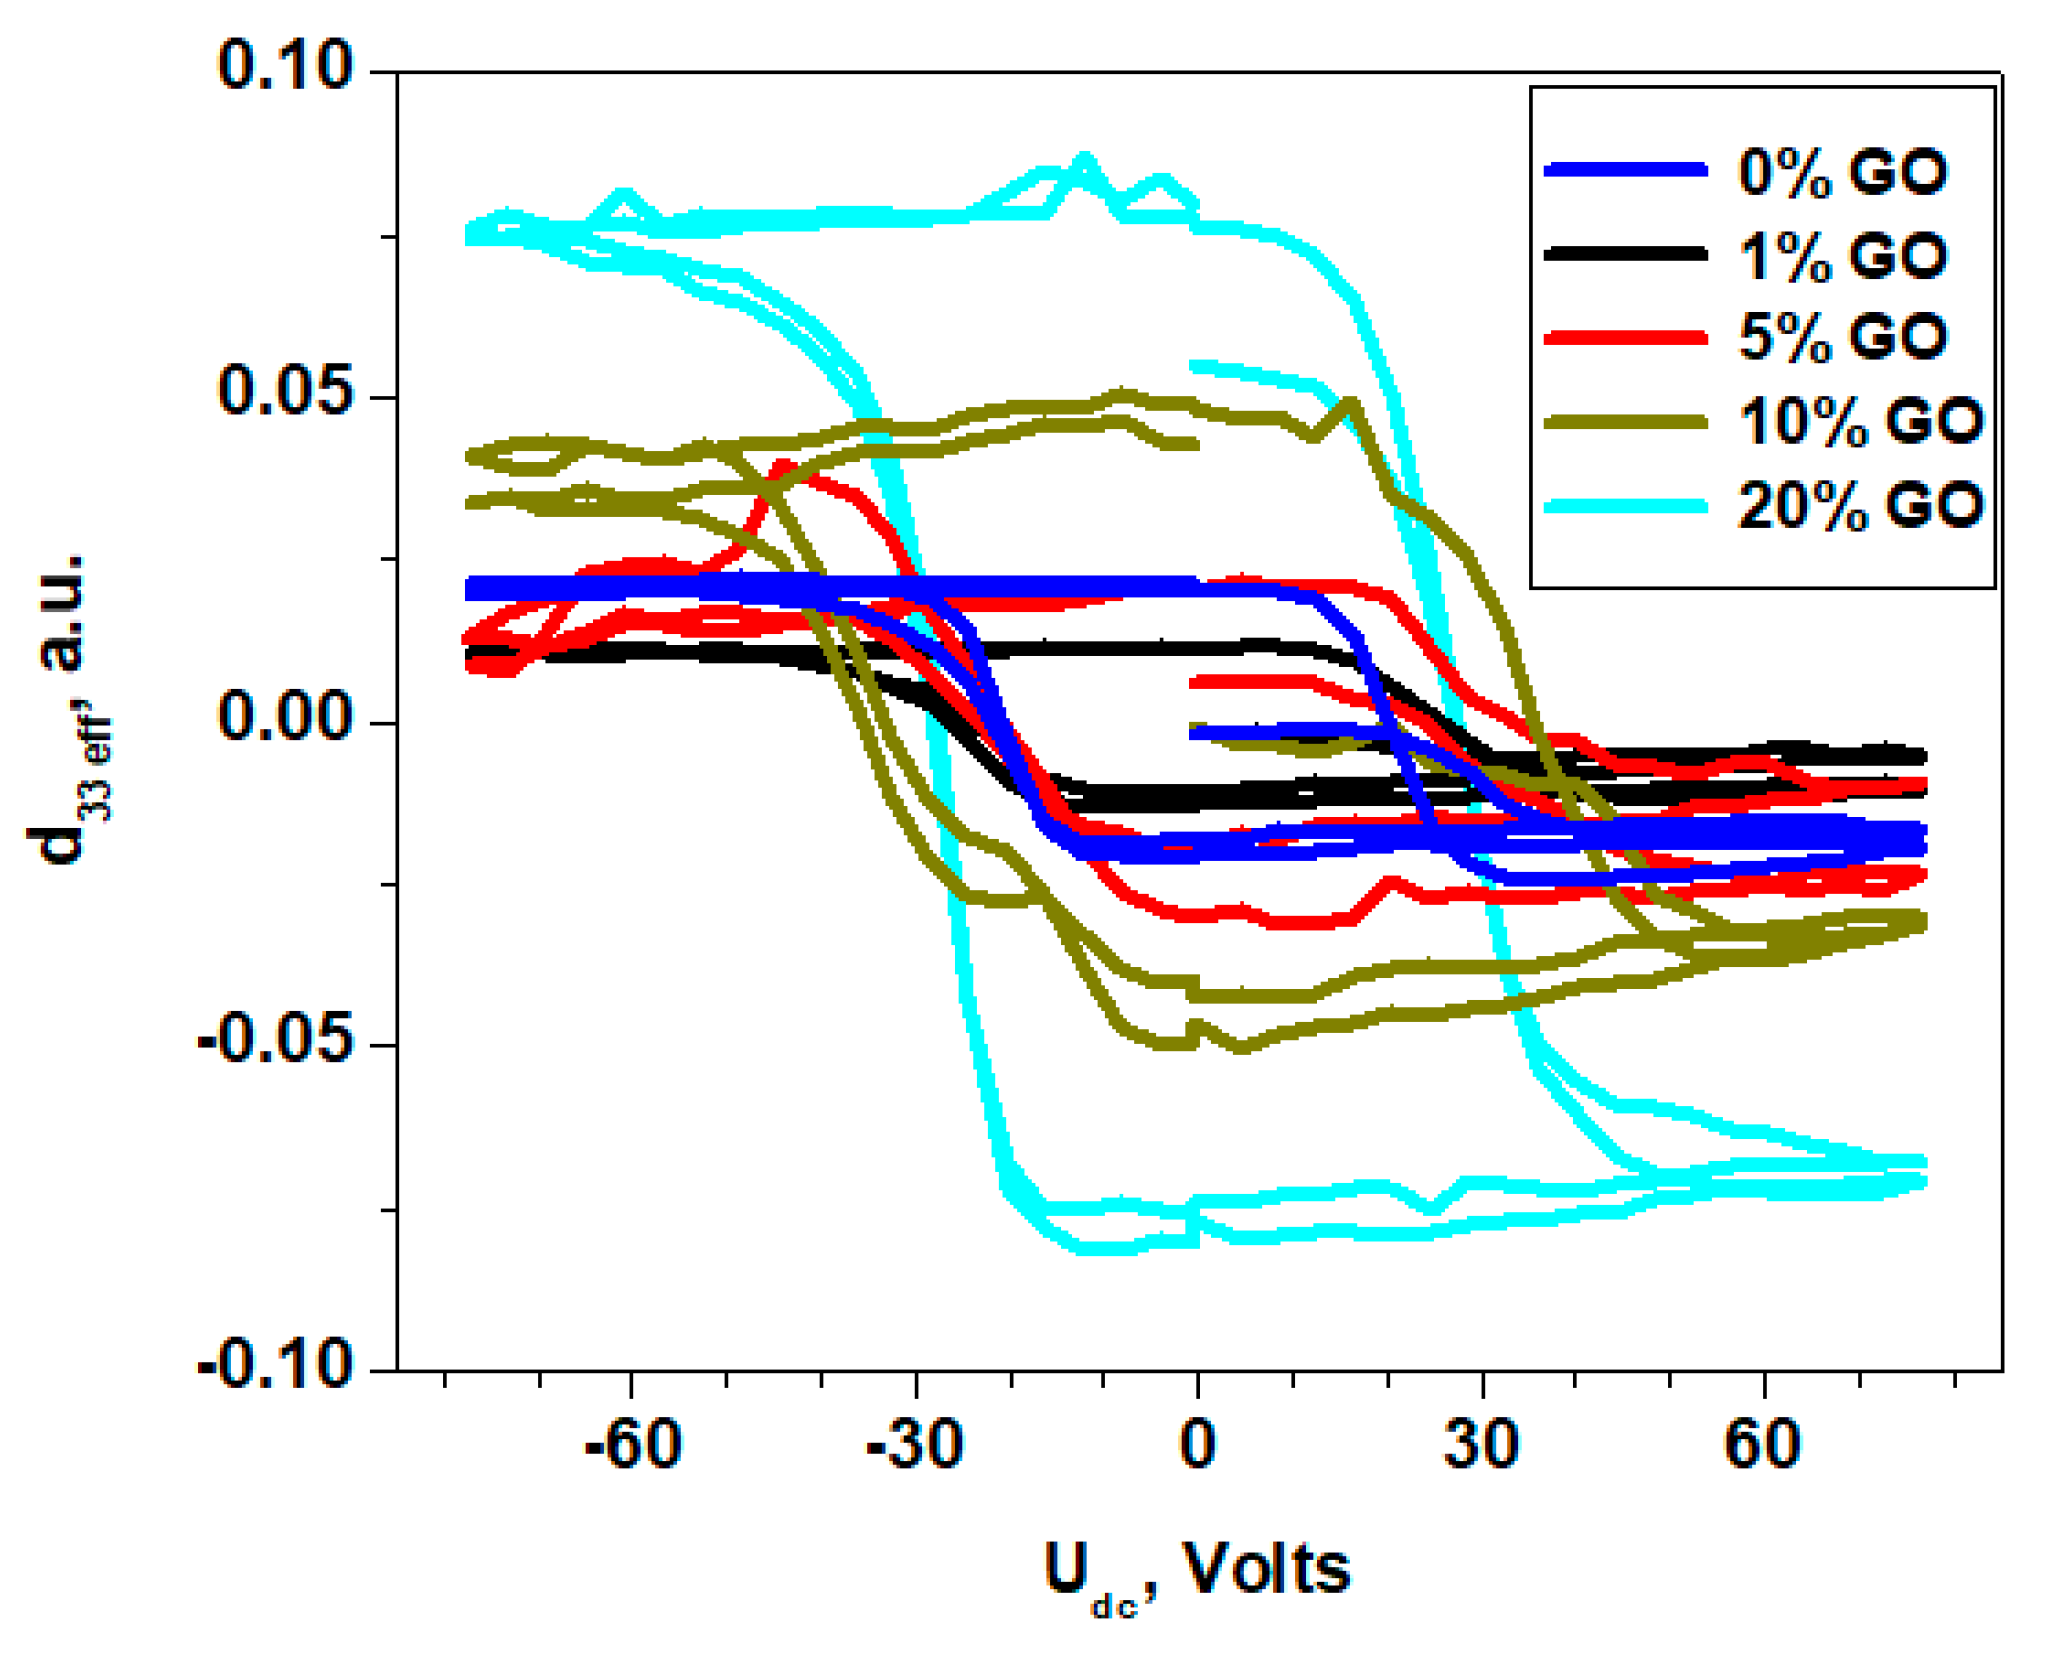
The obtained PFM loops are specific for local switching process, wherein a change in the PFM contrast is justified by the integrated piezoresponse of original domains and “unswitched” polarization. The measurements were done in the so-called pulse mode.
Figure 6 shows the hysteresis loops for the fibers with various concentration of GO. Hysteresis loop acquisition was done by applying a DC voltage (
Vdc) in the range of −75 to +75 V with voltage sweep of 1 Volt for a short time (1 s) and by measuring PFM signals at each sweep voltage.
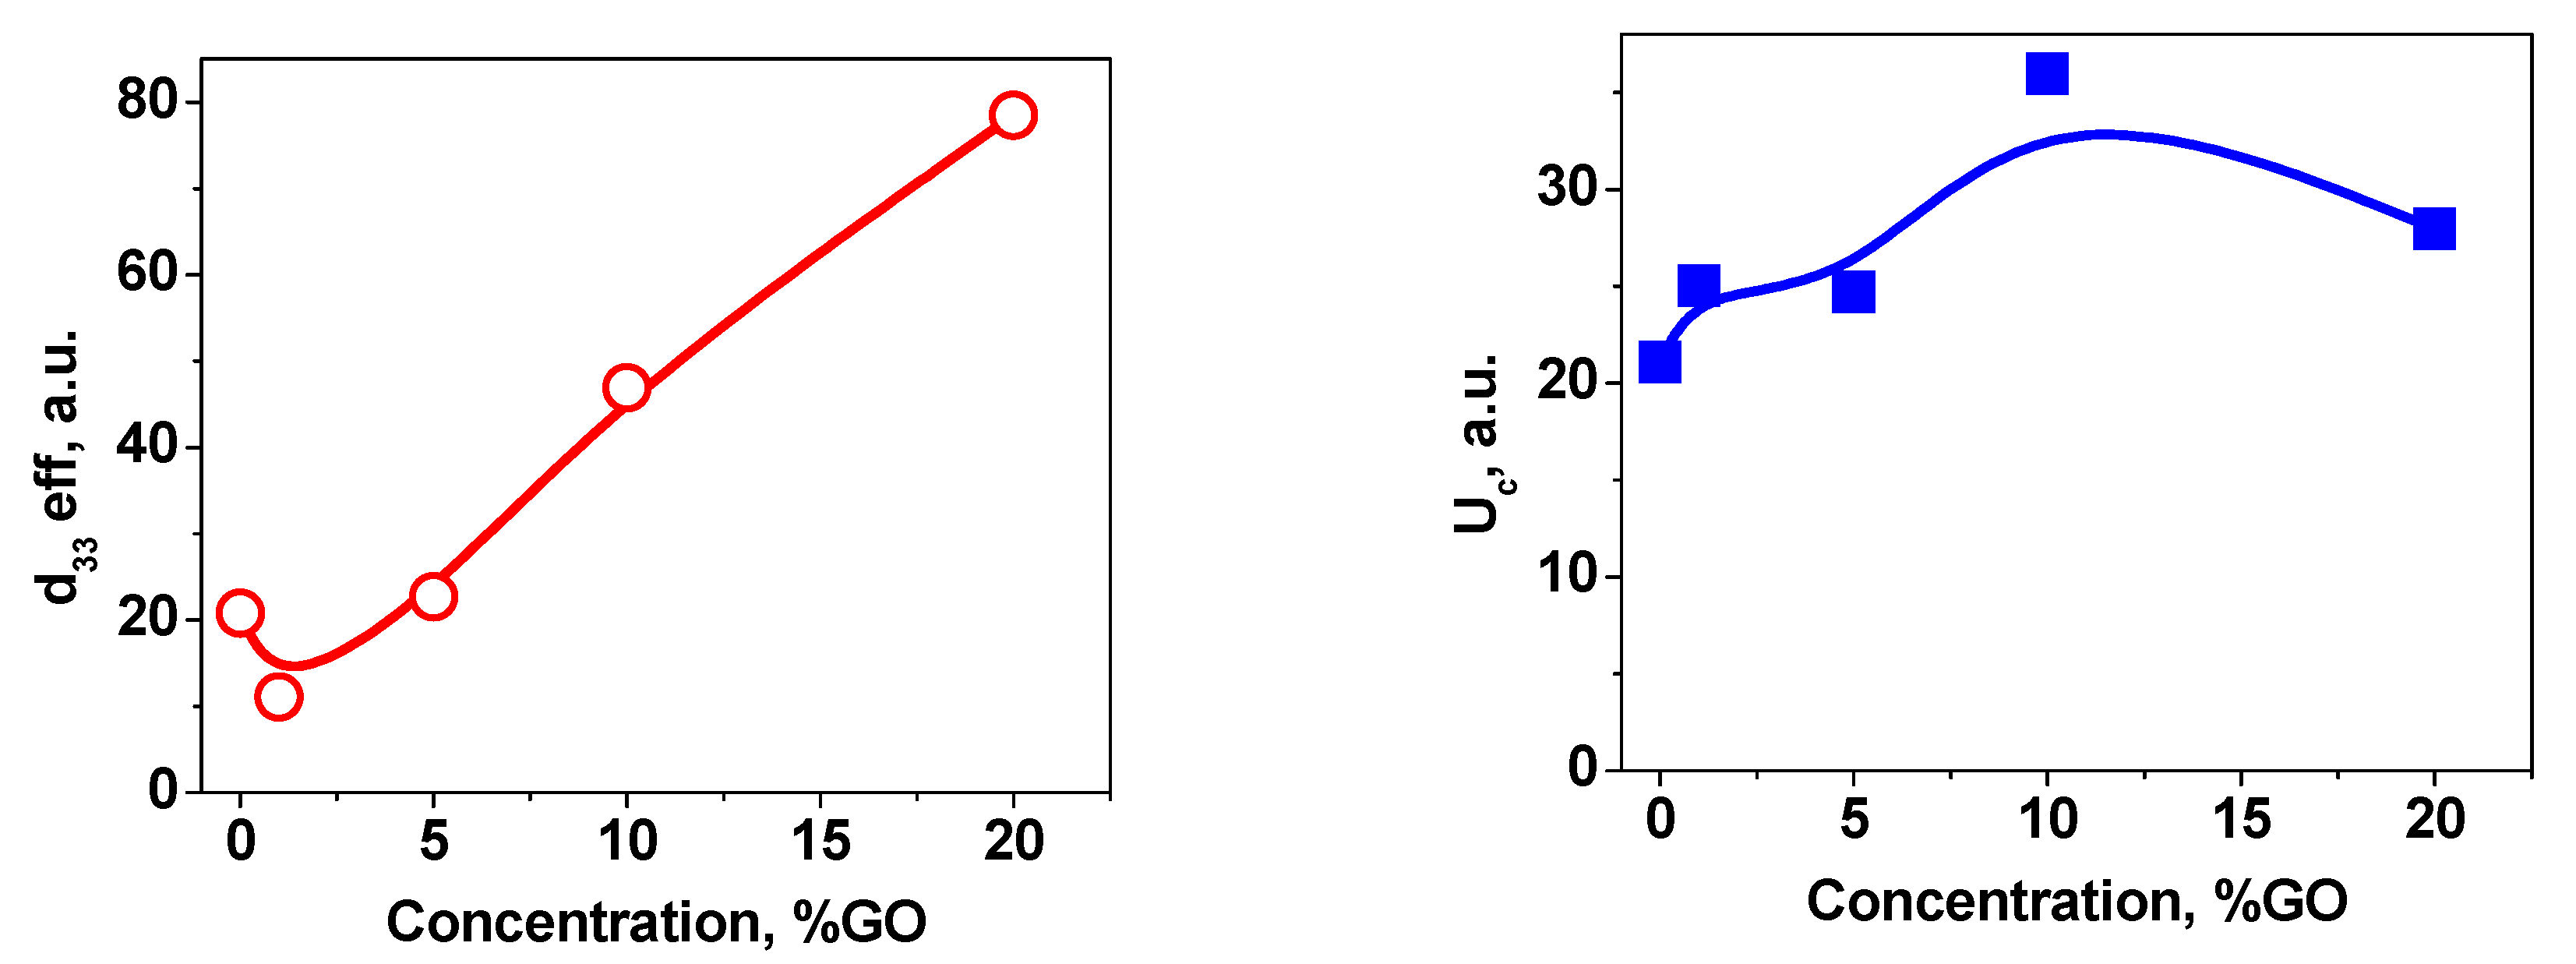
The loops look similar for all the fibers, which demonstrates an initial small piezoresponse with a significant offset relative to the basic level. The maximum value of the piezoelectric response signal corresponds to an estimated value of piezoelectric coefficient
d33eff. The obtained results have permitted to estimate the
d33eff values of composite fibers with varying concentration of graphene oxide (
Figure 7,
Table 1).
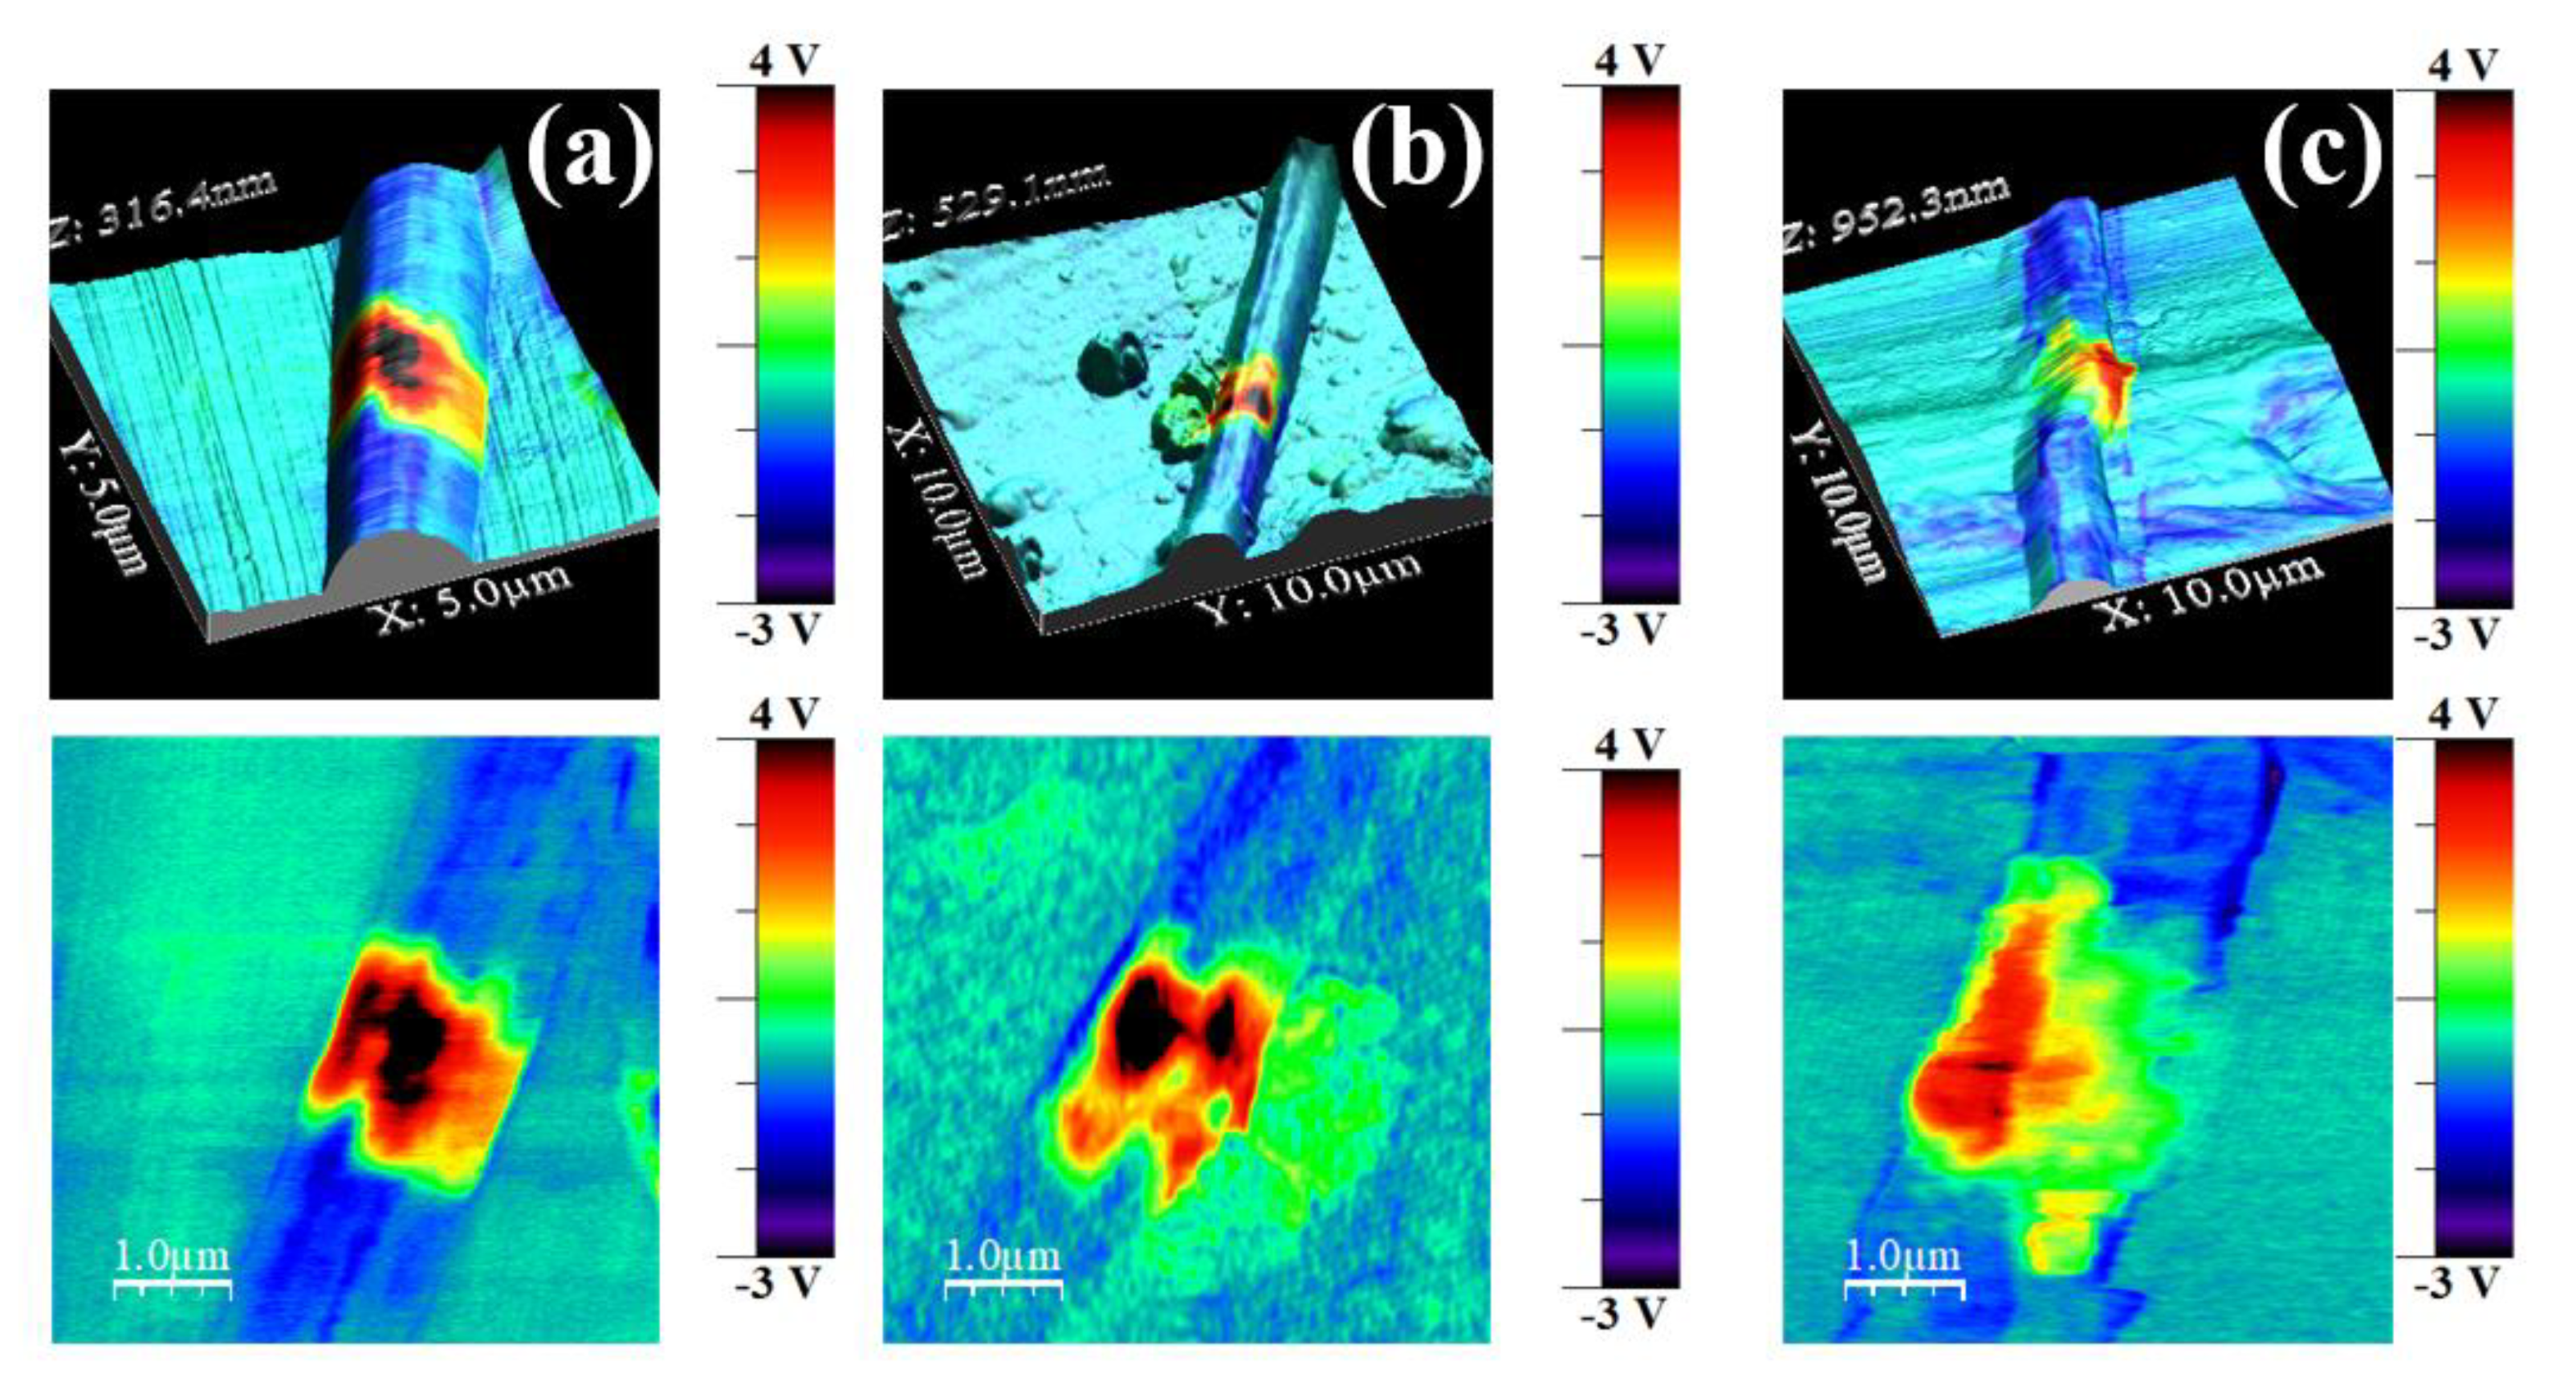
One of the most important observations is the fact of stability of the poled state of fibers (
Figure 8). It was observed that no ferroelectric domains in the initial time. Voltages were applied at the central point of fiber. The fibers was subjected to poling with −75 V
DC (direct current) bias. The PFM images after poling composite fibers with varying concentration of GO are shown in
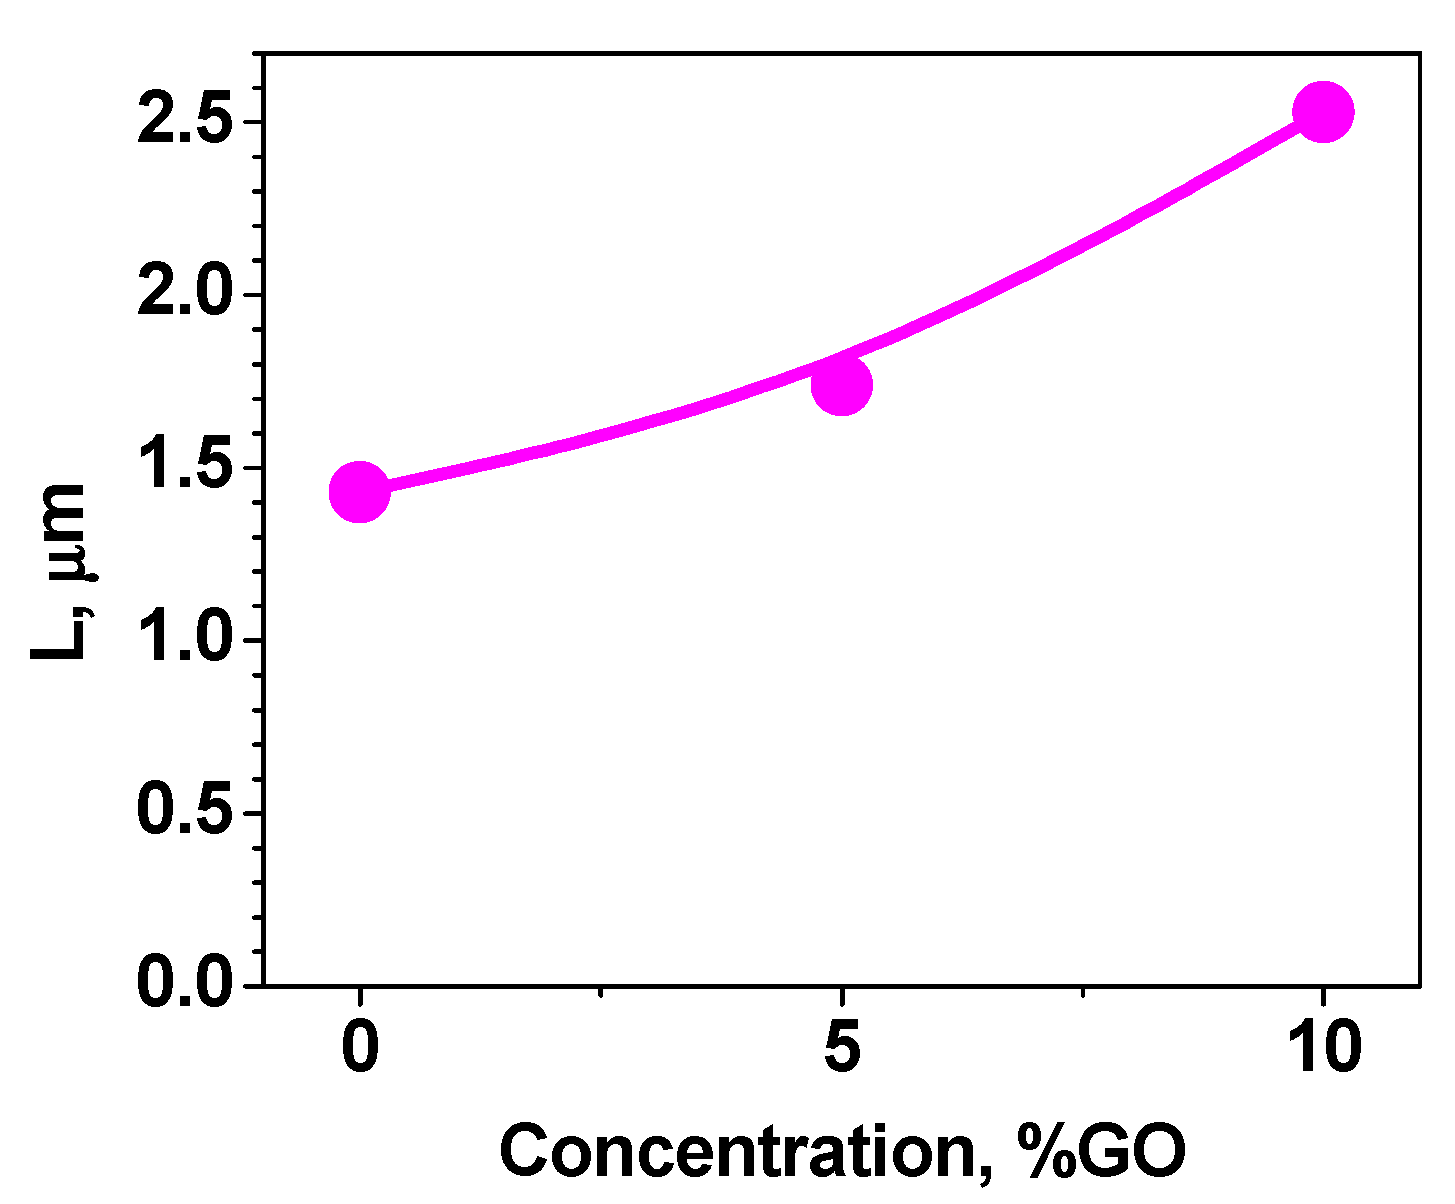
Figure 8. The regions of uniform polarization within the fiber are rough and irregular. In addition, no direct correlation between the piezoelectric contrast and topographic shape is evident, which confirms that the observed effect is the intrinsic piezoelectric property of the fibers and it has not originated from electrostatic effect and/or cross-talk with topography. The influence of the concentration of the GO on the length of domain switching is shown in
Figure 9.
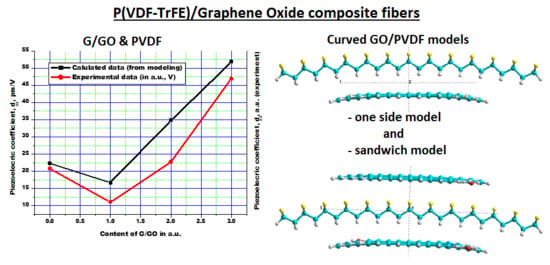
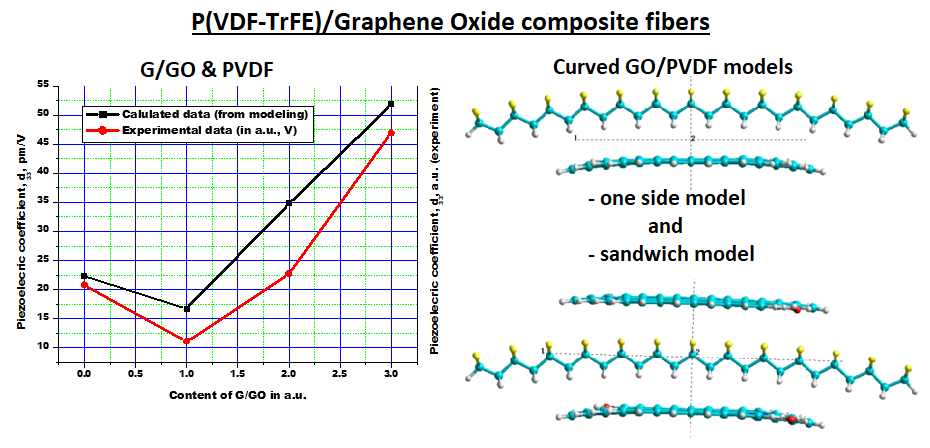
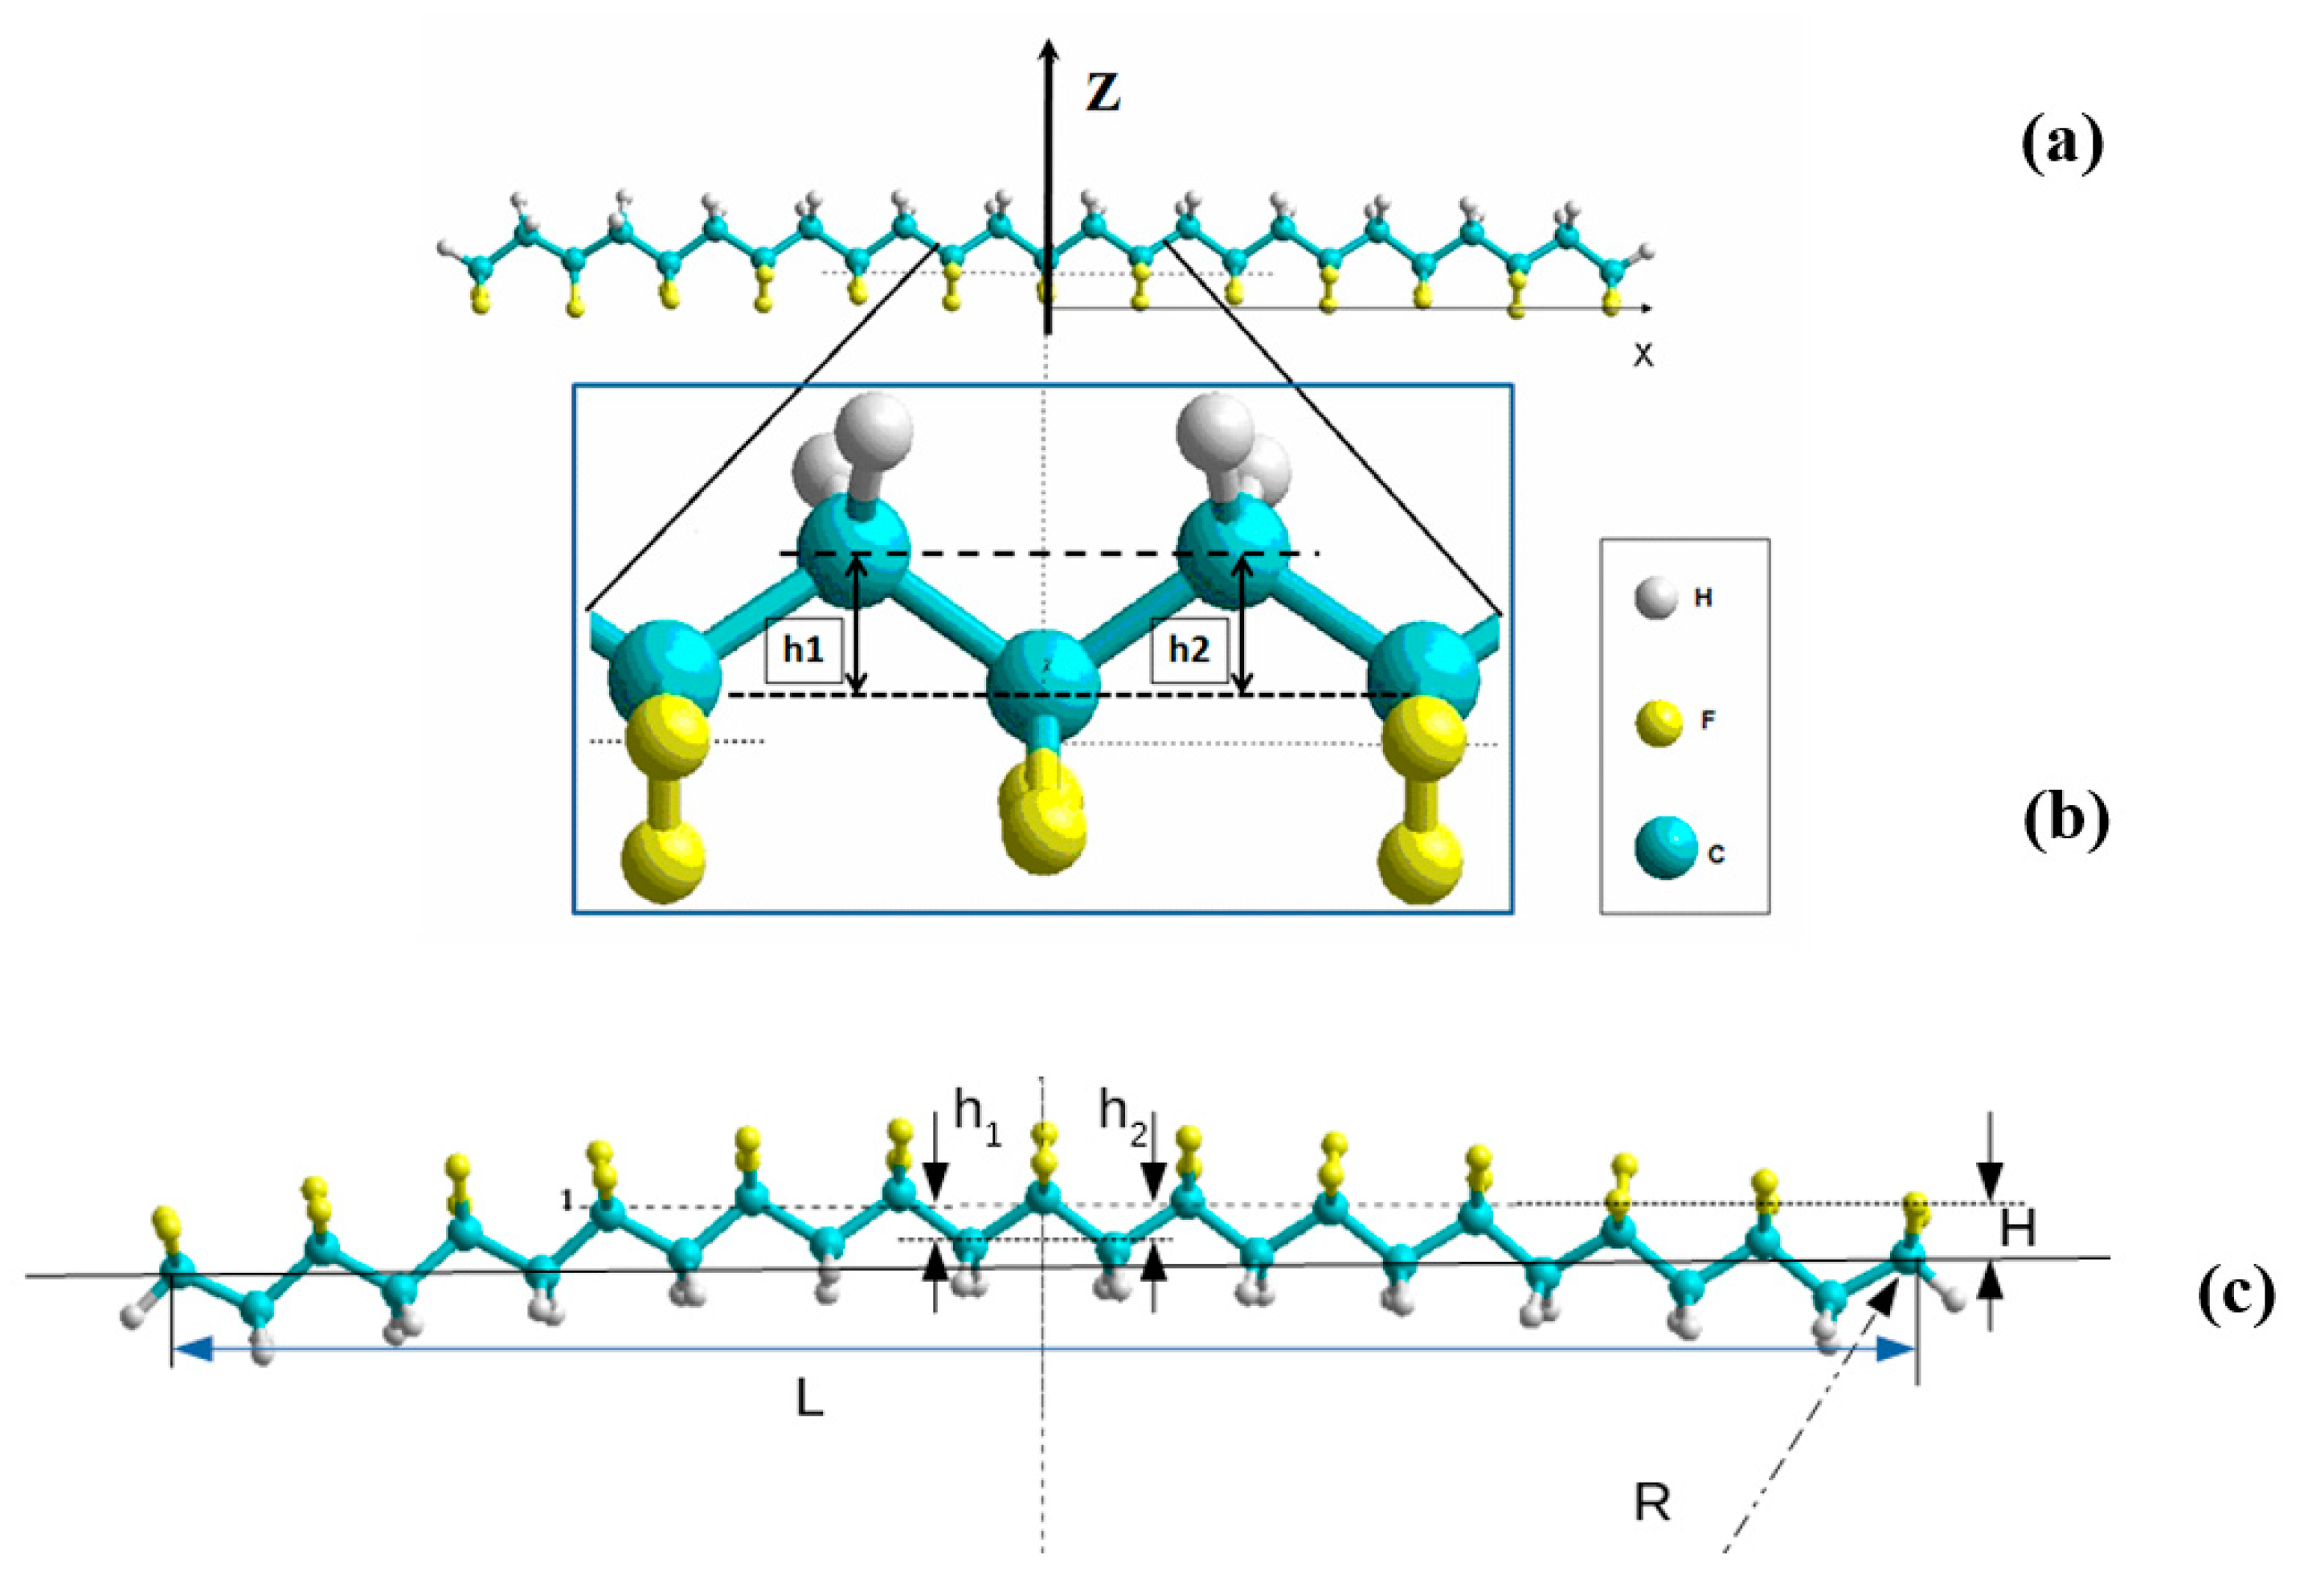
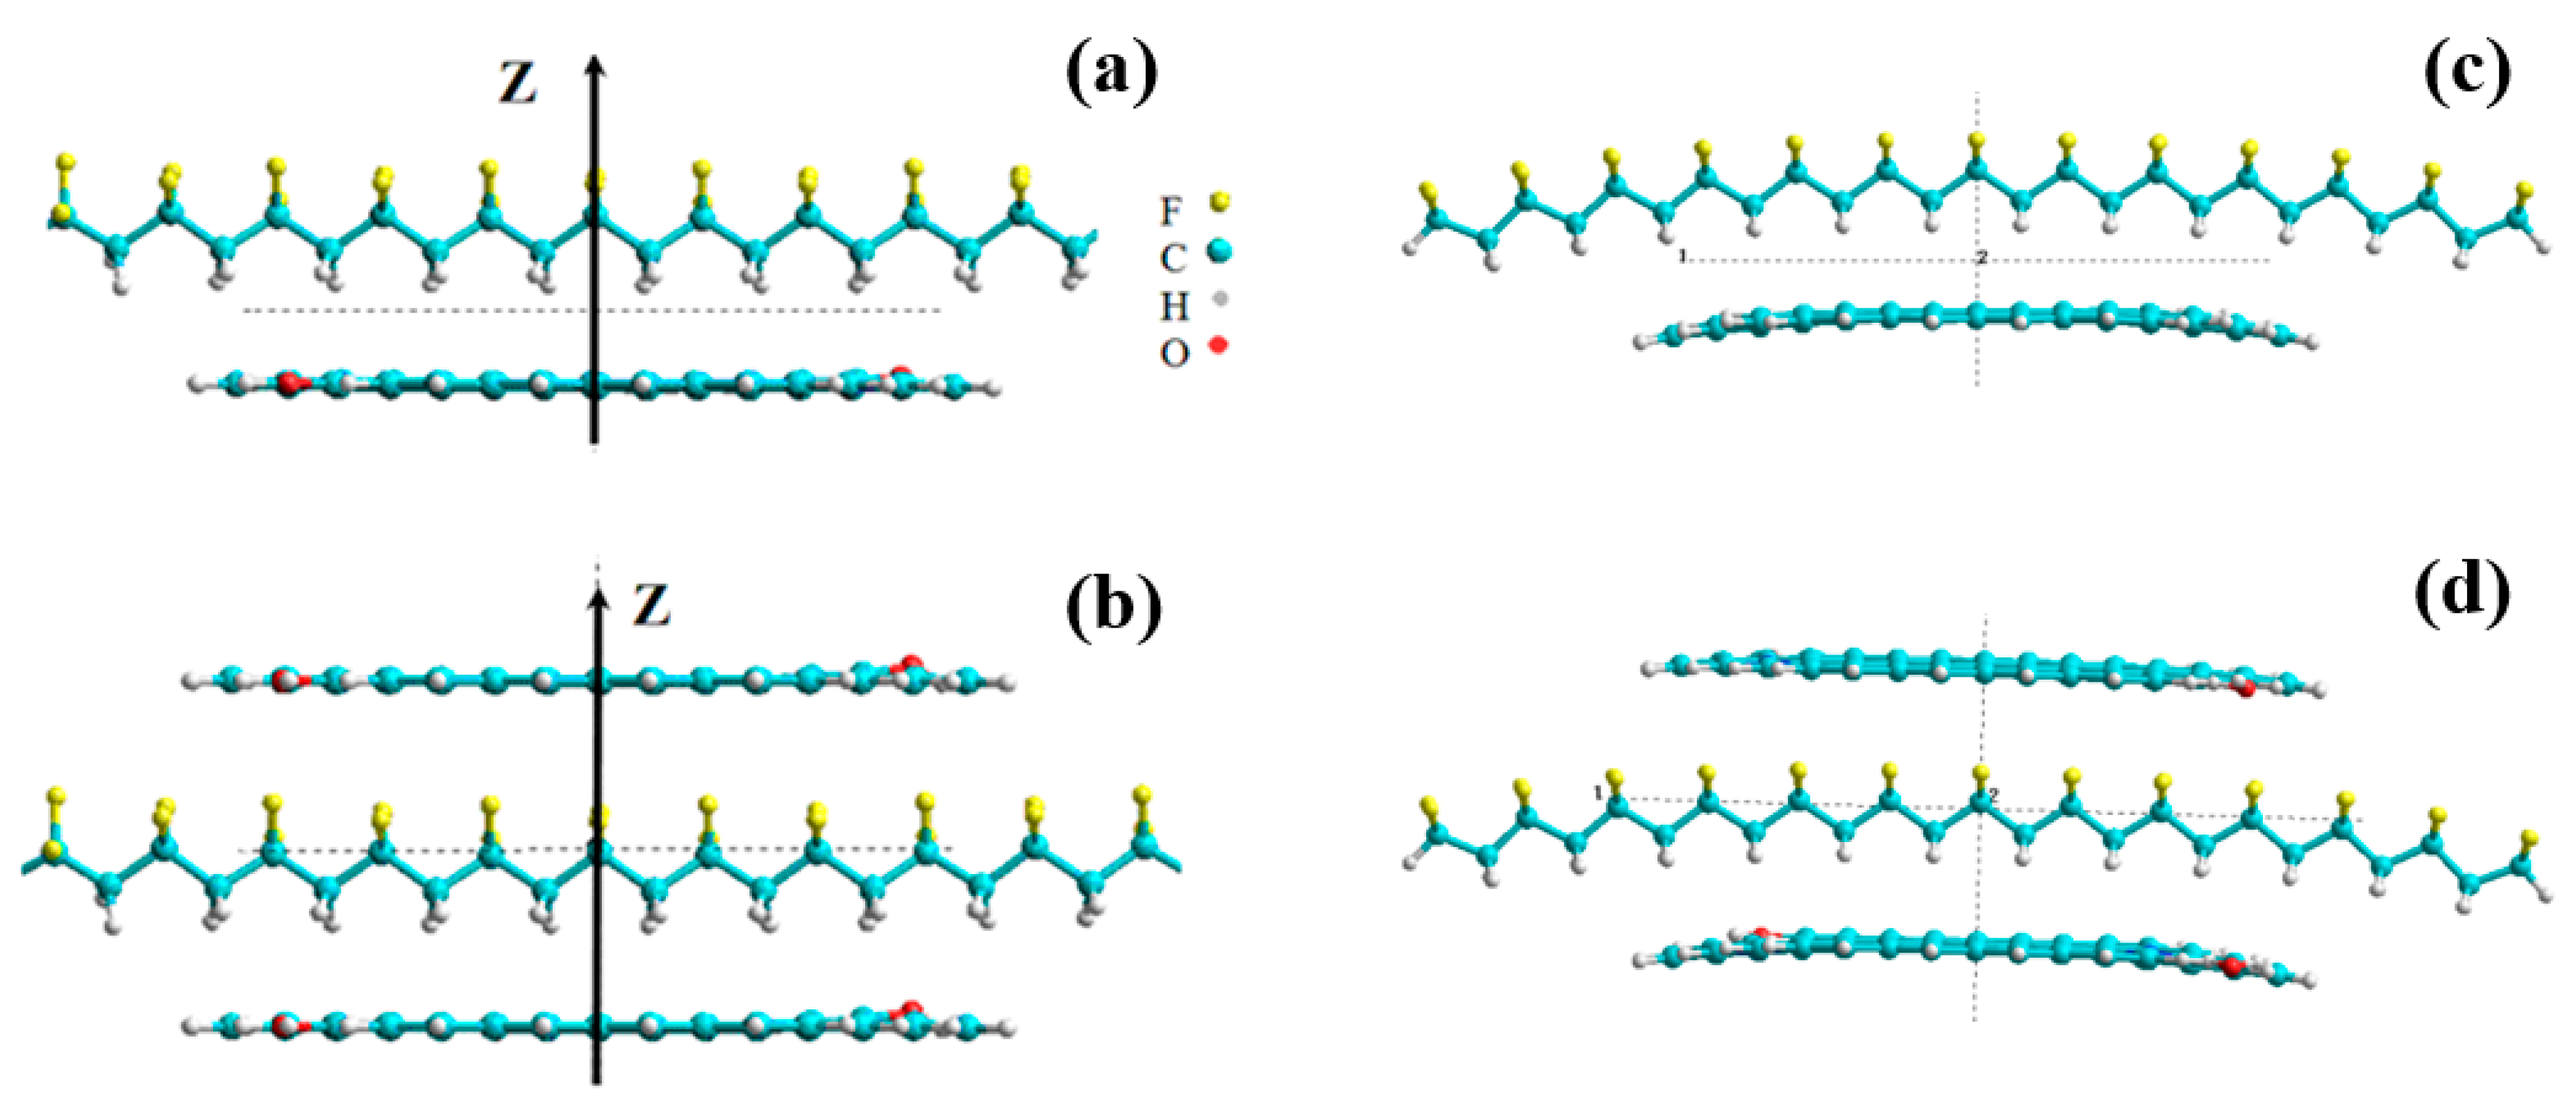
For understanding the mechanism of piezoresponse evolution in these composites, using our previous models of PVDF chain (
Figure 10a) and their behavior in electric fields (
Figure 10b) we have computed piezoelectric coefficients [
26]. It is the case of the previous flat models, which corresponds to PVDF films samples. The curved PVDF chain model (
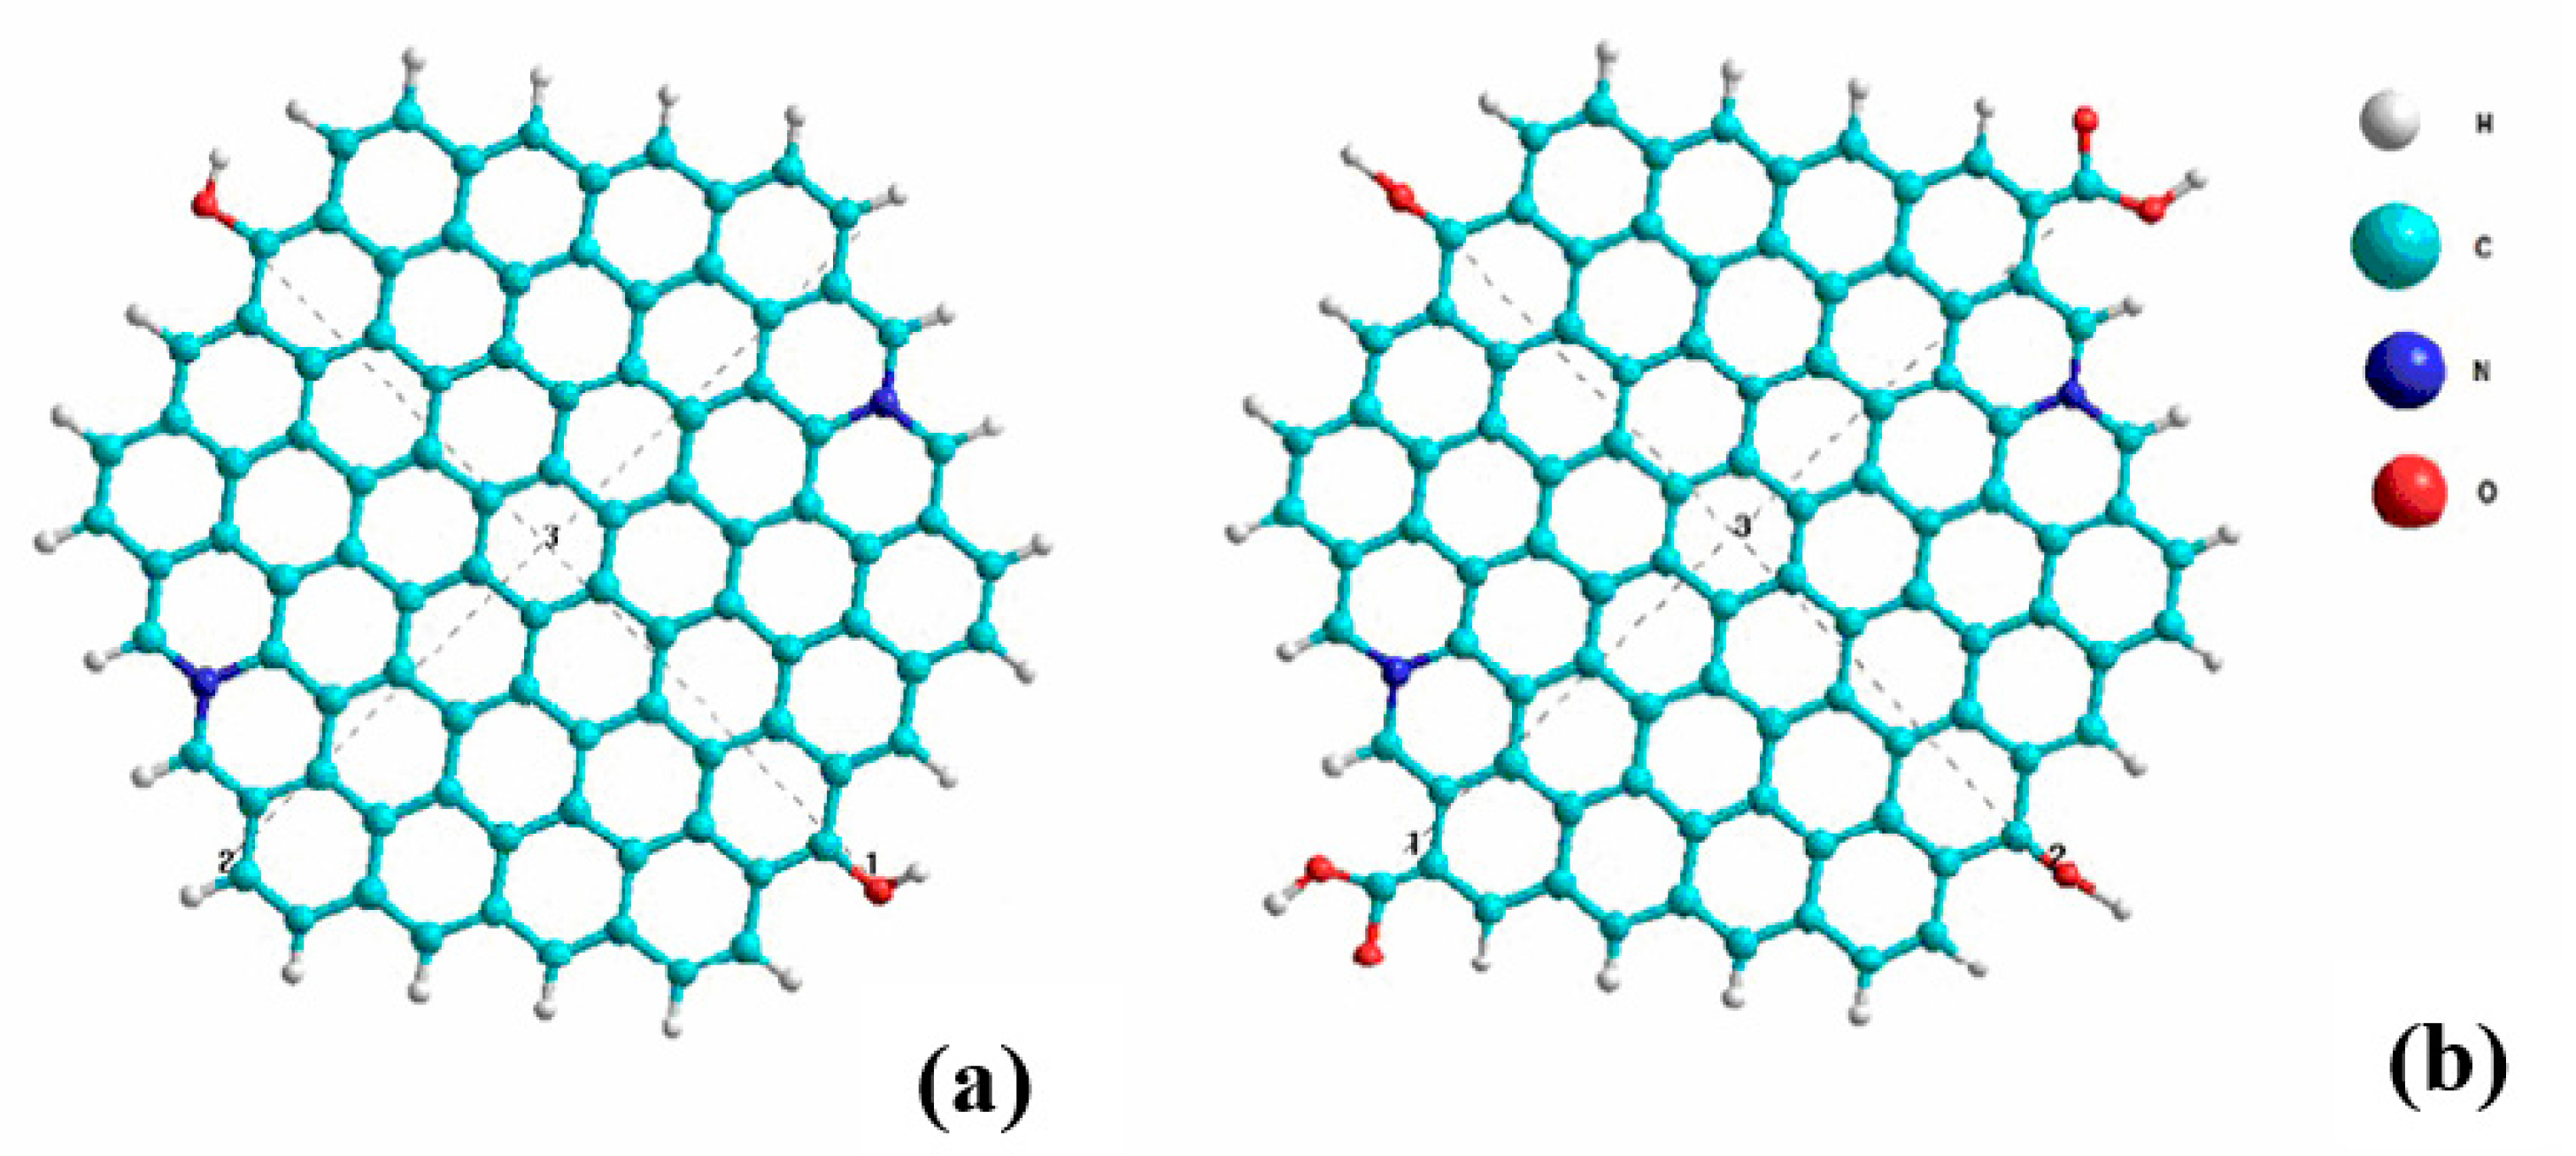
Figure 10c) is proposed and considered for the case of the fibers samples. The symmetrized models of graphene oxide (GO) based on graphene (G) layer consisting of 54 carbon atoms (G54), 96 carbon atoms (G96) and arranged with hydrogens (G54H, G96H) are considered similarly as in our previous work [
26]: with oxygen and OH groups (
Figure 11a) (formula Gr
96HN
2O
2H
2 and further abbreviation GO
2) and with COOH groups (
Figure 11b) (formula Gr
96N
2O
2H
2COOH
2, abbreviation GO1).
Several simplest models for the PVDF/graphene oxide complex were proposed and tested (
Figure 12) similarly to our previous work [
25]. The piezoelectric coefficients for these models were calculated using similar calculation algorithms, as was done in works [
25,
26]. Thus, the following three models were constructed and numerically investigated, viz. #1—with side H (hydrogen atoms) included in the PVDF chain and located towards the graphene oxide layer, #2—with side F (fluorine atoms) included in the PVDF chain and located towards the graphene oxide layer (both of these first options show approximately the same values of the calculated piezoelectric coefficients) and #3—graphene oxide layers on both sides surrounds the PVDF chain (sandwich-type model), as shown in
Figure 12a,b.
For a deeper understanding, the case of the composite fibers formation, we also considered two versions of the graphene layers in relation with PVDF chain: similar as the flat models—the same configuration of the curved models (
Figure 12c,d) models with one side and two sides sandwich models. It should be noted that the cluster geometry of the mentioned models is similar to the situation with graphene oxide layers the while the latter case is much more difficult in terms of calculations. The results obtained after modeling and calculations are presented below in
Table 2.
An optimization strategy which determines the changes in the atomic configuration of studied clusters [
24,
25] assumes several models, the first one considers an absence of electric field which allows to find the initial optimal atomic positions of modeled composite structure and to determine the initial optimal parameters of PVDF chain heights in its central part (
h1, and
h2). The second model considers an external electric field with Z orientation (along the main polarization vector of PVDF), this model allows to find out the optimal geometry for new atomic configuration under action of electric field. The third model assumes the changes of the main parameters (
h1 and
h2,
Figure 10) from initial optimal parameters, which allows to determine the deformation Δ
h1 and Δ
h2, and to calculate the corresponding values of voltage U. Finally, the piezoelectric coefficient
d33 was computed, using dielectric permittivity value of ε = 10. Comparison with the data known for
d33 attributed to initial PVDF samples testifies that under the influence of graphene oxide layer the piezoelectric coefficient
d33 of new composite structure is decreased. It has nearly three times lower value:
d33 = −14.6 pm/V (or pC/N) for the simple flat models (with one side H or F of PVDF chain—
Figure 12a), which interacting with one GO layer (with OH groups), as compared with the average value of the pure PVDF
d33 = −38.5 pm/V (pC/N). It is important to note, that the sign of
d33 coefficient is negative in all cases as it was established in [
26,
27] for the initial pure PVDF, it is caused by specific mechanism of PVDF chain deformation under an applied electric field. In the case of flat with double graphene oxide layers (sandwich model structure) the piezoelectric coefficient
d33 is increased to the value of
d33 = −29.8 pm/V (pC/N) (
Figure 12b, and see in
Table 2, data for flat models).
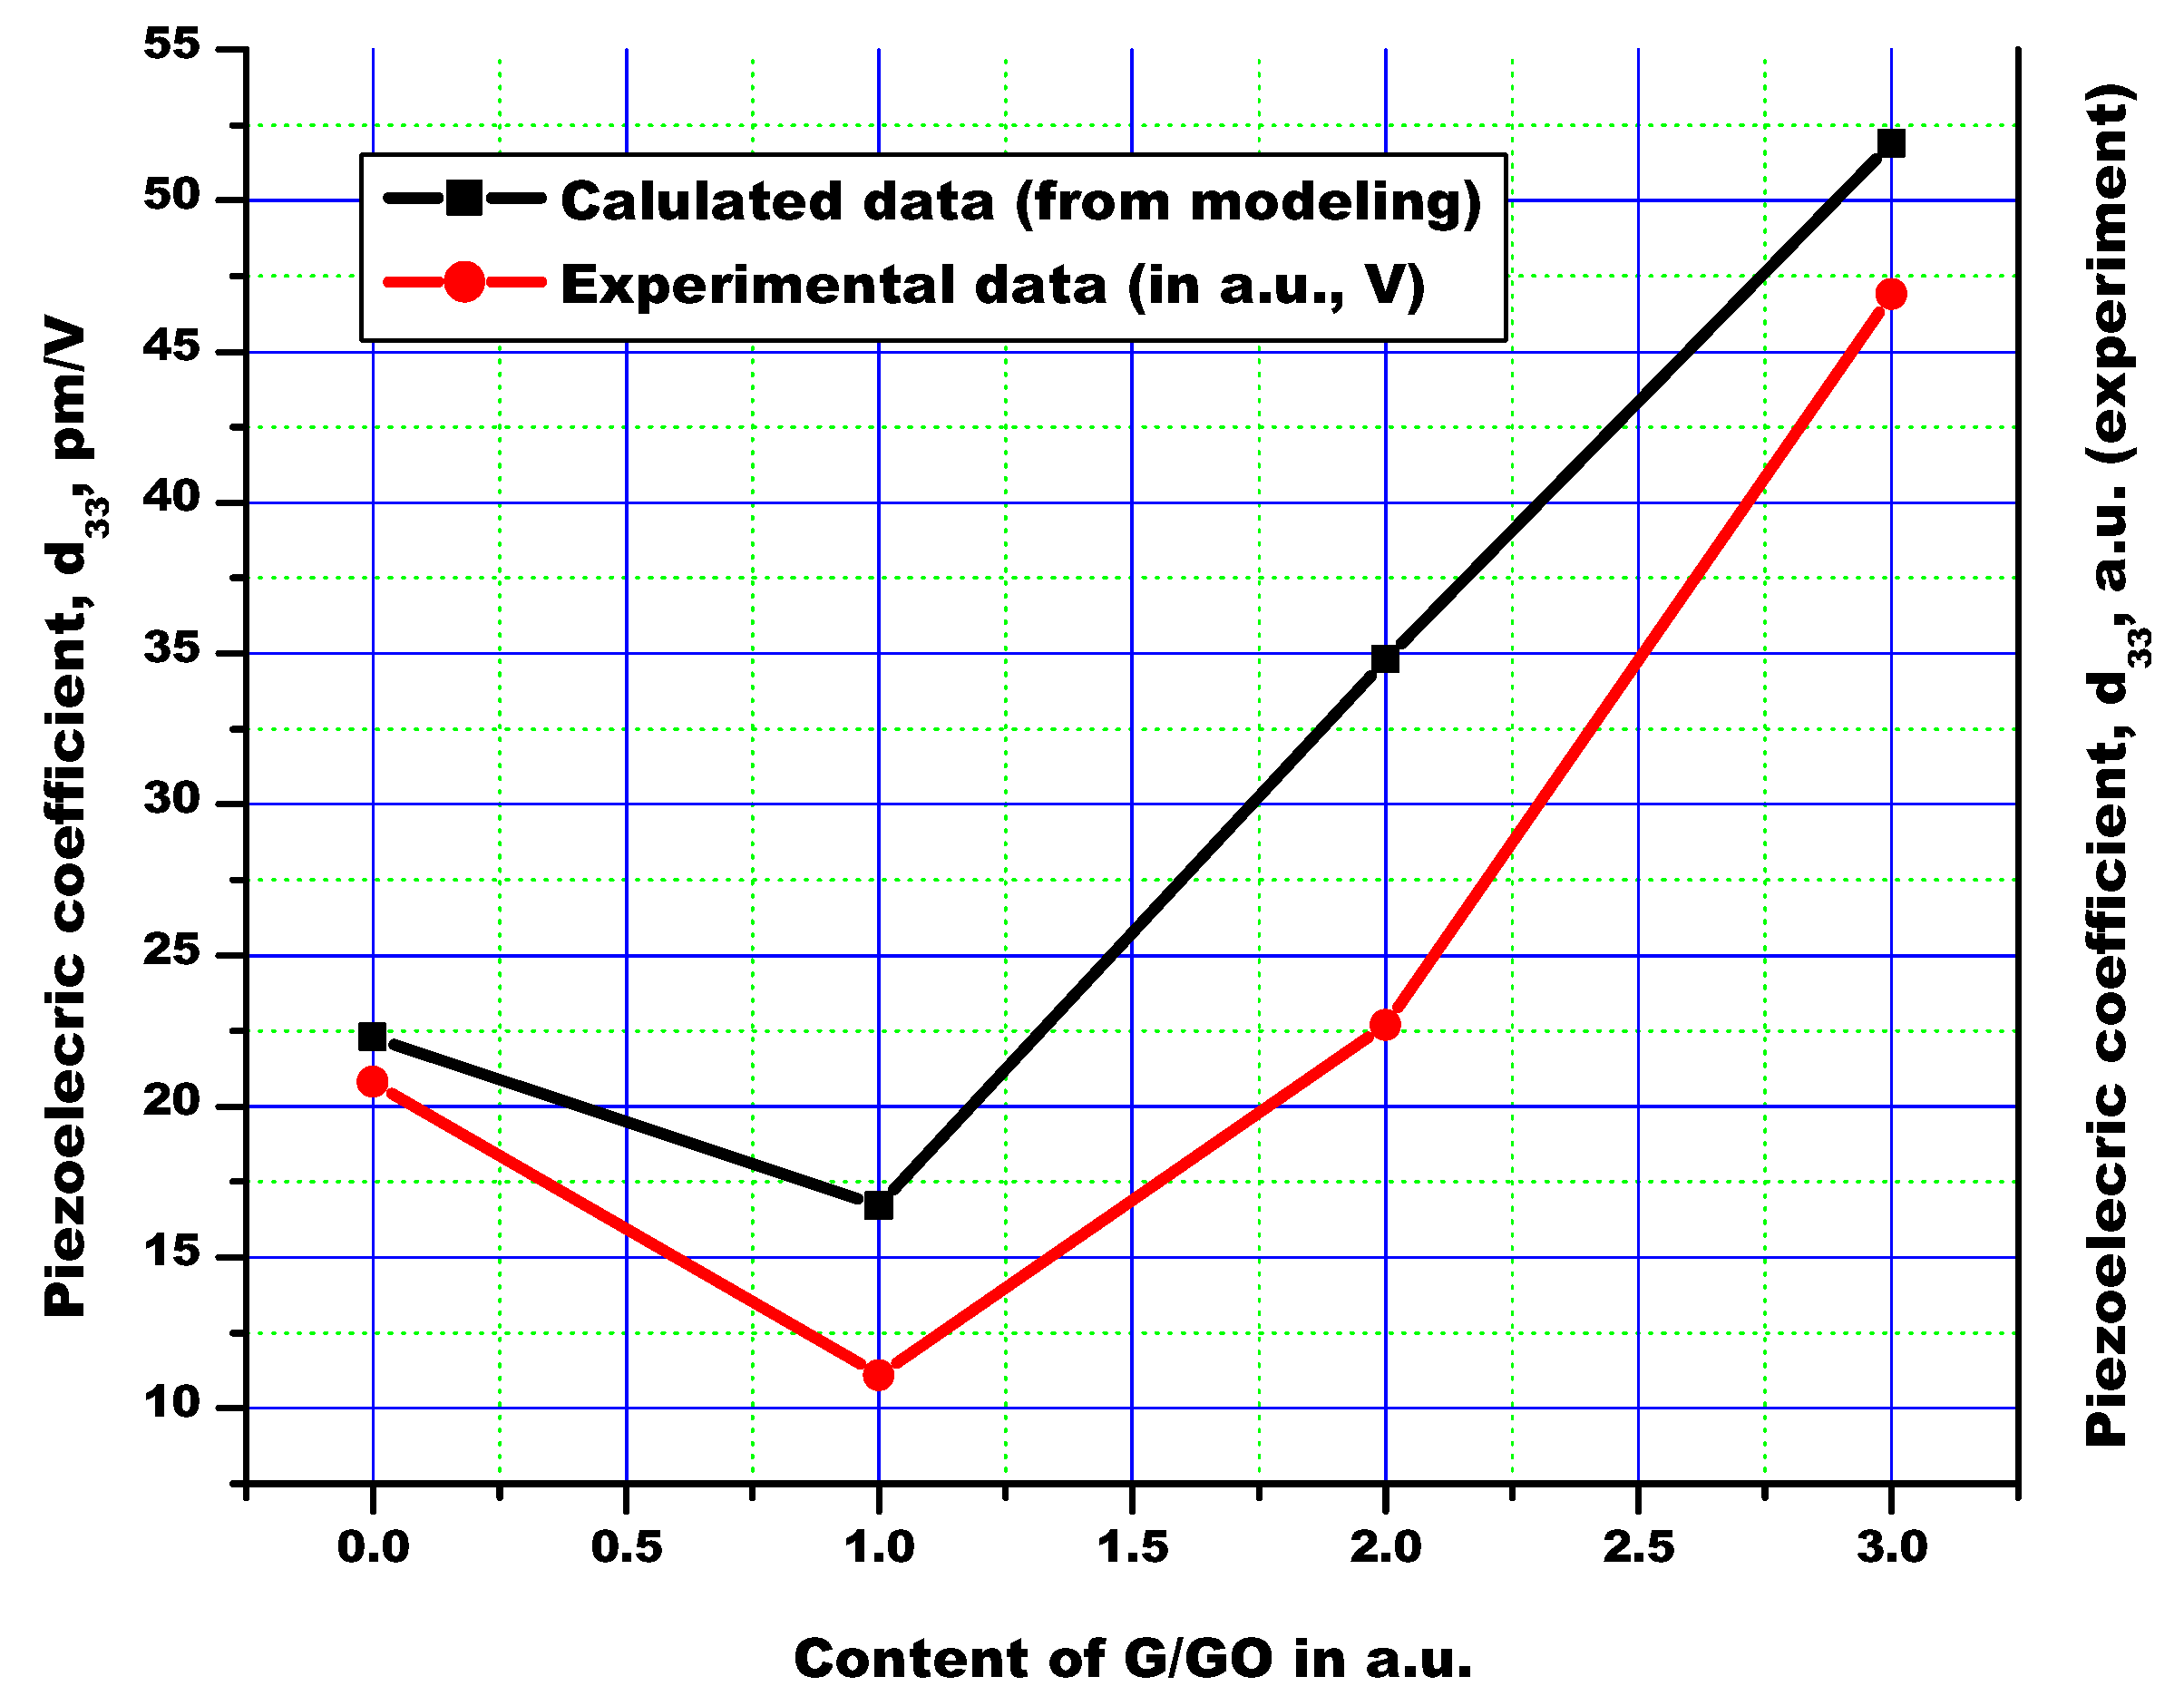
The experimental results qualitatively correlate with those obtained in the calculations (see in
Figure 7 and
Figure 13 and
Table 2). We assume that the experimental data obtained for the composite with small amount of graphene oxide correlate to the model constructed for the PVDF chain interacted with graphene oxide from one side only. The results obtained for this case show a reduction in the piezo-response as well as in the piezoelectric coefficient. From the other side, piezoelectric properties of the composites with larger GO content correspond to the model assuming the sandwich-like clusters in the composite. The experimental data testify a decrease in the piezoelectric signal in these composites which is caused by statistical dispersion and disorientation of graphene oxide layers and PVDF chains (or layers). Uncontrolled thickness of the individual layers of graphene oxide and PVDF component can also affect piezoelectric properties of the composites. Statistical disorder obtained in these cases could not yield an exact match with the simulation performed. However, even at low concentrations, the effect of molecular ordering is observed, and for 20% GO composite the probability of the formation of sandwich structures (as proposed in our modeling) is quite significant. Furthermore, in the case of controlled hetero-structures we can consider a much greater effect and results will be closer to experimental.
Abbreviations used in
Table 2 are the following: GO1 is graphene oxide which contain COOH groups (Gr96N
2O
2H
2COOH
2, which was abbreviated as Gr96NO in [
27]), GO2 is graphene oxide with OH group written as formula Gr96HN
2O
2H
2 above.
We try to consider and discussed here also the case of model with curved PVDF chain and Graphene layers [
25,
26]. This situation could be corresponding to the fiber′s surface—it is a curved surface with some radius R. In the experimental case it is approximately R ~50...100 nm. But in our modeling, we use approximately R ~10 nm (and more) for most bright and expressive influence of such curvatures, which imitates the curved surface. This radius could be simply determined from usual geometry using formula (see about of some geometrical chord (with high
H and length
L) determinations on
Figure 10c:
It is known from the literature that for the case of curved (or flexible) polymers such as PVDF and related materials, the piezoelectric coefficients are changed in this case [
27,
28,
29,
30]. But all computed data used here for our calculation of
d33 and presented on
Figure 11c,d the same as was shown on
Figure 9 (and used in our previous papers [
29,
30]). On
Figure 12c,d are shown the series of such curved models in this case similar as in our previous models (see on
Figure 9,
Figure 10 and
Figure 11) and following results of calculated piezoelectric coefficients are presented in
Table 2 (last two columns for curved models) and on
Figure 13.
We must note that in this situation is very hard convergence of computed data for these curved models during optimization process (searching of the minimum of total energy surface for these complex molecular models using conjugate gradient methods) due their more complex structures. This work will be continued to get better accuracy of the calculations. But now we have only the case of pure Graphene layers (not the Graphene Oxide models—as it is also more complicated for optimization of curved models) and yet have some wide scatter of the data for this case. It should be noted that different types of oxidation (O, OH, COOH etc.) may notably change the functional properties of the composites and appropriate calculations becomes to be quite difficult for conventional computer modelling while these models will be considered in our further works. However, despite on used different units for values of the piezoelectric coefficient, current results clearly show the same trend of changes both for the computed and measured data (see on
Figure 6 and
Figure 13 and
Table 1 and
Table 2).

 ,
, 


