Nanostructure Quantification of Carbon Blacks


John and Willie Leone Family Department of Energy and Mineral Engineering and the Earth and Mineral Sciences (EMS) Energy Institute, Penn State University, University Park, State College, PA 16802, USA
*
Author to whom correspondence should be addressed.
C 2019, 5(1), 2; https://doi.org/10.3390/c5010002
Submission received: 20 November 2018
/
Revised: 8 December 2018
/
Accepted: 21 December 2018
/
Published: 31 December 2018
Abstract
:Carbon blacks are an extensively used manufactured product. There exist different grades by which the carbon black is classified, based on its purpose and end use. Different properties inherent to the various carbon black types are a result of their production processes. Based on the combustion condition and fuel used, each process results in a carbon black separate from those obtained from other processes. These carbons differ in their aggregate morphology, particle size, and particle nanostructure. Nanostructure is key in determining the material’s behavior in bulk form. A variety of carbon blacks have been analyzed and quantified for their lattice parameters and structure at the nanometer scale, using transmission electron microscopy and custom-developed fringe analysis algorithms, to illustrate differences in nanostructure and their potential relation to observed material properties.
1. Introduction
Carbon black is manufactured elemental carbon with customized particle size and aggregate morphology [1]. Produced from the partial combustion or thermal decomposition of hydrocarbons, carbon black is an engineered material, primarily composed of >98% elemental carbon. This number may vary based on its production process and final desired application, where carbon black may be doped with other elements like oxygen, nitrogen, or sulfur to impart solubility, better dispersion or binding properties to the material. The principal uses of carbon black are as a reinforcing agent in rubber compounds, especially tires, and as a black pigment in printing inks, surface coatings, paper, and plastics [1,2]. Worldwide production of the material was estimated at ~13 million metric tons (MMT) at USD ~14 billion in 2015, and is expected to reach ~19 MMT (USD ~20 billion) by 2022 [3]. Approximately >90% of carbon black is used in rubber applications, with the remainder used as an essential ingredient in hundreds of diverse applications, such as plastics, pigments, and coatings [3].
Carbon black is produced by the reaction of a hydrocarbon fuel, such as oil or gas, with a limited supply of combustion air at temperatures of 1300–1500 °C [4]. Carbon black was first manufactured in the 1930s using the Channel Black process, with natural gas, the feedstock, developed in the United States, and the Gas Black process, using coal tar as feed, developed by Degussa in Germany [1]. Both processes used flames impinging on cold surfaces to produce the material. However, owing to environmental and safety concerns, the Channel Black process phased out, but manufacturing with the Gas Black process continued given its environmentally friendly technology and handling [1]. These two processes paved the way for the heavy use of carbon black in the automotive industry in the two nations, respectively. Two major processes are presently used in the United States to manufacture carbon black: (a) the oil furnace process and (b) the thermal process [1,4]. The Furnace Black process is the most recently developed and widely used process for carbon black manufacture, accounting for >95% of production [1]. This process is a continuous one which uses heavy aromatic oils as feedstock and natural gas as the heat source. The production furnace uses atomizing nozzles in a closed refractory-lined reactor to pyrolyze the feedstock oil. Primary quench water cools the gases to 500 °C to stop the cracking. The Thermal Black process accounts for <5% of carbon black production and uses natural gas, primarily methane, as a feedstock material. The process uses a pair of furnaces that alternate approximately every five minutes between preheating and carbon black production. The natural gas is injected into the hot refractory-lined furnace and, in the absence of air, the heat from the refractory material decomposes the natural gas into carbon black and hydrogen. The aerosol material stream is quenched with water sprays and filtered in a bag-house. Other processes, such as the lamp process for the production of lamp black and the cracking of acetylene to produce acetylene black, are specialty processes comprising <2% of carbon black production. The Lamp Black process is one of the oldest commercial carbon black processes. It uses an aromatic oil based on coal tar that is heated in a flat cast-iron pan to produce carbon black. The Acetylene Black process is categorized as a Thermal Black process, except that acetylene is the feedstock, and the carbon black is generally not processed into pellets. Acetylene black is a specialty carbon black owing to its purity of carbon and conductive properties, making it a key ingredient as a conductive additive in polymer compounds or in battery manufacture among other uses.
Applying the terminology of the International Organization for Standardization’s (ISO) Technical Specification 80004-1 of 2015, carbon black is considered a nanostructured material (i.e., a material having internal or surface structure in the nanoscale). A generally accepted model is the crystallite model, wherein the primary particles are comprised of numerous crystallites oriented circumferentially. Each crystallite or basic structural unit consists of a turbostratic stack of short lamellae [5]. Though morphology and size have been well documented, yet remaining is the nanostructure, and in particular the differences between carbon blacks produced by the four processes in present practice. This work aims to bring to the reader’s attention the variations in nanostructure observed due to different manufacturing conditions for the carbon blacks. Nanostructure, in turn, dictates particle and material behavior and interaction at the macro scale. For instance, degree of reactivity of the material is based on available reactive edge sites. The use of carbon black as a filler depends on the matrix-filler interfacial interaction at the nanometer scale. Nanostructure modification can also impart conductive properties to the carbon black. Presented here is a comprehensive and comparative overview of the differences between these materials, to help make better choices when using these as they are or as model materials for fundamental studies on carbon.
2. Materials and Methods
Furnace Black is from Cabot Corp. (Boston, MA, USA), thermal black is from Cancarb Ltd. (Medicine Hat, Alberta, Canada), and Lamp Black and Channel Black are from Degussa (now Orion Engineered Carbons, Frankfurt, Germany). Acetylene black is shown to illustrate the possible variation in morphology and nanostructure by changing reaction and processing parameters. Type-1 acetylene black is from AkzoNobel (Amsterdam, Netherlands) and Type-2 acetylene black is from Soltex Inc., (Houston, TX, USA).
Bright field high resolution images for carbon nanostructure analysis were obtained using a Talos F200X (Field Electron and Ion Company (FEI), Hillsboro, OR, USA) equipped with a 200 keV Field Emission Gun (FEG) source and an information limit of 0.12 nm. Trade-off between image resolution and contrast was observed to be optimum with a 70 µm objective to collect the desired high-resolution images for quantification in this work. Particles were imaged close to Scherzer defocus. Samples were sonicated in methanol before being dropped onto 300 mesh lacey C/Cu TEM grids.
Image quantification by fringe analysis has been done using custom-developed algorithms in-house, with details described in related works outlining code development [6,7]. More than 10 regions of a TEM grid were analyzed with a total of >60 images collected per sample. Of these, we analyzed ~10 representative images of the particle and its nanostructure for this work.
3. Results
Transmission electron microscopy (TEM) has been used to visualize and subsequently quantify parameters of each of the different types of carbon blacks mentioned above. TEM micrographs representing these different carbon blacks are shown in Figure 1 and Figure 2.
3.1. Length Scales
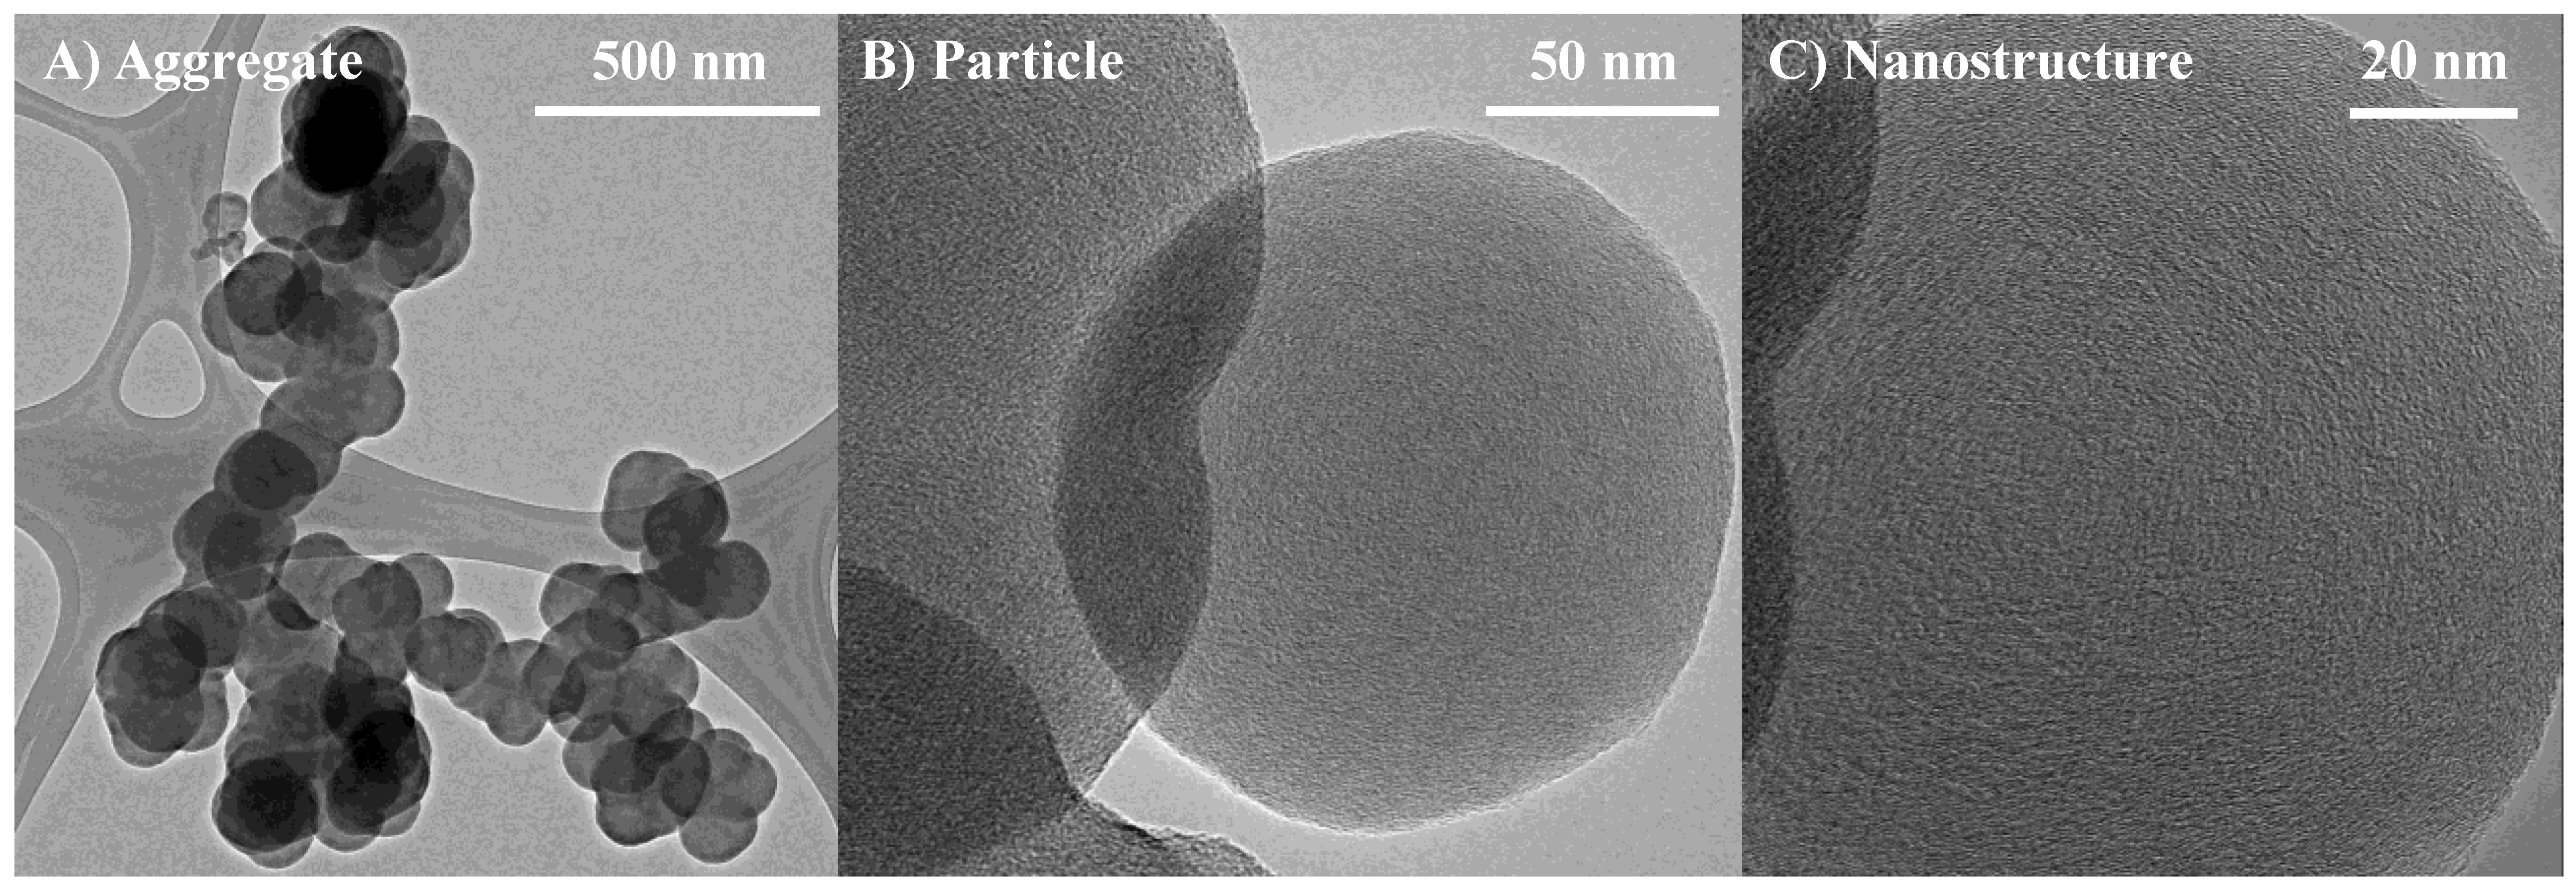
Carbon black exhibits a hierarchy of length scales: (a) nanostructure (i.e., internal to primary particles), (b) spheroidal primary particles, and (c) their collective bonding as aggregates. An illustration of these length scales is shown in Figure 3. Each of these metrics are distributional properties and vary depending on the carbon black grade.
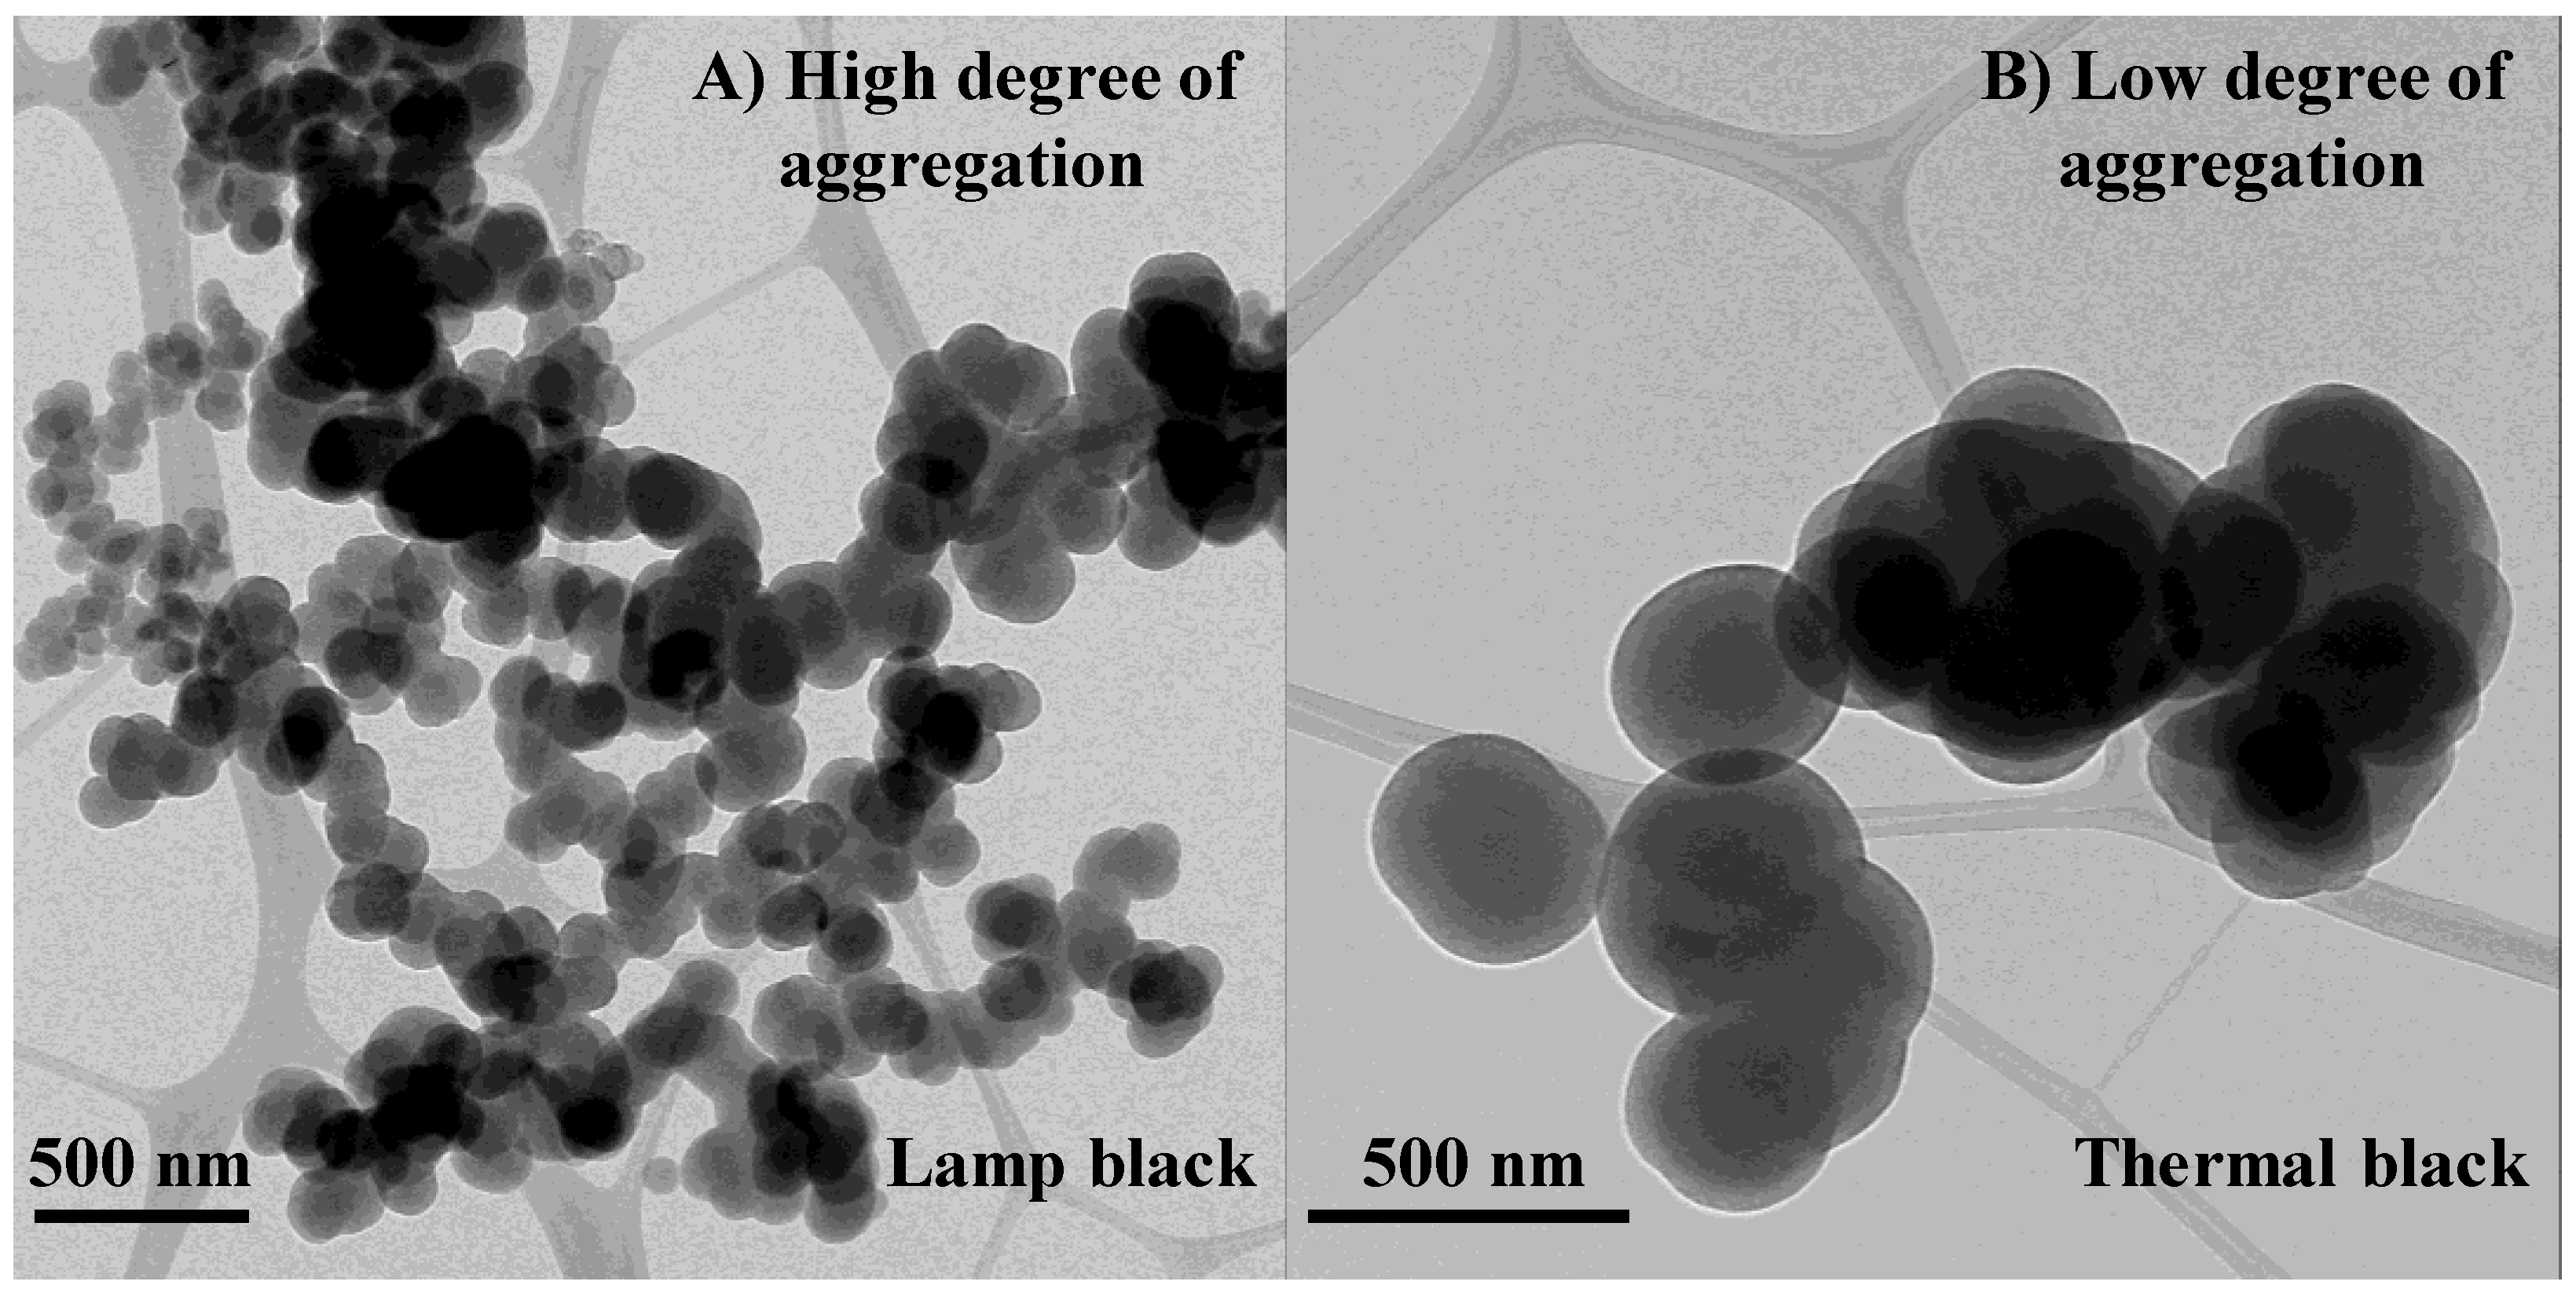
The shape and degree of branching of the aggregates are referred to as its structure [8]. The structure of carbon blacks is well-characterized by diverse grades, differing in primary particle size and aggregate morphology depending upon the application for which it was engineered. The structure level of carbon ultimately determines its effects on several important in-rubber properties. Various carbon black grades can be divided into tread grades, for tire reinforcement, and non-tread grades, for non-tread tire use, to impart antistatic and electrically conductive properties. Increasing carbon black structure, i.e., the degree of aggregation and the dendritic nature of the aggregates, increases modulus, hardness, electrical conductivity, and improves the dispersibility of carbon black, but also increases compound viscosity. The particle size, structure, and surface area of carbon black play a significant role in the material properties of rubber, plastics, and other products as well [4,9]. For instance, the size of the primary particle largely determines the carbon black surface area and tint. Thus, carbon black is manufactured in many grades to meet the varying material needs and application specifications. In general, carbon black grades with smaller particle size have better reinforcing and abrasion resistance qualities than those with larger particle size. Examples of carbon blacks with high and low degrees of aggregation (i.e., number of primary particles per aggregate and dendritic vs. compact nature of the aggregate) are shown in Figure 4.
3.2. Nanostructure Quantification
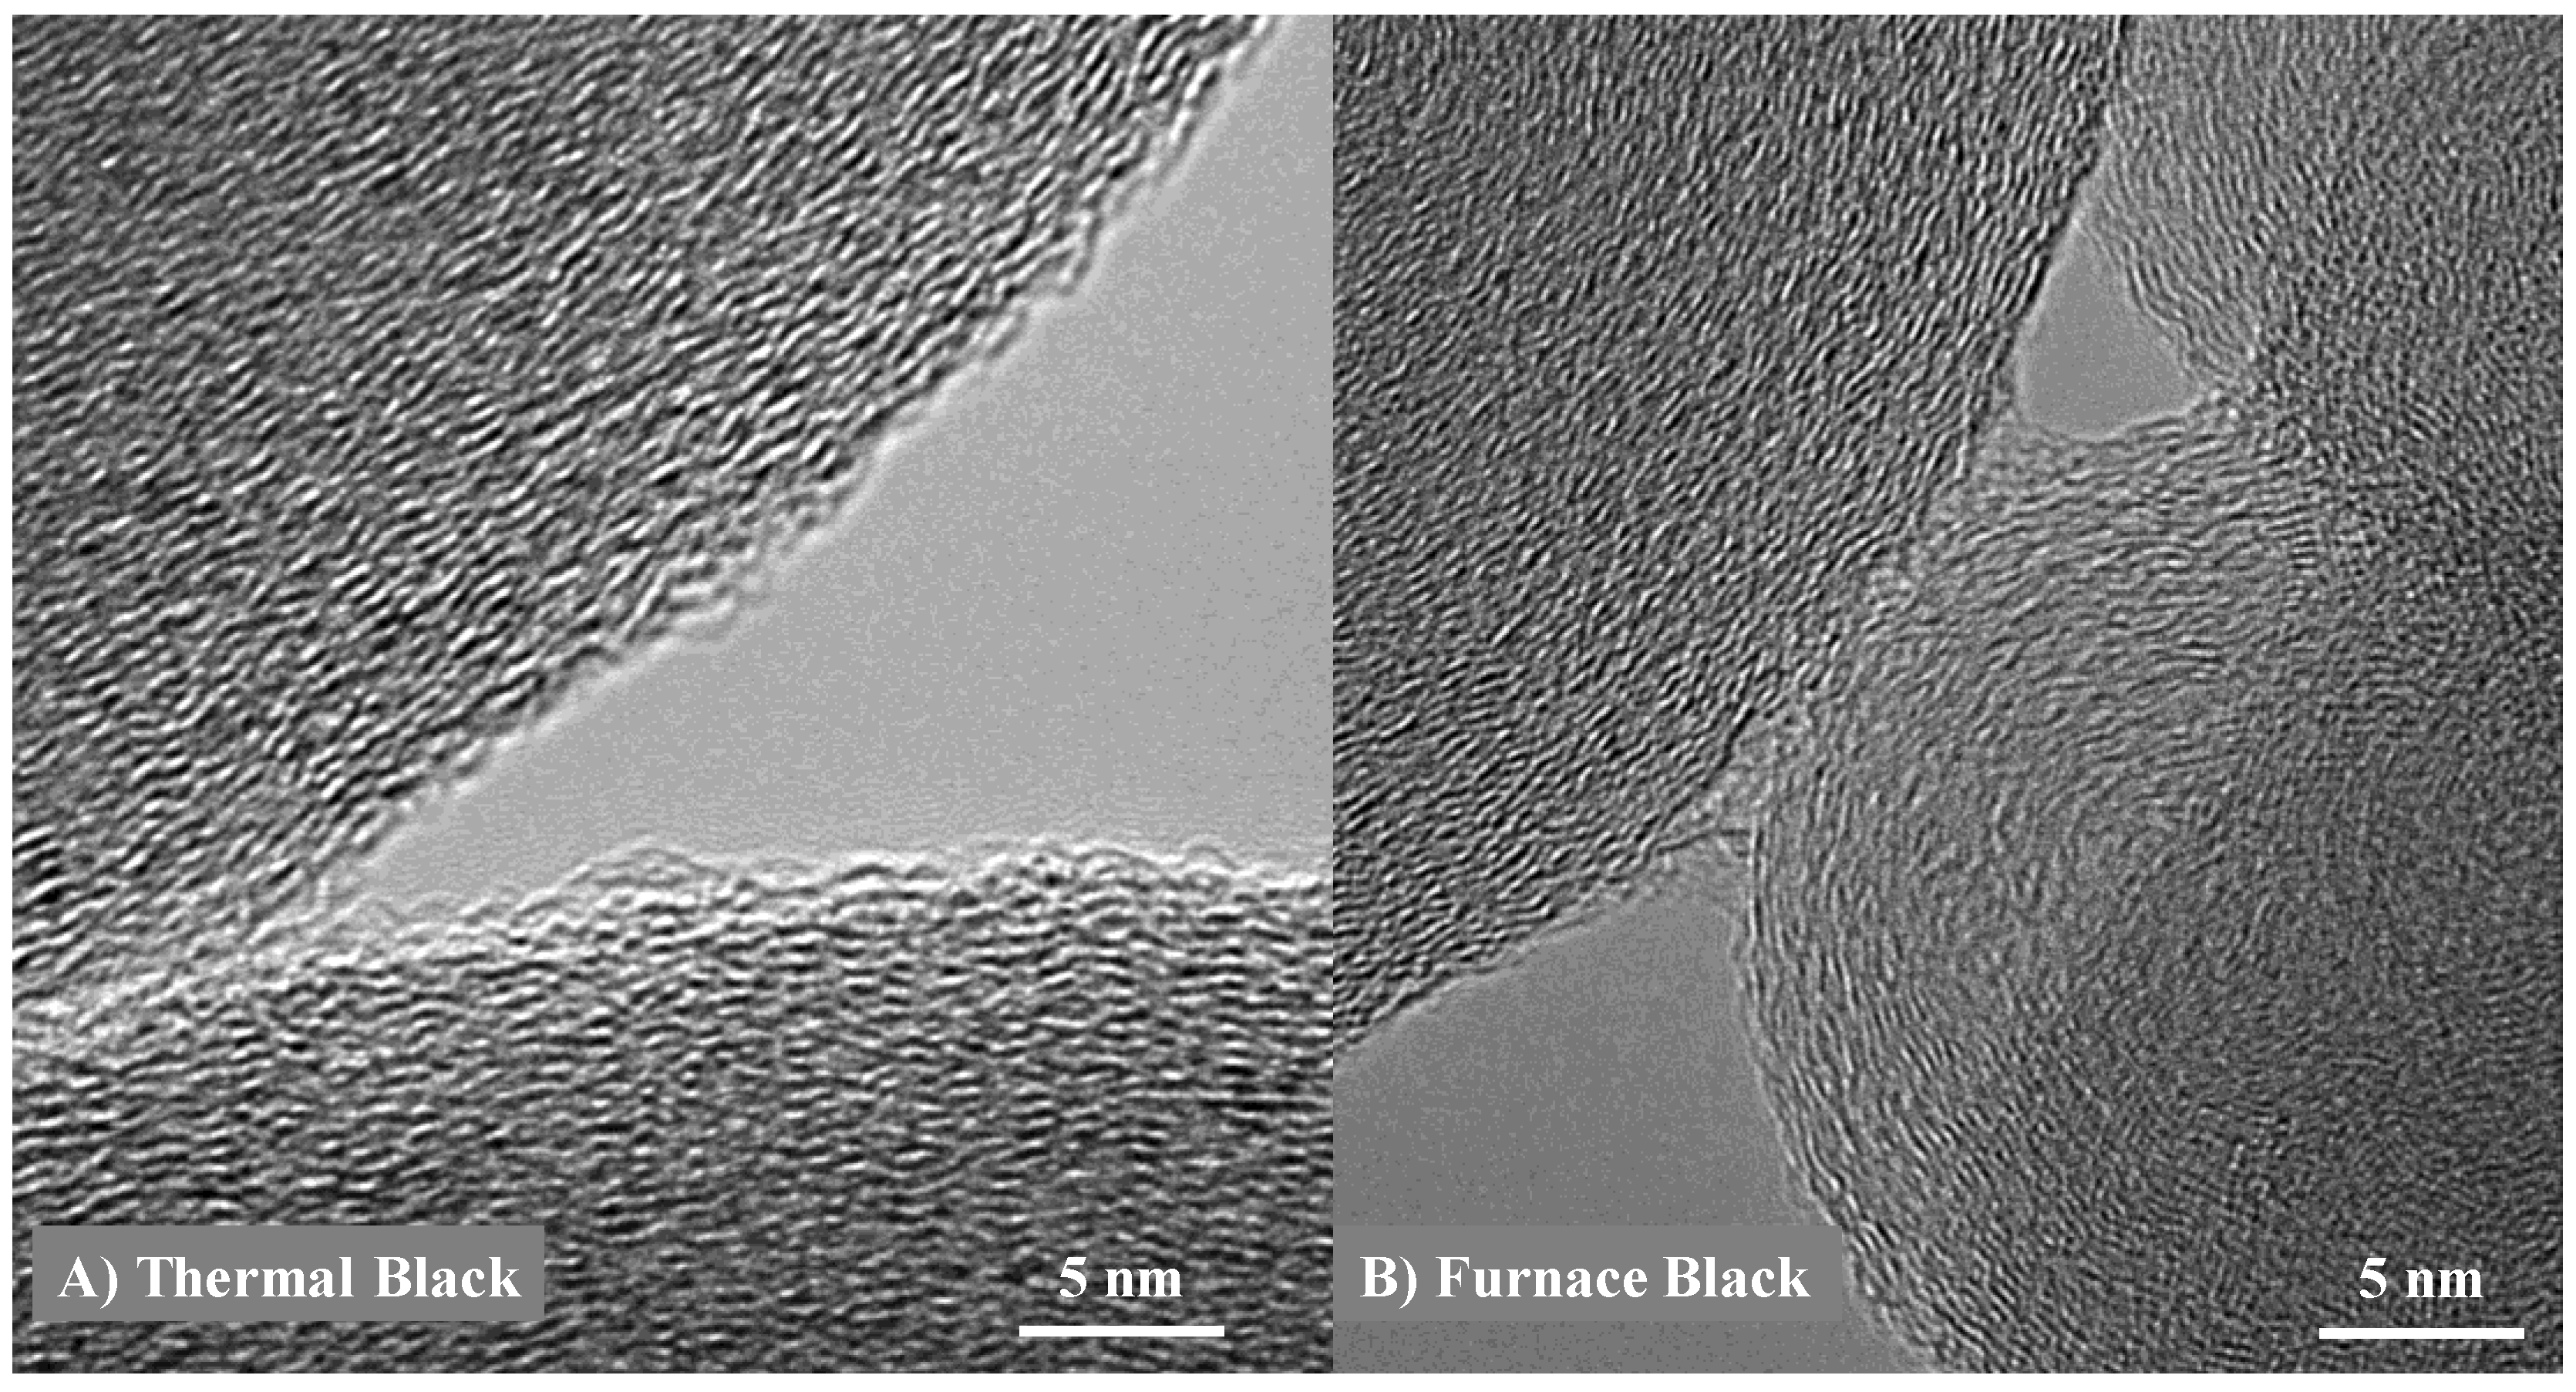
Nanostructure is defined as the detailed physical metrics of carbon lamellae within primary particles, such as lamella length, curvature or undulation of the carbon lamella, and spacing between lamellae [10]. Individual graphene segments (dark lines) observed in a high-resolution TEM (HRTEM) image are referred to as lamellae. Nanostructure has been illustrated in Figure 5, with the image showing the internal structure of the particle of a thermal and a furnace black respectively.
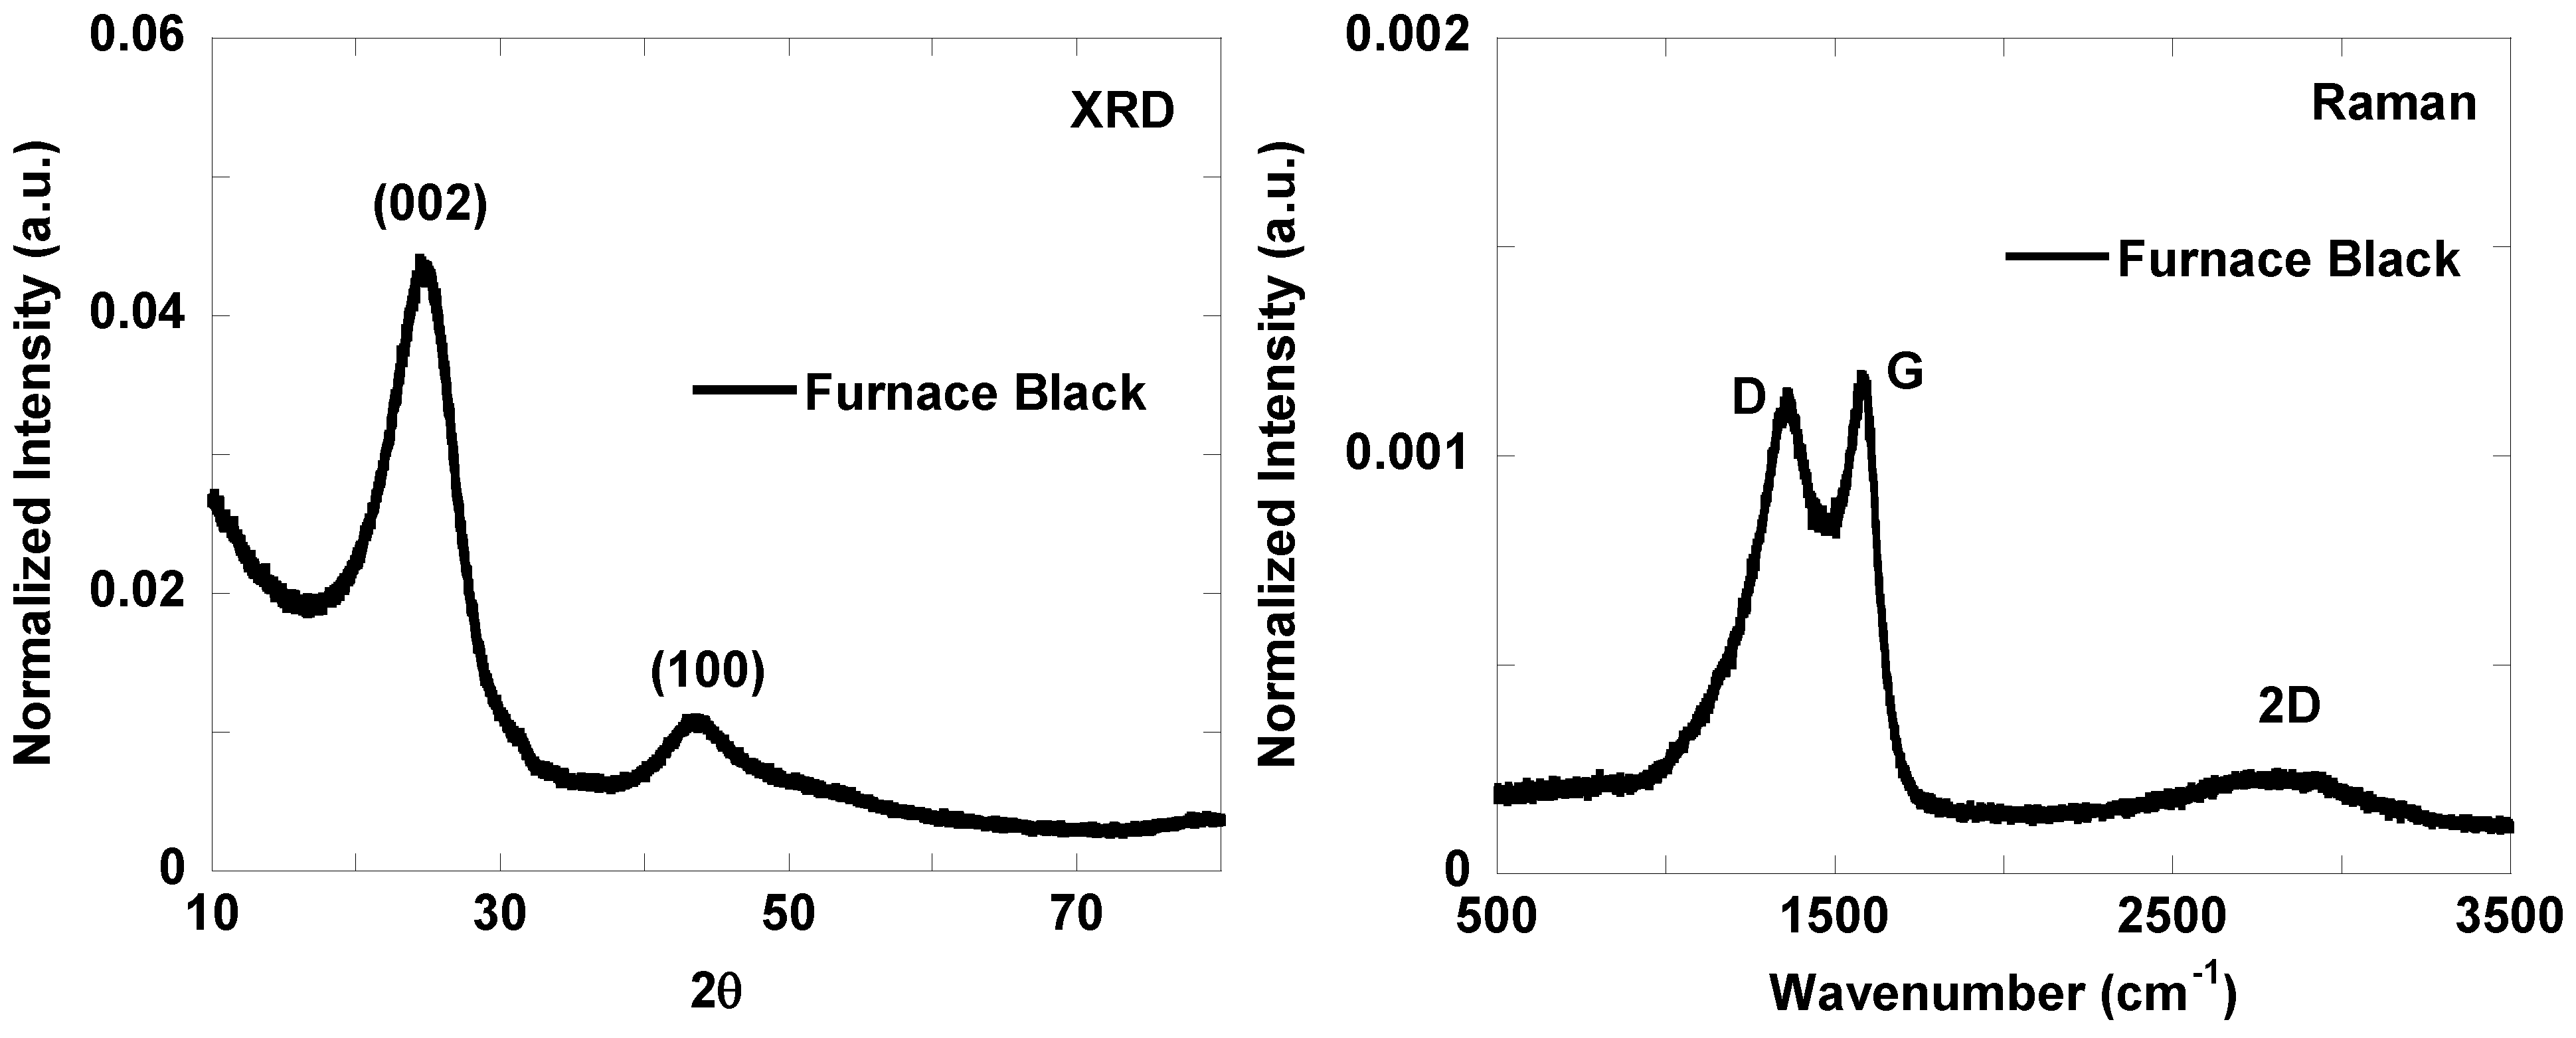
X-ray diffraction (XRD) has been one of the oldest techniques used to quantify material nanostructure though Bragg’s law for layer plane spacing and Scherrer’s equation for crystallite dimensions [11,12,13]. Raman spectroscopy, given its ease of measurement, has also been widely used to study the degree of order (or lack thereof) in carbonaceous materials [14,15,16,17,18]. An example of XRD and Raman for the furnace black is shown in Figure 6. XRD samples weighed ~1 g spread flat on a 25 mm × 25 mm flat sample holder with a ~1 cm diameter depression at its center to hold powdered samples. Raman spectra were obtained, with the powdered sample on a glass slide and spectra collected in DuoScan mode from a 20-micron diameter region. All XRD profiles were fitted for lattice parameter calculation with a residual (R value) of <3%. Following this, lattice parameters calculated for the different carbon black types from XRD are tabulated in Table 1. d002 refers to the d-spacing between two consecutive carbon layer planes, Lc is the c-axis stacking, and La refers to the lateral extent of these layer planes.
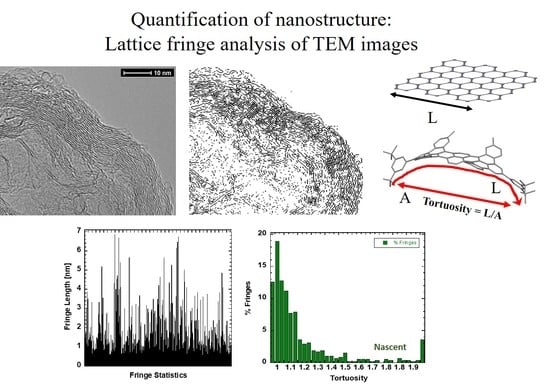
Techniques such as Raman or XRD provide a composite average given their spatial averaging. A more detailed rubric by which to understand the nanoscale structure of carbon materials, and in particular carbon blacks, are afforded by quantification of HRTEM images. HRTEM offers a spatial resolution of the primary particle directly, and qualitatively visualizes the lamellae as “fringes” in bright field contrast. Fringes in high-resolution bright field phase contrast images represent the carbon lamellae within the primary particles, and may be analyzed for spatial metrics. Lattice fringe length is a measure of the physical extent of the atomic carbon layer planes as seen in the HRTEM image. Larger lengths correspond to larger crystallites and correspondingly fewer edge sites. Developed over 15+ years, our fringe analysis algorithms quantify nanostructure, particularly lamellae length, by analysis of HRTEM images [6,7].
3.3. Fringe Analysis
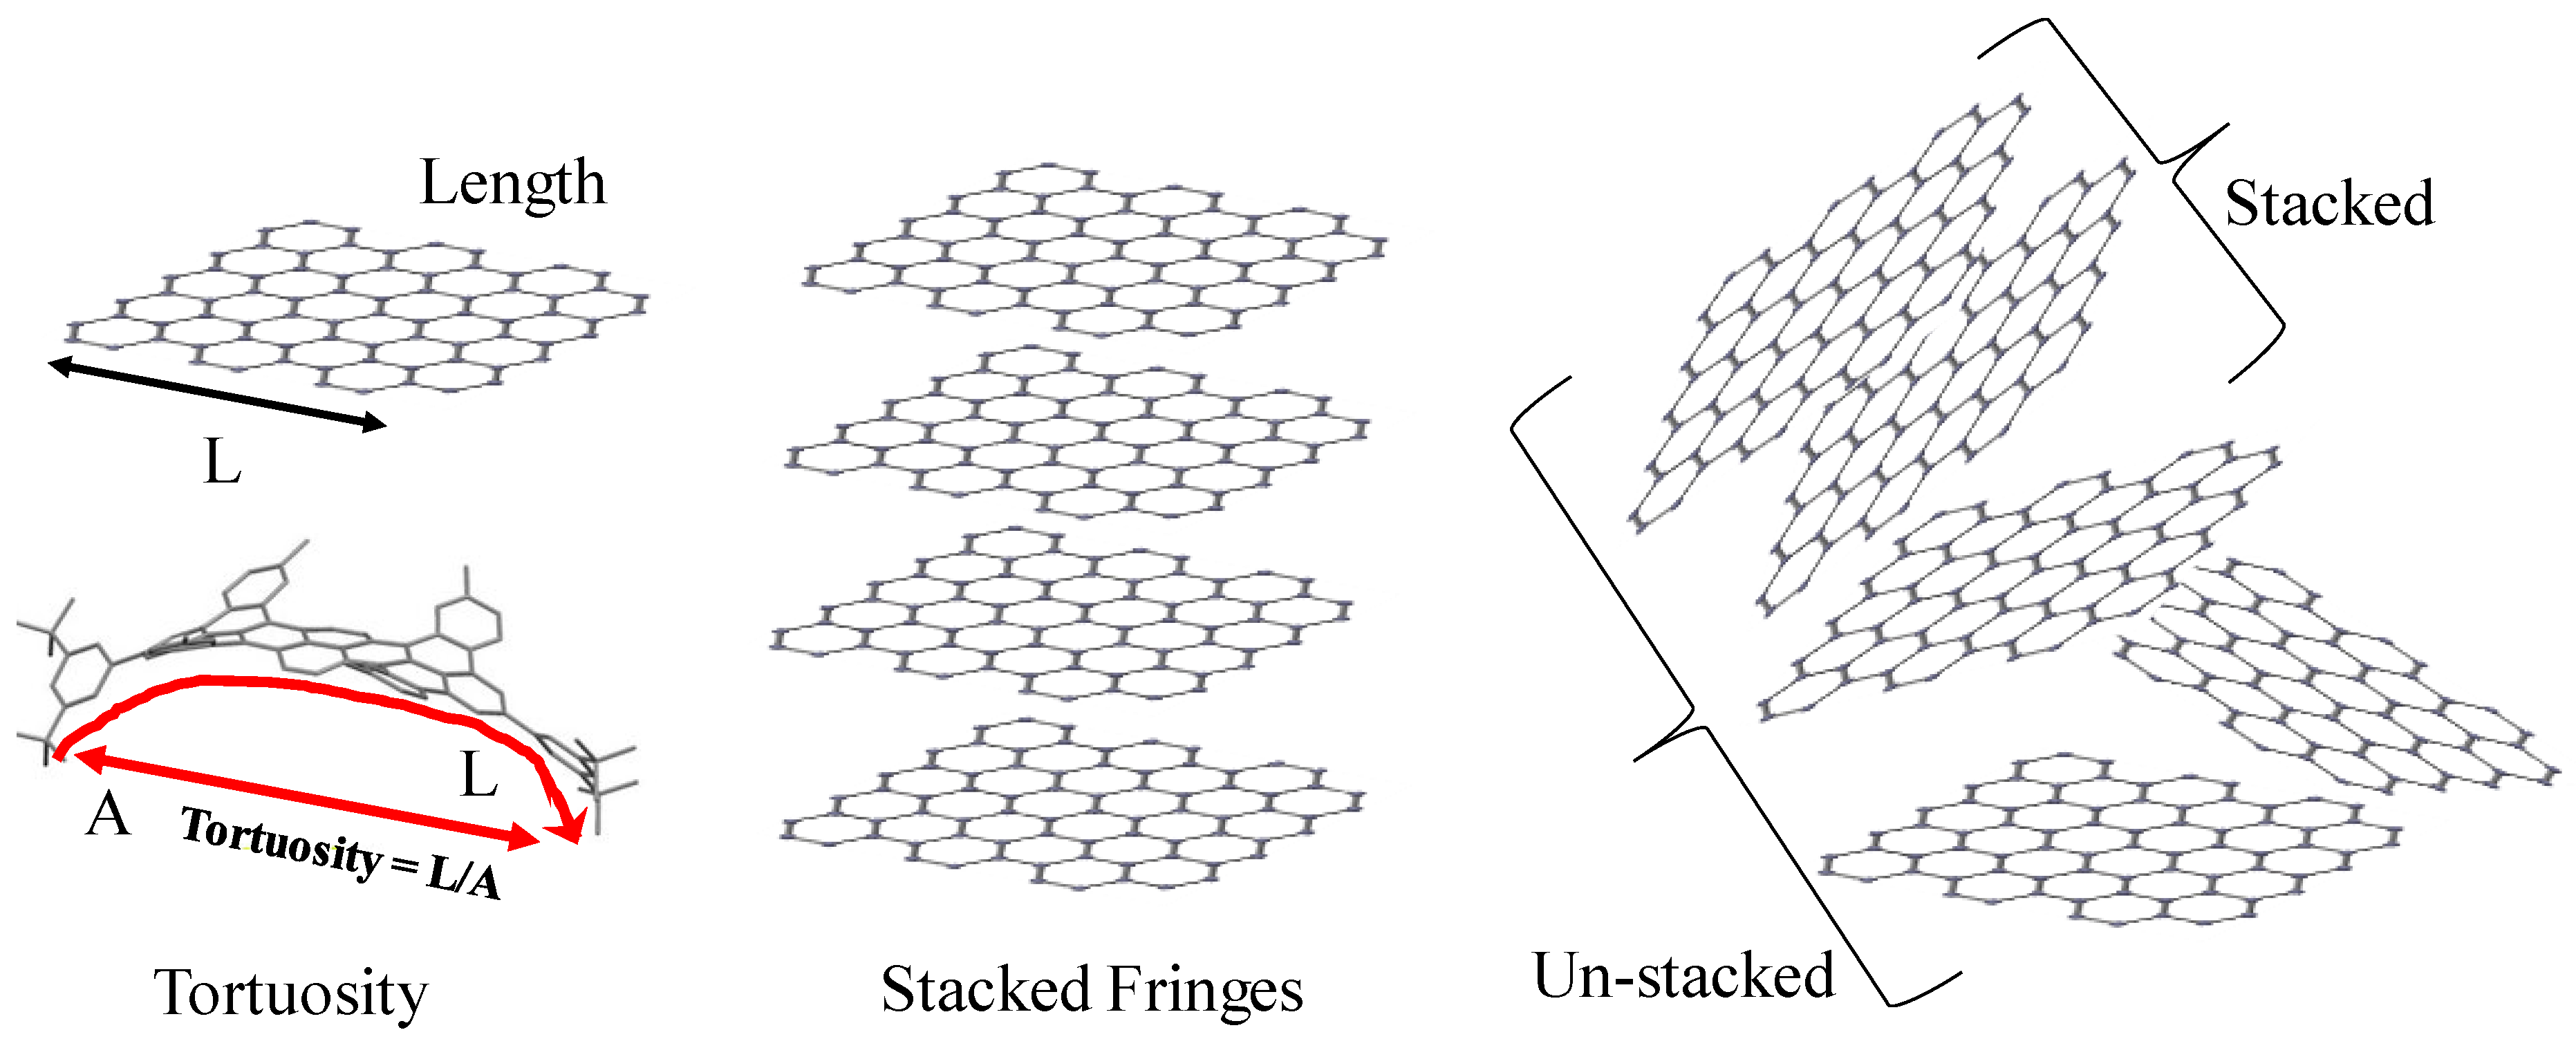
The TEM has long been used to study carbonaceous materials [19,20,21]. Lattice fringes, formed by the constructive interference of the transmitted and diffracted beams in a TEM, provide a reconstruction of the lamellae structure, and can be used to quantify the nanostructure of the carbon black and differentiate between materials based on their lamellae arrangement. Fringe analysis algorithms [6] are applied here to quantify fringes for their length, tortuosity (or undulation), and their stacking, as metrics of nanostructure [10]. Fringe length is the end-to-end distance measuring the fringe along its length, while tortuosity is defined as a ratio of its length to the shortest distance between the fringe’s endpoints. Thus, a straight fringe would exhibit a tortuosity of one, as the shortest distance between its endpoints will coincide with its length. Fringes can be arbitrarily oriented, or they can be stacked with respect to one another. The stacking of fringes is analyzed using an available stack analysis algorithm [22]. This algorithm analyses the image and groups fringes into stacks if they fulfil a user-defined orientation criterion to qualify as a part of a stack. This criterion involves a threshold distance—a maximum angular and lateral displacement below which the fringes will be a part of the same stack. If a fringe is far-displaced laterally or angularly, it will not be a part of one stack, but can form a part of a different stack for which it lies within the defined threshold parameters relative to its neighboring fringes. These parameters have been represented by the schematic in Figure 7.
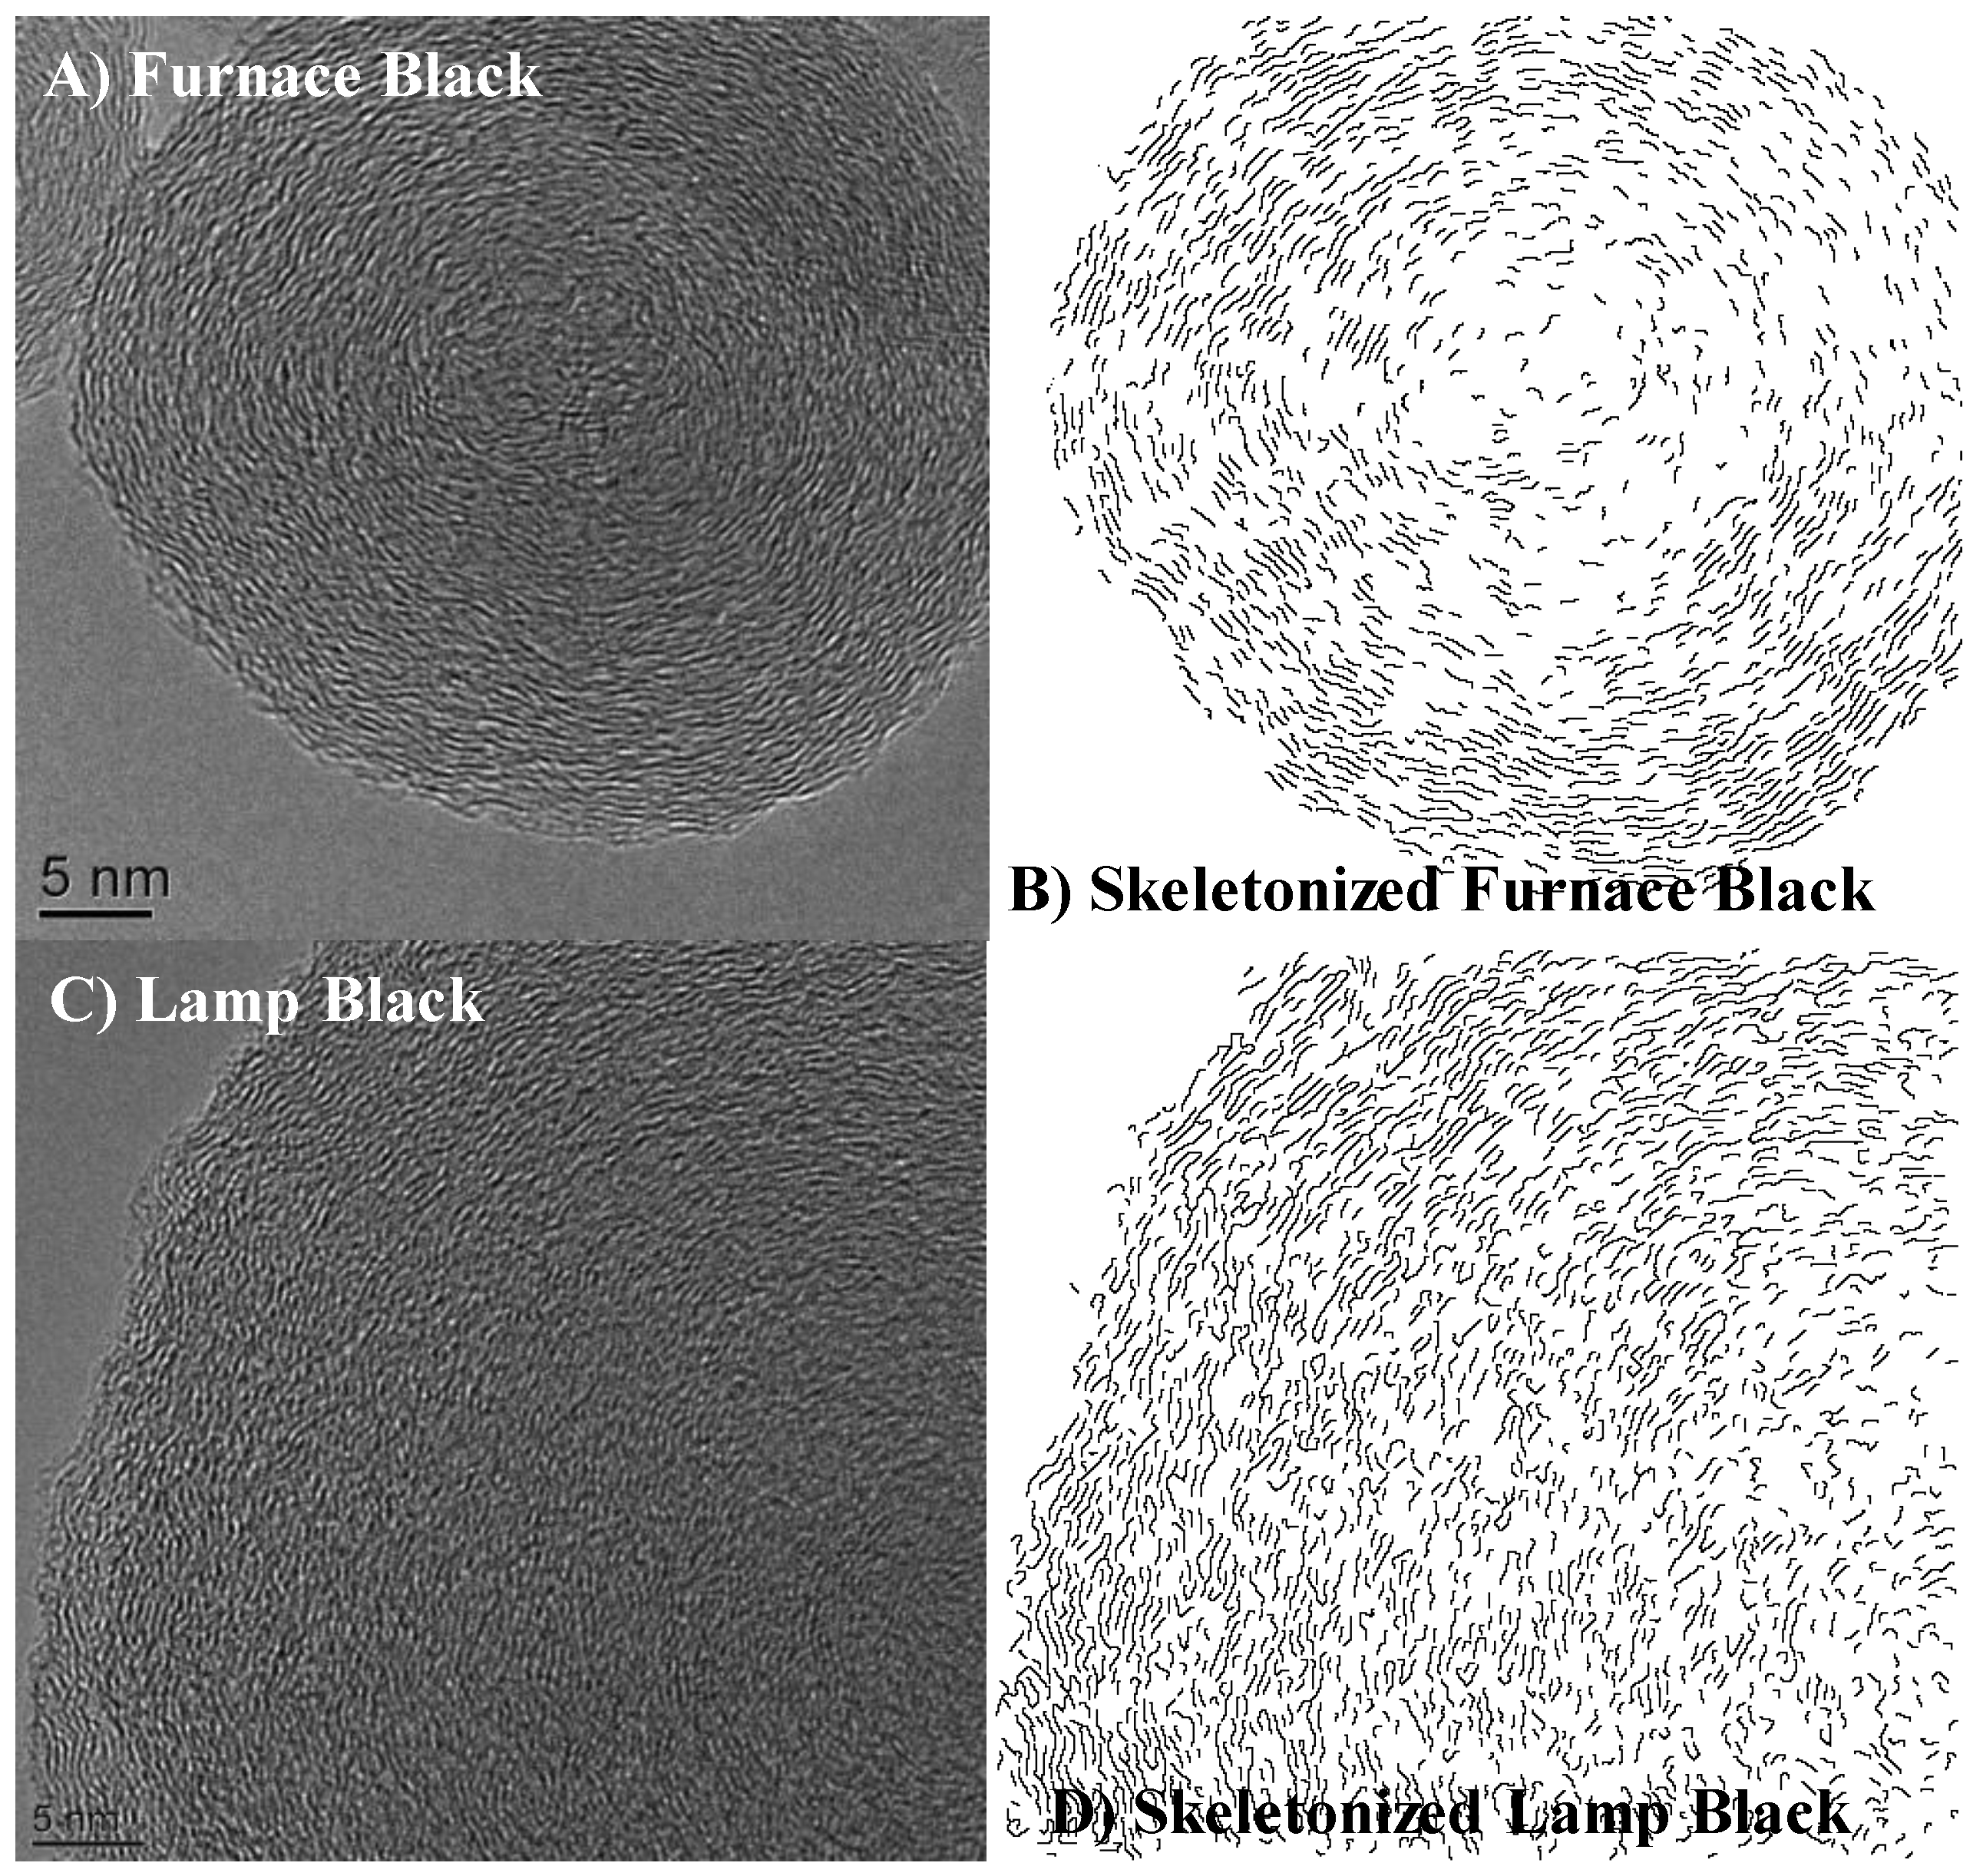
Our custom algorithms quantify nanostructure for lamellae length, tortuosity, and separation distance [6,7,23]. For consistency across samples, analysis for fringe length and tortuosity have been demonstrated, with fringe spacing calculation being a challenge for acetylene and thermal blacks, for instance. Figure 8 outlines the capabilities of these algorithms. Regions of interest can be selected on an HRTEM image, after which the image is skeletonized and fringes are identified by adjusting the contrast of the image. Their application permits translating image data to quantitative distributions of physical scale (e.g., lamellae lengths) for statistical analyses. During such processing binary, so-called “skeletal” images are created, as illustrated in Figure 8.
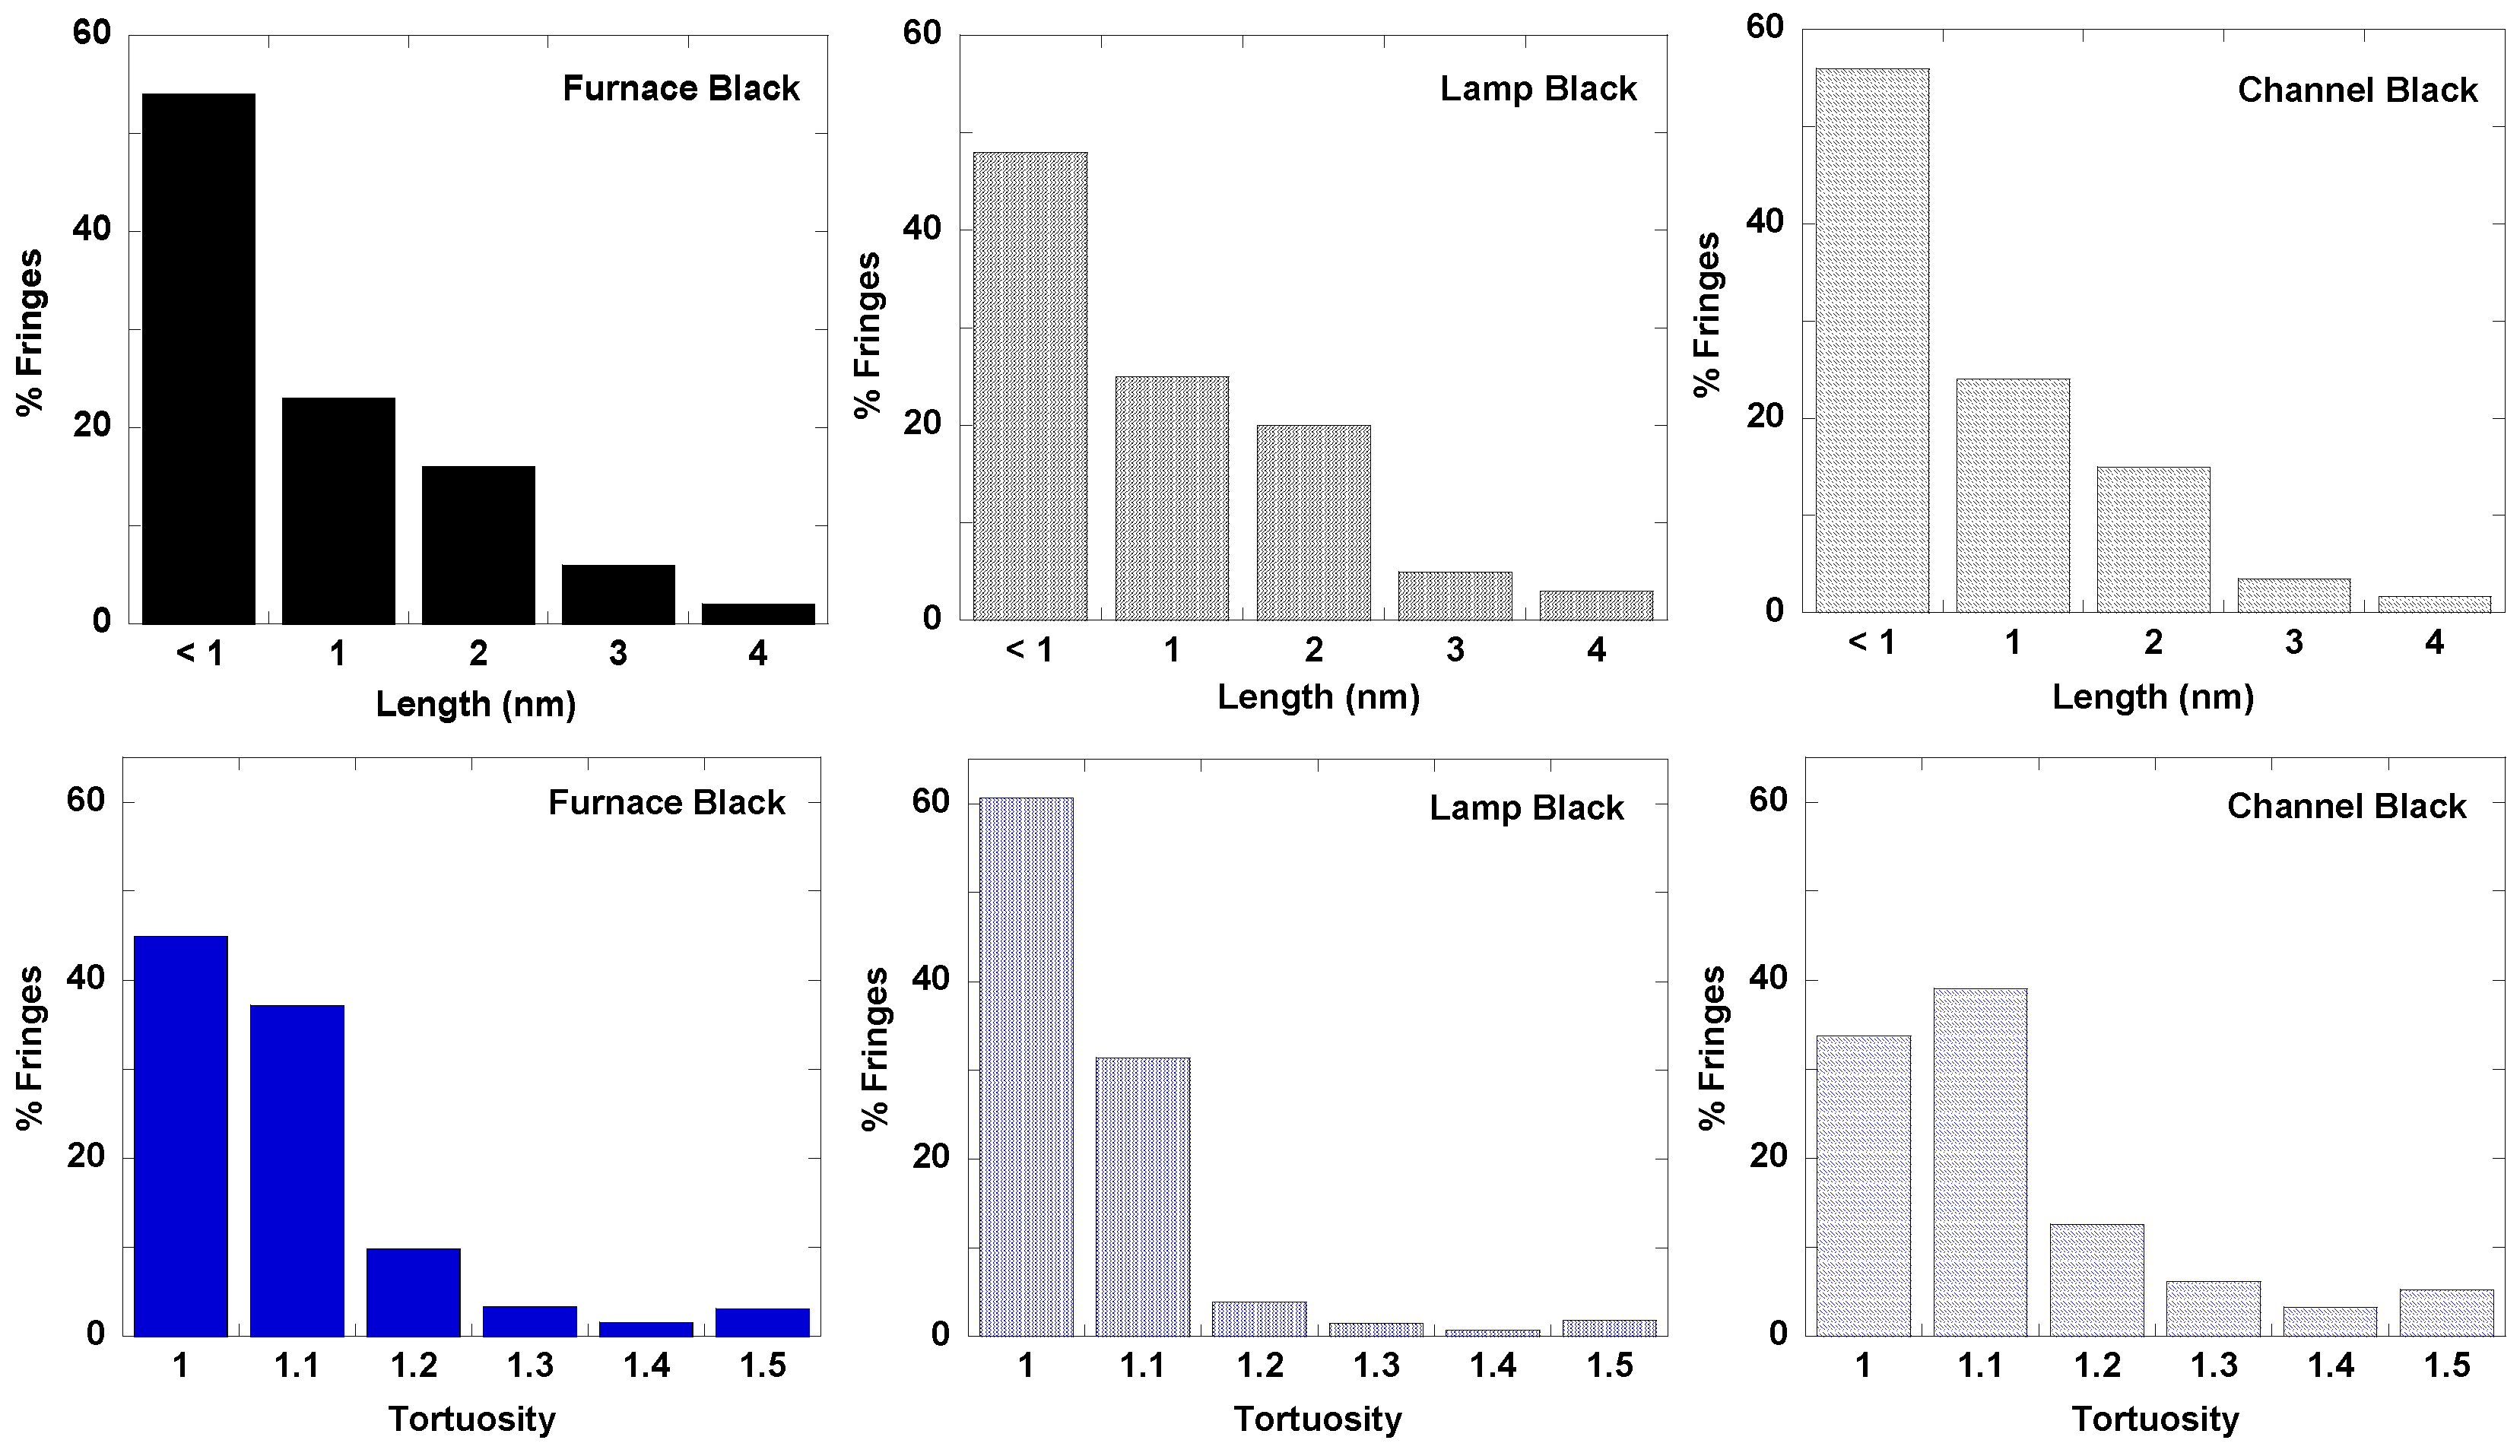
Fringe statistics of length and tortuosity can then be extracted from the binarized and skeletonized images. These are plotted for furnace, lamp, and channel black in Figure 9, and for the two grades of acetylene black in Figure 10. Owing to the high density of fringes for thermal black (as shown in Figure 5A), fringes could not be distinctly and reliably measured by the algorithm and therefore have not been presented here.
Fringe statistics give an overview on nanostructure quantification and provide the user with a better metric to describe the carbon black particle with reference to its nanostructure. With HRTEM and its quantification, nanostructure is seen to be different based on the carbon black production process, with each process resulting in carbon black suited to a desired purpose.
While these are 3D objects, they are all well less than 100 nm, and as such, electron transparent. Additionally, while there is a radial variation in mass-thickness contrast, the added diffraction contrast at high magnification does permit visualization of crystalline nanostructure and subsequent fringe analyses. It is true, however, that despite location of the image plane (focusing/defocusing conditions), some distortion of the interfering wave fronts does occur due to internal “scatter”. This manifests as loss of sharpness, but not fringe reduction. All images have some contrast variation along fringes that can lead to artificial breaks, but the ‘join’ parameter in the algorithms offsets this effect. However, the thermal black defines the limit of sufficient image contrast. As other studies of carbon blacks and flame-formed carbons show, often there is a lack of quantifiable (nano)structure at particle cores. Relative to metal or metal oxides, carbon d002 fringes have a particularly large spacing, beneficially mitigating such blurring, as it would severely limit similar analyses on these other materials.
Lattice parameters calculated after peak deconvolution of Raman and XRD data result in one value of La for the material. Fringe analysis as described here gives the distribution around this one reported, seemingly averaged value typically reported by XRD and TEM. These techniques have their advantages in not requiring sample preparation and image processing, but image quantification using TEM helps the user understand the type and spread of the distribution of fringe lengths to better characterize the carbon black.
4. Discussion
Direct surface characterization of carbons is difficult. Beyond textural measurements, assessing reactive sites entails adsorption/desorption using varied gases as probes. While yet allowing quantification of adsorbed gas, prior surface history, heterogeneity, and measurement parameters often make definitive interpretation problematic. Nanostructure, with metrics derived by quantification of HRTEM images validated against XRD for lamellae spacing and Raman for lamellae length [6], is a useful metric for surface and internal structure characterization of carbon blacks.
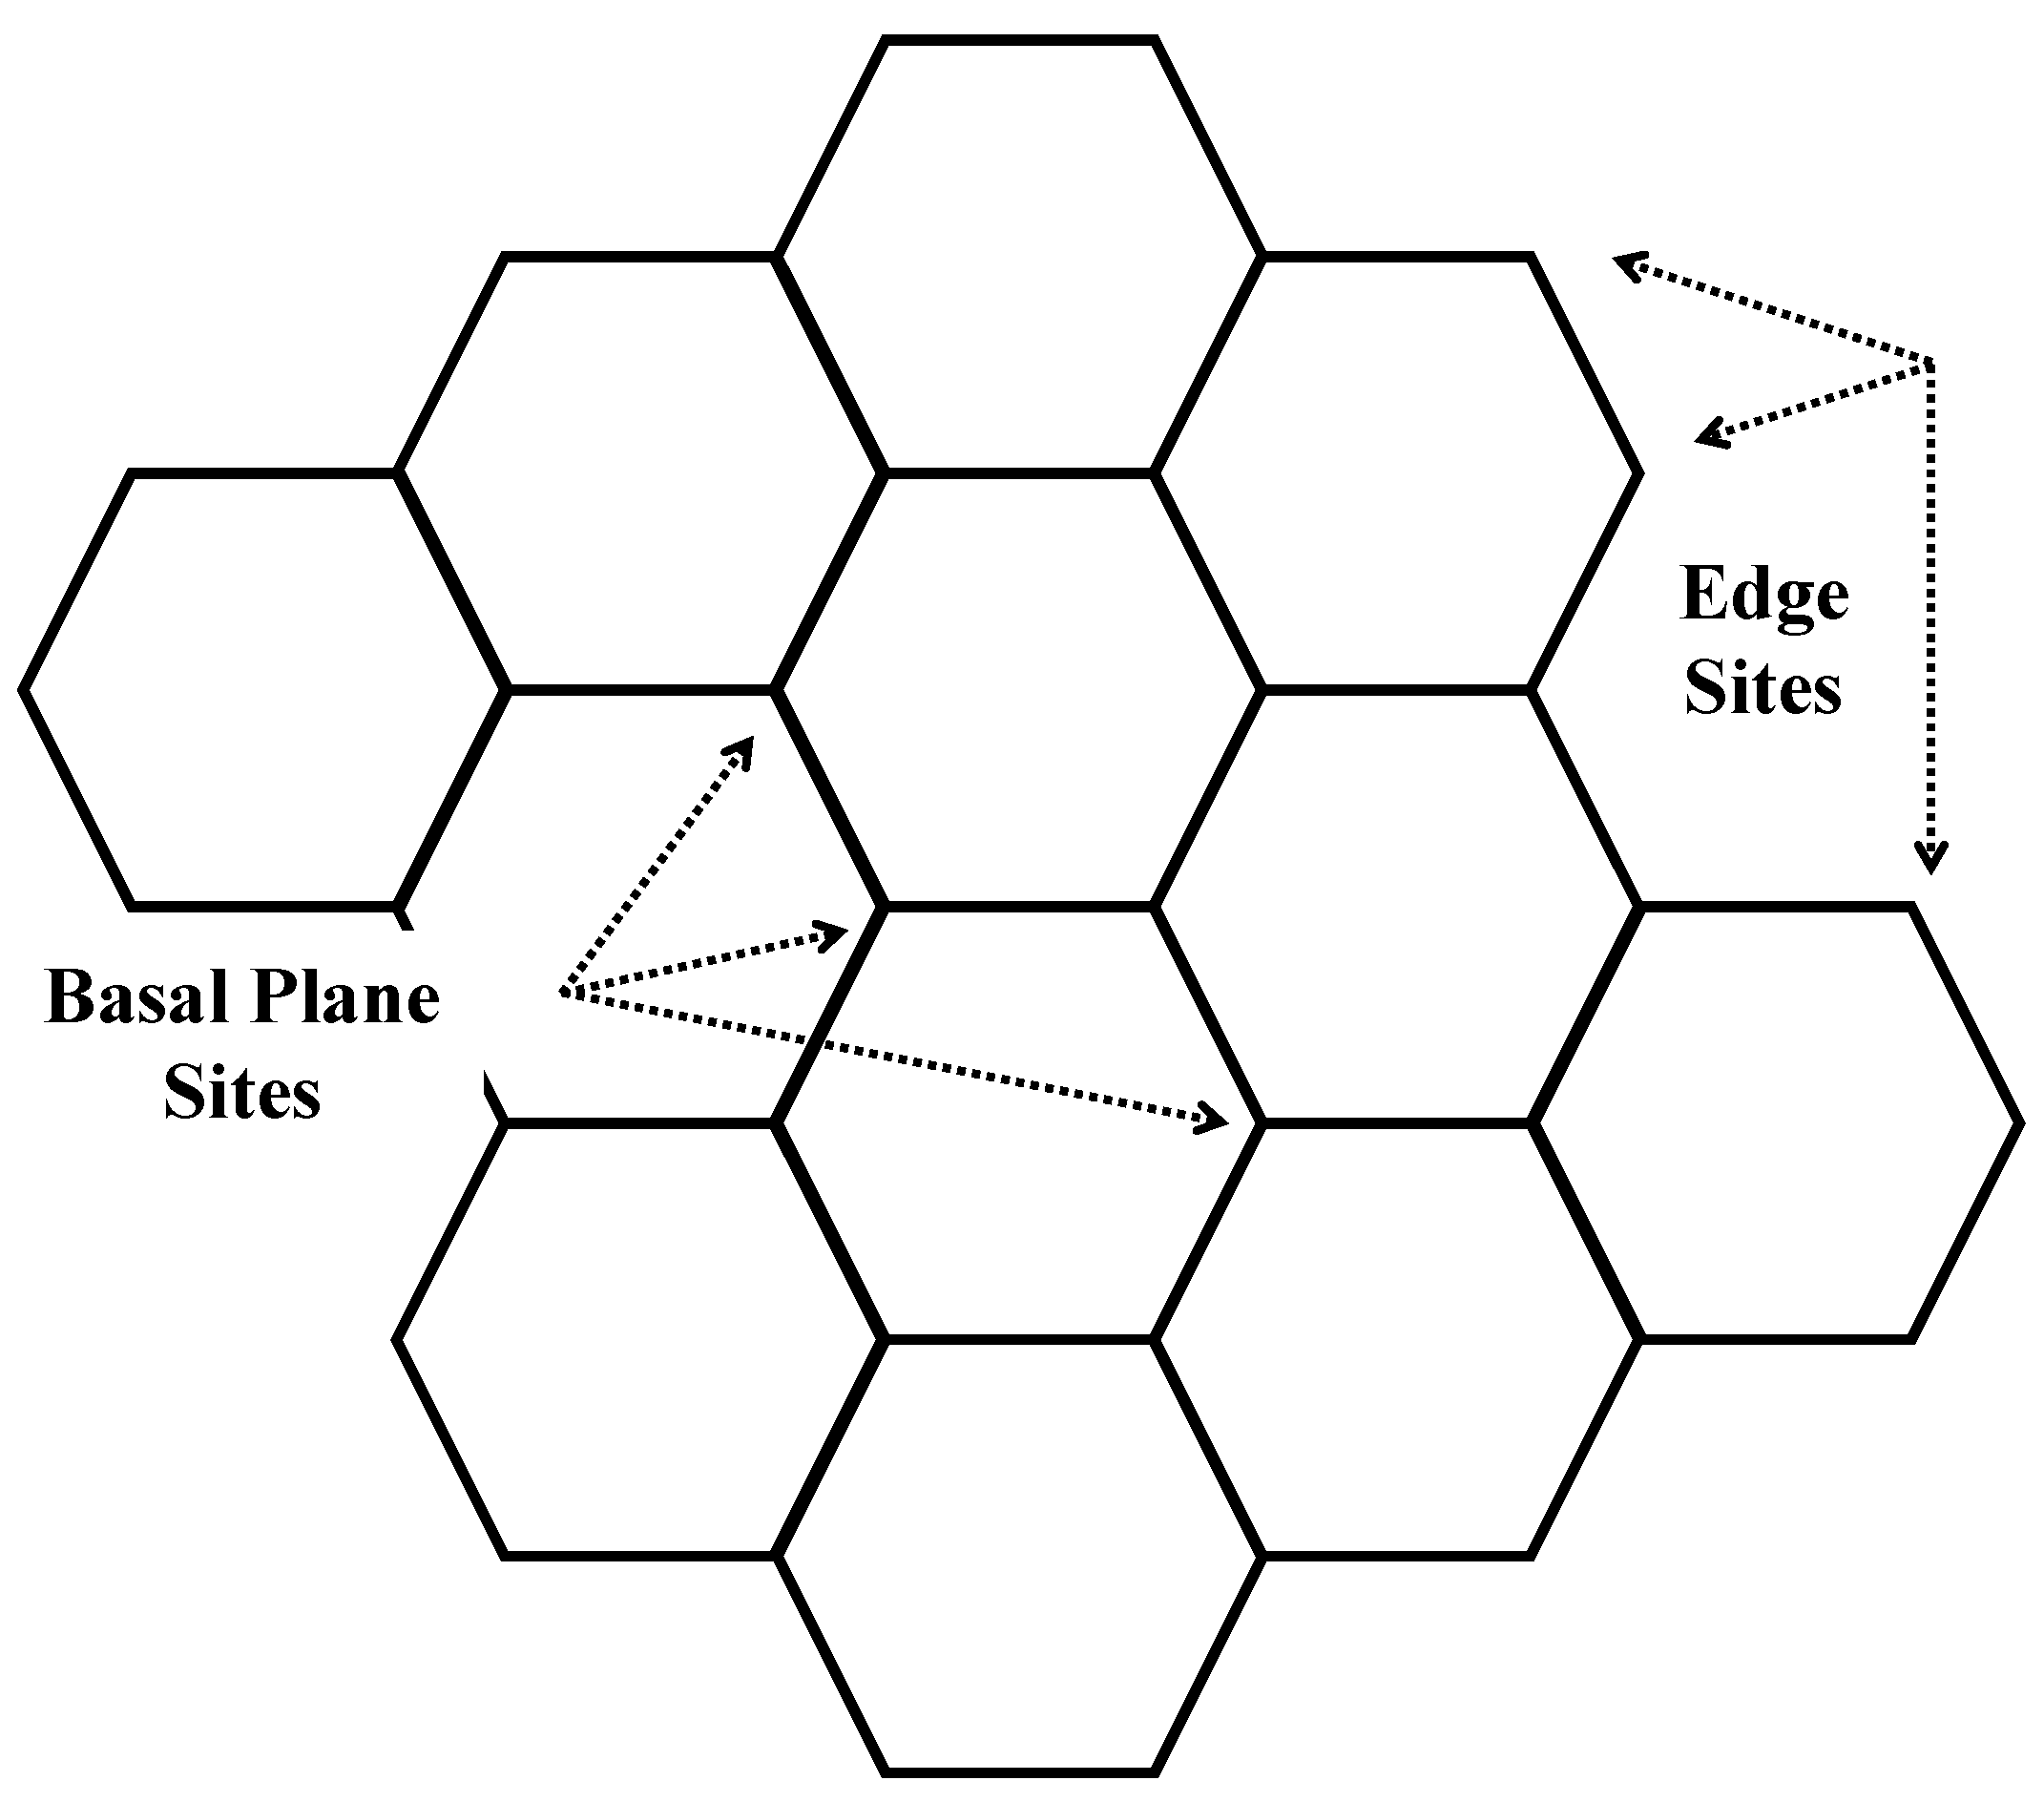
Nanostructure has been shown to govern bulk reactivity in oxidation [24,25]. Many HRTEM studies have shown a radial variation in carbon lamellae length and organization; each increasing outward. Basal plane sites have inherently lower reactivity than edge sites. With reference to oxygen, the basal plane sites have nearly 10×–100× lower reactivity than edge sites [25], dependent upon temperature. Though nanostructure is strictly an interior property, it does pertain to initial surface reactivity, as the surface reflects the unbounded, exposed lamellae, with edge-to-basal sites as represented by the near-surface nanostructure. Whether by gas phase oxidants, aqueous chemical attack, or electrochemical reaction, edge sites display higher reactivity and determine the nascent reactivity of the carbon black. This is directly relevant to the uses of carbon black. For instance, when used as fillers in rubber or plastics, its edge-to-basal site content determines bonding potential and its matrix compatibility in applications such as graphite and electrode manufacture, dictated by its interaction with the matrix. Matrix interaction depends upon surface functionalization and surface energy, which in turn are dependent on the number of edge-to-basal plane sites, hence making their representation by near-surface nanostructure relevant. Offering representative nanostructure, many carbon blacks are also used as surrogates for soot in oxidation studies, activated carbon in absorption studies, etc. [24,26,27,28,29,30,31,32]. An illustration of edge and basal plane sites is shown in Figure 11.
As a final note, carbon black is neither soot nor so-called black carbon [33], despite the seemingly similar morphology and structure of these combustion-produced aerosols. “Soot” and “black carbon” are the two most common names applied to emissions from fires and incomplete anthropogenic combustion of carbon-containing fuels (e.g., natural gas, LPG, gasoline, diesel, kerosene, coal). Such emissions contain some elemental carbon, but also significant quantities of organics and other compounds. “Soot” refers to carbon-rich particles produced by a variety of different combustion processes, including diesel engine exhaust, coal-fired power plant particulate matter (PM) emissions, and oil-fired boilers. “Black carbon” is a term used to describe airborne carbonaceous particulate that has been measured in many recent studies of ambient and indoor particulate matter. As a manufactured material, carbon black consists almost exclusively of pure elemental carbon (>98%). Carbon black generally consists of <1% extractable organic compounds, including polycyclic aromatic hydrocarbons (PAHs). On the contrary, soot particles can consist of >50% organic species which may be dependent upon source and fuel, contain significant concentrations of metals and PAHs. While diesel soot has long been a known carrier for biologically active PAHs, in vitro studies indicate that the PAHs contained on carbon black are adhered strongly to the carbon black, and the PAHs are not bioavailable [3].
5. Conclusions
Carbon black manufacture and its growth is heavily tied to the automotive industry, but has numerous other applications in everyday life, making it an integral part of materials and manufactured goods. With a now-favorable industrial environment and increasing demand for automotive and specialty products, the industry is expected to grow at an average rate of ~6% worldwide and ~14% in developing countries like India, for instance, by the early-to-mid-2020 s [3,34]. Given its low cost of production and wide use, studying carbon black to decode its structure and reactivity not only helps understanding it as a material, but also aids in developing the material towards potential unrealized applications. Nanostructure determines the behavior of the material, which translates to the bulk of the material and therefore plays an integral role in its characterization and further development. TEM and related quantification of images using fringe analysis as illustrated here provide a measure towards this purpose.
Author Contributions
R.L.V.W. conceptualized the work and provided guidance for data collection and analysis. M.S. acquired TEM images, performed related analysis and interpreted results in consultation with R.L.V.W. M.S. and R.L.V.W. wrote the paper.
Funding
The authors gratefully acknowledge support for this work through an Institutes for Energy and the Environment (IEE) seed grant.
Acknowledgments
The authors gratefully acknowledge the characterization facilities of the Materials Research Institute and personnel, Ronnie Wasco and Bradley Maben, of the EMS Energy Institute at The Pennsylvania State University.
Conflicts of interest
The authors declare no conflict of interest.
References
- What is Carbon Black? Orion Engineered Carbons. Available online: https://www.thecarycompany.com/media/pdf/specs/orion-what-is-carbon-black.pdf (accessed on 18 November 2018).
- About Carbon Black. Mitsubishi Chemical. Available online: http://www.carbonblack.jp/en/cb/index.html (accessed on 17 November 2018).
- Carbon Black—A Global Market Overview. PR Newswire. 2016. Available online: http://ezaccess.libraries.psu.edu/login?url=https://search.proquest.com/docview/1757675949?accountid=13158 (accessed on 18 November 2018).
- Spahr, M.; Rothon, R. Carbon Black as a Polymer Filler. In Polymers and Polymeric Composites: A Reference Series; Palsule, S., Ed.; Springer: Berlin/Heidelberg, Germany, 2016. [Google Scholar] [CrossRef]
- Heidenreich, R.D.; Hess, W.M.; Ban, L.L. A test object and criteria for high resolution electron microscopy. J. Appl. Crystallogr. 1968, 1, 1–19. [Google Scholar] [CrossRef] [Green Version]
- Wal, R.L.V.; Tomasek, A.J.; Street, K.; Hull, D.R.; Thompson, W.K. Carbon Nanostructure Examined by Lattice Fringe Analysis of High-Resolution Transmission Electron Microscopy Images. Appl. Spectrosc. 2004, 58, 230–237. [Google Scholar] [Green Version]
- Yehliu, K.; Wal, R.L.V.; Boehman, A.L. Development of an HRTEM image analysis method to quantify carbon nanostructure. Combust. Flame 2011, 158, 1837–1851. [Google Scholar] [CrossRef]
- Heckman, F.A. Microstructure of Carbon Black. Rubber Chem. Technol. 1964, 37, 1245–1298. [Google Scholar] [CrossRef]
- Rajeev, R.S.; de, S.K. Crosslinking of rubbers by fillers. Rubber Chem. Technol. 2002, 75, 475–510. [Google Scholar] [CrossRef]
- Wal, R.L.V. Soot Nanostructure: Definition, Quantification and Implications. SAE Tech. Pap. 2005, 10. [Google Scholar] [CrossRef]
- Warren, B.E. X-Ray Diffraction in Random Layer Lattices. Phys. Rev. 1941, 59, 693–698. [Google Scholar] [CrossRef]
- Franklin, R.E. The interpretation of diffuse X-ray diagrams of carbon. Acta Crystallogr. 1950, 3, 107–121. [Google Scholar] [CrossRef] [Green Version]
- Short, M.A.; Walker, P.L. Measurement of interlayer spacings and crystal sizes in turbostratic carbons. Carbon N. Y. 1963, 1, 3–9. [Google Scholar] [CrossRef]
- Pawlyta, M.; Rouzaud, J.-N.; Duber, S. Raman microspectroscopy characterization of carbon blacks: Spectral analysis and structural information. Carbon N. Y. 2015, 84, 479–490. [Google Scholar] [CrossRef]
- Adar, F. Raman Spectroscopy of Carbon—More Information Than You Would Think. Spectroscopy 2009, 24, 28–39. [Google Scholar]
- Sadezky, A.; Muckenhuber, H.; Grothe, H.; Niessner, R.; Pöschl, U. Raman microspectroscopy of soot and related carbonaceous materials: Spectral analysis and structural information. Carbon N. Y. 2005, 43, 1731–1742. [Google Scholar] [CrossRef]
- Ferrari, A.C.; Robertson, J. Interpretation of Raman spectra of disordered and amorphous carbon. Phys. Rev. B 2002, 61, 14095–14107. [Google Scholar] [CrossRef]
- Chipara, D.M.; Chipara, A.C.; Chipara, M. Raman Spectroscopy of Carbonaceous Materials: A Concise Review. Spectroscopy 2011, 26, 42–47. [Google Scholar]
- Wal, R.L.V. A TEM Methodology for the Study of Soot Particle Structure. Combust. Sci. Technol. 1997, 126, 333–351. [Google Scholar]
- Harris, P.J.F.; Tsang, S.C. High-resolution electron microscopy studies of non-graphitizing carbons. Philos. Mag. A 1997, 76, 667–677. [Google Scholar] [CrossRef] [Green Version]
- Harris, P.J.F. Transmission Electron Microscopy of Carbon: A Brief History. C 2018, 4. [Google Scholar] [CrossRef]
- Luow, E. Structure and Combustion Reactivity of Inertinite-Rich and Vitrinite Rich South African Coal Chars: Quantification of the Structural Factors Contributing to Reactivity Differences. Ph.D. Thesis, The Pennsylvania State University, State College, PA, USA, 2013. [Google Scholar]
- Yehliu, K.; Wal, R.L.V.; Boehman, A.L. A comparison of soot nanostructure obtained using two high resolution transmission electron microscopy image analysis algorithms. Carbon N. Y. 2011, 49, 4256–4268. [Google Scholar] [CrossRef]
- Wal, R.L.V.; Tomasek, A.J. Soot oxidation: Dependence upon initial nanostructure. Combust. Flame 2003, 134, 1–9. [Google Scholar]
- Gaddam, C.K.; Wal, R.L.V.; Chen, X.; Yezerets, A.; Kamasamudram, K. Reconciliation of carbon oxidation rates and activation energies based on changing nanostructure. Carbon N. Y. 2016, 98, 545–556. [Google Scholar] [CrossRef]
- Singh, M.; Srilomsak, M.; Wang, Y.; Hanamura, K.; Wal, R.V. Nanostructure changes in diesel soot during NO2–O2 oxidation under diesel particulate filter-like conditions toward filter regeneration. Int. J. Eng. Res. 2018. [Google Scholar] [CrossRef]
- Yezerets, A.; Currier, N.W.; Eadler, H.A.; Suresh, A.; Madden, P.F.; Branigin, M.A. Investigation of the oxidation behavior of diesel particulate matter. Catal. Today 2003, 88, 17–25. [Google Scholar] [CrossRef]
- Jaramillo, I.C.; Gaddam, C.K.; Wal, R.L.V.; Lighty, J.S. Effect of nanostructure, oxidative pressure and extent of oxidation on model carbon reactivity. Combust. Flame 2015, 162, 1848–1856. [Google Scholar] [CrossRef] [Green Version]
- Wal, R.L.V.; Tomasek, A.J. Soot nanostructure: Dependence upon synthesis conditions. Combust. Flame 2004, 136, 129–140. [Google Scholar]
- Matarrese, R.; Castoldi, L.; Lietti, L. Oxidation of model soot by NO2 and O2 in the presence of water vapor. Chem. Eng. Sci. 2017, 173, 560–569. [Google Scholar] [CrossRef]
- Pahalagedara, L.; Sharma, H.; Kuo, C.H.; Dharmarathna, S.; Joshi, A.; Suib, S.L.; Mhadeshwar, A.B. Structure and Oxidation Activity Correlations for Carbon Blcks and Diesel Soot. Energy Fuels 2012, 26, 6757–6764. [Google Scholar] [CrossRef]
- Wal, R.L.V.; Strzelec, A.; Toops, T.J.; Daw, C.S.; Genzale, C.L. Forensics of soot: C5-related nanostructure as a diagnostic of in-cylinder chemistry. Fuel 2013, 113, 522–526. [Google Scholar]
- Long, C.M.; Nascarella, M.A.; Valberg, P.A. Carbon black vs. black carbon and other airborne materials containing elemental carbon: Physical and chemical distinctions. Environ. Pollut. 2013, 181, 271–286. [Google Scholar] [CrossRef] [Green Version]
- India Carbon Black Market to Grow at 14% CAGR Until 2020 Claims TechSci Research Study. PR Newswire Europe Including UK Disclose. 2015. Available online: http://ezaccess.libraries.psu.edu/login?url=https://search.proquest.com/docview/1667661272?accountid=13158 (accessed on 11 January 2018).
Figure 1.
TEM images showing aggregates of (A) furnace, (B) thermal, (C) lamp, and (D) channel blacks.
Figure 1.
TEM images showing aggregates of (A) furnace, (B) thermal, (C) lamp, and (D) channel blacks.
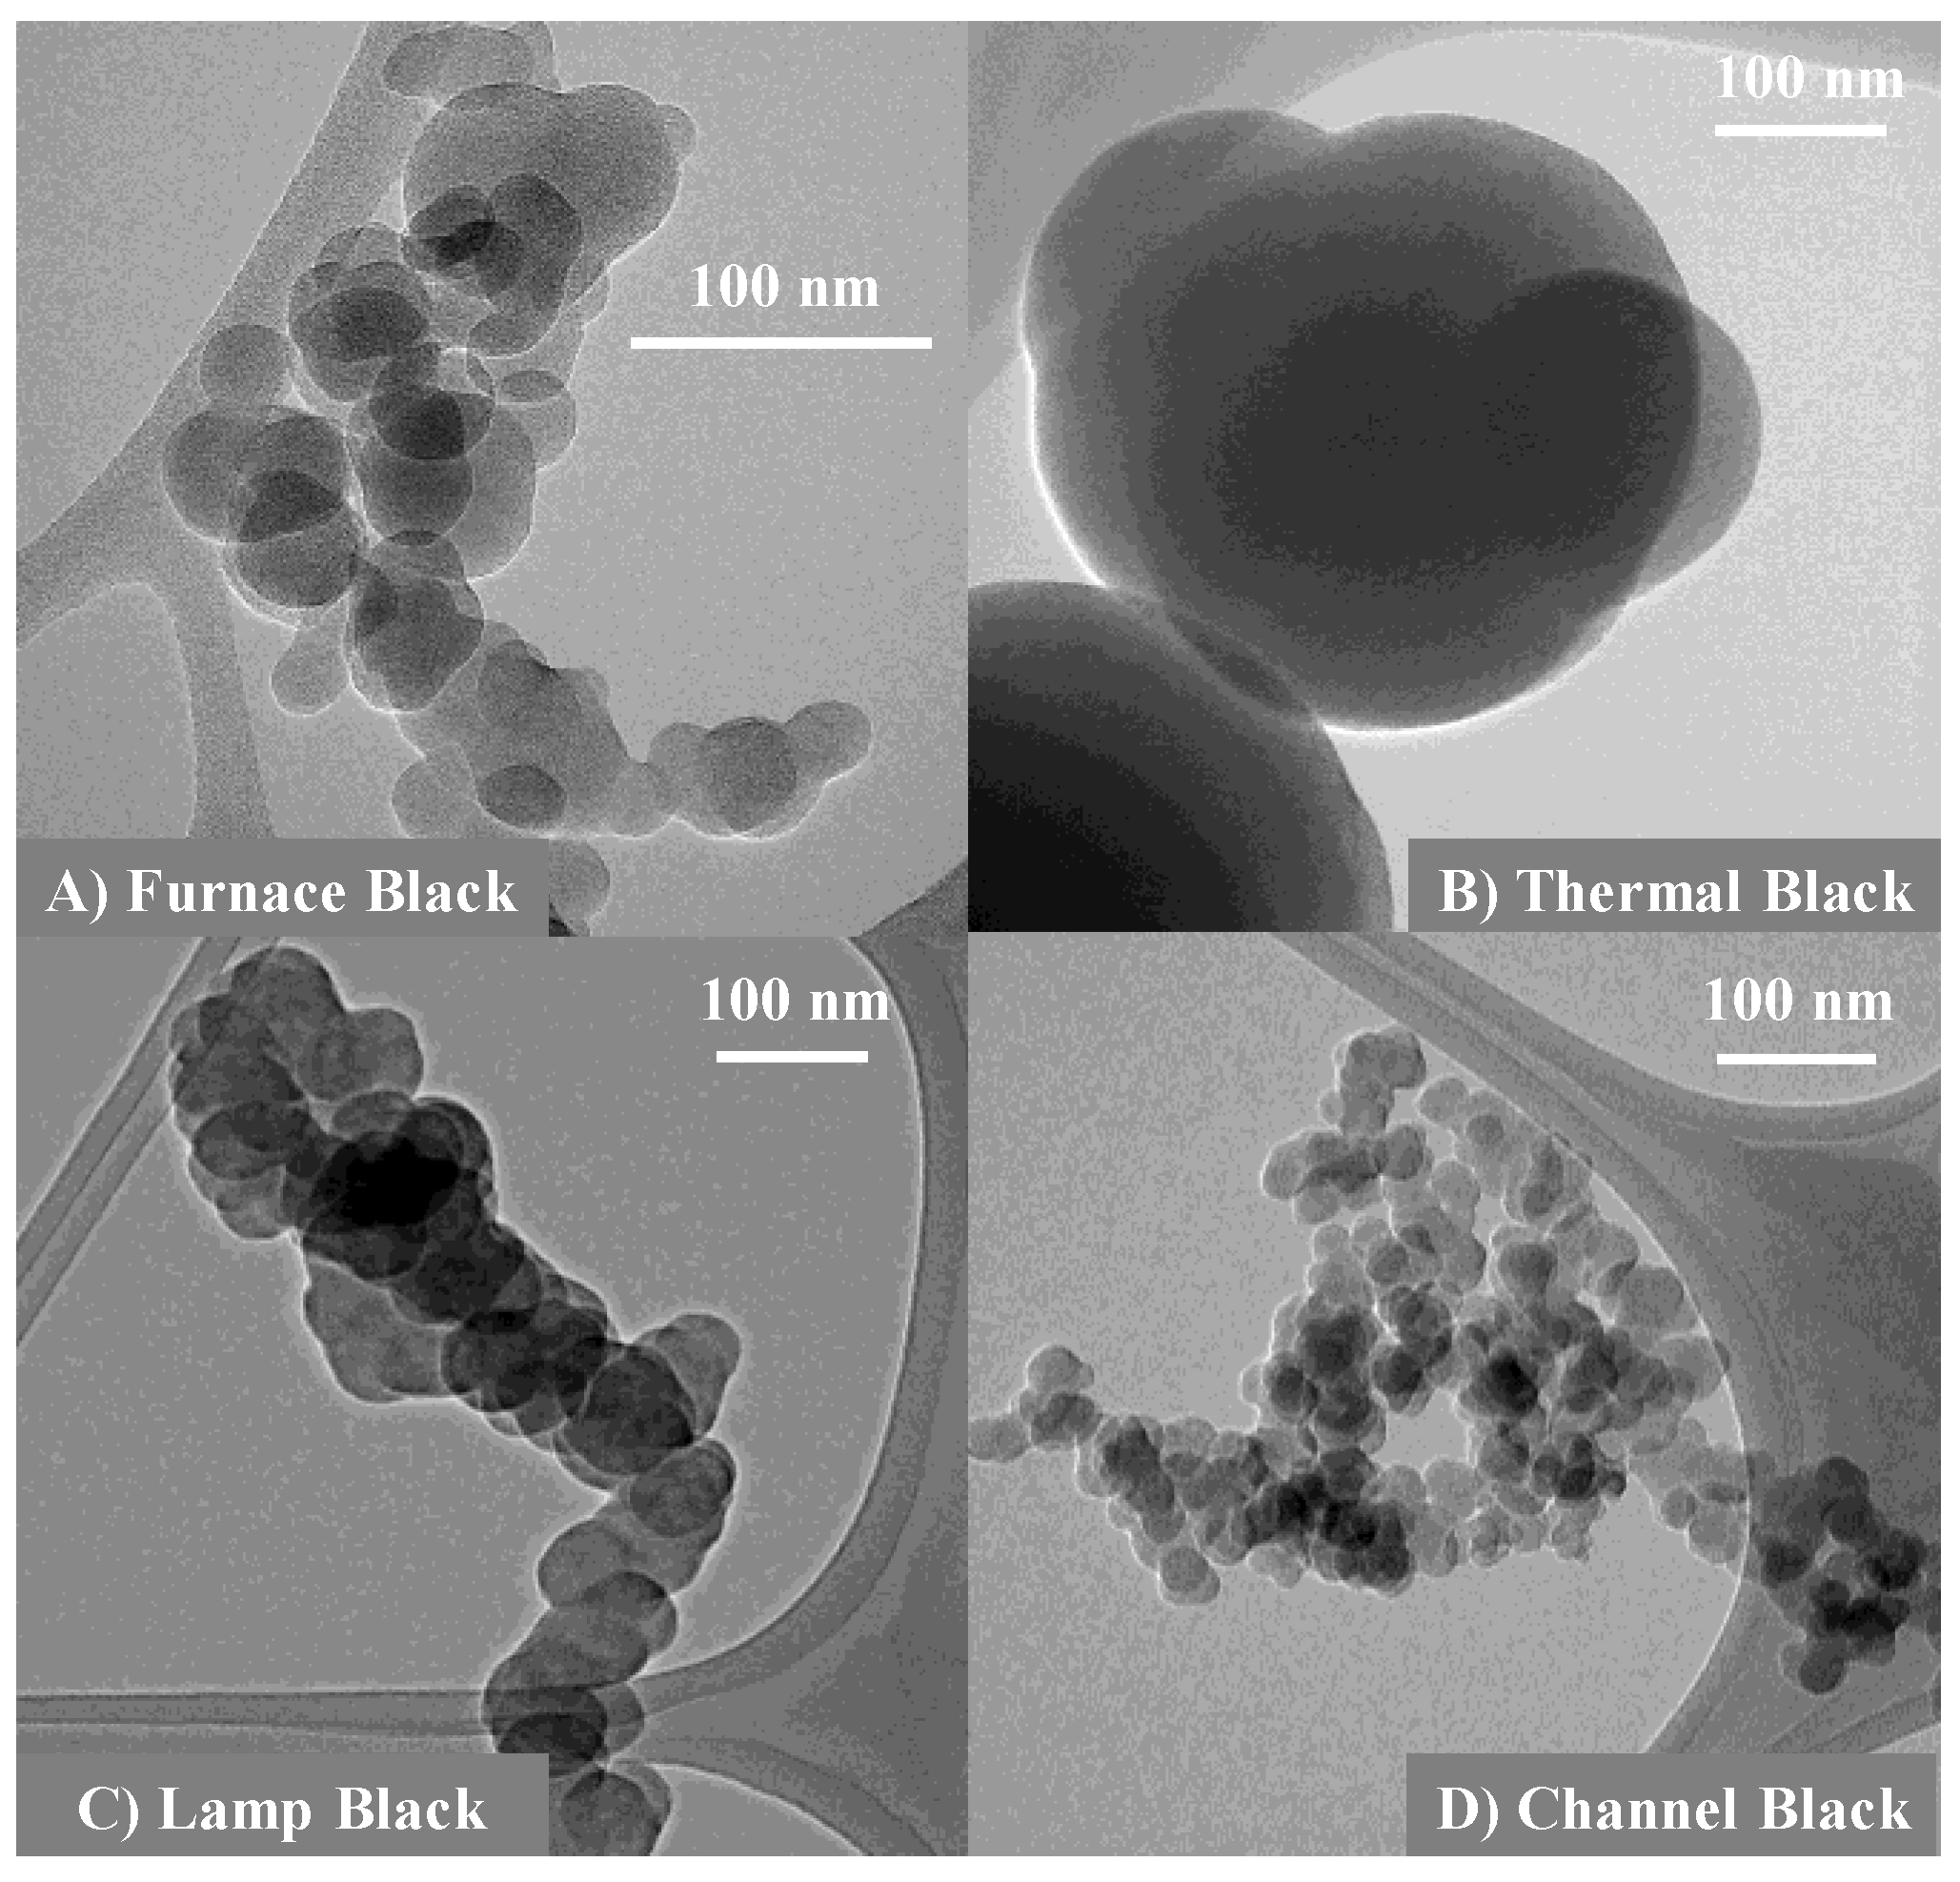
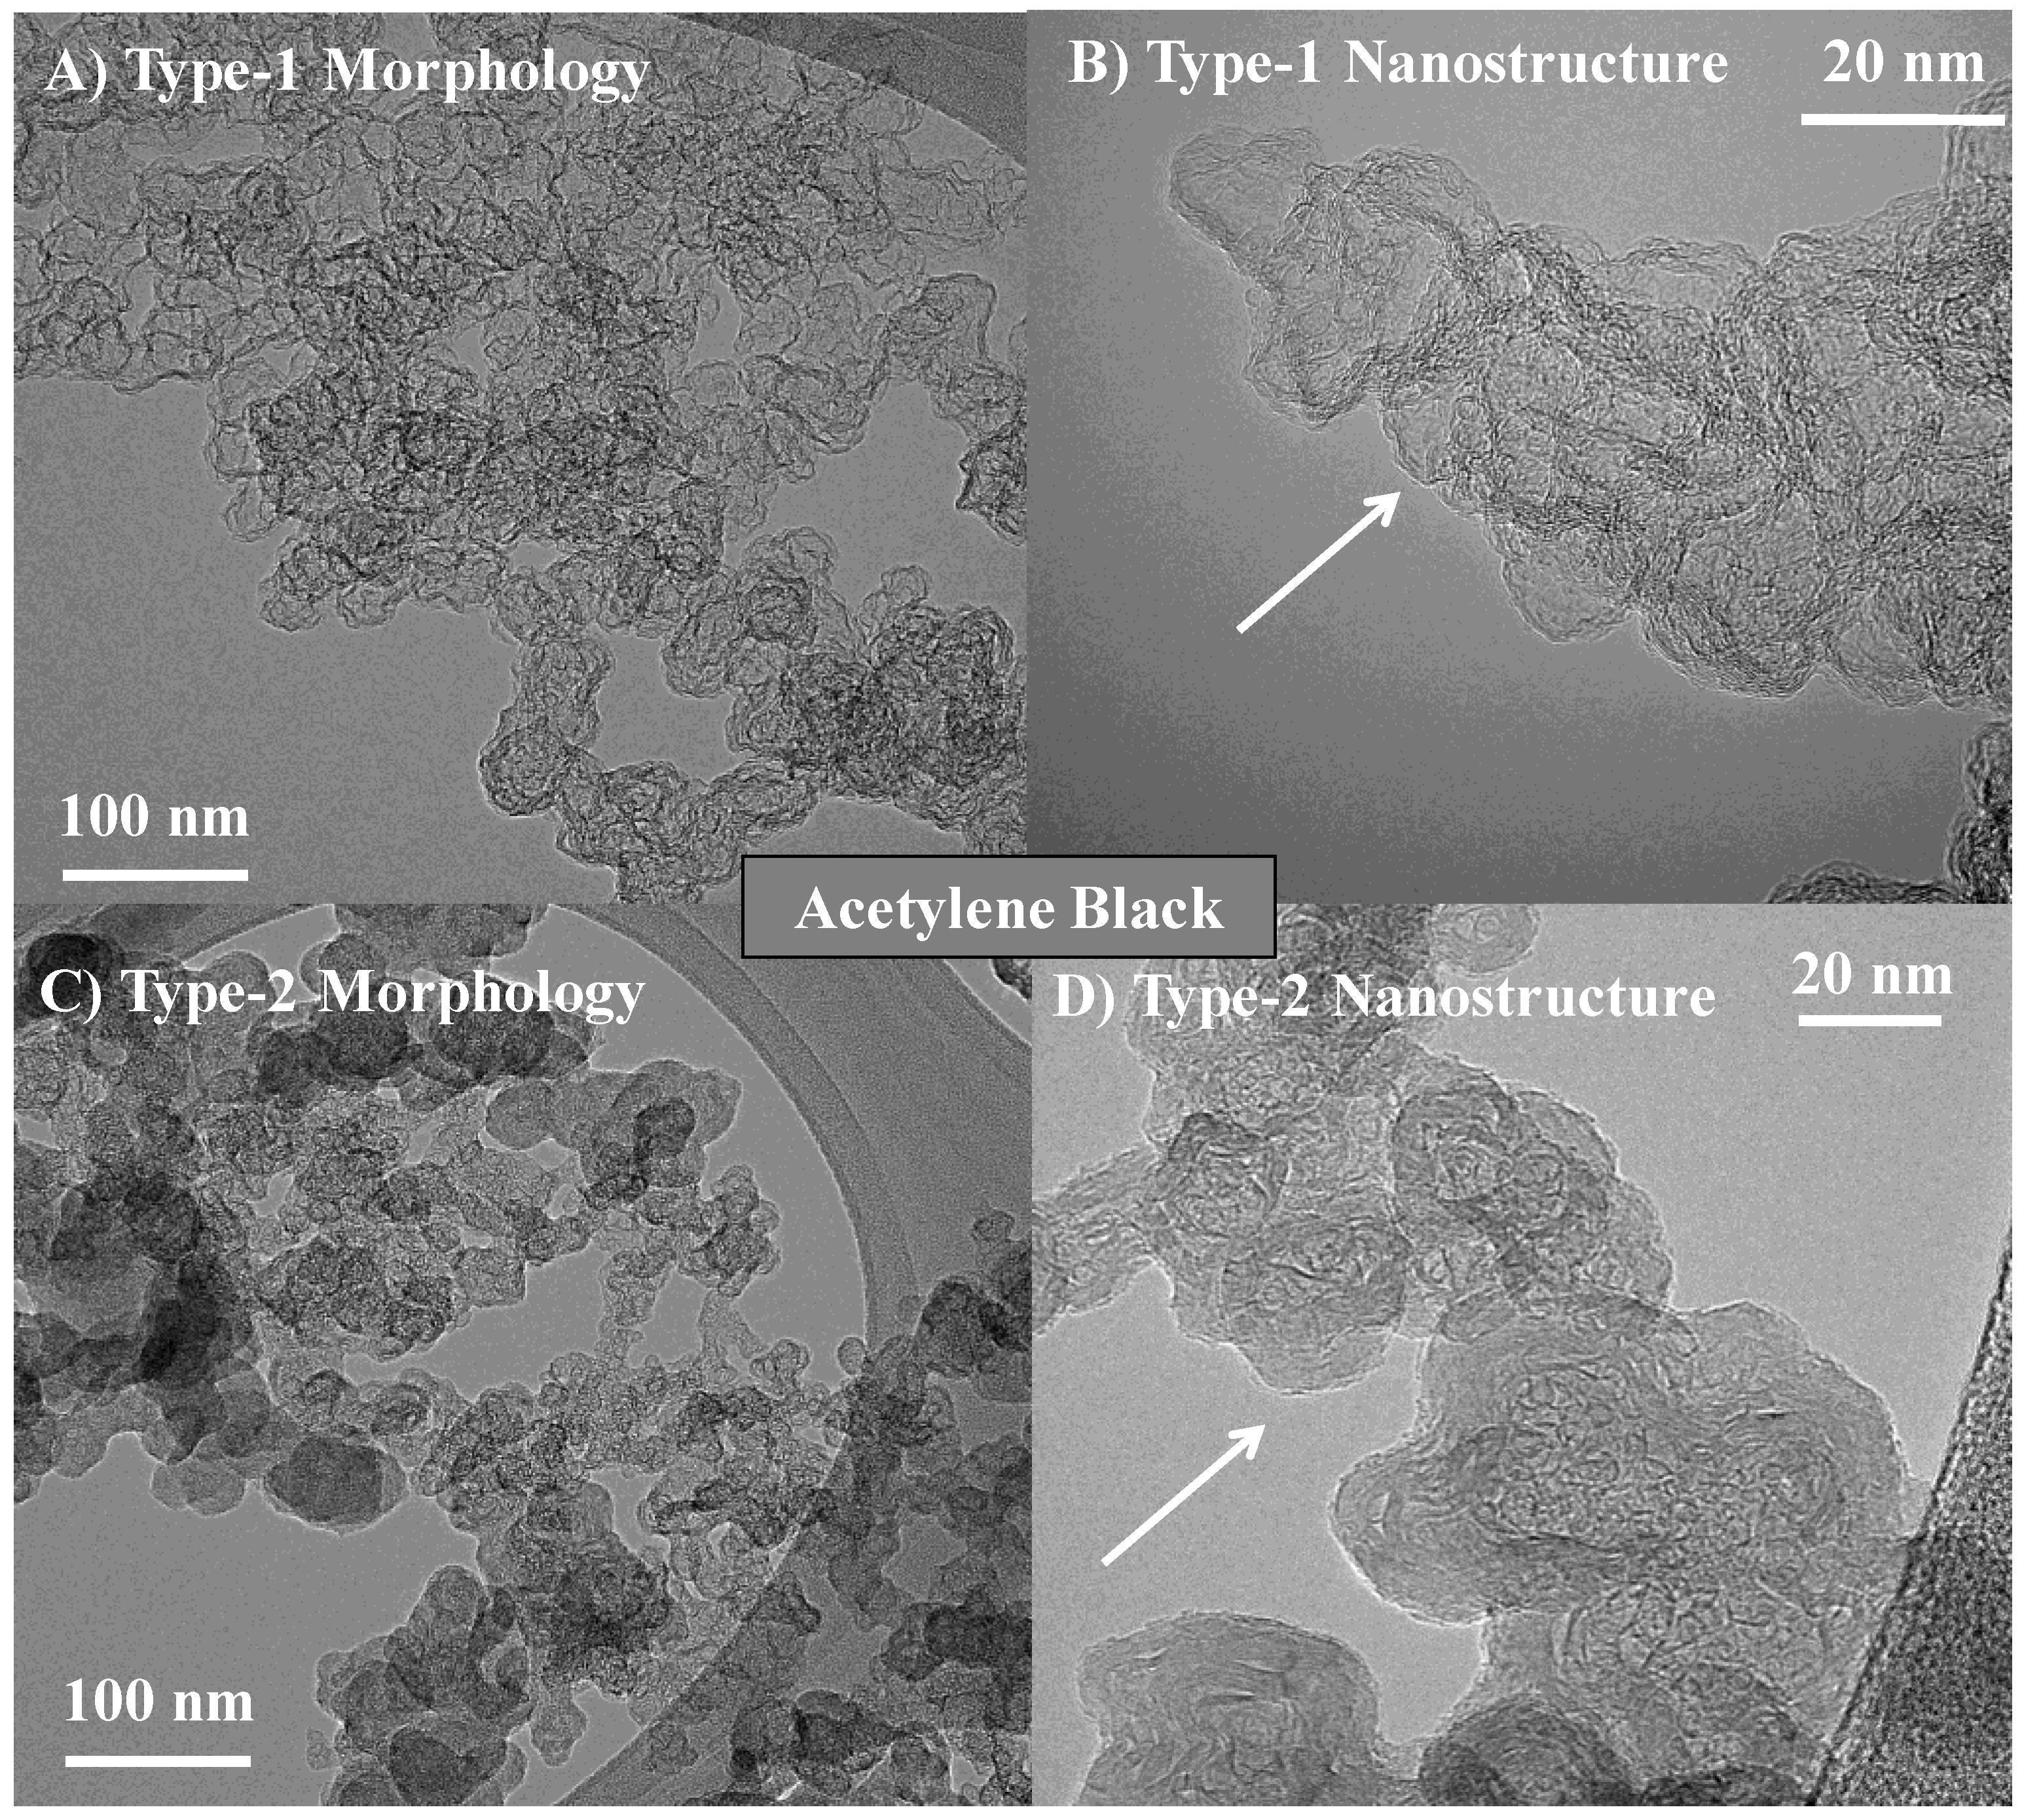
Figure 2.
TEM micrographs showing two types of acetylene black. Images (A,B) illustrate morphology and nanostructure of type-1 and images (C,D) to type-2 acetylene black.
Figure 2.
TEM micrographs showing two types of acetylene black. Images (A,B) illustrate morphology and nanostructure of type-1 and images (C,D) to type-2 acetylene black.
Figure 3.
Transmission electron micrographs showing the three length scales: (A) aggregate, (B) primary particle, and (C) nanostructure for lamp black.
Figure 3.
Transmission electron micrographs showing the three length scales: (A) aggregate, (B) primary particle, and (C) nanostructure for lamp black.
Figure 4.
TEM images contrasting a (A) high and a (B) low degree of aggregation in the different carbon blacks.
Figure 4.
TEM images contrasting a (A) high and a (B) low degree of aggregation in the different carbon blacks.
Figure 5.
TEM image showing nanostructure of (A) thermal and (B) furnace black particles.
Figure 6.
Illustrative examples of XRD and Raman spectra of carbon blacks.
Figure 7.
Fringe parameters characterizing nanostructure.
Figure 8.
Image panel showing high-resolution TEM (HRTEM) and respective skeletonized images for (A,B) furnace and (C,D) lamp black.
Figure 8.
Image panel showing high-resolution TEM (HRTEM) and respective skeletonized images for (A,B) furnace and (C,D) lamp black.
Figure 9.
Fringe statistics of (top) length and (bottom) tortuosity for furnace, lamp, and channel black.
Figure 9.
Fringe statistics of (top) length and (bottom) tortuosity for furnace, lamp, and channel black.
Figure 10.
Fringe statistics of (top) length and (bottom) tortuosity for two acetylene blacks.
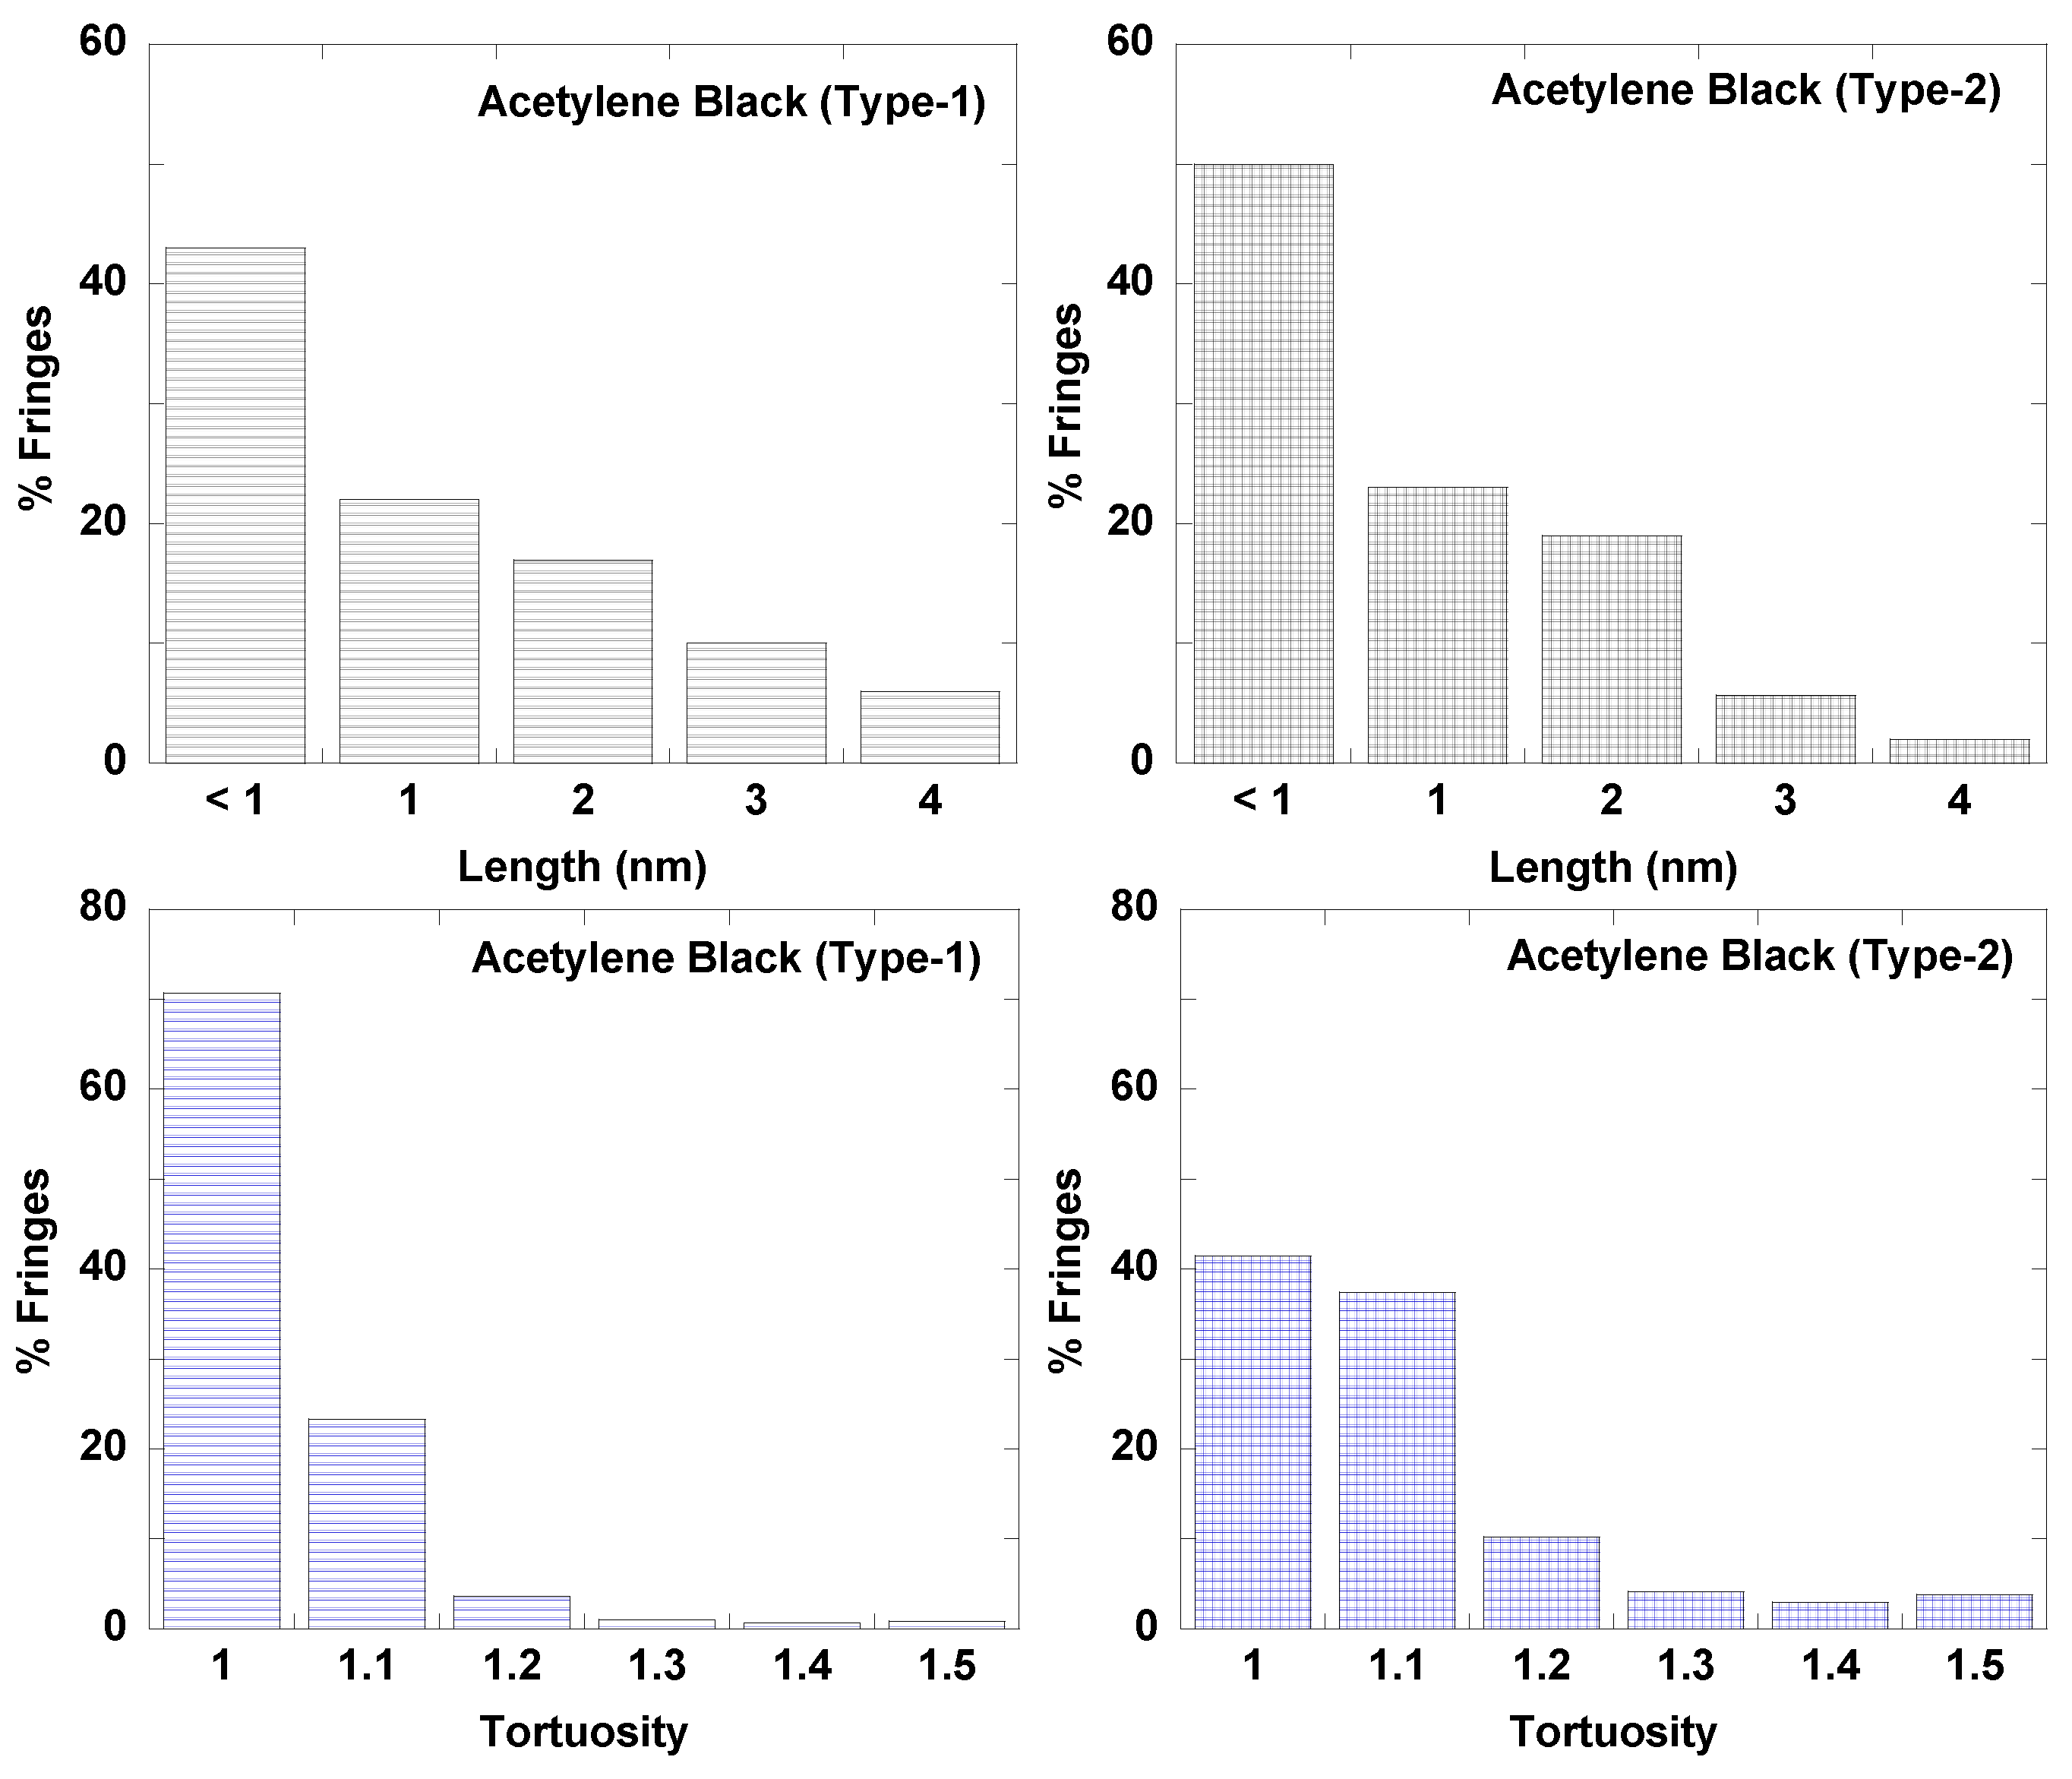
Figure 11.
A schematic illustrating edge and basal plane carbon sites.

Table 1.
Lattice parameters from X-ray diffraction.
| Lattice Parameter | Furnace Black | Thermal Black | Lamp Black | Channel Black | Acetylene Black-1 | Acetylene Black-2 |
|---|---|---|---|---|---|---|
| d002 (Å) | 3.60 | 3.58 | 3.56 | 3.70 | 3.54 | 3.45 |
| Lc (using 002) (nm) | 1.7 | 1.6 | 1.3 | 1.3 | 1.6 | 2.6 |
| La (using 100) (nm) | 5.6 | 4.5 | 4 | 3 | 6 | 5 |
© 2018 by the authors. Licensee MDPI, Basel, Switzerland. This article is an open access article distributed under the terms and conditions of the Creative Commons Attribution (CC BY) license (http://creativecommons.org/licenses/by/4.0/).
Share and Cite
MDPI and ACS Style
Singh, M.; Vander Wal, R.L. Nanostructure Quantification of Carbon Blacks. C 2019, 5, 2. https://doi.org/10.3390/c5010002
AMA Style
Singh M, Vander Wal RL. Nanostructure Quantification of Carbon Blacks. C. 2019; 5(1):2. https://doi.org/10.3390/c5010002
Chicago/Turabian StyleSingh, Madhu, and Randy L. Vander Wal. 2019. "Nanostructure Quantification of Carbon Blacks" C 5, no. 1: 2. https://doi.org/10.3390/c5010002
Note that from the first issue of 2016, this journal uses article numbers instead of page numbers. See further details here.