Structure of Carbon Materials Explored by Local Transmission Electron Microscopy and Global Powder Diffraction Probes


1
A. Chełkowski Institute of Physics, University of Silesia, ul. 75 Pułku Piechoty 1, 41-500 Chorzów, Poland
2
Silesian Center for Education and Interdisciplinary Research, ul. 75 Pułku Piechoty 1A, 41-500 Chorzów, Poland
3
Institute of Engineering Materials and Biomaterials, Silesian University of Technology, ul. Konarskiego 18A, 44-100 Gliwice, Poland
*
Author to whom correspondence should be addressed.
C 2018, 4(4), 68; https://doi.org/10.3390/c4040068
Submission received: 9 November 2018
/
Revised: 14 December 2018
/
Accepted: 14 December 2018
/
Published: 19 December 2018
(This article belongs to the Special Issue Transmission Electron Microscopy and Carbon Materials)
Abstract
:Transmission electron microscopy and neutron or X-ray diffraction are powerful techniques available today for characterization of the structure of various carbon materials at nano and atomic levels. They provide complementary information but each one has advantages and limitations. Powder X-ray or neutron diffraction measurements provide structural information representative for the whole volume of a material under probe but features of singular nano-objects cannot be identified. Transmission electron microscopy, in turn, is able to probe single nanoscale objects. In this review, it is demonstrated how transmission electron microscopy and powder X-ray and neutron diffraction methods complement each other by providing consistent structural models for different types of carbons such as carbon blacks, glass-like carbons, graphene, nanotubes, nanodiamonds, and nanoonions.

1. Introduction
Transmission electron microscopy (TEM) is undoubtedly one of the most powerful tools that greatly contributes to the development of our knowledge on the structure of carbon materials. This direct imaging technique has provided valuable structural information about carbon materials, especially for carbon nanomaterials. The discoveries of carbon nanostructures such as nanotubes [1], nanoonions [2], nanocones [3], and nanohorns [4] were the culmination of years of experience and past accomplishments in the TEM technique. Transmission electron microscopy studies were equally important for obtaining detailed information on the structure of traditional carbon forms. Namely, the morphology of carbon black particles [5], the nature of defects in natural diamonds [6], or the fullerene-like structure of microporous carbons [7,8] were revealed using TEM. Nowadays, TEM is still a driving force for the structural studies of carbon materials and the development of their technology. It is especially worth mentioning recent advances in in situ and real-time TEM experiments which allow observing and recording the behaviour of carbons in different conditions, such as heating, stress, pressure, and electron beam [9,10,11,12,13].
Size, shape, morphology, elemental composition, atomic order, superstructure, and various defects are only a few examples of the structural features which may be neatly determined using TEM imaging. Transmission electron microscopy probes act as “eyes” at the nano and atomic level, directly showing the structure with very high-spatial resolution and unveils precisely local structural features. For structural studies of isolated nanocarbon systems, high-resolution TEM (HRTEM) is particularly useful, since the nano-object dimensions are too small to give sufficient structural information that can be derived from conventional X-ray or neutron diffraction (XRD or ND) measurements. However, when TEM data is recorded for a small portion of the sample material a common question arises as to whether it is a representative picture of the whole specimen volume. Transmission electron microscopy is sensitive to single objects at nanoscale but it may be not enough to represent statistically a larger volume of the materials produced at an industrial scale. Transmission electron microscopy images show only a tiny part of the material because of the extremely high magnification used. Bulk materials are usually combinations of many nano-objects/particles/domains/crystallites, and hence their complete and quantitative structural characterization needs also a global probe, and powder XRD or ND is an adequate tool for this task. Powder XRD and ND diffraction techniques give an average description of the components which may be different from the individual description of each component actually forming the sample. Powder XRD or ND measurements guarantee that the obtained information on the atomic structure is averaged over whole sample volume under probe. Thus, it is worthwhile to discuss achievements of TEM, XRD, and ND techniques and highlight their advantages in revealing the structure of carbons. Carbon materials were one of the first materials studied by XRD method. As early as 1913, Braggs [14] solved the atomic structure of diamond monocrystals. A few years later, in 1917 powder XRD studies of graphite and disordered carbons were published [15]. Based on the obtained results it was established that these carbons contain hexagonal carbon rings. However, the detailed structure determination of disordered or poorly crystallized carbon materials such as carbon black, char, and coke failed before Warren’s and Franklin’s work in 1930–1950s. Warren and co-authors [16,17,18,19] proposed the presence in carbon black of single graphite layers and stacks of layers roughly parallel and equidistant, but random in orientation about the layer normal, whereas Franklin gave a clear definition of graphitic carbons based on the XRD studies [20] and divided carbons prepared by pyrolysis of organic precursors into graphitising and non-graphitising [21]. Moreover, her accurate measurements on interlayer spacing for well-crystallized graphite (3.354 Å) became the standard, still being widely accepted.
Although most carbons cannot be regarded as crystalline materials as they do not possess a three-dimensional periodic atomic arrangement which produces sharp Bragg peaks on the diffraction pattern, they scatter X-rays or neutrons at different but specific angles from which some structural features may be successfully determined. However, the effect of broadening and overlapping of reflections hinders structure elucidation by conventional crystallography methods. Over the last few decades we made huge progress in collection and analysis of XRD and ND data for disordered materials and nanomaterials. In particular, the use of the atomic pair distribution function (PDF) approach [22] has become invaluable since it goes beyond conventional crystallography and captures new structural information which may be utilized for solving structural problems of complex materials such as carbon nanotubes, graphene, activated carbons, and glass-like carbons [23,24,25,26].
In this review, we are concerned with the comparison of the structural information obtained by the TEM and the powder XRD and ND probes for different types of carbons such as carbon blacks, glass-like carbons, graphene, nanotubes, nanodiamonds, and nanoonions. These techniques greatly complement each other and provide consistent images of the structure for various carbon materials, which would be incomplete when characterized using only one of these methods alone.
2. Carbon Black
Carbon black and soot are closely related materials; both are usually obtained from partial combustion of hydrocarbons, with the difference that carbon black is essentially a pure form of soot. Carbon black was one of the first carbon materials studied by both the diffraction and TEM methods. First references showed that the diffraction pattern of carbon black comprises two or three broad diffuse rings roughly at the same positions as the strongest line in the powder pattern of graphite and suggested that this material is simply a fine-grained form of crystalline graphite [27,28]. In 1934 Warren gave a deeper insight into the structure of carbon black and based on the Fourier integral analysis of the XRD patterns proposed that carbon black is not truly crystalline or an amorphous form of carbon but it may be a heterogeneous mixture of domains which range from a single graphite layer (nowadays called graphene) up to graphite crystals several layers thick [16]. Back then he had already aptly noticed that the size of the carbon black particles may vary from one sample to another, depending upon the method of preparation, and it is probably that carbon black comprises a continuous series extending from the mesomorphic to the crystalline state [16]. Subsequent papers by Warren [18] and Biscoe and Warren [19] shed more light on the carbon black structure and provided clearer answers to whether carbon black is finely divided graphite crystals or another form of carbon with a lower degree of order. In these papers, authors developed equations for the X-ray intensity of random lattices of graphite layers in which the layers are randomly translated with respect to each other in a direction parallel to the layer or rotated about the normal, and proposed that the carbon black may have such “turbostratic” structure consisting of groups of unordered graphite layers. These findings were based on analysis of the XRD pattern of a carbon black heat-treated at 2000 °C, which showed more and sharper peaks than for unheated carbon black but consisted of only (00l) and (hk0) graphite reflections, as shown in Figure 1a. The peaks of the graphite diffraction pattern indexed as (002l) are related to the inter-layer correlations and those of (hk0) to the in-plane correlations, while general reflections of (hkl)-type are due to correlations between atoms across the layer.
The diffraction lines with (hkl) indices come from the planes declining to the basal planes, where the three-dimensional structure with regular stacking of layers has to be established. The absence of the (hkl) reflections for carbon black, both unheated and heat-treated, was explained by the absence of the three-dimensional order of crystalline graphite due to translational or rotational disorder of layers—so called “turbostratic” structure. Figure 1b illustrates schematically the model of a carbon black cluster established based on the XRD studies by Biscoe and Warren [19]. This model is composed of chaotically arranged packages of parallel and equidistant lines, each line represents a single graphite layer, and between the stacked layers the turbostratic disorder is assumed.
Moreover, in the work by Biscoe and Warren [19] and in later publication by Houska and Warren [17], the effect of graphitisation on the size of carbon black turbostratic packages was examined. Figure 2 shows the XRD intensity curves recorded for three carbon black samples with a different heat-treatment history. As the temperature of heat-treatment increases, the sharpening and increase in intensity of diffraction peaks is clearly visible. The diffraction pattern in Figure 2a for Spheron Grade 6 carbon black heat-treated at 2800 °C is sufficiently sharp to distinguish readily the basal planes (002), (004), and (006) reflections from the two-dimensional (100) and (110) lattice reflections. Biscoe and Warren analysed the changes in the structure of carbon black during heat-treatment based on the position and width of the diffraction peaks. They proposed a method for calculation of the average graphite layer dimension in the plane of layer, La, and the average dimension of the parallel layer group perpendicular to graphite layers, Lc [17,19]. The values of La were derived from the (100) and (110) reflections, while Lc values from the (002) and (004) lines. Figure 2b shows the changes in the calculated dimensions of graphitic domains for carbon black heat-treated at various temperatures. The parallel layer groups appear to grow the same rate in both directions, individual graphite layers grow in size, and more layers stack themselves parallel. Biscoe and Warren reported also that at temperatures around 1000 °C, a rapid growth of layers sets in and they correlated it with an intensive removal of hydrogen at this temperature. The positions of the (002l) reflections for carbon blacks were shifted towards smaller scattering angles comparing to crystalline graphite. Using the position of the (002) peak it was shown that the average distance between graphite layers, often referred to as d(002) (twice the distance between layers is referred to as c) decreases gradually with increasing temperature and may approach values of ~3.44 Å, which is still larger than the interlayer spacing of 3.34 Å for ideal graphite crystal.
In later work, Houska and Warren [17] adopted an idea for the presence of different interlayer distances in the structure of heat-treated carbon black and predicted how it affects the diffraction data: “With the beginning of graphitisation, there are two different layer spacings corresponding to ordered and disordered pairs. This produces a distortion broadening in addition to the particle size broadening.” [17]. Today we know that disordered carbons, included carbon black and soot, are composed of twisted and crumpled graphite-like layers, and a significant distribution of interlayer distances occurs. However, the XRD and ND techniques do not provide direct quantitative information on the fluctuations in interlayer spacing. By employing computer modelling of XRD and ND data it is possible to estimate the average interlayer spacing together with its standard deviation [29,30,31]. However, it is not trivial and usually information on interlayer spacing distribution is obtained from an analysis of TEM images. In 1971 Marsh and co-workers [32] already measured the d(002)-spacing distribution in a number of carbon blacks using TEM micrographs. They found a broad (~3.5–4.1 Å), log-normal distribution of d(002)-spacing, with the same average value and standard deviation for all carbon blacks, regardless of their particle size and degree of particle coalescence. Moreover, it was shown that graphitisation leads to narrowing of the d(002)-spacing distribution without changing its log-normal character. In addition, Marsh compared the values of average interlayer spacing obtained from XRD patterns with the values determined from TEM. The first ones were consistently lower. The values of La and Lc calculated from XRD patterns according the Biscoe and Warren method [19] based on the assumption that the graphitic layers are flat, may be questionable when graphitic layers are neither not well-ordered nor flat.
The results obtained at that time using the global powder XRD method can be summarized as follows: the structure of carbon black is similar to graphite, but it is not a collection of fine graphite crystallites but a heterogeneous mixture of turbostratic domains which range from a single layer up to domains 1–2 nm thick. The average size of the domains may vary from one carbon black grade to another and increases during heat-treatment at inert atmosphere. The layers grow evenly in both directions, reaching a maximum width of about 60 Å and a height of about 40 Å. The average distance between layers decreases during the annealing process, but the final distance is significantly greater than for graphite. In the following part of paper, it will be shown how the structural information obtained by the global powder diffraction probe had been confirmed and refined due to the TEM studies.
The first TEM images for carbon black were obtained already in the 1940s. The first studied sample was thermal carbon black, which is a specific kind of carbon black grade, as it contains very large basic structural domains, known from the earlier XRD examinations. The obtained TEM images revealed that the thermal carbon black consists of large (0.5–1 μm) isolated particles of spherical shape (Figure 3a). The internal structure of these spherules, in particular turbostratic domains, remained invisible. After heating at 3000 °C the shape of the particles changed from spherical to polyhedral (Figure 3b) [5].
The results of TEM observations for other typical technical carbon black grades, published afterwards [33,34], showed that carbon black nanospherules usually have smaller diameter (10–100 nm, depending on the carbon black grade) and form lace-shape aggregates (Figure 3c). Microscopy analysis performed by Hall [35] was the first which indicated a different arrangement of graphite-like domains inside particles than proposed by Biscoe and Warren. Hall applied the dark-field (DF) imaging technique for studies of carbon black particles [34] which enabled to obtain a better visualization of the microstructure for examined samples. A DF image is obtained if the objective aperture is placed in order to intercept diffracted beams. Electron diffraction (ED) patterns of carbon blacks comprise broad diffuse (002) graphitic-type rings. Only the graphitic planes which satisfy the Bragg relation corresponding to the (002) reflection give bright spots on a dark background. Using the dark-field imaging, Hall noticed that carbon spherules exhibit regions of enhanced intensity at their edges. Anomalous intensities in the dark-field images were interpreted as resulting from coherent scattering by groups of parallel graphitic layers, which were previously identified by Biscoe and Warren using XRD. Hall’s results indicated that graphite-like domains are arranged approximately parallel to the surface of the roughly spherical carbon black particles—they are arranged concentrically around the core. The electron microscope was used to measure the particle size of carbon blacks and to observe their state of aggregation. At that time, the resolution of available microscopes did not allow the accurate assessment of the internal structure of the spherical particles.
The internal structure of carbon black particles in term of arrangement of turbostratic domains was finally revealed in the 1960–1970s. A decisive contribution in such research was provided by development of two TEM techniques: dark-field and phase contrast electron microscopy. Papers published by Heidenreich et al. [36] and Oberlin [37] had given outstanding results in this field. An important guideline to understanding the internal structure were also TEM observations of carbon blacks subjected to oxidation by nitric acid or air at high temperature [38]. In a TEM image of carbon black after oxidation (Figure 4) only an external shell is visible, while an inner part of the particles is empty. These studies revealed that the oxidation process is selective—first the core part of primary carbon black particles is oxidized, while the outer part is more resistant and remains undamaged for a longer time.
Heidenreich et al. [36] proposed a carbon black model, which assumed that primary particles of carbon black are composed of concentrically arranged turbostratic graphitic domains. These domains are oriented approximately parallel to the outer surface of the primary particles. They are larger at the outer part of the primary particles, while the central part is made of much smaller domains, arranged randomly, or even amorphously. Heidenreich’s model explained why the oxidation process starts from the central part of carbon black nanospherules and why differences in the average size of graphitic domains determined based on XRD for various carbon black grades occur (for larger nanospherules larger domains are formed). The combination of the XRD and TEM studies enabled the construction of a multiscale model, according to which carbon black consists of three-dimensional aggregates (Figure 5a), composed of spherical particles (Figure 5b), in which turbostratic graphitic domains (Figure 5c) are concentrically arranged [40].
The development of phase contrast microscopy led to direct imaging of carbon layers in carbon blacks. The initial difficulty in using phase contrast was due to the low quality of electromagnetic lenses (large spherical aberrations), but the visualization of carbon layers was possible due to lattice-fringes imaging. The first lattice fringe images of graphitised carbon black were obtained by Heidenreich and colleagues [36] as early as in 1968. By using an aperture large enough to accept two electron beams (the direct (000) and the (002) scattered) and introducing a suitable defocus of the objective lens, a set of bright and dark fringes were obtained in the Gaussian plane. The obtained fringes were interpreted as an enlarged projection of the carbon layers onto the observation plane. In later years, due to the systematic increase in the quality of available electromagnetic lenses, it was possible to increase the diameter of the objective aperture, allowing for interference of a larger number of beams, up to the total abandonment of their use during HRTEM imaging. However, it should be emphasized that most of the early images were not directly interpretable in terms of the atomic structure. The HRTEM image is a convolution between the crystal projected potential and the microscope contrast transfer function. The correct interpretation of high resolution TEM images, due to the fact that electrons are scattered more than once during the passage through the sample and because that the rule describing the intensity of the exit wave contains non-linear components, is not trivial [42]. These difficulties become less crucial for high accelerating voltage and for very thin samples, and it can be assumed that electrons have been scattered only once. Under this condition, it becomes possible to interpret phase contrast in terms of the crystal potential and to receive the structural information from the obtained images. However, the interpretation must be very careful and the obtained HRTEM images have to be compared to the results of computer simulations. It is worth noting that due to the low Z value of carbon, the acceptable thickness of carbon materials is much higher than for heavier elements. Although many nanostructured carbon materials, such as graphene, carbon nanotubes, and fullerenes fulfil this condition, obtaining and interpreting HRTEM images for “traditional” carbon forms such as carbon black are more complicated. Carbon blacks, because of their disordered structure, do not take full advantage of the possibilities offered by the most advanced electron microscopes, including direct imaging of the arrangement of individual atoms, as in the case of lower-dimensional structures such as graphene.
Heidenreich’s structural model of graphitised carbon black adopted a concept of rather flat graphite layers grouped in stacks with an interplane distance of approximately 3.4 Å and arranged in a concentric manner around a hollow centre. Carbon layers, visible on the obtained HRTEM images for graphitised carbon black, proved to be larger than for primary particles, which was already known from the XRD measurements [19]. An example of a first high-resolution TEM image for graphitised carbon black and its structural model proposed by Heidenreich et al. [36] are shown in Figure 6a,b, respectively. Defects in the form of dislocations and bending of a graphite-like lattice were already noticed at that time, but it was concluded that they are rather occasional [36]. As it turned out based on more recent TEM observations, things are quite different, the graphitic layers are rather far from perfect and carbon black can be regarded as “disordered” carbon.
By combining different TEM modes, such as (hkl) or (hk) tilted dark-field, (002) lattice fringes, contrasted bright-field (BF), and selected area electron diffraction (SAED), the behaviour of carbonaceous materials heat-treated up to ~3000 °C was explained. At this point it is worth mentioning the important works of Oberlin and Terriere [43], Oberlin [44], and Rouzaud and Oberlin [45] on the TEM studies of the carbonisation and graphitisation of disordered carbons. In these papers, multiple stages of the high-temperature heat-treatment process were identified and the resulting structures were described in terms of “basic structural units”, which are packages of stacked, parallel graphene layers. It has been established that this process is carried out according to the following scheme [44]:
- -
- atoms of non-carbon elements are first removed;
- -
- basic structural units arrange in columns;
- -
- after removing structural defects between the columns, it becomes possible to combine them and form larger but still strongly defected carbon layers;
- -
- above ~2000 °C plane defects are removed and ordering of the structure in three dimensions proceeds.
The structural data obtained by Oberlin and colleagues [43,44,45] using TEM were compared to diameters of the coherent domains determined based on the (110) diffraction peaks and both methods gave similar results. In carbon materials derived from organic precursors and heated up to ~1000 °C, the basic structural units have been shown to be turbostratic stacks of two or three layers having a diameter around 1–2 nm. It was suggested that the basic structural units are separated by tilt and twist boundaries where defects and heteroatoms are gathered. During the heat-treatment process the basic structural units coalesce face to face into distorted columns. Further steps involve lateral coalescence of columns and curing of in-plane defects, and then ordering of the structure towards perfect graphite -AB-AB- stacking of carbon layers may occur. In non-graphitising carbons, however, the graphitisation is inhibited due to the very small extent of the basic structural units (5–10 nm) and their strong disorientation.
Detailed structural investigations for a series of five carbon black grades heat-treated up to 2600 °C, by three research techniques: HRTEM, XRD, and Raman spectroscopy are presented in Reference [46]. Examples of the XRD patterns for raw and heat-treated Printex 25 carbon black are shown in Figure 7. They exhibit features typical for the turbostratic structure. For all raw carbon black grades, the diffraction patterns are composed of three broad lines, which can be indexed as the (002), (10), and (11) graphite-type reflections. Structural parameters determined by means of quantitative analysis of the (002) peak are given in Table 1. The values of d002, calculated from the Bragg equation, and Lc, estimated via the Debye–Scherrer formula, do not exhibit meaningful differences for various carbon blacks. Therefore, based on these results it was not possible to clearly distinguish between the different carbon blacks and justify the differences in their physical properties.
In turn, the HRTEM images show noticeable dissentions in the arrangement of the basic structural units, which may be correlated with observable differences in physical properties. For example, the outer part of the Printex 25 particles is built of larger and more regularly arranged units, which tightly surround a more disordered core. Such nanostructure prevents fast oxidation of the shell. FW200 carbon black contains smaller particles. Their outer shell is less developed, and the oxidation process may take place at lower temperature. The comparison between Printex 25 and FW200 carbon blacks is shown in Figure 8. The TEM imaging of the multiscale organisation (morphology of aggregates, shape and size of nanospherules, nanostructure) appears to be the most suitable method to discriminate between unheated carbon blacks.
The direct imaging of layer planes was used to analyse changes in the structure of carbon black during the graphitisation process. It was established that heat-treatment at 2600 °C transforms carbon black particles into faceted particles which appear to have closed shell-like structures. The precise structure of the graphitised particles depends on the nature of the primary carbon black. For Printex 25 relatively large, discrete particles are formed, as shown in Figure 8C, while for FW200 smaller and less defined particles with many curved planes are formed, as shown in Figure 8F. The HRTEM images shown in Figure 9 clearly indicate that during heat-treatment up to 2600 °C, only a partial ordering of carbon units toward graphite structure takes place and the ordering is limited by the diameter of the primary particles. The size of the basic structural units after heat-treatment correlates with the initial size of the primary particles (the bigger the primary particle the bigger the basic structural units), which is in agreement with the previous results obtained by Oberlin and Rouzaud for cokes [44,45]. They demonstrated that the graphitisation degree of carbonaceous materials is limited by the diameter of polyaromatic layers oriented in parallel. In fact, the diameter of carbon black nanoparticles plays the same role as the size of domains build from individual basic structural units oriented nearly parallel in cokes. As the largest carbon black nanoparticles are rather small (<0.1 μm) in comparison to the largest coke domains (up to 100 μm), the carbon blacks are only weakly graphitising, whereas the cokes can be highly graphitising.
Last but not least, the issue discussed in this section is the curved shape of graphene layers in carbon black and soot. In 1986, just after the discovery of fullerenes by Kroto [48] in 1985, Zhang et al. [49] suggested that spherical soot particles may growth from fullerene-like structures acting as “nuclei”. Kroto and McKay [50] expanded this idea and proposed the so-called “icospiral nucleation scheme” and “pentagon road model”. According to this idea, the first stages of soot particles resemble the shell of a nautilus. The growth proceeds along a spatial spiral—along the opening of the nautilus shell. Such a mechanism involves the incorporation of pentagonal rings into a growing carbon network, driven by the need to eliminate dangling bonds. However, this model was questioned based on, among others, XRD studies. Ebert [51] pointed out that d002 spacing for continuously curving icospirals would be lower than those observed experimentally in the diffraction patterns of soot. Nonetheless, the fact that fullerenes had been predicted to occur in flames [52], as well as the reasonable idea that bent faceted planes and closed structures in soot arise from the presence of pentagonal rings supported the hypothesis that soot and related carbon black have a fullerene-related structure [53].
The dark lines visible in the HRTEM images are the projections of carbon layers. Figure 10 shows nanostructure of soot from premixed flames. The similarity of soot nanostructure to previously presented carbon black is evident. In Reference [54] the authors image carbon layers and characterize them in a quantitative way. The imaged carbon layers are highly curved and resemble fragments of fullerenes. Mathematical morphological analysis of HRTEM images may be applied to extract structural parameters related to the curved geometry of individual fringes as layer length, tortuosity, and local curvature radii. Because pentagonal rings cause the curvature of fullerenes and carbon nanotubes, it is believed that they are also the origin of the non-planarity in soot. The formation of other topological defects cannot be ruled out. The missing atoms in hexagonal network break the periodic order and may cause the misalignment of layer segments relative to one another, resulting in the layer curvature, as shown in Figure 11.
3. Glass-Like Carbon and Other Pyrolysed Non-Graphitising Carbons
Glass-like carbon, often called “glassy carbon”, is another representative of non-graphitising carbons, for which the fullerene-related structure was proposed [7,53,56]. This form of carbon is produced by the pyrolysis of organic precursors such as phenolic or furfuryl alcohol resins and is very chemically inert and impermeable to gases comparing to other carbons. In this section we focus mostly on the glass-like carbon. However, a discussion over other non-graphitising carbons produced by pyrolysis is indispensable since they belong to the same group of carbon materials and show common structural features. In 1951 Franklin described XRD studies of the effect of high-temperature heat-treatment (up to 3000 °C) on the structure of various carbons prepared by pyrolysis of organic materials and proposed they fall into two classes, graphitising and non-graphitising [21]. She showed that the recorded X-ray diagrams for all non-graphitising carbons can be satisfactorily interpreted by supposing the existence of graphite-like domains together with a certain proportion of highly disordered material. Figure 12 shows her representation of the structure for those carbons which may be converted into graphite by high-temperature annealing and for those which could not [21]. Franklin assumed the presence of disordered cross-links connecting the small graphitic crystallites in non-graphitising carbons leads to their resistance against graphitisation, hardness, and formation of pores.
Although the cross-links were very important to Franklin’s structural model, she could not explain their nature based on the XRD studies. In 1959 Ergun and Tiensuu [57] gave another interpretation of the XRD patterns of non-graphitising carbons. They showed that clusters of tetrahedrally-bonded carbon atoms give rise to diffraction bands in approximately the same angular region as the two-dimensional (10) and (11) reflections of graphene layers, that is at values s = 2sinθ/λ (θ is the scattering angle and λ is the wavelength) of about 0.5 Å−1 and 0.85 Å−1, as can be seen in Figure 13. Therefore, they argued that from the broad, diffuse diffraction peaks of non-graphitising carbons it is very difficult to completely rule out the presence of diamond-like structures. Moreover, when crystallites are very small containing finite number of atoms, a diamond lattice yields interatomic distances and atomic distributions very close to those of carbon black obtained by Warren [16].
The presence of sp3 bonds would explain glassy carbon hardness and the nature of cross-links envisaged by Franklin. Such a structural model was also propagated by Noda and Inagaki, who proposed that both types of coordination, trigonal and tetrahedral, occur in the structure of glassy carbons prepared from furfuryl alcohol resin [58]. They determined the quantitative amount of the tetrahedral bonds for carbon pyrolysed at 2000 °C to be 50%. However, further ND studies have shown absence of diamond-like structures in glassy carbon [59] and pointed out that previous analysis was wrong due to poor quality of diffraction data. Noda and Inagaki used diffraction data only extending to a scattering vector, Q = 4πsinθ/λ, of 10 Å−1, what resulted in the spatial resolution for diffraction data in the real space of only around 0.6 Å. It is noteworthy that nowadays the powder XRD and ND measurements provide a great coverage over a wide Q-range up to around 60 Å−1 and the analysis of the diffraction data in real space in the form of the pair or radial distribution function is much more accurate than many years ago. The issue of the sp3-bonds’ presence in non-graphitising carbons has not been completely explained. Most recent studies using the total scattering method combined with computer simulations of the atomic structure support the thesis that these carbons contain mostly sp2-type bonds; however, the presence of small amounts of sp3 bonds is possible [26,60]. It should be mentioned that so far, the TEM investigations have not provided images of diamond-like structures in non-graphitising carbons and observations of isolated sp3 bonds would be extremely difficult.
In the 1960–1970s new methods of the diffraction data interpretation for disordered carbons became more extensively used. Ruland and Perret [61] applied Fourier transform methods for the analysis of layer-line profiles of a heat-treatment series of non-graphitising carbons. Ergun et al. [62,63,64] developed an analysis of the diffraction patterns for disordered carbons, deriving equations which allowed the calculation of the diffraction profiles and their direct comparison with the experimental functions for larger scattering vector ranges. Warren and Bodenstein [65,66] proposed an approximate equation that allowed calculations of the powder diffraction patterns for relatively large models assuming disorder in the layer stacking. Mildner and Carpenter [67] performed an analysis of ND data in real space for glassy carbon, calculating the contribution to the radial distribution function (RDF) resulting from the turbostratic structure. Ergun and Schehl [68], analysing the X-ray scattering data for glassy carbon, showed that a model based on the quinoid structure can satisfactorily account for the experimental RDF data. More recently Burian et al. [69] and Dore et al. [30] reported that turbostratic models with paracrystalline distortion of the hexagonal network reproduces very well all features of the experimental RDFs for activated carbons. They used a curve-fitting method to the RDF for obtaining structural parameters such as interatomic distances, their standard deviations, and the coordination numbers. Szczygielska et al. [70] used a different approach to the structure of activated carbons, which is based on analysis of the experimental ND data in reciprocal space, since RDF is weakly sensitive to the number of layers in coherent scattering domains. In this approach, the diffraction intensities were calculated on the basis of a paracrystalline model with very weak interlayer spatial correlations in which the atomic Cartesian coordinates were taken to obtain the interatomic distances in the Debye equation. Szczygielska et al. [71] studied also the graphitisation process in carbon materials using the radial distribution function. It was shown from analysis of the XRD data in real space that carbons produced from saccharose are clearly non-graphitising, while for anthracene-based carbons the inter-layer correlations start to play a role at about 1900 °C, and at 2300 °C practically complete transformation into graphite is observed. The changes in the experimental structure factors and the RDFs for the studied carbons heat-treated at 1000, 1900, and 2300 °C are showed in Figure 14a,b.
Since the knowledge of structural parameters such as interlayer spacing, d, thickness of basic structural units, Lc, and their diameter, La, is very important to understand the carbonisation and graphitisation process, researchers often use the diffraction XRD or ND patterns or TEM images to characterize these parameters for graphitic carbons [18,21,43,44,45,46,72,73,74,75,76,77]. Many attempts have been made to compare the structural parameters from both techniques, but they are mostly only qualitative and sometimes they differ from each other. This may result from the fact that powder XRD or ND gives quantitative information from greater sample volume than TEM, and when a material probed with TEM is not fully homogenous at the atomic level, the obtained information cannot be considered as representation of the sample in general. This may be the case when the structure is composed of highly graphitised portions and disordered portions. The second reason why the structural parameters obtained by powder XRD or ND and TEM may differ is misunderstanding of their physical meaning in these two techniques. This especially applies to the La parameter referred to as the average size of graphene layers in direction parallel to them. Namely, La from XRD represents only the linear portions of layers, while in TEM La is the length of the (002) lattice fringes, most of which are not straight. Therefore, the values of La obtained from TEM in such a case are usually larger than from XRD or ND pattern analysis. This issue is discussed in the work of Sharma et al. [78]. What is more, Sharma et al. pointed out that analysis of TEM images is usually obtained manually and that human subjectivity is involved in such evaluation. These authors developed a computer algorithm to obtain interlayer spacing, layer size, number of layers per stack, and their distribution from TEM images. It has been shown that the structural parameters obtained using this algorithm for non-graphitising phenol-formaldehyde-based carbon heat-treated at 1000 °C and 1400 °C agree very well with the results of the XRD. However, it was demonstrated that the La parameter obtained using the Scherrer’s approach to the (100) and (110) diffraction profiles [79] differ significantly from the results given by Diamond’s approach to the (11) line [72], and TEM results are compatible only with the Diamond’s approach. The comparison between structural parameters from XRD and TEM compiled by Sharma is shown in Table 2.
It is important to note that values of the average layer size of the ordered regions may be also neatly obtained from the diffraction data in the real space in the form of the atomic pair distribution function. The range of the PDF oscillations yields the average size of coherent scattering domains. Using computer modelling of the structure and fitting of the model-based diffraction data to the experimental diffraction data in both real and reciprocal space, it is possible to determine the size and shape of basic structural units in directions parallel and perpendicular to the graphene layers and the number of layers in stack. Examples of such modelling [25,26] are presented later in this section.
Although XRD studies of disordered carbons performed by Franklin did not provide evidence that the graphite-like layers may be curved, she first allowed such a possibility to explain the mechanism of the crystallite growth during graphitisation: “In a compact carbon, the conception of whole layer-planes moving by small stages seems a reasonable one; no large, abrupt movement need be involved, especially if we admit the possibility of a slight bending of the layers during their migration” [21]. Among other early glassy carbon researchers assuming curvature of its structure, it is necessary to outline the work by Jenkins and Kawamura [80]. Analysing XRD and TEM results they considered that glass-like carbon has a network structure consisting of tangles and curved ribbons of graphitic carbon which are cross-linked and which during the graphitisation process the ribbons are flattened and straightened. This model has been quite widely accepted, but it was not compatible with the observed impermeability to gases and low reactivity of glass-like carbons. Oberlin [43] has also pointed out that the ribbon-like interpretation of the structure for disordered carbons based on the TEM images may be misleading. In TEM, only a part of the structure is imaged—only the fringes parallel to the electron beam. The carbon layers which are under the Bragg angle with respect to the incident beam should appear. Since for graphitic carbons only the (002) fringes are resolved, it is impossible to determine if the layers are ribbon-like or rather isometric-like [43]. Oberlin, however, suggested the presence of in-plane and boundary defects and wrinkling of graphene layers which disappears during the high-temperature graphitisation process. Detailed studies of the structure for non-graphitising carbons have been developed after the discovery of fullerenes since it turned out that non-planar sp2-bonded carbons containing non-six-membered rings can be highly stable. A huge contribution to this field was provided by HRTEM. Harris et al. [7] showed that HRTEM images of glass-like carbons contain many features which indicate fullerene-related structure. These include completely closed nanoparticles of different size, some of them similar to C60, multi-layered giant fullerene-like structures, nanotube-like structures, saddle points, and negatively curved features. Examples of such structures observed for commercial glassy carbons are shown in Figure 15.
Harris [7] studied “low-temperature” and “high-temperature” glassy carbons, which means those pyrolysed at temperatures up to 1000 °C and heated at temperatures of 2000 °C or higher, respectively. Typical HRTEM micrographs for those two types of glassy carbon are shown in Figure 16a,b, respectively. In the case of the “low-temperature” carbon, the microstructure is disordered and isotropic, consisting of tightly curled single-carbon layers, which enclose micropores of the order of 1 nm in diameter, with little obvious formation of graphitic layer. The “high-temperature” carbon contains bigger graphitic structures and rather many more layers, but there is no macroscopic graphitisation. Completely closed nanoparticles are present and often are multi-layered and have inner cavities approximately 5 nm in diameter. The existence of large numbers of fullerene-like nanoparticles explains the observation of impermeability to gases and low reactivity of glass-like carbon compared to other carbons. As a result of this research, Harris proposed models for the structure of the “low-temperature” and “high-temperature” non-graphitising carbons. The common feature of both models is the presence of curved graphene sheets, in which pentagons and heptagons were dispersed randomly throughout networks of hexagons. The models are shown in Figure 16c,d. Compelling evidence for the fullerene-like model of non-graphitising carbons was found in 2008 by Harris et al. [81] in some HRTEM images of activated carbon. They recorded the presence of five-membered rings in the network of hexagons, which can be seen in Figure 17, providing a possible explanation of the observed curvature and ripples of graphene-like layers. Up to now there is no other explanation for the formation of curved fullerene-like structures in non-graphitising carbons such as the one that assumes the presence of topological defects in the form of non-hexagonal rings.
It is worth mentioning that Gogotsi et al. [82] showed also very interesting electron microscopy studies of glassy carbon structures. He discovered unusual polyhedral nano- and micro-objects with shapes of faceted needles, rods, rings, barrels, and double-tipped pyramids, in pores of glassy carbon, and they were called “graphite polyhedral crystals”. Some of the observed structures were giant radially extended nanotubes with high degree of perfection, as can be seen in Figure 18A,B, and in the insets of Figure 18G. It was assumed that such polyhedral nanotubes grew from C–H(N2) gas trapped in pores during carbonisation at 2000 °C and closure of the central nanotube can occur due to pentagons giving rise to a curved geometry at the tip. Recently, we have also observed similar polyhedral nanotubes to those found by Gogotsi in polyfurfuryl alcohol-derived glassy carbon pyrolysed at 2500 °C, as can be seen in Figure 18H. The presence of such objects with a non-planar geometry in glassy carbon is a further indication that it may have a fullerene-like structure.
The emergence of the fullerene-related model for non-graphitising carbons has prompted many studies to interpret the powder ND and XRD data in terms of graphite-like structures containing non-hexagonal defects. The atomic pair distribution function approach was widely used for this purpose. By using this approach Petkov et al. [83] carefully examined the experimental ND data for polyfurfuryl-alcohol-based glassy carbons and optimized models for their local atomic structure which are consistent with the experimental results. To identify the basic structural units of the structurally coherent regions they considered the first few peaks in the PDF. The first three peaks for carbon prepared at 1200 °C were positioned at real space distances of 1.41, 2.47, and 2.85 Å, respectively, which exactly match the in-plane C–C bond distances in the aromatic-type ring of graphite, marked in Figure 19a. However, for carbon prepared at 800 °C, the third peak was broadened, and its intensity dropped when compared with that for 1200 °C. The third neighbour peak is present in the six-membered carbon ring but not in pentagon-ring, while higher-membered rings should appear at a different distance depending on the size of the ring. This peak is relatively weak and broadened for samples pyrolysed at 800 °C providing strong evidence that there is a significant proportion of non-hexagonal rings in the structure. The PDF modelling performed by Petkov et al. has indicated that carbon obtained at relatively low temperature (400 °C) may have a heavily distorted structure which can be well approximated with an assembly of uncorrelated polymeric-like chains of carbon atoms. Glassy carbon obtained at 800 °C is composed of curved and defective graphene sheets, and carbon pyrolysed at 1200 °C is made of stacks of uncorrelated graphene sheets forming nanocrystalline domains. An example of the comparison between the experimental PDF for the glassy carbon pyrolysed at 800 °C and the calculated PDF for an optimized curved graphene-type model is shown in Figure 19b.
Due to the development of computer simulation methods such as ab initio molecular dynamics, Reverse Monte Carlo (RMC), and Hybrid Reverse Monte Carlo (HRMC), the generation of physical structural models which extend up to thousands of atoms has become possible. In these models of disordered carbons, consisting of the Cartesian coordinates of atoms, the presence of topological defects was assumed. A number of XRD and ND studies combined with modelling have been published in this area [25,26,30,84,85,86,87,88,89,90]. It is worth noting that ED in a transmission electron microscope has also been applied to determine the structure factors and the pair distribution functions for glassy carbons and to investigate their local structure. For example, O’Malley and Snook [91] utilized the Reverse Monte Carlo method in order to obtain three-dimensional atom configurations by fitting the structure factor and pair distribution function, shown in Figure 20, provided by the ED. The models produced by the RMC method consisted of randomly stacked graphitic basal planes possessing a buckled nature. It was found that significant non-graphitic regions exist in glassy carbon, including the presence of non-hexagonal rings. These disordered regions decrease in extent as the heat-treatment temperature increases. Interestingly, the existence of three- and four-membered rings in the simulated structures was revealed, as can be seen in Figure 21. Although the RMC procedure converges very well to the experimental data, the large amount of three- or four-membered carbon rings is unrealistic since they are highly-unstable carbon configurations. Further HRMC simulations excluded a possibility of the presence of such atomic configurations in disordered carbons [84].
Another approach widely used to construct atomic physical models including topological defects is classical molecular dynamics. The energy of the computer-generated models is optimized using potential, describing interactions between carbon atoms such as reactive empirical bond order potential for atoms lying in the same layer and the Lennard–Jones potential for atoms lying in different graphene-like layers. As a result, three-dimensional models with intrinsic disorder are obtained. The experimental data are analysed by comparison of the model-based calculations of the structure factors and the pair distribution functions with the experimental functions. Such a procedure was used by Hawelek et al. [25] to investigate the structure of commercial activated carbons AX21 and BP71. He proposed models containing two and four graphene layers for AX21 and BP71, respectively, approximately 16–20 Å in size, containing non-six membered rings in the form of the Stone–Thrower–Wales (STW) defects. It should be noted that defects introduced to the considered models lead to fluctuations in the nearest neighbours inter-atomic distances. If these defects are randomly distributed over graphene layers, the fluctuations of the next neighbours distances increase proportionally to the square root of the inter-atomic distance, according with the paracrystalline approach [69,70]. Such a propagation of the network distortions influences both the structure factors and the radial distribution functions, leading to their attenuation and broadening. The correctness of the constructed models was confirmed by the good agreement between the experimental and simulated data, shown in Figure 22. Both peak positions and amplitudes are well reproduced by the models, presented on the right in Figure 22, despite slight discrepancies in the region of the first and second PDF peaks. These discrepancies can be related to problems with the contribution resulting from a possible correlation between the structural units building up the whole sample volume. Such effects are not accounted for in the present approach in which only spatial correlations between atoms within an average structural unit are considered. Based on the obtained results it was concluded that the activated carbons have a fullerene-related structure, but it is impossible to find only one precise model which would explain the observed experimental data.
The Harris’s model for fullerene-related structure of non-graphitising carbons in which it is assumed that pentagons, heptagons, and other non-six-membered rings are randomly distributed over the network of hexagons has prompted modelling studies taking into account such configurations. However, for a long time there was no a direct microscopic evidence of heptagonal or higher-membered ring defects in this type of carbon materials. Finally in 2012, Guo et al. [92] provided unequivocal experimental data for the presence of connected five- and seven-atom ring defects in glassy carbons. They obtained atomic-resolution images, shown in Figure 23, by using the annular dark-field scanning TEM (ADF STEM), and demonstrated that wood- and polyfurfuryl alcohol-based nanoporous carbons indeed comprise isotropic three-dimensional networks of wrinkled graphene sheets in which the non-hexagonal defects are frequently observed. These defects were found typically within one or two rings of another five- to seven-ring pair structure, which suggests that they are correlated with each other. Such a phenomenon is similar to what has been observed in grain boundaries, where the dislocation cores align to minimize their strain energy.
These findings strongly support the idea that non-hexagonal defects in graphene-like layers cause their corrugation and consequently affect their stacking, which in turn determines the structure of nanopores and adsorption properties. A direct imaging probably ensures the best evidences for the presence of local curvature and topological defects in the structure of non-graphitising carbons, but it does not provide quantitative information on the degree of curvature and number of defects in greater sample volume. The quantitative analysis of the structure is essential for predicting the macroscopic properties. Here the powder XRD and ND methods combined with modelling come to help us. Recently, it has been shown that the changes in the fullerene-like curvature of an atomic network for a series of polyfurfuryl alcohol-based glass-like carbons may give a fingerprint in ND and XRD data converted to the atomic pair distribution function representation [26]. It has been shown that for all carbons pyrolysed at various temperatures in a range 800–2500 °C, the positions of the PDF peaks in the first few coordination spheres up to around 6 Å are practically the same as those of the perfect hexagonal graphene layer, as seen in Figure 24a. But the PDF peaks in the range around 13–19 Å, seen in Figure 24b, are moved towards shorter distances for the “low-temperature” glassy carbons when compared with graphite, and they shift towards greater interatomic distances when pyrolysis temperature increases. For the “high-temperature” glassy carbon pyrolysed at 2500 °C, the PDF peak positions approach the interatomic distances for unstrained graphite. Therefore, it seems that based on the PDFs we are able to compare the degree of the atomic structure curvature for different graphitic carbons.
In order to quantitatively specify the degree of the curvature, manifesting itself in the XRD and ND data, computer-simulated models of the atomic structure were optimized using the molecular dynamics method. The simulation procedure allowed estimation of the averaged coherent scattering domain size, number of layers in the stack, and the kind and number of the topological defects, assuring good agreement with the experimental diffraction data. For the glassy carbon pyrolysed at 800 °C, the best agreement was achieved when the monovacancies were introduced into the model of coherent scattering domain. For carbon heat-treated at 1000 °C, a mixture of vacancies and STW defects were optimal, while for carbons pyrolysed at higher temperatures, 1500 °C, 2000 °C, and 2500 °C, only the STW defects introduced in the models allow for the best fit to the experimental structure factors and the PDFs [26]. In principle, based on these results, the presence of other defects cannot be rejected, but they may indicate what type of defects dominate and what the mechanism is whereby “low-temperature” glassy carbon is transferred into the “high-temperature” structure.
For the structural models with sizes representing the extent of the coherently scattered domains, shown in Figure 25, it is assumed that they diffract independently. However, it is quite possible that structures constructed from larger fragments would display slightly different behaviour to those made from smaller ones. The larger fragments of structure should account for spatial correlations between atoms within a single coherent scattering domain, as well as between atoms lying in different domains. It was demonstrated that bigger structural models created through a coalescence of the smaller building blocks match both neutron and X-ray experimental diffraction data in reciprocal and real spaces significantly better than the models of single coherent scattering domains [26]. The boundaries of the linked domains are regions rich in various defects, which can be recognized in the fragments of the models presented in Figure 26a–d. The presence of agglomerated defective regions induces the formation of curvature in the form of fullerene-like or nanotube-like elements. This is in agreement with the outcome of work published by Guo et al. [92] showing ADF STEM images of agglomerated defective sites in the glassy carbon structure. The proposed models were confirmed by direct HRTEM observations for the same series of polyfurfuryl-alcohol based glassy carbons published in Reference [93]. Examples of the microscopic images for glassy carbons pyrolysed at 800 °C, 1500 °C, and 2500 °C are confronted with the structural models in Figure 26. This comparison indicates that both methods TEM and XRD or ND combined with simulations give consistent structural information.
Another convincing example showing a good agreement between TEM images and atomistic modelling of the structure for non-graphitising carbons is presented in Figure 27. It is clear that these models proposed by Tomas et al. [60], optimized using an annealing based molecular dynamics approach, reproduce the main characteristics of HRTEM pictures including microstructure, porosity at the nanometre scale, and graphitisation with increasing temperature. Simultaneously, the authors showed that they reproduce features of the experimental pair distribution functions derived from XRD data [60].
4. Carbon Nanotubes and Graphene
Review articles on application of TEM for structural studies of carbon nanomaterials have been already published [94,95,96,97,98,99]. Therefore, in the last two sections we will focus only on some selected issues which may be confronted with achievements of powder XRD and ND in characterization of carbon nanotubes, graphene, nanodiamonds, and nanoonions.
Carbon nanotubes (CNTs) were discovered in 1991 by Iijima using HRTEM imaging. Some of Iijima’s first images of multiwalled carbon nanotubes (MWCNTs) are shown in Figure 28a. Parallel dark lines correspond to fragments of coaxially stacked nanotube cylinders parallel to the incident electron beam. The separation distance between walls of adjacent nanotubes was estimated to be 0.34 nm. However, many years before the Iijima discovery, in 1976, Oberlin et al. [99] presented similar TEM images, which are shown in Figure 28b. The resolution of electron microscopes available at that time did not allow to “see” the structure of carbon walls in such objects and the Iijima HRTEM observations led to correct description of the CNT structure. Nowadays, HRTEM gives the possibility of distinguishing between carbon nanofibres and carbon nanotubes [94].
Combined HRTEM and ED patterns elucidated the helical structure of CNTs [1,101]. IIjima [101] showed that the helical arrangement of hexagons in a graphitic carbon tubule is responsible for the symmetry observed in the experimental ED pattern (Figure 29). The diffraction pattern of single-walled carbon nanotubes (SWCNTs) may be understood by considering diffraction from two parallel parts of the nanotube, corresponding to the “top” and “bottom” wall of it. An electron beam incident normal to the tube axis passes sequentially through the two these fragments and the resultant diffraction pattern is the sum of that from each of them. The diffraction pattern obtained from the MWCNT or rope of the CNTs can be considered as the superposition of the diffraction patterns coming from the concentrically stacked SWCNTs. It is known that CNTs may have different electronic properties, depending on their diameter and chirality [102]. Therefore, a detailed determination of such structural features is very important. Since the preliminary characterization of CNTs, a variety of experimental approaches for the determination of their conformation using both ED and direct imaging have been described. In Reference [103] the various methods for the accurate determination of the chiral indices of CNTs from ED patterns are collected.
The quality of early SAED patterns was poor and their analysis was limited. However, the development of nanoarea electron diffraction (NAED) significantly improved the analysis of the CNT structure. Figure 30 shows NAED patterns together with HRTEM images for folded graphene. Graphene folding, like forming a carbon nanotube by rolling up a graphene sheet, can occur in any direction. The graphene folding angle can be measured similarly to the chiral angle measurement of the CNTs [104].
The powder XRD and ND methods become inadequate for determining chirality of single carbon nanotubes or folded graphene. However, the X-ray or neutron powder diffraction studies may provide some quantitative information on the structure of nanocarbon powder. One of the first XRD investigations reported in Reference [106] have shown that the structure of the MWCNTs is turbostratic in nature. Furthermore, XRD and ND patterns of the MWCNTs often show a presence of additional peaks, beside the () and () type peaks due to the turbostratic structure [23,107]. These peaks correspond to reflections of graphite which may only exists if some regular stacking of layers occurs. The presence of these reflections can be explained by the existence of flat graphitic layers in the CNTs of polygonal shape. It is in agreement with TEM observations of the polygonised MWCNTs with large diameters [97]. Powder XRD and ND may be also useful for getting information about CNT bundles or ropes. Many synthesis methods provide CNTs in aggregates assembled into a 2D hexagonal lattice held together by van der Waals forces, as shown in TEM images presented in Figure 31a–c. When SWCNTs are arranged in such ropes, their diffraction pattern shows a Bragg peak at around 0.43 Å−1 (Figure 31d) due to diffraction on the two-dimensional hexagonal lattice. Careful inspection of Figure 31b,c reveals differences in the diameters of SWCNTs in the ropes [95]. It was shown that the position, intensity, and width of the () diffraction peak could be affected due to the different diameters and the powder XRD or ND data may help to get an average value of the SWCNT diameter, as well as to estimate distribution frequencies of the tube diameters [108].
Computer simulations of diffraction data based on the Debye equation have revealed that for CNTs of small diameter (~0.7 nm) it is possible to distinguish between armchair, zig-zag, and chiral configurations, as can be seen in Figure 32a [109]. As the diameter of the tubule increases (up to around 6 nm), the differences between the different configurations disappear, as showed in Figure 32b, and the powder XRD or ND is not adequate to determine the CNT chirality. Experimental investigations confirmed that XRD may be a useful tool to “fingerprint” the chiral indices of bulk SWCNT samples, when tube diameters are small (~1 nm) [110].
Beside the dependence of CNT properties on the way a single graphitic sheet is wrapped up into a cylinder, it has been revealed that CNT properties are directly related to the presence of defects in graphene network. Although the CNTs with the perfect hexagonal structure exhibit ballistic transport of electrons, the presence of such defects leads to additional states in an energy gap and to a reduction of CNT electrical conductivity [111,112,113]. A number of studies have demonstrated that CNTs may contain topological defects such as vacancies, Stone–Thrower–Wales defects, and other non-hexagonal rings. One of the first direct HRTEM observations of the formation and relaxation of individual topological defects in double-walled CNTs (DWCNTs) was presented by Urita et al. [114]. The interlayer defects, which cause curvature of graphene layers and bridge two adjacent layers, shown in Figure 33, were assigned to interstitial vacancy pairs. The accelerating voltage for these HRTEM observations has been chosen as 120 kV, which is just close to the threshold of the knock-on-damage effect of graphite (130 kV) [115].
The interaction of electrons with carbon material may result in damage of the atomic structure—it is the so-called knock-on-damage phenomena. An example of such damage to the SWCNT structure is presented in Figure 34 [117]. These images show amorphous-like disordering of CNT structure after 200 keV irradiation. Smith et al. [117] established that the threshold electron energy for the knock-on damage to an isolated SWCNT is only 86 keV. As the electron energy is increased from 86 to 139 keV carbon atoms become susceptible to ballistic ejection, and above 139 keV, all atoms can be ejected. It means that the structure of CNTs cannot be stably imaged for long periods at high TEM accelerating voltages, which prevents the accurate detection and investigation of pristine structural defects. A reducing of the accelerating voltage (electron energy) solves the problem of the knock-on damage effect but it also results in a decrease of resolution of the observed images.
Alternatively, the characterization of the CNT atomic structure, including presence of topological defects, can be made through combination of powder XRD or ND data with computer modelling of the structure, as described in References [118,119]. The topological defects can be introduced into the computer-generated models in the form of Cartesian coordinates of atoms, and then relaxed using molecular dynamics method. The experimental XRD or ND data, in reciprocal- and real-space, are compared with model-based simulations. Such a procedure allows an estimation of the type and amount of defects for which a good agreement with the experimental data is obtained. It is important to point out that in such a way it is possible to quantitatively evaluate the average number of pristine defects (disorder) in probed CNT powder without the risk of the knock-on-damage effect. In this context, XRD and ND was established as a suitable test for the quality of carbon nanotubes produced by various methods, such as cathodic arc discharge (defect free), catalytic decomposition of hydrocarbons (low degree of disorder), and template deposition (high degree of disorder) [119]. A comparison of the structure factors and the pair-distribution functions for these CNTs is shown in Figure 35. For the defect-free MWCNTs, the peaks are clearly sharper and when the samples are more disordered, they become broadened as a result of network distortions due to presence of Stone–Thrower–Wales defects. The number of STW defects computed as proportions of rotated carbon–carbon bonds was 1.4%, 0.87%, and 0.66% for MWCNTs obtained by template deposition, catalytic DWCNTs, and catalytic MWCNTs, respectively.
Similar simulations verified by experimental XRD and ND data were applied for studies of the atomic scale structure of graphene powder [24,120]. For graphene flakes obtained by chemical exfoliation of graphite it was shown that the best agreement between experimental and model-based diffraction data was obtained for a model consisting of three graphene layers, 36 Å in diameter, with di-vacancy defects randomly distributed over the layers. The introduced defects lead to a departure from planarity of the graphene layers, as can be seen in Figure 36. Sofer at al. [121] demonstrated major advantages of ND and XRD techniques for structural investigations of bulk amounts of graphene. Compared to various microscopic techniques, XRD and ND methods can give overall information about the graphene microstructure such as average number of layers and in-plane size of coherently scattered domains. Powder XRD and ND methods are usually non-destructive and do not require any sample preparation based on dispersing in solvents that may imply changes in the structure. Laboratory X-ray sources do not destroy carbon specimens. When synchrotron or neutron sources are used, the final diffraction intensities are averaged over several scans that allow checking for structural changes of the investigated sample during radiation exposition. The irradiation damages were detected only under high radiation doses [122,123] which are not applied for diffraction studies. The use of X-ray free electron lasers can in principle introduce structural changes [124], and in such a case special care should be taken in order to avoid misinterpretation of the results. The application of XRD or ND is crucial for large-scale (industrial) characterization of graphene materials. The presented XRD and ND studies combined with modelling yield average information on structural defects and allow the characterization of the powder nanocarbon materials produced on industrial scale.
A major revolution for electron microscopy in the past decade was introduction of aberration correction (AC) that contributed significantly to the high-resolution imaging at low-operating voltages (60–80 kV). This is crucial for carbon nanomaterials which are sensitive to electron beam. For the low-operating voltage, the risk of sample damage by the electron beam is significantly reduced, and moreover, the contrast of the obtained images increases. The pioneer AC TEM studies performed by Suenaga and colleagues [106,116,125,126] have provided new information about the chirality of the smallest carbon nanotubes, the edge structure of graphene layers, the atomic-scale defects in nanocarbons, and how the defects can influence their macroscopic properties. Figure 37 displays images of the carbon network for the smallest carbon nanotubes, (3,3), (4,3), and (4,4) identified so far, obtained by a modern HRTEM with a post-specimen aberration corrector. In order to unambiguously identify the diameter of such small carbon nanotubes by TEM, the assignment of its chiral index with the relevant image simulation or the nanoprobe diffraction is indispensable. Using AC HRTEM, the atomic structure of the smallest CNTs was faithfully imaged (as a moiré pattern), and therefore the chiral index assignment could be performed. As a result, the diameters of the imaged CNTs were calculated as ~0.41 nm for (3,3), ~0.48 nm for (4,3), and ~0.54 nm for (4,4) configuration.
A great chance for better understanding of the role and behaviour of defects in carbon nanostructures is in situ AC TEM that allows direct observations of dynamic processes and property measurements at the nanoscale [127]. Hashimoto et al. [128] reported in situ HRTEM observations of a defect formation in single graphene layers induced by electron irradiation. Figure 38a shows the observed graphene structure before irradiation. After several tens of seconds of irradiation, a missing row of a zig-zag chain appeared, as shown in Figure 38b. Such a basal plane dislocation in the graphene layer was explained by the existence of a topological defect. The HRTEM simulations based on the relaxed pentagon–heptagon structure showed a blurred area of 1–2 nm around the dislocation core (Figure 2d) that fits well with the experimental image (Figure 38b). The formation of such Stone–Thrower–Wales bond rotation, inducing a deformation of graphene layers, is considered as an important factor for carbon nanotube relaxation under strain [129]. Subsequent HRTEM observations with atomic sensitivity performed by Suenaga et al. [116] directly found pentagon–heptagon pair defects in SWCNTs. By in situ observations they also elucidated the atomistic mechanism of the plastic deformation of SWNTs. It was shown that an accumulation of topological defects occurs near the kink of a deformed nanotube (Figure 39). This result suggests that such active topological defects may indeed be responsible for the plastic deformation of CNTs.
Parallel to TEM, scanning TEM (STEM) is another kind of powerful technique for observing carbon materials on the atomic scale, and nowadays STEM units are often incorporated into conventional TEM setups. The TEM mode uses a stable, parallel electron beam. Therefore, an image of the entire nanostructure is obtained in one shot. This is of great value for in situ studies. In the STEM mode, in turn, the electron beam is strongly focused (the size of the spot- on sample surface is of the order of Å) and scans the surface of the sample. In the STEM imaging different detectors may be used: BF detector, placed in the optical axis of microscope, ADF detector, which registers electron scattered elastically, and high-angle ADF (HAADF) detector, which registers electron scattered elastically, and high-angle annular dark-field (HAADF) detector, which collects electrons that are scattered elastically to higher angles. High-resolution STEM-HAADF images, obtained using a suitable electron optical setup, can be directly interpreted as positions of individual atoms, without the need of image-processing and comparison to computer simulation results, as is the case with HRTEM images. In the previous section, we already presented one example of ADF STEM images revealing the presence of topological defects in non-graphitising carbons (Figure 23). Here, it is also worth mentioning application of STEM for nanocarbons, since it provides an excellent capability of imaging their local atomic structure. Figure 40a presents ADF STEM atomic resolution images of a single graphene layer edge. The possible positions of carbon atoms derived from the local intensity maxima of ADF signals are marked by circles in Figure 40b. A triple-coordinated sp2 carbon atom, a double-coordinated atom, and a single-coordinated atom, illustrated in Figure 40c, are marked with arrows. This spectacular imaging was coupled with electron energy loss spectroscopy (EELS), which is the spectroscopic technique associated with transmission electron microscopes and provides information on bonding states and the electronic structure of atoms. Figure 40d shows K (1s)-edge EELS spectra measured for these three atomic configurations. They exhibit clear differences. It means a discrimination of single-, double-, and triple-coordinated carbon atoms is achievable with the atomic resolution. Electron energy loss spectroscopy is also widely used to study the transformation of the bonding character of carbon atoms during carbonization and graphitization. Methodology of EELS data treatment and analysis can be found in References [130,131].
5. Nanodiamonds and Carbon Nanoonions
Nanodiamonds were synthesised for the first time in 1963 by detonation method from a highly explosive mixture of carbon molecules [133]. Over the decades, TEM and powder XRD and ND have been routinely applied to study the structure of nanodiamonds as well. For example, in 1987 Lewis et al. [134,135] using XRD, TEM imaging, and ED revealed that the famous Allende meteorite contains nanodiamonds. The measured XRD pattern for isolated diamond nanoparticles showed broad, diffuse reflections which matched the positions of Bragg peaks for crystalline diamond. The presence of a diamond structure in this meteorite was confirmed by SAED, and an analysis of TEM images allowed evaluating the average size of the diamond particles to be only 2.6 nm.
There are three main aspects in the structure of diamond nanoparticles to be considered: the overall shape, the core, and the surface. They strongly depended on the synthesis conditions and subsequent purification treatment. Many researchers have demonstrated, using direct TEM imaging, that nanodiamond structure can be described by a core-shell model, in which a central part of the nanoparticle has diamond structure and the atomic arrangement in the outer shell is of graphite-like or amorphous type [136,137,138]. Transmission electron microscopy and HRTEM micrographs of typical nanodiamond particles are shown in Figure 41a,b [139]. The core of these nanodiamonds closely resembles the structure of a diamond, while the surface of the nanoparticles actually resembles the structure of disordered graphite-like carbon.
The core-shell nanodiamond structure was strongly supported by powder diffraction studies. In 1999 Aleksenskii et al. [140] proposed a model describing the structure of diamond nanoclusters, produced by explosive shocks, based on experimental data obtained from XRD and small-angle X-ray scattering. This model postulates that the nanodiamond surface is unstable and considers the diamond nanocluster as a crystalline diamond core coated by an onion-like shell. It has been shown that experimental XRD patterns display (002) reflection from graphite-type structure, beside the (111), (220), and (311) reflections from the cubic diamond-type structure.
In contrast to the structural models of nanodiamonds assuming the presence of disordered graphitic shell, Iakoubowskii et al. [141] showed high-vacuum aberration-corrected electron microscope images of detonation nanodiamond particles which have a well-resolved cubic lattice with negligible fraction of non-diamond structures on the surface. They proposed that the non-diamond shell, commonly detected on nanodiamond particles, could be intrinsic to the specific sample preparation and treatment rather than to the nature of the nanosized diamond itself. Moreover, it has been demonstrated that the disordered carbon structure may appear either due to contamination or electron beam-induced damage. When the studied area was irradiated, after ~1 min of exposure to the electron beam some disordered carbon layers were formed at the particle edges, as can be seen in Figure 42.
The TEM observation of isometric and elongated shape of nanodiamond particles by Iakoubowskii et al. [141] disagreed with the previous postulates that the detonation nanodiamond’s particle shape is spherical [142] or that of a truncated octahedron [143]. The survey on the existing nanodiamond structure indicates that a single model cannot describe all kinds of nanodiamonds manufactured and purified by different methods. We would note in this regard that the powder ND and XRD combined with modelling of the atomic structure may be satisfactorily used to support the TEM observations and describe the structure of nanodiamond particles in terms of their size and core-shell atomic order. Especially, the nature of the most-outer shell may be specified if it is amorphous or graphitic-type. Hawelek et al. [144] used high-energy XRD and molecular dynamic for optimization of models of explosive nanodiamonds. The obtained results showed that the structure of the investigated diamond nanoparticles cannot be satisfactorily described in terms of the model based on the perfect diamond lattice. The core-shell models with an average size of ~2 nm and spherical and truncated octahedron shapes, consisting of the diamond core and the graphite-like shell, accounted very well for the experimental diffraction data in the reciprocal and real spaces in the form of the structure factors and the pair distribution functions. Analysing the surface of the optimized nanodiamond’s models, it was found that graphitic-type fragments appear on the (111)-type surfaces, whereas the atomic arrangement on the (100)-type surfaces remains diamond-like, as can be seen in Figure 43a,b. The higher transformation rate of (111) diamond planes to graphite-like layers was previously suggested by Kuznestov et al. [145] studying transformation of nanodiamonds into onion-like carbon by heat-treatment. The diamond-like core gradually changes into the graphitic-shell via the intermediate part of the distorted diamond-type and the changes may be monitored by analysis of the bond length and valence angle distributions calculated based on the proposed models in the form of Cartesian coordinates of atoms (see Figure 44).
Both TEM and powder XRD and ND tools also provided valuable information on the structure of nanodiamonds treated at elevated temperatures in vacuum. This process was studied in detail by Keznestov et al. [145,146] and Tomita et al. [147,148]. At temperatures around 1500 °C, spherical onion-shaped particles are formed. Heating the samples to around 2000 °C leads to faceted graphitic nanoparticles with hollow cores. A nice interplay between results obtained from TEM and XRD is presented in Figure 45. This figure shows a sequence change in the diffraction patterns of nanodioamonds heat-treated at 1400 °C, 1700 °C, and 2000 °C, arising from sp3 to sp2-type bonding transformation, and the changes correlate well with TEM images. The onions obtained at 1700 °C form concentric-shell particles, which are comprised of about ten shells with an intershell distance of 0.35–0.36 nm, estimated from the position of the first diffraction peak. The large d002 values suggest a considerable reduction in interlayer interaction when compared to perfect graphite. For the sample heated at 2000 °C, diffraction pattern do not exhibit diamond-type reflections and the observed polyhedral onions with facets on their outer part may be considered as pure sp2-type carbon materials.
The concept of “carbon onions” was for the first time used in 1992 by Ugarte [2], who observed nanonion-like multi-layered fullerenes produced by intense bombardment of nanotubes and nanoparticles by electron beam. Further studies showed that they may be also obtained by arc-discharge, electron irradiation, chemical vapour deposition, radio-frequency, microwave plasma, and the already mentioned nanodiamond annealing [149]. Since high-temperature annealing of nanodiamonds is the method that can provide carbon nanoonions with uniform size in a large quantity, the graphitisation process of nanodiamonds has been extensively studied, including molecular dynamic simulations of structural models [150,151] and their verification by experimental powder diffraction data [152,153].
Finally, it is worth mentioning recent achievements of ultra-high-resolution TEM in revealing the structure of nanodiamonds. Many powder XRD and ED reports indicated that diamond nanocrystals are structurally inhomogeneous, consisting of cubic (c-) diamond, plus several poorly characterized sp3-bonded forms, called polymorphs, or polytypes [154,155,156,157,158,159]. Based on those studies it was suggested that the postulated nanodiamond polymorphs cause the appearance of additional diffraction peaks, in addition to c-diamond reflections. The proposed polymorphs could be attractive for a range of applications, but they have never been synthesized in pure form. For example, lonsdaleite-diamond received attention because it was thought to possess superior compressive strength, hardness, and rigidity, compared to c-diamond [160]. However, in 2015, Németh et al. [161] using ultra-HRTEM (0.08 nm point resolution) showed that the diffraction features attributed previously to the various polymorphs are consistent with c-diamond containing abundant defects. The interpretation of the microscopic images strongly suggested that the reported nanodiamond polymorphs are in fact twinned c-diamond, while combinations of (113) reflection and <011> rotation twins produce HRTEM images and -spacings that match those attributed to the postulated diamond polymorphic forms. It is a good example showing how the local TEM probe may re-evaluate the structural features obtained by the global powder XRD or ND probes and lead to a rethinking of carbon structure.
6. Conclusions
The widespread use of carbon materials requires continuous improvement of their synthesis and processing. Understanding of their properties and controlling of quality is impossible without an elucidation of their structure. In this review article, we have collated structural information obtained by the powerful TEM technique and XRD and ND methods for several industrially important “old” and “new” carbon materials, such as carbon black, glass-like carbon, carbon nanotubes, graphene, nanodiamonds, and nanoonions. Both kinds of the considered techniques have advantages and limitations. With powder XRD or ND, a sample consisting of a large number of particles with all possible orientations with respect to incident beam direction is probed and a global, statistical characterization of the material can be obtained. However, these methods do not provide direct information about individual elements building the structure. On the other hand, it has been shown that very tiny structures (of the order of nm or even single atoms) may be examined individually using TEM. However, this method does not guarantee that the limited amount of sample under probe is representative for the whole produced material. There is no single technique available today that can probe all structural features on different length-scales. We highlighted that TEM and powder XRD or ND provide complementary structural data and combining them is required for complex structures that cannot be solved by either method alone. We showed examples of what type of structural information may be derived from the experimental observations using both kinds of techniques and how they may be included in computer modelling of structure. The use of both TEM and powder XRD or ND simultaneously allows correlation of local and global structural information and verification of the structural models proposed based on results from only one method. We provided a number of examples which show how local TEM studies had inspected the shortcomings in the structure determination by the global powder diffraction experiments. Transmission electron microscopy imaging revealed that graphite-like domains in carbon black particles are arranged concentrically around the core, while first structural models of carbon black constructed based on powder XRD studies had assumed a random orientation of the graphite-like domains. Transmission electron microscopy method demonstrated the presence of fullerene-like elements and topological defects in the structure of non-graphitising carbons, while powder XRD and ND was initially unable to determine the curvature and origin of disorder in graphene-like layers. The atomic-resolved HRTEM revised the presence of various polymorphic forms in nanodiamonds postulated based on powder diffraction studies and suggested that those forms may have in fact a twinned cubic diamond structure. Furthermore, HRTEM has become useful for in situ observations of dynamic processes even for single atoms or point defects in carbon nanostructures, while powder XRD and ND methods are not applicable for structure manipulations on single atoms or nano-objects. Nevertheless, powder XRD and ND combined with computer modelling of the atomic structure was showed to be highly valuable for global quantitative characterization of structural features such as phase composition, size of coherent scattering domains, interlayer distances, or number of defects. This allows comparison of the same type of carbon materials but produced by different methods. To conclude, it is worth mentioning that both TEM and powder XRD and ND techniques, as well as the approaches to their analysis, are still developing and we may expect they will contribute to further progress in solving various carbon structures of high complexity.
Author Contributions
Conceptualization, K.J.; Writing-Original Draft Preparation, K.J.; M.P.; Editing, K.J.; A.B.; Visualization, K.J.; Supervision, A.B.
Funding
This research was funded by National Science Center (Narodowe Centrum Nauki) grant number 2015/19/N/ST3/01037.
Acknowledgments
K.J. is thankful for the financial support from the National Science Centre (Narodowe Centrum Nauki) grant no. 2015/19/N/ST3/01037.
Conflicts of Interest
The authors declare no conflict of interest.
References
- Iijima, S. Helical microtubules of graphitic carbon. Nature 1991, 354, 56–58. [Google Scholar] [CrossRef]
- Ugarte, D. Curling and closure of graphitic networks under electron-beam irradiation. Nature 1992, 359, 707–709. [Google Scholar] [CrossRef] [PubMed]
- Krishnan, A.; Dujardin, E.; Treacy, M.M.J.; Hugdahl, J.; Lynum, S.; Ebbesen, T.W. Graphitic cones and the nucleation of curved carbon surfaces. Nature 1997, 388, 451–454. [Google Scholar] [CrossRef]
- Iijima, S.; Yudasaka, M.; Yamada, R.; Bandow, S.; Suenaga, K.; Kokai, F.; Takahashi, K. Nano-aggregates of single-walled graphitic carbon nano-horns. Chem. Phys. Lett. 1999, 309, 165–170. [Google Scholar] [CrossRef]
- Hofmann, U.; Höper, W. Über die “aktiven Stellen” bei der Katalyse. Naturwissenschaften 1944, 32, 225–226. [Google Scholar] [CrossRef]
- Evans, T.; Phaal, C. Imperfections in type I and type II diamonds. Proc. R. Soc. A Math. Phys. Eng. Sci. 1962, 270, 538–552. [Google Scholar] [CrossRef]
- Harris, P.J.F. Fullerene-related structure of commercial glassy carbons. Philos. Mag. 2004, 84, 3159–3167. [Google Scholar] [CrossRef] [Green Version]
- Harris, P.J.F. Fullerene-like models for microporous carbon. J. Mater. Sci. 2013, 48, 565–577. [Google Scholar] [CrossRef]
- Helveg, S.; López-Cartes, C.; Sehested, J.; Hansen, P.L.; Clausen, B.S.; Rostrup-Nielsen, J.R.; Abild-Pedersen, F.; Nørskov, J.K. Atomic-scale imaging of carbon nanofibre growth. Nature 2004, 427, 426–429. [Google Scholar] [CrossRef]
- Tang, D.-M.; Zhang, L.-L.; Liu, C.; Yin, L.-C.; Hou, P.-X.; Jiang, H.; Zhu, Z.; Li, F.; Liu, B.; Kauppinen, E.I.; et al. Heteroepitaxial Growth of Single-Walled Carbon Nanotubes from Boron Nitride. Sci. Rep. 2012, 2, 971. [Google Scholar] [CrossRef]
- Yang, W.; Mao, S.; Yang, J.; Shang, T.; Song, H.; Mabon, J.; Swiech, W.; Vance, J.R.; Yue, Z.; Dillon, S.J.; et al. Large-deformation and high-strength amorphous porous carbon nanospheres. Sci. Rep. 2016, 6, 24187. [Google Scholar] [CrossRef] [PubMed]
- Zoberbier, T.; Chamberlain, T.W.; Biskupek, J.; Kuganathan, N.; Eyhusen, S.; Bichoutskaia, E.; Kaiser, U.; Khlobystov, A.N. Interactions and reactions of transition metal clusters with the interior of single-walled carbon nanotubes imaged at the atomic scale. J. Am. Chem. Soc. 2012, 134, 3073–3079. [Google Scholar] [CrossRef] [PubMed]
- Kotakoski, J.; Meyer, J.C.; Kurasch, S.; Santos-Cottin, D.; Kaiser, U.; Krasheninnikov, A.V. Stone-Wales-type transformations in carbon nanostructures driven by electron irradiation. Phys. Rev. B Condens. Matter Mater. Phys. 2011, 83, 245420. [Google Scholar] [CrossRef]
- Bragg, W.H.; Bragg, W.L. The structure of the diamond. Nature 1913, 91, 557. [Google Scholar] [CrossRef]
- Debye, P.; Scherrer, P. Über die Konstitution von Graphit und amorpher Kohle. Phys. Z. 1917, 18, 291–301. [Google Scholar] [CrossRef]
- Warren, B.E. X-ray diffraction study of carbon black. J. Chem. Phys. 1934, 2, 551–555. [Google Scholar] [CrossRef]
- Houska, C.R.; Warren, B.E. X-ray study of the graphitization of carbon black. J. Appl. Phys. 1954, 25, 1503–1509. [Google Scholar] [CrossRef]
- Warren, B.E. X-ray diffraction in random layer lattices. Phys. Rev. 1941, 59, 693–698. [Google Scholar] [CrossRef]
- Biscoe, J.; Warren, B.E. An x-ray study of carbon black. J. Appl. Phys. 1942, 13, 364–371. [Google Scholar] [CrossRef]
- Franklin, R.E. The structure of graphitic carbons. Acta Crystallogr. 1951, 4, 253–261. [Google Scholar] [CrossRef] [Green Version]
- Franklin, R.E. Crystallite growth in graphitizing and non-graphitizing carbons. Proc. R. Soc. A Math. Phys. Eng. Sci. 1951, 209, 196–218. [Google Scholar] [CrossRef]
- Billinge, S.J.L.; Kanatzidis, M.G. Beyond crystallography: The study of disorder, nanocrystallinity and crystallographically challenged materials with pair distribution functions. Chem. Commun. 2004, 4, 749–760. [Google Scholar] [CrossRef]
- Burian, A.; Dore, J.C.; Fischer, H.E.; Sloan, J. Structural studies of multiwall carbon nanotubes by neutron diffraction. Phys. Rev. B 1999, 59, 1665–1668. [Google Scholar] [CrossRef]
- Woznica, N.; Hawelek, L.; Fischer, H.E.; Bobrinetskiy, I.; Burian, A. The atomic scale structure of graphene powder studied by neutron and X-ray diffraction. J. Appl. Crystallogr. 2015, 48, 1429–1436. [Google Scholar] [CrossRef]
- Hawelek, L.; Brodka, A.; Dore, J.C.; Honkimäki, V.; Burian, A. Fullerene-like structure of activated carbons. Diam. Relat. Mater. 2008, 17, 1633–1638. [Google Scholar] [CrossRef]
- Jurkiewicz, K.; Duber, S.; Fischer, H.E.; Burian, A. Modelling of glass-like carbon structure and its experimental verification by neutron and X-ray diffraction. J. Appl. Crystallogr. 2017, 50, 36–48. [Google Scholar] [CrossRef]
- Trendelenburg, F. Ein Verfahren zur Untersuchung feinkristalliner pulverförmiger Stoffe mittels Elektronenbeugung. Naturwissenschaften 1932, 20, 655–656. [Google Scholar] [CrossRef]
- Mukherjee, P.C. Streuung von Röntgenstrahlen durch Kohlenstoff. Z. Phys. 1934, 88, 247–250. [Google Scholar] [CrossRef]
- Zhou, Z.; Bouwman, W.G.; Schut, H.; Pappas, C. Interpretation of X-ray diffraction patterns of (nuclear) graphite. Carbon 2014, 69, 17–24. [Google Scholar] [CrossRef]
- HaweŁek, L.; KoŁoczek, J.; Bródka, A.; Dore, J.C.; Honkimäki, V.; Burian, A. Structural studies of disordered carbons by high-energy X-ray diffraction. Philos. Mag. 2007, 87, 4973–4986. [Google Scholar] [CrossRef]
- Jurkiewicz, K.; Duber, S.; Burian, A. Paracrystalline structure of glass-like carbons. Int. J. Appl. Glass Sci. 2016, 7, 355–363. [Google Scholar] [CrossRef]
- Marsh, P.A.; Voet, A.; Mullens, T.J.; Price, L.D. Quantitative micrography of carbon black microstructure. Carbon 1971, 9, 797–805. [Google Scholar] [CrossRef]
- Watson, J.H. Filmless sample mounting for the electron microscope. J. Appl. Phys. 1946, 17, 121–127. [Google Scholar] [CrossRef]
- Hall, C.E. Dark-field electron microscopy. I. Studies of crystalline substances in dark-field. J. Appl. Phys. 1948, 19, 198–212. [Google Scholar] [CrossRef]
- Hall, C.E. Dark-field electron microscopy: II. Studies of colloidal carbon. J. Appl. Phys. 1948, 19, 271–277. [Google Scholar] [CrossRef]
- Heidenreich, R.D.; Hess, W.M.; Ban, L.L. A test object and criteria for high resolution electron microscopy. J. Appl. Crystallogr. 1968, 1, 1–19. [Google Scholar] [CrossRef] [Green Version]
- Oberlin, A. Application of dark-field electron microscopy to carbon study. Carbon 1979, 17, 7–20. [Google Scholar] [CrossRef]
- Donnet, J.B.; Bouland, J.C. Etude de l’oxydation a l’air de divers noirs de carbone. Carbon 1966, 4, 201–208. [Google Scholar] [CrossRef]
- Donnet, J.B. Carbon Black: Science and Technology, 2nd ed.; CRC Press: New York, NY, USA, 1993; ISBN 978-0-82-478975-6. [Google Scholar]
- Rouzaud, J.N. The multiscale organization as a fingerprint of the formation conditions of carbons; a TEM study. In Proceedings of the CARBON’04, Providence, RI, USA, 11–16 July 2004. [Google Scholar]
- Brasil, A.M.; Farias, T.L.; Carvalho, M.G. A recipe for image characterization of fractal-like aggregates. J. Aerosol Sci. 1999, 30, 1379–1389. [Google Scholar] [CrossRef]
- Spence, J.C.H. High-Resolution Electron Microscopy; OUP: Oxford, UK, 2010; Volume 9780199552, ISBN 978-0-19-170866-4. [Google Scholar]
- Oberlin, A.; Terriere, G. Graphitization studies of anthracites by high resolution electron microscopy. Carbon 1975, 13, 367–376. [Google Scholar] [CrossRef]
- Oberlin, A. Carbonization and graphitization. Carbon 1984, 22, 521–541. [Google Scholar] [CrossRef]
- Rouzaud, J.N.; Oberlin, A. Structure, microtexture, and optical properties of anthracene and saccharose-based carbons. Carbon 1989, 27, 517–529. [Google Scholar] [CrossRef]
- Pawlyta, M.; Rouzaud, J.-N.; Duber, S. Raman microspectroscopy characterization of carbon blacks: Spectral analysis and structural information. Carbon 2015, 84, 479–490. [Google Scholar] [CrossRef]
- Pawlyta, M. Nanostrukturalne Materiały Węglowe Jako Nośnik Nanocząstek Katalitycznych; (Nanostructural carbon materials as a support for catalytic nanoparticles); Wydawnictwo Politechniki Śląskiej: Gliwice, Poland, 2017. [Google Scholar]
- Kroto, H.W.; Heath, J.R.; O’Brien, S.C.; Curl, R.F.; Smalley, R.E. C60: Buckminsterfullerene. Nature 1985, 318, 162–163. [Google Scholar] [CrossRef]
- Zhang, Q.L.; O’Brien, S.C.; Heath, J.R.; Liu, Y.; Curl, R.F.; Kroto, H.W.; Smalley, R.E. Reactivity of large carbon clusters: Spheroidal carbon shells and their possible relevance to the formation and morphology of soot. J. Phys. Chem. 1986, 90, 525–528. [Google Scholar] [CrossRef]
- Kroto, H.W.; McKay, K. The formation of quasi-icosahedral spiral shell carbon particles. Nature 1988, 331, 328–331. [Google Scholar] [CrossRef]
- Ebert, L.B. The icospiral model of combustion soot. Carbon 1993, 31, 239–240. [Google Scholar] [CrossRef]
- Gerhardt, P.; Löffler, S.; Homann, K.H. Polyhedral carbon ions in hydrocarbon flames. Chem. Phys. Lett. 1987, 137, 306–310. [Google Scholar] [CrossRef]
- Harris, P.J.F. Structure of non-graphitising carbons. Int. Mater. Rev. 1997, 42, 206–218. [Google Scholar] [CrossRef] [Green Version]
- Apicella, B.; Pré, P.; Alfè, M.; Ciajolo, A.; Gargiulo, V.; Russo, C.; Tregrossi, A.; Deldique, D.; Rouzaud, J.N. Soot nanostructure evolution in premixed flames by High Resolution Electron Transmission Microscopy (HRTEM). Proc. Combust. Inst. 2015, 35, 1895–1902. [Google Scholar] [CrossRef]
- Buseck, P.R.; Adachi, K.; Gelencsér, A.; Tompa, É.; Pósfai, M. Ns-Soot: A material-based term for strongly light-absorbing carbonaceous particles. Aerosol Sci. Technol. 2014, 48, 777–788. [Google Scholar] [CrossRef]
- McDonald-Wharry, J.S.; Manley-Harris, M.; Pickering, K.L. Reviewing, Combining, and Updating the Models for the Nanostructure of Non-Graphitizing Carbons Produced from Oxygen-Containing Precursors. Energy Fuels 2016, 30, 7811–7826. [Google Scholar] [CrossRef]
- Ergun, S.; Tiensuu, V. Tetrahedral structures in amorphous carbons. Acta Crystallogr. 1959, 12, 1050–1051. [Google Scholar] [CrossRef] [Green Version]
- Noda, T.; Inagaki, M.; Yamada, S. A Comment on the Structure of Glassy Carbon. Bull. Chem. Soc. Jpn. 1968, 41, 3023–3024. [Google Scholar] [CrossRef] [Green Version]
- Mildner, D.F.R.; Carpenter, J.M. On the short range atomic structure of non-crystalline carbon. J. Non-Cryst. Solids 1982, 47, 391–402. [Google Scholar] [CrossRef]
- De Tomas, C.; Suarez-Martinez, I.; Vallejos-Burgos, F.; López, M.J.; Kaneko, K.; Marks, N.A. Structural prediction of graphitization and porosity in carbide-derived carbons. Carbon 2017, 119, 1–9. [Google Scholar] [CrossRef] [Green Version]
- Perret, R.; Ruland, W. Profile analysis of random-layer lines. J. Appl. Crystallogr. 1968, 1, 257–262. [Google Scholar] [CrossRef] [Green Version]
- Ergun, S.; Gifford, T.J. Analysis of the 00l reflections of carbons. J. Appl. Crystallogr. 1968, 1, 313–317. [Google Scholar] [CrossRef]
- Ergun, S. X-ray scattering by very defective lattices. Phys. Rev. B 1970, 1, 3371–3380. [Google Scholar] [CrossRef]
- Ergun, S. Calculation of profiles of two-dimensional X-ray reflections from layered structures. J. Appl. Crystallogr. 1970, 3, 153–156. [Google Scholar] [CrossRef]
- Warren, B.E.; Bodenstein, P. The diffraction pattern of fine particle carbon blacks. Acta Crystallogr. 1965, 18, 282–286. [Google Scholar] [CrossRef] [Green Version]
- Warren, B.E.; Bodenstein, P. The shape of two-dimensional carbon black reflections. Acta Crystallogr. 1966, 20, 602–605. [Google Scholar] [CrossRef] [Green Version]
- Mildner, D.F.R.; Carpenter, J.M. Neutron diffraction and inelastic scattering studies of a glassy carbon. In Proceedings of the 5th International Conference on Amorphous and Liquid Semiconductors, Garmisch-Partenkirchen, Germany, 3–8 September 1973. [Google Scholar]
- Ergun, S.; Schehl, R.R. Analysis of the structure of a glassy carbon using the Fourier transform technique. Carbon 1973, 11, 127–138. [Google Scholar] [CrossRef]
- Burian, A.; Ratuszna, A.; Dore, J.C.; Howells, S.W. Radial distribution function analysis of the structure of activated carbons. Carbon 1998, 36, 1613–1621. [Google Scholar] [CrossRef]
- Szczygielska, A.; Burian, A.; Dore, J.C. Paracrystalline structure of activated carbons. J. Phys. Condens. Matter 2001, 13, 5545. [Google Scholar] [CrossRef]
- Szczygielska, A.; Burian, A.; Duber, S.; Dore, J.C.; Honkimaki, V. Radial distribution function analysis of the graphitization process in carbon materials. J. Alloys Compd. 2001, 328, 231–236. [Google Scholar] [CrossRef]
- Diamond, R. X-ray diffraction data for large aromatic molecules. Acta Crystallogr. 1957, 10, 359–364. [Google Scholar] [CrossRef] [Green Version]
- Short, M.A.; Walker, P.L. Measurement of interlayer spacings and crystal sizes in turbostratic carbons. Carbon 1963, 1, 3–9. [Google Scholar] [CrossRef]
- Yoshizawa, N.; Yamada, Y.; Shiraishi, M. TEM lattice images and their evaluation by image analysis for activated carbons with disordered microtexture. J. Mater. Sci. 1998, 33, 199–206. [Google Scholar] [CrossRef]
- Aso, H.; Matsuoka, K.; Sharma, A.; Tomita, A. Evaluation of size of graphene sheet in anthracite by a temperature-programmed oxidation method. Energy Fuels 2004, 18, 1309–1314. [Google Scholar] [CrossRef]
- Zhao, J.; Yang, L.; Li, F.; Yu, R.; Jin, C. Structural evolution in the graphitization process of activated carbon by high-pressure sintering. Carbon 2009, 47, 744–751. [Google Scholar] [CrossRef]
- Weisbecker, P.; Leyssale, J.-M.; Fischer, H.E.; Honkimäki, V.; Lalanne, M.; Vignoles, G.L. Microstructure of pyrocarbons from pair distribution function analysis using neutron diffraction. Carbon 2012, 50, 1563–1573. [Google Scholar] [CrossRef]
- Sharma, A.; Kyotani, T.; Tomita, A. Comparison of structural parameters of PF carbon from XRD and HRTEM techniques. Carbon 2000, 38, 1977–1984. [Google Scholar] [CrossRef]
- Scherrer, P. Bestimmung der Grösse und der inneren Struktur von Kolloidteilchen mittels Röntgenstrahlen. Nachrichten von der Gesellschaft der Wissenschaften zu Göttingen, Math. Klasse 1918, 2, 98–100. [Google Scholar] [CrossRef]
- Jenkins, G.M.; Kawamura, K. Structure of glassy carbon. Nature 1971, 231, 175–176. [Google Scholar] [CrossRef] [PubMed]
- Harris, P.J.F.; Liu, Z.; Suenaga, K. Imaging the atomic structure of activated carbon. J. Phys. Condens. Matter 2008, 20, 362201. [Google Scholar] [CrossRef] [Green Version]
- Gogotsi, Y.; Libera, J.A.; Kalashnikov, N.; Yoshimura, M. Graphite polyhedral crystals. Science 2000, 290, 317–320. [Google Scholar] [CrossRef]
- Petkov, V.; DiFrancesco, R.G.; Billinge, S.J.L.; Acharya, M.; Foley, H.C. Local structure of nanoporous carbons. Philos. Mag. B 1999, 79, 1519–1530. [Google Scholar] [CrossRef]
- Opletal, G.; Petersen, T.C.; McCulloch, D.G.; Snook, I.K.; Yarovsky, I. The structure of disordered carbon solids studied using a hybrid reverse Monte Carlo algorithm. J. Phys. Condens. Matter 2005, 17, 2605–2616. [Google Scholar] [CrossRef]
- Smith, M.A.; Foley, H.C.; Lobo, R.F. A simple model describes the PDF of a non-graphitizing carbon. Carbon 2004, 42, 2041–2048. [Google Scholar] [CrossRef]
- Zetterström, P.; Urbonaite, S.; Lindberg, F.; Delaplane, R.G.; Leis, J.; Svensson, G. Reverse Monte Carlo studies of nanoporous carbon from TiC. J. Phys. Condens. Matter 2005, 17, 3509–3524. [Google Scholar] [CrossRef]
- Hawelek, L.; Brodka, A.; Dore, J.C.; Honkimaki, V.; Burian, A. The atomic scale structure of CXV carbon: Wide-angle x-ray scattering and modeling studies. J. Phys. Condens. Matter 2013, 25, 454203. [Google Scholar] [CrossRef] [PubMed]
- Woznica, N.; Hawelek, L.; Duber, S.; Fischer, H.E.; Honkimäki, V.; Pawlyta, M.; Bulou, A.; Burian, A. The atomic scale structure of saccharose-based carbons. Philos. Mag. 2017, 97, 1675–1697. [Google Scholar] [CrossRef]
- Jurkiewicz, K.; Hawełek, Ł.; Balin, K.; Szade, J.; Braghiroli, F.L.; Fierro, V.; Celzard, A.; Burian, A. Conversion of Natural Tannin to Hydrothermal and Graphene-Like Carbons Studied by Wide-Angle X-ray Scattering. J. Phys. Chem. A 2015, 119, 8692–8701. [Google Scholar] [CrossRef] [PubMed]
- Bhatia, S.K. Characterizing structural complexity in disordered carbons: From the slit pore to atomistic models. Langmuir 2017, 33, 831–847. [Google Scholar] [CrossRef]
- O’Malley, B.; Snook, I.; McCulloch, D. Reverse Monte Carlo analysis of the structure of glassy carbon using electron-microscopy data. Phys. Rev. B 1998, 57, 14148–14157. [Google Scholar] [CrossRef]
- Guo, J.; Morris, J.R.; Ihm, Y.; Contescu, C.I.; Gallego, N.C.; Duscher, G.; Pennycook, S.J.; Chisholm, M.F. Topological defects: Origin of nanopores and enhanced adsorption performance in nanoporous carbon. Small 2012, 8, 3283–3288. [Google Scholar] [CrossRef]
- Jurkiewicz, K.; Pawlyta, M.; Zygadło, D.; Chrobak, D.; Duber, S.; Wrzalik, R.; Ratuszna, A.; Burian, A. Evolution of glassy carbon under heat treatment: Correlation structure–mechanical properties. J. Mater. Sci. 2018, 53, 3509–3523. [Google Scholar] [CrossRef]
- Somani, P.R.; Umeno, M. Importance of transmission electron microscopy for carbon nanomaterials research. Mod. Res. Educ. Top. Microsc. 2007, 3, 634–642. [Google Scholar] [CrossRef]
- Lambin, P.; Loiseau, A.; Culot, C.; Biró, L.P. Structure of carbon nanotubes probed by local and global probes. Carbon 2002, 40, 1635–1648. [Google Scholar] [CrossRef]
- Verheijen, M.A.; Meekes, H.; Meijer, G.; Bennema, P.; de Boer, J.L.; van Smaalen, S.; van Tendeloo, G.; Amelinckx, S.; Muto, S.; van Landuyt, J. The structure of different phases of pure C70 crystals. Chem. Phys. 1992, 166, 287–297. [Google Scholar] [CrossRef] [Green Version]
- Amelinckx, S.; Lucas, A.; Lambin, P. Electron diffraction and microscopy of nanotubes. Rep. Prog. Phys. 1999, 62, 1471–1524. [Google Scholar] [CrossRef]
- Pham, P.V. A Library of Doped-Graphene Images via Transmission Electron Microscopy. C 2018, 4, 34. [Google Scholar] [CrossRef]
- Harris, P. Transmission electron microscopy of carbon: A brief history. C 2018, 4, 4. [Google Scholar] [CrossRef]
- Oberlin, A.; Endo, M.; Koyama, T. Filamentous growth of carbon through benzene decomposition. J. Cryst. Growth 1976, 32, 335–349. [Google Scholar] [CrossRef]
- Iijima, S.; Ichihashi, T. Single-shell carbon nanotubes of 1-nm diameter. Nature 1993, 363, 603–605. [Google Scholar] [CrossRef]
- Saito, R.; Dresselhaus, G.; Dresselahus, M. Physical Properties of Carbon Nanotubes; Imperial College: London, UK, 1998; ISBN 1860940935. [Google Scholar]
- Allen, C.S.; Zhang, C.; Burnell, G.; Brown, A.P.; Robertson, J.; Hickey, B.J. A review of methods for the accurate determination of the chiral indices of carbon nanotubes from electron diffraction patterns. Carbon 2011, 49, 4961–4971. [Google Scholar] [CrossRef]
- Novoselov, K.S.; Geim, A.K.; Morozov, S.V.; Jiang, D.; Zhang, Y.; Dubonos, S.V.; Grigorieva, I.V.; Firsov, A.A. Electric field effect in atomically thin carbon films. Science 2004, 306, 666–669. [Google Scholar] [CrossRef] [PubMed]
- Zhang, J.; Xiao, J.; Meng, X.; Monroe, C.; Huang, Y.; Zuo, J.M. Free folding of suspended graphene sheets by random mechanical stimulation. Phys. Rev. Lett. 2010, 104, 166805. [Google Scholar] [CrossRef]
- Kociak, M.; Suenaga, K.; Hirahara, K.; Saito, Y.; Nakahira, T.; Iijima, S. Linking chiral indices and transport properties of double-walled carbon nanotubes. Phys. Rev. Lett. 2002, 89, 155501/1–155501/4. [Google Scholar] [CrossRef] [PubMed]
- Reznik, D.; Olk, C.H.; Neumann, D.A.; Copley, J.R.D. X-ray powder diffraction from carbon nanotubes and nanoparticles. Phys. Rev. B 1995, 52, 116–124. [Google Scholar] [CrossRef]
- Anglaret, E.; Rols, S.; Sauvajol, J.L. Comment on “effect of the growth temperature on the diameter distribution and chirality of single-wall carbon nanotubes”. Phys. Rev. Lett. 1998, 81, 4780. [Google Scholar] [CrossRef]
- Koloczek, J.; Kwon, Y.-K.; Burian, A. Characterization of spatial correlations in carbon nanotubes-modelling studies. J. Alloys Compd. 2001, 328, 222–225. [Google Scholar] [CrossRef]
- Mitsuyama, R.; Tadera, S.; Kyakuno, H.; Suzuki, R.; Ishii, H.; Nakai, Y.; Miyata, Y.; Yanagi, K.; Kataura, H.; Maniwa, Y. Chirality fingerprinting and geometrical determination of single-walled carbon nanotubes: Analysis of fine structure of X-ray diffraction pattern. Carbon 2014, 75, 299–306. [Google Scholar] [CrossRef] [Green Version]
- White, C.T.; Todorov, T.N. Carbon nanotubes as long ballistic conductors. Nature 1998, 393, 240–241. [Google Scholar] [CrossRef]
- Huang, J.Y.; Chen, S.; Jo, S.H.; Wang, Z.; Han, D.X.; Chen, G.; Dresselhaus, M.S.; Ren, Z.F. Atomic-scale imaging of wall-by-wall breakdown and concurrent transport measurements in multiwall carbon nanotubes. Phys. Rev. Lett. 2005, 94, 236802. [Google Scholar] [CrossRef]
- Charlier, J.; Ebbesen, T. Structural and electronic properties of pentagon-heptagon pair defects in carbon nanotubes. Phys. Rev. B Condens. Matter Mater. Phys. 1996, 53, 11108–11113. [Google Scholar] [CrossRef]
- Urita, K.; Suenaga, K.; Sugai, T.; Shinohara, H.; Iijima, S. In situ observation of thermal relaxation of interstitial-vacancy pair defects in a graphite gap. Phys. Rev. Lett. 2005, 94, 155502. [Google Scholar] [CrossRef]
- Muto, S.; Tanabe, T. Damage process in electron-irradiated graphite studied by transmission electron microscopy. I. high-resolution observation of highly graphitized carbon fibre. Philos. Mag. A Phys. Condens. Matter Struct. Defects Mech. Prop. 1997, 76, 679–690. [Google Scholar] [CrossRef]
- Suenaga, K.; Wakabayashi, H.; Koshino, M.; Sato, Y.; Urita, K.; Iijima, S. Imaging active topological defects in carbon nanotubes. Nat. Nanotechnol. 2007, 2, 358–360. [Google Scholar] [CrossRef]
- Smith, B.W.; Luzzi, D.E. Electron irradiation effects in single wall carbon nanotubes. J. Appl. Phys. 2001, 90, 3509–3515. [Google Scholar] [CrossRef]
- Brodka, A.; Koloczek, J.; Burian, A.; Dore, J.C.; Hannon, A.C.; Fonseca, A. Molecular dynamics simulation of carbon nanotube structure. J. Mol. Struct. 2006, 792, 78–81. [Google Scholar] [CrossRef]
- Hawelek, L.; Koloczek, J.; Brodka, A.; Dore, J.C.; Hönkimaki, V.; Ando, Y.; Burian, A. Wide-angle X-ray scattering as a quality test for carbon nanotubes. Diam. Relat. Mater. 2012, 29, 18–22. [Google Scholar] [CrossRef]
- Hawelek, L.; Kolano-Burian, A.; Szade, J.; Maziarz, W.; Woznica, N.; Burian, A. The atomic scale structure of nanographene platelets studied by X-ray diffraction, high-resolution transmission electron microscopy and molecular dynamics. Diam. Relat. Mater. 2013, 35, 40–46. [Google Scholar] [CrossRef]
- Sofer, Z.; Šimek, P.; Jankovský, O.; Sedmidubský, D.; Beran, P.; Pumera, M. Neutron diffraction as a precise and reliable method for obtaining structural properties of bulk quantities of graphene. Nanoscale 2014, 6, 13082–13089. [Google Scholar] [CrossRef] [Green Version]
- Bonal, J.P.; Thiele, B.; Tsotridis, G.; Wu, C.H. Neutron induced dimensional changes in carbon materials at high temperatures and high damage doses. J. Nucl. Mater. 1994, 212–215, 1218–1222. [Google Scholar] [CrossRef]
- Burchell, T.D.; Snead, L.L. The effect of neutron irradiation damage on the properties of grade NBG-10 graphite. J. Nucl. Mater. 2007, 371, 18–27. [Google Scholar] [CrossRef]
- Medvedev, N.; Tkachenko, V.; Lipp, V.; Li, Z.; Ziaja, B. Various damage mechanisms in carbon and silicon materials under femtosecond x-ray irradiation. 4open 2018, 1. [Google Scholar] [CrossRef]
- Guan, L.; Suenaga, K.; Iijima, S. Smallest carbon nanotube assigned with atomic resolution accuracy. Nano Lett. 2008, 8, 459–462. [Google Scholar] [CrossRef]
- Liu, Z.; Suenaga, K.; Harris, P.J.F.; Iijima, S. Open and closed edges of graphene layers. Phys. Rev. Lett. 2009, 102, 15501. [Google Scholar] [CrossRef]
- Wang, Z.L. New developments in transmission electron microscopy for nanotechnology. Adv. Mater. 2003, 15, 1497–1514. [Google Scholar] [CrossRef]
- Hashimoto, A.; Suenaga, K.; Gloter, A.; Urita, K.; Iijima, S. Direct evidence for atomic defects in graphene layers. Nature 2004, 430, 870–873. [Google Scholar] [CrossRef] [PubMed]
- Yakobson, B.I.; Samsonidze, G.; Samsonidze, G.G. Atomistic theory of mechanical relaxation in fullerene nanotubes. Carbon 2000, 38, 1675–1680. [Google Scholar] [CrossRef]
- Daniels, H.; Brydson, R.; Rand, B.; Brown, A. Investigating carbonization and graphitization using electron energy loss spectroscopy (EELS) in the transmission electron microscope (TEM). Philos. Mag. 2007, 87, 4073–4092. [Google Scholar] [CrossRef]
- Zhang, Z.; Brydson, R.; Aslam, Z.; Reddy, S.; Brown, A.; Westwood, A.; Rand, B. Investigating the structure of non-graphitising carbons using electron energy loss spectroscopy in the transmission electron microscope. Carbon 2011, 49, 5049–5063. [Google Scholar] [CrossRef]
- Suenaga, K.; Koshino, M. Atom-by-atom spectroscopy at graphene edge. Nature 2010, 468, 1088–1090. [Google Scholar] [CrossRef] [PubMed]
- Danilenko, V.V. On the history of the discovery of nanodiamond synthesis. Phys. Solid State 2004, 46, 595–599. [Google Scholar] [CrossRef]
- Lewis, R.S.; Ming, T.; Wacker, J.F.; Anders, E.; Steel, E. Interstellar diamonds in meteorites. Nature 1987, 326, 160–162. [Google Scholar] [CrossRef]
- Lewis, R.S.; Anders, E.; Draine, B.T. Properties, detectability and origin of interstellar diamonds in meteorites. Nature 1989, 339, 117–121. [Google Scholar] [CrossRef]
- Mykhaylyk, O.O.; Solonin, Y.M.; Batchelder, D.N.; Brydson, R. Transformation of nanodiamond into carbon onions: A comparative study by high-resolution transmission electron microscopy, electron energy-loss spectroscopy, x-ray diffraction, small-angle x-ray scattering, and ultraviolet Raman spectroscopy. J. Appl. Phys. 2005, 97, 74302. [Google Scholar] [CrossRef]
- Baidakova, M.; Vul’, A. New prospects and frontiers of nanodiamond clusters. J. Phys. D Appl. Phys. 2007, 40, 6300–6311. [Google Scholar] [CrossRef]
- Dolmatov, V.Y. Detonation-synthesis nanodiamonds: Synthesis, structure, properties and applications. Russ. Chem. Rev. 2007, 76, 339–360. [Google Scholar] [CrossRef]
- Pawlyta, M. Transmission electron microscope studies on carbon nanostructured materials. Arch. Mater. Sci. Eng. 2013, 63, 58–67. [Google Scholar]
- Aleksenskii, A.E.; Baidakova, M.V.; Vul’, A.Y.; Siklitski, V.I. The Structure of diamond nanoclusters. Phys. Solid State 1999, 41, 277–291. [Google Scholar] [CrossRef]
- Iakoubovskii, K.; Mitsuishi, K.; Furuya, K. High-resolution electron microscopy of detonation nanodiamond. Nanotechnology 2008, 19, 155705. [Google Scholar] [CrossRef] [PubMed]
- Chen, Q.; Yun, S. Nano-sized diamond obtained from explosive detonation and its application. Mater. Res. Bull. 2000, 35, 1915–1919. [Google Scholar] [CrossRef]
- Osawa, E. Recent progress and perspectives in single-digit nanodiamond. Diam. Relat. Mater. 2007, 16, 2018–2022. [Google Scholar] [CrossRef]
- Hawelek, L.; Brodka, A.; Dore, J.C.; Honkimaki, V.; Tomita, S.; Burian, A. Structural studies of nanodiamond by high-energy X-ray diffraction. Diam. Relat. Mater. 2008, 17, 1186–1193. [Google Scholar] [CrossRef]
- Kuznetsov, V.L.; Chuvilin, A.L.; Butenko, Y.V.; Mal’kov, I.Y.; Titov, V.M. Onion-like carbon from ultra-disperse diamond. Chem. Phys. Lett. 1994, 222, 343–348. [Google Scholar] [CrossRef]
- Kuznetsov, V.L.; Chuvilin, A.L.; Butenko, Y.V.; Stankus, S.V.; Khairulin, R.A.; Gutakovskii, A.K. Closed curved graphite-like structures formation on micron-size diamond. Chem. Phys. Lett. 1998, 289, 353–360. [Google Scholar] [CrossRef]
- Tomita, S.; Fujii, M.; Hayashi, S.; Yamamoto, K. Electron energy-loss spectroscopy of carbon onions. Chem. Phys. Lett. 1999, 305, 225–229. [Google Scholar] [CrossRef]
- Tomita, S.; Burian, A.; Dore, J.C.; LeBolloch, D.; Fujii, M.; Hayashi, S. Diamond nanoparticles to carbon onions transformation: X-ray diffraction studies. Carbon 2002, 40, 1469–1474. [Google Scholar] [CrossRef]
- Xu, B. Prospects and research progress in nano onion-like fullerenes. New Carbon Mater. 2008, 23, 289–301. [Google Scholar] [CrossRef]
- Seifert, G.; Hermann, H. Concentric-shell fullerenes and diamond particles: A molecular-dynamics study. Phys. Rev. B Condens. Matter Mater. Phys. 1999, 60, 10711–10714. [Google Scholar] [CrossRef]
- Bródka, A.; Zerda, T.W.; Burian, A. Graphitization of small diamond cluster—Molecular dynamics simulation. Diam. Relat. Mater. 2006, 15, 1818–1821. [Google Scholar] [CrossRef]
- Bródka, A.; Hawełek, Ł.; Burian, A.; Tomita, S.; Honkimäki, V. Molecular dynamics study of structure and graphitization process of nanodiamonds. J. Mol. Struct. 2008, 887, 34–40. [Google Scholar] [CrossRef]
- Hawelek, L.; Brodka, A.; Tomita, S.; Dore, J.C.; Honkimäki, V.; Burian, A. Transformation of nano-diamonds to carbon nano-onions studied by X-ray diffraction and molecular dynamics. Diam. Relat. Mater. 2011, 20, 1333–1339. [Google Scholar] [CrossRef]
- Bhargava, S.; Bist, H.D.; Sahli, S.; Aslam, M.; Tripathi, H.B. Diamond polytypes in the chemical vapor deposited diamond films. Appl. Phys. Lett. 1995, 67, 1706. [Google Scholar] [CrossRef]
- Wen, B.; Zhao, J.J.; Li, T.J. Synthesis and crystal structure of n-diamond. Int. Mater. Rev. 2007, 52, 131–151. [Google Scholar] [CrossRef]
- Peng, J.L.; Orwa, J.O.; Jiang, B.; Prawer, S.; Bursill, L.A. Nano-crystals of c-diamond, n-diamond and i-carbon grown in carbon-ion implanted fused quartz. Int. J. Mod. Phys. B 2001, 15, 3107–3123. [Google Scholar] [CrossRef]
- Hedberg, K.; Hedberg, L.; Bethune, D.S.; Brown, C.A.; Dorn, H.C.; Johnson, R.D.; DE Vries, M. Bond lengths in free molecules of buckminsterfullerene, c60, from gas-phase electron diffraction. Science 1991, 254, 410–412. [Google Scholar] [CrossRef]
- Bucknum, M.J.; Castro, E.A. On the n-diamond and i-carbon nanocrystalline forms. J. Math. Chem. 2012, 50, 1034–1038. [Google Scholar] [CrossRef]
- Kumar, A.; Ann Lin, P.; Xue, A.; Hao, B.; Khin Yap, Y.; Sankaran, R.M. Formation of nanodiamonds at near-ambient conditions via microplasma dissociation of ethanol vapour. Nat. Commun. 2013, 4, 2618. [Google Scholar] [CrossRef] [PubMed] [Green Version]
- Pan, Z.; Sun, H.; Zhang, Y.; Chen, C. Harder than diamond: Superior indentation strength of wurtzite BN and lonsdaleite. Phys. Rev. Lett. 2009, 102, 55503. [Google Scholar] [CrossRef]
- Németh, P.; Garvie, L.; Aoki, T.; Dubrovinskaia, N.; Dubrovinsky, L.; Buseck, P.R. Lonsdaleite is faulted and twinned cubic diamond and does not exist as a discrete material. Nat. Commun. 2014, 5, 5447. [Google Scholar] [CrossRef] [PubMed] [Green Version]
Figure 1.
(a) X-ray diffraction (XRD) patterns of unheated Spheron Grade 6 carbon black (top), the same carbon black heated for 2 h at 2000 °C (middle), and graphite (bottom). (b) A first model of the carbon black structure assuming turbostratic disorder of graphite layers. Reproduced with permission from Biscoe and Warren [19]. Copyright AIP Publishing, 1942.

Figure 2.
(a) XRD patterns of unheated Spheron Grade 6 carbon black (upper part) of the same sample heated for 2 h at 1500 °C (middle part), and heated for 2 h at 2800 °C (bottom part), (b) Evolution of dimensions, La and Lc, of parallel layer groups for Spheron Grade 6 black heat-treated at various temperatures. Reproduced with permission from Biscoe and Warren [19]. Copyright AIP Publishing, 1942.

Figure 3.
Historical TEM images obtained for carbon black. (a) Unheated and (b) heat-treated at 3000 °C thermal carbon black consisting of individual nanospherules. Figures reprinted with permission from Hofmann and Höper [5]. Copyright (1944) Springer Nature. (c) Unheated channel carbon black (Spheron grade 6) consisting of aggregates. Reproduced with permission from Hall [5]. Copyright AIP Publishing, 1948.
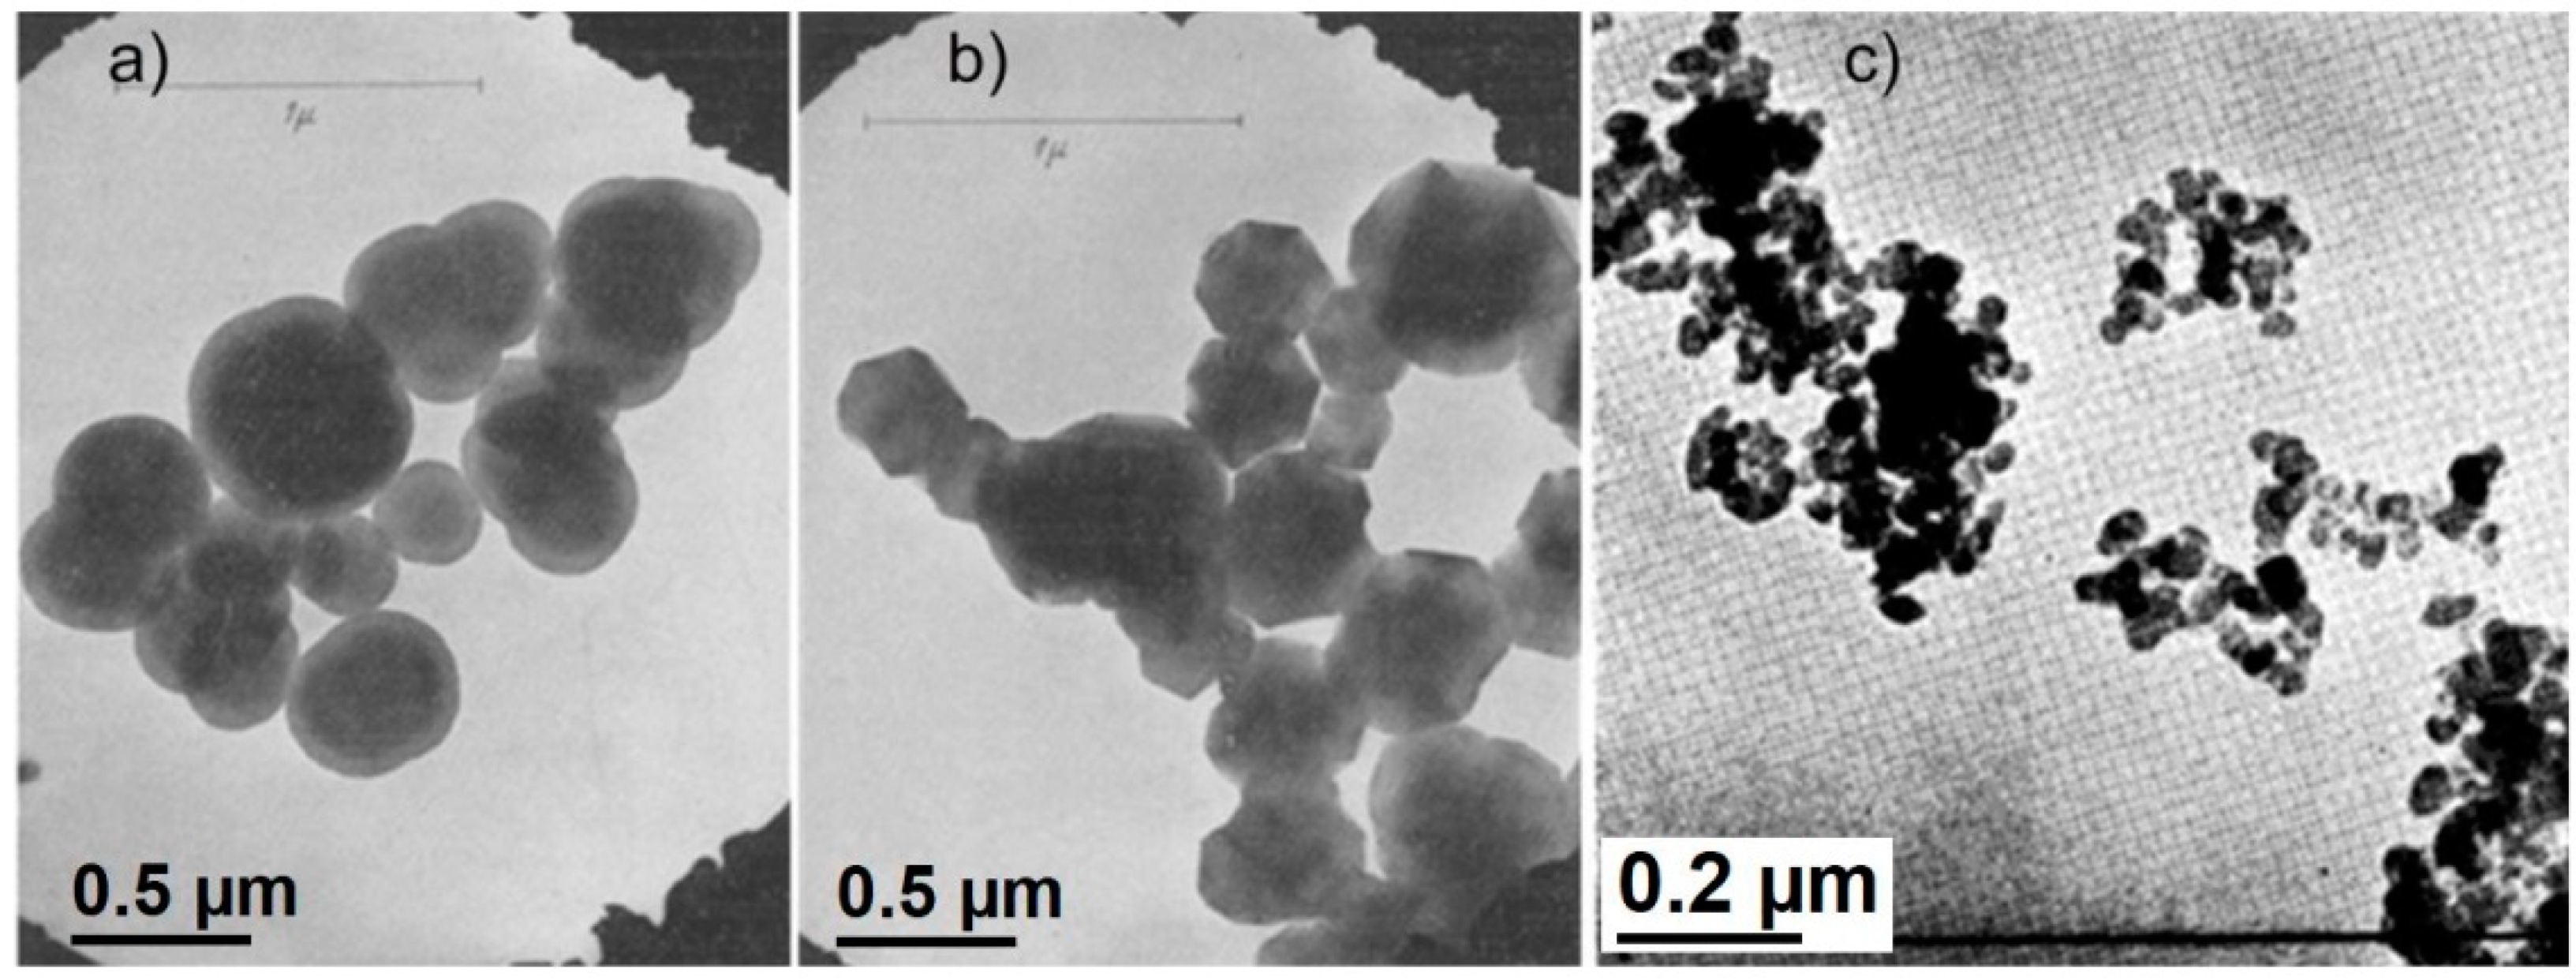
Figure 4.
TEM image of hollow particles of carbon black after thermal oxidation. Reproduced with permission from Reference [39] Copyright Marcel Dekker, 1993.
Figure 4.
TEM image of hollow particles of carbon black after thermal oxidation. Reproduced with permission from Reference [39] Copyright Marcel Dekker, 1993.

Figure 5.
Multiscale structure of carbon black. (a) Model of a primary carbon black aggregate. Reproduced with permission from Brasil et al. [41]. Copyright AIP Publishing, 1999. (b) Model of a carbon black particle showing the arrangement of the turbostratic domains. (c) Model of a carbon black turbostratic domain. Reproduced with permission from Heidenreich et al. [36]. Copyright International Union of Crystallography, 1968.
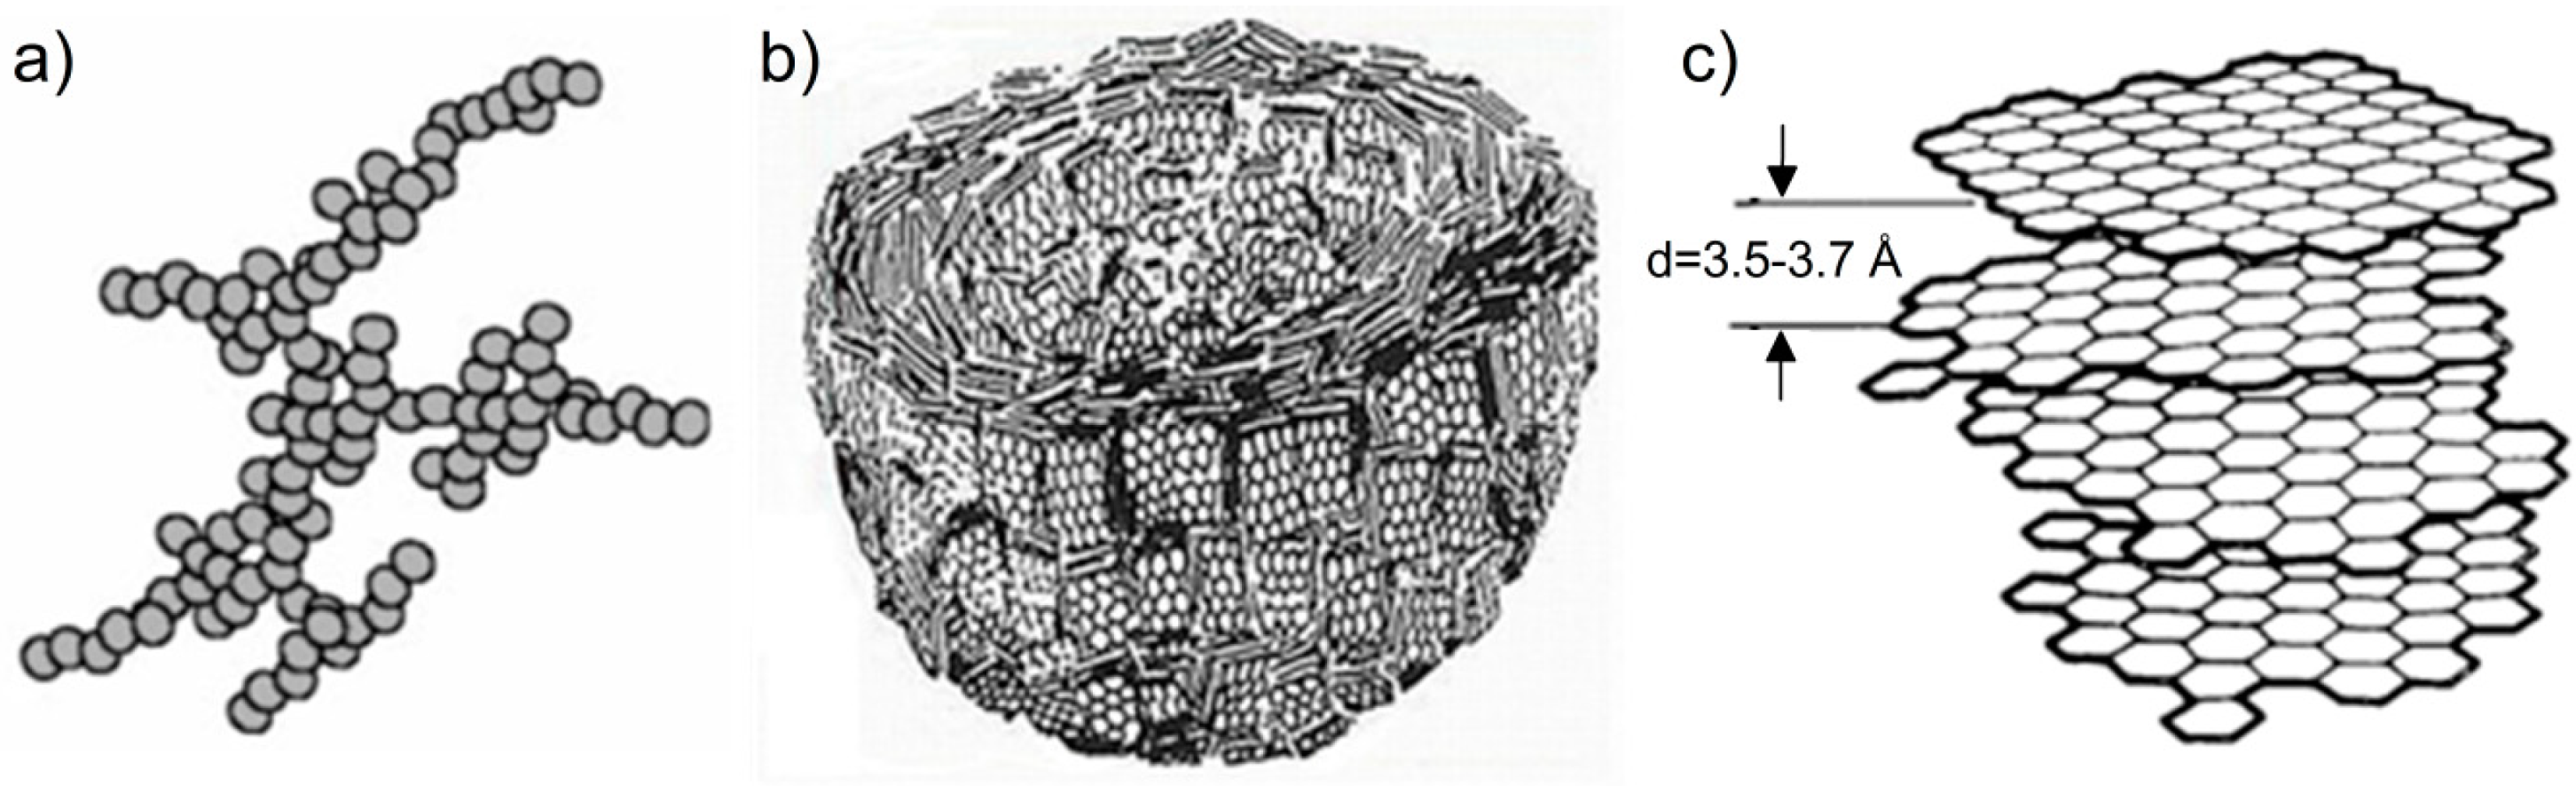
Figure 6.
(a) Early TEM image of carbon black graphitised at 2600 °C. (b) Heidenreich’s model of a graphitised carbon particle. Reproduced with permission from Heidenreich et al. [36]. Copyright John Wiley and Sons, 1968.
Figure 6.
(a) Early TEM image of carbon black graphitised at 2600 °C. (b) Heidenreich’s model of a graphitised carbon particle. Reproduced with permission from Heidenreich et al. [36]. Copyright John Wiley and Sons, 1968.

Figure 7.
Comparison of XRD patterns for Printex 25 carbon black and the same carbon black heat-treated at 2600 °C. Reproduced with permission from Pawlyta et al. [46]. Copyright Elsevier, 2015.
Figure 7.
Comparison of XRD patterns for Printex 25 carbon black and the same carbon black heat-treated at 2600 °C. Reproduced with permission from Pawlyta et al. [46]. Copyright Elsevier, 2015.

Figure 8.
Comparison of the morphology and nanostructure of two carbon black grades. (A) Aggregate, (B) primary particle of unheated, and (C) heat-treated at 2600 °C Printex 25 carbon black; (D–F) FW200 carbon black, respectively. Reproduced with permission from Pawlyta et al. [46]. Copyright Elsevier, 2015.
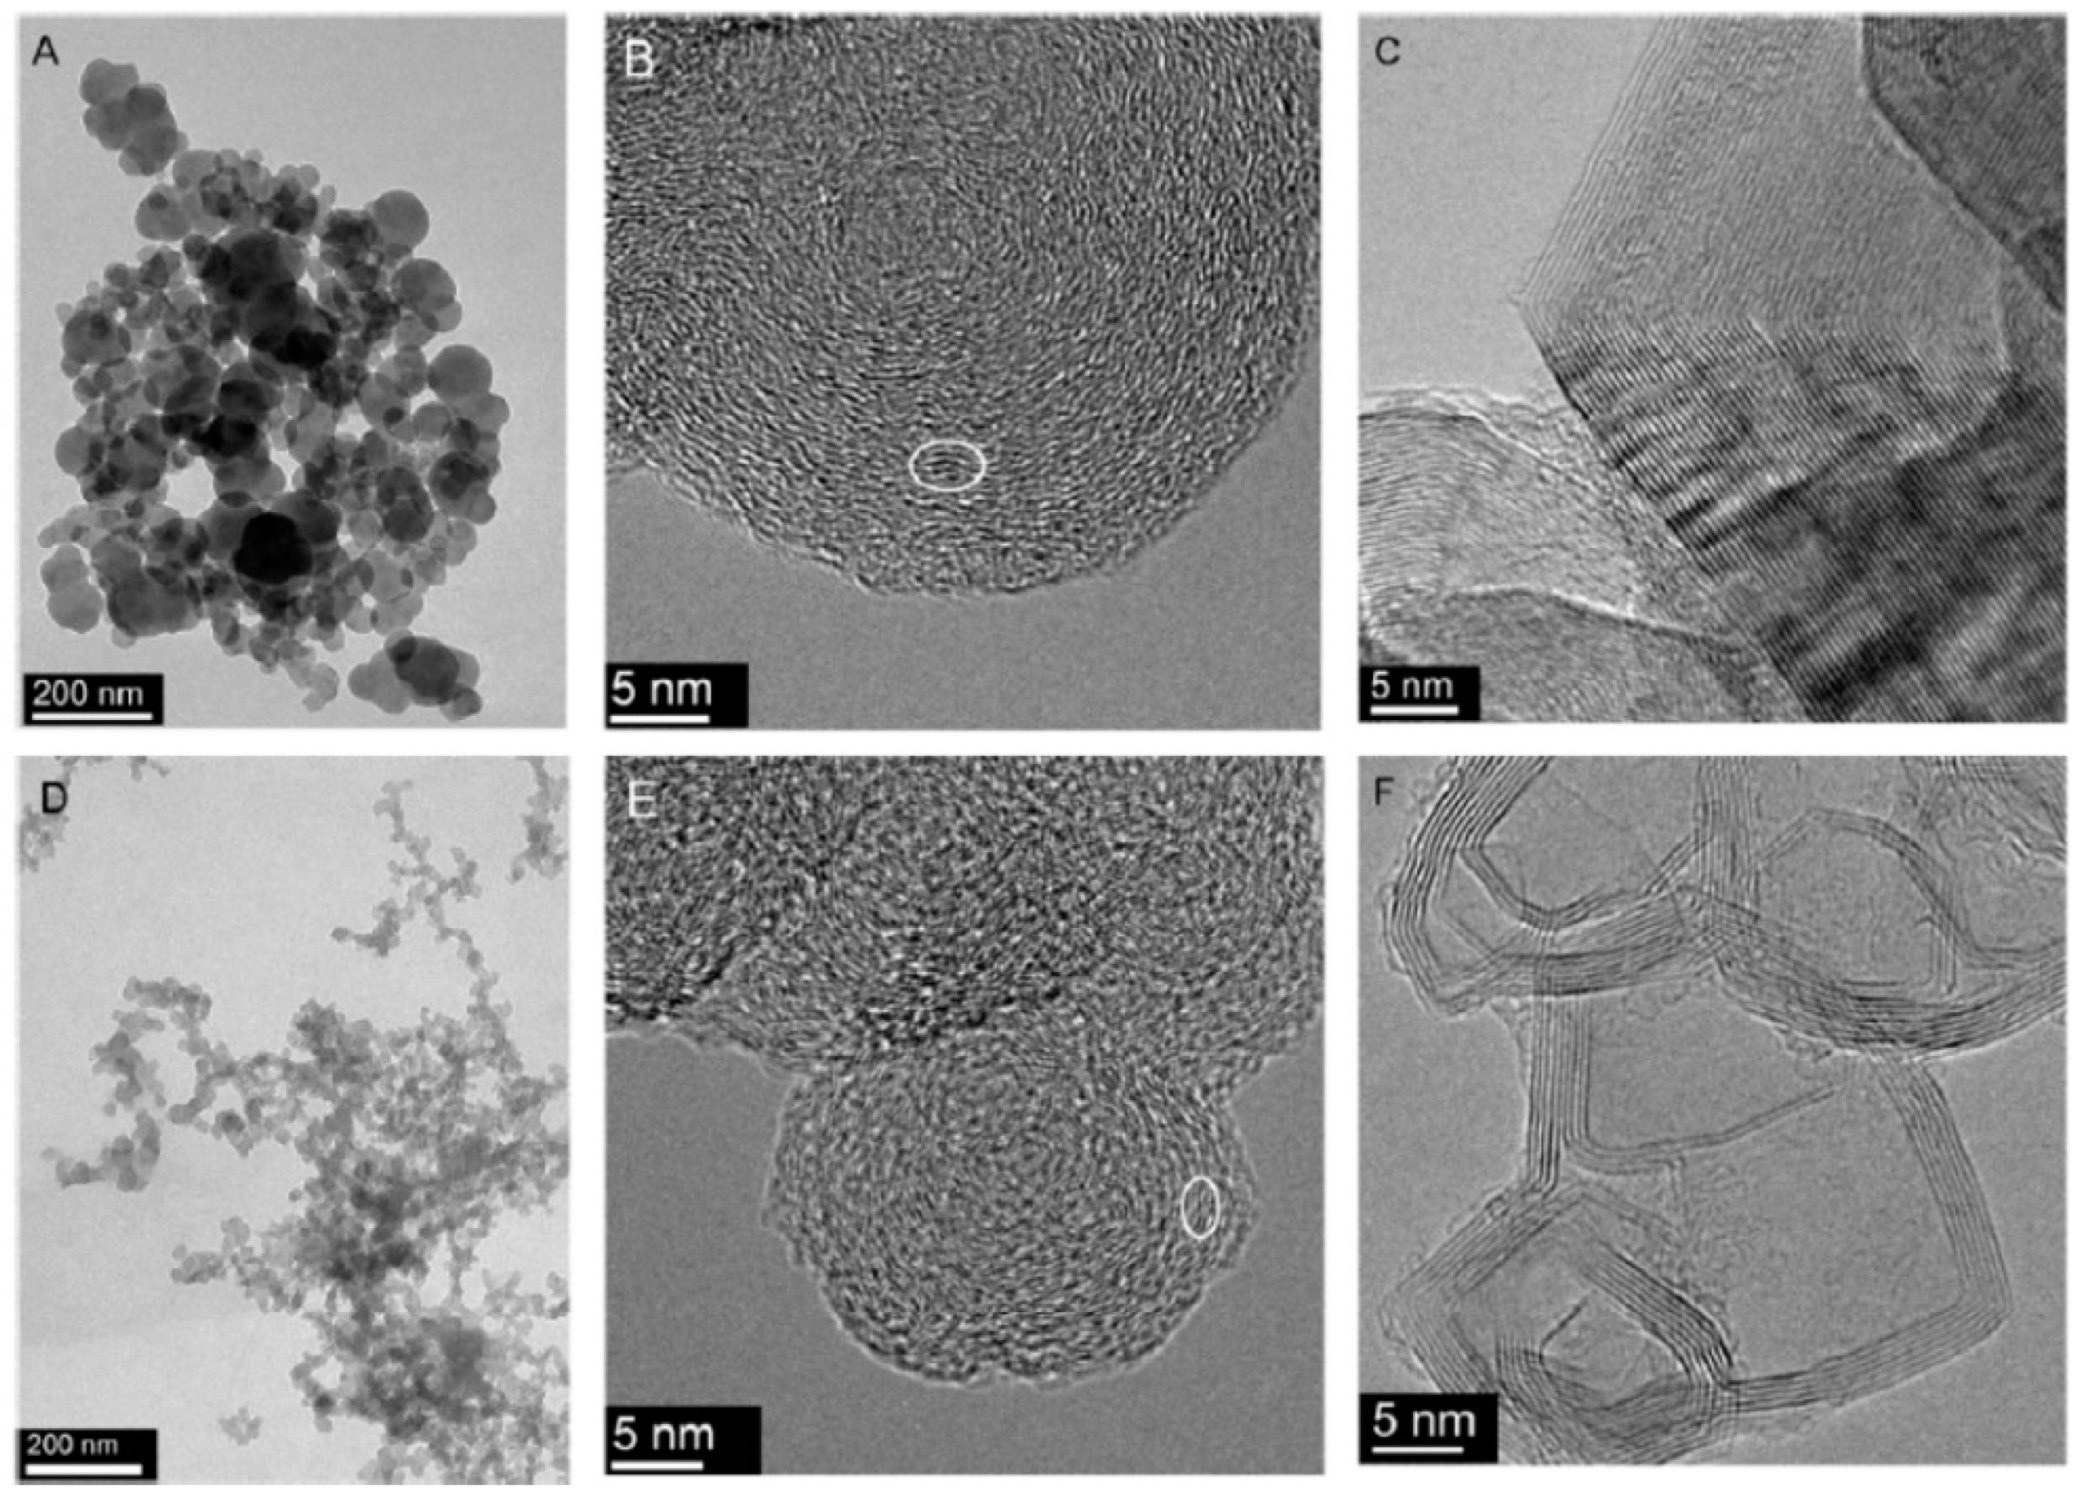
Figure 9.
(a) Comparison of FW20 carbon black structure before and (b) after heat-treatment at 1000 °C, (c) 1700 °C, and (d) at 2600 °C. Reproduced with permission from Pawlyta et al. [47]. Copyright Wydawnictwo Politechniki Śląskiej, 2017.
Figure 9.
(a) Comparison of FW20 carbon black structure before and (b) after heat-treatment at 1000 °C, (c) 1700 °C, and (d) at 2600 °C. Reproduced with permission from Pawlyta et al. [47]. Copyright Wydawnictwo Politechniki Śląskiej, 2017.
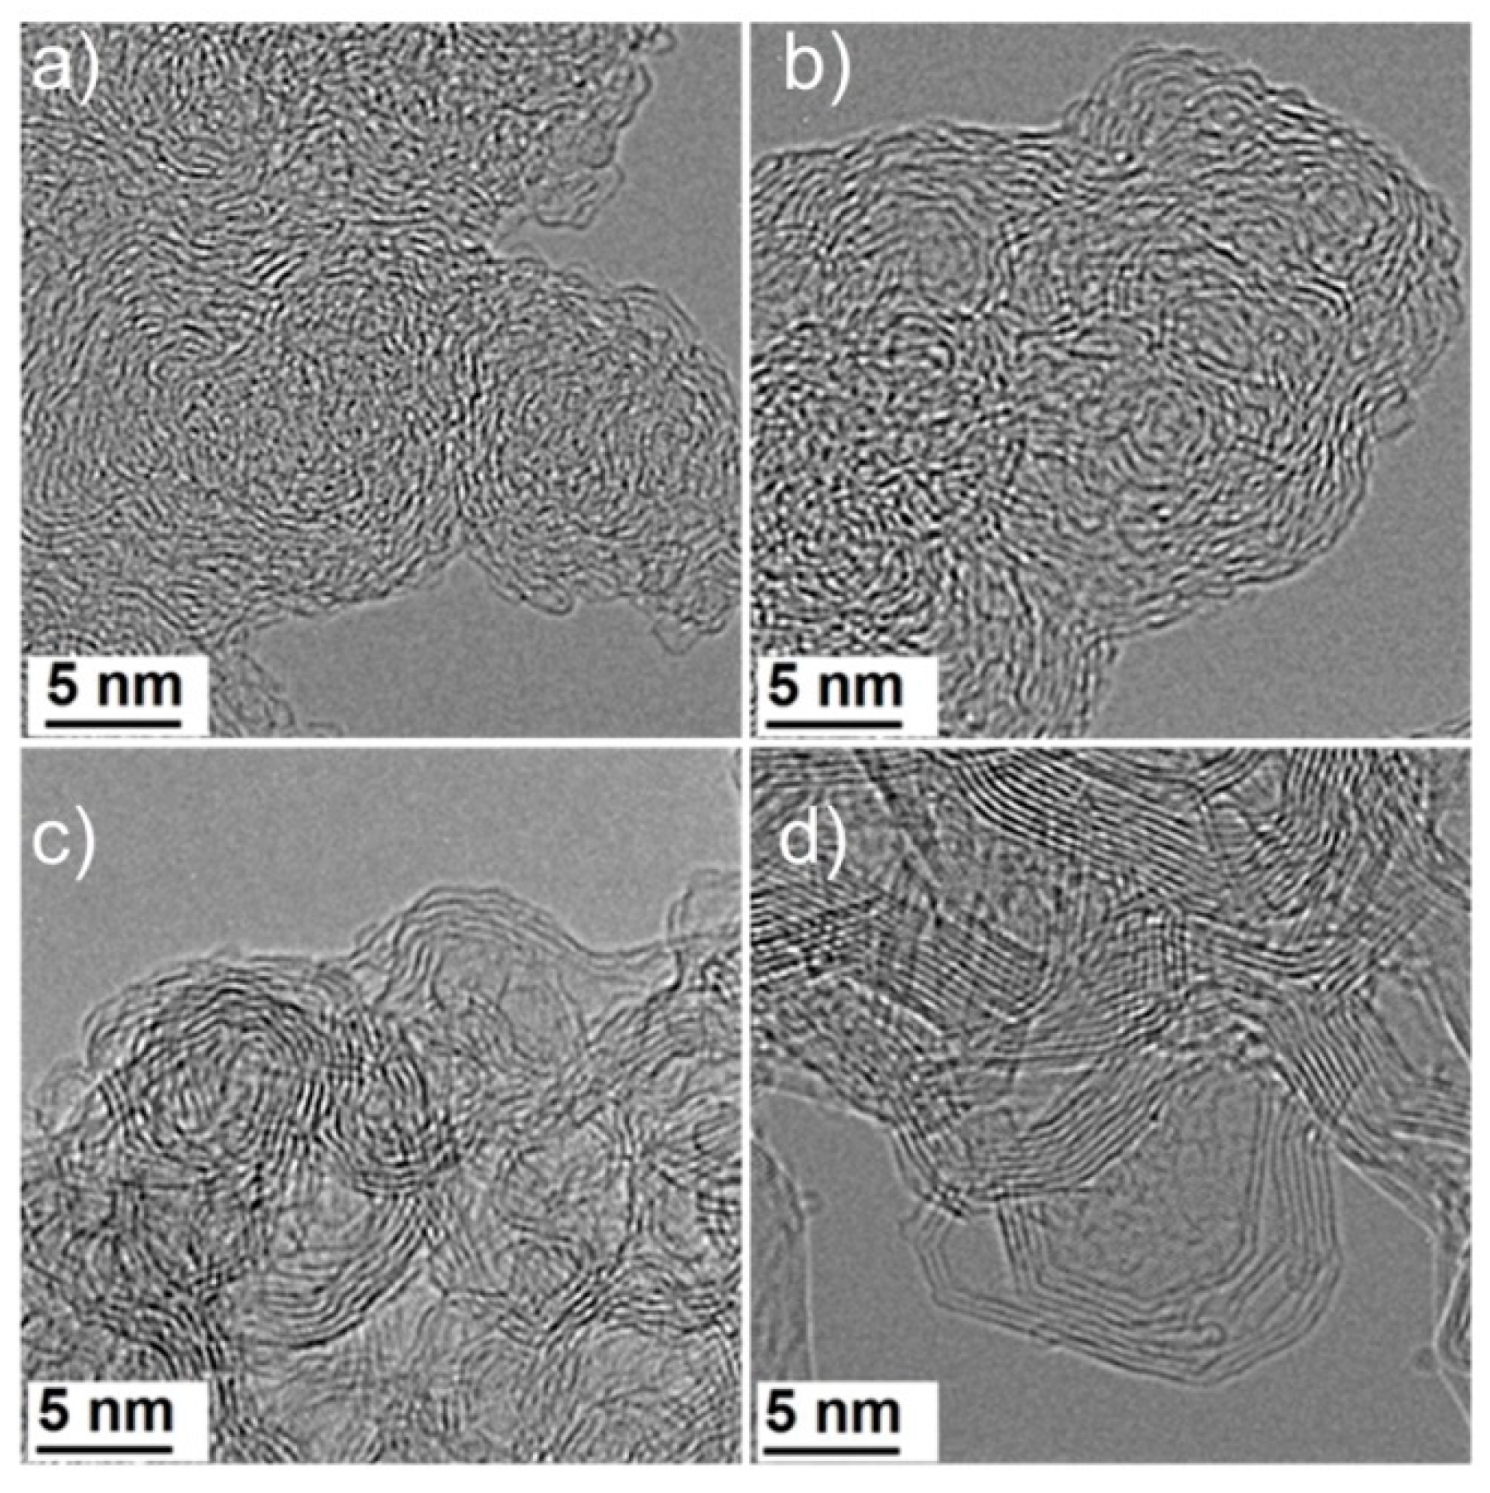
Figure 10.
Quantitative analysis of carbon layers distribution in soot. (a) HRTEM image of mature benzene soot. (b) The skeletonized image by Analyze Plan. (c) Morphological analysis. (d) Magnification of the part of the analysed HRTEM image (14 nm × 14 nm) with enhanced contrast of carbon layers. Reproduced with permission from Apicella et al. [54]. Copyright Elsevier, 2015.
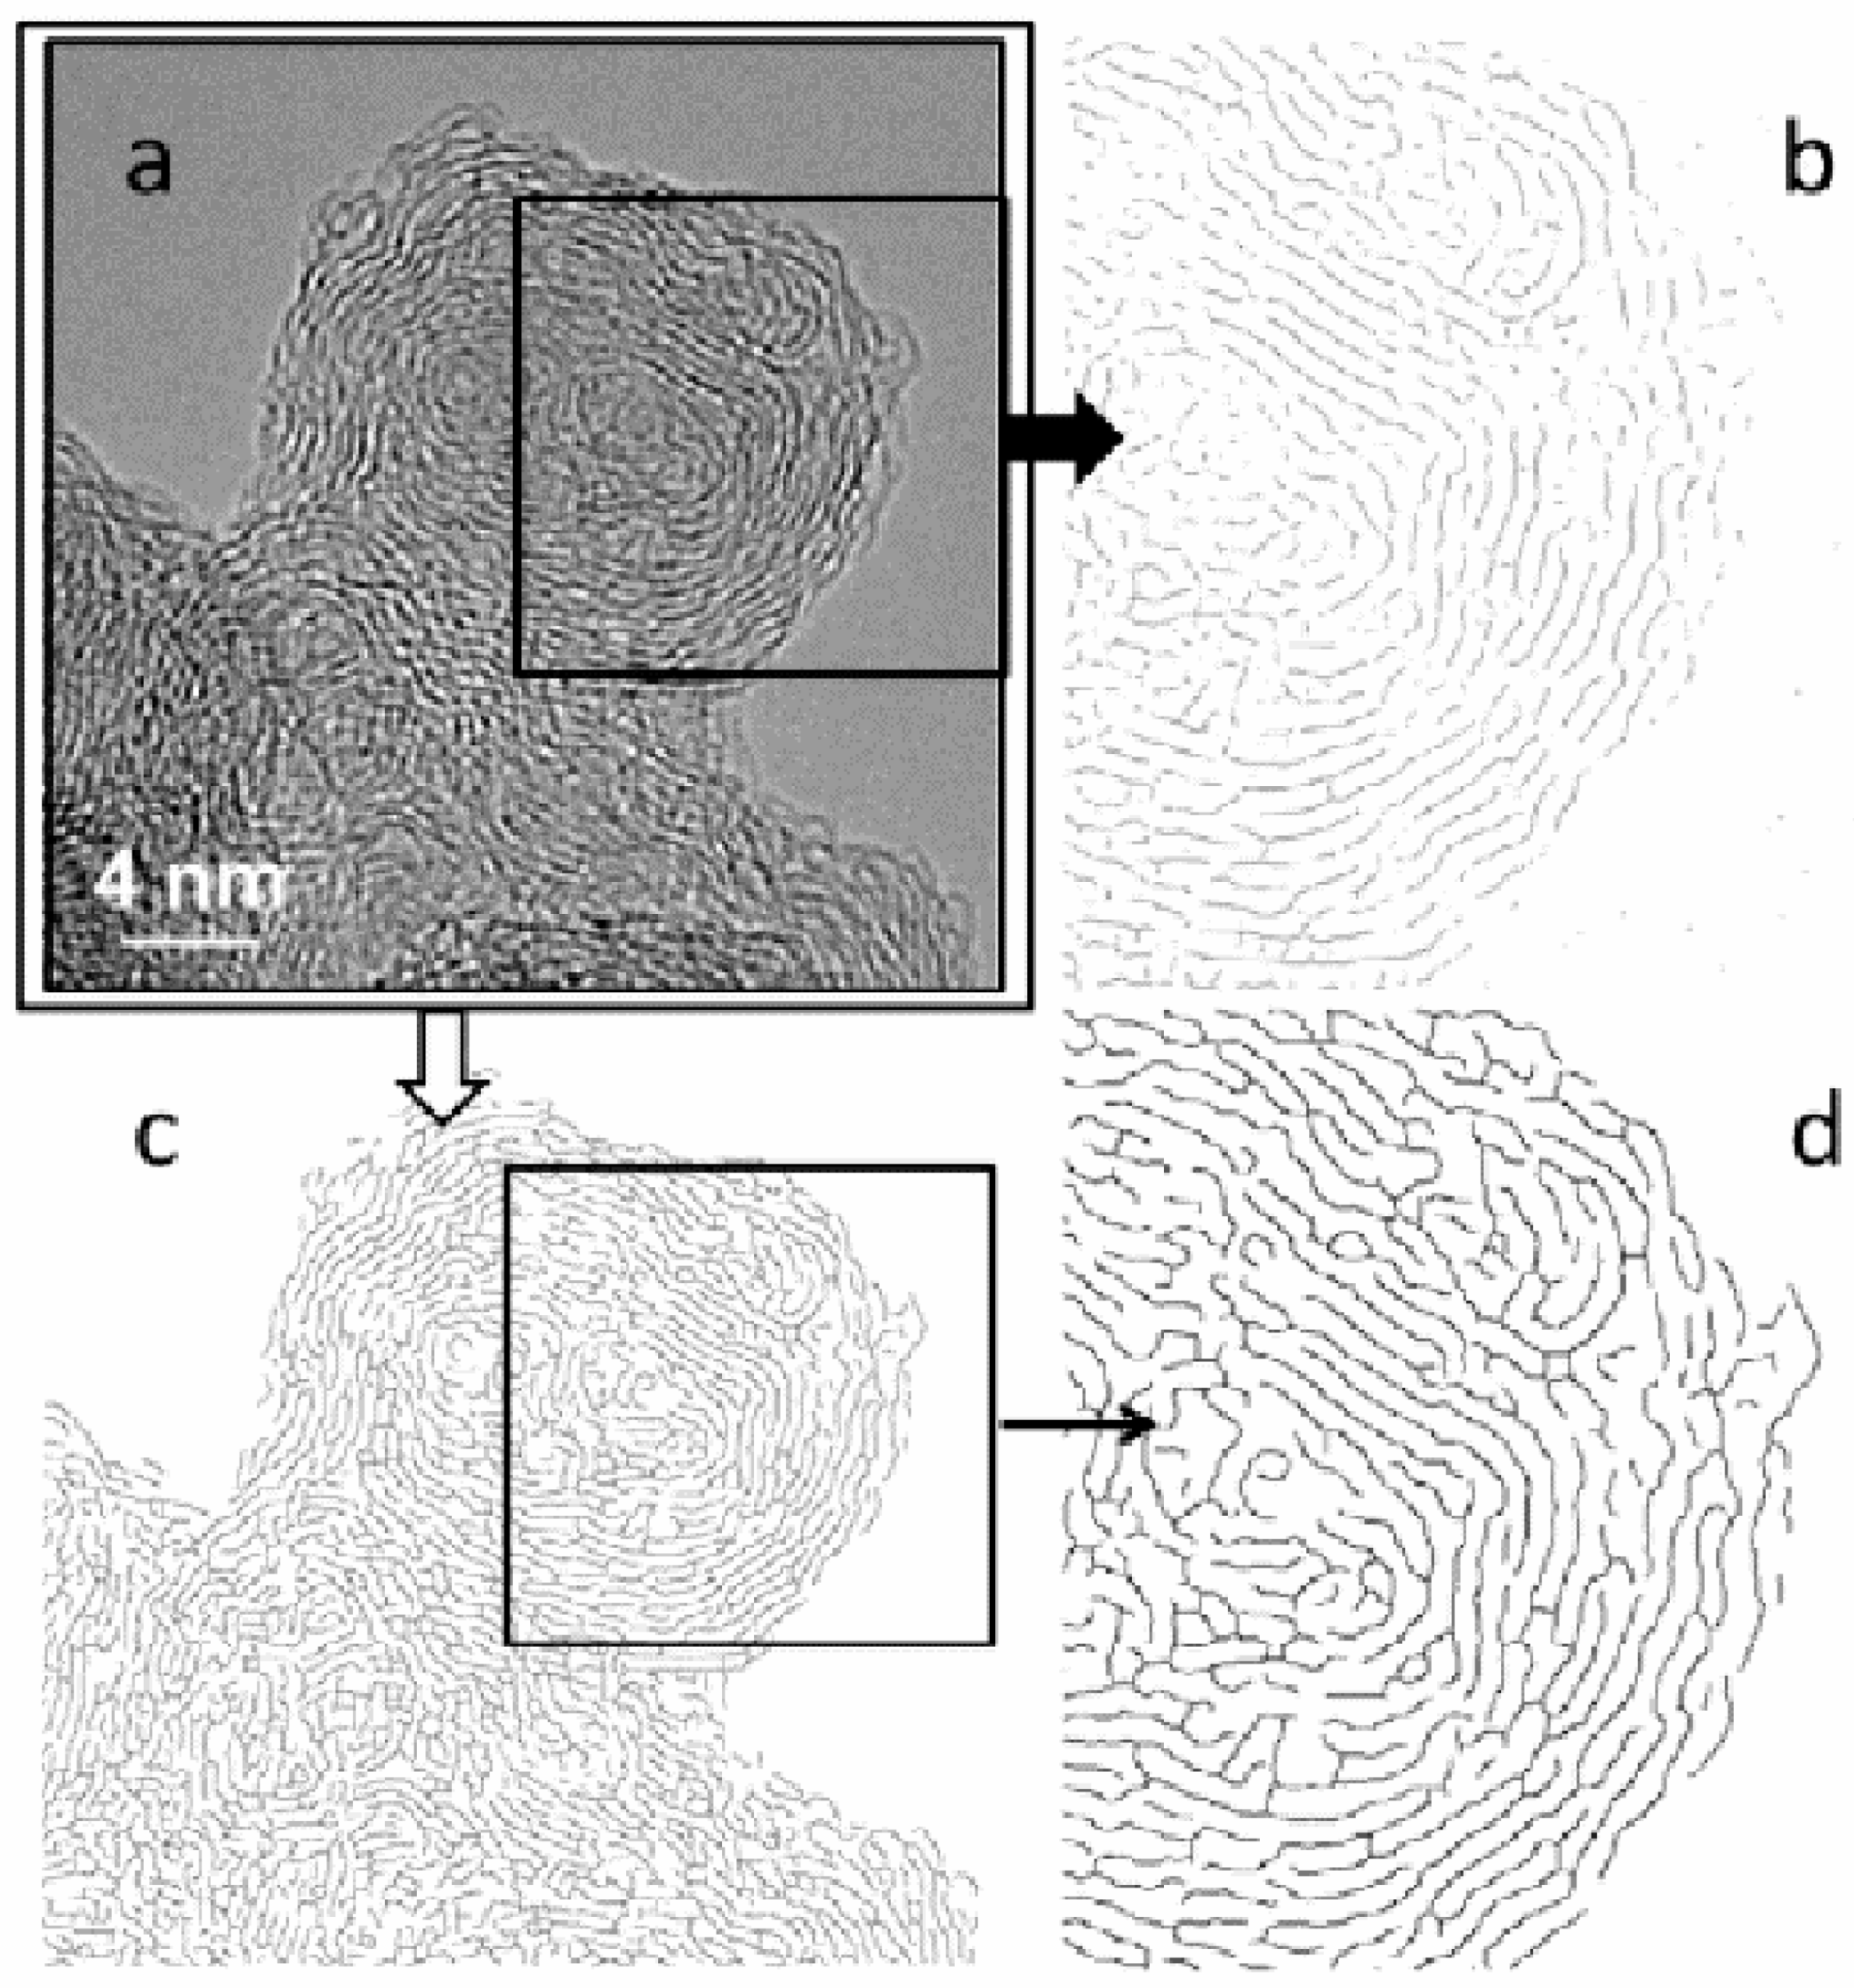
Figure 11.
(a) An example of soot nanostructure with contrast of carbon layers enhanced digitally. (b) A schematic model for three graphene-like layers in soot nanostructure. Reproduced with permission from Buseck et al. [55]. Copyright Taylor & Francis, 2014.
Figure 11.
(a) An example of soot nanostructure with contrast of carbon layers enhanced digitally. (b) A schematic model for three graphene-like layers in soot nanostructure. Reproduced with permission from Buseck et al. [55]. Copyright Taylor & Francis, 2014.

Figure 12.
(a) Franklin’s representations of graphitising and (b) non-graphitising carbons. Reproduced with permission from Franklin [21]. Copyright The Royal Society, 1951.
Figure 12.
(a) Franklin’s representations of graphitising and (b) non-graphitising carbons. Reproduced with permission from Franklin [21]. Copyright The Royal Society, 1951.
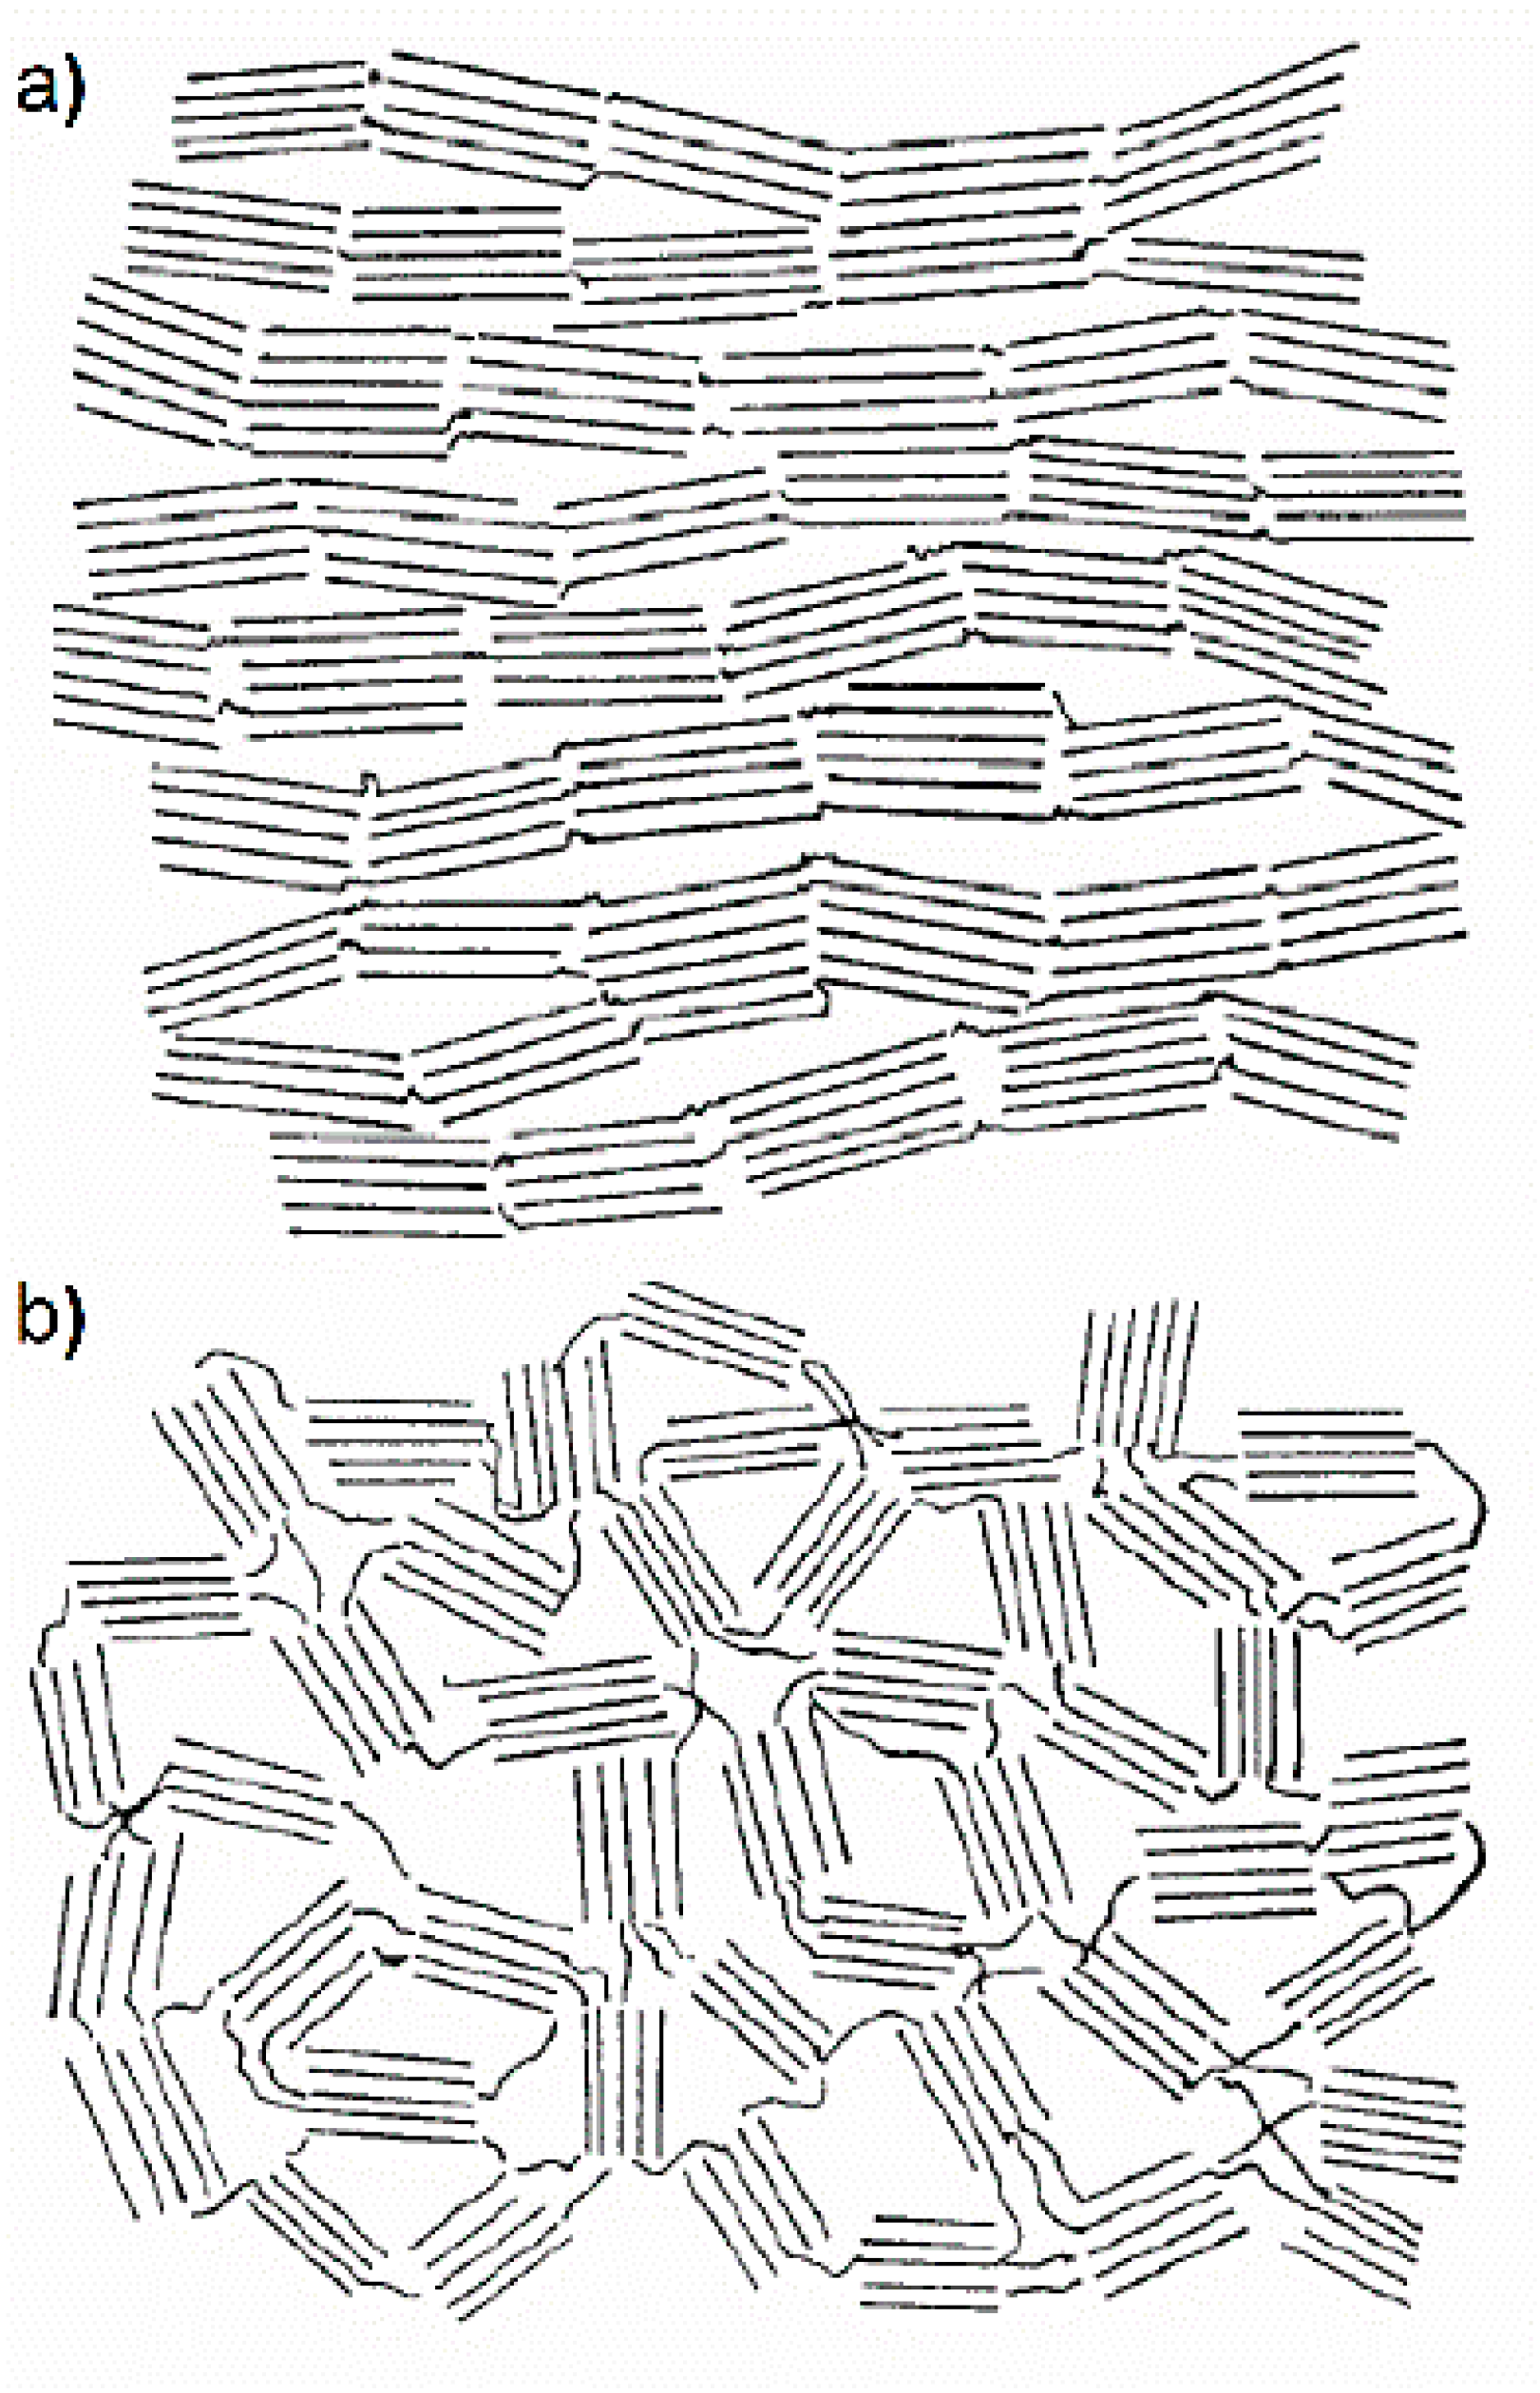
Figure 13.
Calculated X-ray scattering intensities of a graphite-like layer (solid line), a cubic diamond-like lattice (dashed line), and a hexagonal diamond lattice (dotted line), each containing 26 atoms. Reproduced with permission from Ergun and Tiensuu [57]. Copyright International Union of Crystallography, 1959.

Figure 14.
(a) Comparison of structure factors and (b) radial distribution functions for saccharose- and anthracene-based carbons heat-treated at 1000, 1900, and 2300 °C. Reproduced with permission from Szczygielska et al. [71]. Copyright Elsevier, 2001.
Figure 14.
(a) Comparison of structure factors and (b) radial distribution functions for saccharose- and anthracene-based carbons heat-treated at 1000, 1900, and 2300 °C. Reproduced with permission from Szczygielska et al. [71]. Copyright Elsevier, 2001.

Figure 15.
Nanostructures observed by HRTEM in commercial Sigradur glass-like carbon: imperfect nanoparticle (a) and nanotube-like structures with small fullerene particles at the tip (b). Reproduced with permission from Harris [7]. Copyright Taylor & Francis, 2004.
Figure 15.
Nanostructures observed by HRTEM in commercial Sigradur glass-like carbon: imperfect nanoparticle (a) and nanotube-like structures with small fullerene particles at the tip (b). Reproduced with permission from Harris [7]. Copyright Taylor & Francis, 2004.
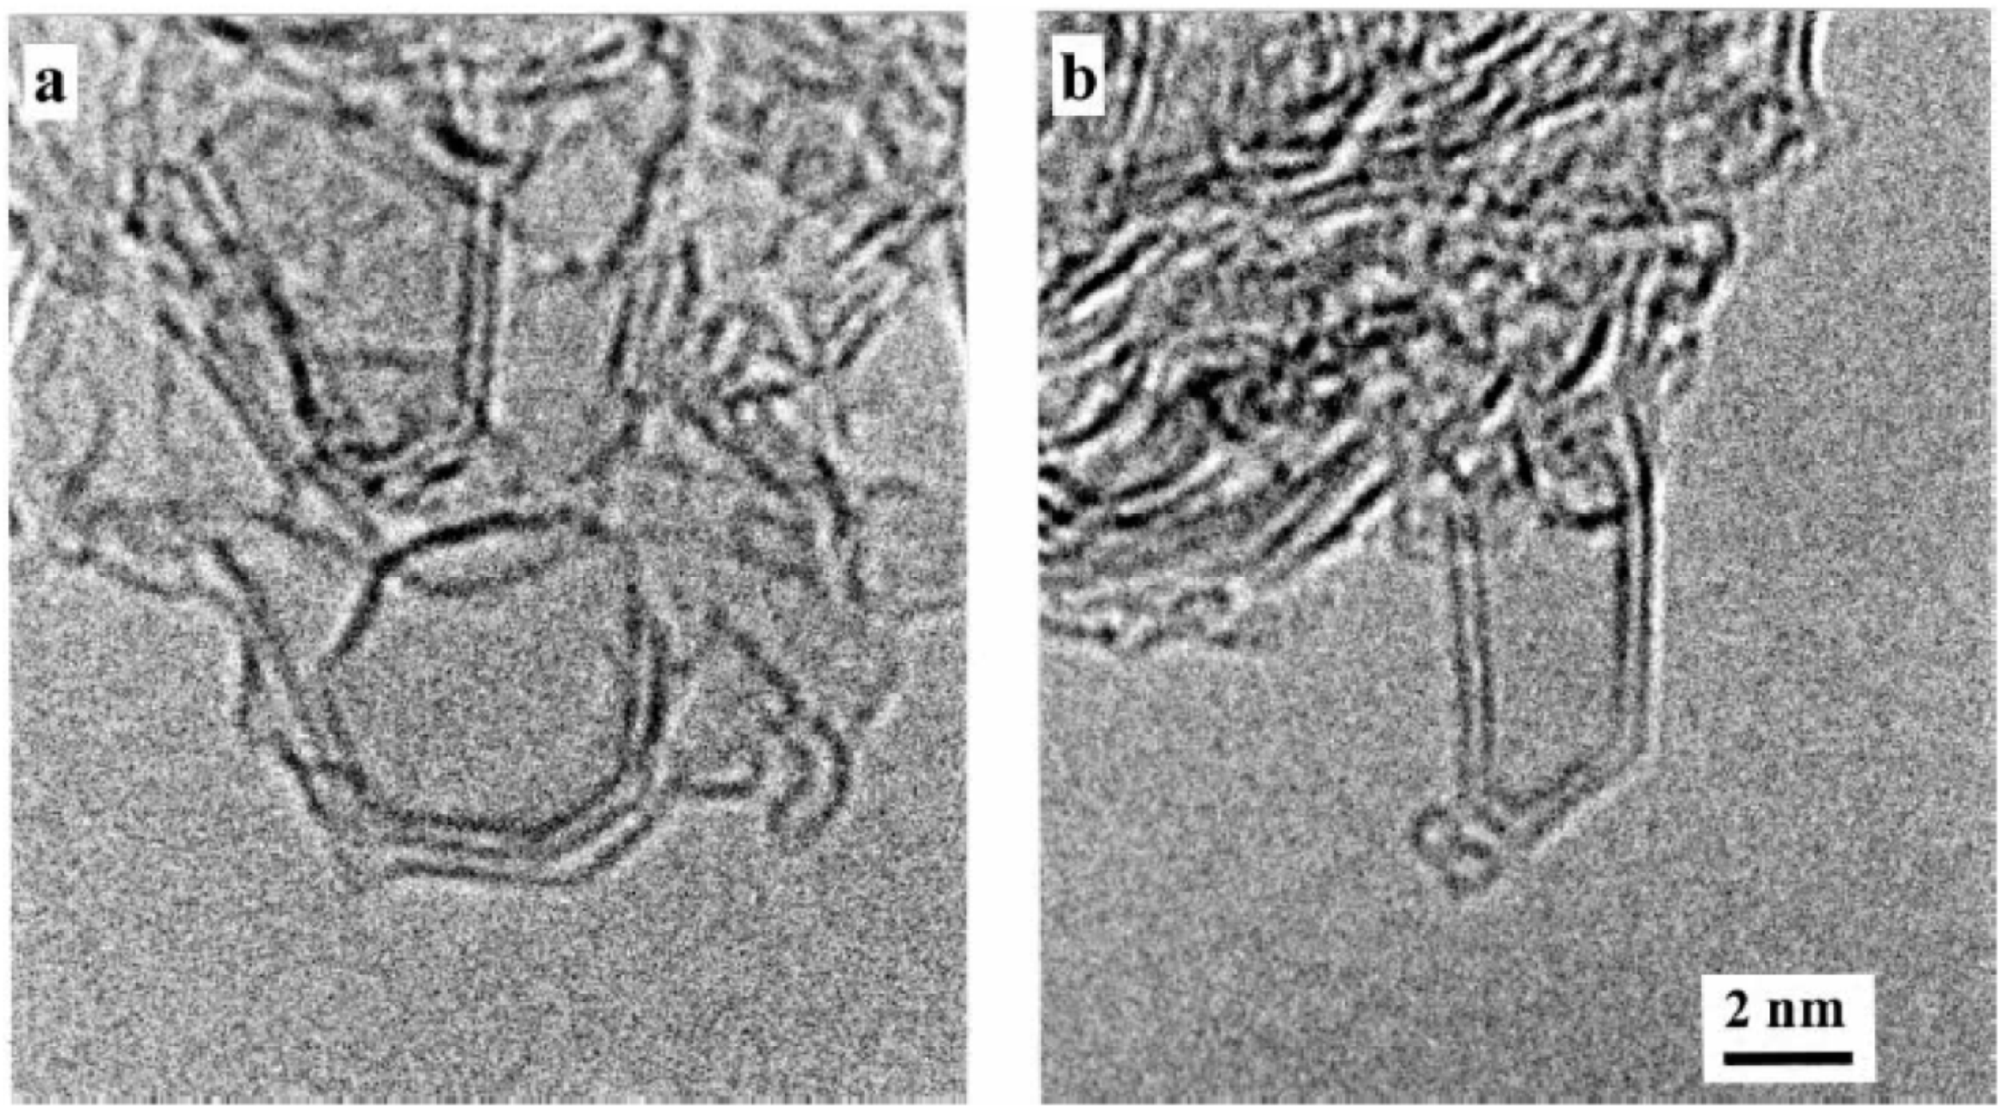
Figure 16.
(a) TEM images of commercial Sigradur K glass-like carbon prepared at 1000 °C and (b) Sigradur G glass-like carbon prepared at 2800 °C. (c) Models for the fullerene-like structure of low-temperature and (d) high-temperature glass-like carbon proposed by Harris. Reproduced with permission from Harris [7]. Copyright Taylor & Francis, 2004.

Figure 17.
(a) Aberration-corrected micrograph of activated carbon heated to 2000 °C. (b,e) Enlarged regions showing pentagonal arrangement of spots. (c,f) Simulated images of structures shown in (d,g), respectively. Reproduced with permission from Harris et al. [81]. Copyright IOP Publishing, 2008.
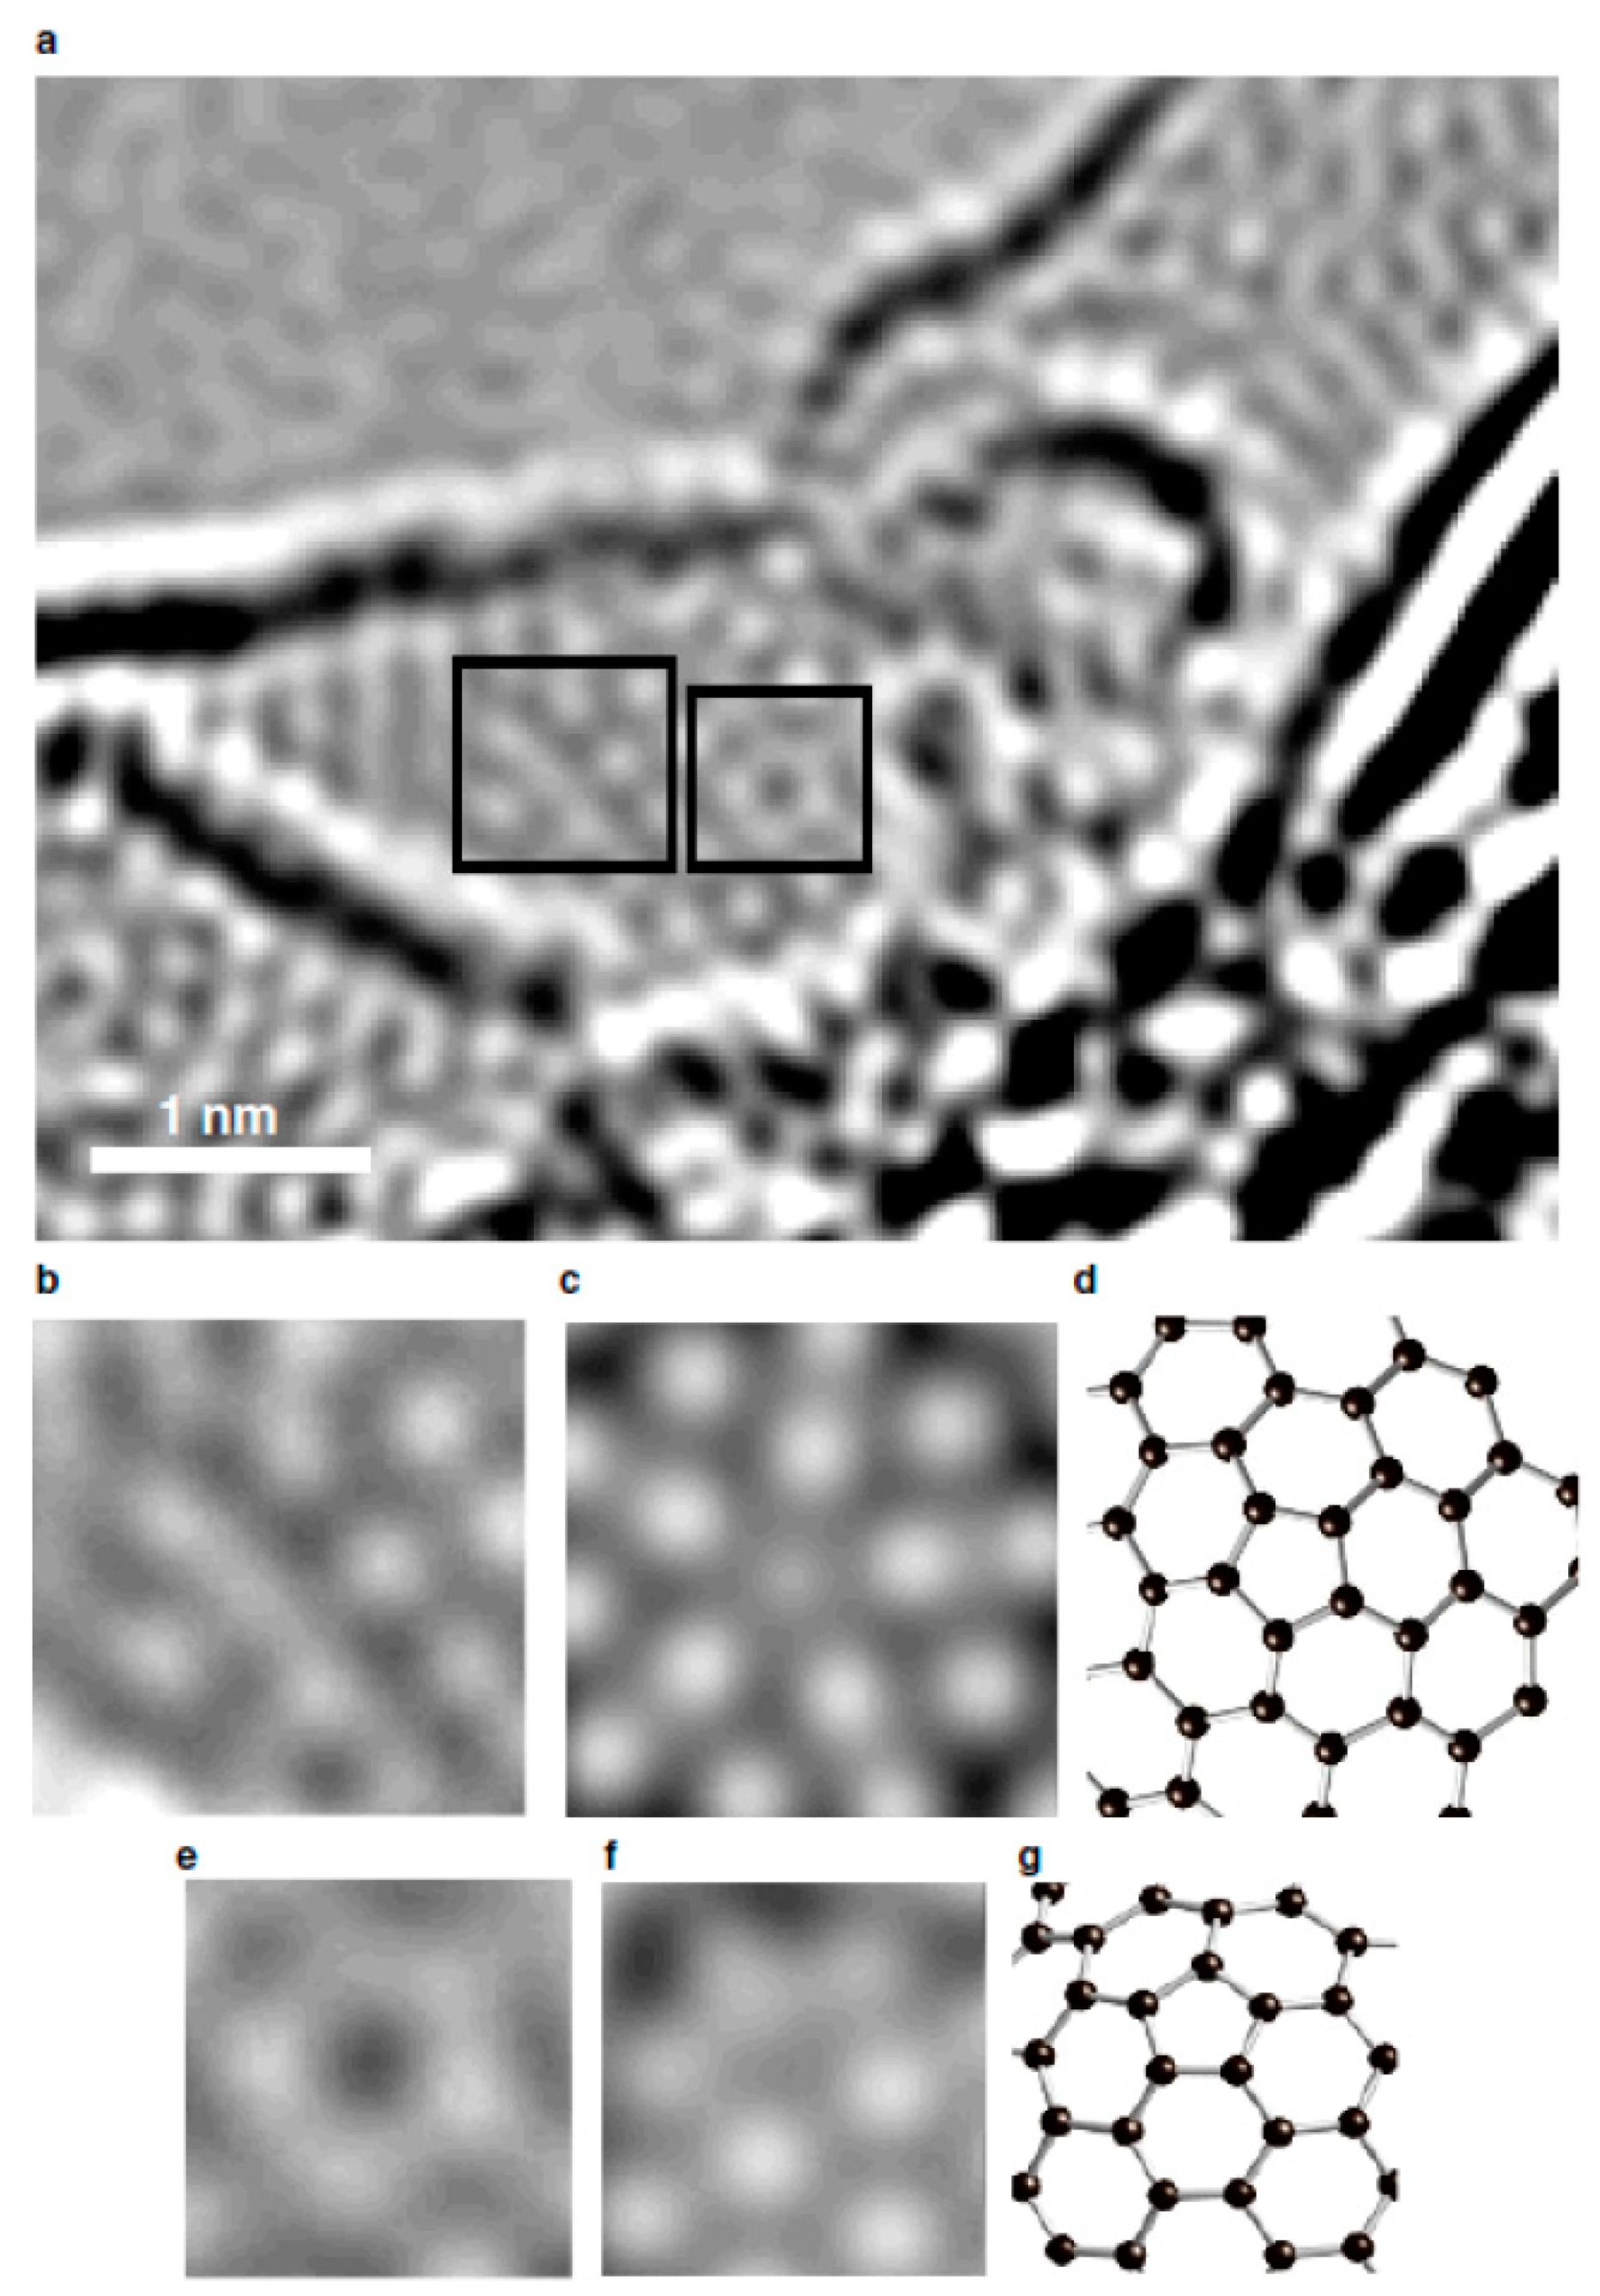
Figure 18.
(A–F) Scanning electron micrographs of graphite polyhedral crystals found in pores of Toyo Tanso GL-200 glassy carbon. (G) Raman spectra of a polyhedral nanotube found in Toyo Tanso glassy carbon with insets of its SEM and TEM images. Reproduced with permission from Gogotsi et al. [82]. Copyright The American Association for the Advancement of Science, 2000. (H) TEM image of a polyhedral nanotube found in polyfurfuryl alcohol-derived glassy carbon, recorded with the S/TEM Titan 80–300 microscope at accelerating voltage of 300 kV.
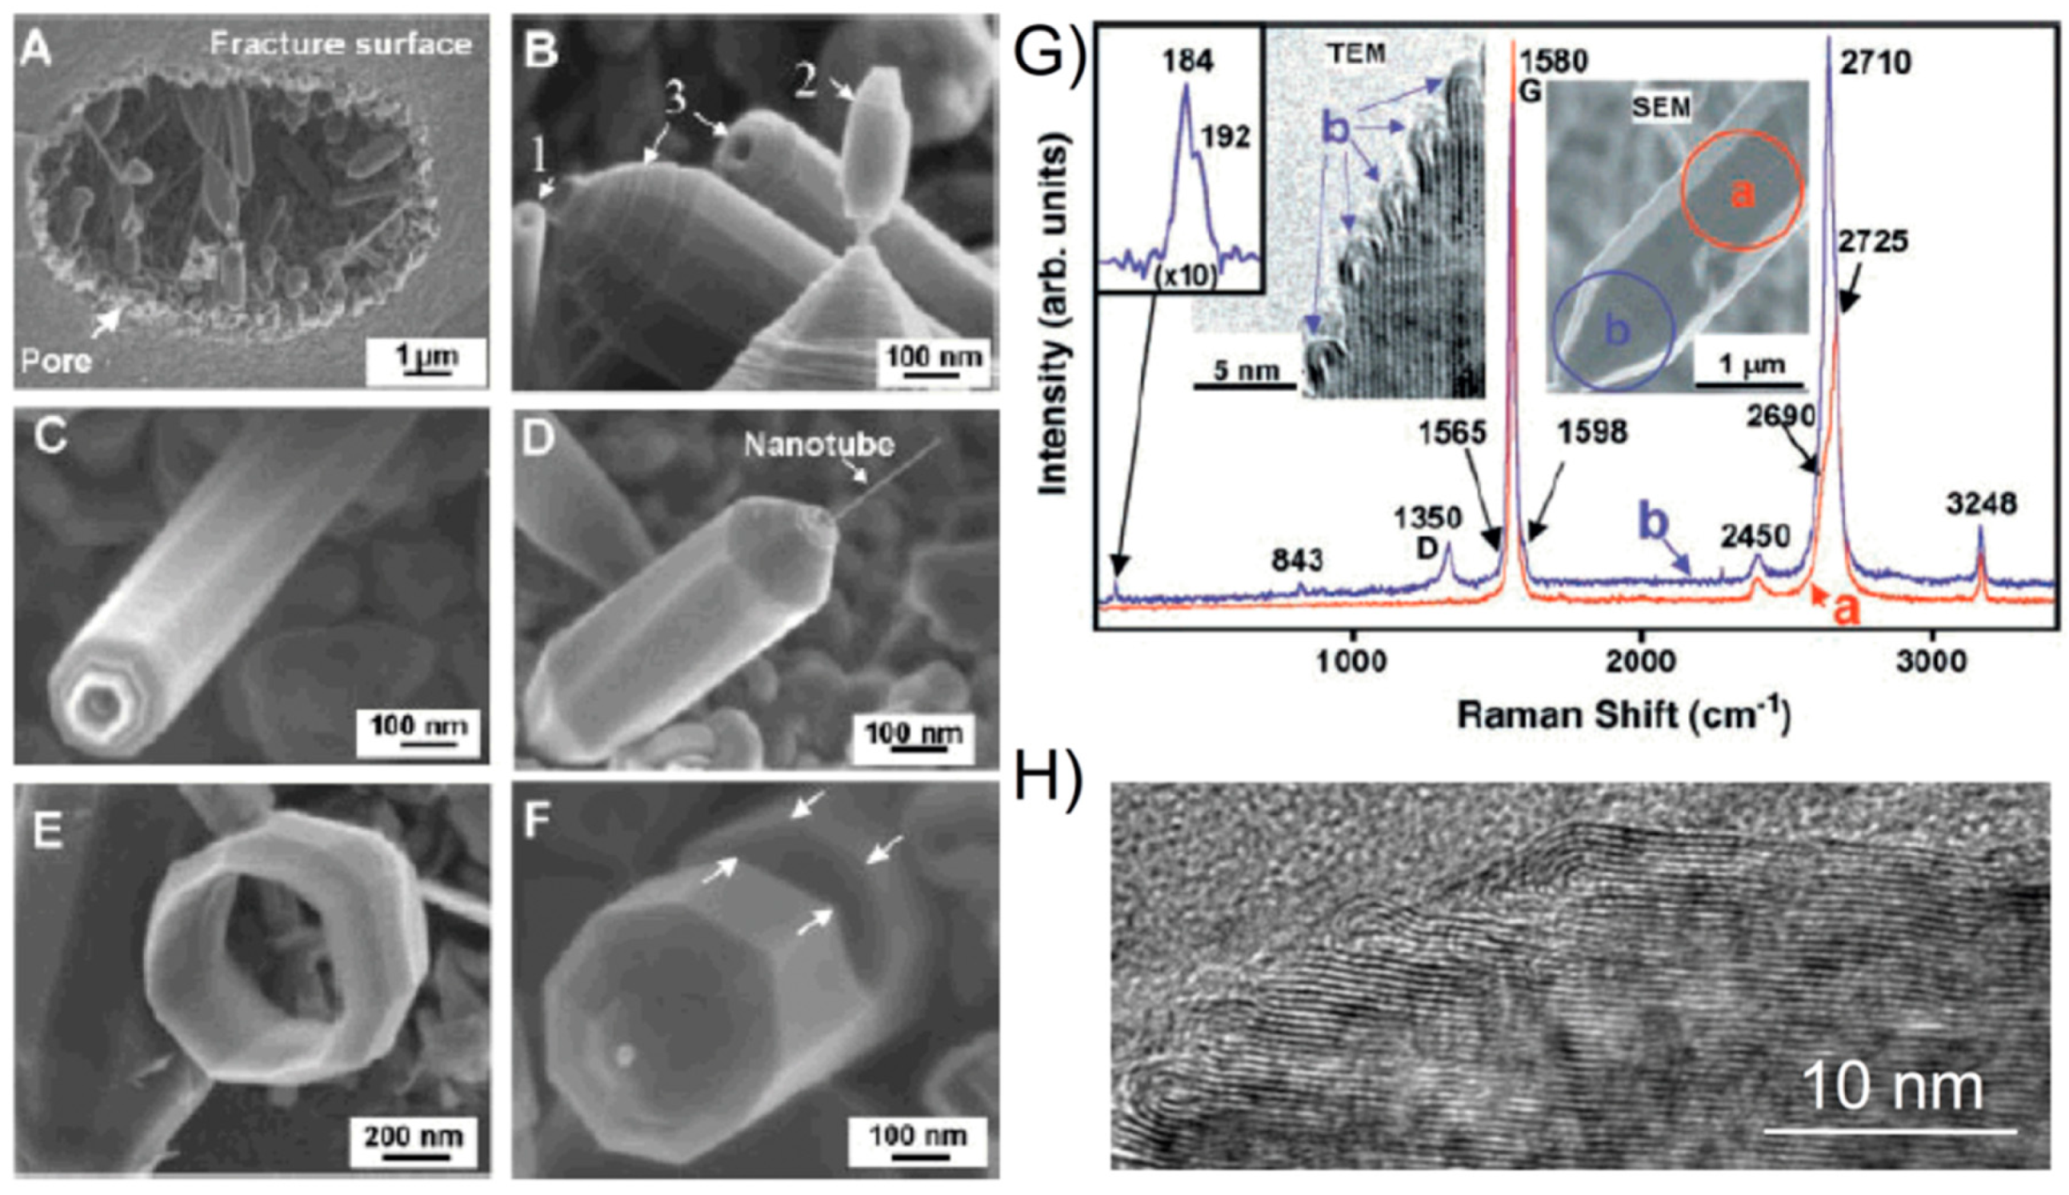
Figure 19.
(a) C–C bond distances in an aromatic-type hexagonal ring of graphite structure. (b) Comparison of the experimental pair distribution function for the glassy carbon pyrolysed at 800 °C (dotted line) with the calculated pair distribution function for a slightly-curved graphene-type model optimized by Petkov et al. [83]. Reproduced with permission from Petkov et al. [83]. Copyright Taylor and Francis, 1999.

Figure 20.
(a) Structure factor and (b) pair distribution function for glassy carbon heat-treated at 1000 °C, ED data—solid line, RMC modelling—dotted line. Reproduced with permission from O’Malley and Snook [91] Copyright APS Physics, 1997.
Figure 20.
(a) Structure factor and (b) pair distribution function for glassy carbon heat-treated at 1000 °C, ED data—solid line, RMC modelling—dotted line. Reproduced with permission from O’Malley and Snook [91] Copyright APS Physics, 1997.
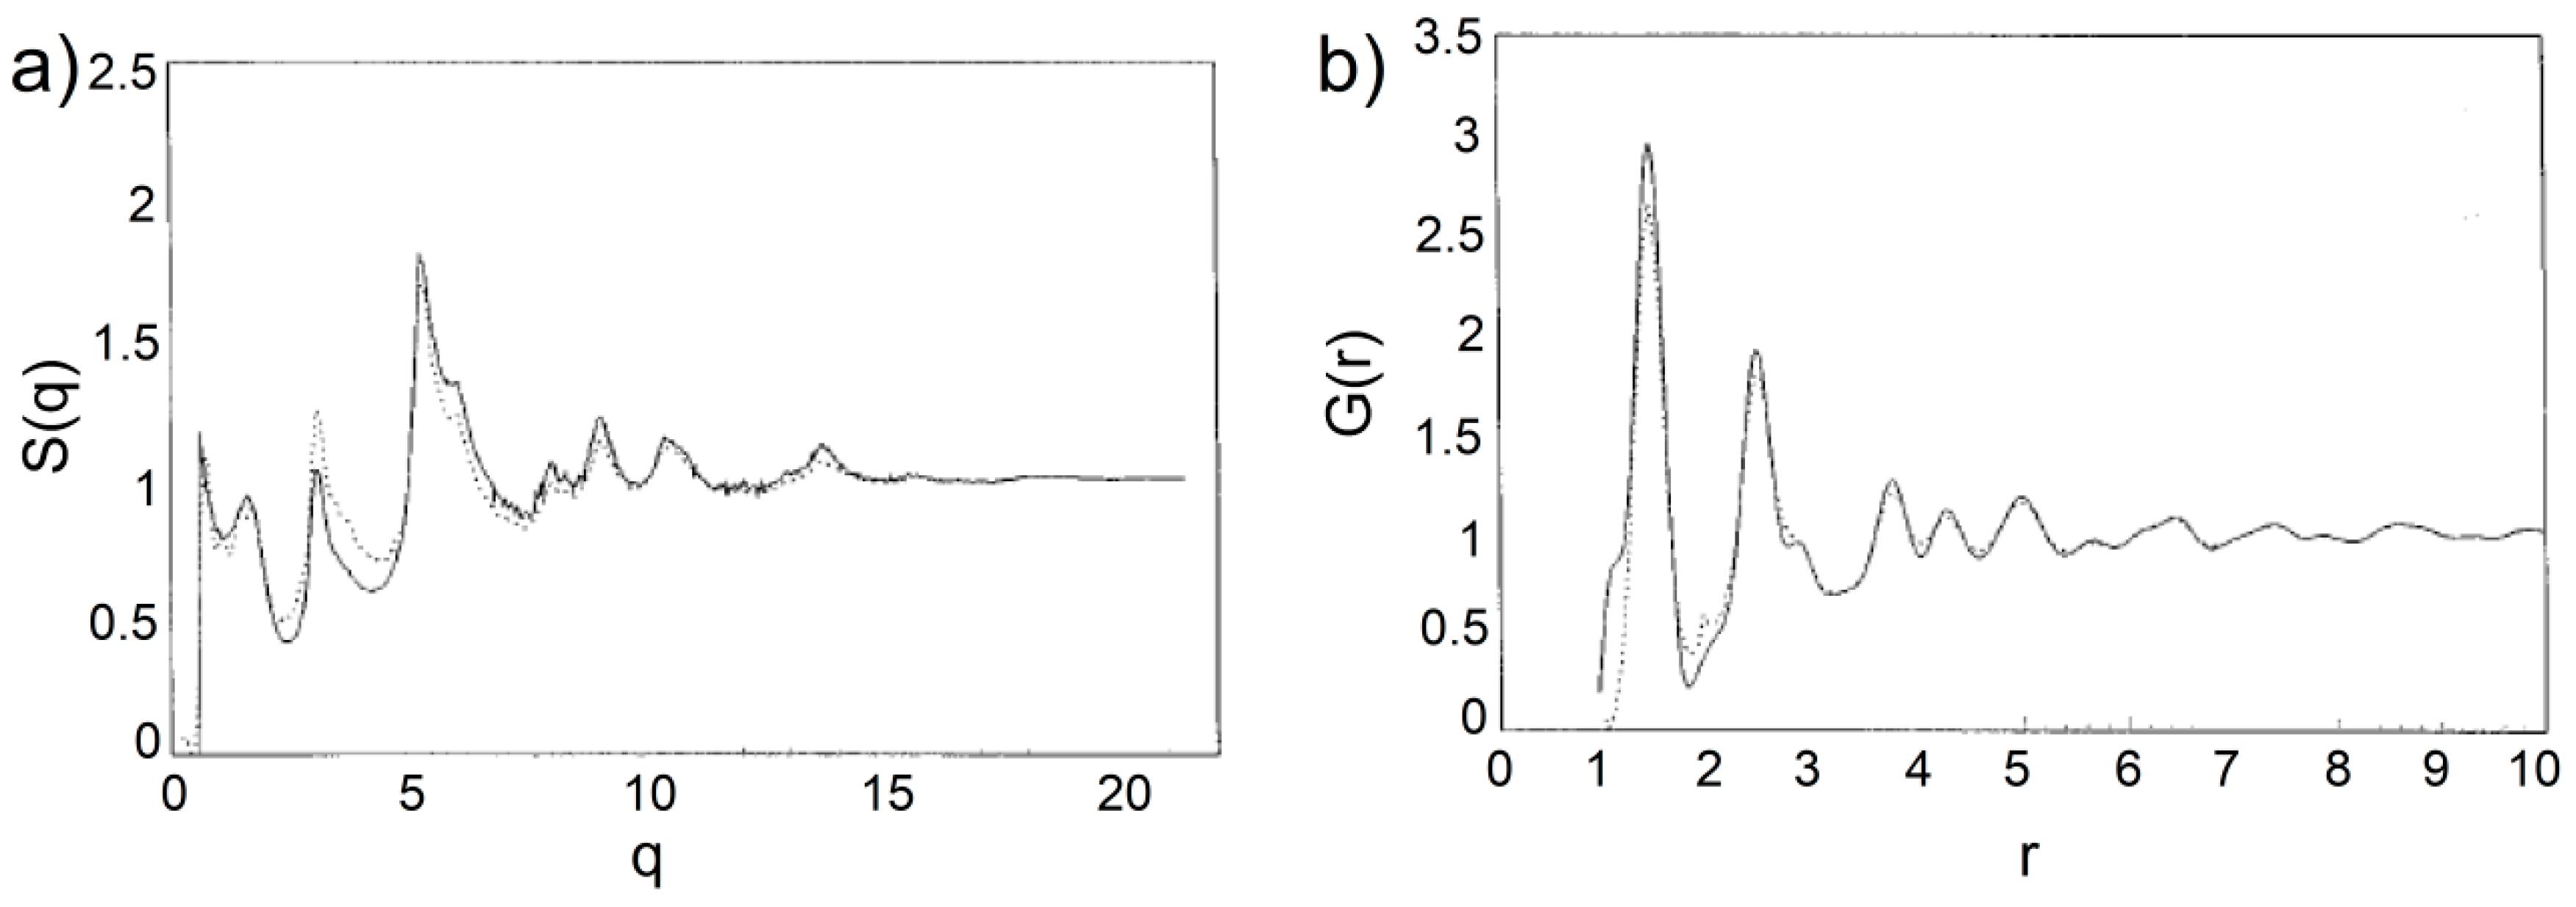
Figure 21.
(a) A basal plane from the generated RMC configurations for glassy carbon heat-treated at 1000 °C. (b) A side-on view of the same basal plane. Reproduced with permission from O’Malley and Snook [91]. Copyright APS Physics, 1997.
Figure 21.
(a) A basal plane from the generated RMC configurations for glassy carbon heat-treated at 1000 °C. (b) A side-on view of the same basal plane. Reproduced with permission from O’Malley and Snook [91]. Copyright APS Physics, 1997.
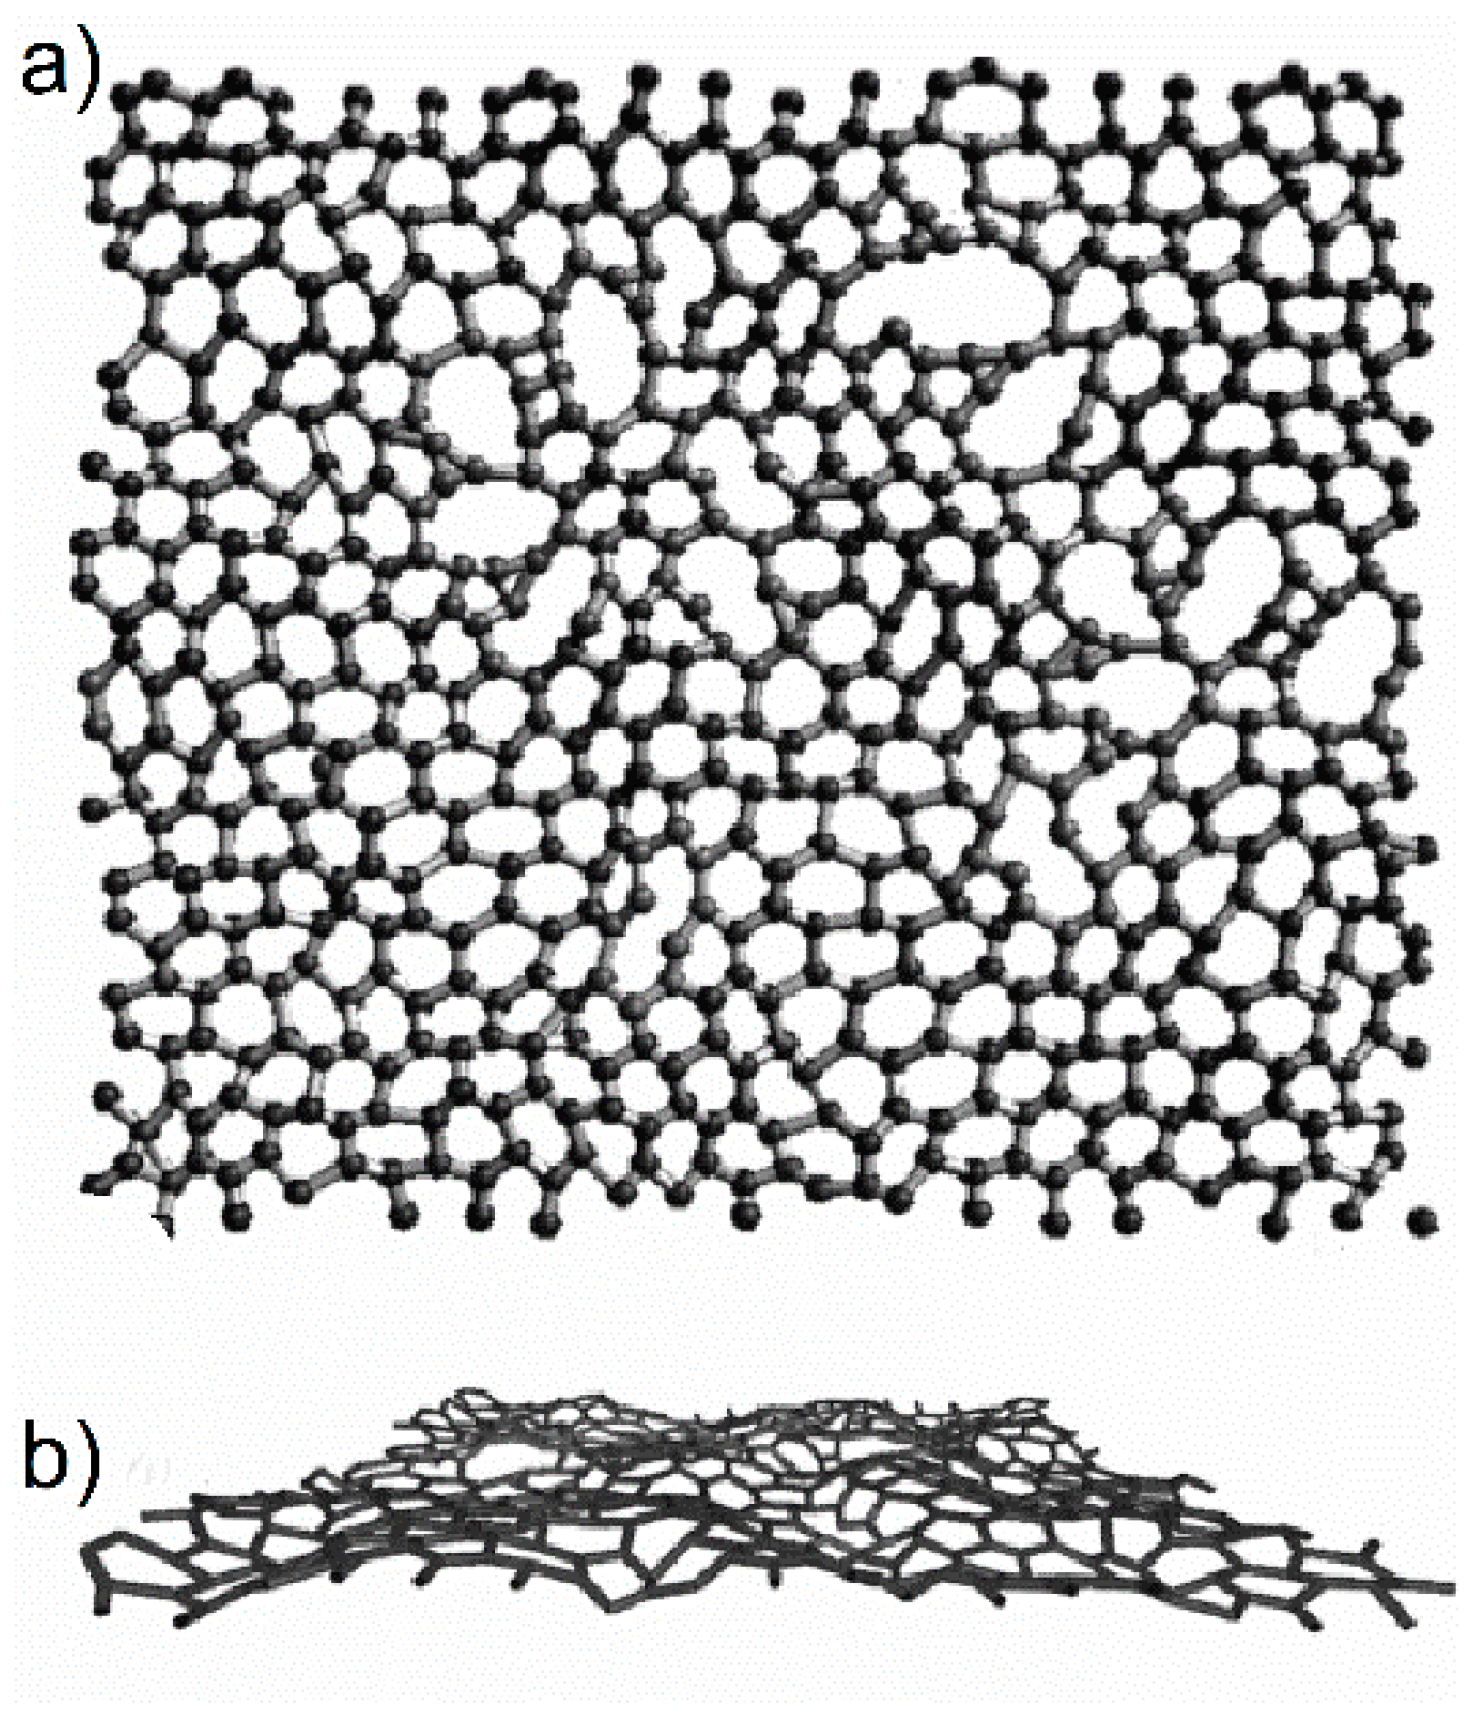
Figure 22.
Comparison of the simulated and experimental pair distribution functions for commercial activated carbon BP71 (left). Visualisation of optimized models for the average structural unit of BP71 carbon (right). Reproduced with permission from Hawelek et al. [25]. Copyright International Union of Crystallography, 1997.

Figure 23.
(a,b) STEM images of wood-based and (c,d) polyfurfuryl alcohol-based nanoporous carbons. Hexagonal carbon rings are marked in blue, five- and seven-membered rings are marked in red. Reproduced with permission from Guo et al. [92]. Copyright John Wiley and Sons, 2012.
Figure 23.
(a,b) STEM images of wood-based and (c,d) polyfurfuryl alcohol-based nanoporous carbons. Hexagonal carbon rings are marked in blue, five- and seven-membered rings are marked in red. Reproduced with permission from Guo et al. [92]. Copyright John Wiley and Sons, 2012.

Figure 24.
(a) Comparison of the experimental pair distribution functions determined from ND and XRD measurements for glassy carbons pyrolysed at temperatures in the the range 800–2500 °C with the function calculated for a single unstrained graphite layer in the short-range order and (b) in the intermediate-range order. Reproduced with permission from Jurkiewicz et al. [26]. Copyright International Union of Crystallography, 2017.

Figure 25.
Models of averaged coherent scattering domains for polyfurfuryl alcohol-based glass-like carbons pyrolysed at temperatures: 2500, 2000, 1500, 980, and 800 °C (on the left) and the atomic configurations of single layers randomly separated from these models (on the right). (a) Fragment of the model with non-planar sp2 bonding, (b) Stone–Thrower–Wales defect, and (c) monovacancy. Reproduced with permission from Jurkiewicz et al. [26]. Copyright International Union of Crystallography, 2017.
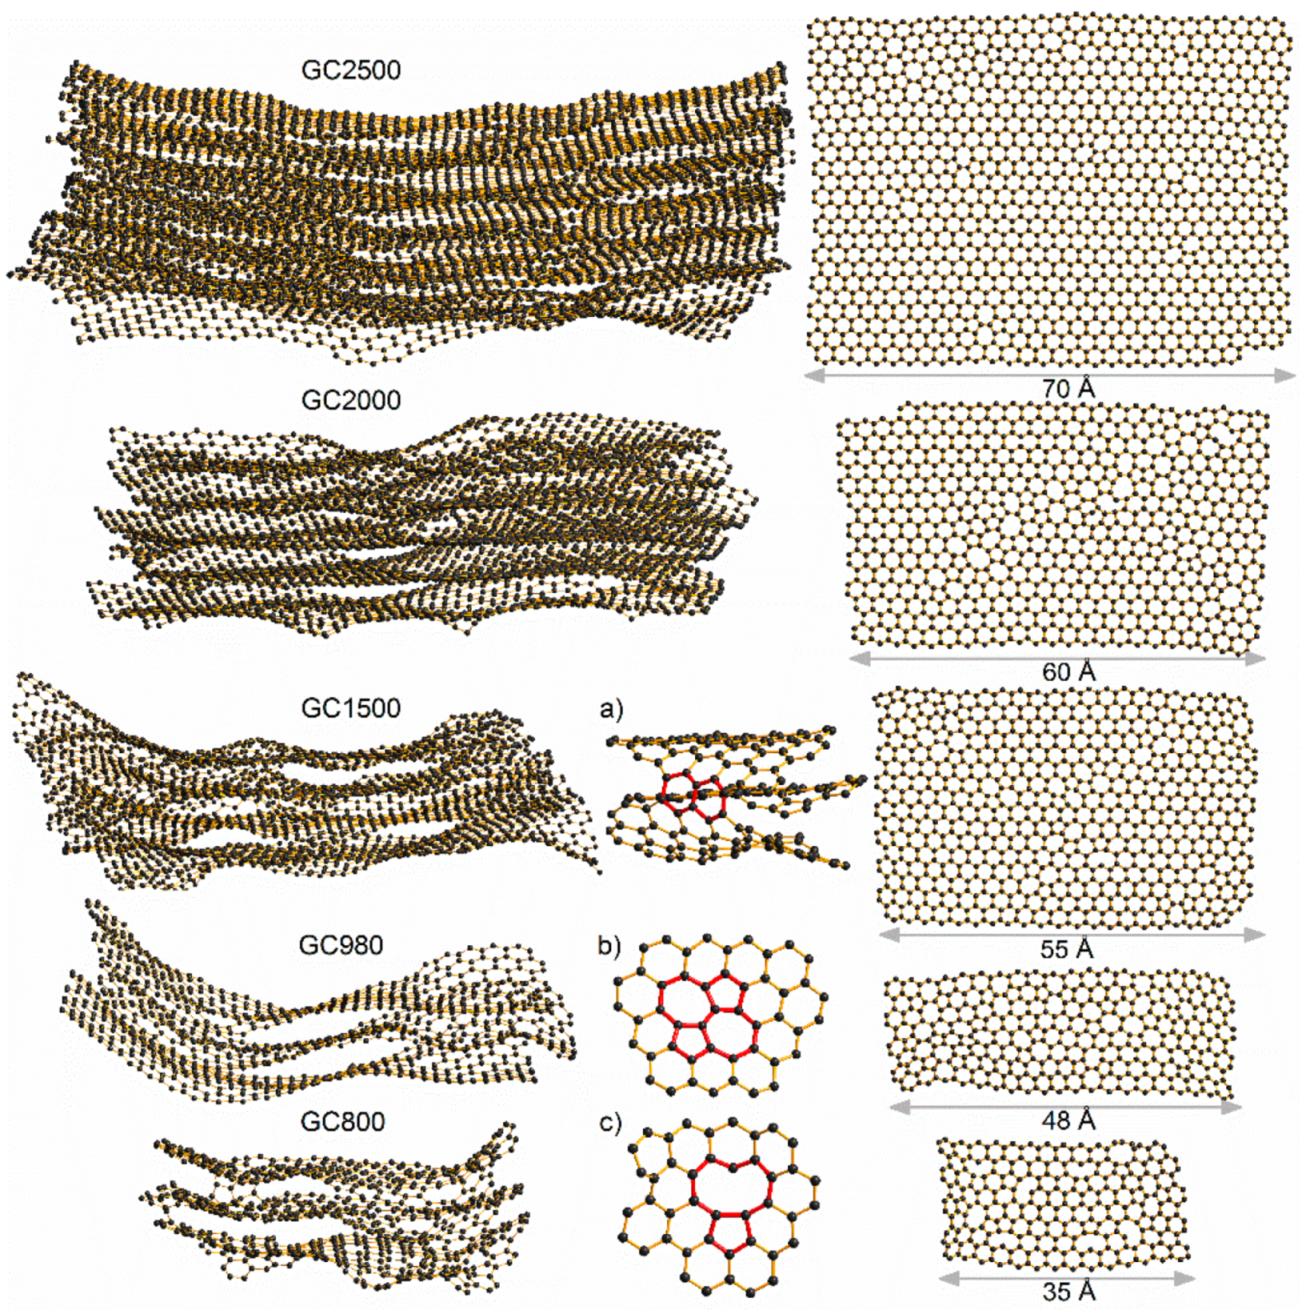
Figure 26.
Structural models for polyfurfuryl alcohol-based glass-like carbons pyrolysed at temperatures: 2500, 2000, 1500, 980, and 800 °C, composed of several coherent scattering domains connected to each other (on the left). (a–d) Selected fragments of the models showing curved fullerene-like or nanotube-like elements. Reproduced with permission from Jurkiewicz et al. [26]. Copyright International Union of Crystallography, 2017. HRTEM images of glass-like carbons prepared at 2500, 1500, and 800 °C (on the right) obtained with the S/TEM Titan 80–300 microscope at accelerating voltage of 300 kV.

Figure 27.
(a–e) TEM images of carbide-derived carbons obtained by chlorination at various temperatures. (f–j) Structural models of carbide-derived carbons simulated using the annealing-based molecular dynamic approach. Reproduced with permission from Tomas et al. [60]. Copyright Elsevier, 2017.
Figure 27.
(a–e) TEM images of carbide-derived carbons obtained by chlorination at various temperatures. (f–j) Structural models of carbide-derived carbons simulated using the annealing-based molecular dynamic approach. Reproduced with permission from Tomas et al. [60]. Copyright Elsevier, 2017.
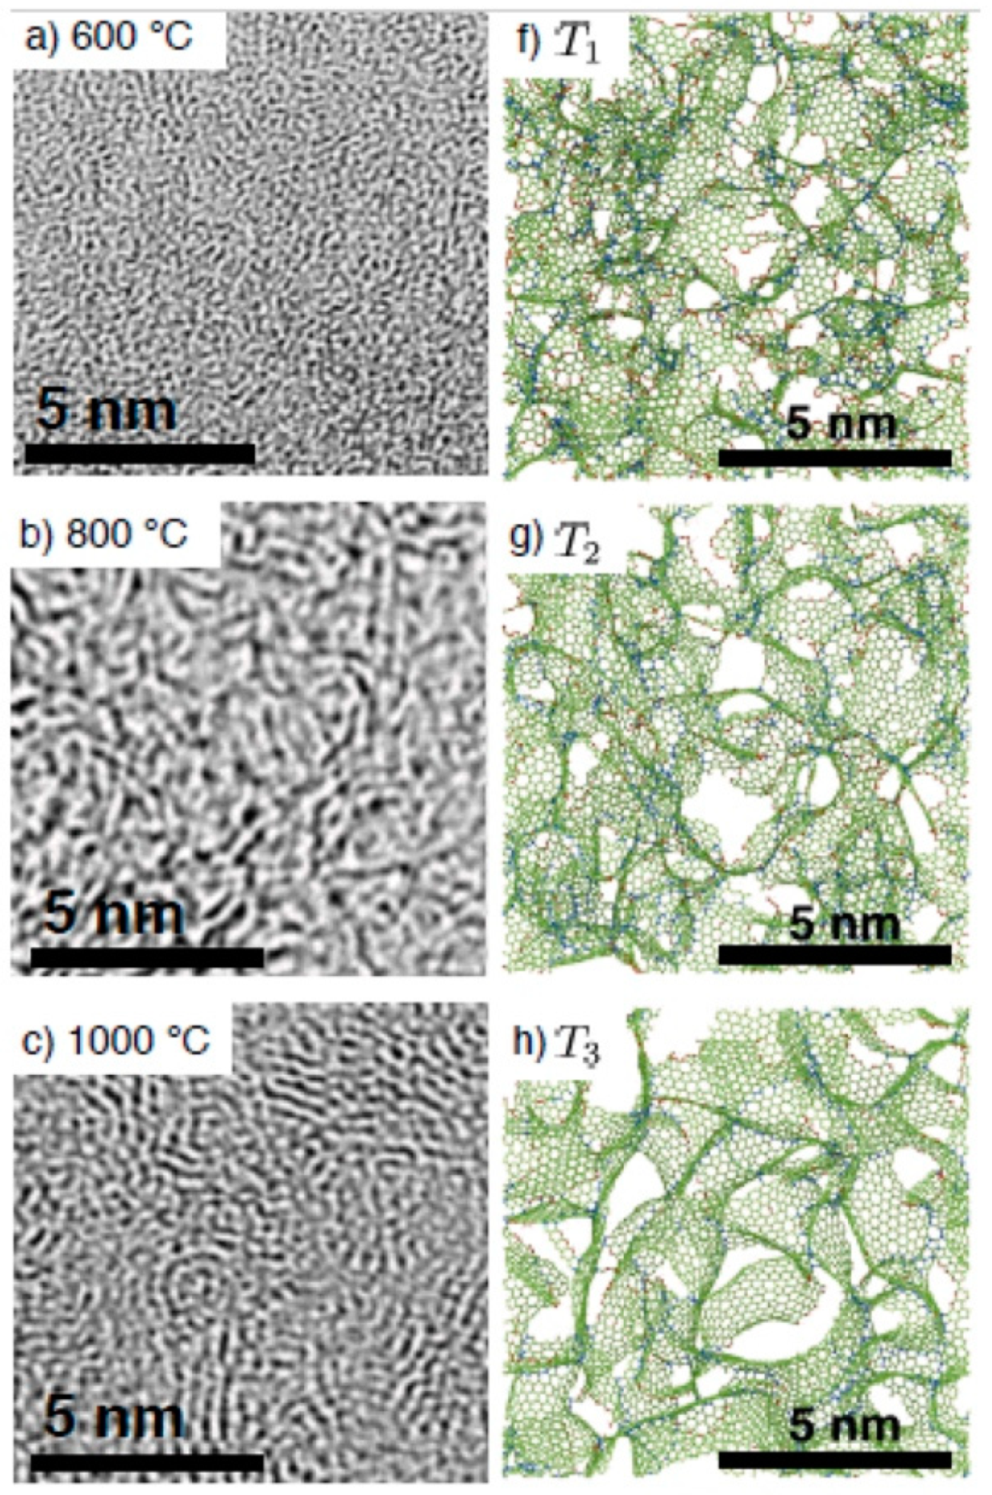

Figure 28.
(a) First HRTEM images of multiwalled carbon nanotubes published by Iijima in 1991. Reproduced with permission from Iijima [1]. Copyright Springer Nature, 1991. (b) TEM image of CNT-like structure published by Oberlin et al. in 1976. Reproduced with permission from Oberlin et al. [100]. Copyright Elsevier, 1976.

Figure 29.
(a) ED pattern taken from a single-walled carbon nanotube (SWCNT) of diameter 1.37 nm. (b) Electron micrograph of the same SWCNT. The pattern comprises two sets of hexagonal patterns which give rise to splitting of the () spots. Each spot has periodic intensity maxima in the vertical direction, caused by Frauenhofer diffraction from the two portions of tube imaged as dark line in (b). (c) Schematic representation of helical tubules according to Hamada’s representation. A tubule is represented by an index () or (), where is the -th hexagon from the origin (), and chiral angle are defined as shown. Reproduced with permission from Iijima and Ichihashi [101]. Copyright Springer Nature, 1993.
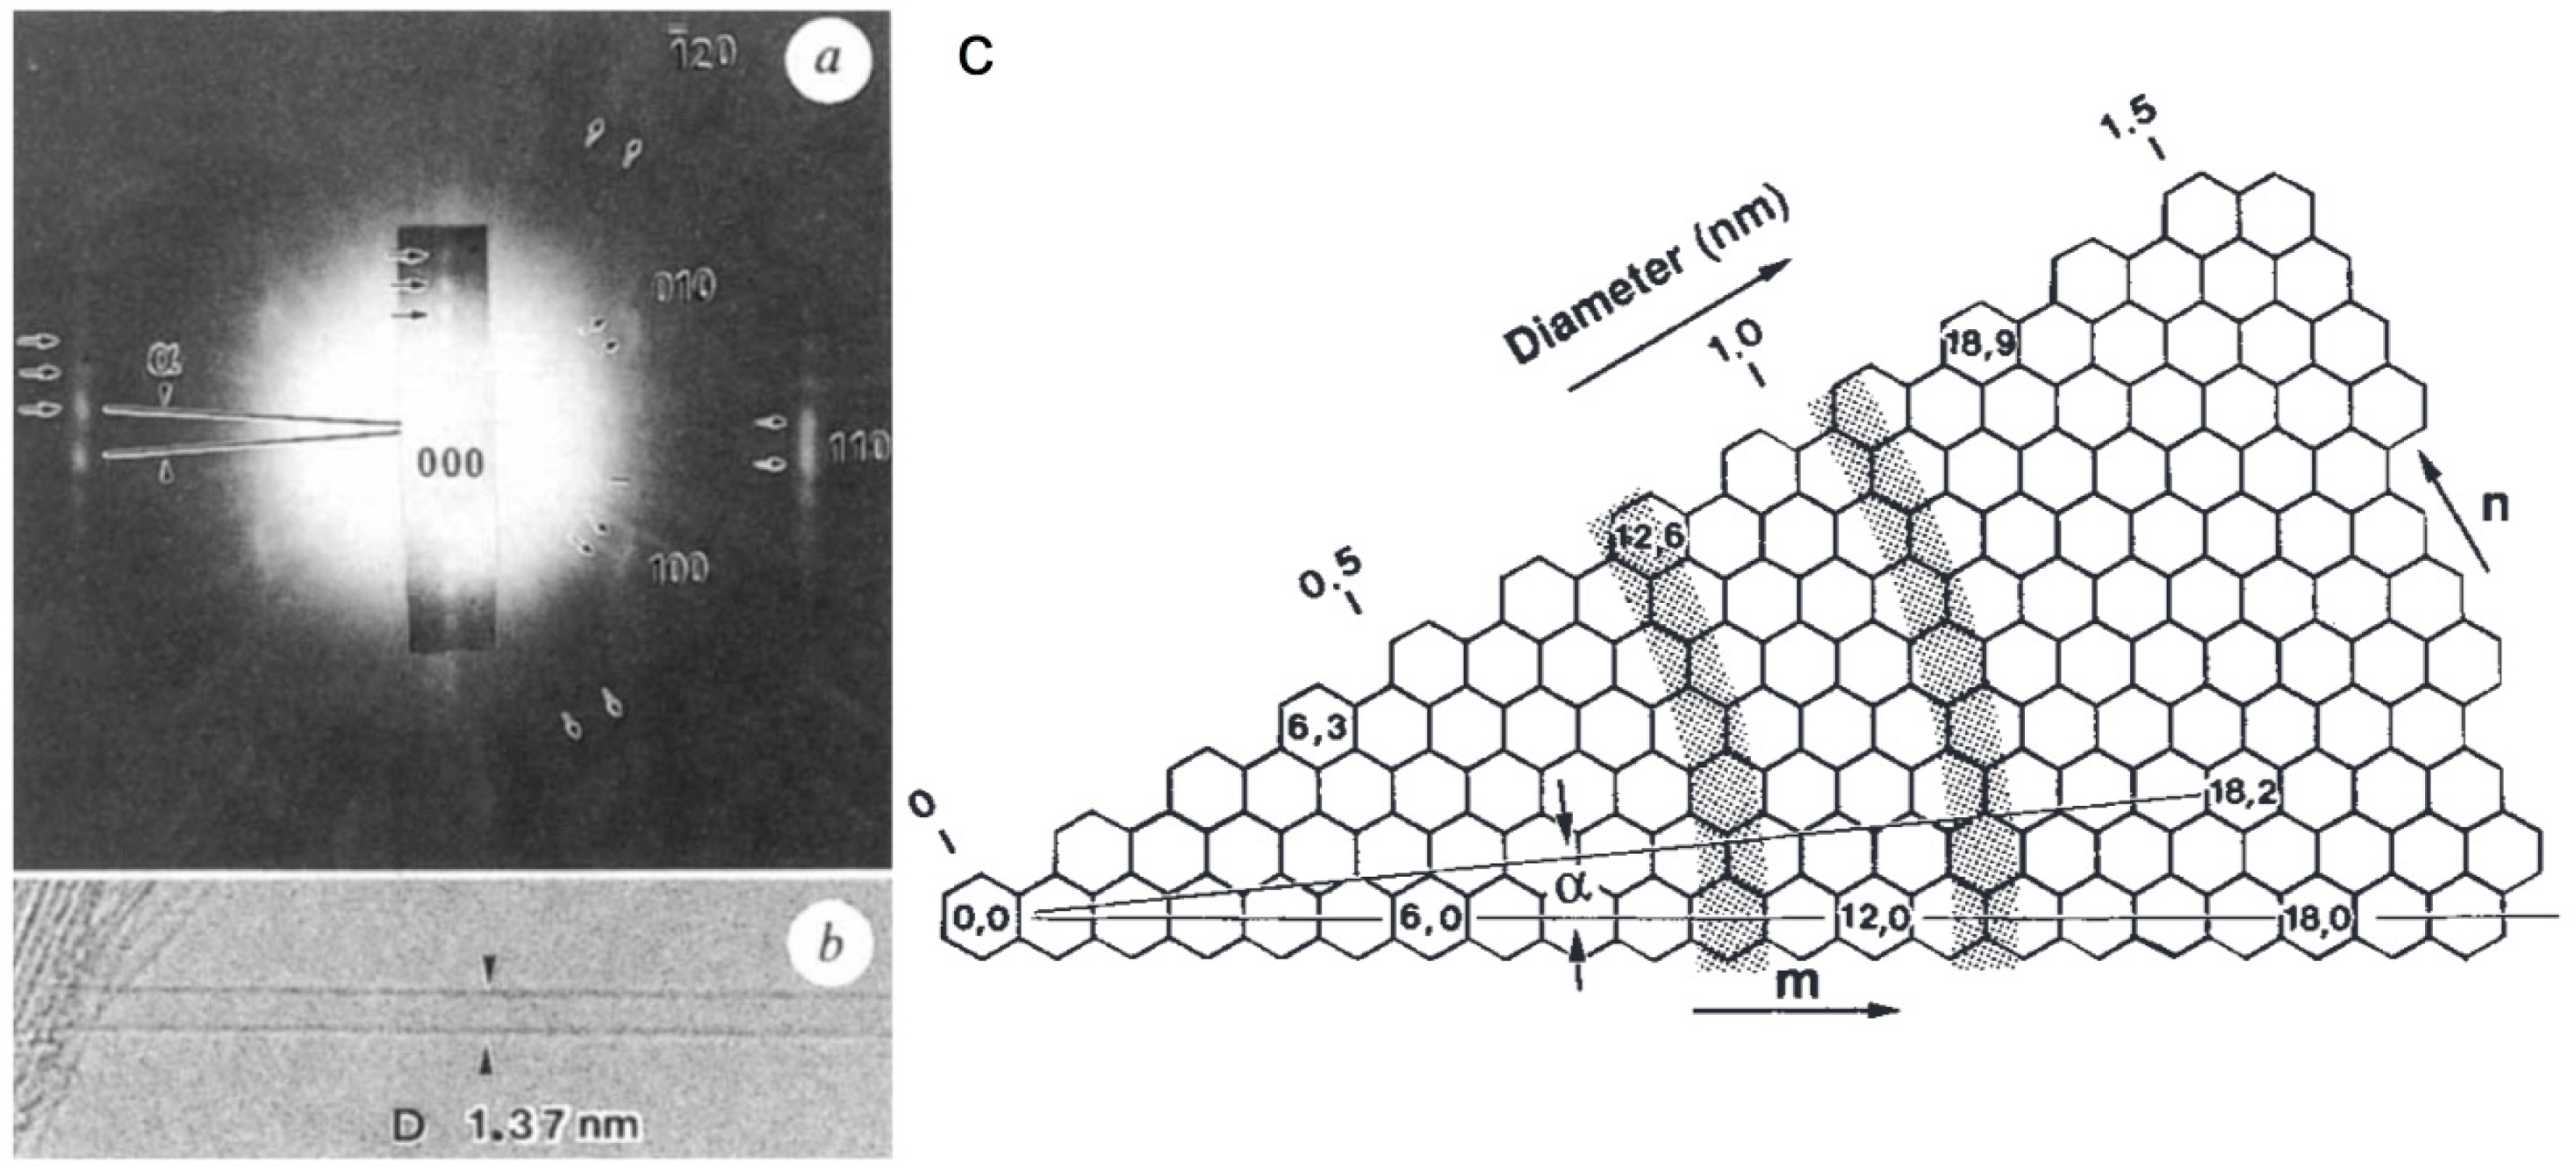
Figure 30.
(a–c) HRTEM images and (d–f) ED patterns from bilayer graphene folded edges of armchair-type, 14.6° chiral folded-edge, zigzag-type, respectively. Reproduced with permission from Zhang et al. [105]. Copyright APS Physics, 2009.
Figure 30.
(a–c) HRTEM images and (d–f) ED patterns from bilayer graphene folded edges of armchair-type, 14.6° chiral folded-edge, zigzag-type, respectively. Reproduced with permission from Zhang et al. [105]. Copyright APS Physics, 2009.

Figure 31.
(a) HRTEM image of CNT ropes projected perpendicularly to their axis and (b,c) images of a rope projected along its axis. (d) Experimental powder XRD profile of a sample of SWCNT ropes produced by the arc-discharge technique (top curve) and theoretical diffraction profile computed for an ensemble of ropes with average diameter 1.34 nm and average number of tubes 25. Reproduced with permission from Lambin et al. [95]. Copyright Elsevier, 2002.
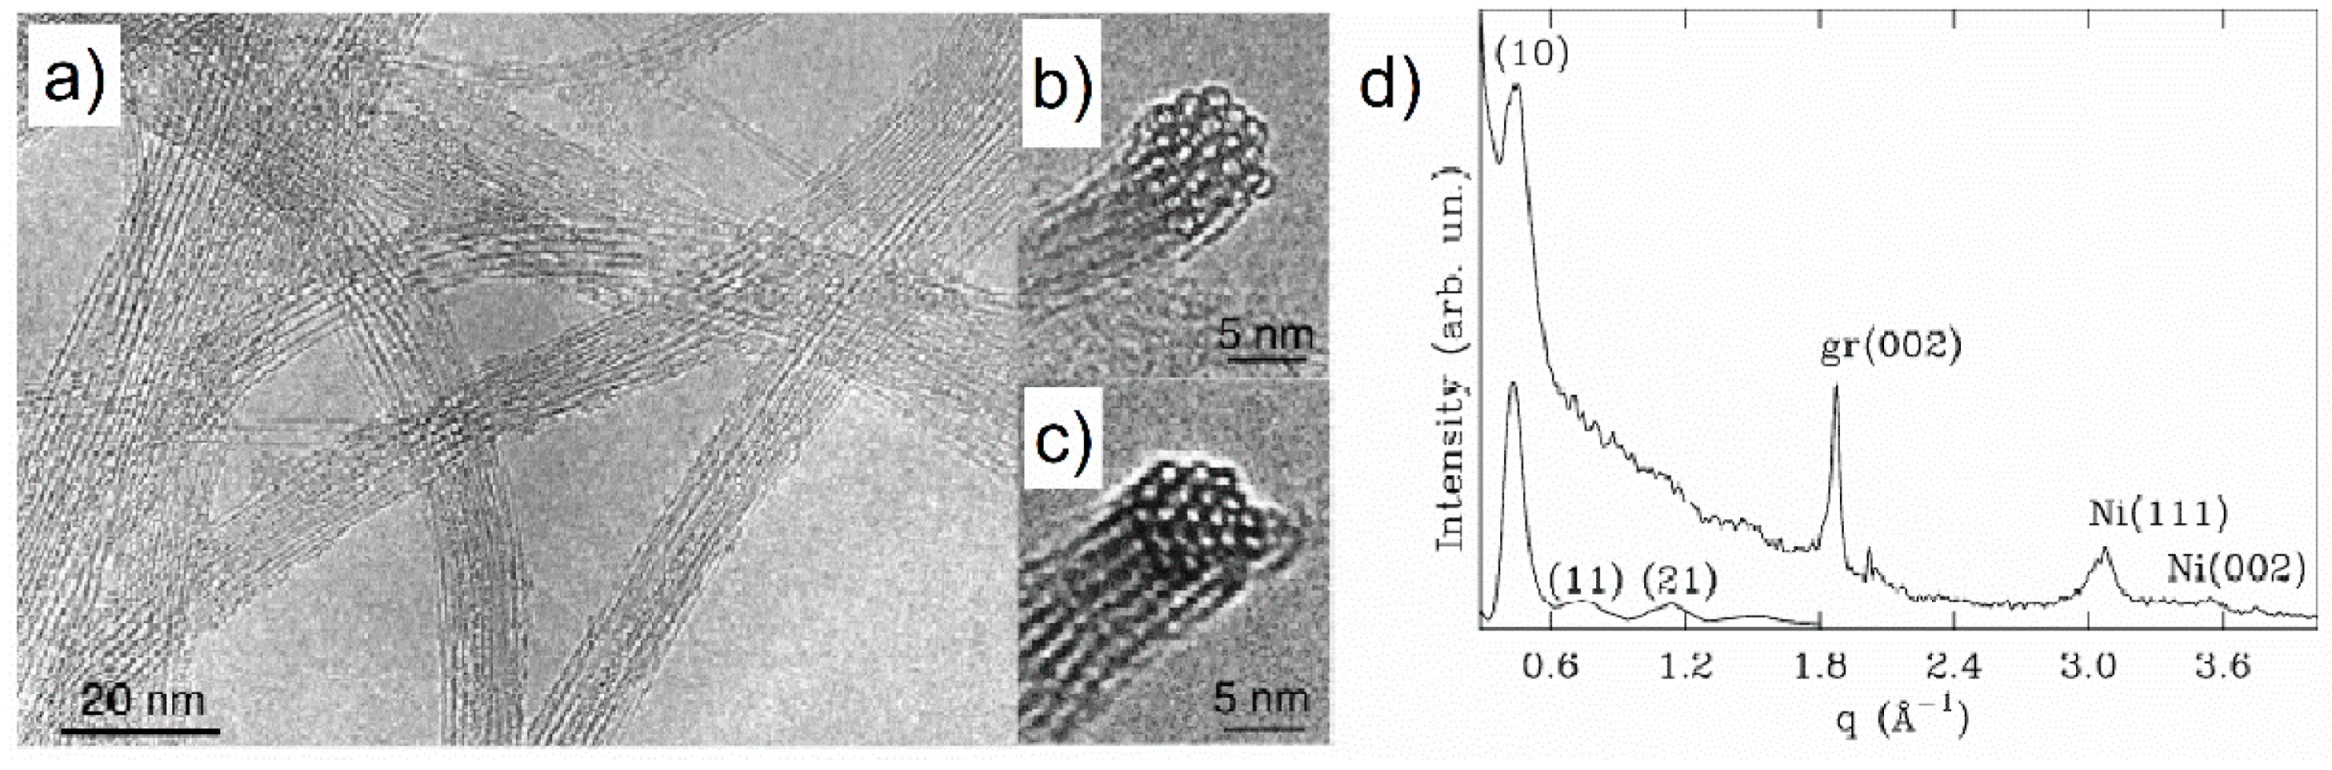
Figure 32.
(a) Structure factors of (5,5), (9,0), (2,8), and (b) (45,45), (81,0), and (21,58) SWCNTs compared with that of a single graphene layer. Reproduced with permission from Koloczek et al. [109]. Copyright Elsevier, 2001.
Figure 32.
(a) Structure factors of (5,5), (9,0), (2,8), and (b) (45,45), (81,0), and (21,58) SWCNTs compared with that of a single graphene layer. Reproduced with permission from Koloczek et al. [109]. Copyright Elsevier, 2001.

Figure 33.
Sequential HRTEM images of the interlayer defects which appear and disappear in DWCNTs recorded at 573 K. In the side wall (a–d), several bridges connecting two graphene layers frequently appear in dark contrast (marked by red arrows) and disappear just after the observation. Also, in the top wall (e–h), pairs of dark and bright contrast often appear and then vanish (marked by red arrows). Reproduced with permission from Urita et al. [116]. Copyright American Physical Society, 2005.
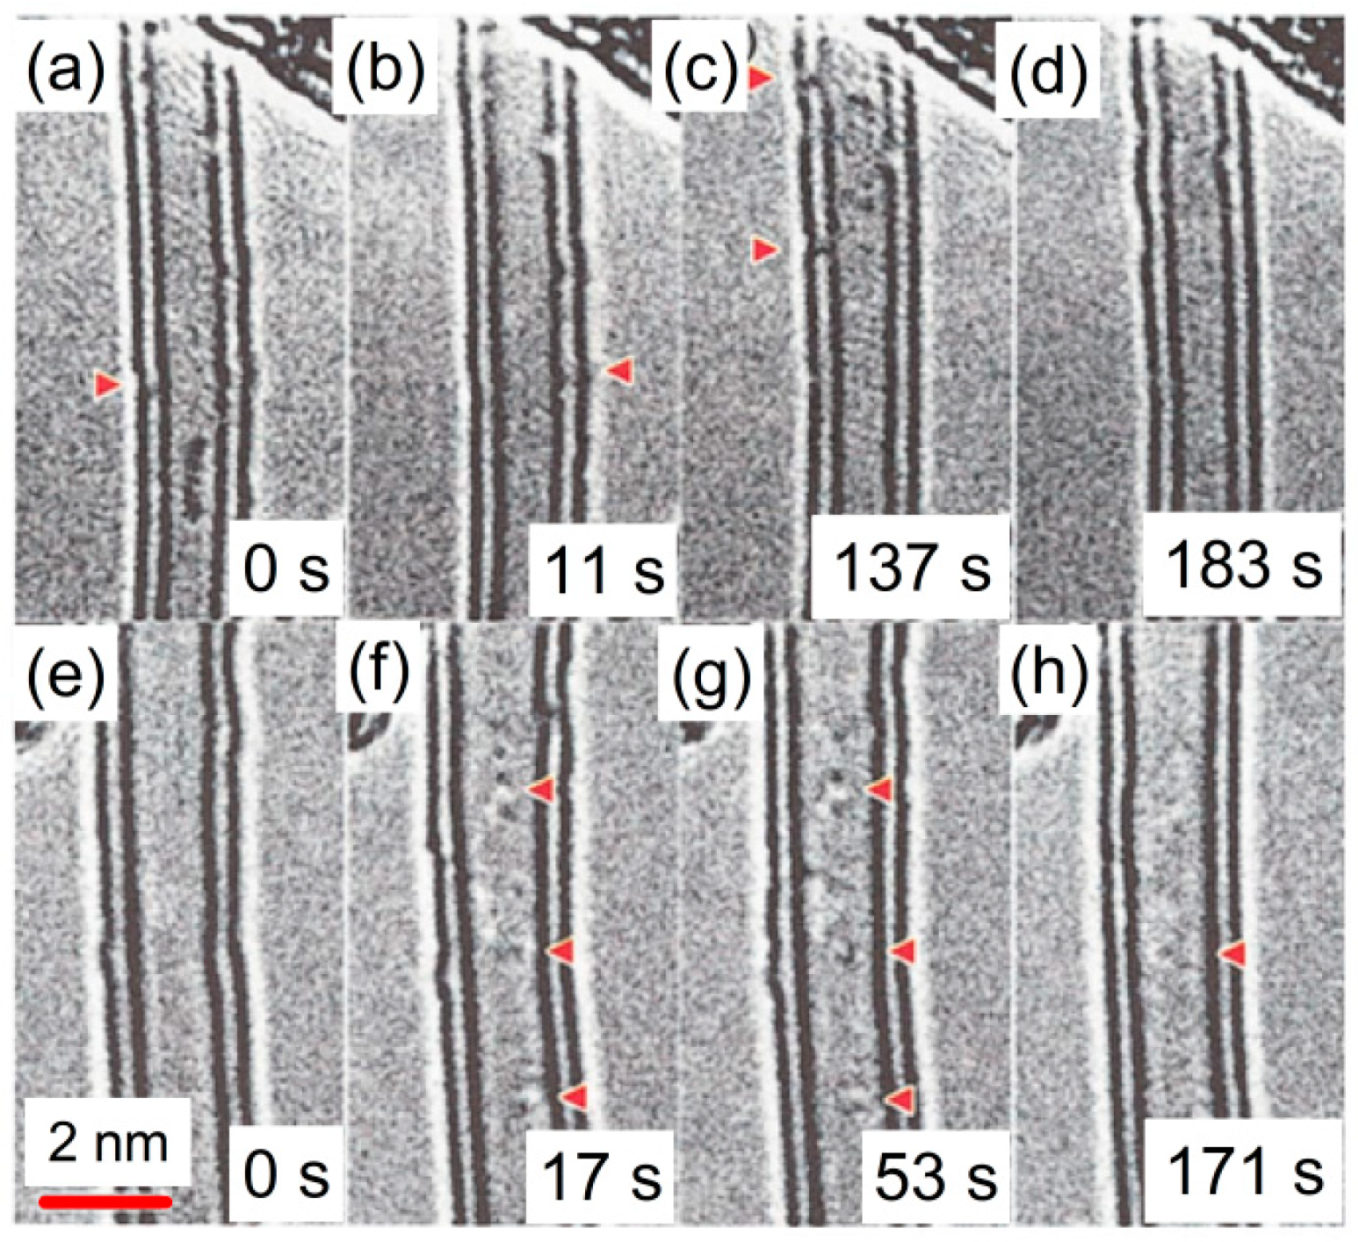
Figure 34.
Electron irradiation of a SWNT at 200 keV: (A) before extensive irradiation and (B) after irradiation to a dose of 0.35 × 10²³ electrons/cm−2. Reproduced with permission from Smith et al. [117]. Copyright American Physical Society, 2001.
Figure 34.
Electron irradiation of a SWNT at 200 keV: (A) before extensive irradiation and (B) after irradiation to a dose of 0.35 × 10²³ electrons/cm−2. Reproduced with permission from Smith et al. [117]. Copyright American Physical Society, 2001.
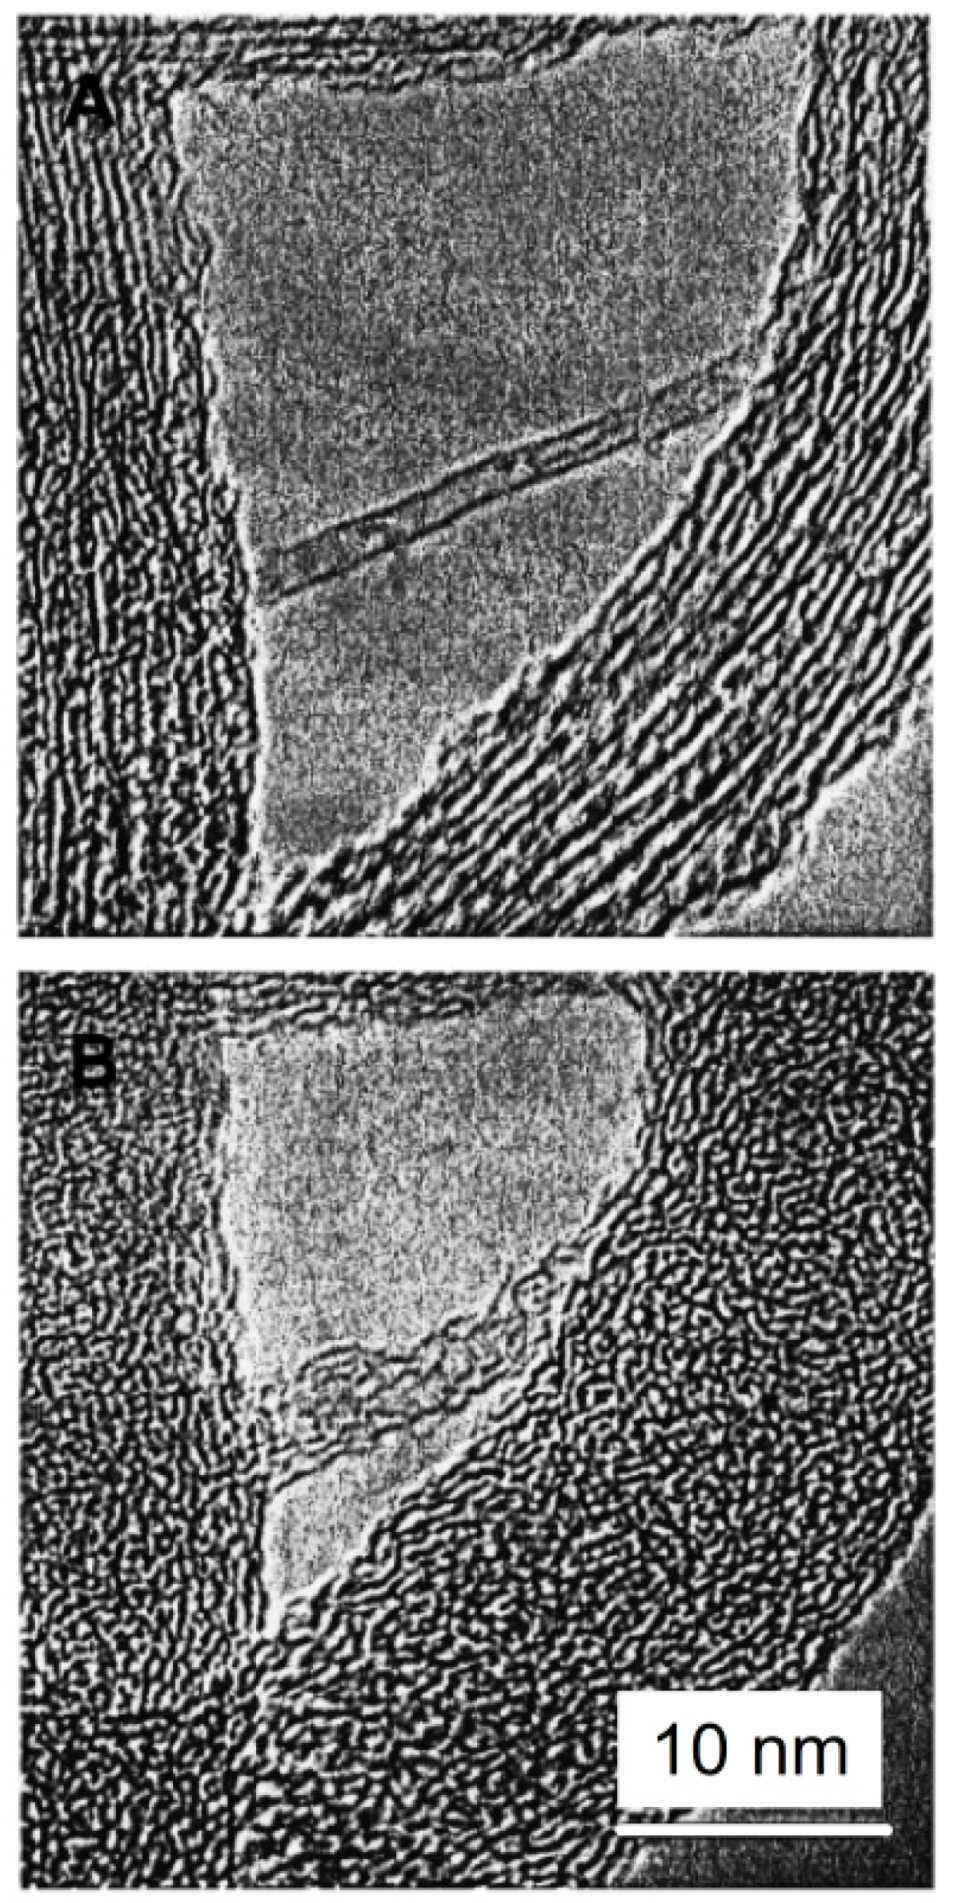
Figure 35.
(a) Comparison of the structure factors for the sample A (MWCNTs obtained by template deposition), the sample B and C (catalytic DWCNTs and MWCNTs), and the sample D (MWCNTs obtained by arc discharge). (b) The pair distribution functions computed from the data shown on (a). Reproduced with permission from Hawelek et al. [119]. Copyright Elsevier, 2012.

Figure 36.
Visualization of the structural model with di-vacancies defects for graphene flakes obtained by chemical exfoliation of graphite. The visible defects are indicated by grey non-hexagonal rings. Reproduced with permission from Woznica et al. [24]. Copyright International Union of Crystallography, 2015.

Figure 37.
Set of HRTEM image (top left), simulation (bottom left), and schematic model (right) for (a) (3,3)@(12,3) DWCNTs, (b) (4,3)@(9,8) DWCNTs, and (c) (4,4)@(9,9) DWCNTs. Scale bar, 1 nm. Reproduced with permission from Guan et al. [125]. Copyright American Chemical Society, 2008.
Figure 37.
Set of HRTEM image (top left), simulation (bottom left), and schematic model (right) for (a) (3,3)@(12,3) DWCNTs, (b) (4,3)@(9,8) DWCNTs, and (c) (4,4)@(9,9) DWCNTs. Scale bar, 1 nm. Reproduced with permission from Guan et al. [125]. Copyright American Chemical Society, 2008.

Figure 38.
In situ observation of a topological defect induced in a graphene layer. (a) HRTEM images of a single graphene layer with a topological defect before and (b) after electron irradiation. An edge dislocation is unambiguously visible at the middle of the network where one zig-zag chain is missing through it. The missing zig-zag chain is shown schematically in the bottom part of each panel. (c) An atomistic model of the pentagon–heptagon pair in the graphitic network. (d) A simulated HRTEM image shows a good comparison with the HRTEM image shown in (b). Reproduced with permission from Hashimoto et al. [128]. Copyright Nature, 2004.

Figure 39.
Active topological defects observed by in situ HRTEM. (a–h) Sequential HRTEM images of an SWNT layer. Heptagons or higher-membered rings (red), hexagons (green), and pentagons or smaller rings (blue) of carbon atoms tend to gather around the kink structure during observations. Reproduced with permission from Suenaga et al. [116]. Copyright Nature, 2007.

Figure 40.
Imaging and spectroscopy of graphene edge. (a) ADF STEM image of a single graphene layer at the edge region. No image-processing has been done. Atomic positions are marked by circles in a smoothed image (b). Green, blue, and red spectra correspond to the normal sp2 carbon atom, a double-coordinated atom, and a single-coordinated atom, respectively. These different states of atomic coordination are marked by coloured arrows in (a,b) and illustrated in (c). (d) Electron energy loss spectroscopy (EELS) of carbon K (1s) spectra taken at the colour-coded atoms indicated in (b). Reproduced with permission from Suenaga et al. [132]. Copyright Nature, 2010.

Figure 41.
(a) TEM and (b) HRTEM micrographs of nanodiamonds. Reproduced with permission from Pawlyta [139]. Copyright International OSCSCO World Press, 2013.
Figure 41.
(a) TEM and (b) HRTEM micrographs of nanodiamonds. Reproduced with permission from Pawlyta [139]. Copyright International OSCSCO World Press, 2013.

Figure 42.
BF STEM images showing a twinned detonation nanodiamond particle after a few seconds of observation (left panel) and after ~1 min exposure to the electron beam (right panel). Reproduced with permission from Iakoubowski et al. [141]. Copyright AIP Publishing, 2008.
Figure 42.
BF STEM images showing a twinned detonation nanodiamond particle after a few seconds of observation (left panel) and after ~1 min exposure to the electron beam (right panel). Reproduced with permission from Iakoubowski et al. [141]. Copyright AIP Publishing, 2008.
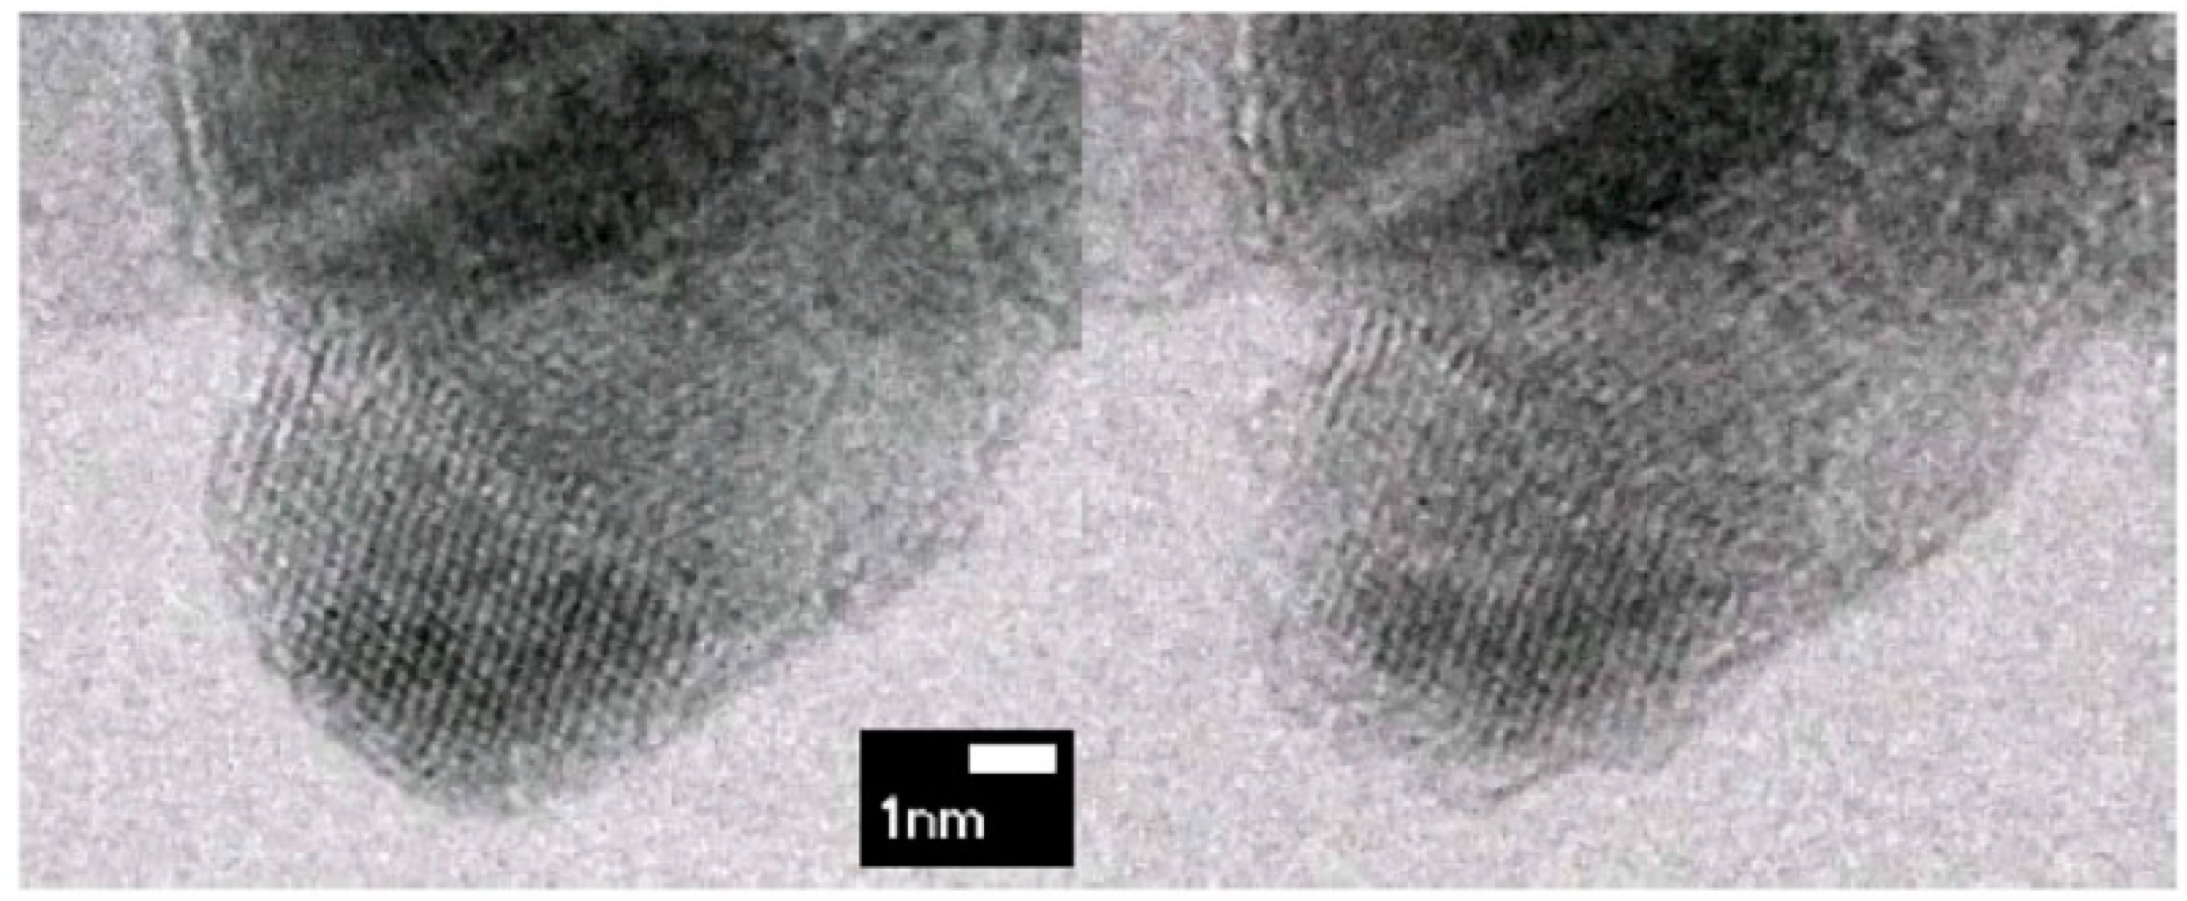
Figure 43.
(a) Spherical and (b) truncated octahedron models of an explosive nanodiamond particle. The graphitic fragments are shown as black balls. Reproduced with permission from Hawelek et al. [144]. Copyright AIP Publishing, 2008.
Figure 43.
(a) Spherical and (b) truncated octahedron models of an explosive nanodiamond particle. The graphitic fragments are shown as black balls. Reproduced with permission from Hawelek et al. [144]. Copyright AIP Publishing, 2008.

Figure 44.
Bond length and valence length distribution for model of the nanodiamond shown in Figure 43b. Part 1, 2, 3, and 4 refers to the inner, middle, and outer regions of the model. Reproduced with permission from Hawelek et al. [144]. Copyright AIP Publishing, 2008.

Figure 45.
The diffraction intensities together with the TEM images for (a) pristine diamond nanoparticles, (b) the nanoparticles after heat-treatment at 1400 °C, (c) at 1700 °C, and (d) at 2000 °C. Reproduced with permission from Tomita et al. [148]. Copyright AIP Publishing, 2002.
Figure 45.
The diffraction intensities together with the TEM images for (a) pristine diamond nanoparticles, (b) the nanoparticles after heat-treatment at 1400 °C, (c) at 1700 °C, and (d) at 2000 °C. Reproduced with permission from Tomita et al. [148]. Copyright AIP Publishing, 2002.
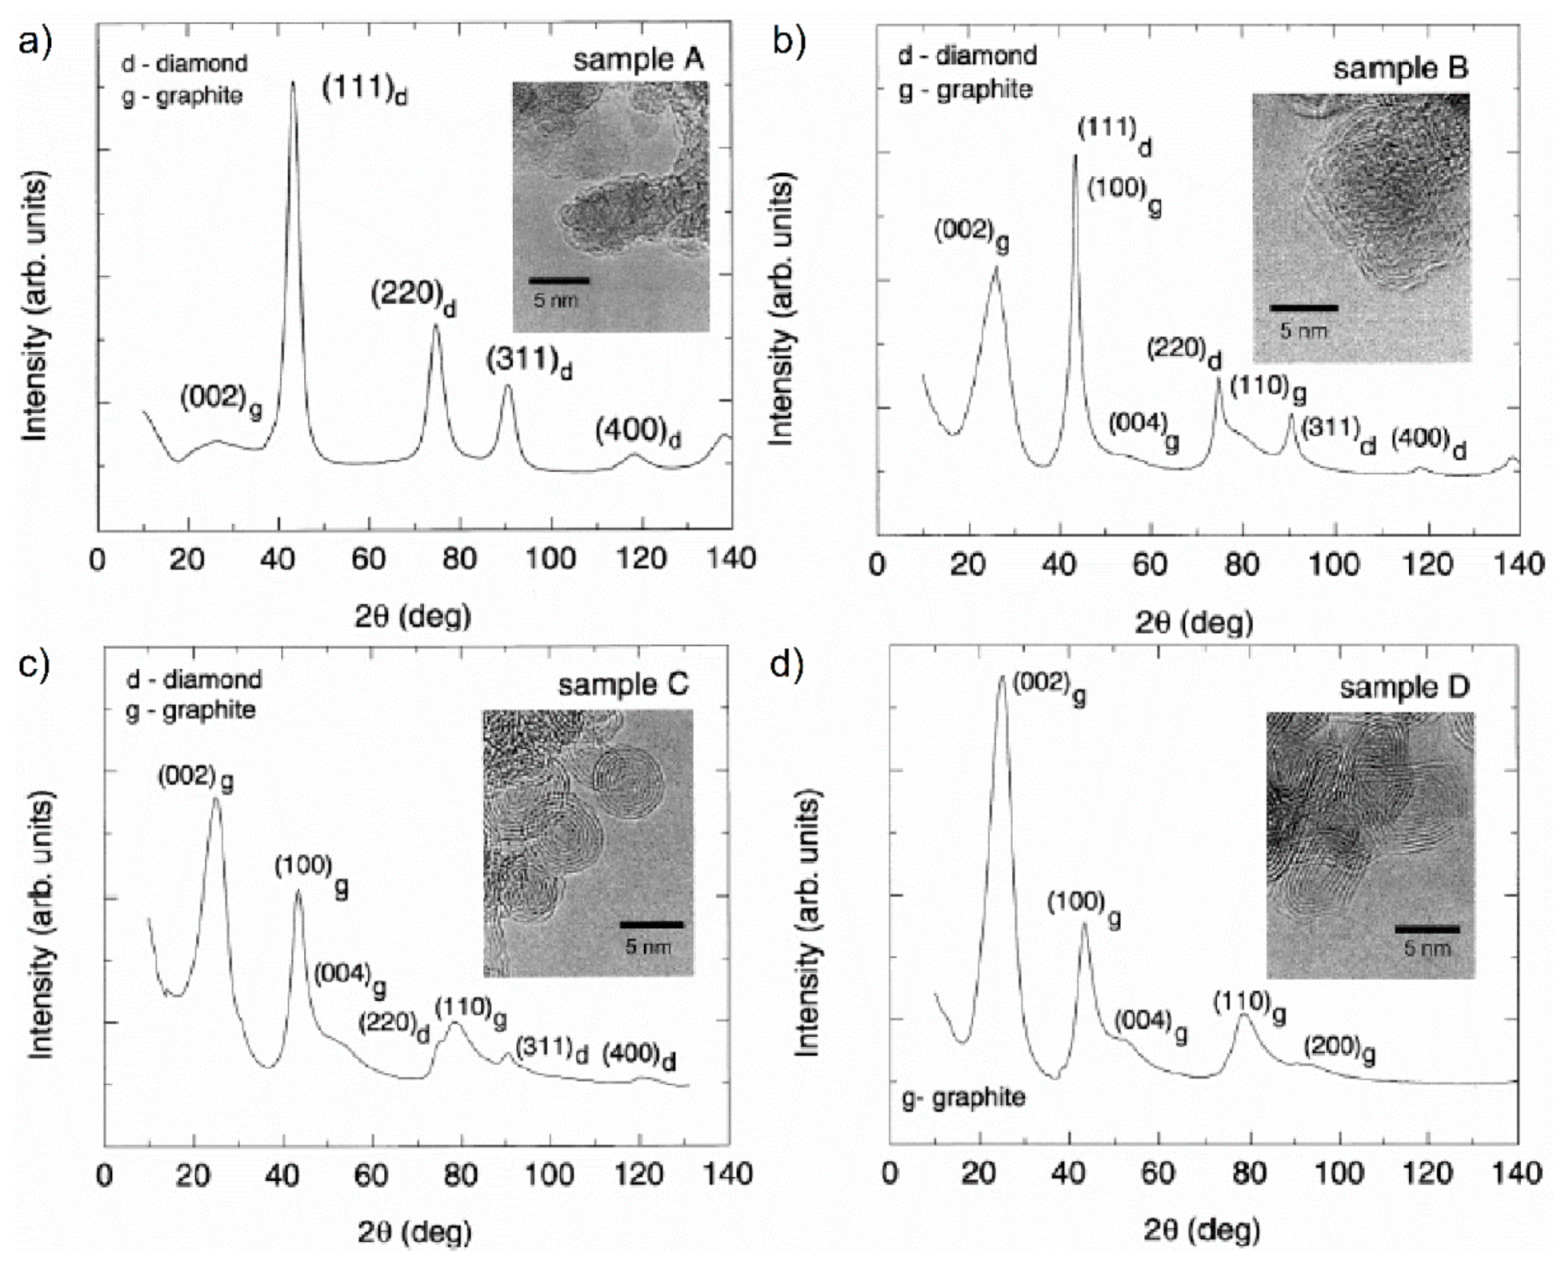

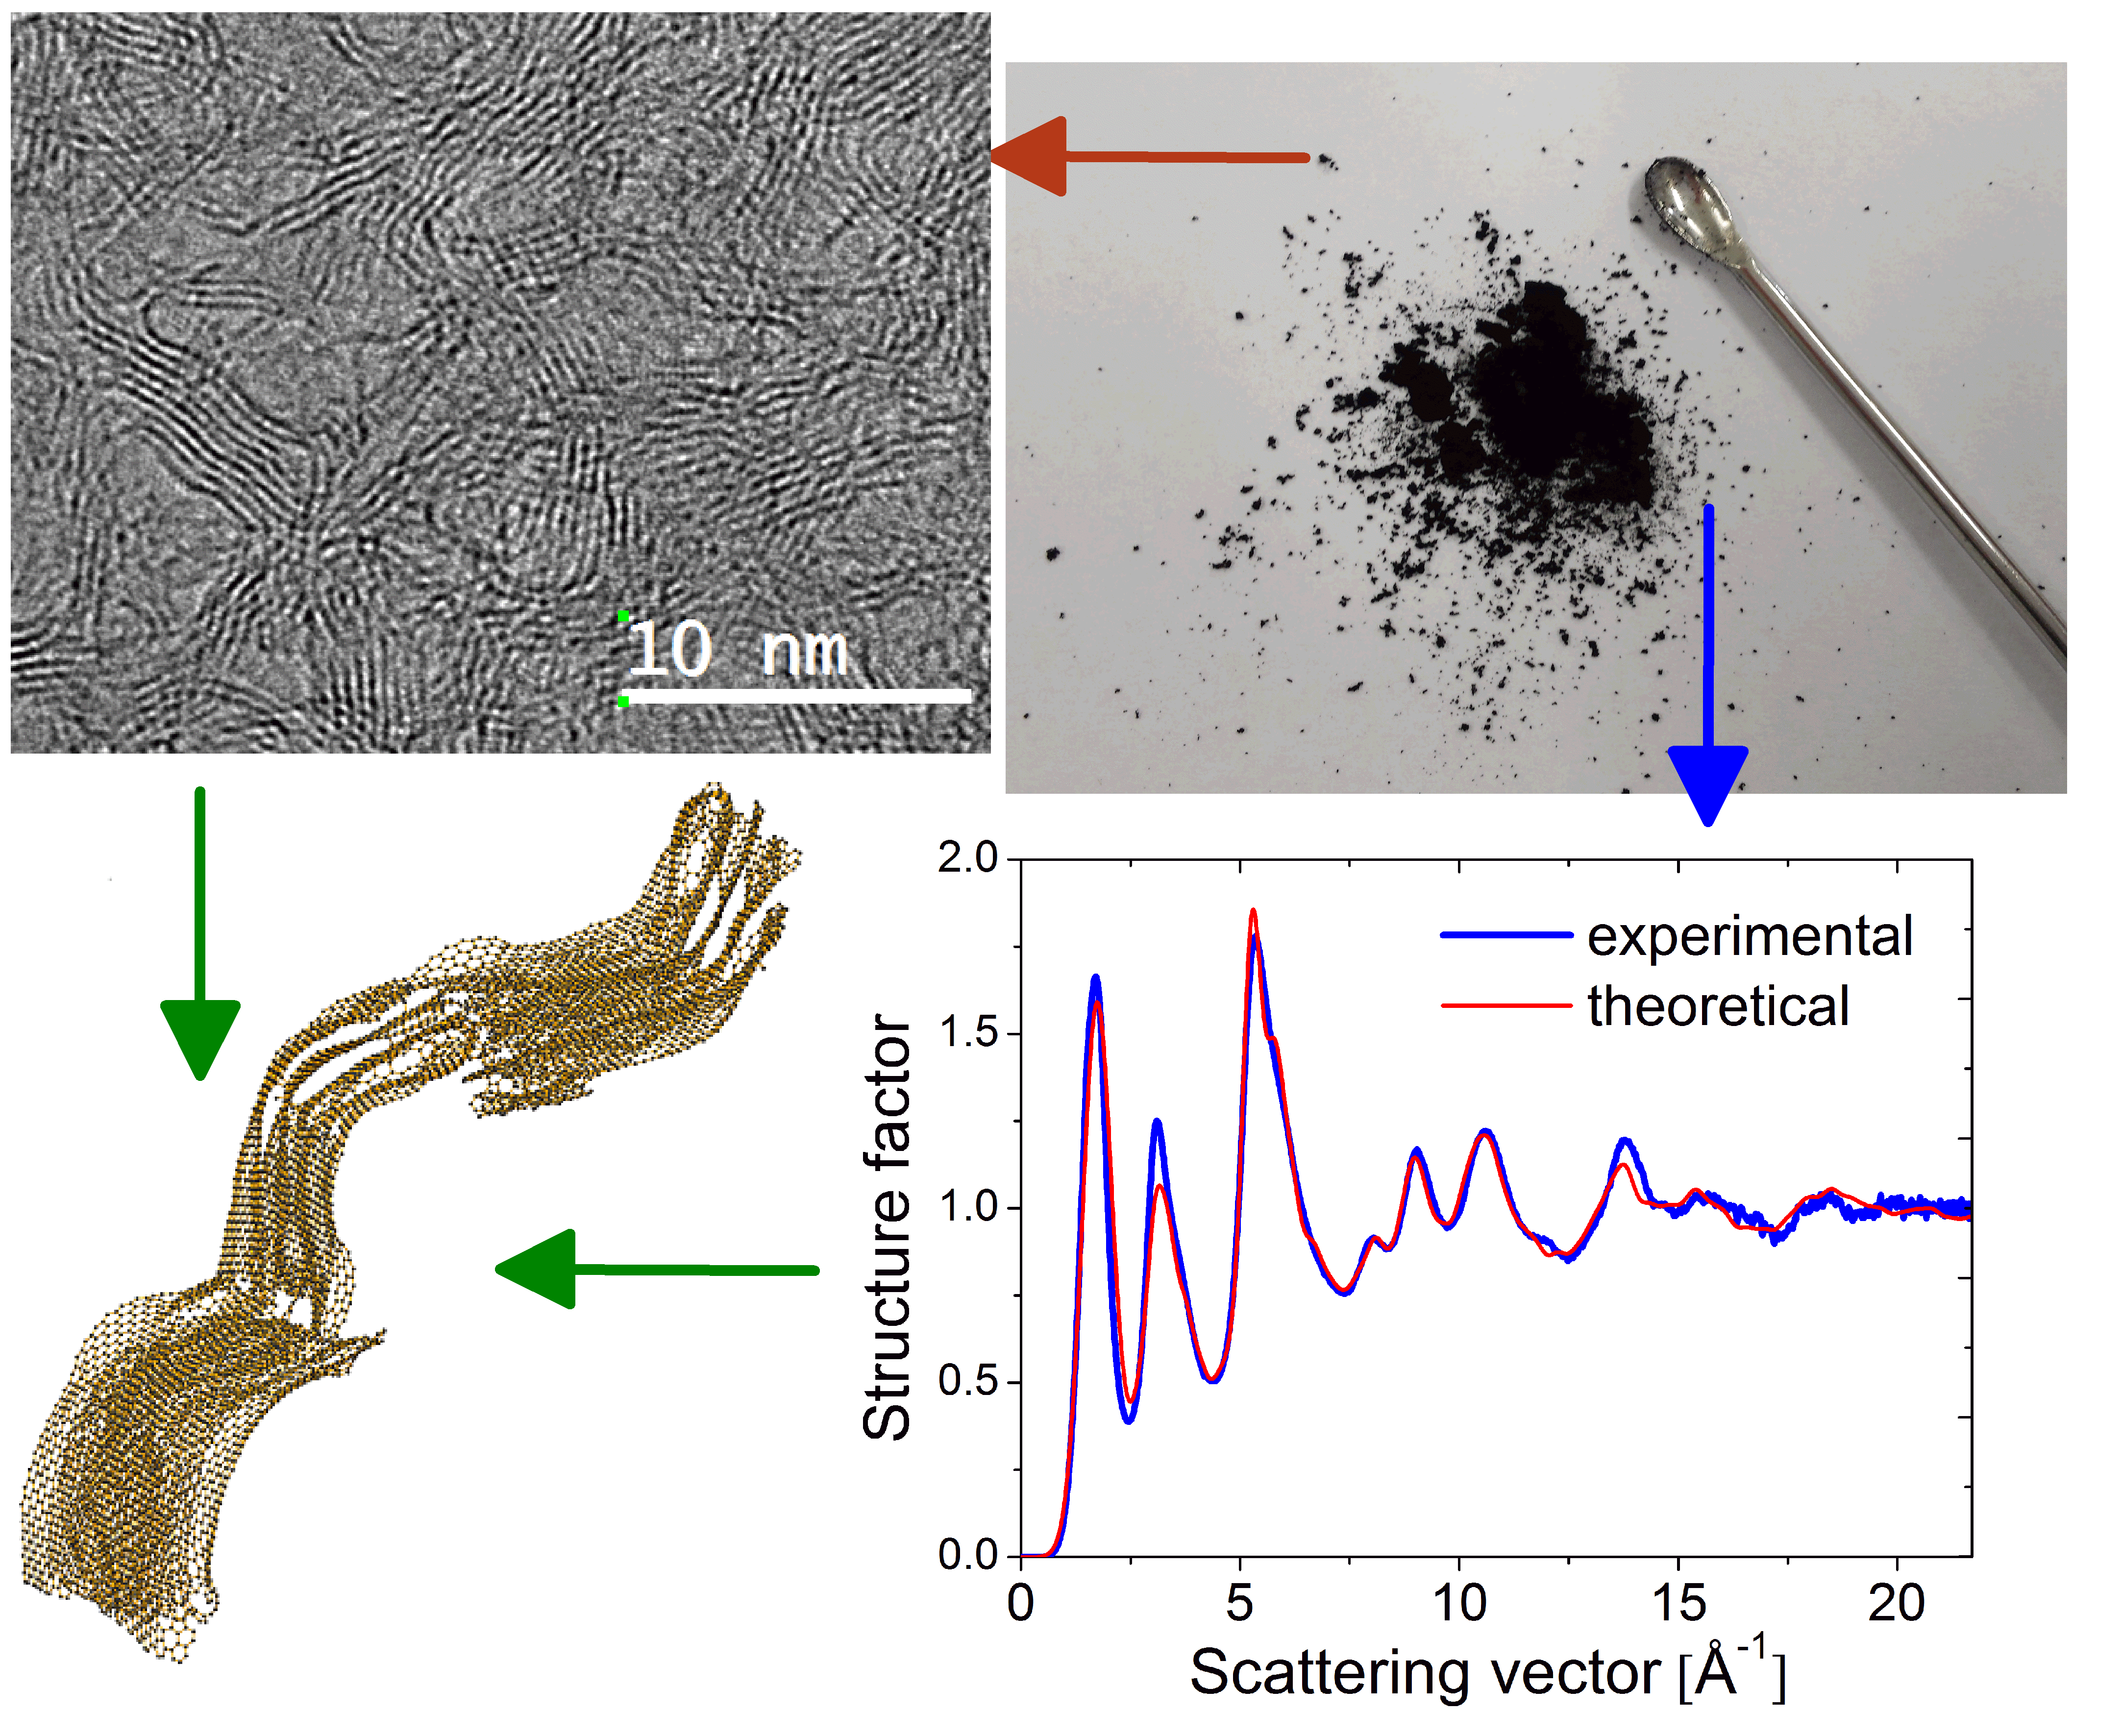
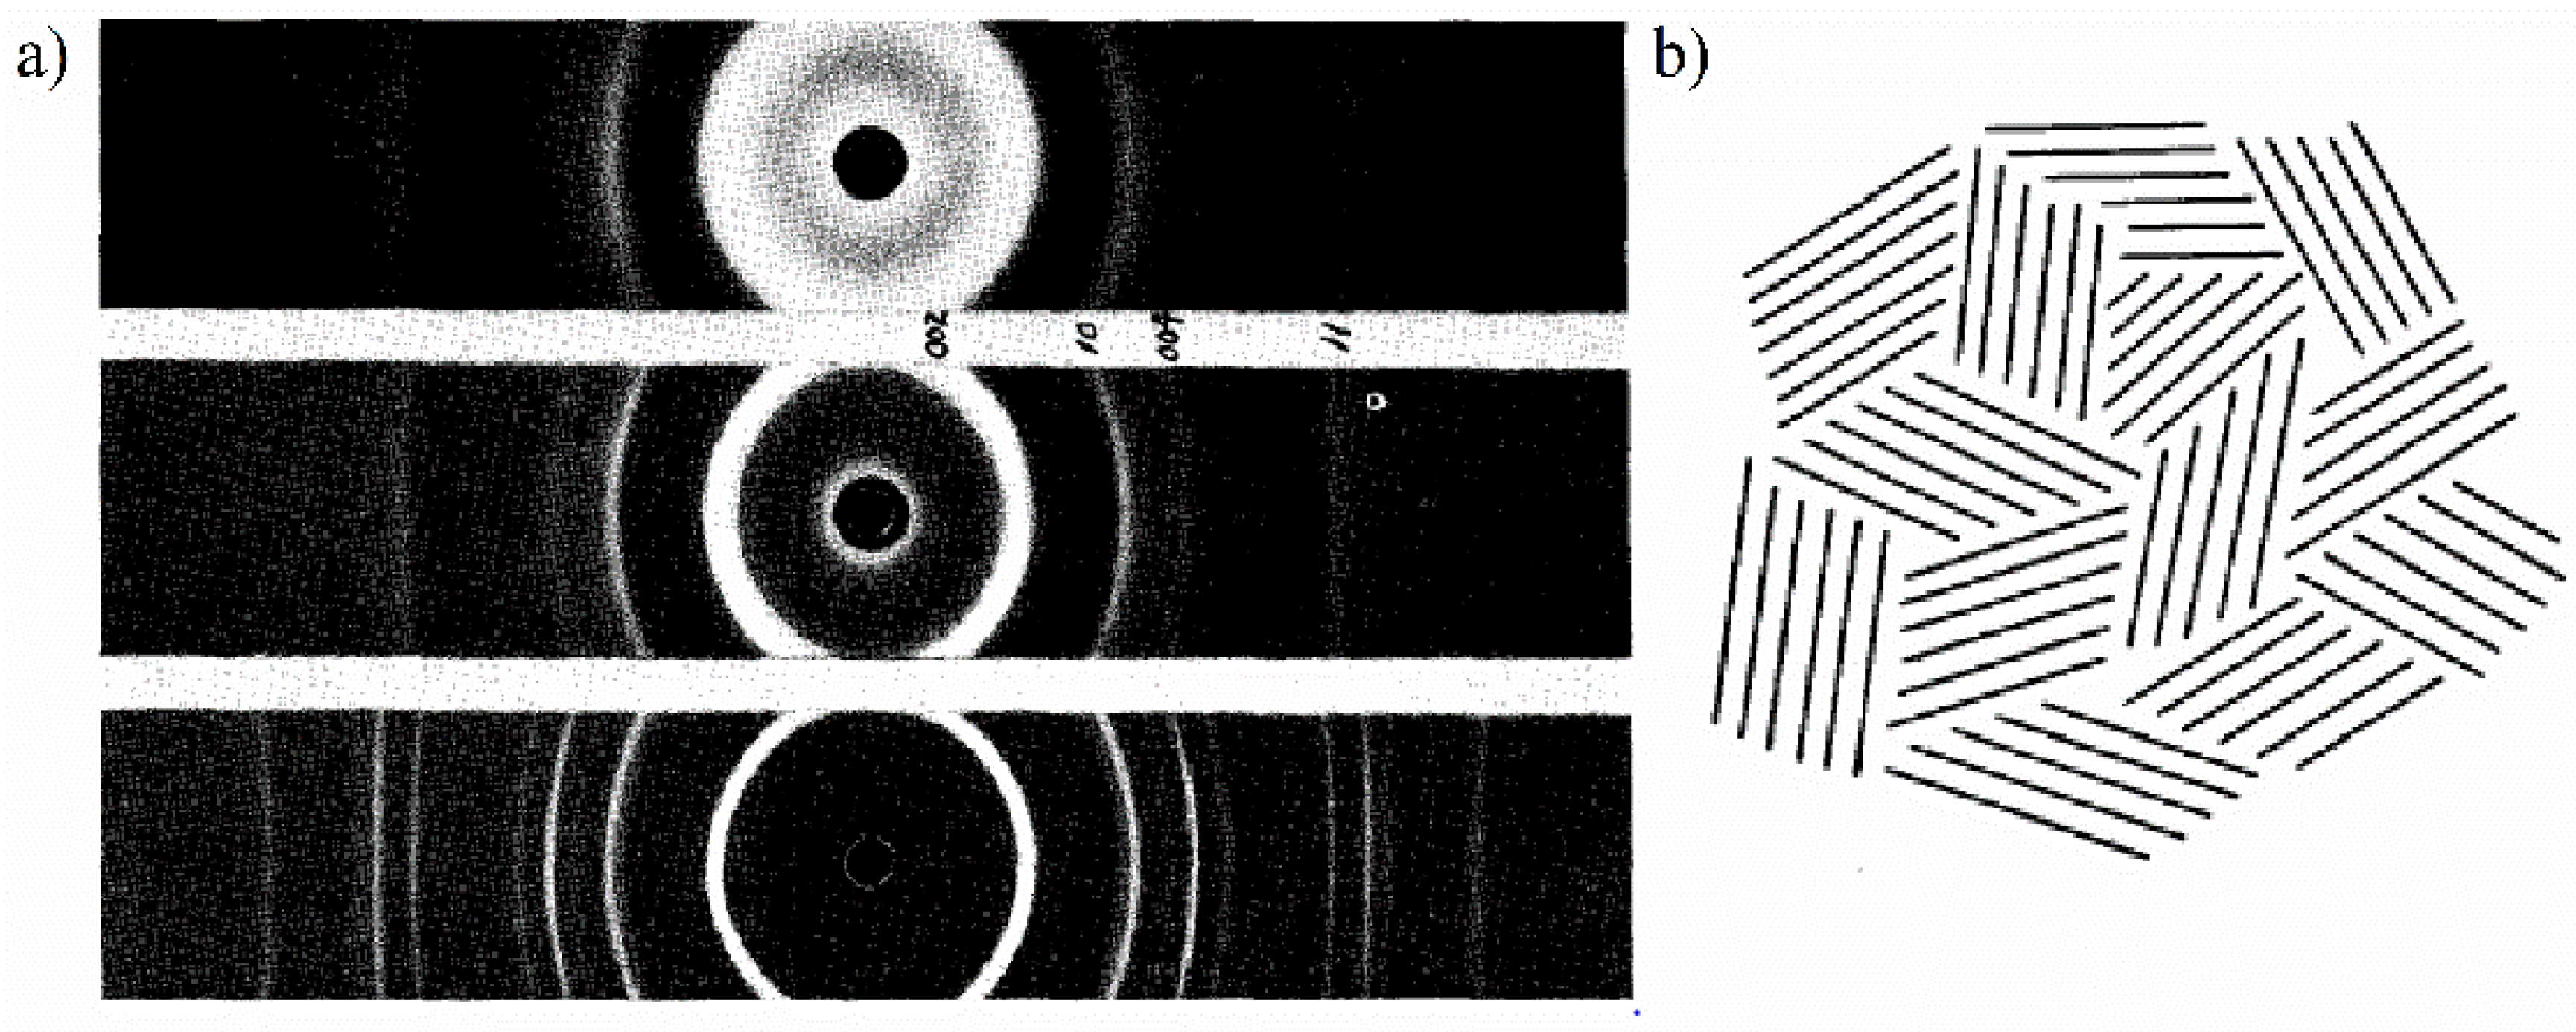
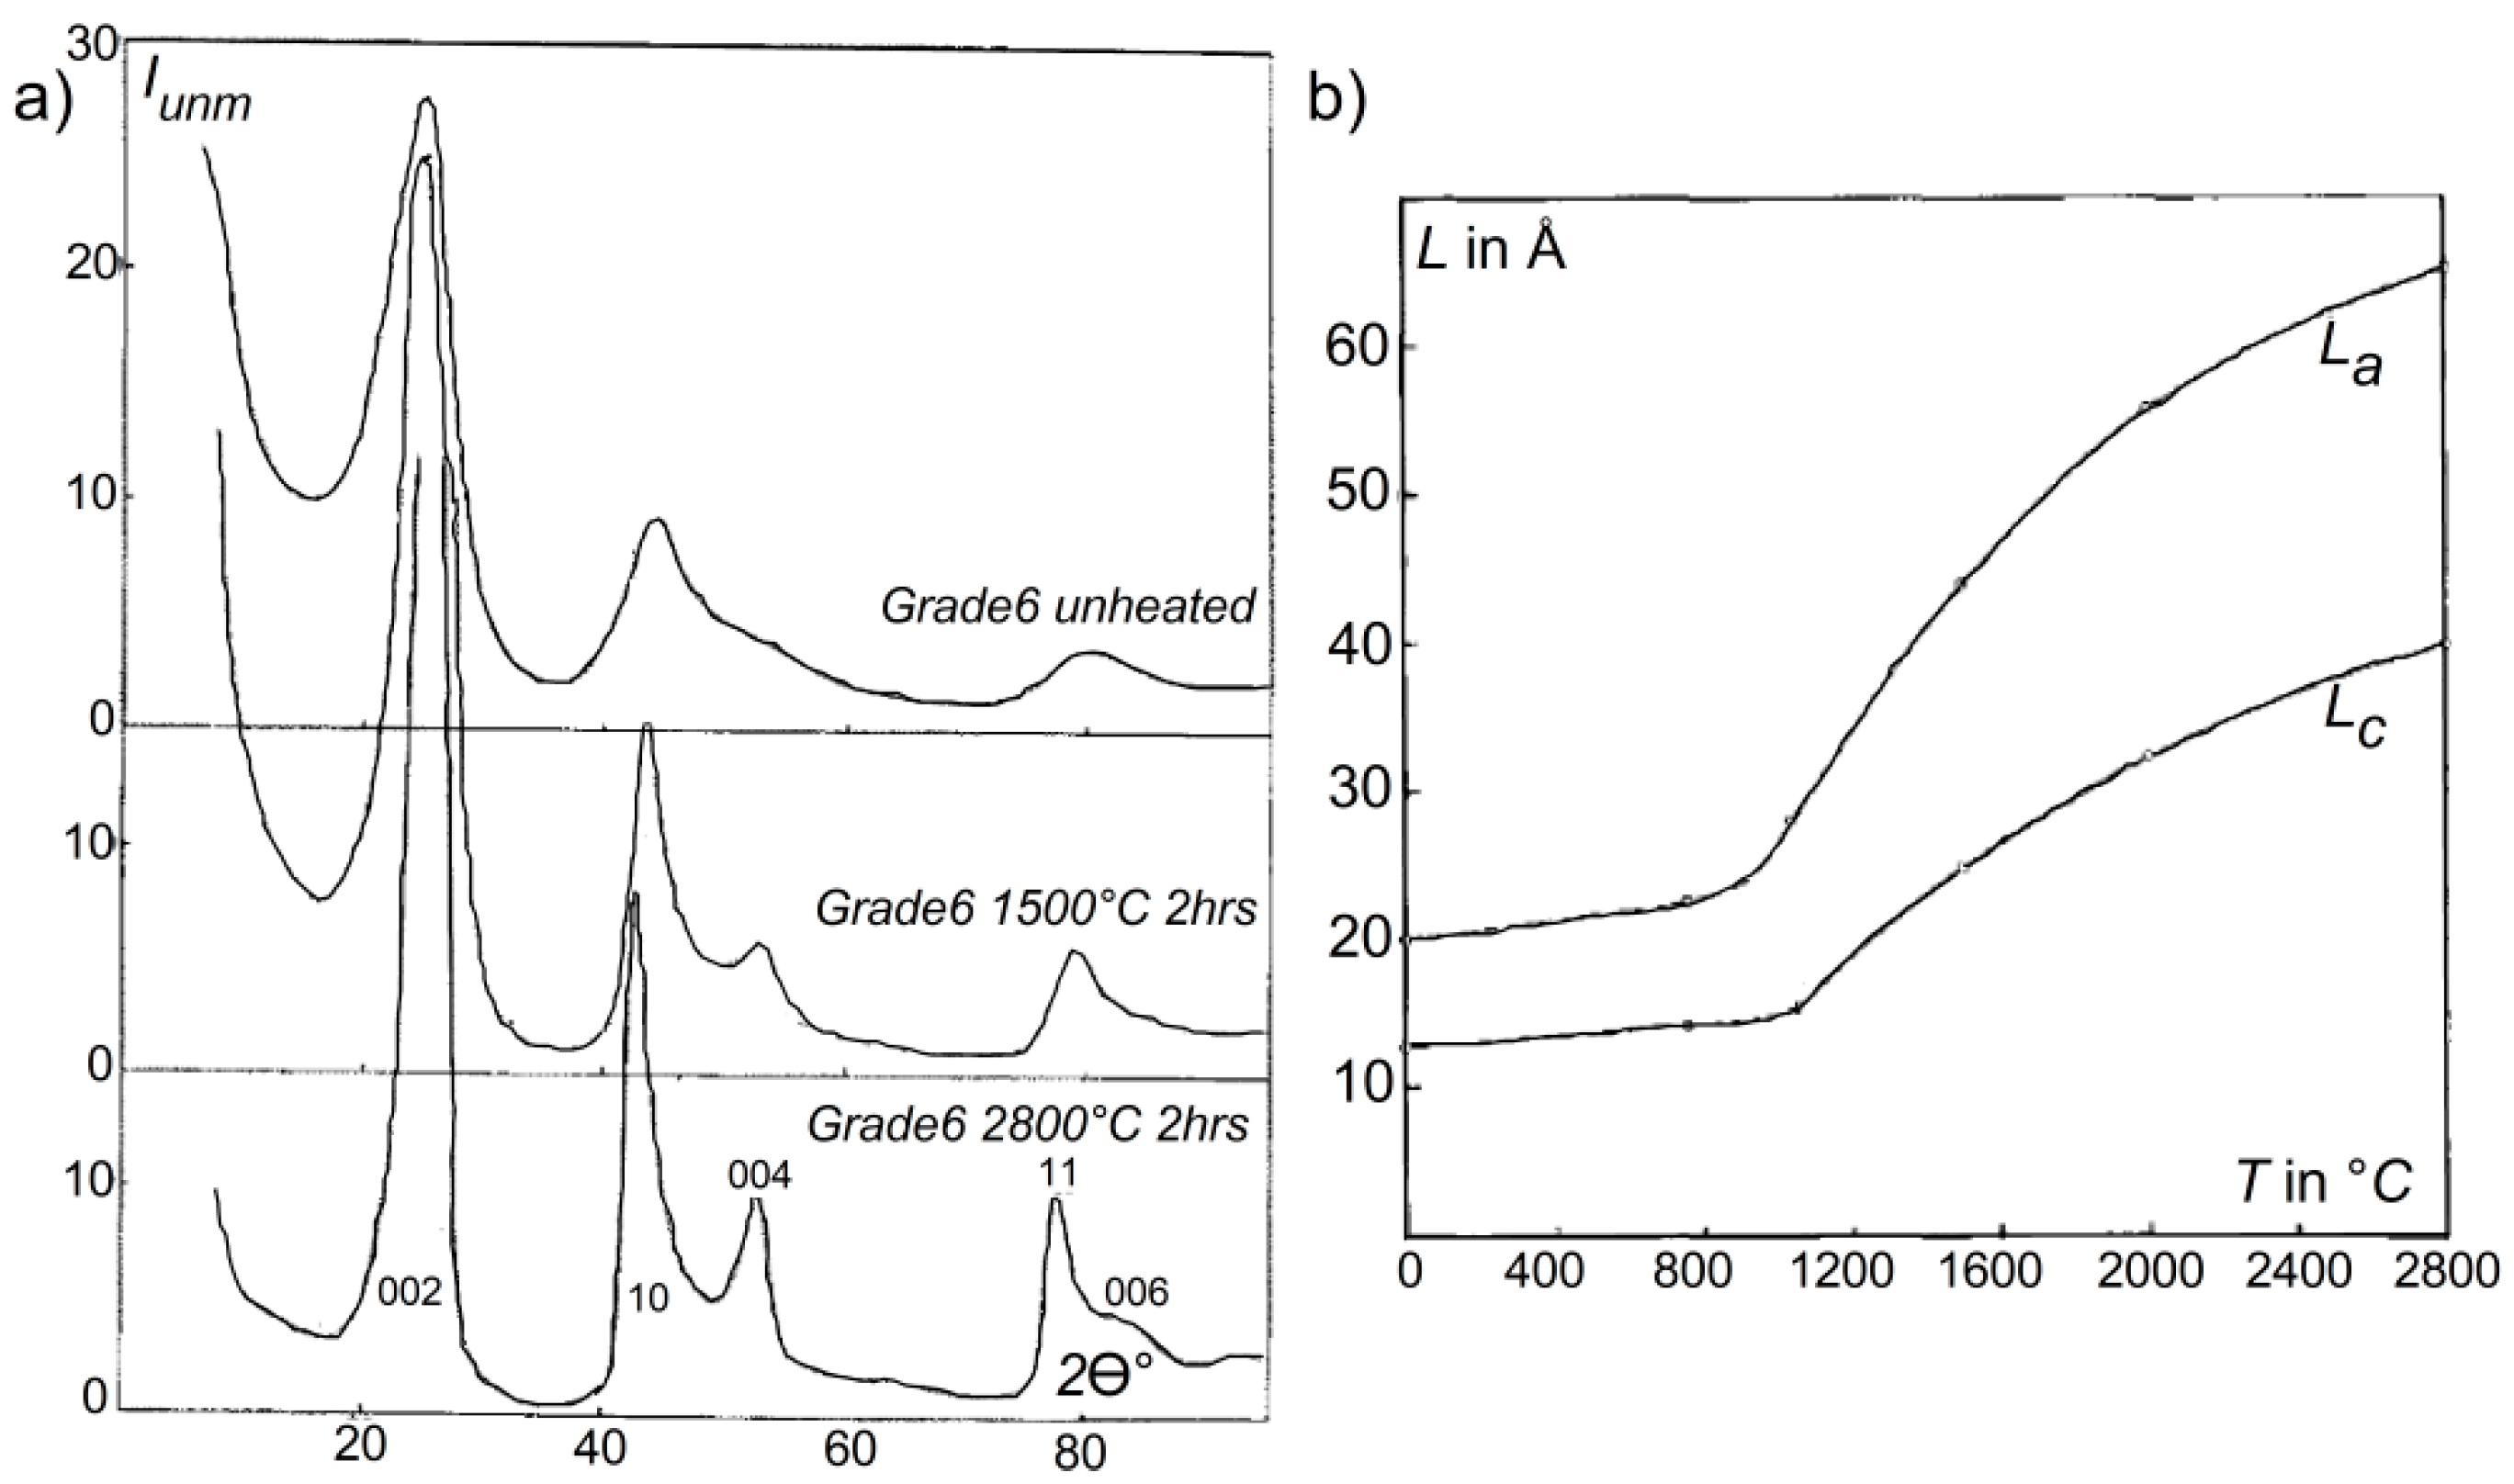
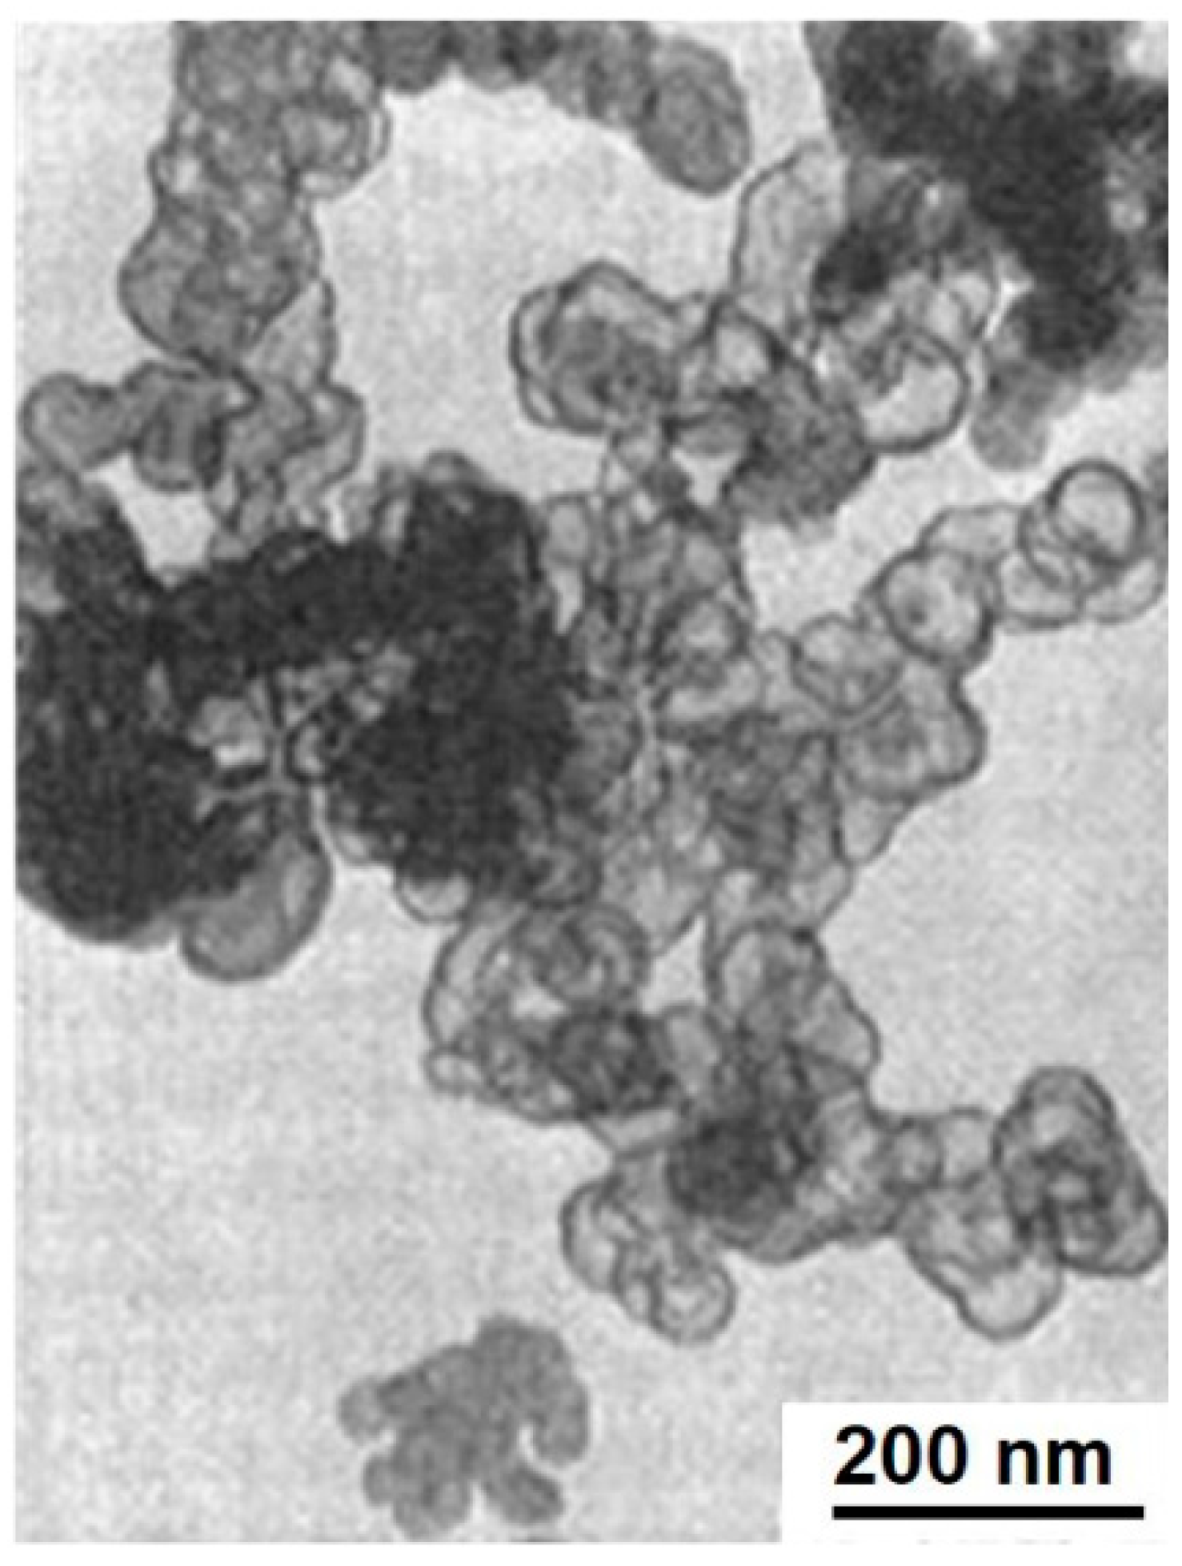
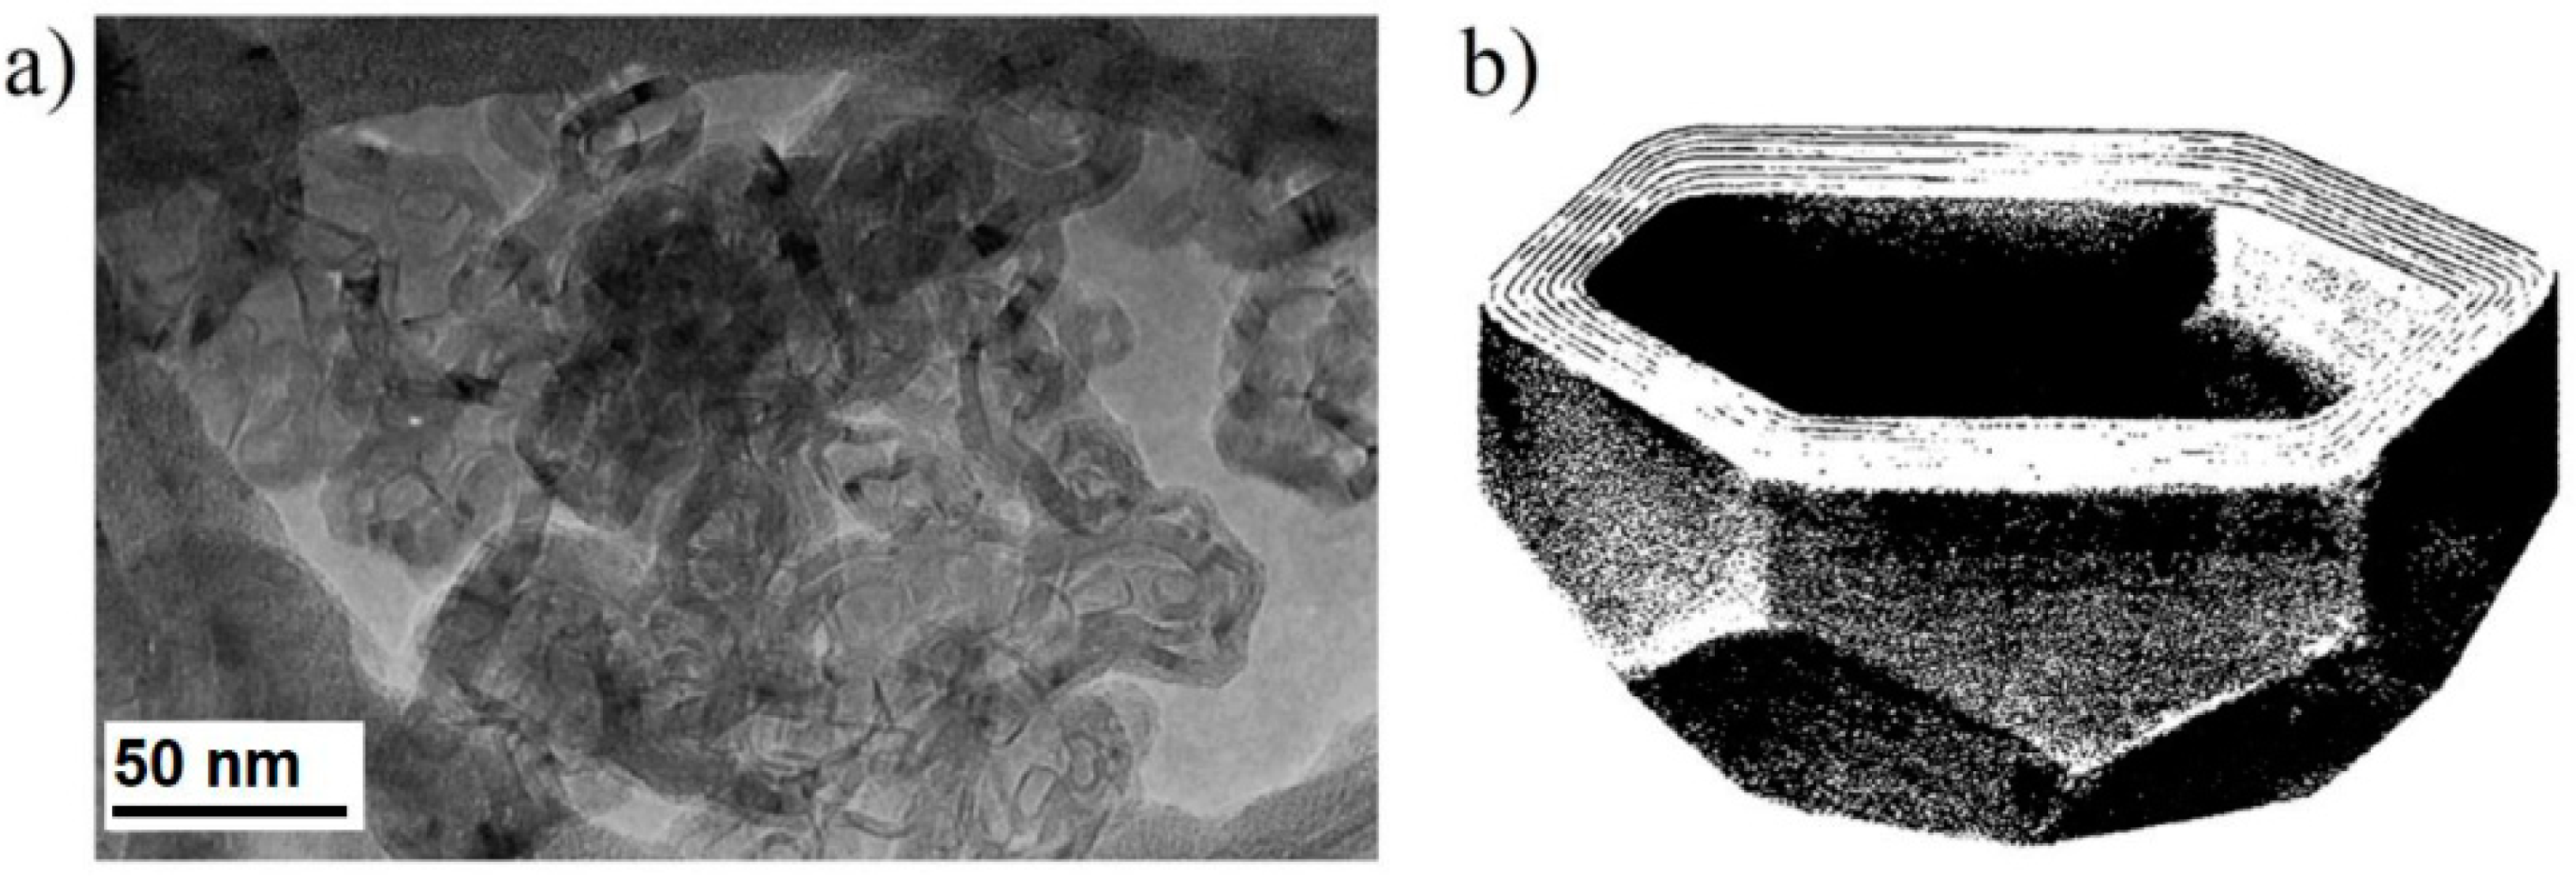
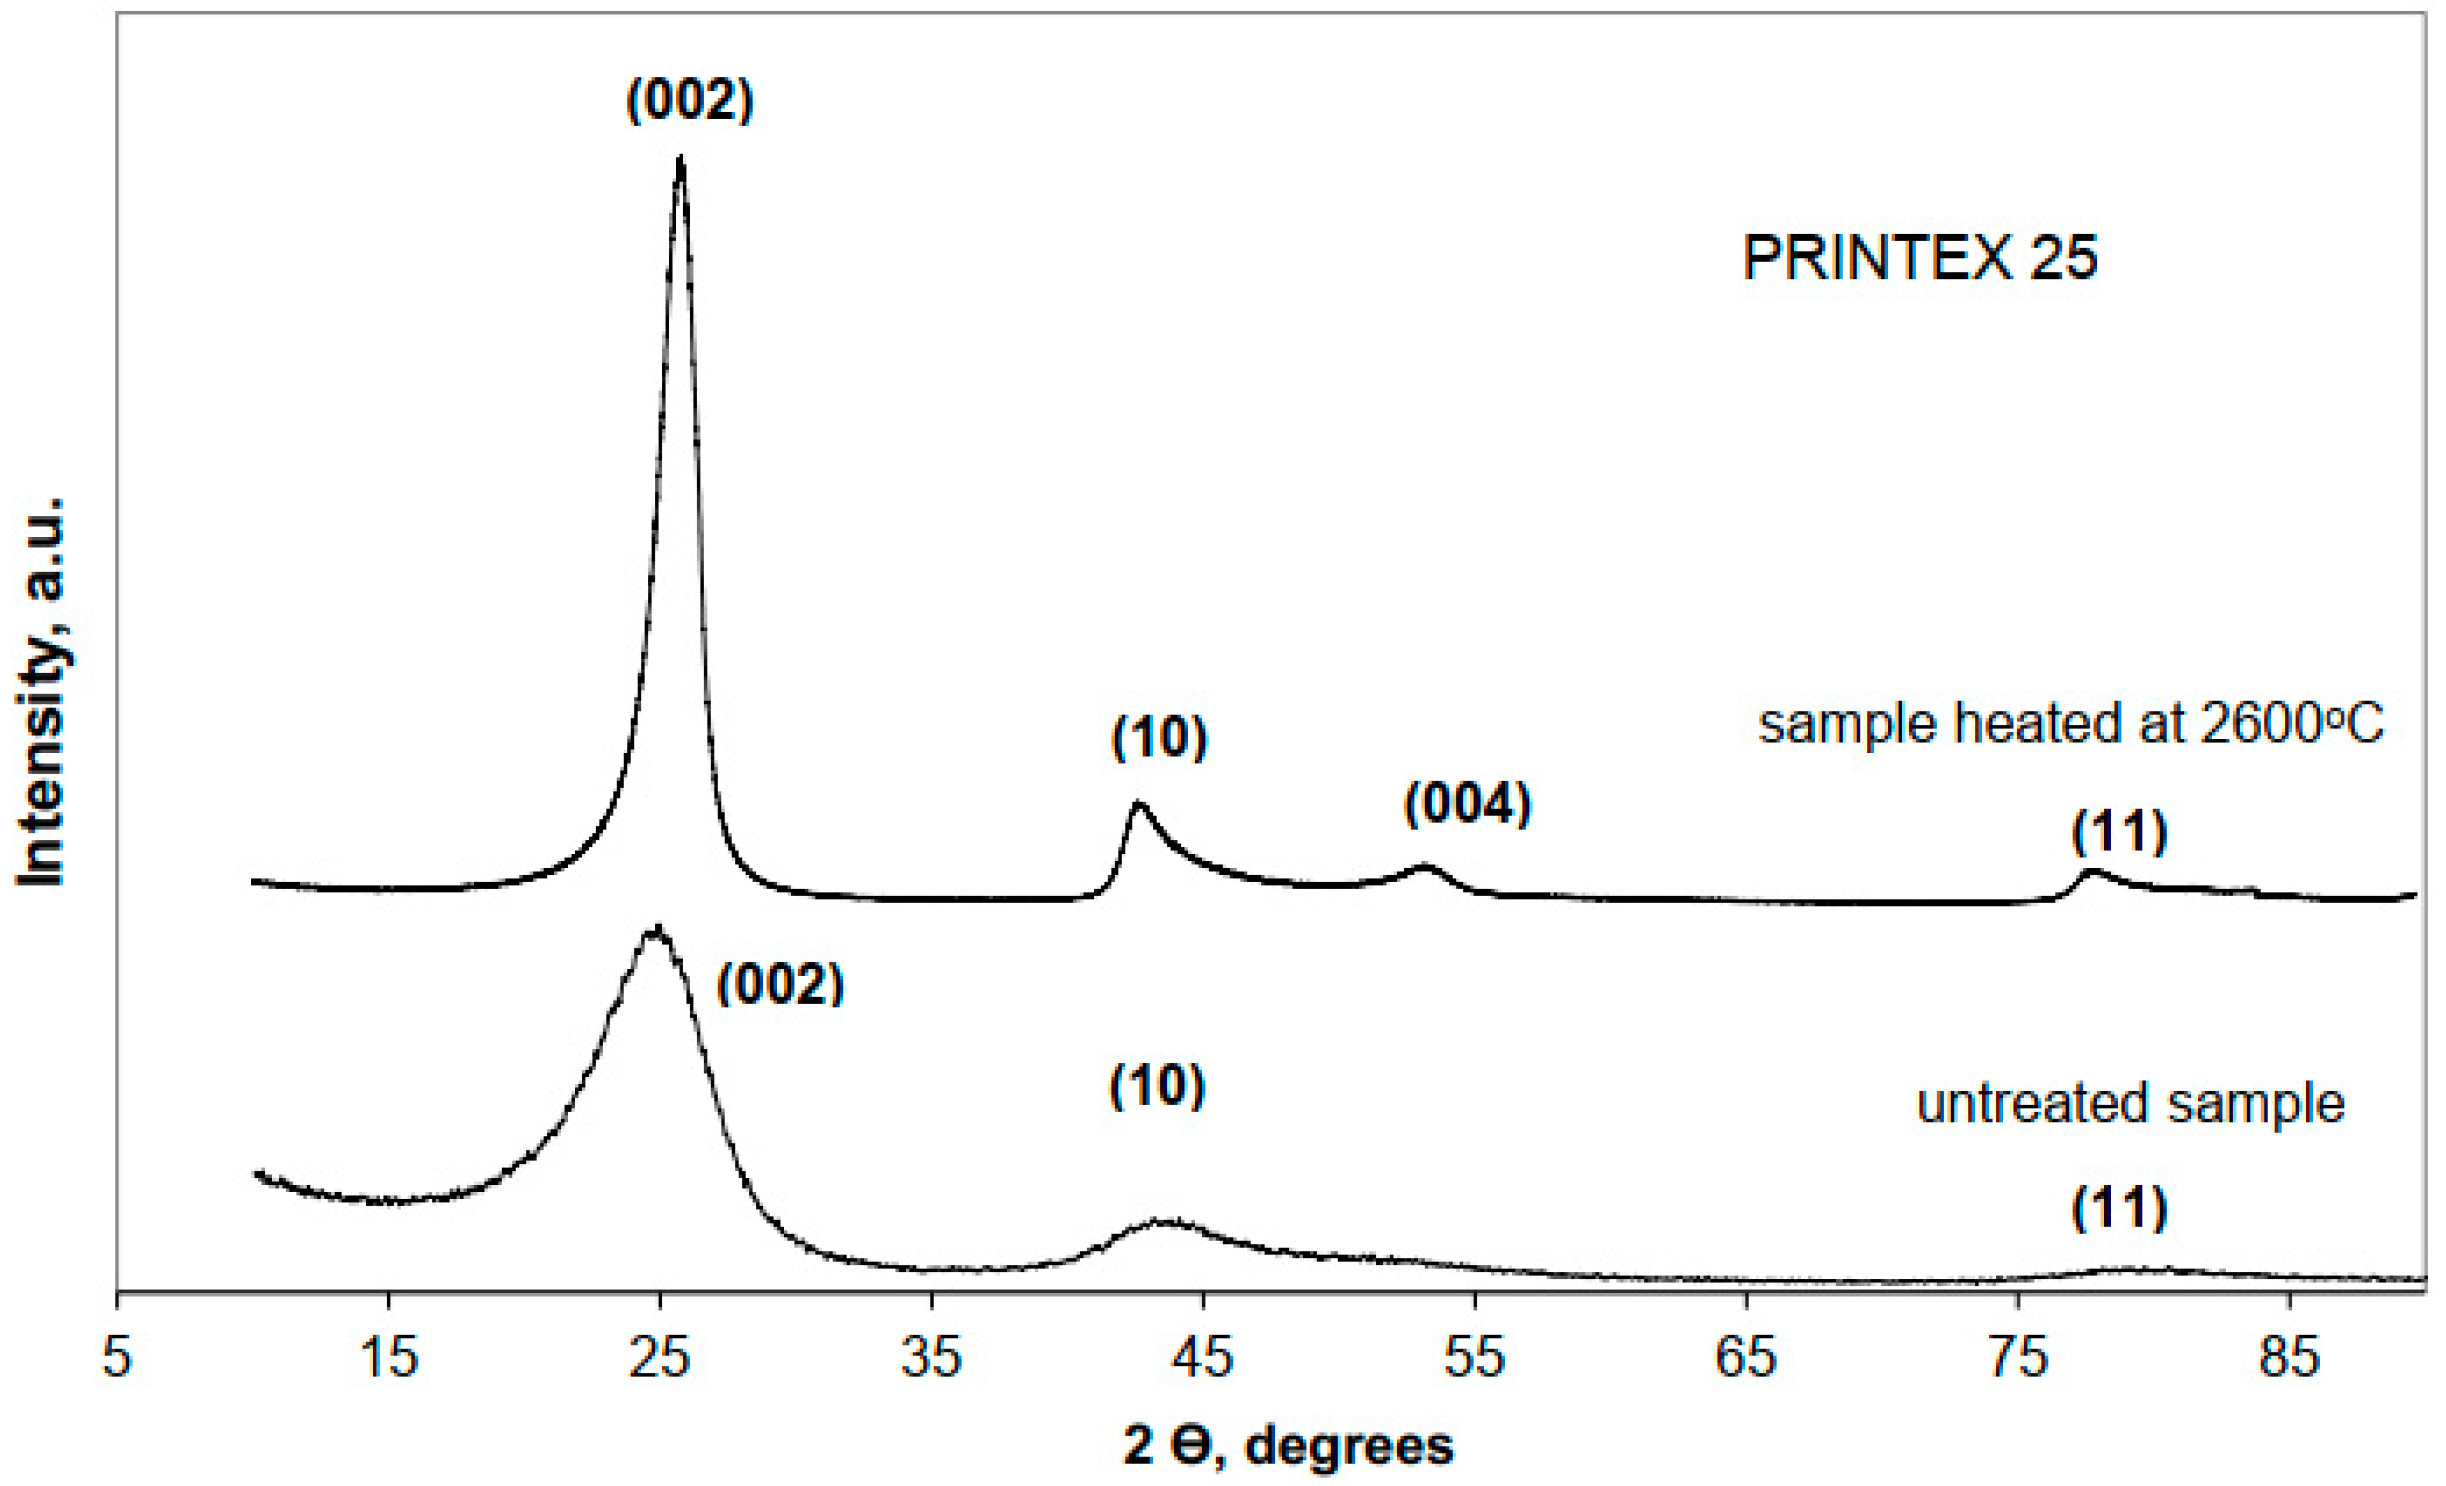
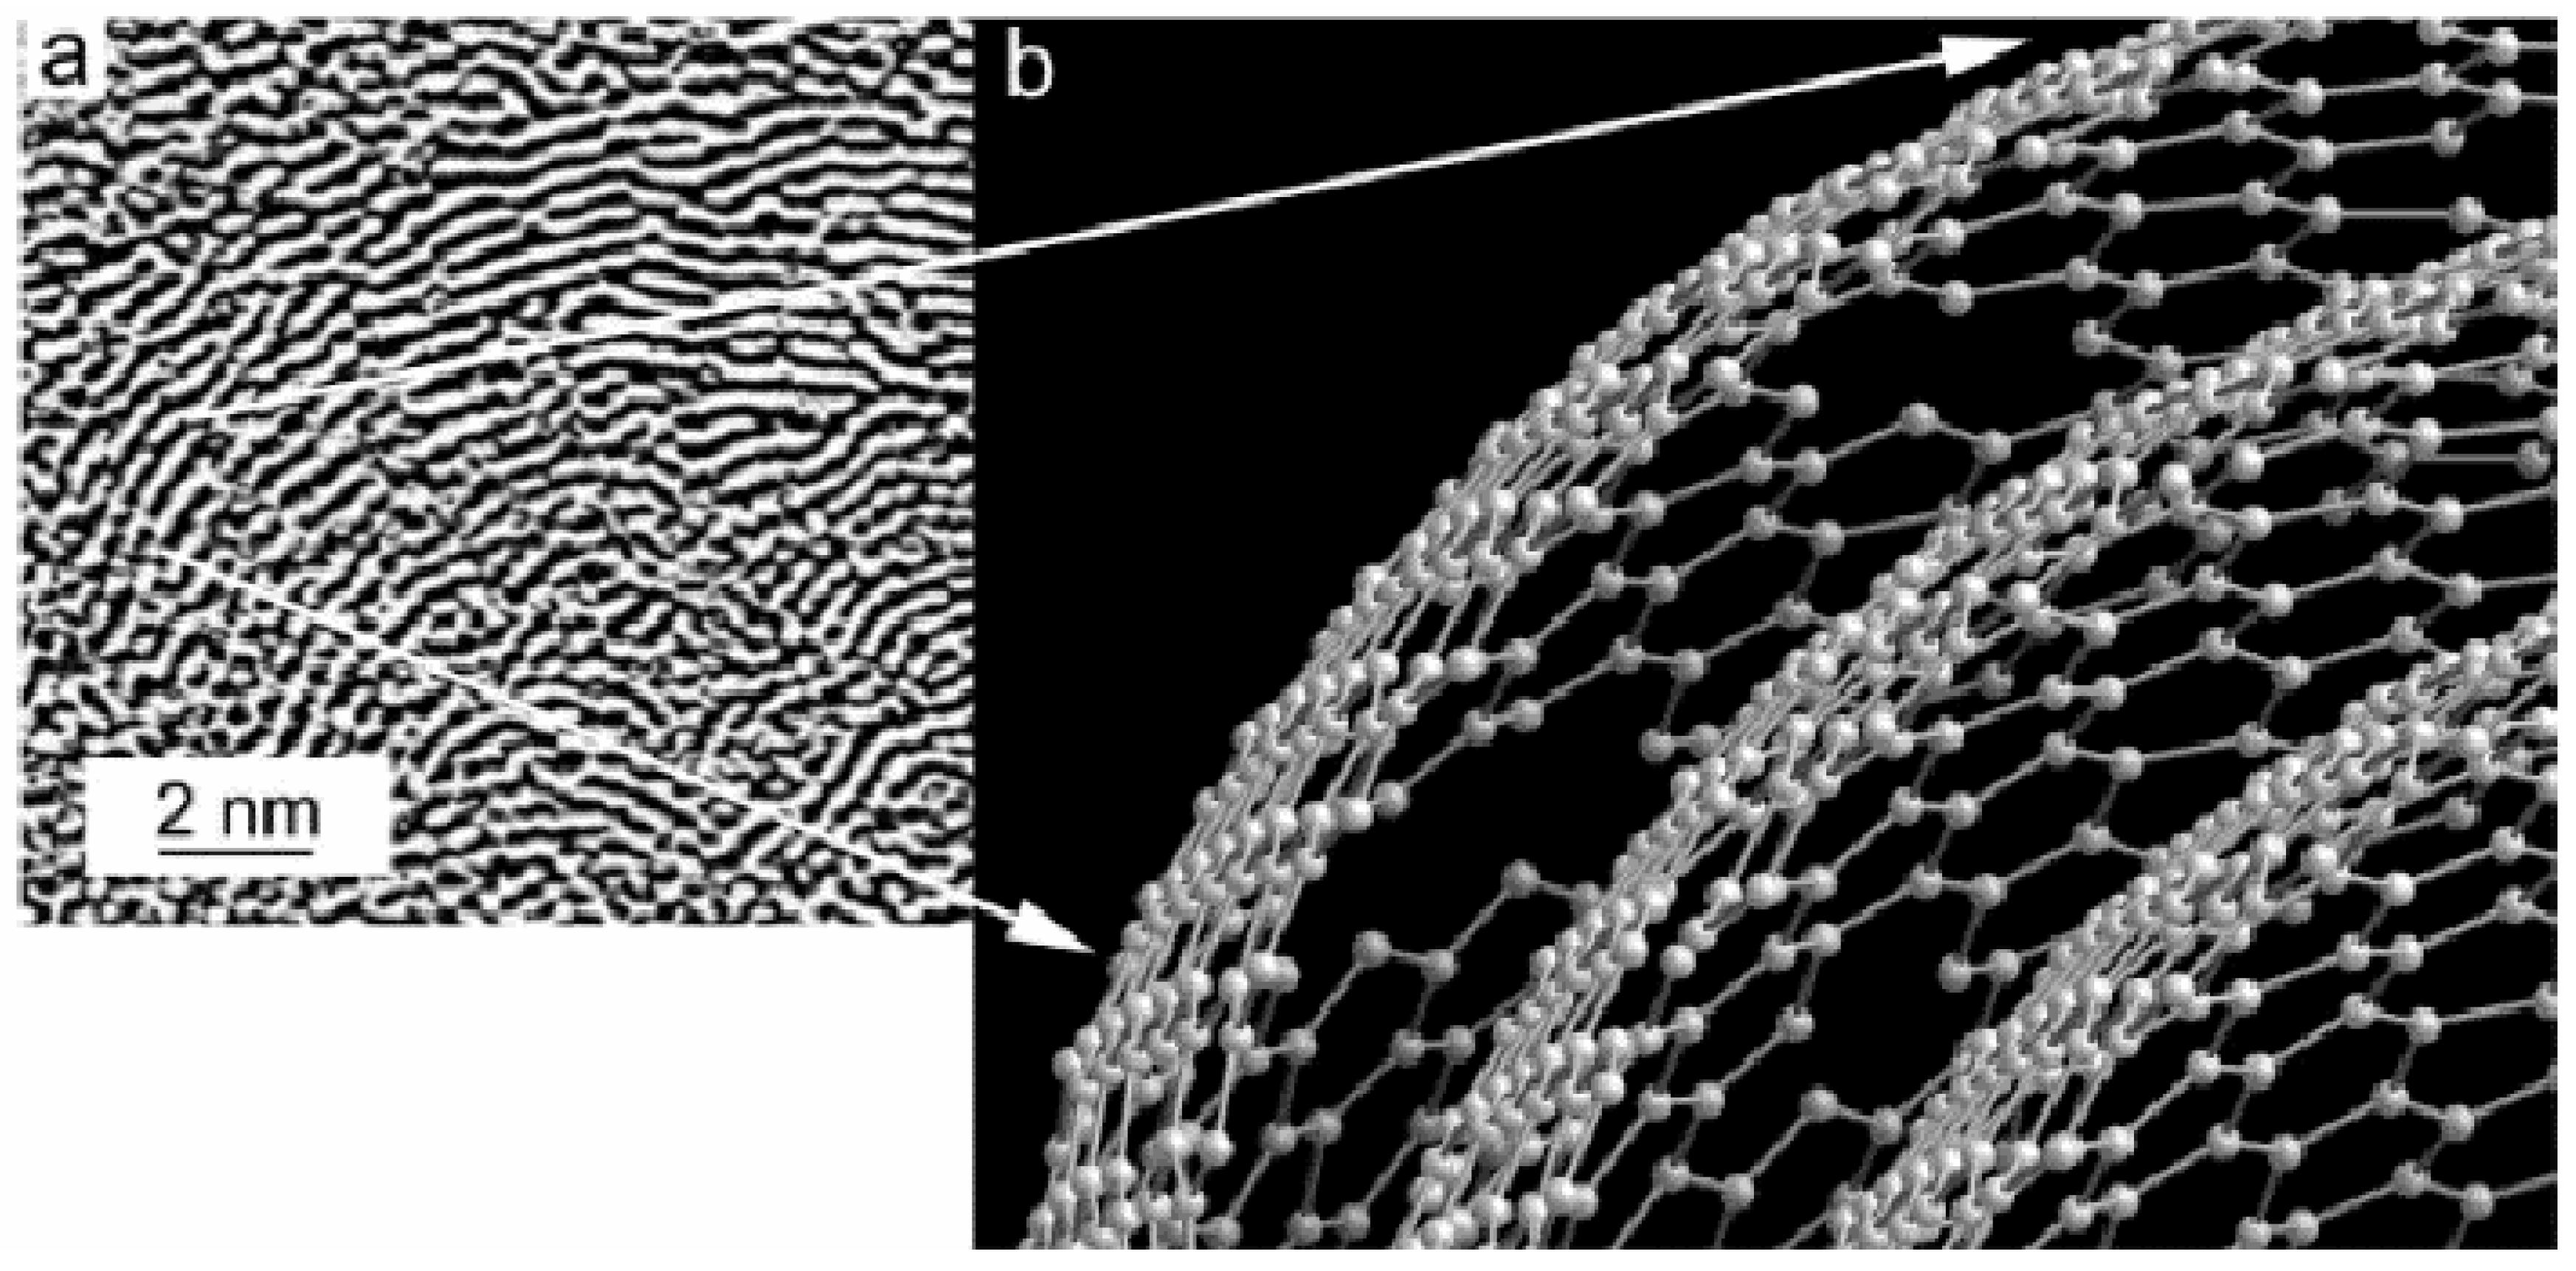
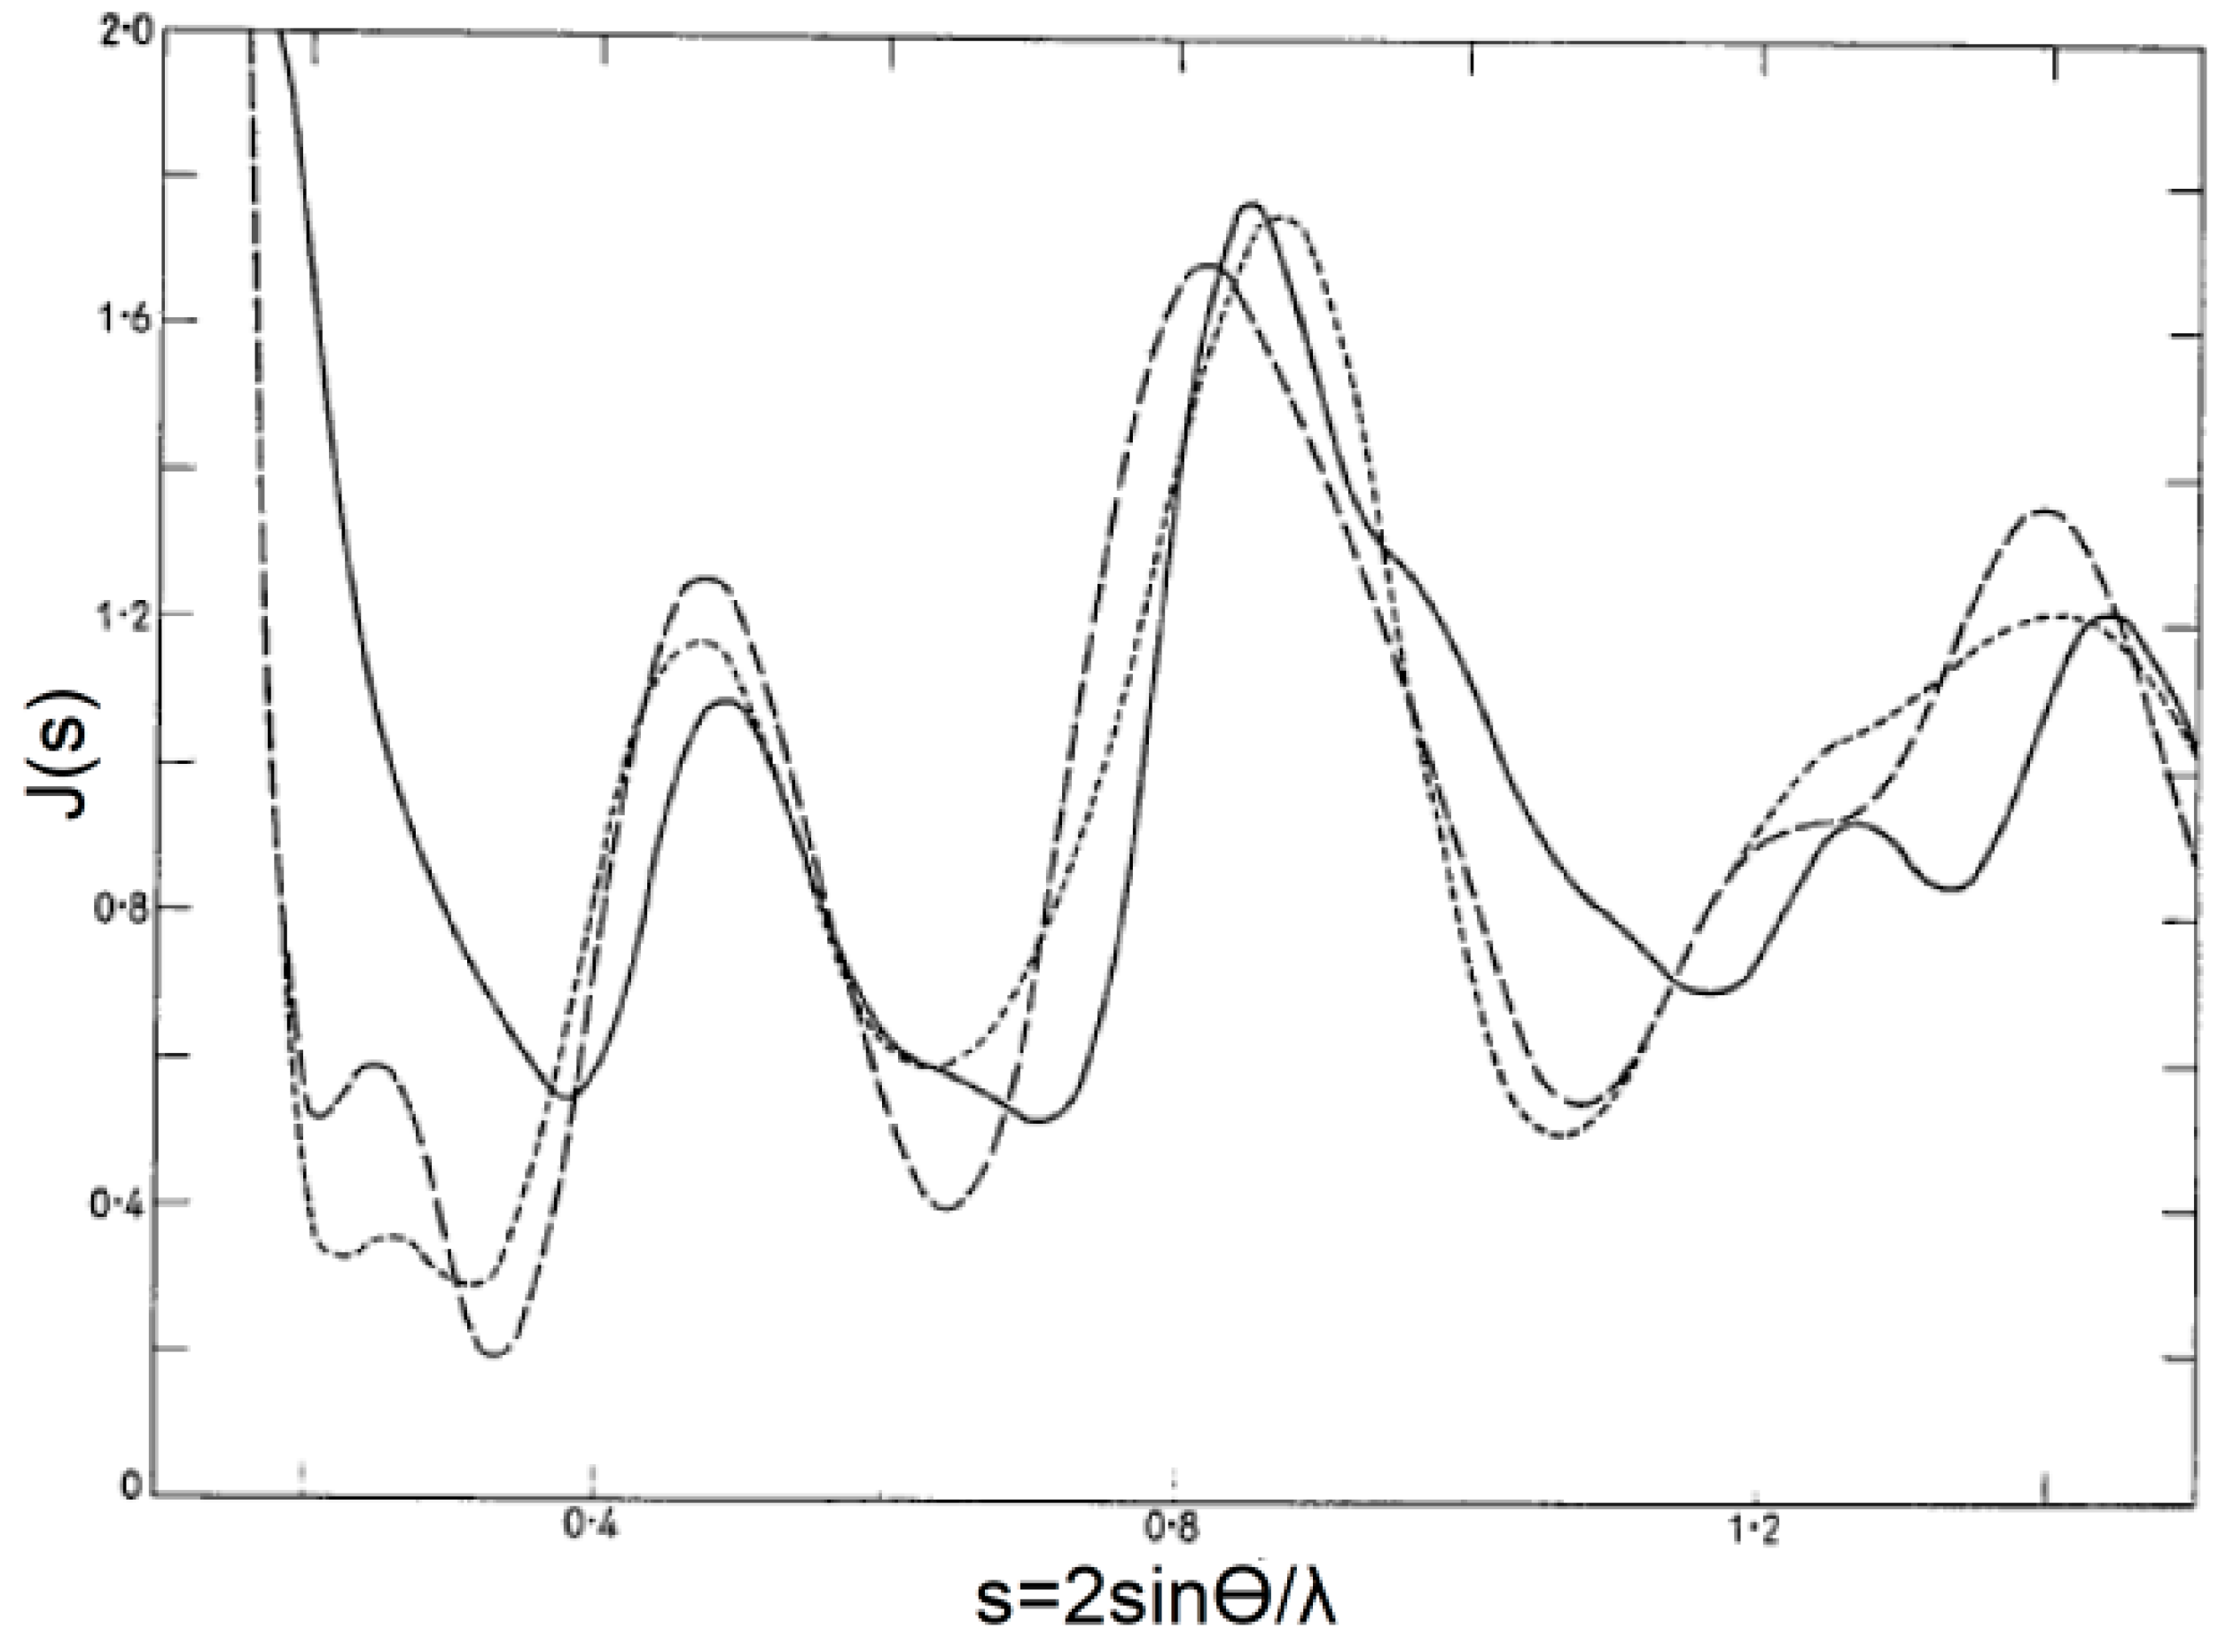
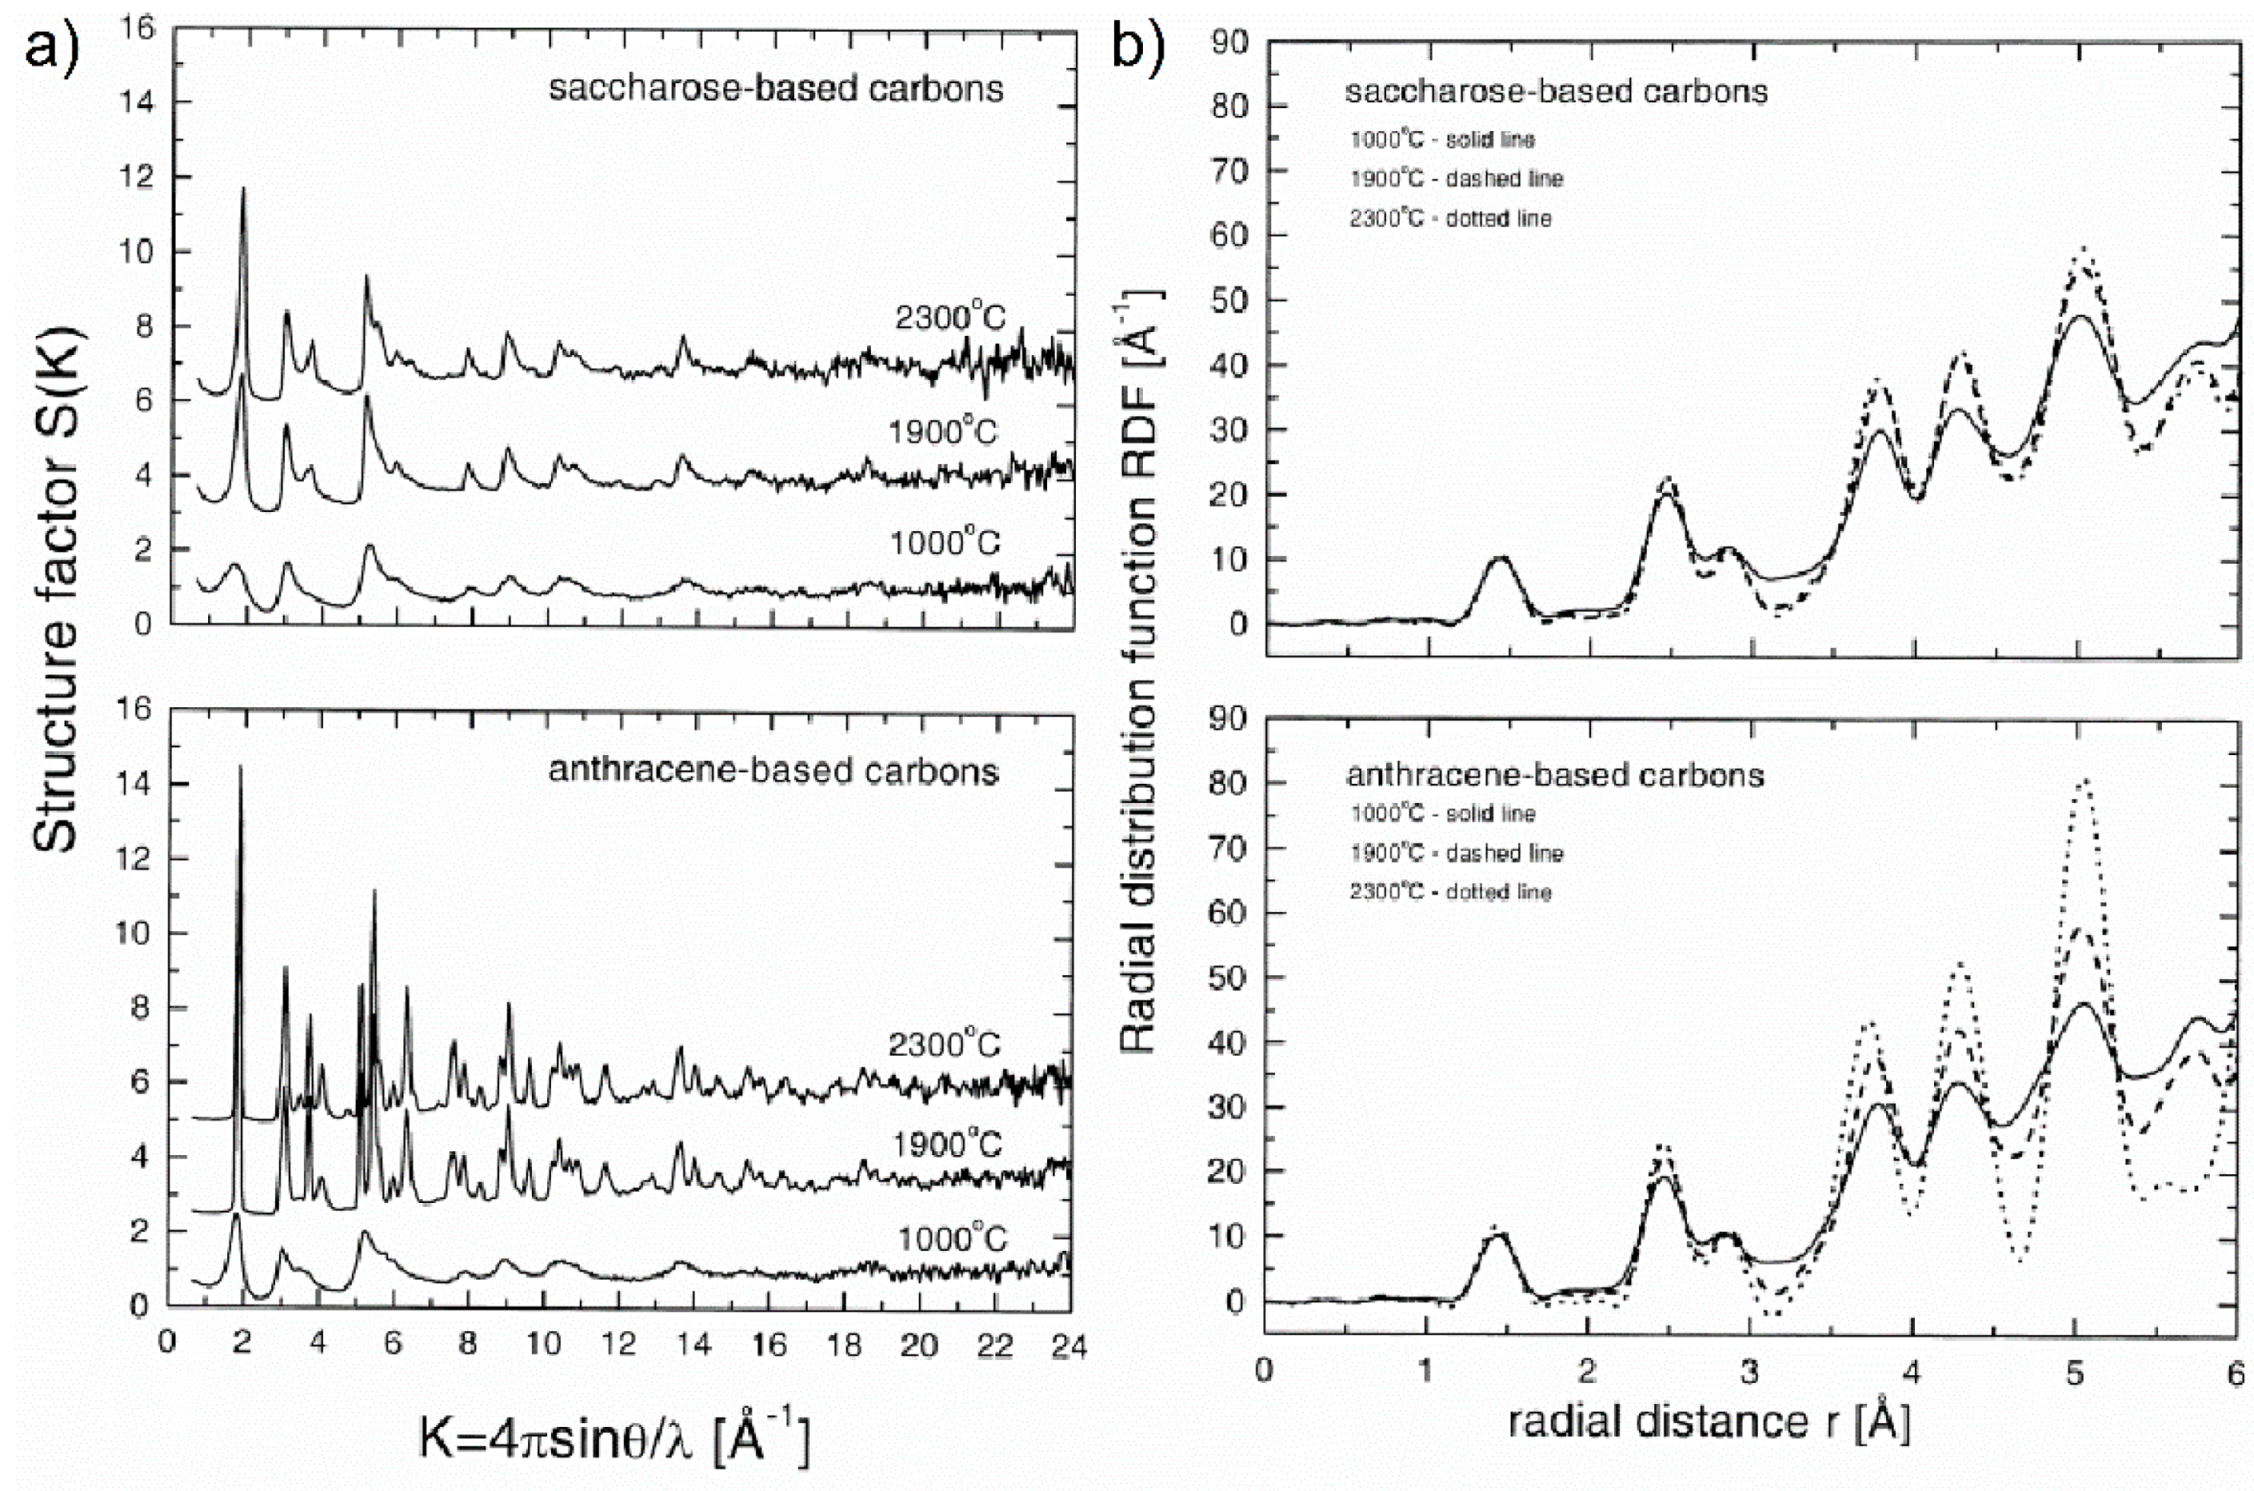
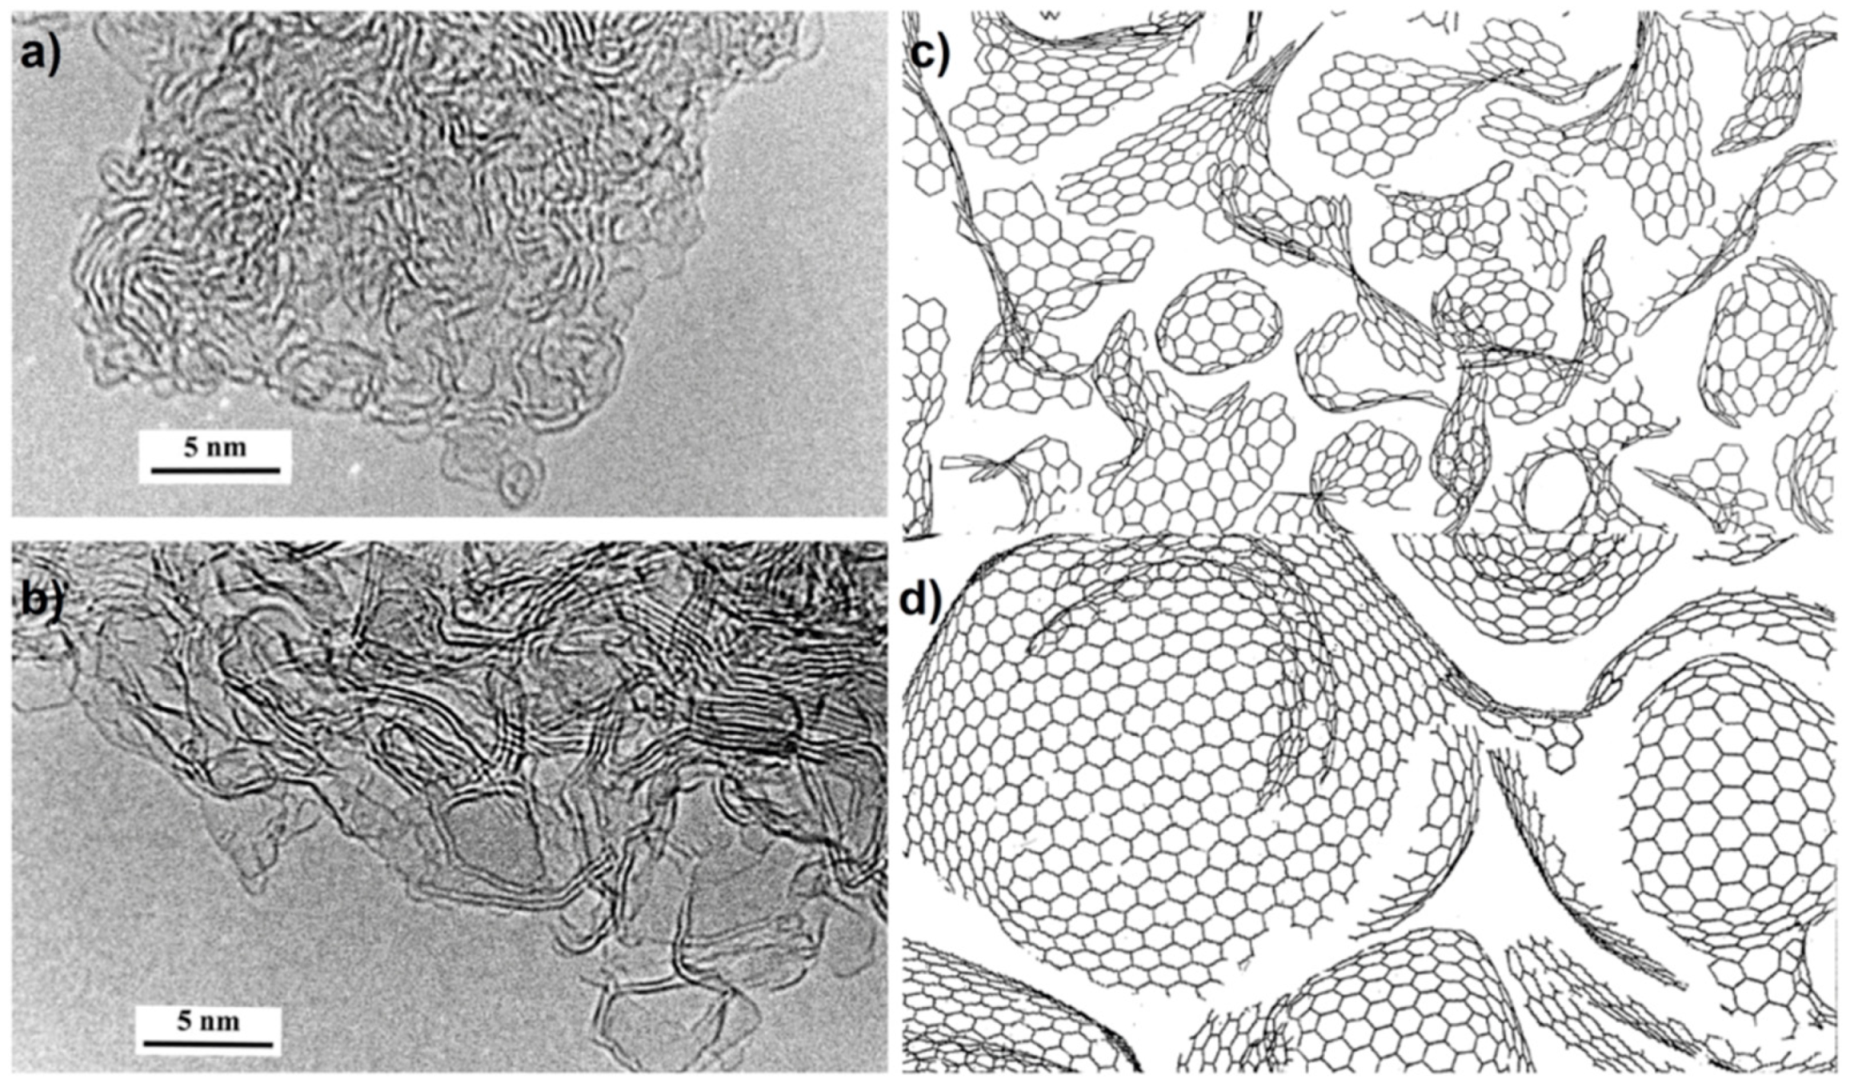
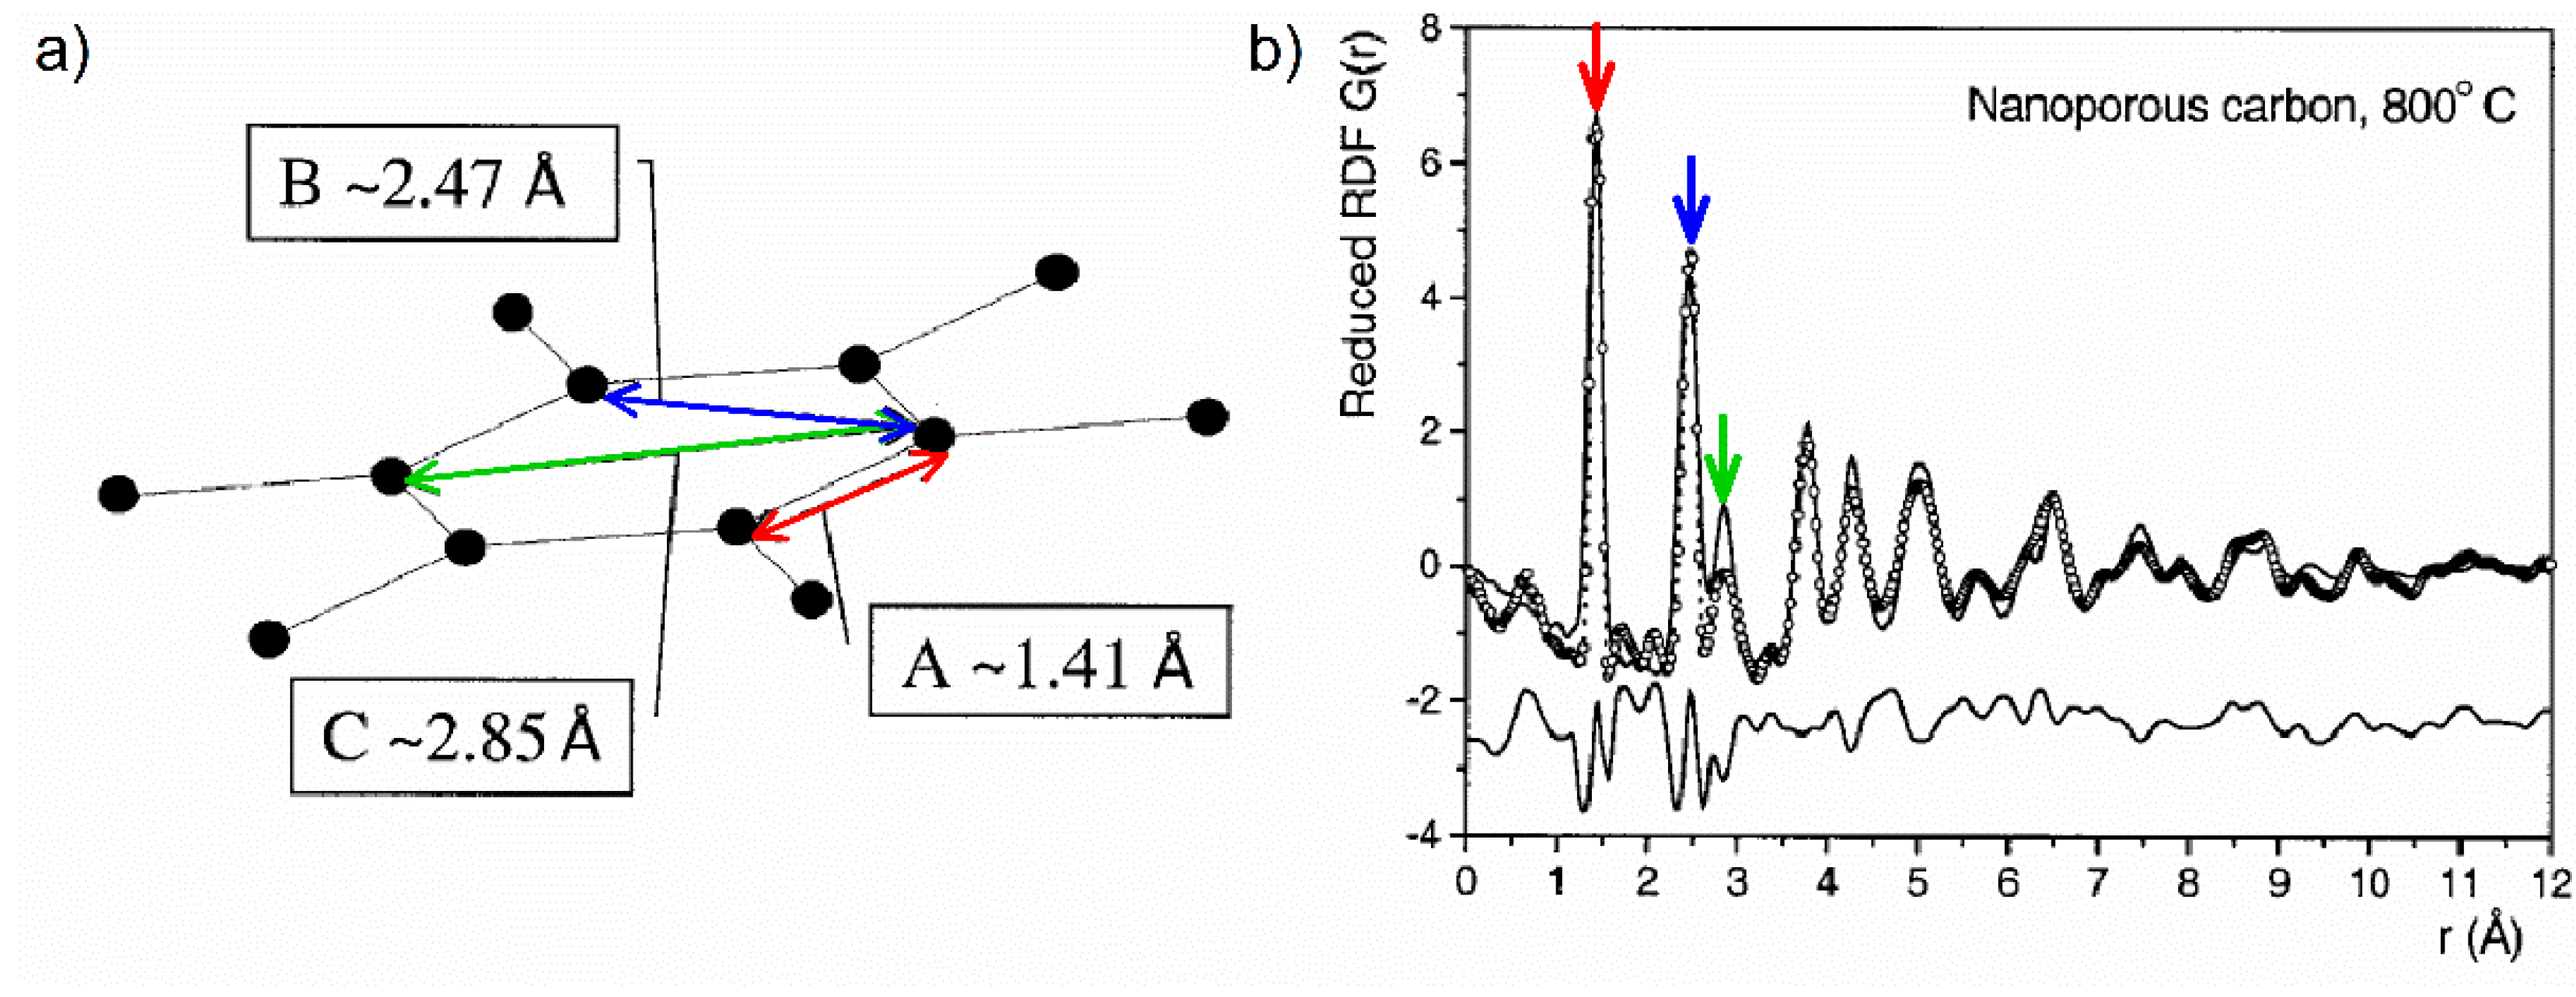
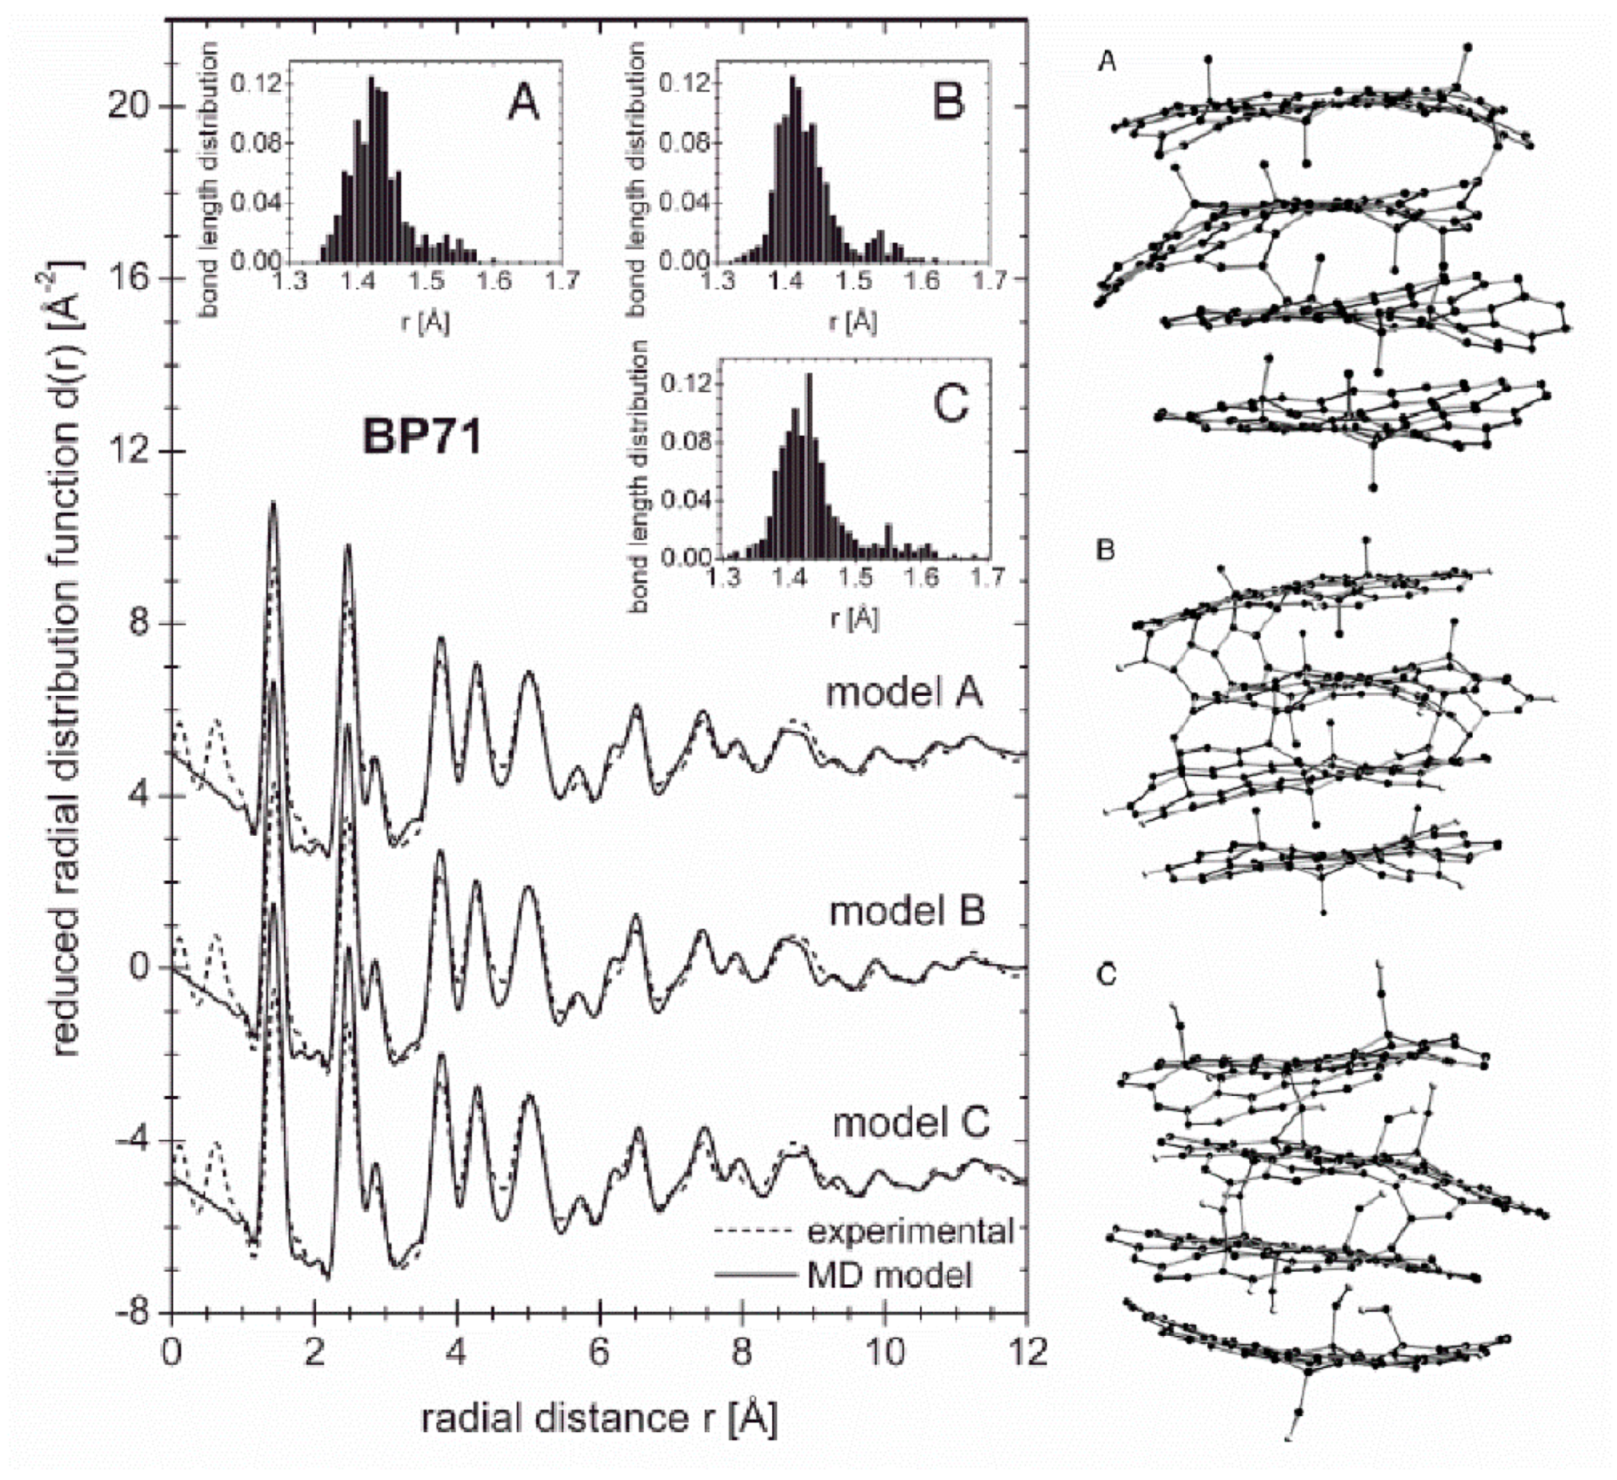
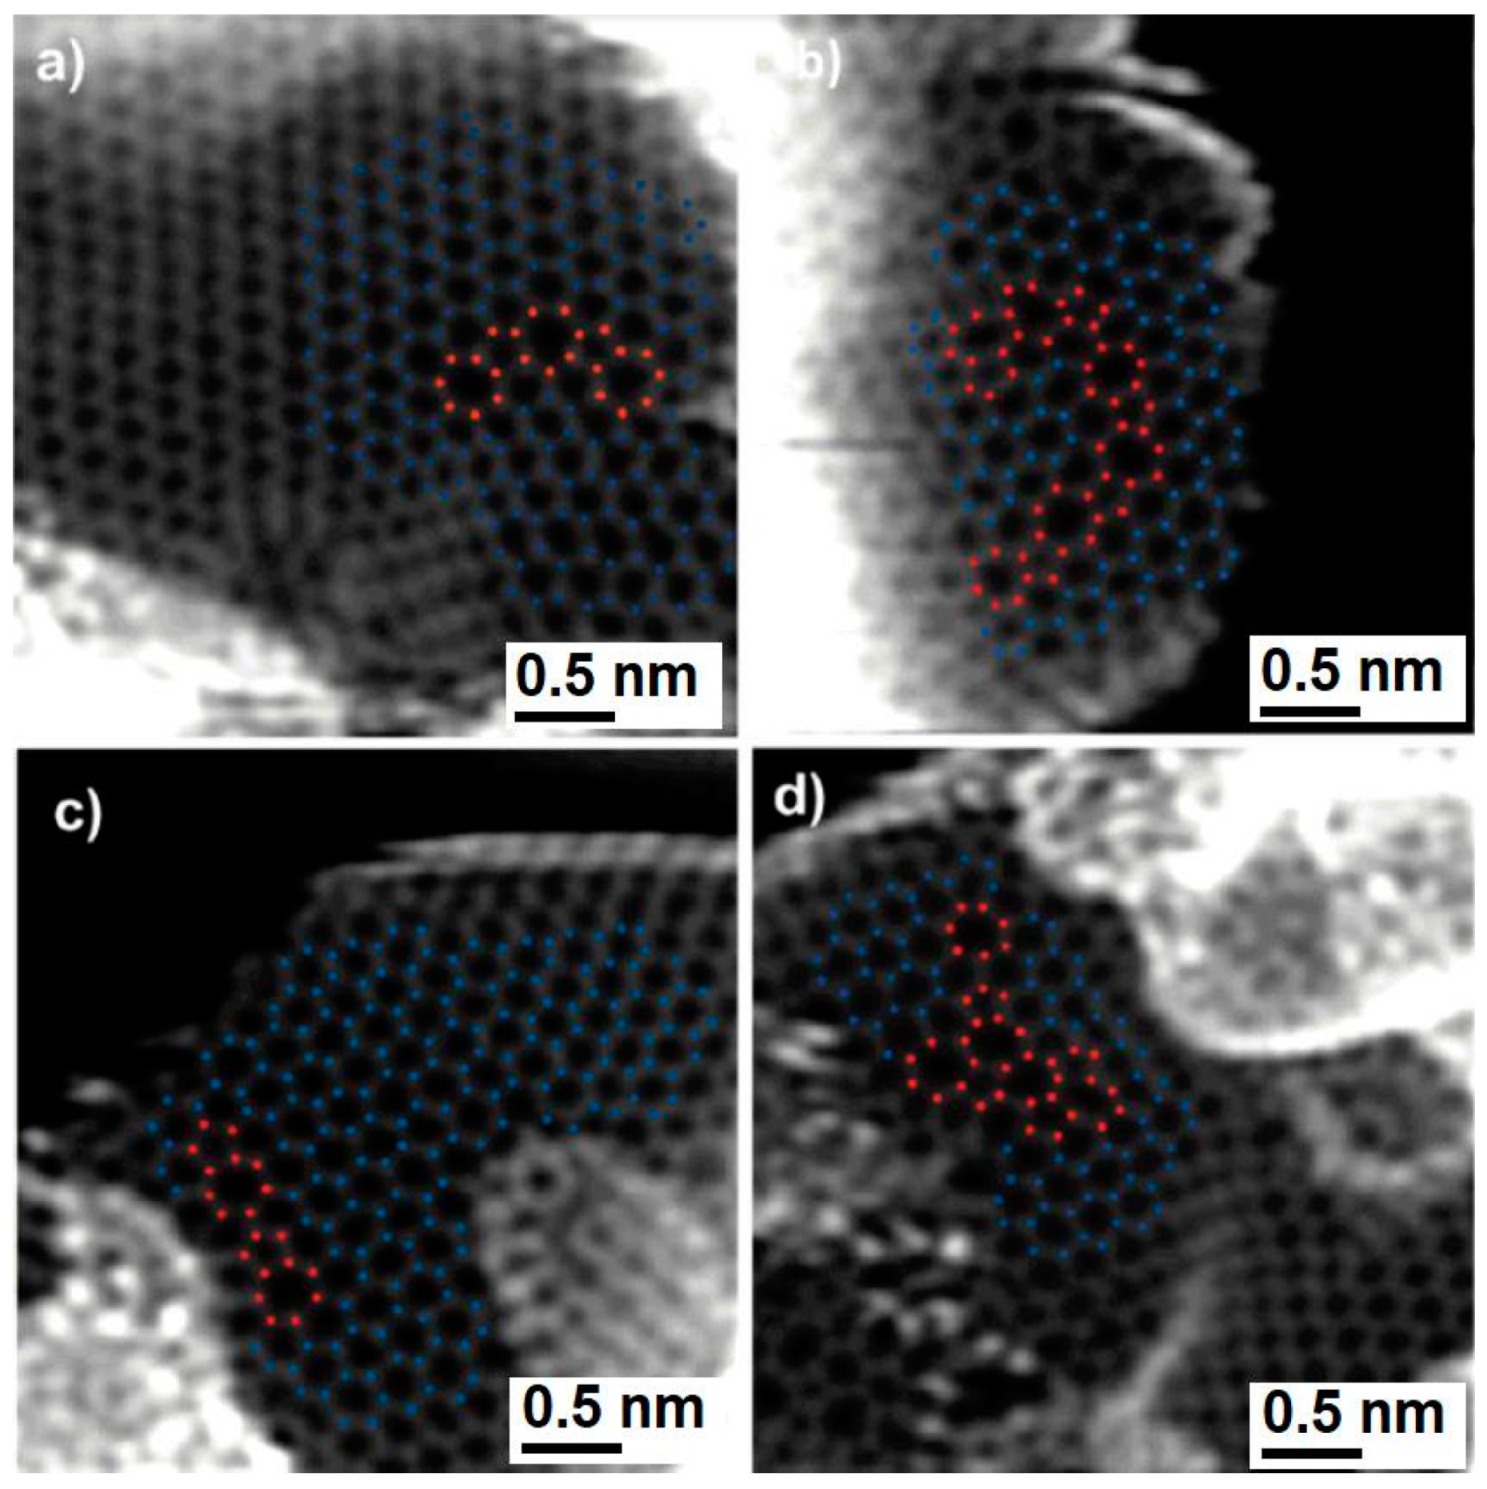
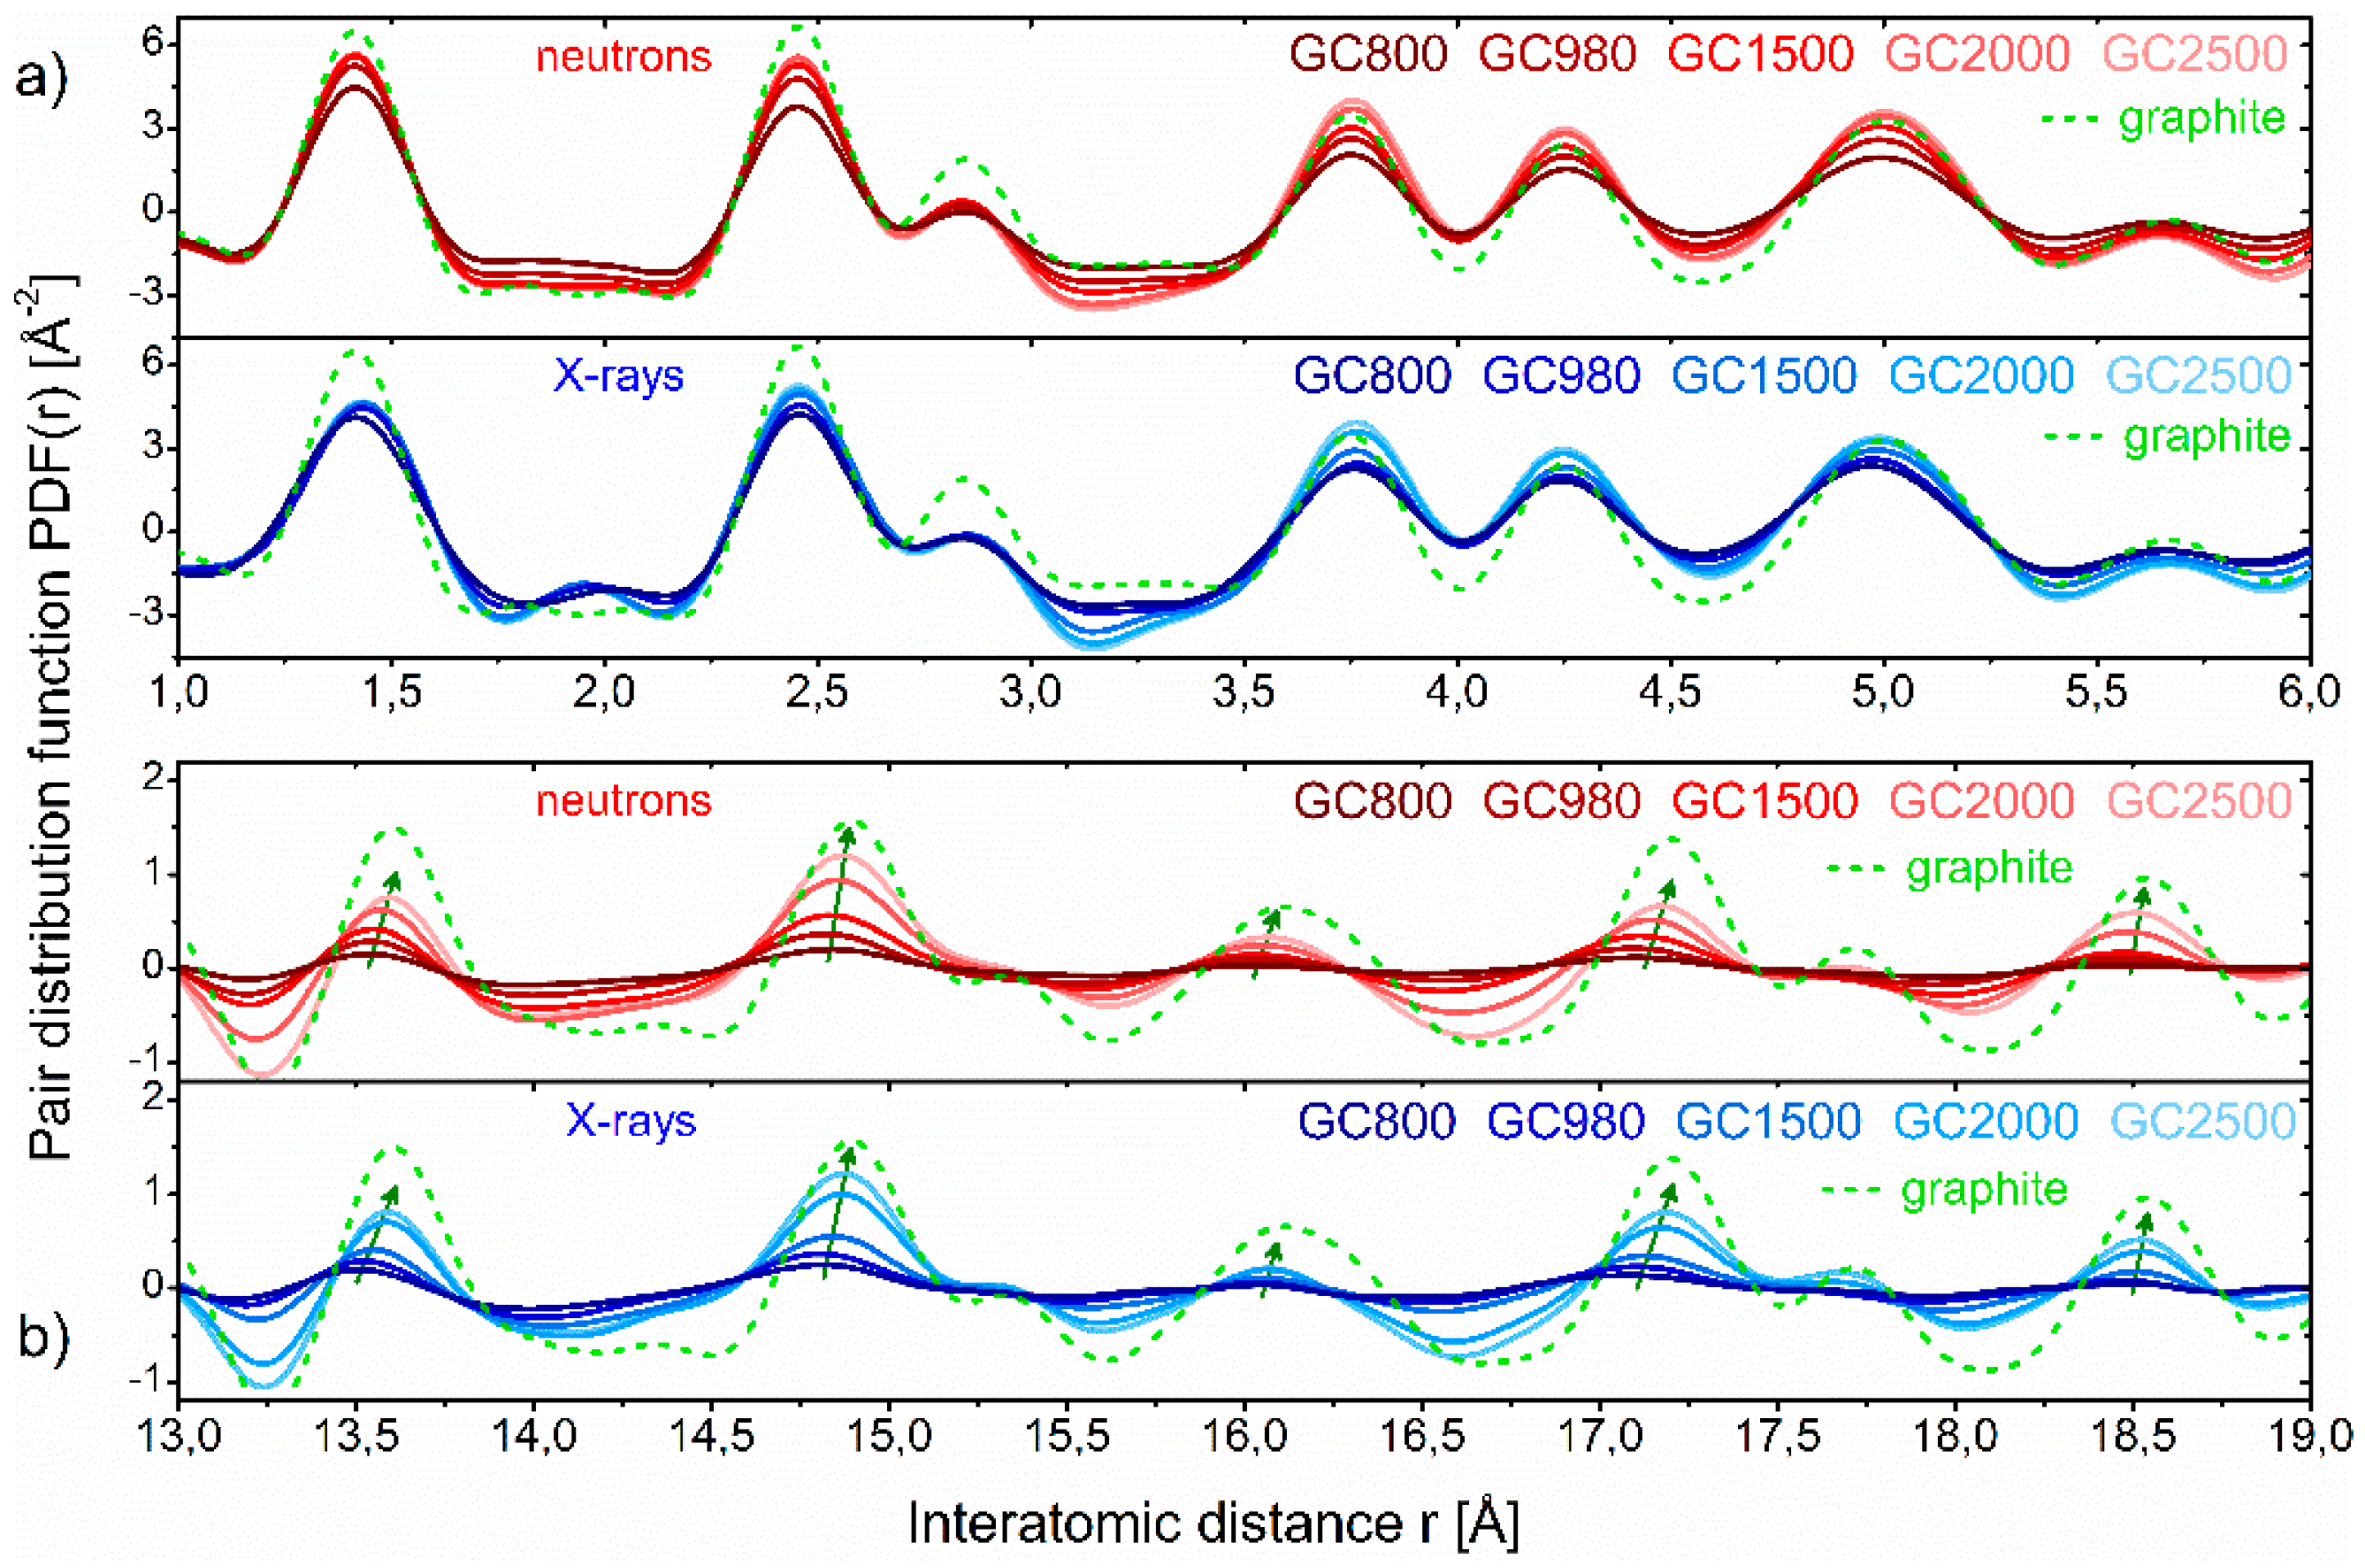
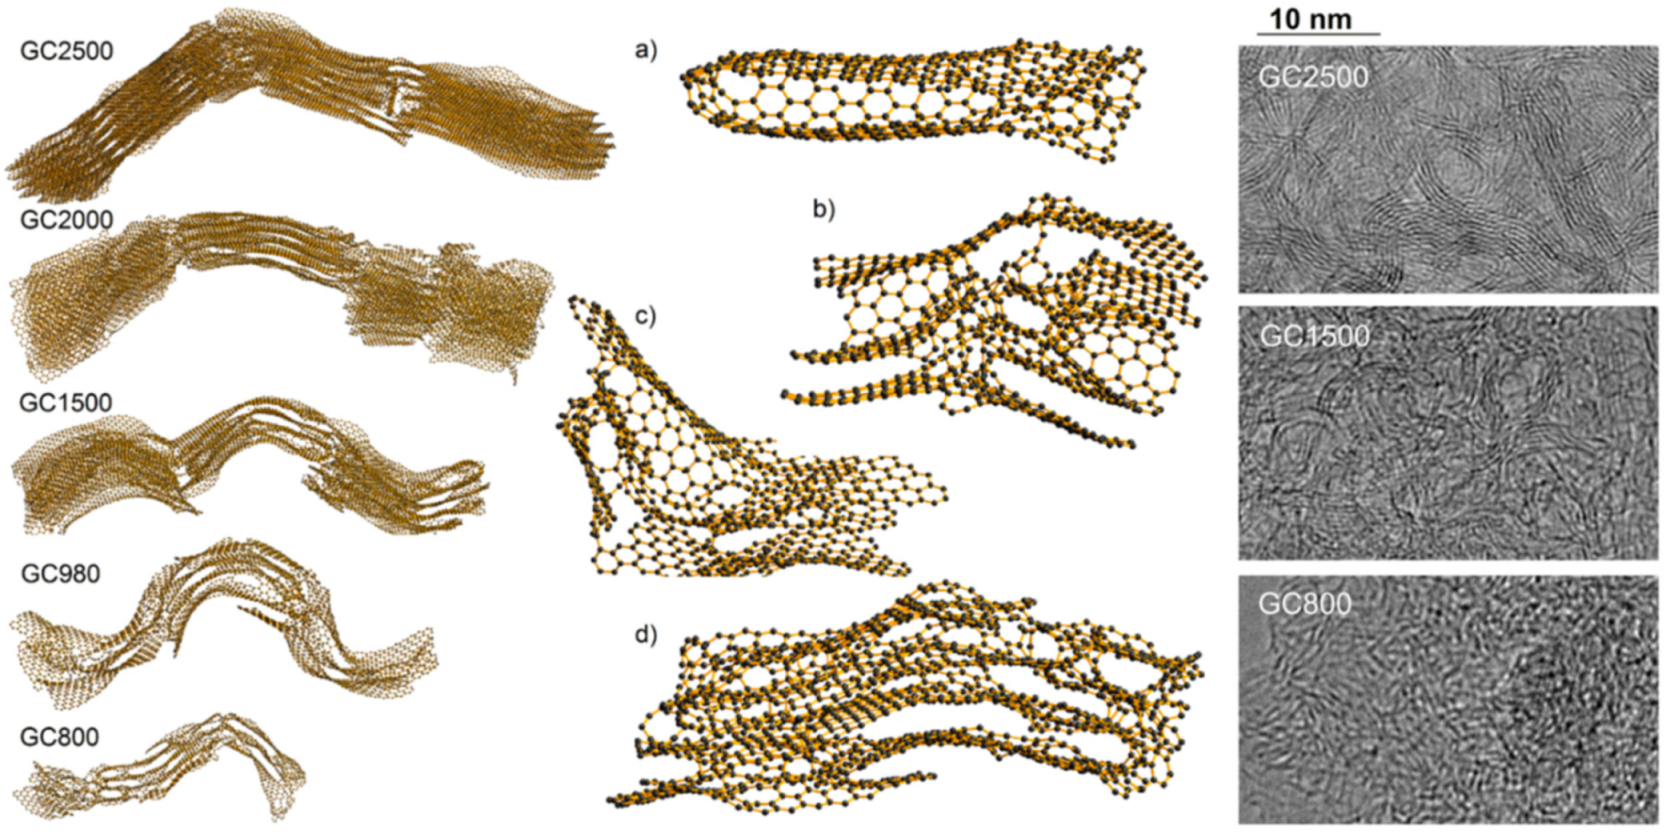
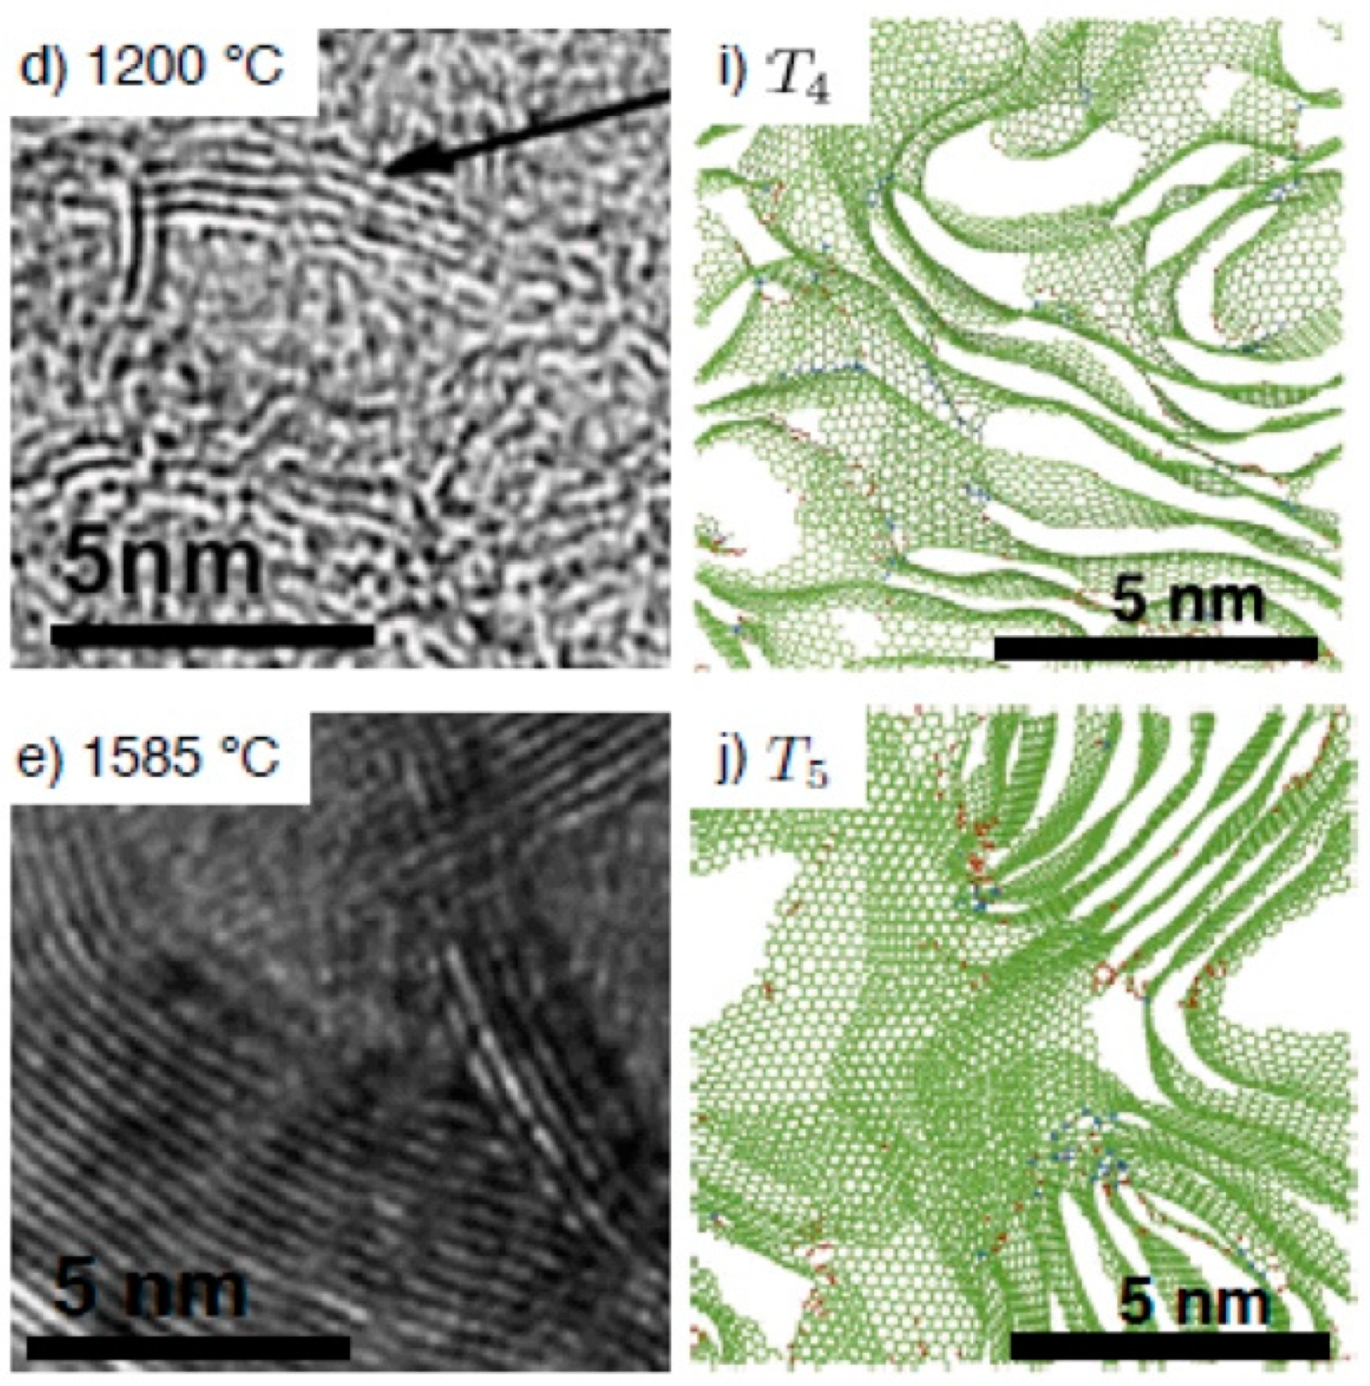
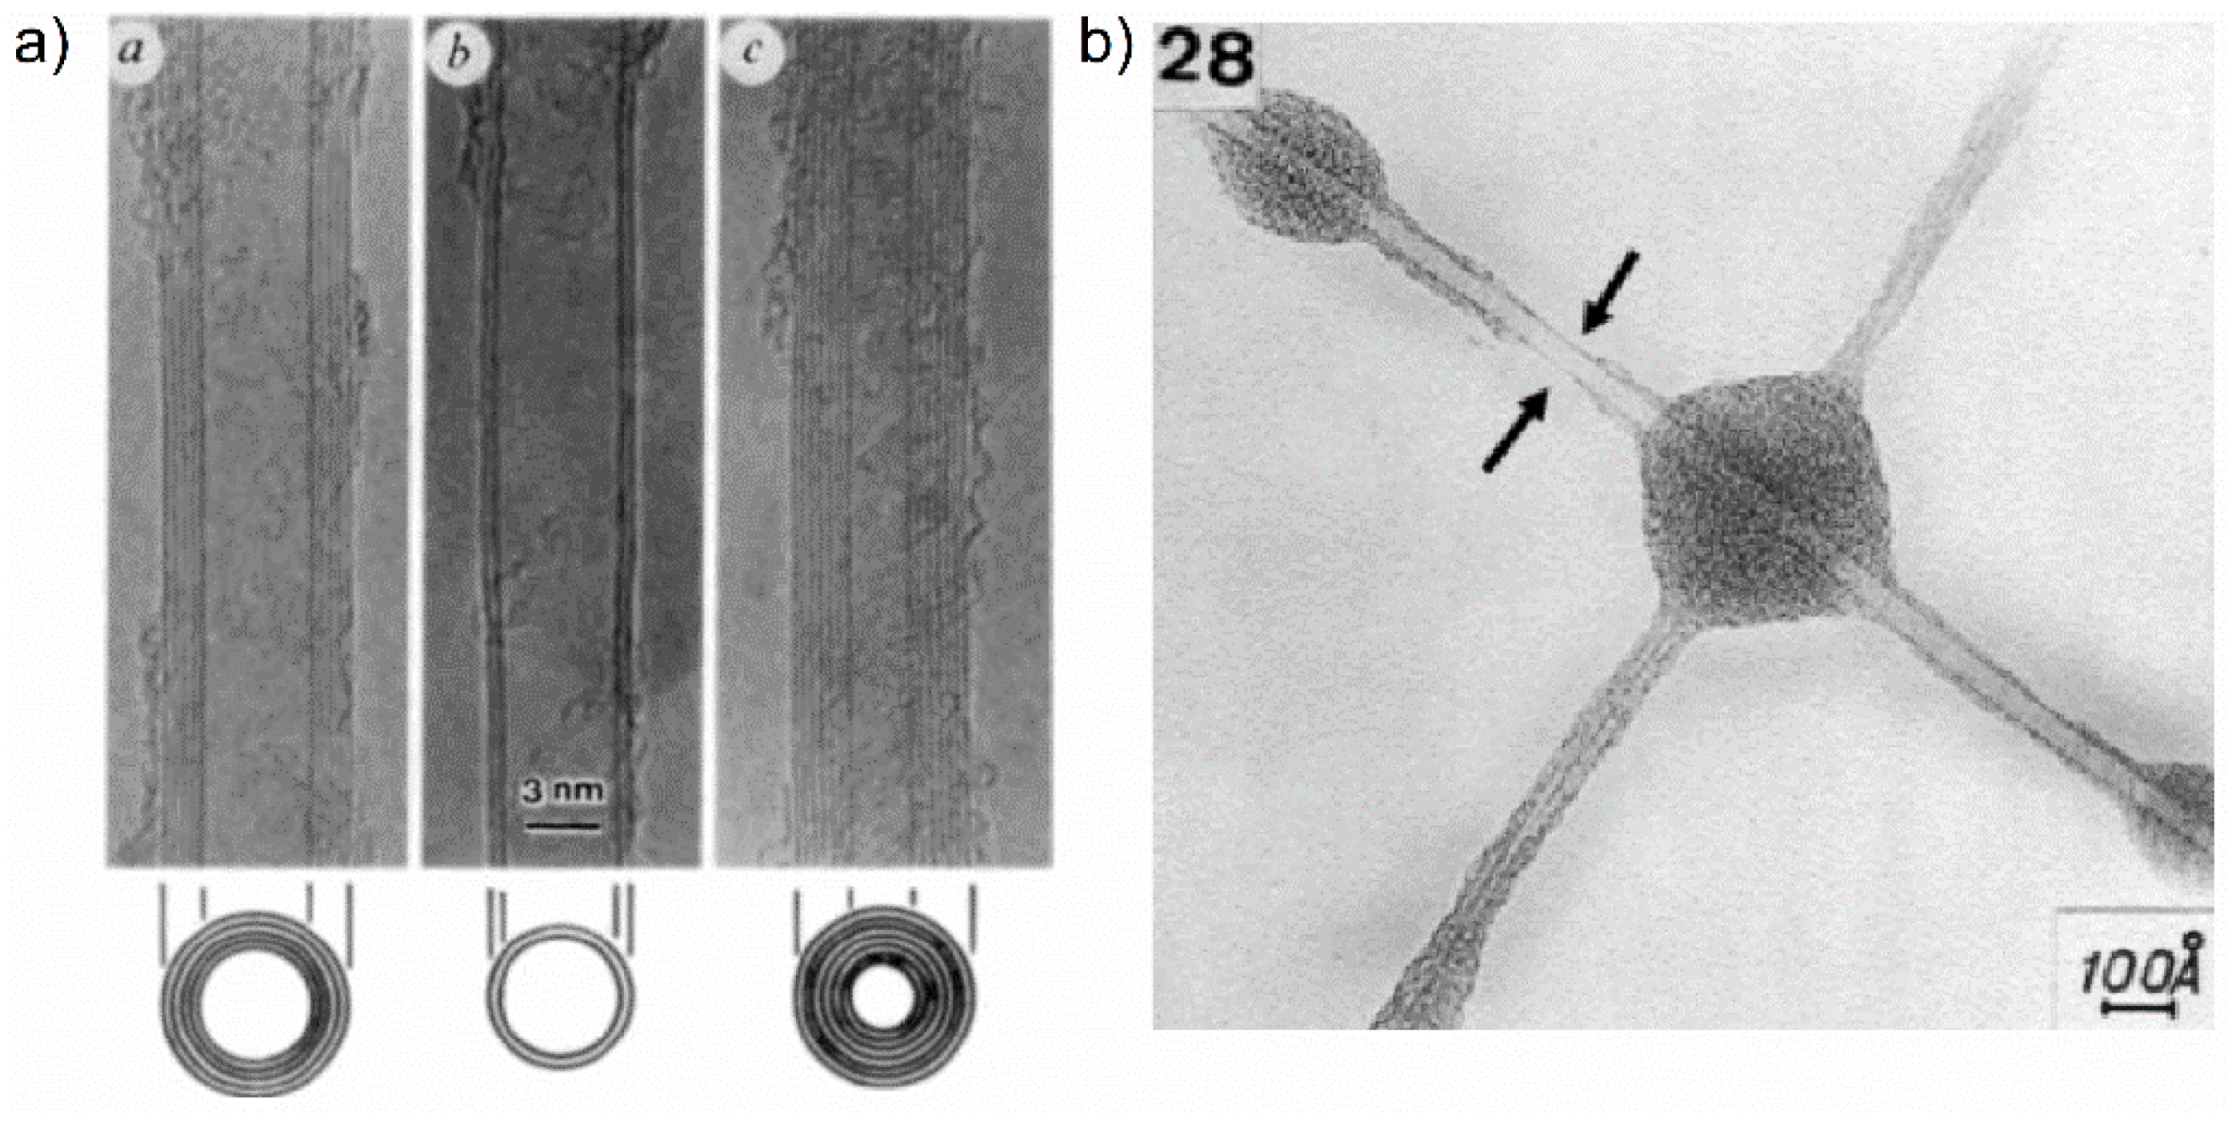
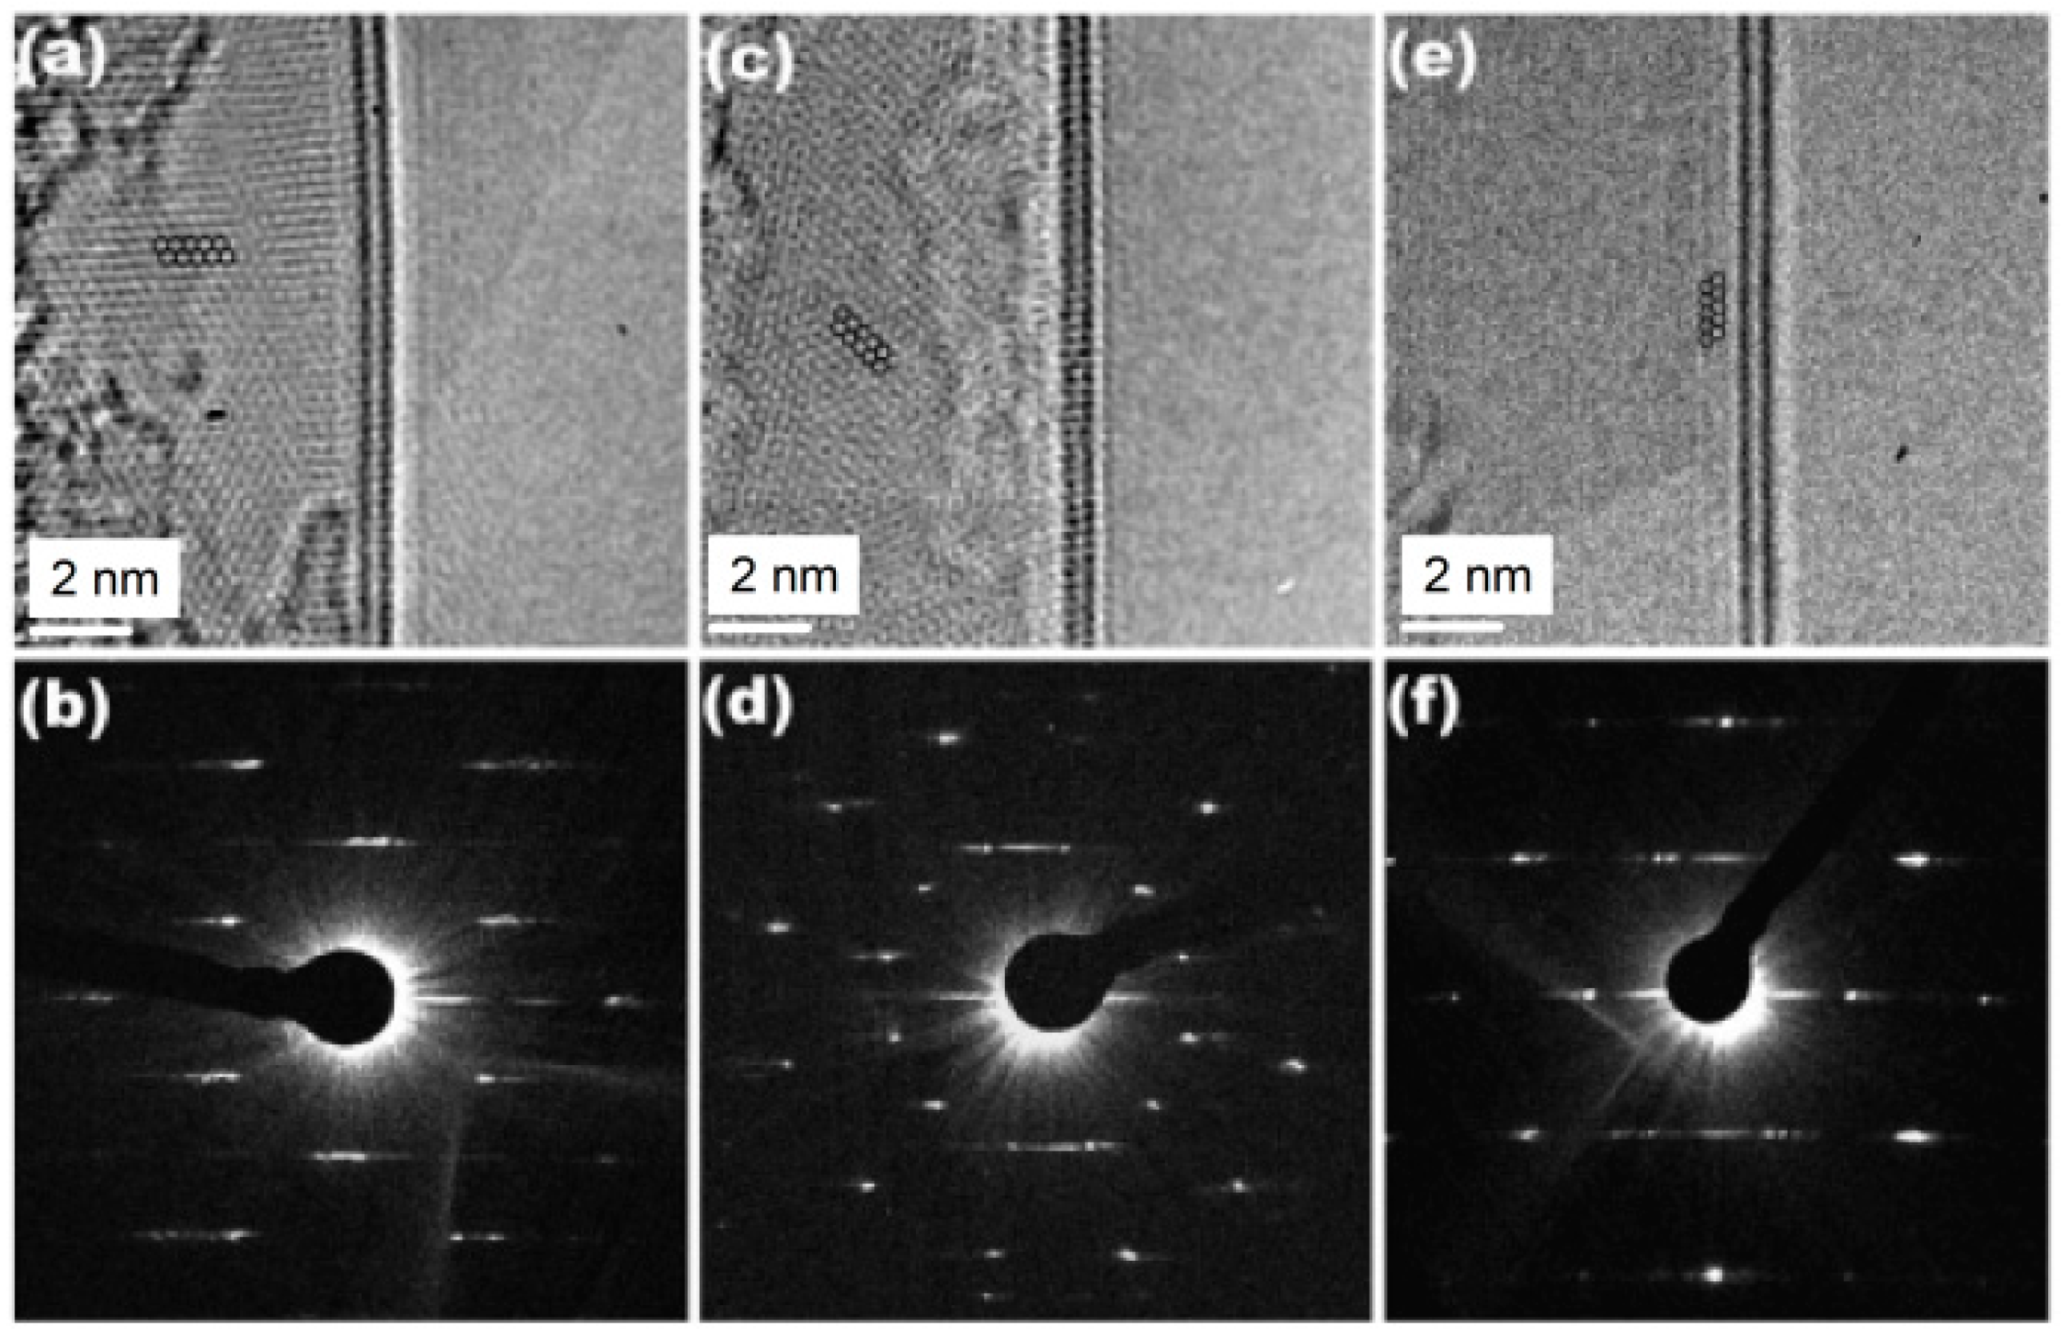
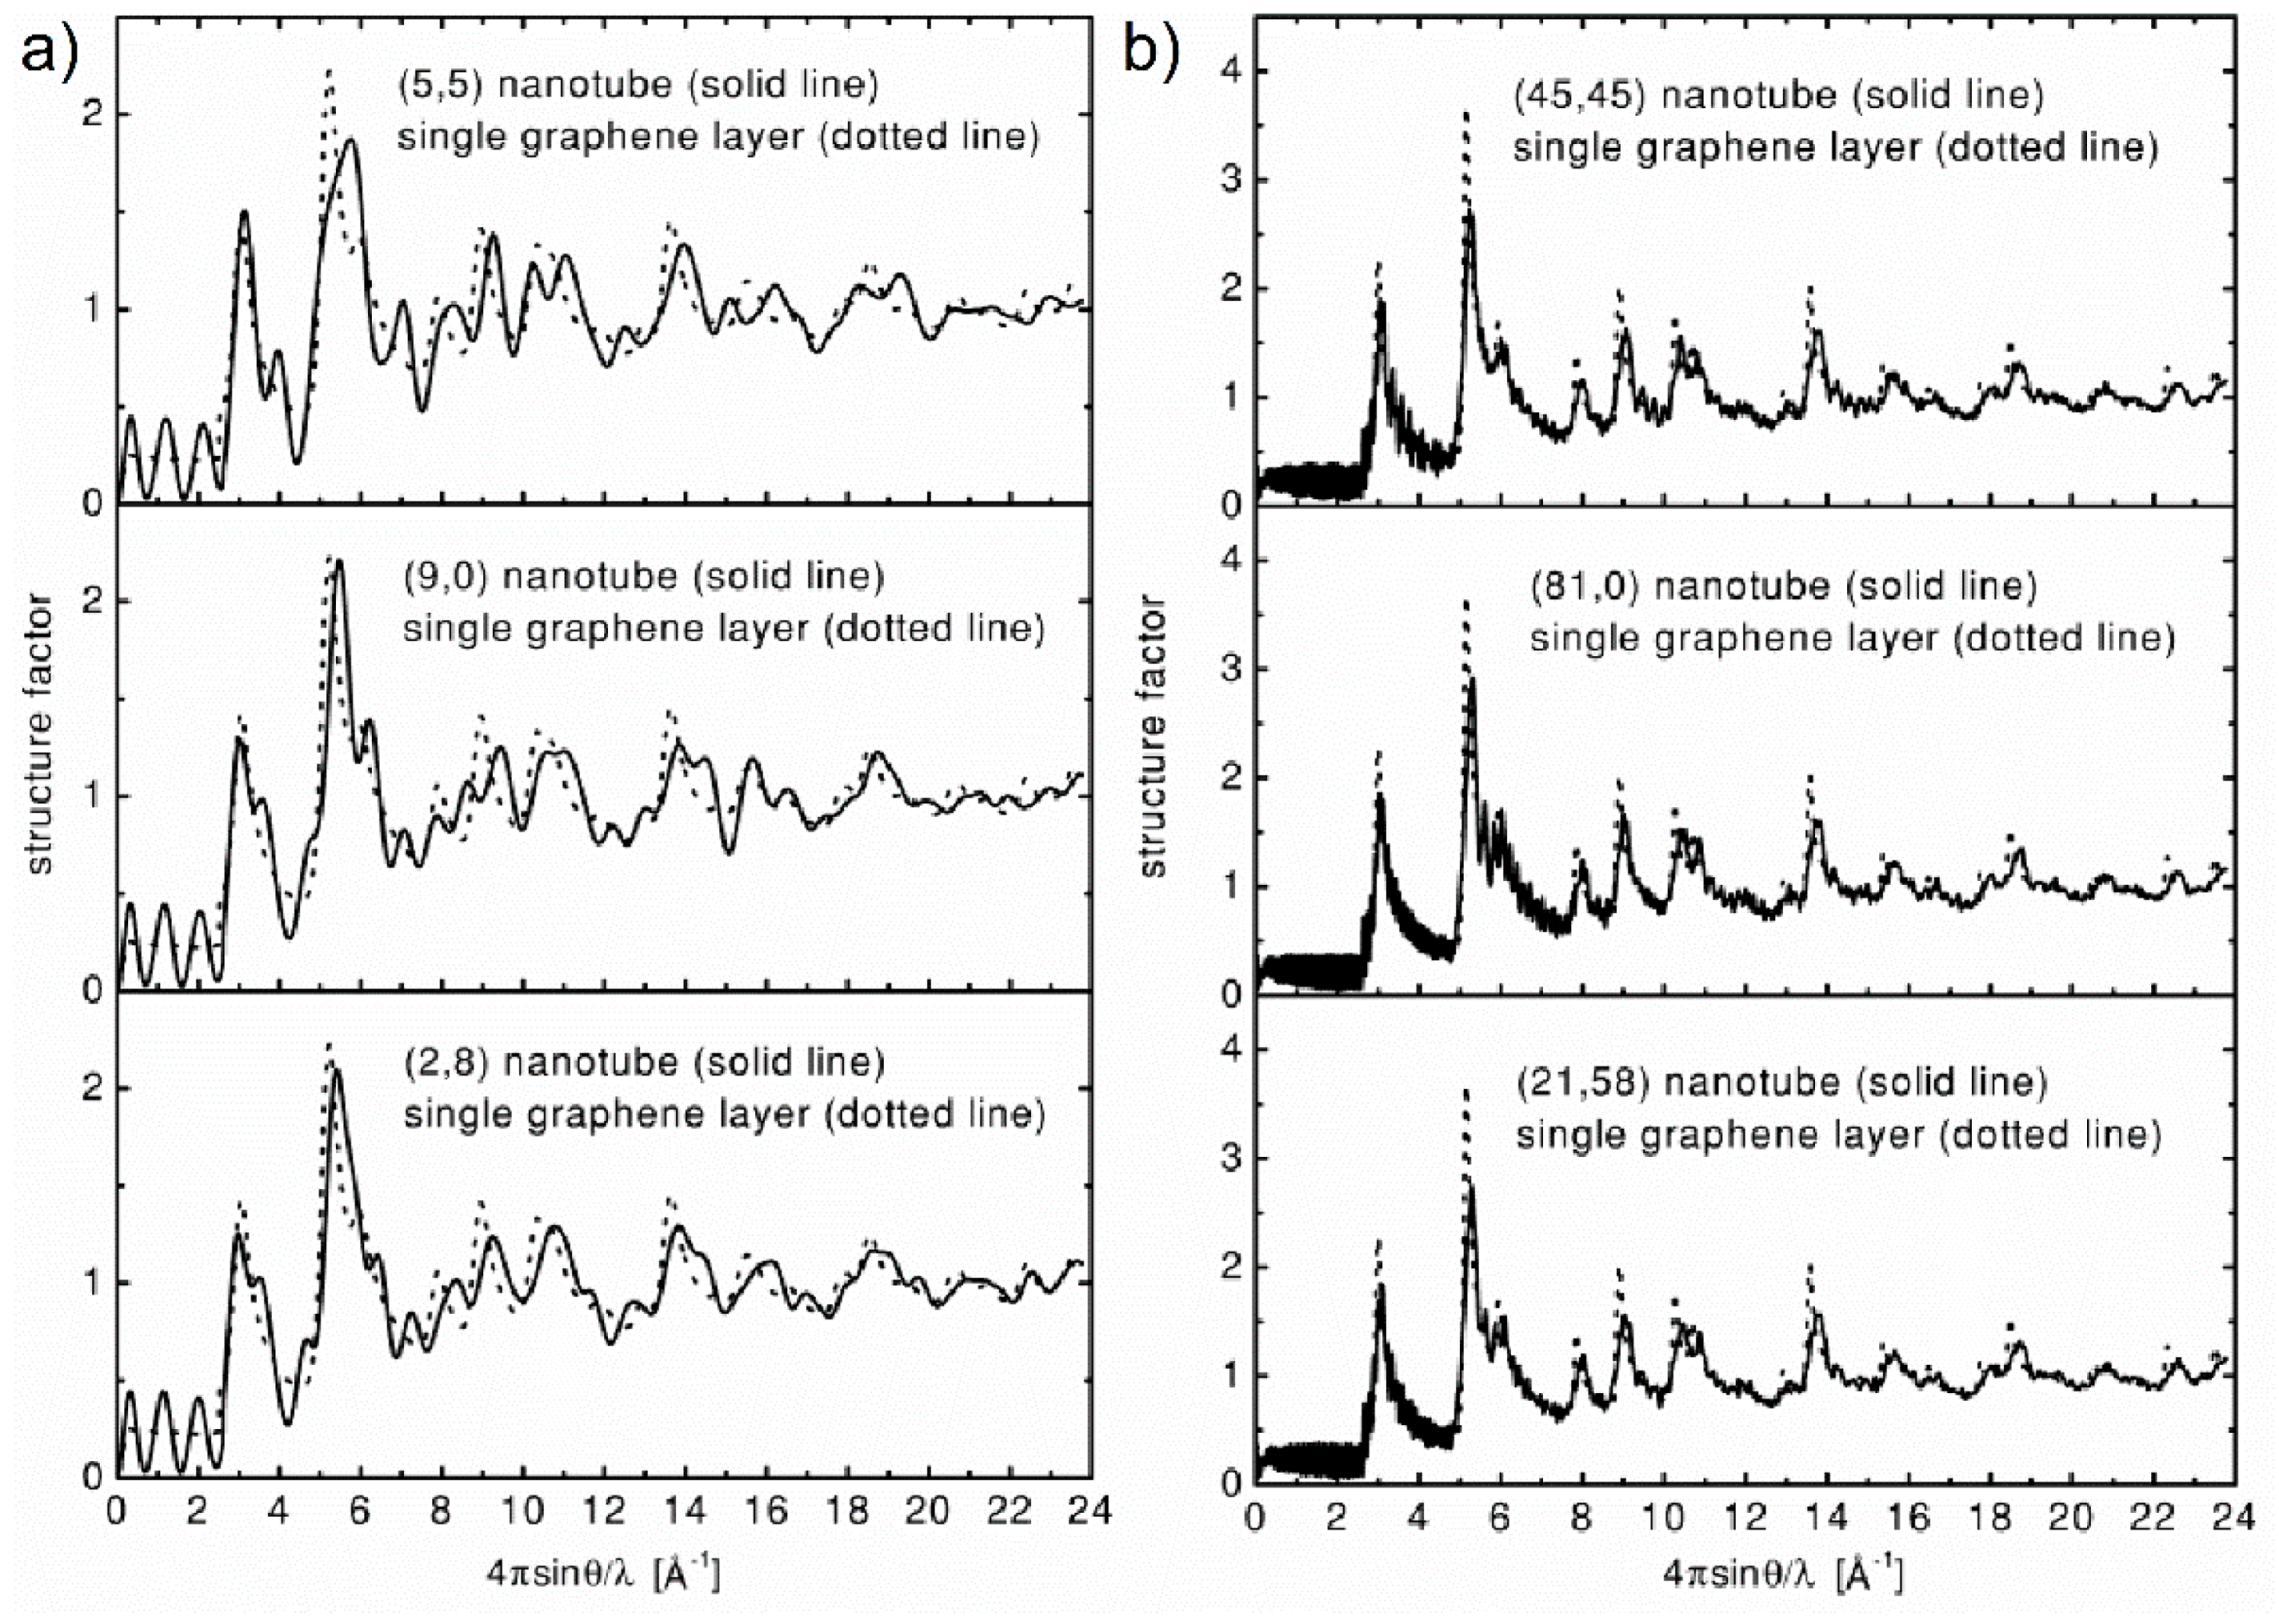
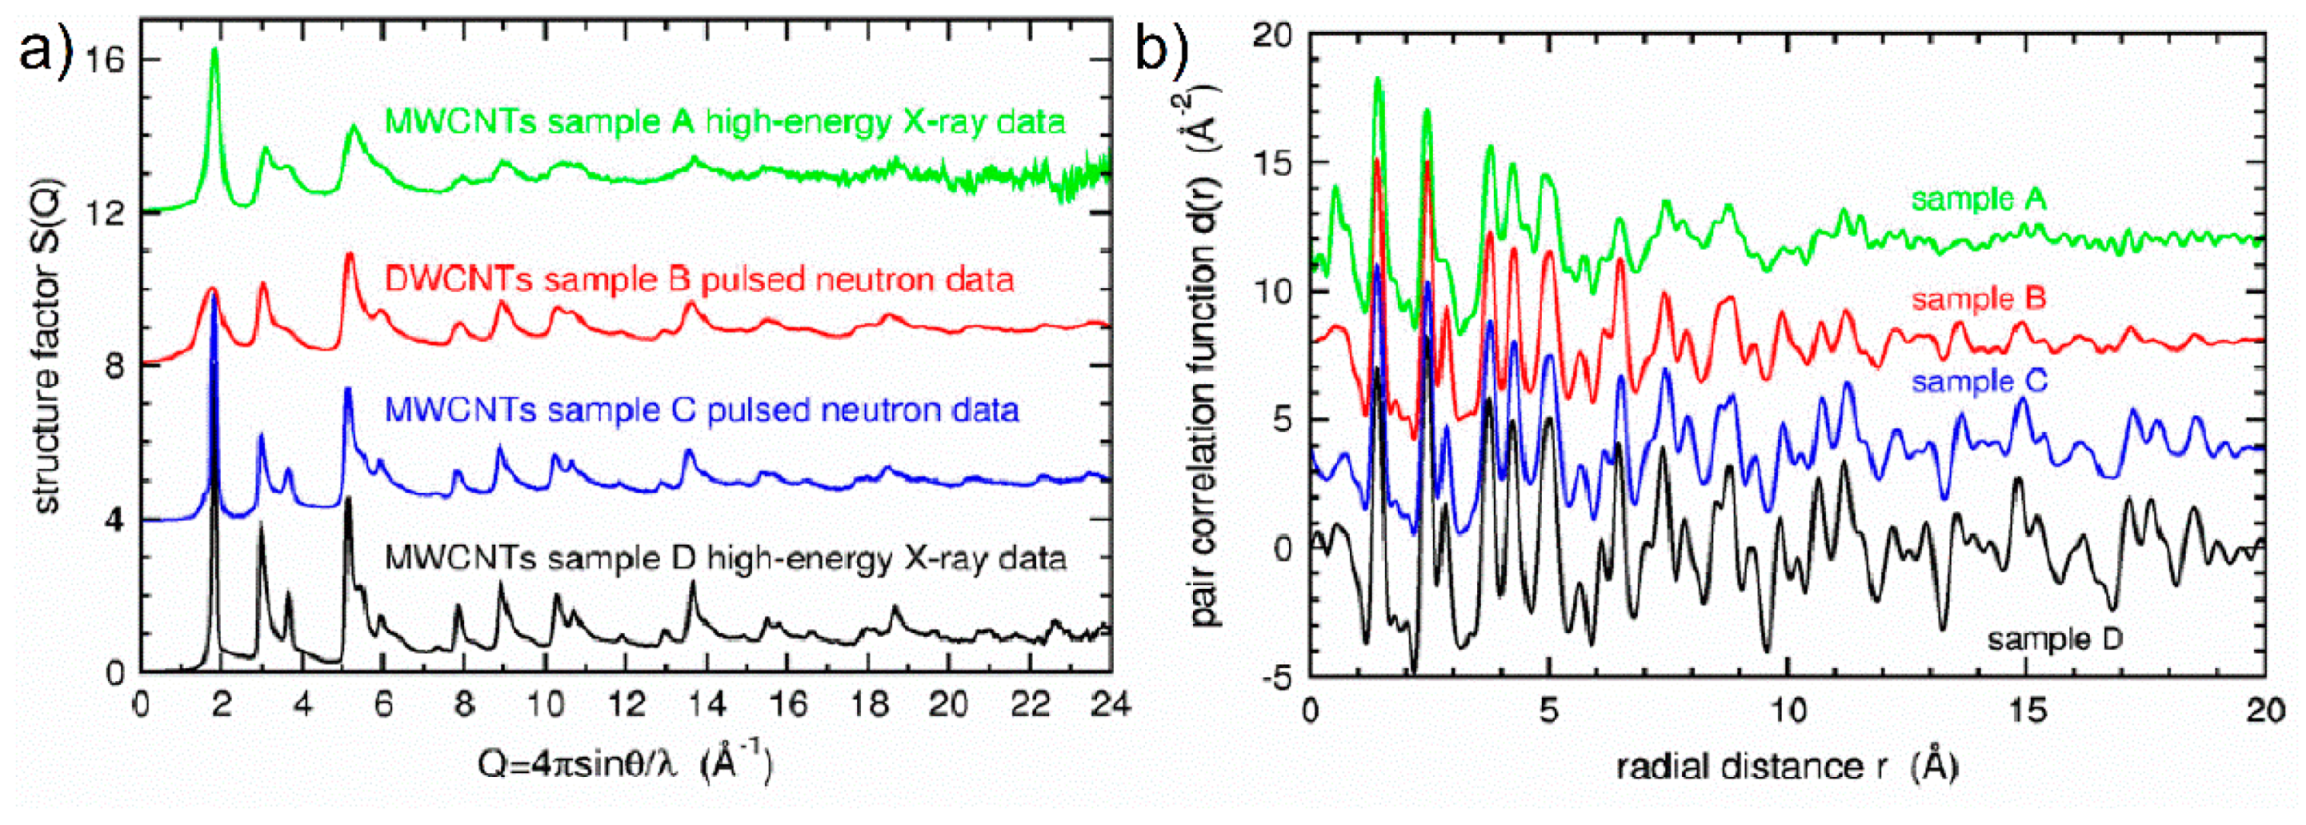
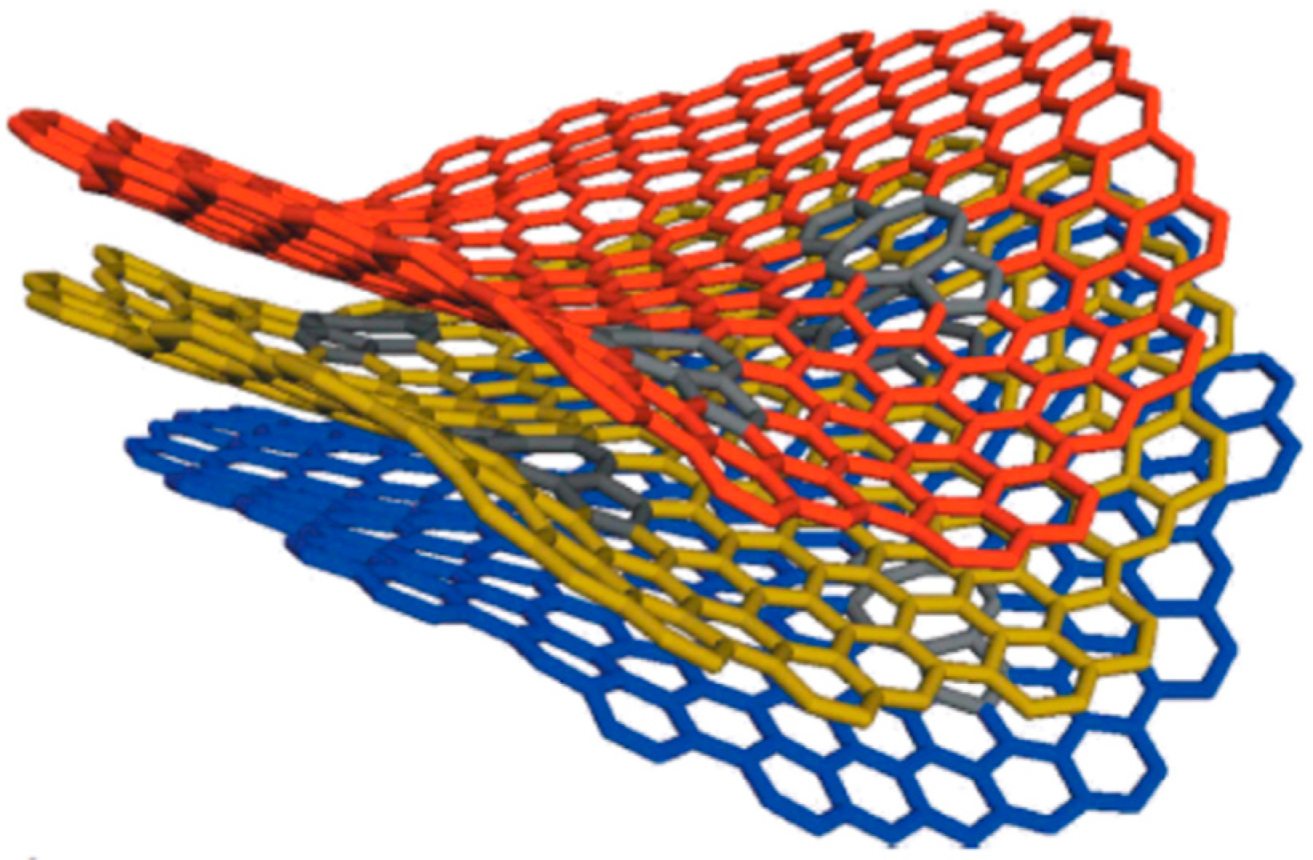
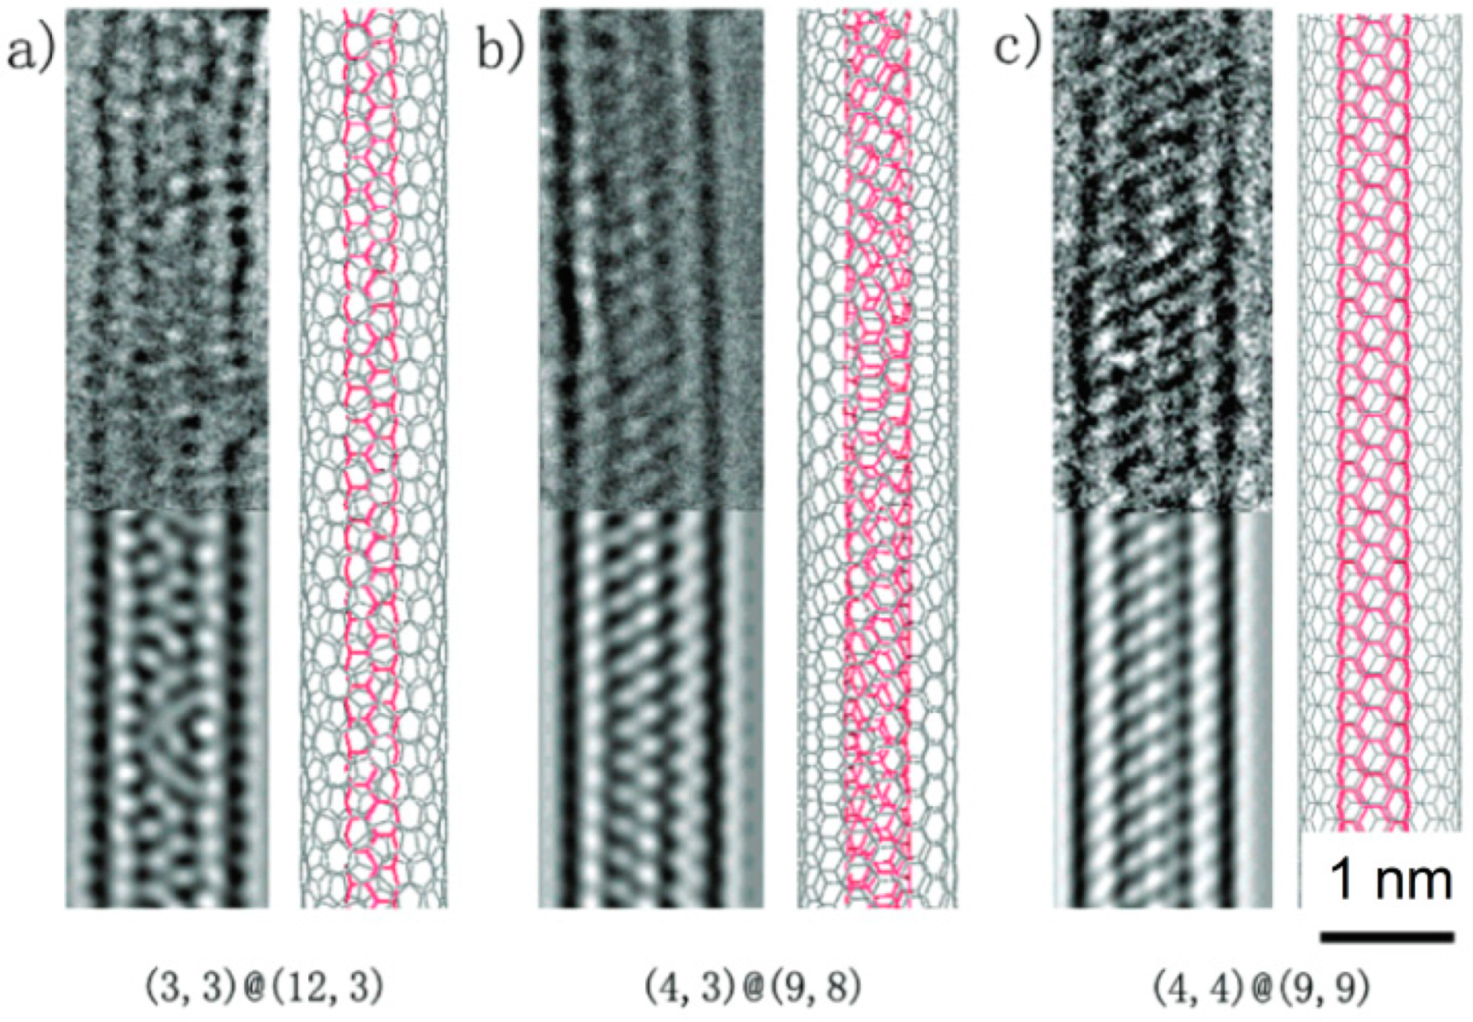
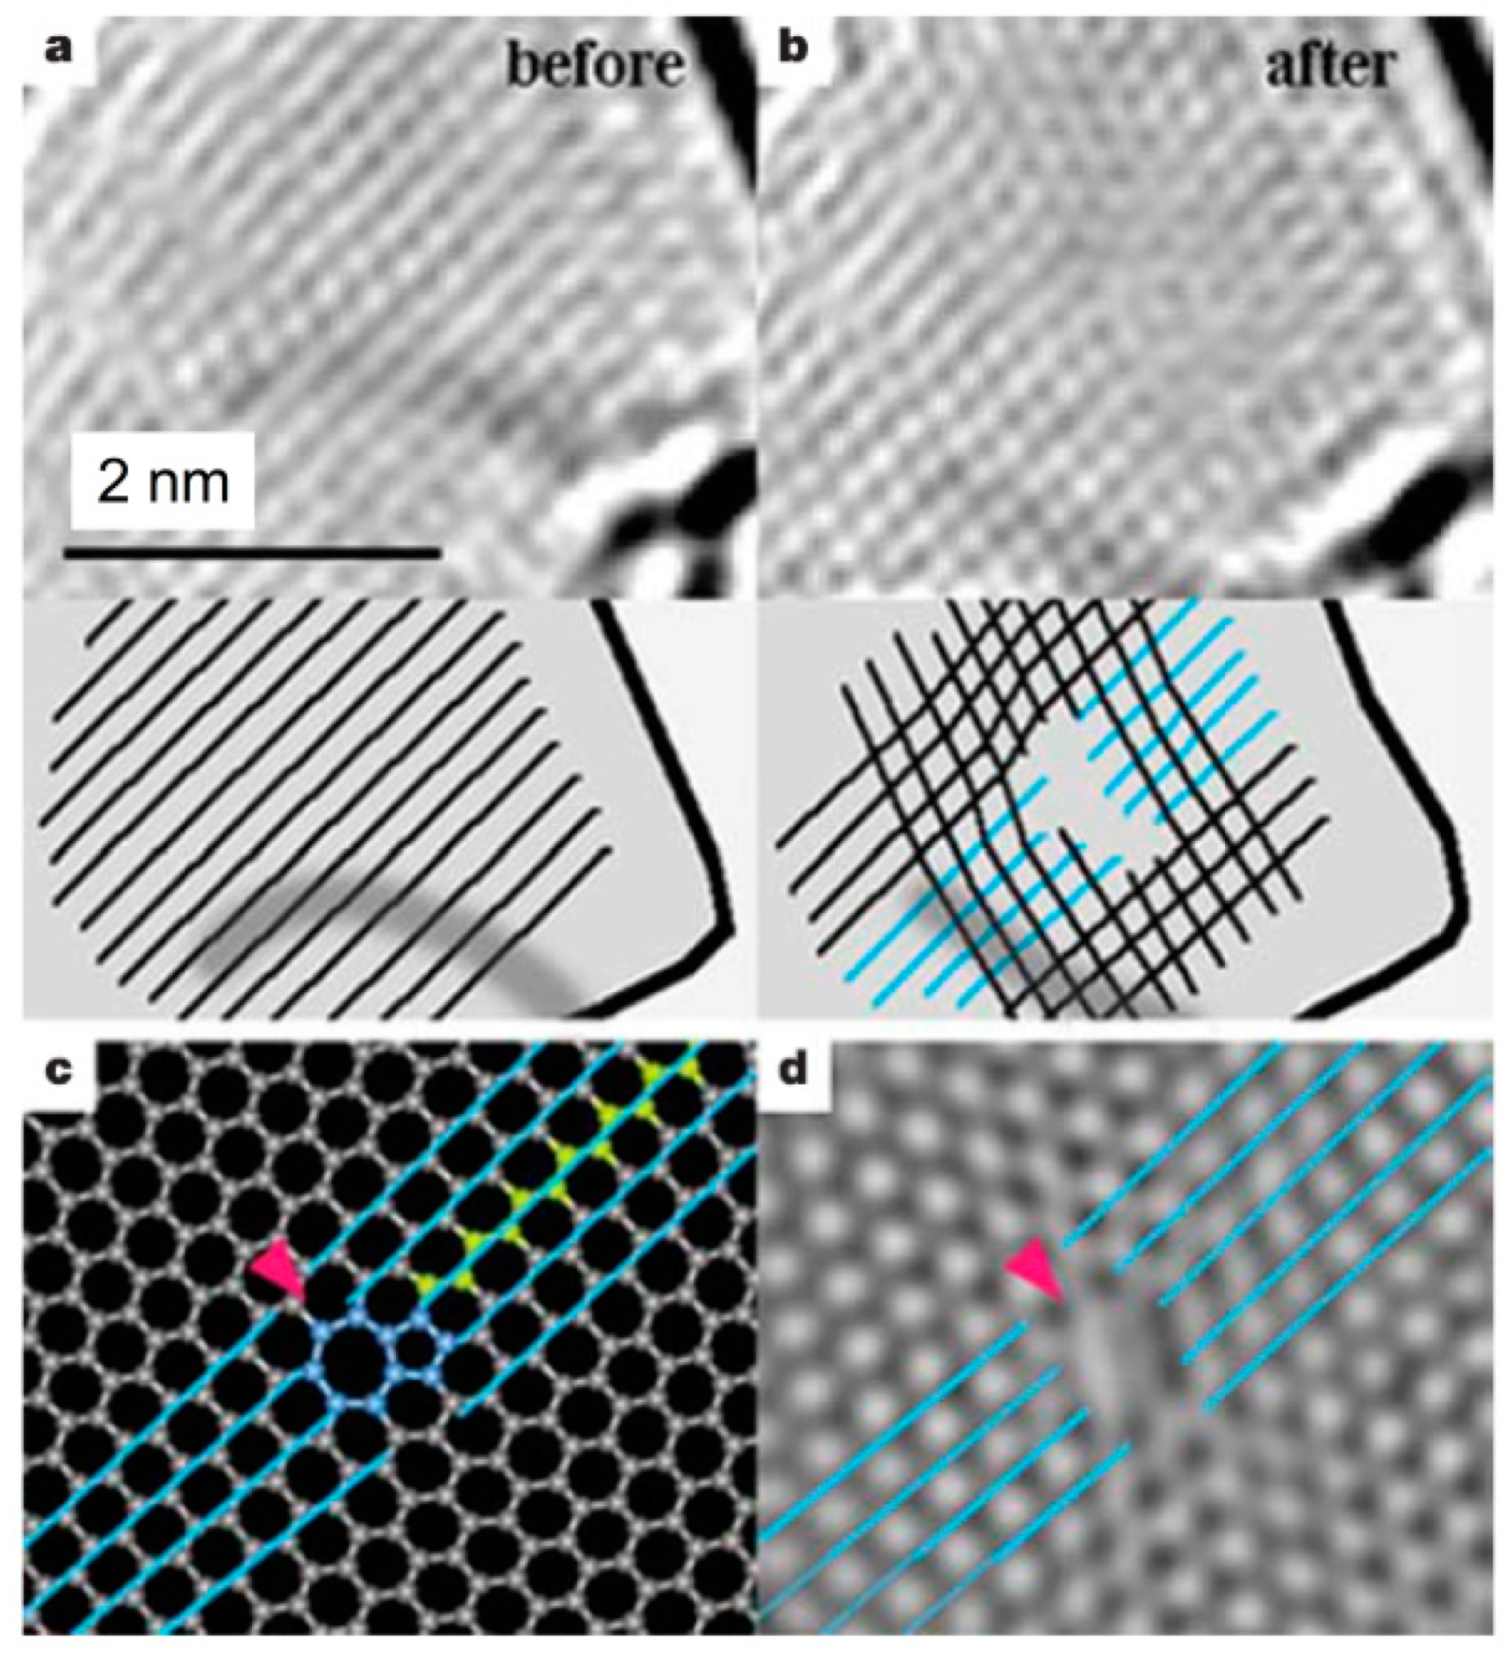
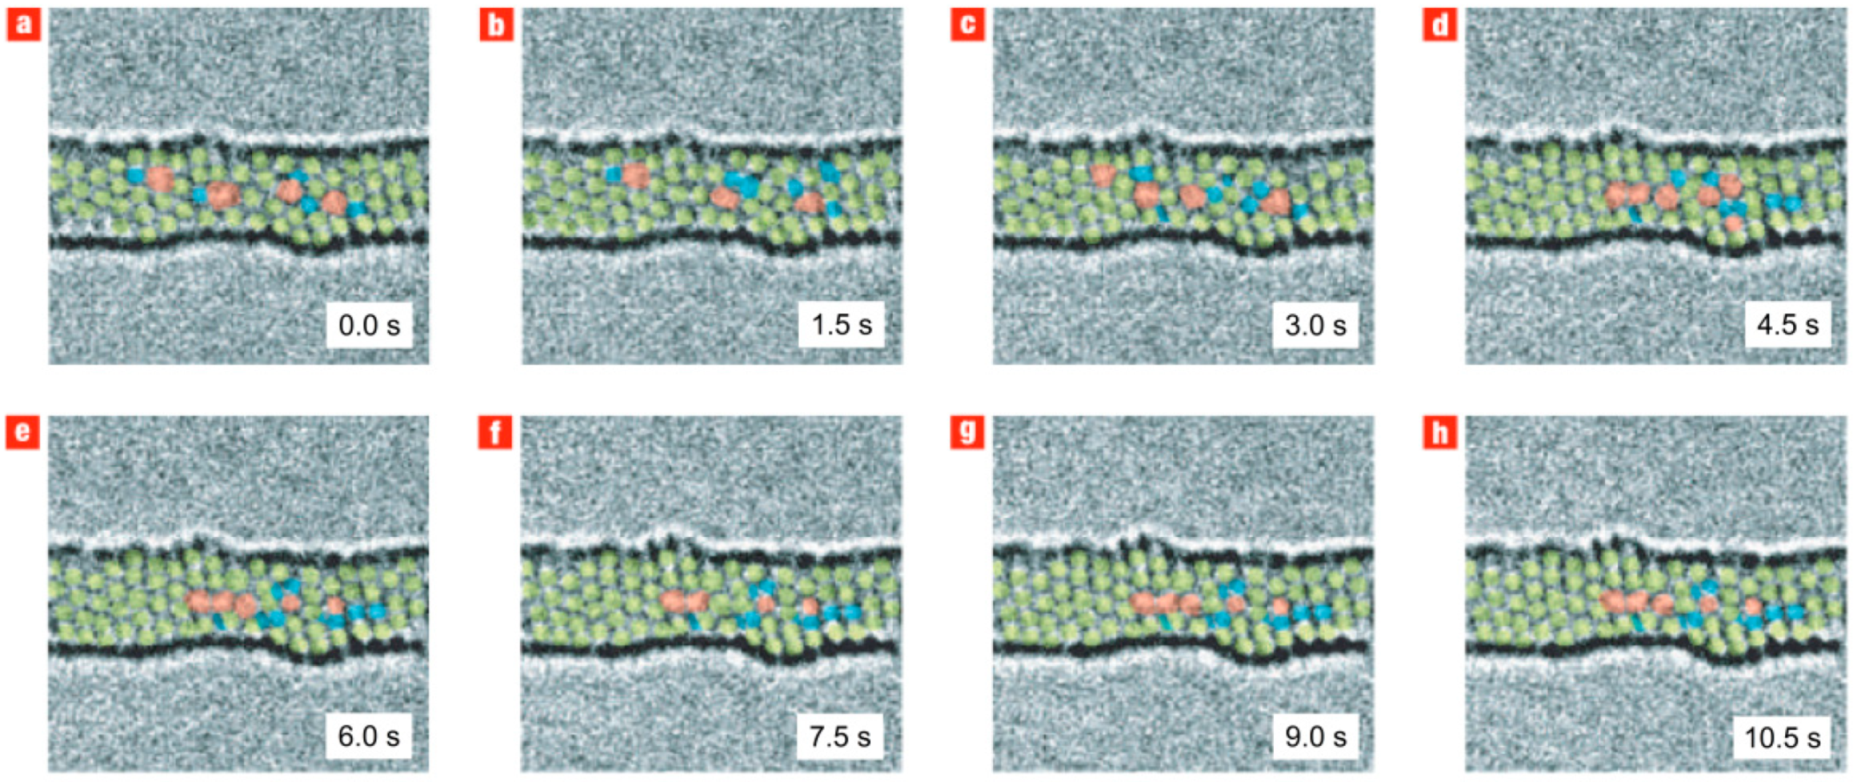
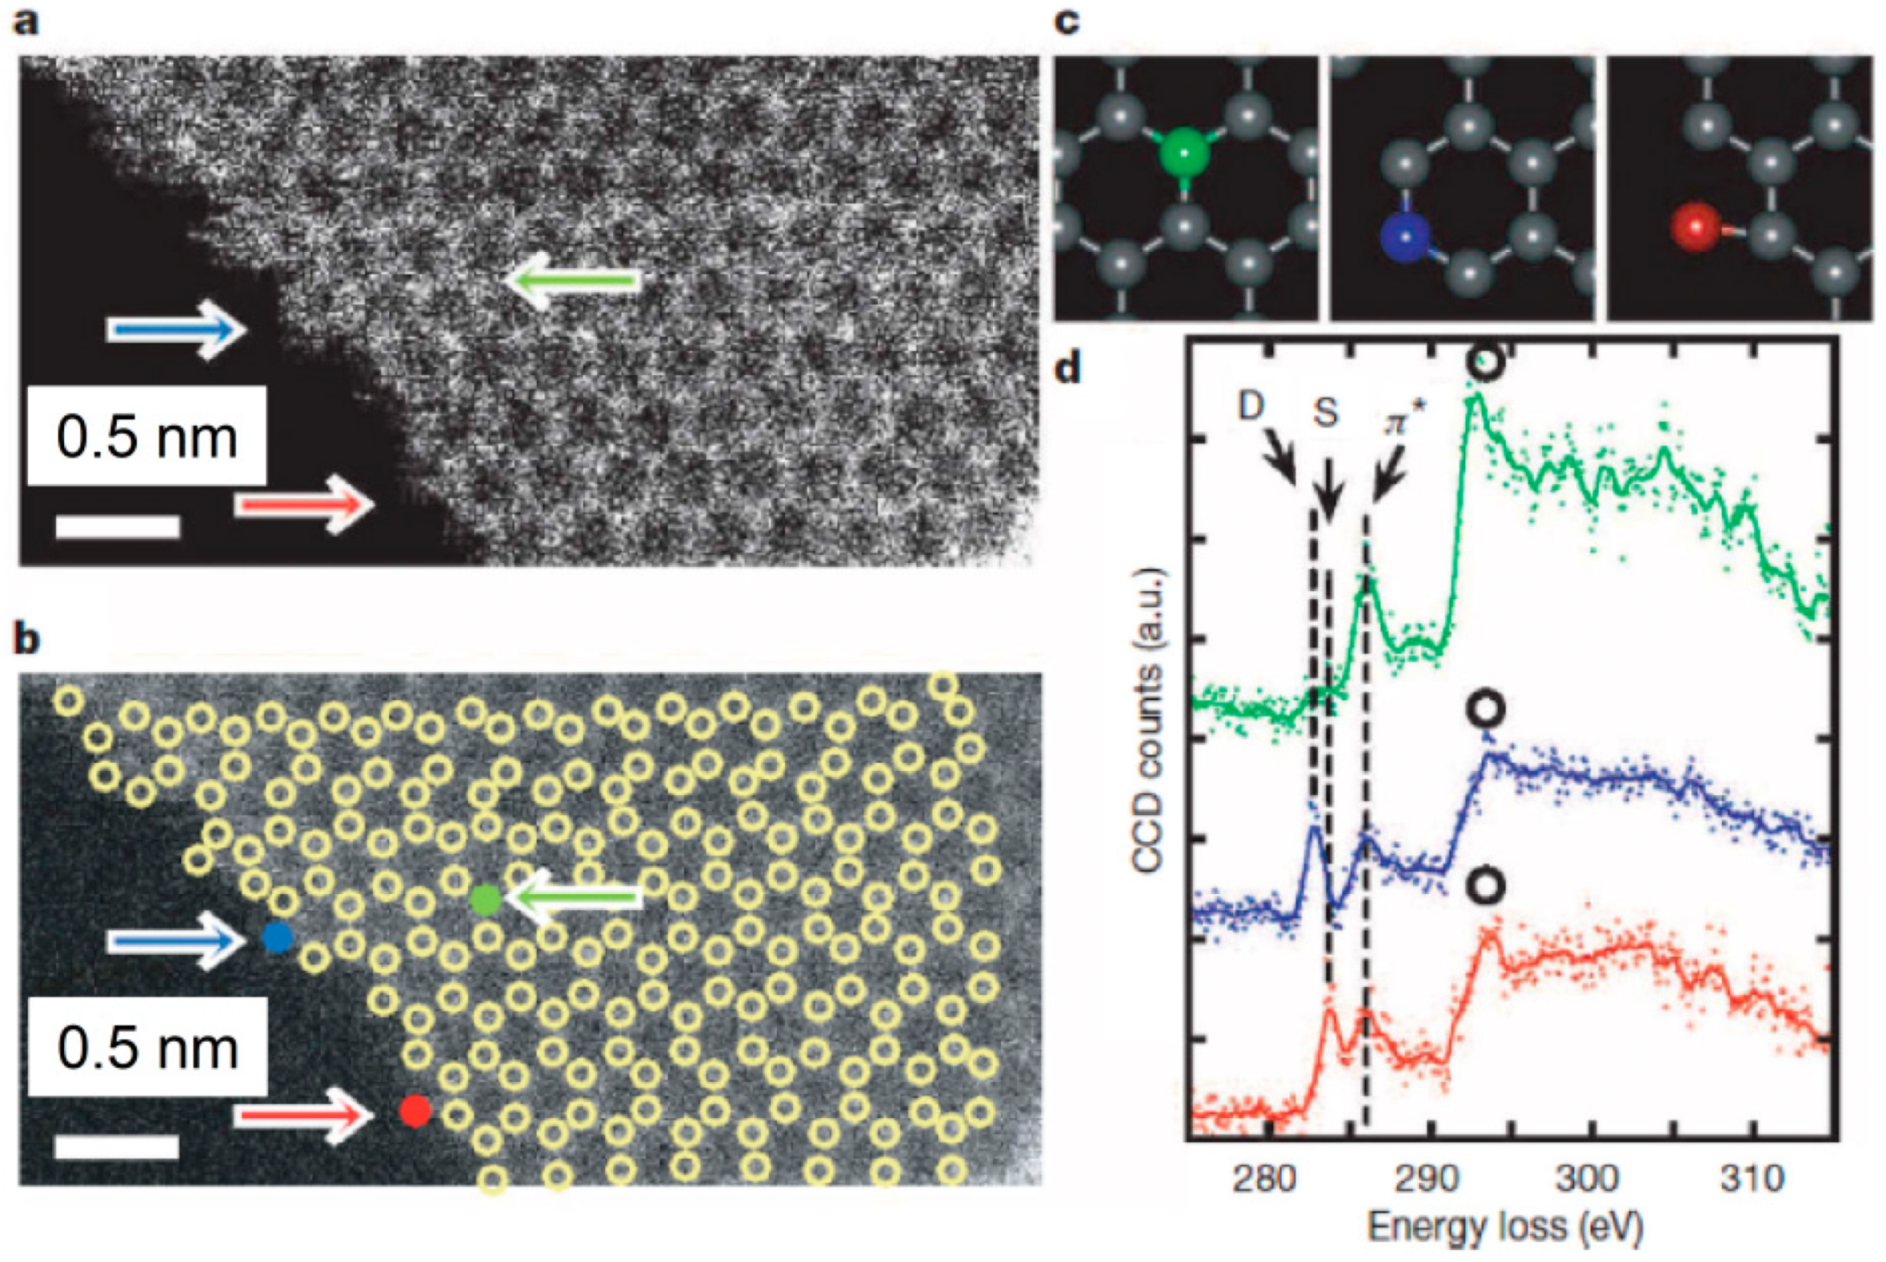
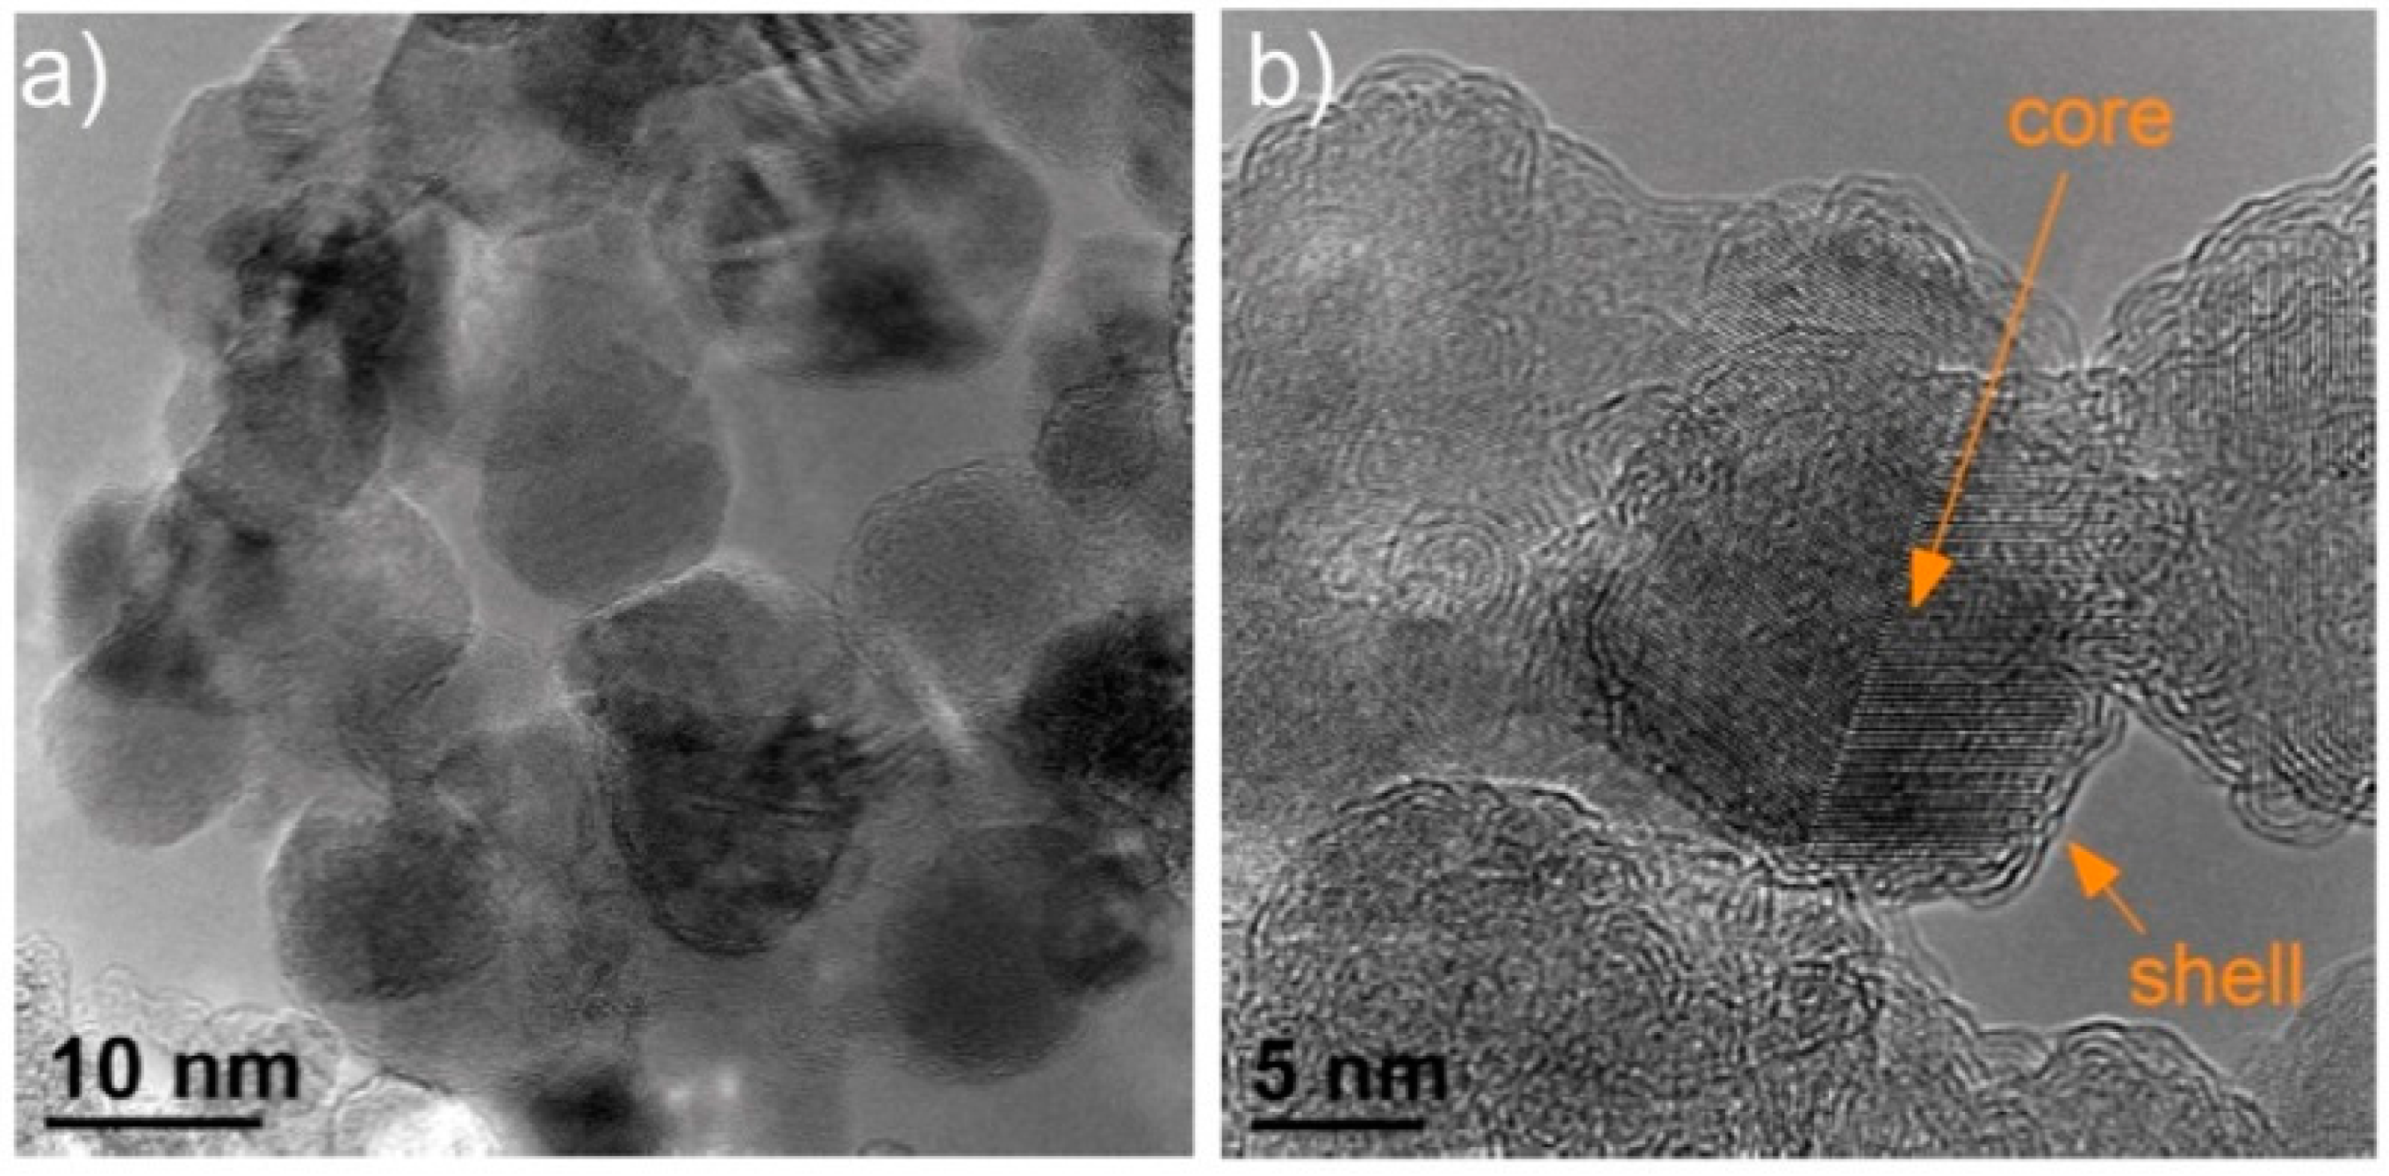
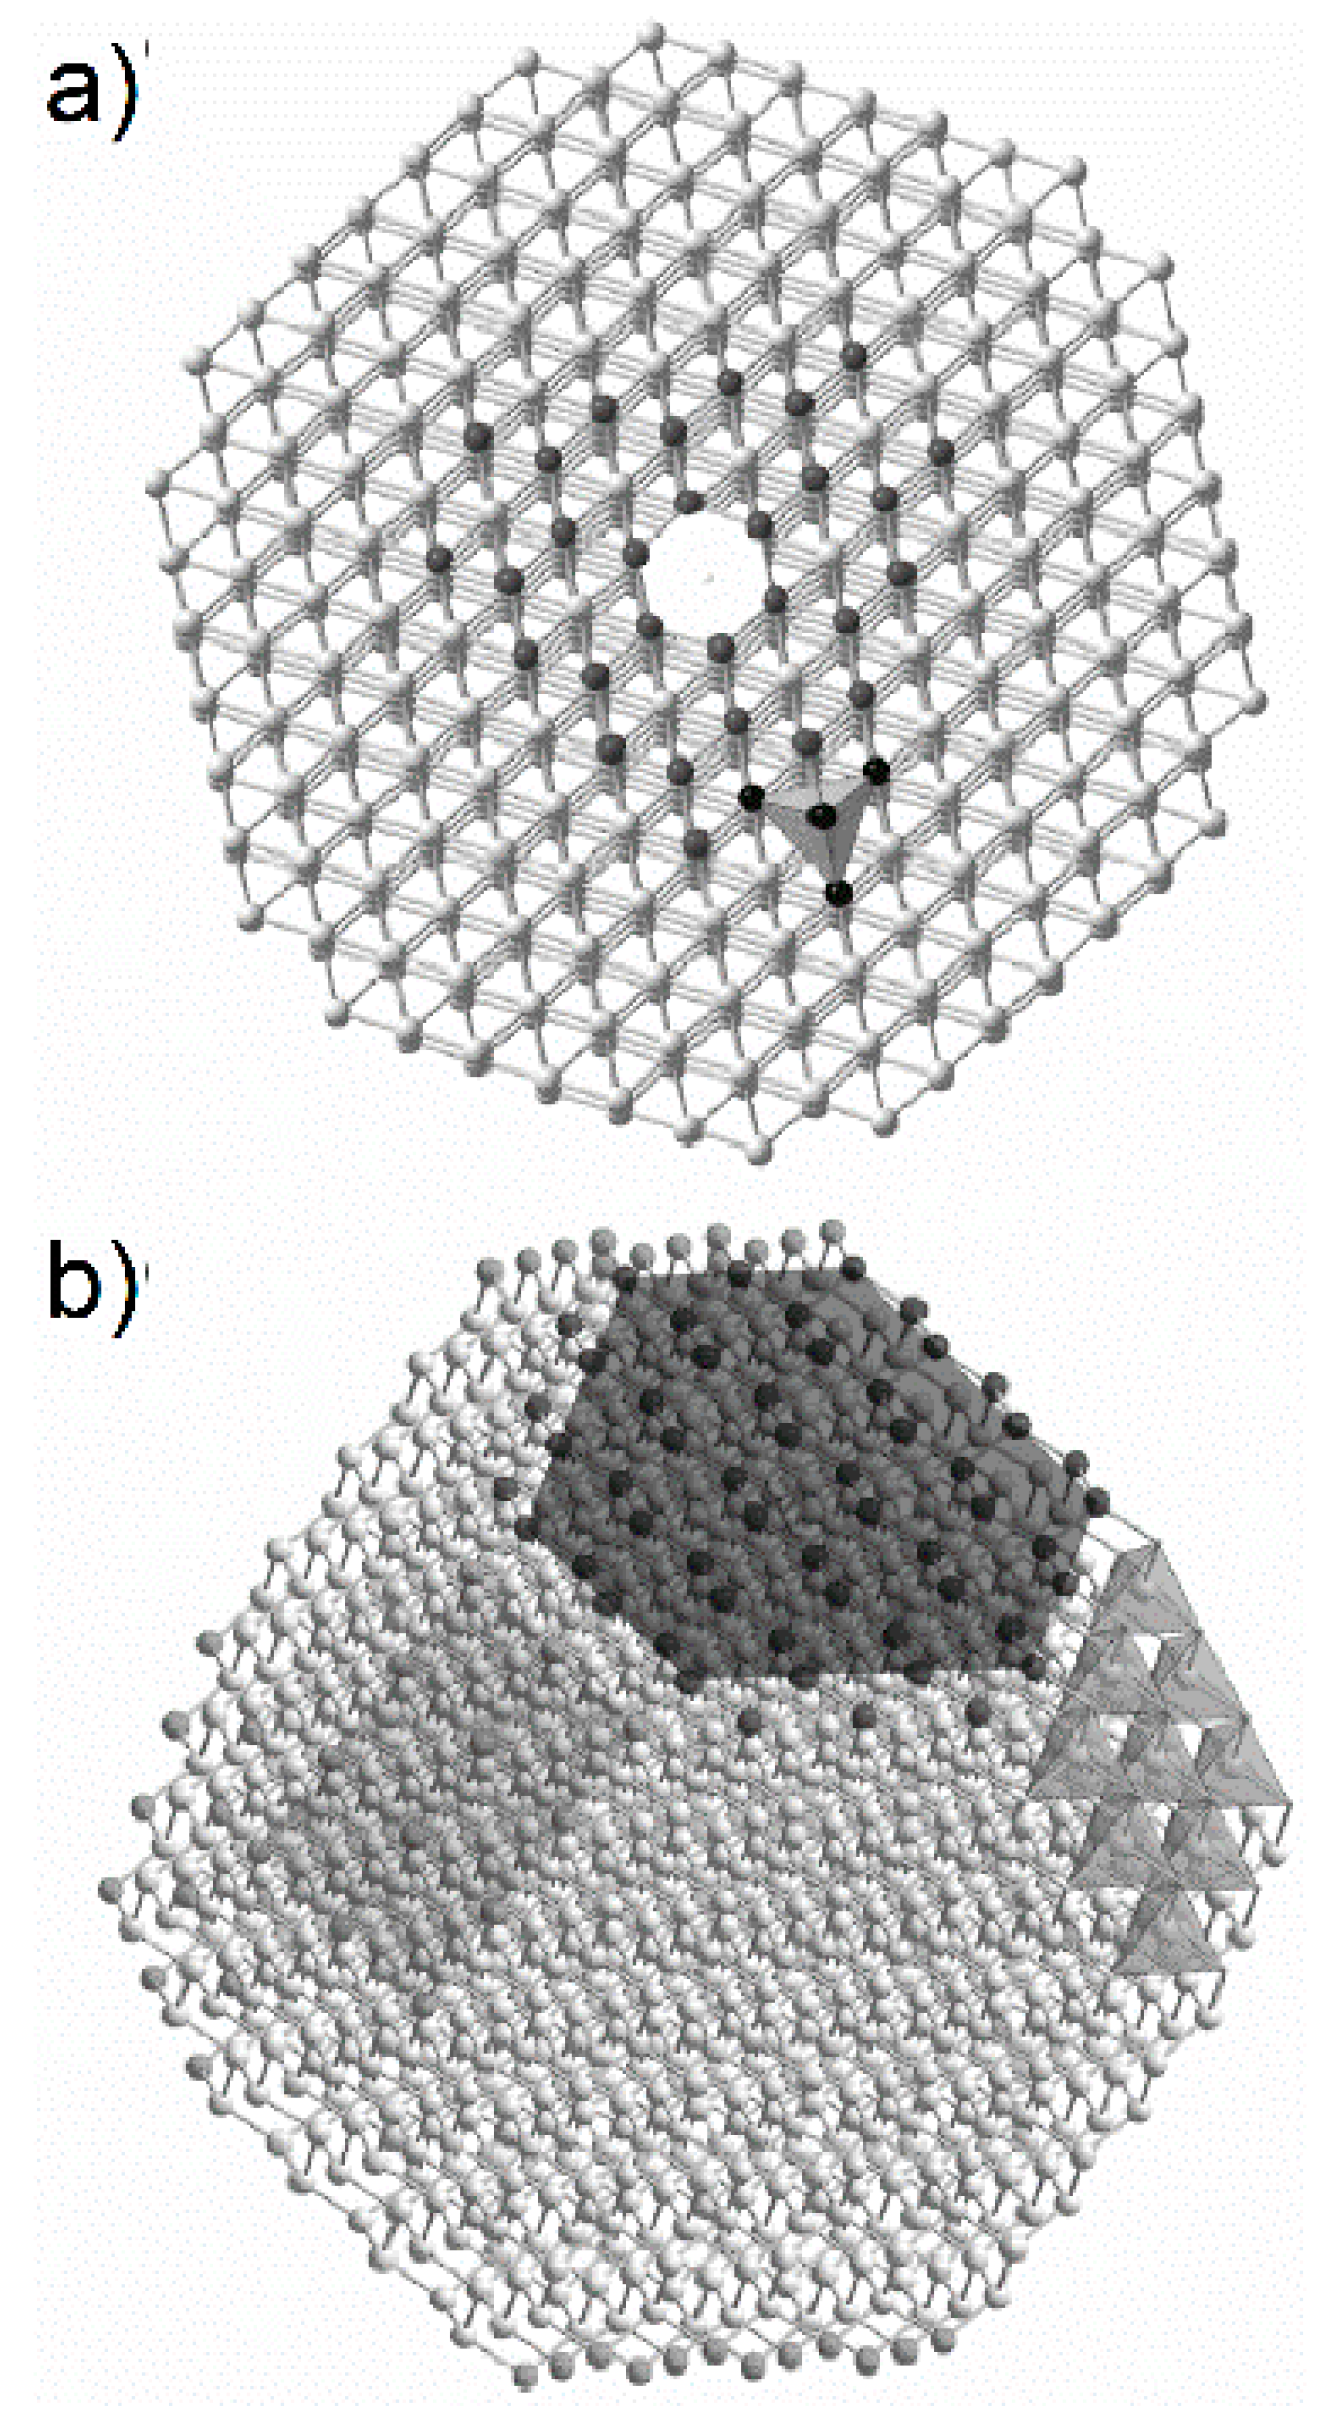
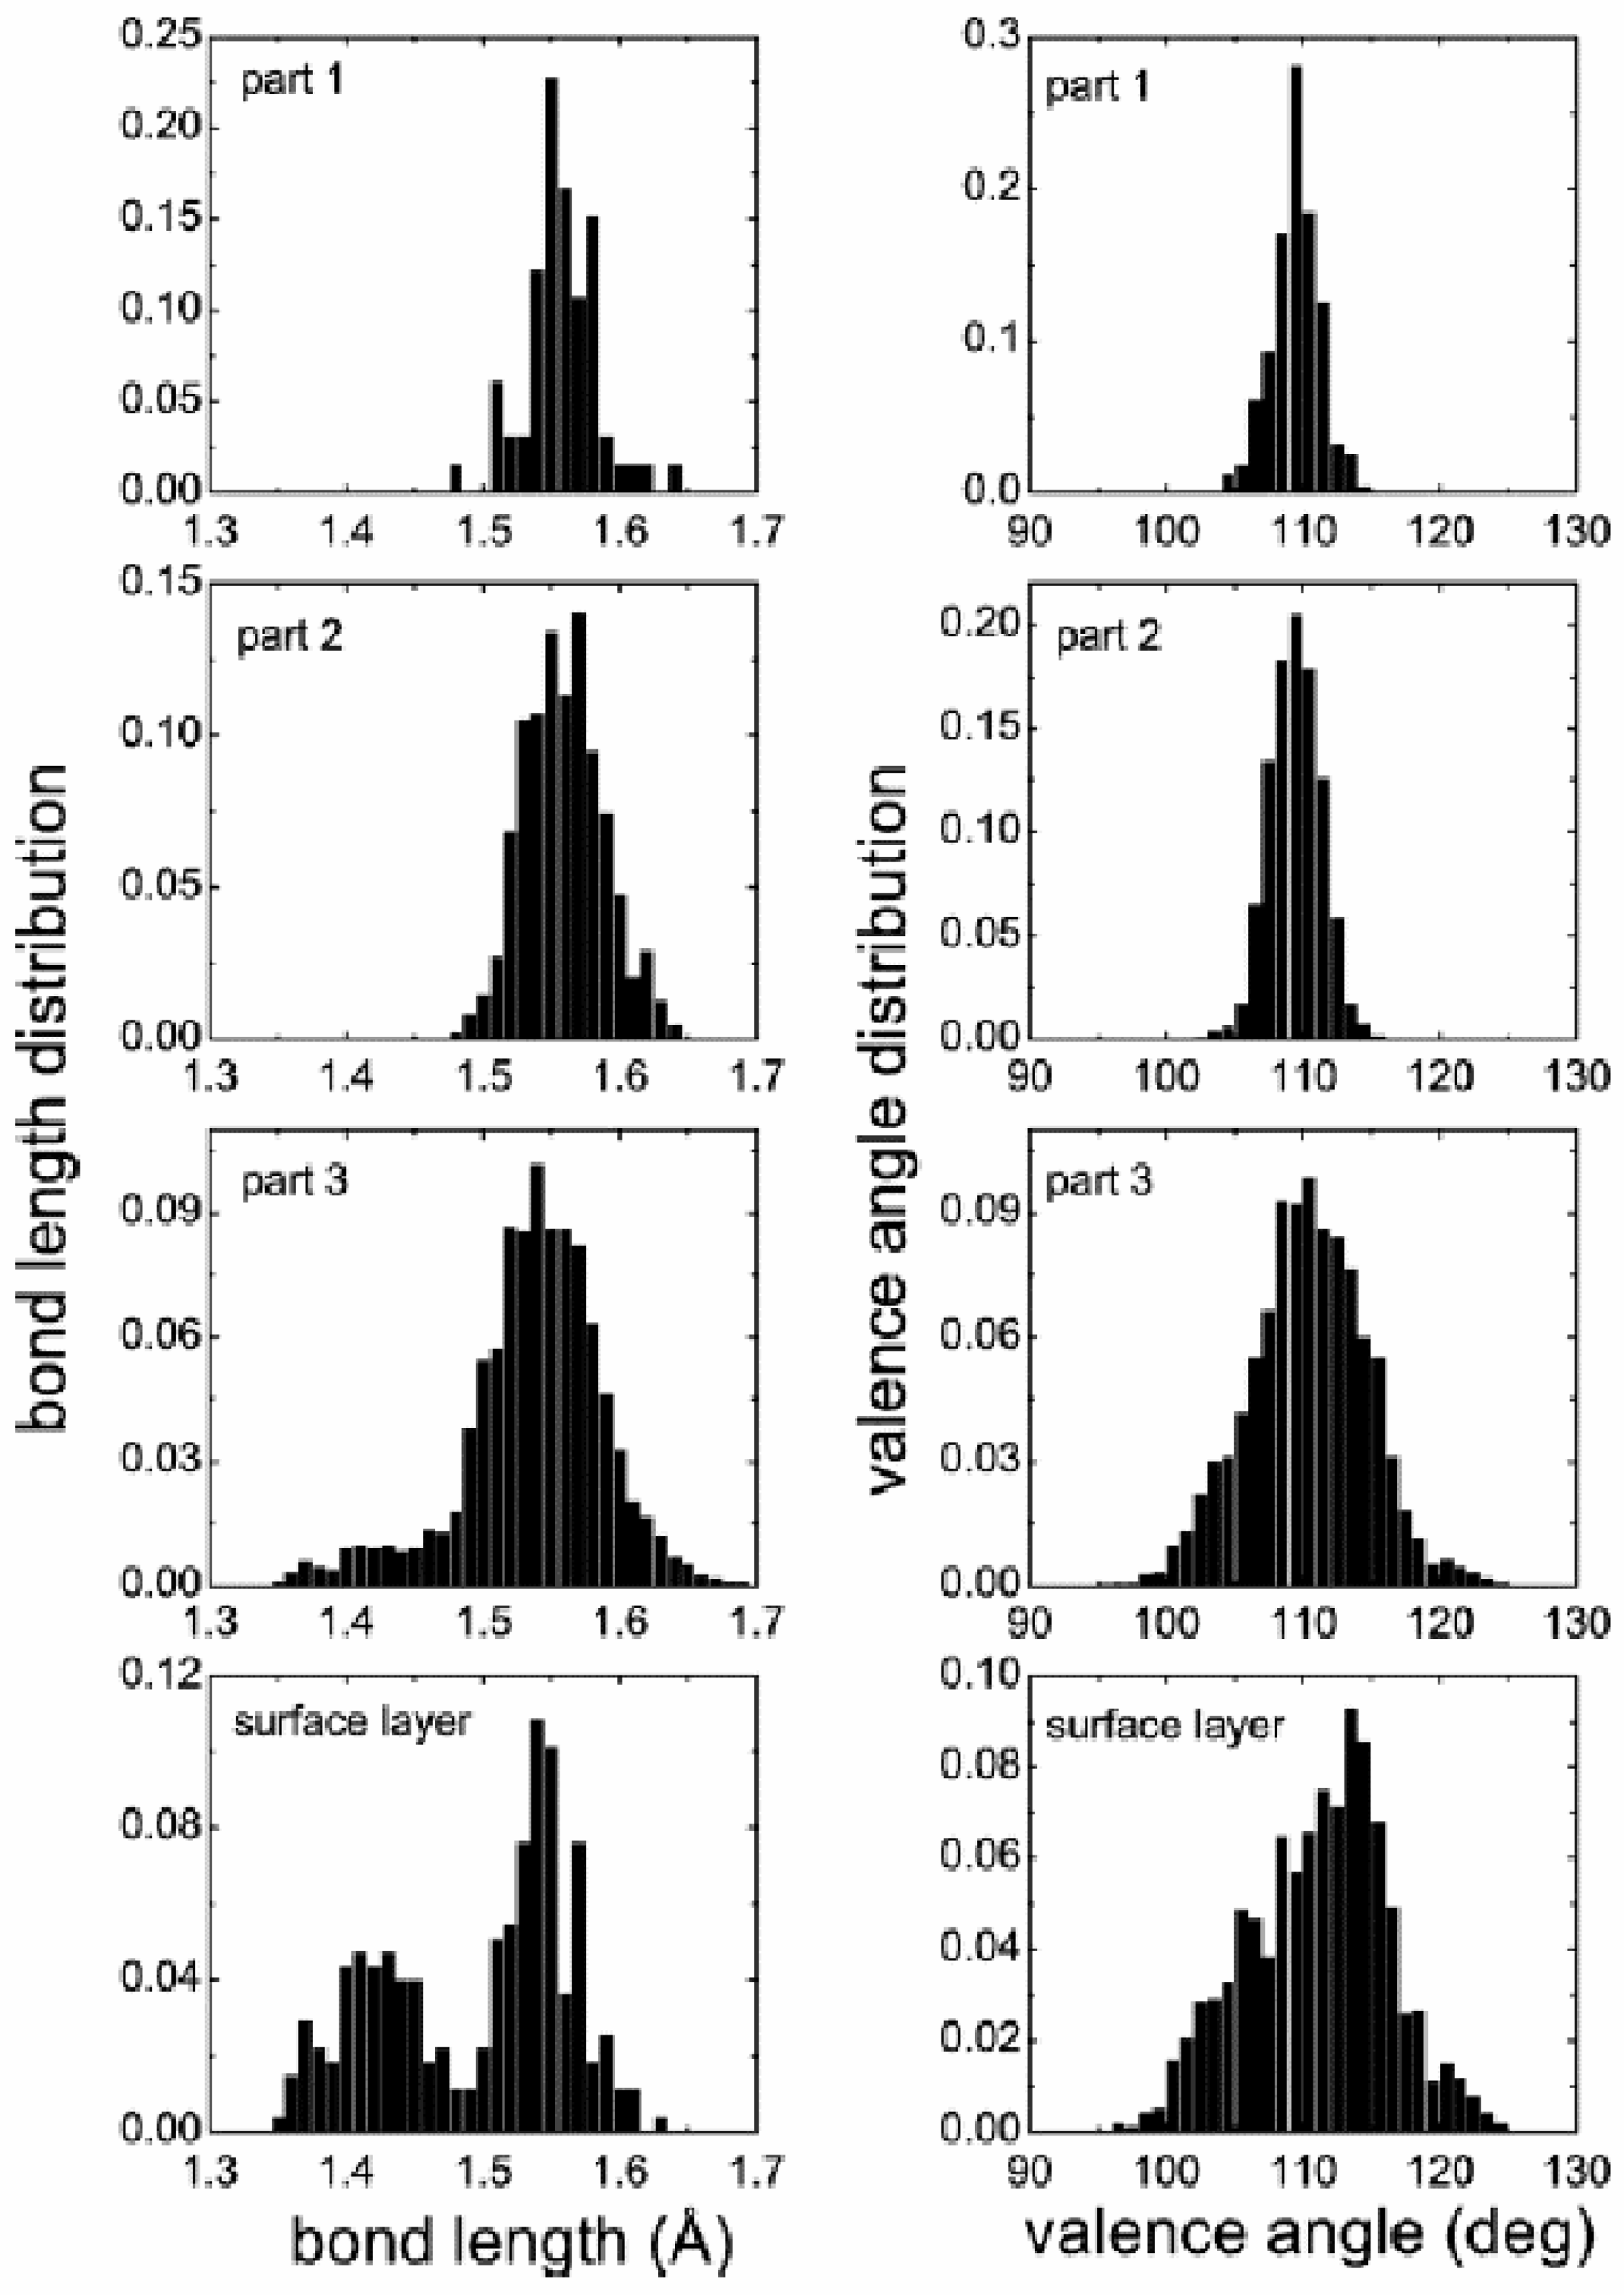
Table 1.
Structural parameters (average interlayer spacing between carbon layers, d002, and average size of basic structural units in direction perpendicular to layers, Lc) obtained from analysis of XRD patterns for raw and heat-treated (HTT) at 2600 °C commercial carbon blacks. Reproduced with permission from Pawlyta et al. [46]. Copyright Elsevier, 2015.
| Grade | Untreated Sample | HTT, 2600 °C | ||
|---|---|---|---|---|
| d002 (nm) | Lc (nm) | d002 (nm) | Lc (nm) | |
| Printex 25 | 0.356 | 1.79 | 0.343 | 8.51 |
| Printex 60 | 0.359 | 1.15 | 0.345 | 4.91 |
| Printex 90 | 0.363 | 1.00 | 0.345 | 3.43 |
| Colour Black FW200 | 0.359 | 1.24 | 0.344 | 2.73 |
| Printex XE2B | 0.349 | 1.15 | 0.343 | 4.81 |
Table 2.
Comparison of structural parameters for phenol-formaldehyde-based carbon heat-treated at 1000 °C and 1400 °C from XRD and TEM techniques. Reproduced with permission from Sharma et al. [78]. Copyright Elsevier, 2000.
Table 2.
Comparison of structural parameters for phenol-formaldehyde-based carbon heat-treated at 1000 °C and 1400 °C from XRD and TEM techniques. Reproduced with permission from Sharma et al. [78]. Copyright Elsevier, 2000.
| Sample | Interlayer Spacing d, nm | Average Number of Layers/Stack | Average Layer Diameter, nm | ||||||
|---|---|---|---|---|---|---|---|---|---|
| XRD | TEM | ||||||||
| XRD | TEM | XRD | TEM | Scherrer Method | Diamond Method | ||||
| PFC 10 | 0.38 | 0.38 | 2.5 | 2.4 | 2.6 | 3.6 | 3.4 | 1.2 | 1.1 |
| PFC 14 | 0.37 | 0.38 | 2.6 | 2.4 | 2.8 | 3.8 | 3.9 | 1.4 | 1.3 |
© 2018 by the authors. Licensee MDPI, Basel, Switzerland. This article is an open access article distributed under the terms and conditions of the Creative Commons Attribution (CC BY) license (http://creativecommons.org/licenses/by/4.0/).
Share and Cite
MDPI and ACS Style
Jurkiewicz, K.; Pawlyta, M.; Burian, A. Structure of Carbon Materials Explored by Local Transmission Electron Microscopy and Global Powder Diffraction Probes. C 2018, 4, 68. https://doi.org/10.3390/c4040068
AMA Style
Jurkiewicz K, Pawlyta M, Burian A. Structure of Carbon Materials Explored by Local Transmission Electron Microscopy and Global Powder Diffraction Probes. C. 2018; 4(4):68. https://doi.org/10.3390/c4040068
Chicago/Turabian StyleJurkiewicz, Karolina, Mirosława Pawlyta, and Andrzej Burian. 2018. "Structure of Carbon Materials Explored by Local Transmission Electron Microscopy and Global Powder Diffraction Probes" C 4, no. 4: 68. https://doi.org/10.3390/c4040068
Note that from the first issue of 2016, this journal uses article numbers instead of page numbers. See further details here.