Article

Kinetic and Equilibrium Study of the Adsorption of CO2 in Ultramicropores of Resorcinol-Formaldehyde Aerogels Obtained in Acidic and Basic Medium

by
Jhonatan R. Guarín Romero
1,
Juan Carlos Moreno-Piraján
1,* and
Liliana Giraldo Gutierrez
2
1
Departamento de Química, Facultad de Ciencias, Grupo de Investigación en Sólidos Porosos y Calorimetría, Universidad de los Andes, Bogotá 111711, Colombia
2
Departamento de Química, Facultad de Ciencias, Grupo de Calorimetría, Universidad Nacional de Colombia, Bogotá 111321, Colombia
*
Author to whom correspondence should be addressed.
Submission received: 30 July 2018 / Revised: 7 September 2018 / Accepted: 12 September 2018 / Published: 20 September 2018

Abstract

:
In this work, aerogels were prepared using resorcinol-formaldehyde as a precursor in two synthetic routes, one basic and one acidic, to perform the adsorption of CO2 at 0 °C and atmospheric pressure. Aerogels were Characterization by N2 and CO2 Physisorption, Raman Spectroscopy, Scanning Electron Microscopy, and Infrared Spectroscopy. In general, was found that aerogels have a polymeric, disordered, three-dimensional structure and have a microporous surface. Langmuir, Freundlich, Sips and Toth equilibrium models present a good data fit of CO2 adsorption at relative pressure ranging between 1 × 10⁻⁴ and 3 × 10⁻². The diffusion intra-particle kinetic model explains the setps of this process; the Elovich model also showed a good fit, therefore, there are an energetic heterogeneity of the CO2 superficial adsorption sites. The aerogel carbonized in basic medium at 1050 °C (ACB 1050) material was the best adsorbent of this pollutant, reaching an adsorption capacity of 6.43 mmol g−1.

Graphical Abstract

1. Introduction

Global warming caused by greenhouse gases is leading to the destabilization of marine ecosystems, the rise in sea levels, and the acidification of the oceans [1]. CO2 is the main contributor to these phenomena due to industrialization processes [2]. During the last several decades, CO2 concentration has increased considerably [3] due to the combustion of fossil fuels [4] and other human activities, such as the cement industry [5]. Currently, fossil-fueled power stations are the most potential sources of CO2 emission, releasing more than a third of global emissions [4], and in the future humans will continue to depend on this source of energy, thus continue to emit CO2 if corrective measures are not taken [6].
Eight-five percent of world energy is fueled using fossil fuels, due to its inherent availability, energy density, and our modern economic society [7]. About 60% of the effects of global warming are due to CO2, even though methane and chlorofluorocarbons have a much greater greenhouse effect in relation to the mass of the gases. CO2 emission has increased in recent years [2], and the international panel on climate change (IPCC) stated that the average concentration of CO2 could rise to 570 ppm by 2100, causing a 1.9 °C increase in the average global temperature and a 38 cm increase in sea level [8]. For this reason, CO2 has become a threat to the environment [2].
Recently, the Paris agreement was signed by the Parties of the United Nations with the aim of strengthening the global response to the threat of climate change, where an agreement was made to maintain a global temperature increase below 2 °C in comparison to pre-industrial levels [9].
Achieving economic and favorable separation of CO2 from gas mixtures represents one of the main technological and environmental problems facing our society today [10]. The most studied post-combustion technology is chemical adsorption. Monoethanol amine (MEA) has been the chemical most used for this purpose. Alternative solvents, such as piperazine and ammonia, have also been proposed to achieve this objective [6]. The advantage of this method is the low partial pressure that is used because the CO2 molecules are easily absorbed over liquids in flue gas streams [11]. The disadvantage is that the use of amine alkoxysilanes is very expensive [12], and the method requires high regeneration energy due to the large emission of combustion gases and the costs of repairing the process equipment [4]. Other common methods to achieve CO2 sequestration include separation in membranes, cryogenic and biological methods, and physical adsorption [13].
Capture and storage technology has been considered the best option to reduce carbon dioxide emissions from large sources, and particularly adsorption is considered a promising process to separate gas mixtures [14]. This process is inexpensive, requires less regeneration energy, is easy to handle, has fast kinetics, and has a high capacity of CO2 adsorption and selectivity [4]. The adsorbents provide a high surface area, which is a fundamental parameter in this process. Among the different adsorbents, 13X zeolite has been investigated to adsorb CO2 by oscillating the pressure [6]. It is generally recognized that CO2 is physically adsorbed to activated carbon, mainly by condensation or liquefaction in pores with widths that are less than 1 nm [15]. The adsorption of this greenhouse gas in nanopore materials has also been investigated in zeolites exchanged with alkali metals, amino-modified and modified alkaline, mesoporous silicas, microporous polymers, carbons, and metalorganic structures [10]. It has also been established that the chemical properties of activated carbon play a relevant role in this process [15]. Porous composite carbon materials are especially promising because they are economical, easy to synthesize and regenerate, and, according to the parameters used during the synthesis, a porous structure with great chemical, thermal, and mechanical stability can be obtained [16].
In view of the growing exponential demand for energy in various applications worldwide and to meet the long-term goal of reducing CO2 emissions, it is necessary to develop more efficient technologies and profitable adsorbents for the capture and sequestration of CO2. In the present work, carbon aerogels were synthesized using resorcinol-formaldehyde precursors with two different synthesis routes (basic and acidic) and using suitable synthesis conditions to obtain materials with a high adsorption capacity of this pollutant.

2. Experimental

2.1. Synthesis

Aerogels were synthesized by the sol-gel method [17]. In this process, the starting precursors resorcinol and formaldehyde were mixed with a resorcinol/formaldeyde (R/F) ratio of 0.5, and deionized water was added as a solvent in a resorcinol/water (R/H2O) ratio of 0.0757. The catalysts used in basic and acidic media were Na2CO3 and HCl, respectively, in a 1500 resorcinol/catalyst (R/C) ratio. The resulting solutions were agitated for 30 min and placed in polypropylene molds. Then, the thermal treatment stage was carried out, during which hydrogels were left at 25 °C for one day, 50 °C for two days, and finally 80 °C for three days. After the hydrogels were cooled to room temperature, the solvent was allowed to exchange with acetone for three days. For supercritical drying with CO2, a high-pressure reactor was used at 40 °C with a pressure of 120 bar.

2.2. Carbonization

The obtained resorcinol/formaldehyde (RF) organic aerogels were carbonized [17] in a tubular furnace with a quartz tube under N2 flow at 80 mL min−1 using the following ramp cycle: 25–250 °C in 60 min, held at 250 °C for 30 min, 250–600 °C in 300 min, held at 600 °C for 30 min, 600–1050 °C in 180 min, and kept at 1050 °C for 240 min. Then, the furnace was allowed to cool down to room temperature under N2 flow. The obtained RF carbon aerogel samples in basic and acidic medium were labeled as ACB 1050 (Aerogel Carbonized in Basic medium at 1050 °C) and ACA 1050 (Aerogel Carbonized in Acid medium at 1050 °C), respectively.

2.3. Activation with CO2

Once the carbonization process was carried out, the activation process was done on the samples (ACB 1050 and ACA 1050). For this, a certain amount of solid was weighed and placed inside the tube of a carbolite MFT (Mini Tube Furnace) furnace. Throughout the process, constant CO2 flow was maintained, and the heating temperature was increased at 5 °C/min from room temperature to 850 °C, and the final temperature was maintained for 2 h. It is important to mention that the temperature and time employed in this process were determined by performing Thermogravimetric-Differential Thermogravimetric (TG-DTG) tests (Hitachi STA7000 Series, Schaumburg, IL, USA) to determine the conditions under which CO2 modifies the carbon aerogel. The samples obtained were named AAB 850 and AAA 850 (Aerogel Basic prepared to 850 °C and Aerogel Acid obtained to 850 °C).

2.4. Characterization

After being prepared each of the samples it is necessary to perform a characterization of these in order to set each of the parameters that will allow subsequently analyze its effect on the application that will be given to the samples. The procedures are presented to set each of these parameters.

2.4.1. Physisorption of N2 at −196 °C and CO2 at 0 °C

A sample of 0.1000 g of the synthesized aerogels was degassed at 250 °C and a vacuum of 1 × 10⁻⁵ mbar for a period of 3 h was used to remove all the adsorbed species that could intervene in the adsorption processes (automatic IQ2 sortometer (Quantachrome Inc., Boynton Beach, FL, USA). The corresponding N2 and CO2 adsorption isotherms at −196 °C and 0 °C were obtained in the above equipment with a relative pressure range between 1 × 10⁻⁴ and 3 × 10⁻² for CO2 and 4 × 10⁻⁵ and 1 for N2. The specific surface area was evaluated from the Brunauer-Emmet-Teller (BET) method [18,19,20,21] with the data obtained for N2 relative pressures (P/P0) in a range that meets the requirements for micropore materials (IUPAC 2015) [22]. To determine the volume of ultramicropores of the aerogels, the data obtained from the CO2 adsorption isotherms were analyzed by applying the Dubinin-Radushkevich (DR) model [23]. Additionally, ultramicropore size distribution was determined using the non-local density functional theory (NLDFT) model [24,25]. This was done using the software implemented on the computer. This software was developed by the engineers of Quantachrome instruments (Boynton Beach, FL, USA) and is based on the thermodynamic model between the interface’s liquid-liquid, solid-liquid, gas-gas-gas and solid-gas. The software allows the user to model the results of the isotherms considering, for example, the type of pore that the solid has.

2.4.2. Raman Spectroscopy

Raman spectra were taken on a HORIBA Scientific instrument (Newark, NJ, USA) in a range of 500–2500 cm−1 using a 532 nm laser and a 10× (Near Infrared) (NIR) target. For this analysis, no additional preparation of the samples was performed. This technique was used to demonstrate that the carbonized samples had a disordered structure composed of layers of graphene.

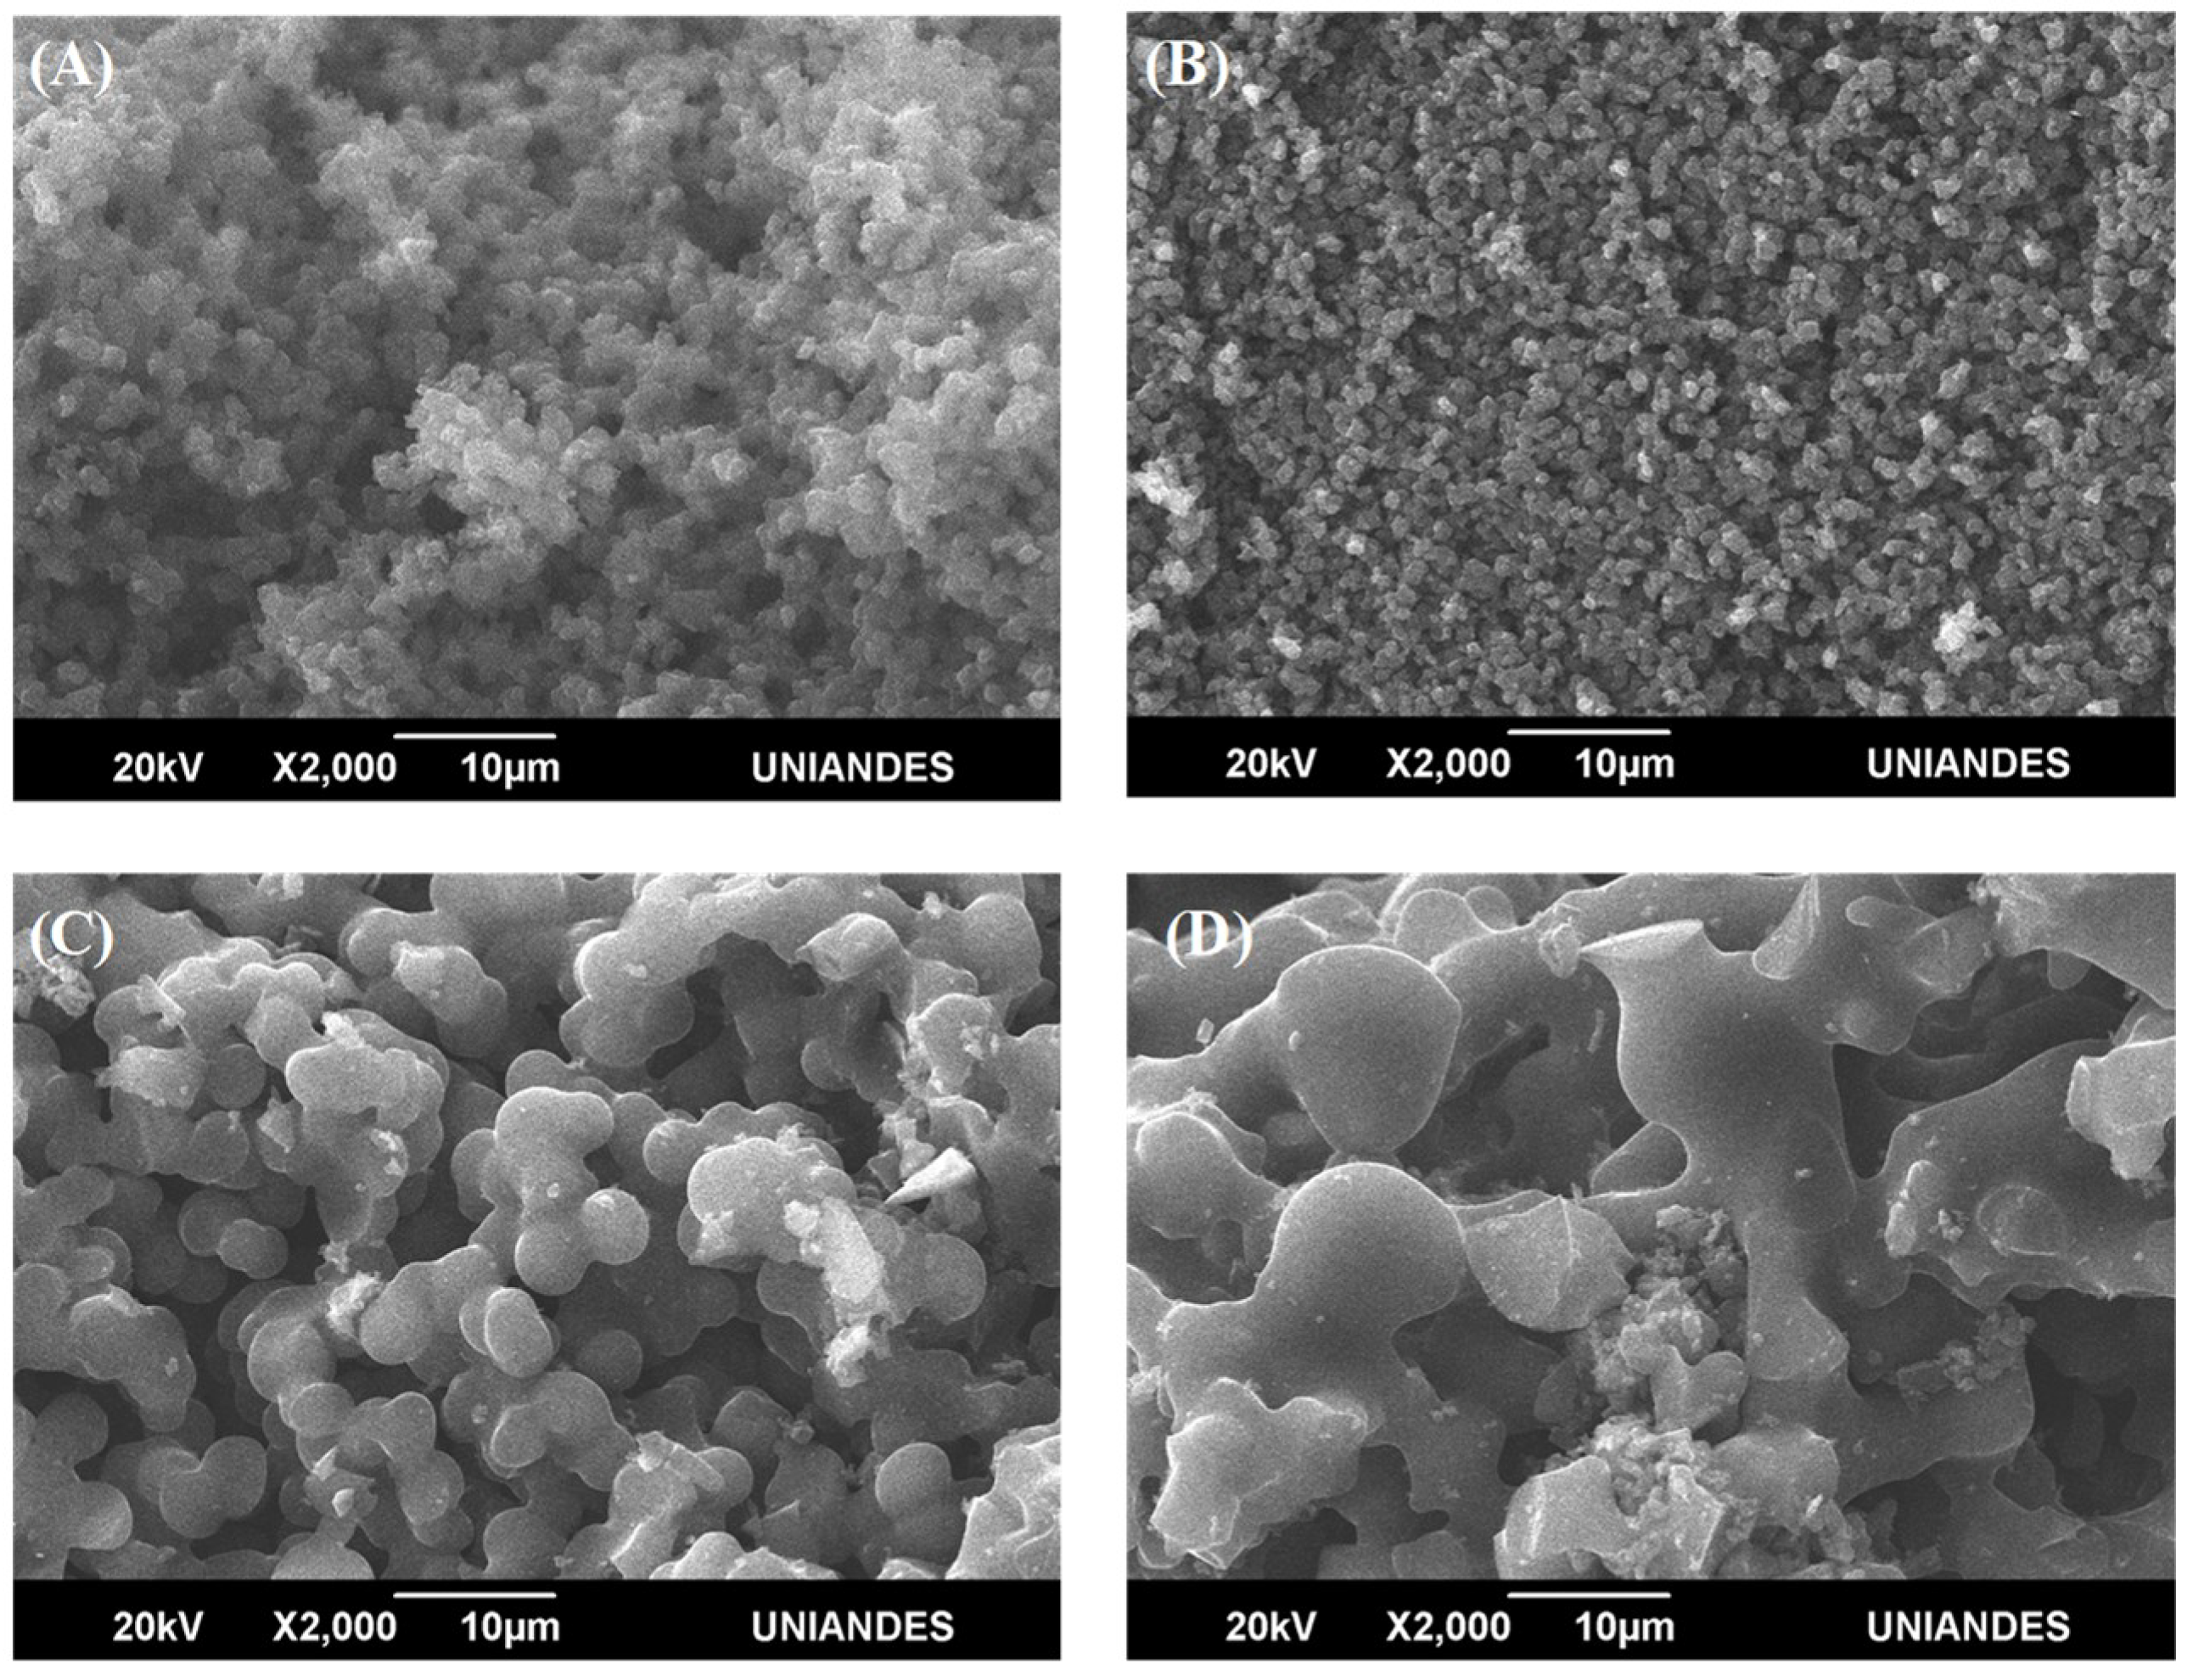
2.4.3. Scanning Electron Microscopy (SEM)

This analysis was performed on a JEOL JSM 6490-LV microscope (Peabody, MA, USA). For this, a certain quantity of aerogel was triturated. Before carrying out this analysis, the aerogel surface was coated with gold using the sputtering method to obtain a conductive surface. This analysis was carried out to observe the material surface and to confirm that the aerogels had a polymeric structure.

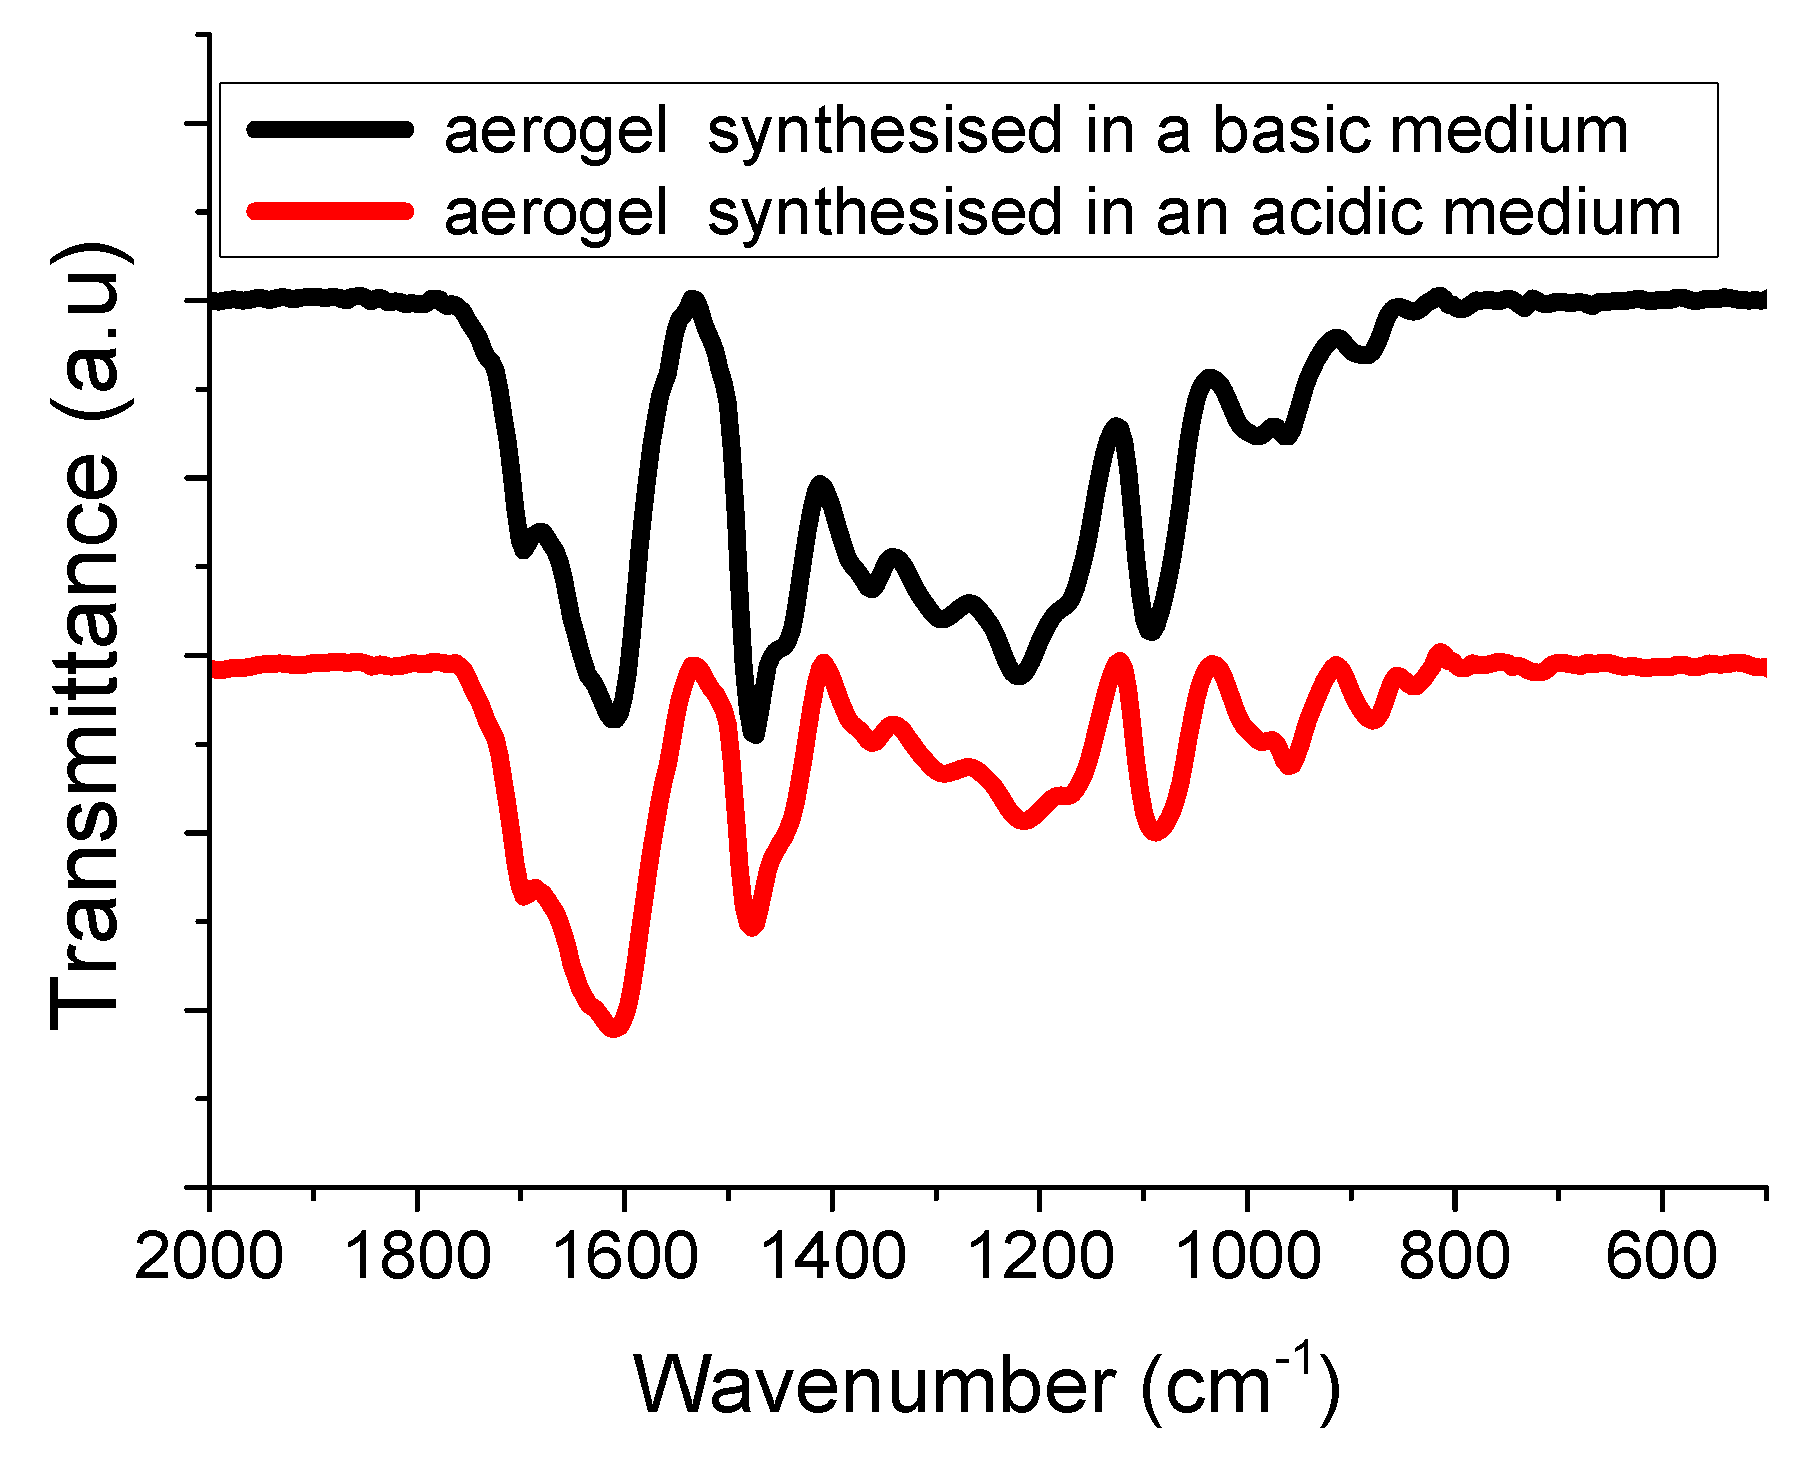
2.4.4. Infrared Spectroscopy

Fourier Transform Infrared Spectra (FTIR) of the aerogels were obtained in a Shimazu (IRT racer-100, Columbia, SC, USA) using a reflectance cell. The pressed granules were prepared by grinding the carbon aerogels and mixing them with KBr in an agate mortar. The spectral data were recorded at wavenumber values of 4000–500 cm−1.

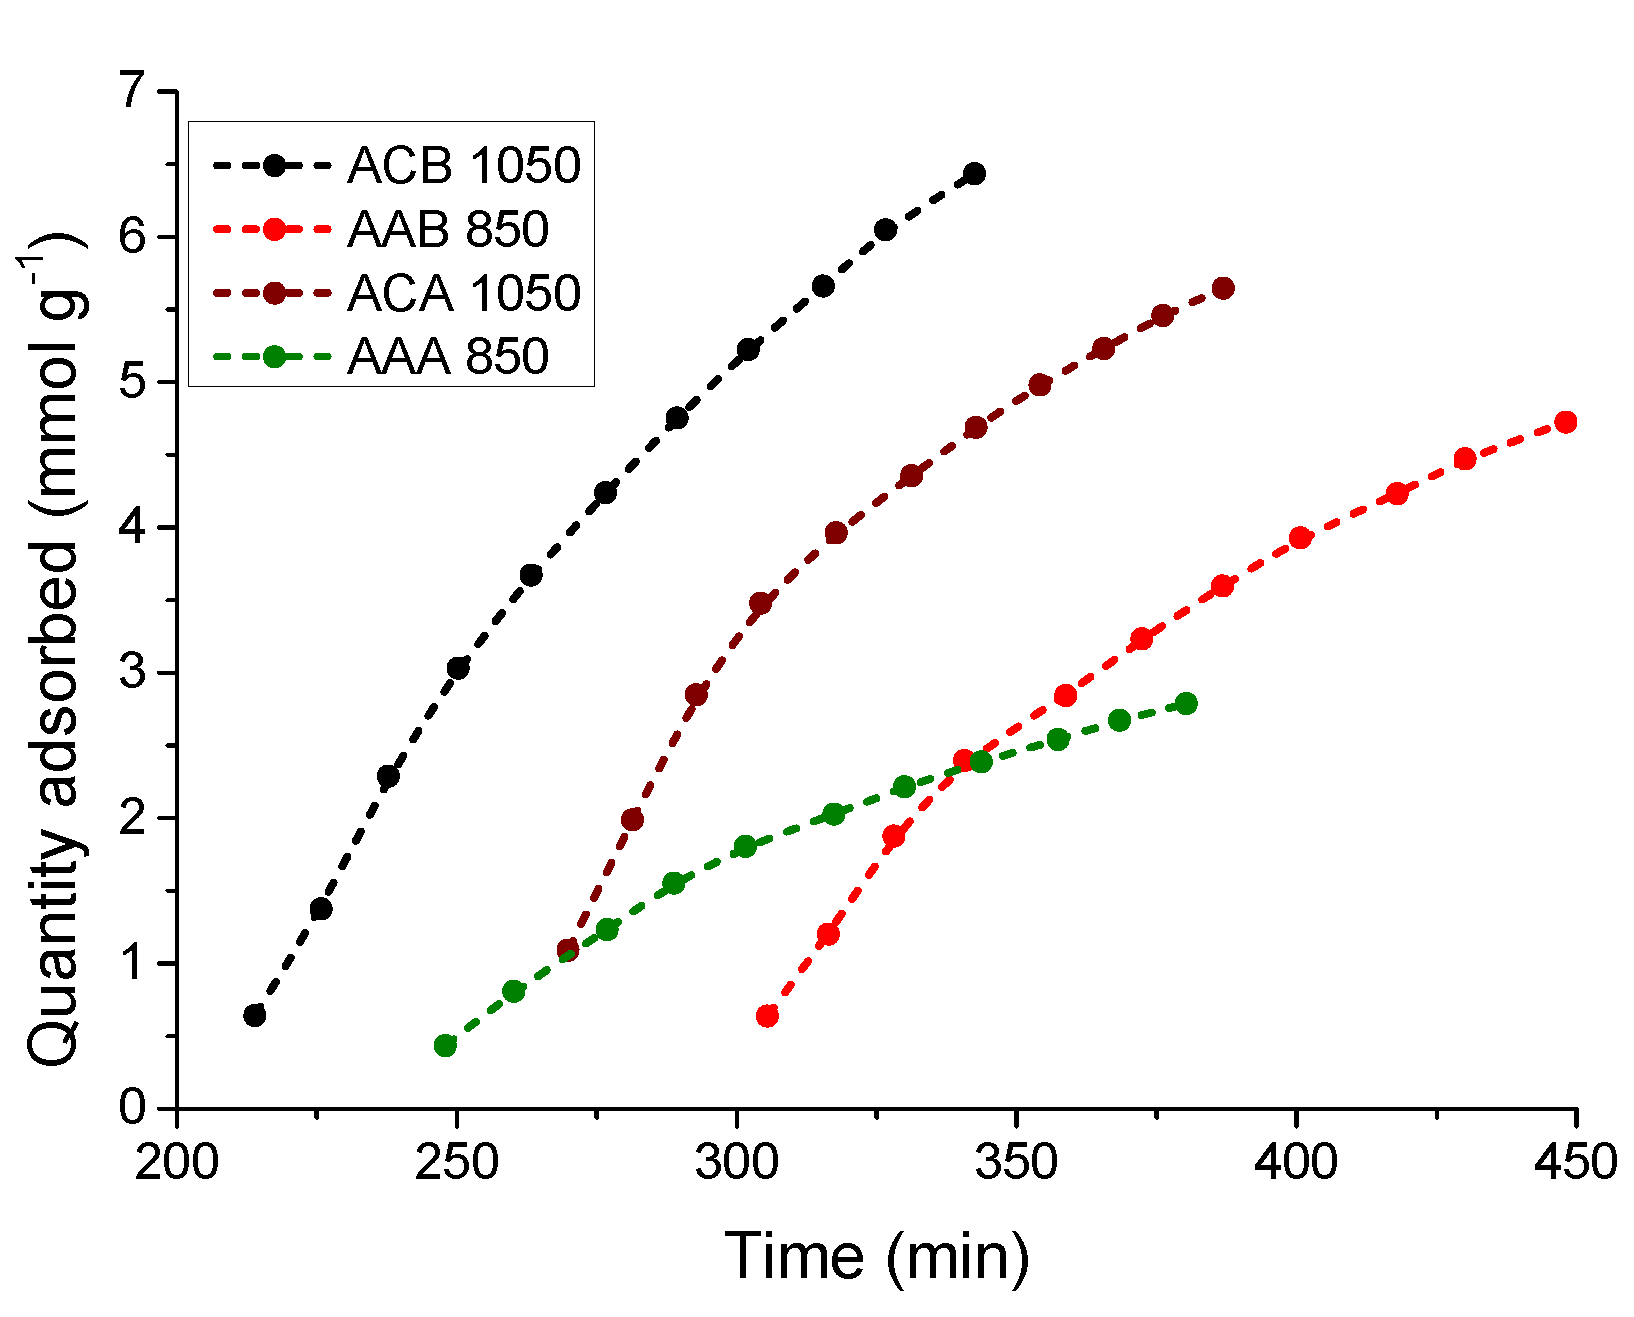
2.5. Kinetic Study of the CO2 Adsorption Process at 0 °C and Atmospheric Pressure

Rate laws are essential in any adsorption study because they provide an exact expression during the duration of the reaction [26]. The models used in the present study are described below.

2.5.1. Pseudo First Order and Pseudo Second Order Models

There are several models of kinetics, but in general, the most used and compared are the pseudo first order and pseudo second order kinetic models. The Pseudo first order kinetic model was proposed for the first time at the end of the 19th century by Lagergren. The speed constant when using this model is denoted as K1 [27]. The Pseudo second order kinetic model was introduced for the first time in the mid-1980s, but its recognition increased in 1999 when Ho and McKay [28] took data from experiments reported in the literature and determined that the best fit to the data from all the systems studied was given by applying the Pseudo second order model. After this publication came to light, the speed constant K2 become more popular since in most studies it was found that the data obtained fit this model. The equations of these two models are presented below. Equation (1) describes the Pseudo first order model, as follows:
log ( 1 q t q e ) = K 1 2.303 t
where qt is the concentration of the adsorbed phase at a certain time of the adsorption process, qe is the concentration of the adsorbed phase at the end of equilibrium with the solid present in suspension, t is the time that has elapsed since the process of adsorption began, and k1 is the Lagergreen constant (s−1). The pollutant adsorption rate is proportional to the time that has elapsed since the adsorption process started: for t = 0, the value of qt = 0, and, once equilibrium has been reached, the value of qtqe [29]. Equation (2) describes the Pseudo second order model, as follows:
t q t = 1 k 2 q e 2 + 1 q e t
When t approaches zero, the adsorption rate t/qt becomes the initial adsorption rate. The data obtained in the kinetics study were adapted to the Pseudo second order model when obtaining the graph of t/qt vs. t. The linear relationship obtained allowed for the calculation of qe, k2, and k2qe2 without previously knowing any parameter [30].

2.5.2. Modified Pseudo First Order

This kinetic model is useful when the experimentally obtained data do not conform to the Pseudo first order kinetic model, Pseudo second order kinetic model, or the intraparticle diffusion model. In this new model, the Pseudo first order equation is modified by the velocity constant, as observed in Equation (3) [31], as follows:
ln ( 1 q t q e ) + q t q e = k m t
Since qt < qe, this equation implies that the rate constant k1 is minimal when equilibrium has been reached [31].

2.5.3. Elovich Model

It has been found that the Elovich empirical adsorption model has wide applicability for numerous adsorption systems. This model is based on the assumption of energetic heterogeneity of the adsorption sites in the form of a rectangular distribution [32]. The Elovich kinetic model is reported in Equation (4), as follows:
q t = 1 β ln ( α   β ) + 1 β ln t
where α is the initial adsorption rate of the Elovich equation (mmol g−1 s−1) and β is the model adsorption constant (g mmol−1) [26], which is related to the adsorption energy [33]. The Elovich equation can be linearized assuming that αβt >> 1 and that q = 0 at t = 0 [34] and that q = qt for time t = tt [35]. Under these conditions, a graph of qt versus (lnt) shows a linear relationship with a slope of (1/β) and intercept of (1/β)ln(αβ) [26]. This equation was used by Inyang et al. and Onwawoma et al., to describe the kinetics of adsorption of pollutants in natural adsorbents, prepared or modified, in which they found that the best behavior of the obtained data is given when applying this model [26]. This equation is also used to describe reaction mechanisms, such as solute diffusion in the solution or interface phase, surface activation, and deactivation. It is adequate to elucidate processes with significant changes of activation energy [34].

2.5.4. Intra-Particle Diffusion Model

According to the fundamental theory of chemical adsorption, intraparticle diffusion becomes a limiting factor for the rate of adsorption when the particle size is too large and/or the intrinsic reaction rate is too fast compared to the diffusion rate of the particles adsorbed inside the pores. The degree of inhibition resulting from the overall velocity depends on the combination of particle size and shape, the intrinsic reaction rate, and the diffusion rate [36].
According to Weber and Morris (1963) [37], the plot of qt versus t1/2 gives a straight line; therefore, the adsorption process is controlled by intraparticle diffusion only. However, if the data exhibit multilinear plots, two or more steps influence the adsorption process. The intra-particle diffusion model is reported in Equation (5), as follows:
q t = K i P t 0.5 + C
where Kip is the intra-particle diffusion rate constant (mmol g−1 min−0.5) [38].

2.6. Adsorption Studies

Various adsorption isotherm models have been formulated to describe the experimental adsorption data. The most important ones are mentioned below.

2.6.1. Langmuir Model

The Langmuir model (1916) [39] is the simplest theoretical model to describe the adsorption of a monolayer on a homogeneous surface [40]. This model considers the following assumptions: (i) the molecules are adsorbed to a fixed number of active sites, which are well defined; (ii) the adsorption forms a single monolayer; (iii) each site can contain a single molecule of adsorbate and adsorbed grindings will not change the adsorption site; (iv) each adsorption site possesses the same energy, therefore, there are definite and energetically equivalent numbers of adsorption sites, and thus the surface of the adsorbent is homogeneous; (v) there is no interaction between the adsorbed molecules in nearby sites and (vi) the adsorption system is in equilibrium. Therefore, the adsorption constant is equal to the desorption constant [8]. The model of the Langmuir isotherm is reported in Equation (6), as follows:
Q e = q L K L P CO 2 1 + K L P CO 2
where qL is the maximum capacity of adsorption in the monolayer, PCO2 (atm) is the pressure at the equilibrium of the adsorbed gas, and KL (atm−1) is the Langmuir adsorption constant or the affinity constant related to the energy of adsorption [40].

2.6.2. Freundlich Model

The adsorption of molecules on a surface that has a constant interaction energy is not common since most solids have a heterogeneous surface [8]. The Freundlich model [41] is described by an empirical equation used for systems with a high degree of heterogeneity. In this model, it is assumed that adsorption occurs at different sites and the formation of multilayers occurs with different adsorption energies. This leads to an exponential decrease in energy as the coverage of the surface originate [42].
The strength of the bonds is not homogeneous due to the physicochemical characteristics of the adsorption sites or the number of molecules already adsorbed. In particular, as more molecules join to a site and it is less likely that another molecule will join the same site because it requires a higher (exponentially) energy [8]. The model of the Freundlich isotherm is reported in Equation (7), as follows:
Q e = K f P CO 2 1 n
where Qe (mmol g−1) is the capacity of adsorption of CO2 by the adsorbents (in this case, the carbon aerogels) in equilibrium, Kf is the constant of the Freundlich isotherm (mmol g−1 atm−1/n), and n is the heterogeneity factor that represents the deviation of the linearity of the adsorption. The Freundlich constant (n) depends on the adsorption capacity and is used to evaluate the adsorption favorability. The value of nf is between 2 and 10, indicating a high adsorption capacity, while values between 1 and 2 indicate moderate adsorption capacity and values less than 1 indicate a small adsorption capacity [43].
To obtain a better understanding of the stages carried out during the process of adsorption of CO2 in the ultramicropores of resorcinol-formaldehyde aerogels obtained in basic and acid medium. The data obtained in the equilibrium isotherms were also adjusted to adsorption models of three parameters, which are less common than the traditional Langmuir and Freundlich models.

2.6.3. Sips Model

The two models of the previous isotherms have been widely used to analyze the adsorption of various pollutants. The Sips model simultaneously involves the Freundlich and Langmuir models, has three parameters taken from the theory of these models [44], and has a greater capacity to describe equilibrium. The Sips isotherm model is reported in Equation (8), as follows:
Q e = q s ( K s P CO 2 ) 1 / m s 1 + ( K s P CO 2 ) 1 / m s
where Ks (atm−1) is the constant of the Sips isotherm, qs (mmol g−1) reflects the maximum adsorption constant, and ms is the heterogeneity factor that represents the deviation of the linearity of adsorption [8]. A value of ms close to or equal to 1 is given in adsorbents with homogeneous active sites [45], while a value of ms close to 0 occurs in biosorbents that possess the heterogeneously distributed active sites [46].

2.6.4. Toth Model

In the Toth model, an asymmetric quasi-gaussian energy distribution is assumed, where most sites have a lower adsorption energy than the energy peak of maximum adsorption [42]. Toth modifies the Langmuir equation to reduce the error between the experimental and predicted values of adsorption equilibrium. This model is best suited for heterogeneous systems in which multiple adsorption layers occur. The exponent of the Toth isotherm (mT) is related to the heterogeneity of the surface. If mT is equal to the unit, the Toth model is reduced to the Langmuir model. This correlation is applied for liquid-solid adsorption [47]; therefore, it typically describes the adsorption isotherms at all pressures since it has the potential to combine the advantages of the Langmuir and Freundlich models, that is, it is valid at high partial pressures and possesses the correct behavior of Henry’s law at low pressures [8]. The Toth isotherm model is reported in Equation (9), as follows:
Q e = q T K T   P CO 2 1 + ( ( K T P CO 2 ) m T ) 1 / m T
where KT is the constant of the Toth isotherm (atm−1), qT (mmol g−1) is the maximum capacity of adsorption, and mT is the factor of heterogeneity. Deviations of mT from the unit correspond to heterogeneous systems and can be derived from the nature of the solid, from the adsorbed contaminant, or from a combination of both. When mT equals 1, the Toth isotherm is reduced to the Langmuir model, which represents a homogeneous system. The parameter mT is usually smaller than the unit and, therefore, the smaller this parameter, the more heterogeneous the system [8].

3. Results and Discussion

3.1. Physisorption

Below is the analysis of each of the results obtained in this research according to the technique used.

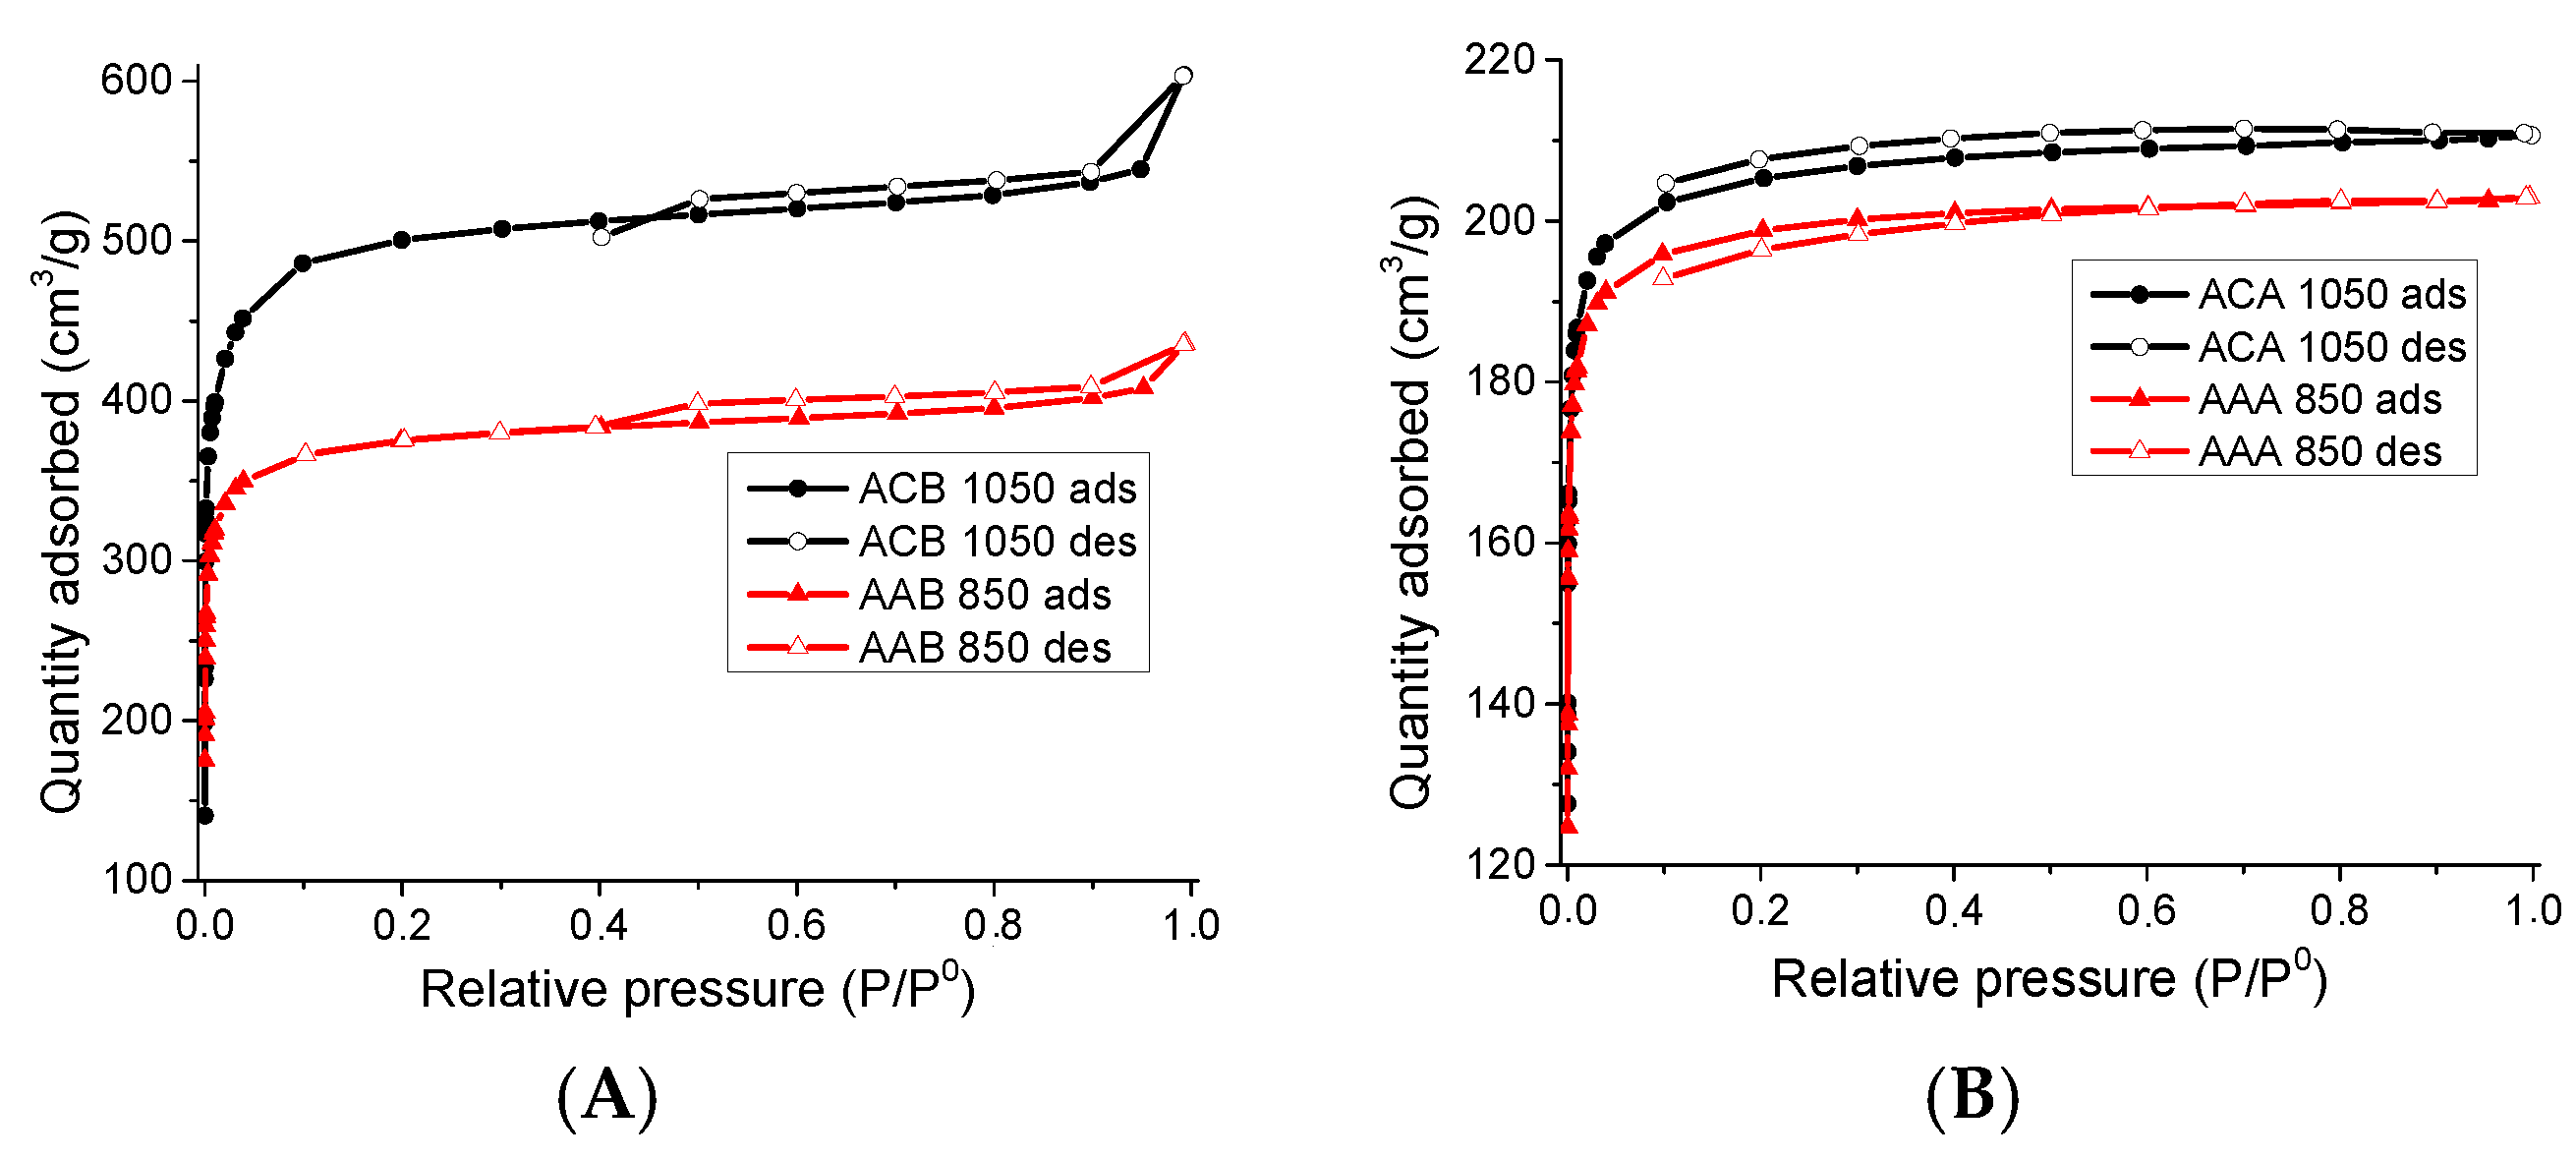
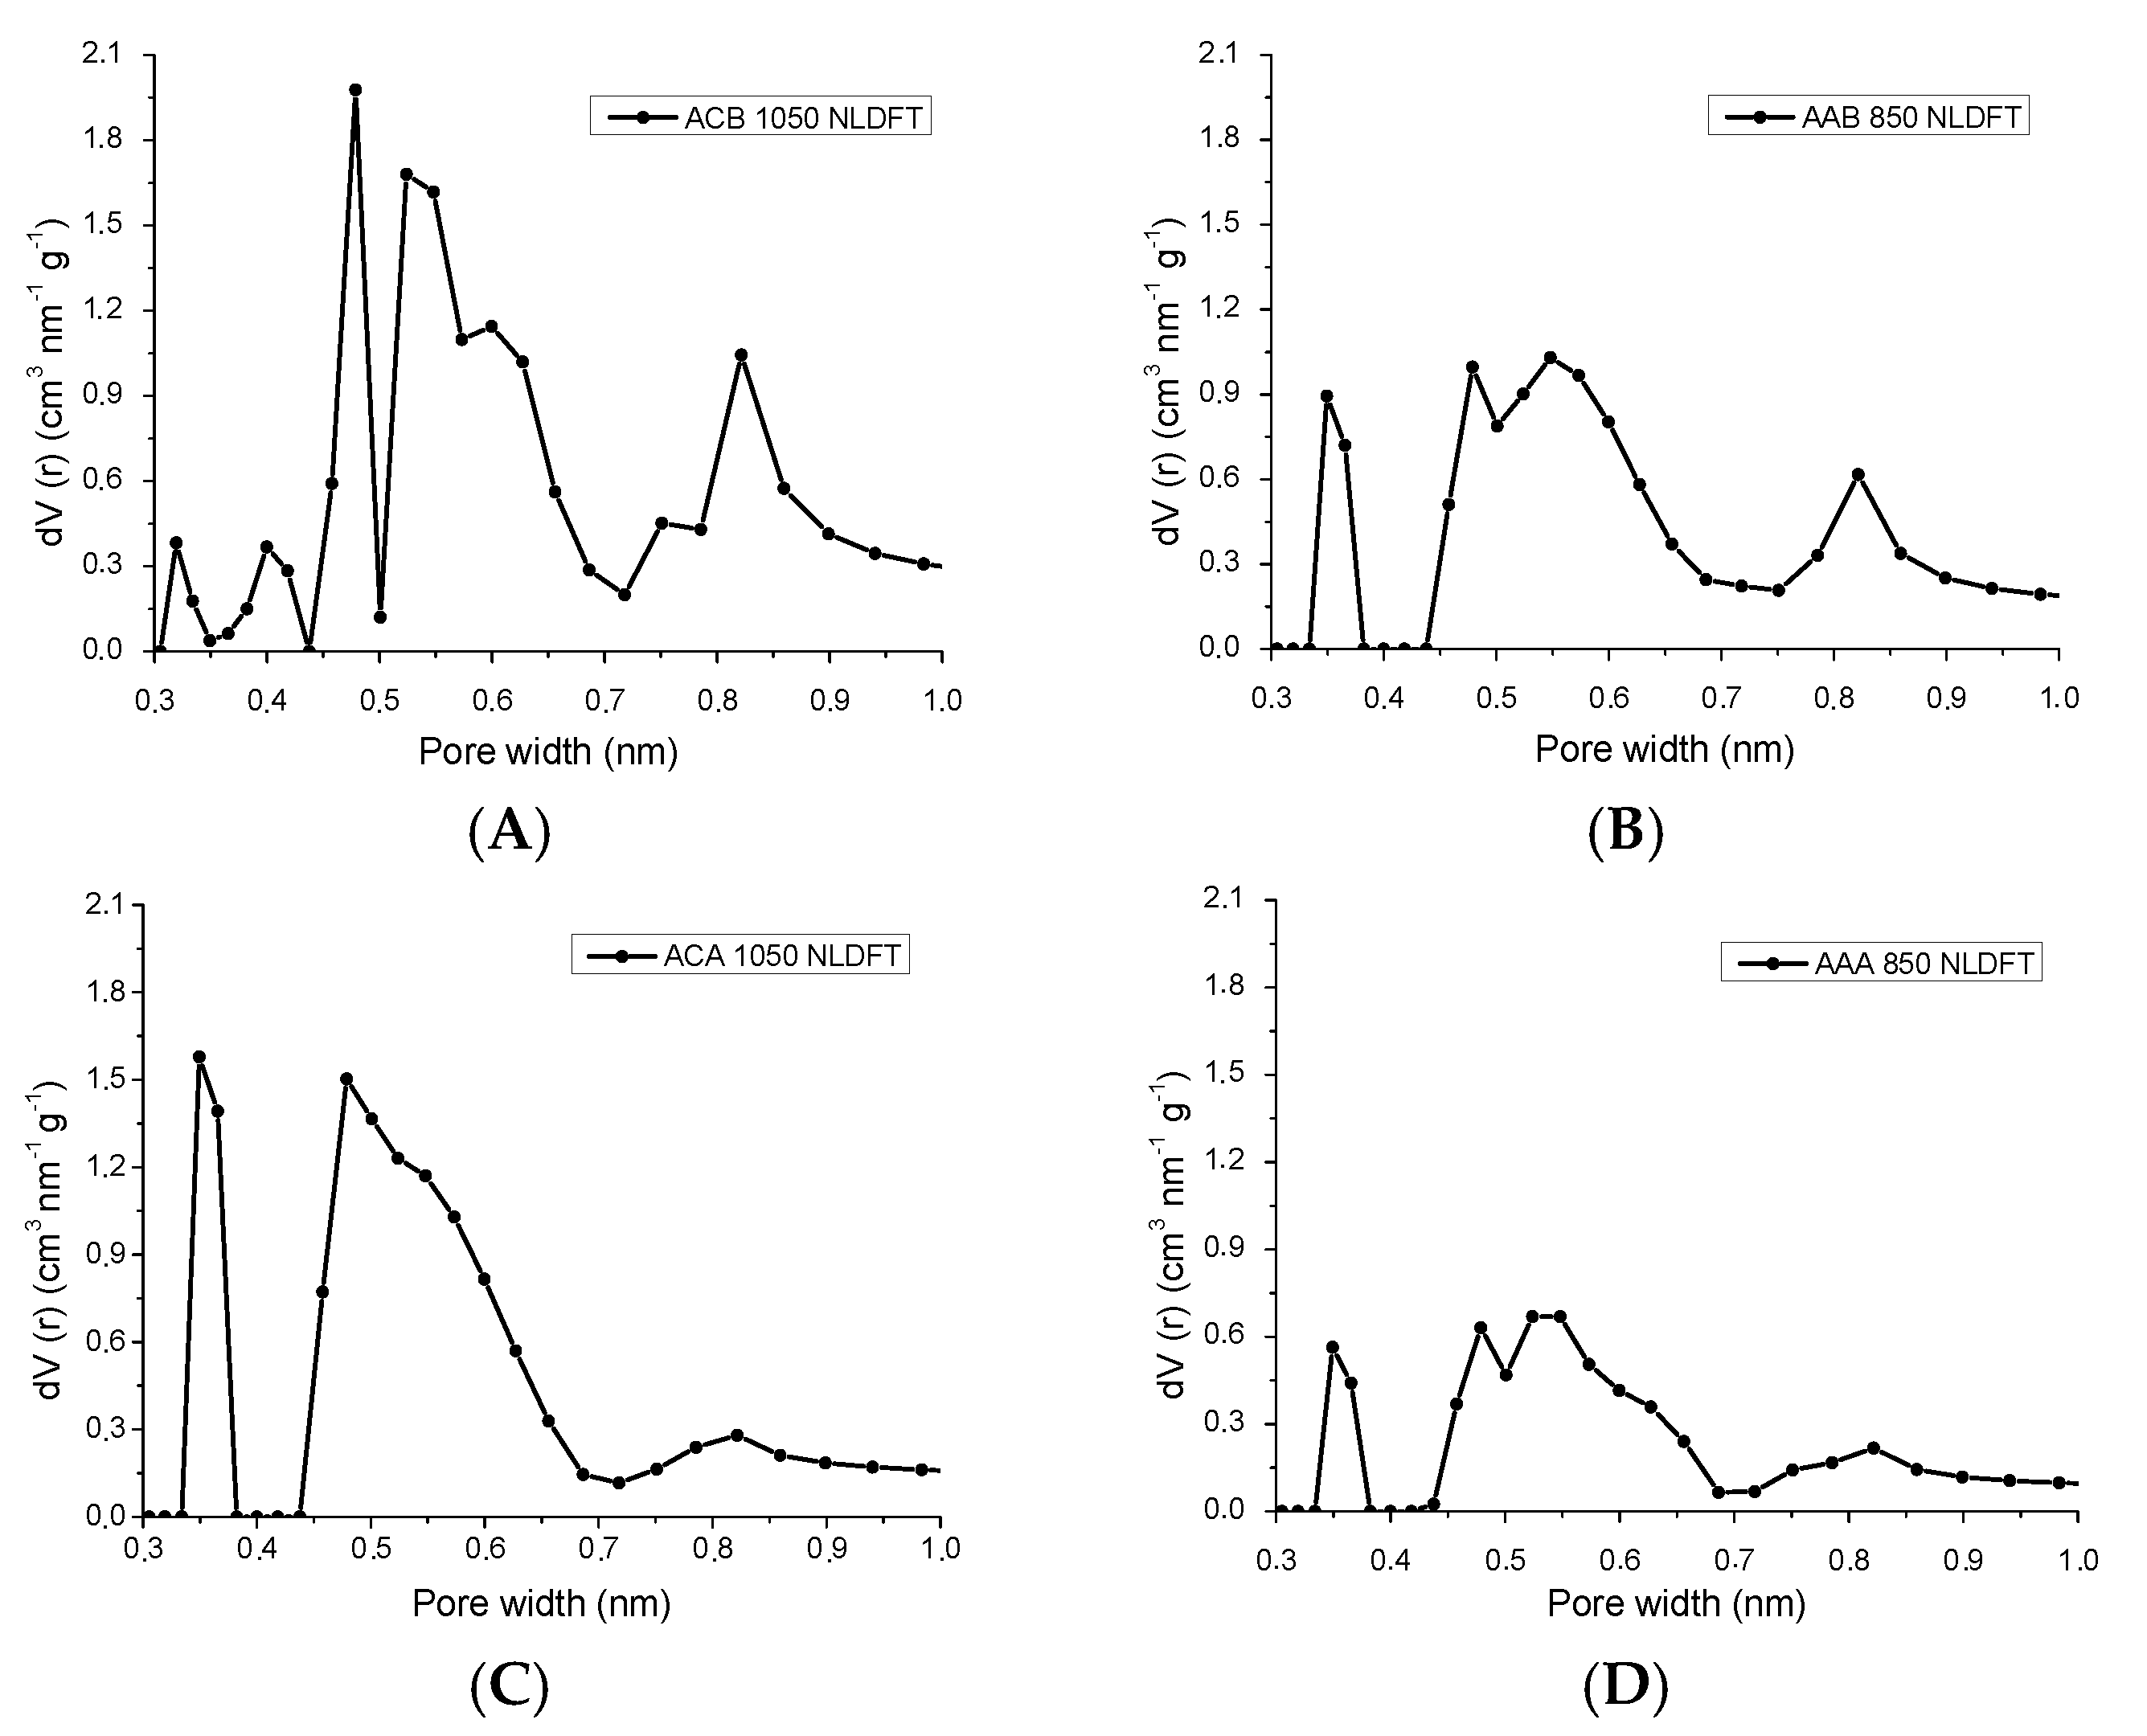
3.1.1. Physisorption of N2 to −196 °C

The carbon aerogel synthesized by basic catalysis at 1050 °C presents the best adsorption capacity. Isotherm type I is characteristic of micropores (width < 2 nm) [48,49] and corresponds to adsorption in a single layer called a monolayer [50]. Figure 1A shows the adsorption isotherms of N2 at −196 °C of the carbon aerogels synthesized by the basic route (ACB 1050 and AAB 850), where the right number refers to the activation temperature in Celsius degree (°C). The isotherms, according to the International Union of Pure and Applied chemistry (IUPAC) classification, are of type Ib for sample ACB 1050 and type of Ia for sample AAB 850. Relatively high N2 adsorption reaches a plateau at a P/P0 of 0.1.
From the type Ib isotherm of the ACB 1050 aerogel, it can be deduced that the solid has a heterogeneous distribution with a pore width ˂ 2 nm. The isotherm of the aerogel AAB 850 type Ia indicates that most of these pores have a homogeneous distribution and a size that is <2 nm.
The isotherms have a hysteresis cycle at a relative pressure > 0.4, indicating the presence of mesopores [49,50,51]. This behavior is present in the two samples obtained in basic medium (ACB 1050 and AAB 850). It is important to mention that the value of the quantity of adsorbed N2 in the carbonized sample decreased after activation, probably due to the increase in pore size during this process, in addition, micropores and mesopores were produced [48], besides the high temperature of 850 °C leads to an important destruction of the porosity, associated with pore deformation, cracking or blockage phenomena [52].
Figure 1B corresponds to the physisorption isotherms of N2 for the samples obtained in acidic medium (ACA 1050 and AAA 850). The experimental isotherms are of type Ib, characteristic of materials with a heterogeneous pore distribution and a size with width < 2 nm. The characteristic hysteresis of mesopores was small.
In Table 1, the surface area value of the synthesized materials is reported, this parameter is high in the carbonized materials (ACB 1050 and ACA 1050) due to the generation of porosity by the removal of the organic groups during thermal treatment [53]. A high value of CO2 activation temperature increases the coal burning reducing the yield of the synthesis, the value of the BET area decreased after of this process, this effect has been attributed to the accumulation of carbon in the pores, the increase in the size of the pores, the fusion of pores, and the deformation of some walls [54].

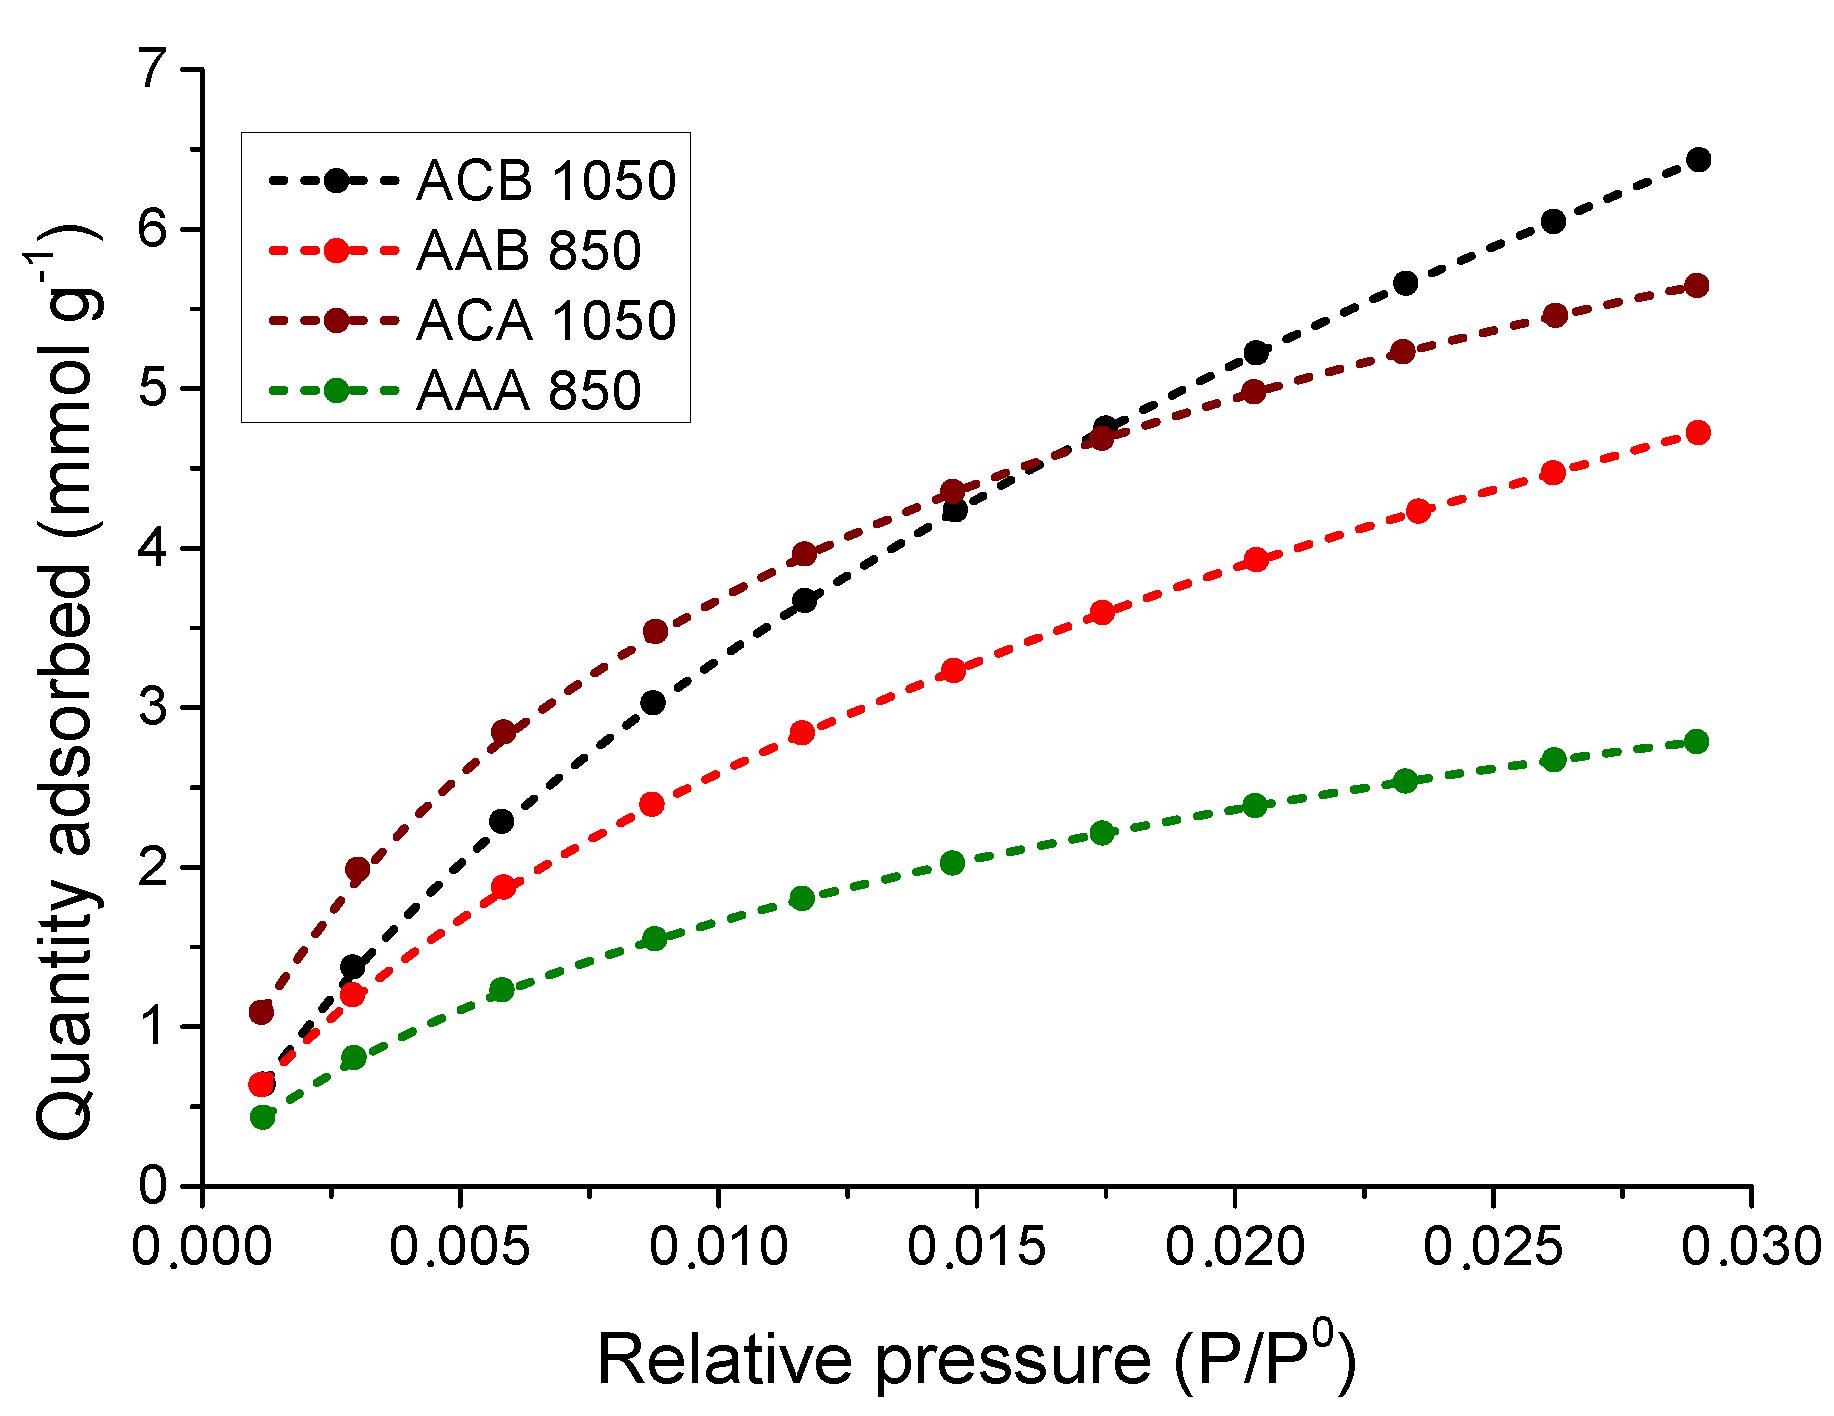
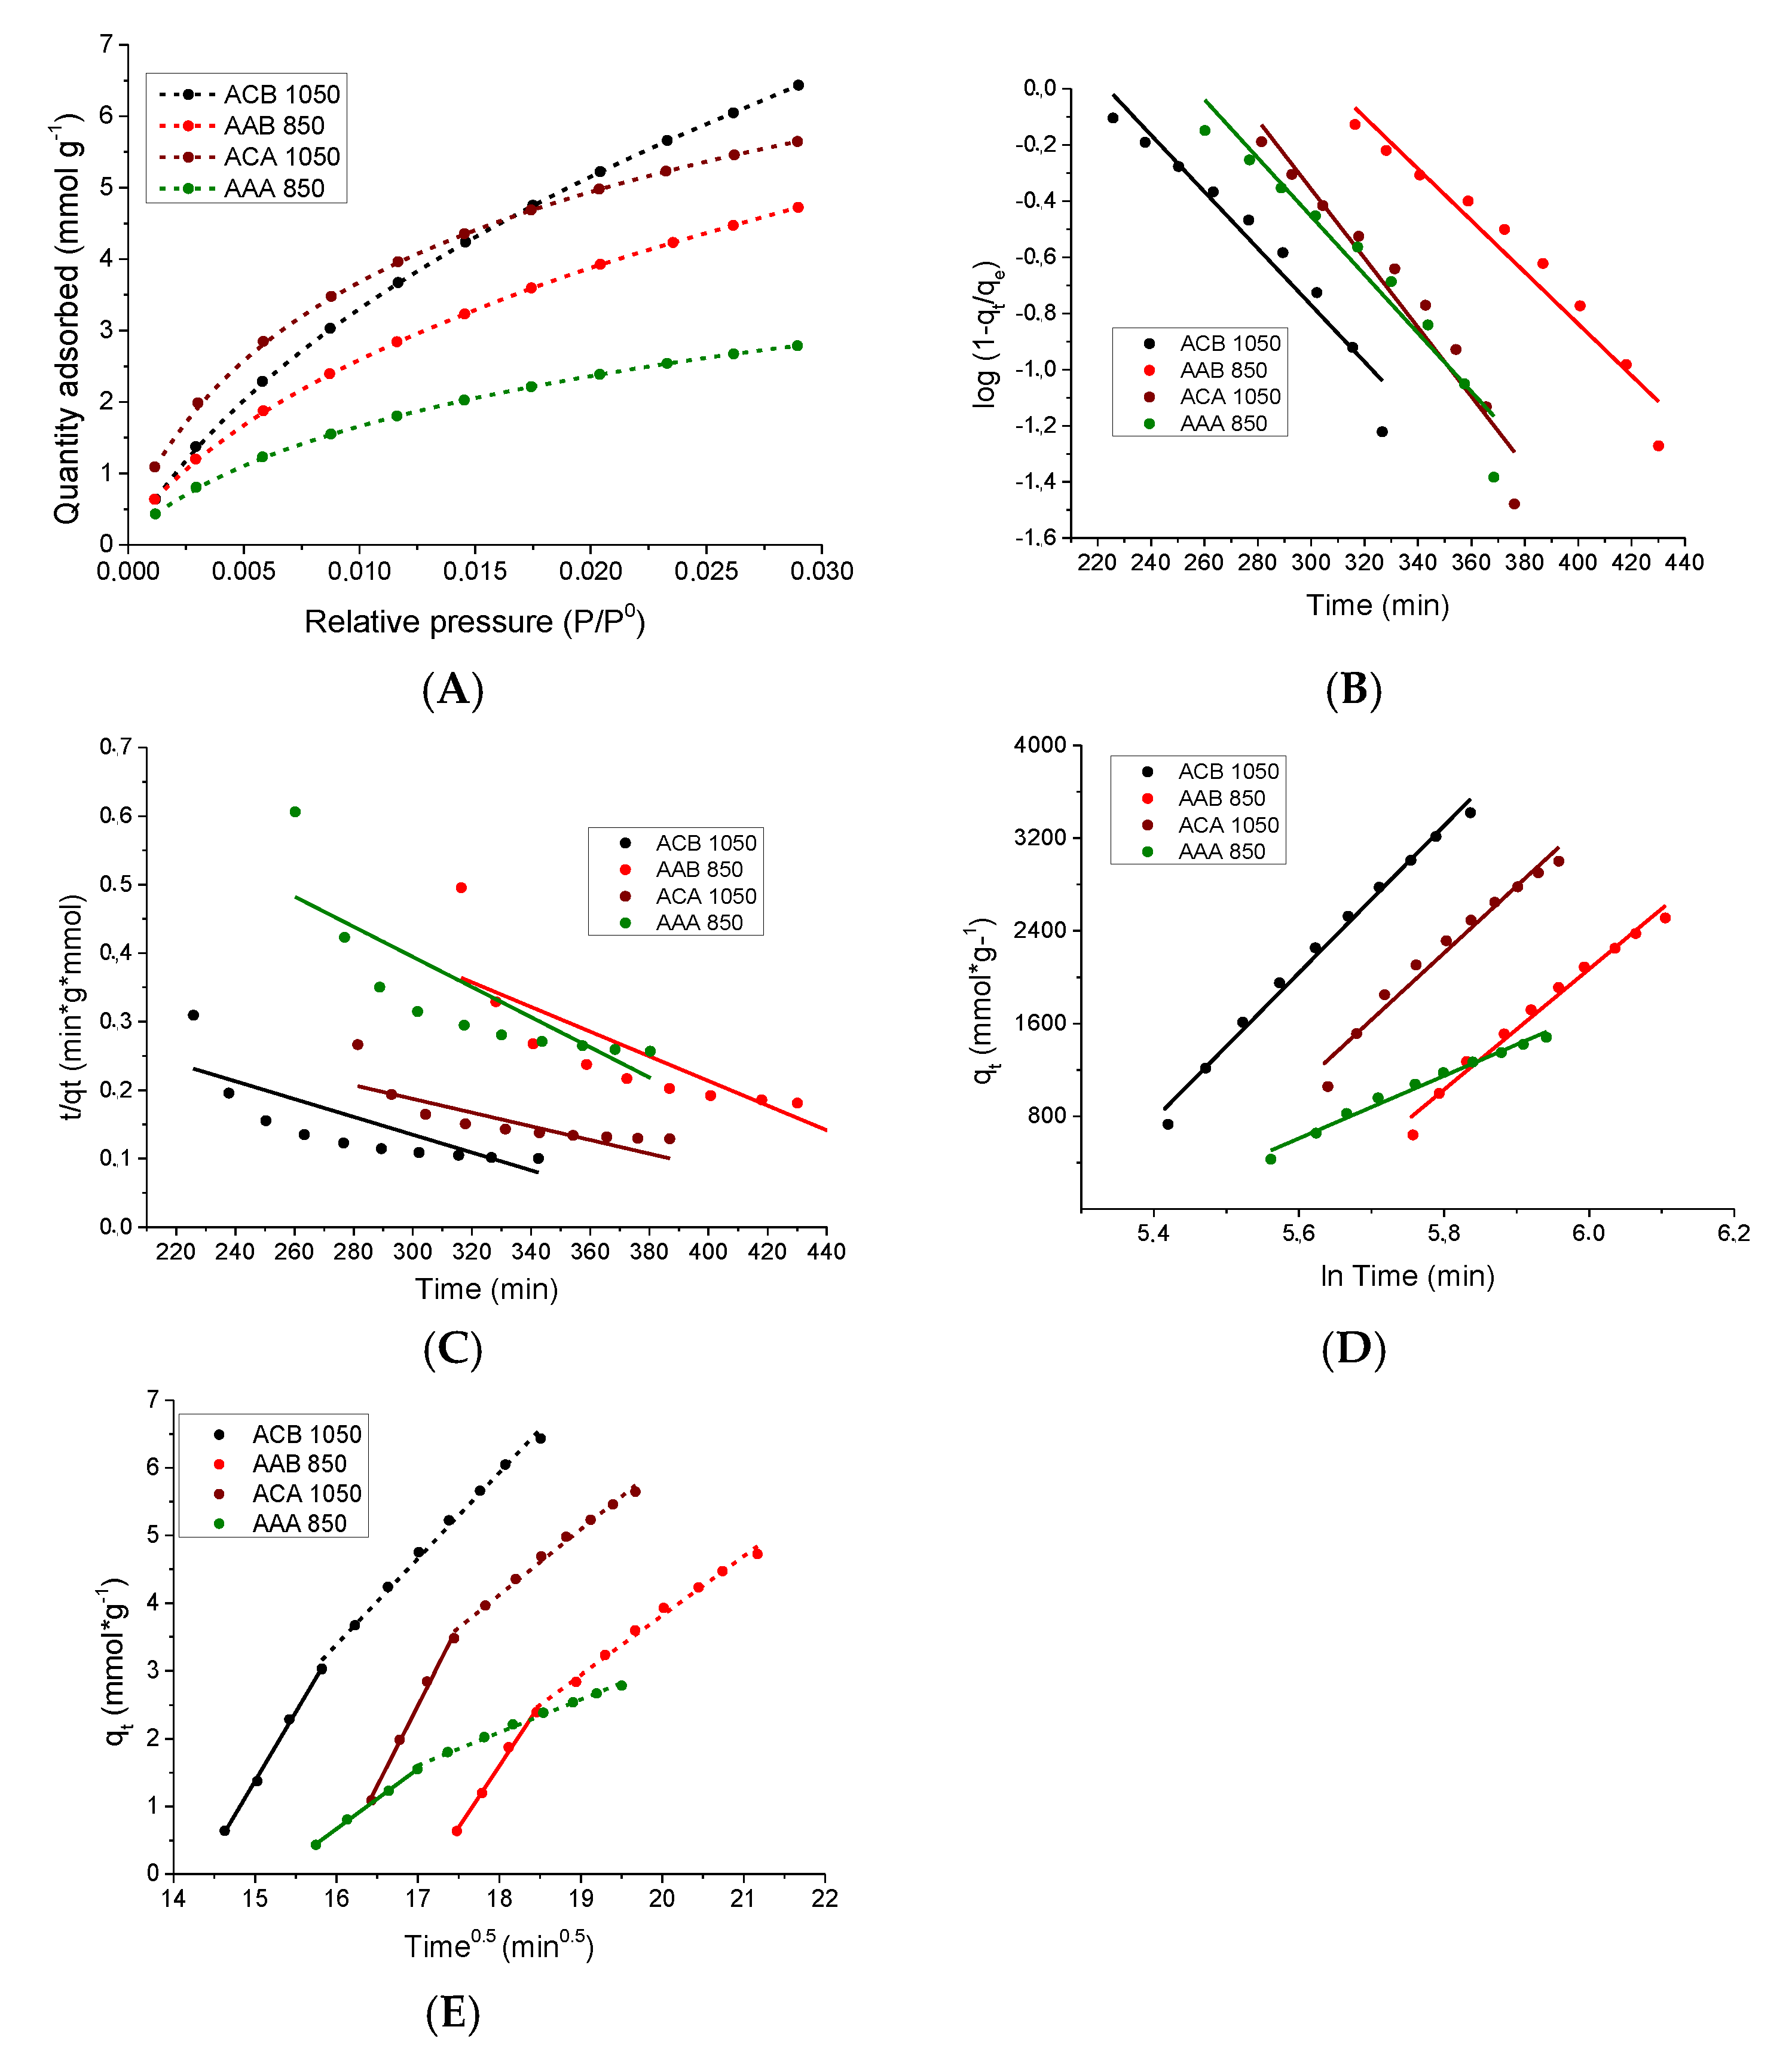
3.1.2. Physisorption of CO2 at 0 °C

In the present work, the size distribution of the ultramicropores from the CO2 adsorption isotherms was carried out using the NLDFT model. The physisorption isotherm of CO2 was done to determine the textural characterization of the materials and was carried out at 0 °C. This molecule has a critical dimension of 0.33 nm. Its relatively high temperature of adsorption confers a high speed of diffusion; therefore, it can access very narrow pores in relatively short periods. Under these temperature and pressure conditions, this gas only fills the ultramicropores (width < 0.7 nm) [55]. In Figure 2, the size distribution of these pores is presented, applying the theoretical NLDFT model. This type of porosity is present in all synthesized aerogels. Its volume in the different materials is given in the following order from highest to lowest: ACB 1050, ACA 1050, AAB 850, and AAA 850. Activation with CO2 decreased the ultramicropore content of the carbonized aerogels. The ACB 1050 solid presented the highest amount of ultramicropores (<0.7 nm). This can be related to the size of the interparticle pores observed by SEM since these are smaller in the samples obtained in basic media with respect to that obtained by the acidic route. In addition, carbonization has a greater effect on the surface of the material and develops more porosity.
Small values of temperature are not efficient in the physical activation of the coals [52]; therefore, when using 850 °C, the interaction between CO2 and the samples is assured. The decrease in the number of ultramicropores after activation with CO2 in the samples obtained in basic medium (ACB 1050) and acidic medium (ACA 1050) has been attributed to the destruction of the porosity, associated with the deformation of the pores, the cracking, and the obstruction phenomena [52].
Table 2 shows the ultramicropore volume of aerogels, which were determined by physisorption of CO2 at 0 °C using the Dubinin-Radushkevich equation. The decrease in the pore volume with a width < 0.7 nm in the carbonized samples (ACB 1050 and ACA 1050) after the activation process (AAB 850 and AAA 850) was due to the plugging of the ultramicropores.

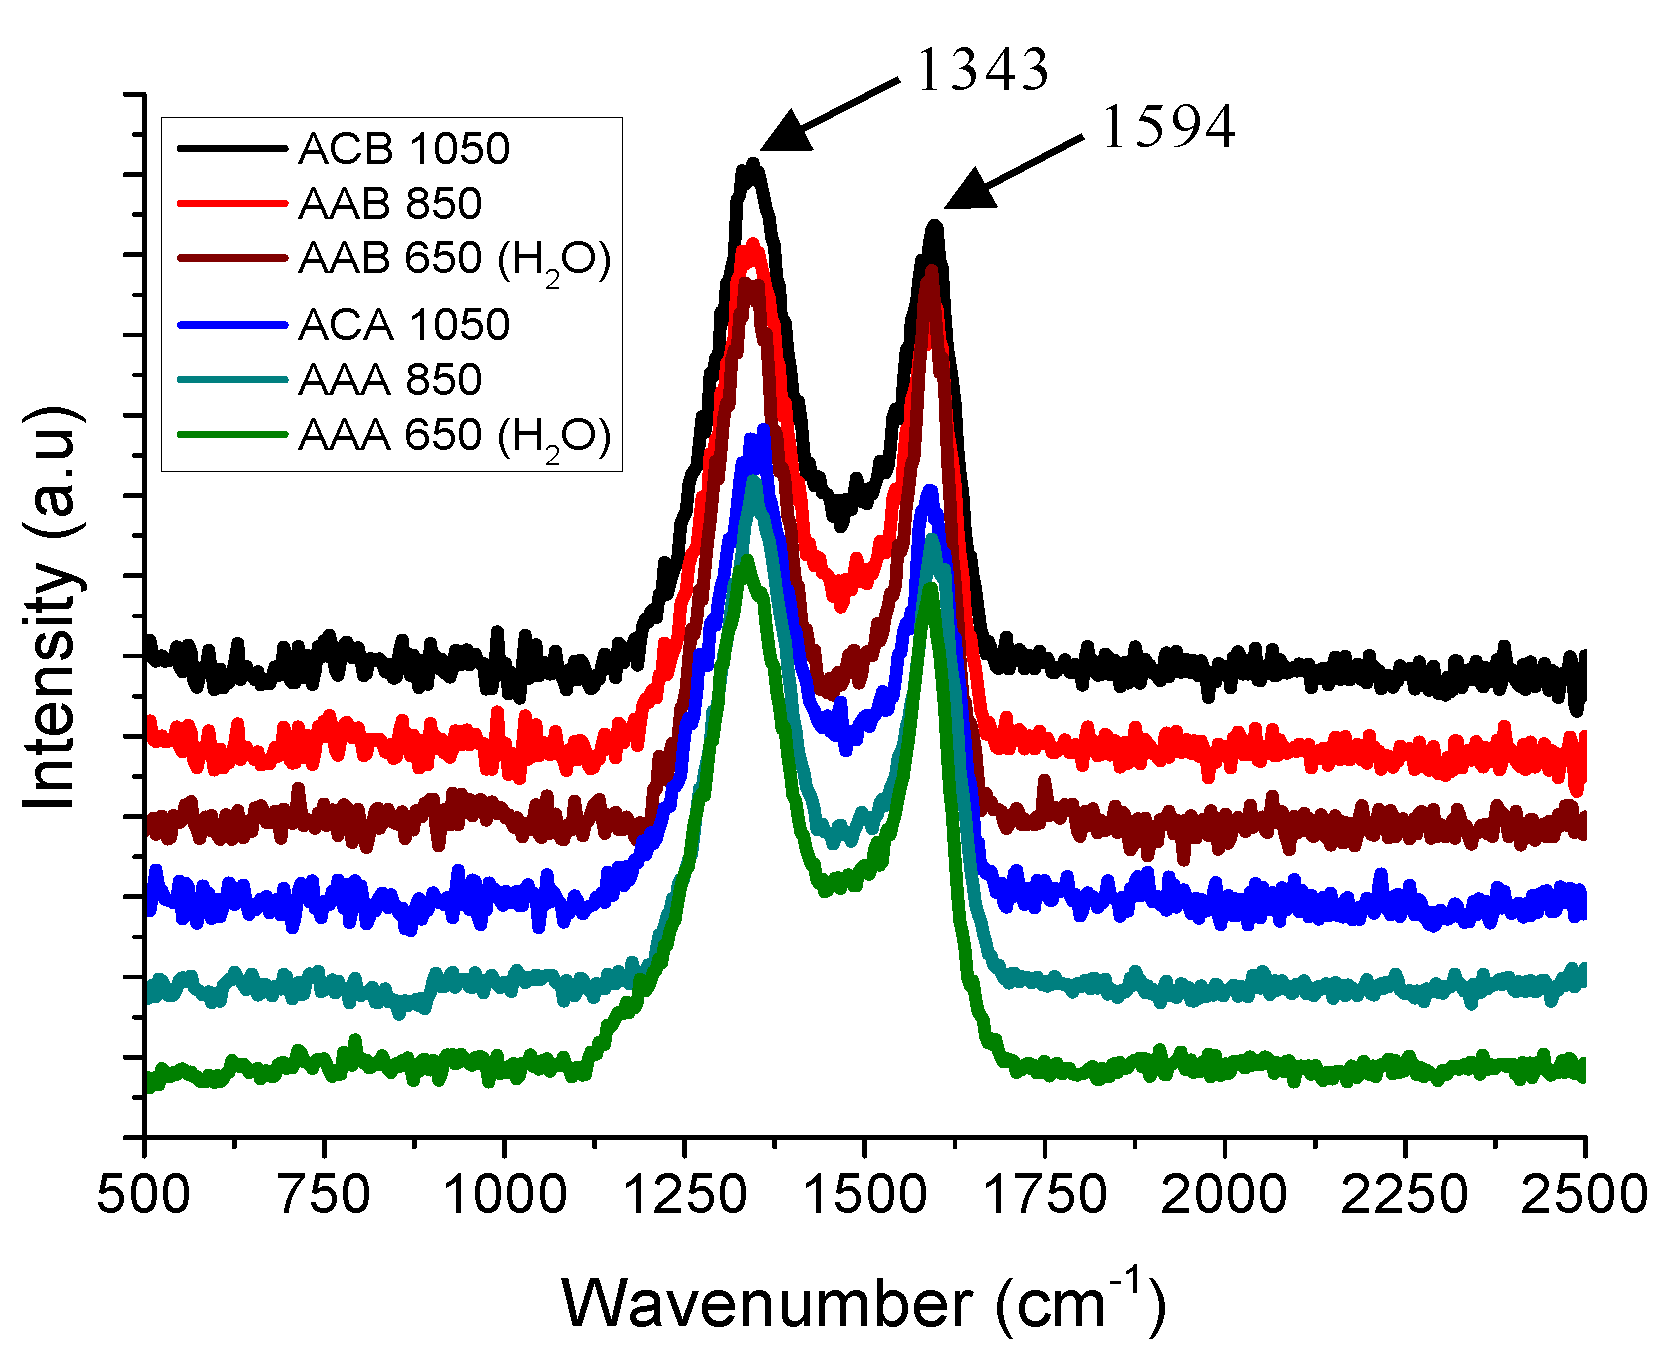
3.2. Raman Spectroscopy

Figure 3 shows the Raman spectra. Two peaks are observed at 1343 cm−1 and 1594 cm−1, which correspond to D and G bands, respectively. The D1 mode, which is also called disorder-induced, is commonly attributed to the lack of symmetry present in disordered carbon atoms. The Lorentzian signal, called G, is the band assigned to the E2g mode, resulting from the displacements in the plane of the strongly coupled carbons in hexagonal sheets. The presence of these two peaks is due to the existence of sp2 hybridizations due to the high polarizability of the conjugated π bonds at the sp2 sites [56,57].

3.3. Scanning Electron Microscopy (SEM)

In the SEM micrographs (Figure 4), all R/F aerogels have a disordered, porous, three-dimensional network structure [58] characteristic of a typical colloidal gel formed by interconnected [59] spherical particles [60]. The series of micrographs show that supercritical drying avoids that reduction of superficial surface tension being too strong, which prevents the amount of micro- and mesopores being reduced while the particle area fusses into more compact structures, also increasing the density of the material [59]. It also shows that the particles of the aerogels, having a micrometric size, are joined in larger dense groups, and, in their interconnection network, wide necks and a superposition of aggregate material on their surface are observed [59].
The aerogel particles synthesized in basic medium (Figure 4A,B) had a smaller size than the particles obtained in acidic medium (Figure 4C,D). This indicates that the change in the catalyst and the route of synthesis results in aerogels with different average particle sizes. In the micrographs, the presence of open interparticle pores was also observed [61] due to the agglomeration of the particles that make up the clusters. There was a small variation in the distribution of the particle size in the same material, but when comparing the aerogels obtained in basic and acidic medium it was observed that the size of the particles changed drastically.
It has been reported that, in gel synthesis, the samples prepared with the highest catalyst content have a compact cross-linked structure and the particles are smaller. A reduction in the amount of catalyst results in an increase in particle size, reaching a size on the micrometer scale [62]. This was also observed in the synthesis of these aerogels since the R/C ratio was 1500 and the size of the polymer particles was given on the micrometer scale due to prolonged condensation during synthesis [63]. The interparticle pores observed by this technique (SEM) have a scale of micrometre’s, therefore, they are not efficient in the adsorption of CO2, this process occurs in the intra-particular pores studied in Section 3.1.2.

3.4. Infrared Spectroscopy

This technique was used to perform a qualitative analysis of the chemical composition of the aerogels. Figure 5 shows the results obtained in the analysis of the materials (aerogel obtained in basic and dry medium (AB) and aerogel obtained in acidic and dry medium (AA)). The two aerogels have the same chemical composition, independent of the catalyst used in the synthesis (Na2CO3 and HCl). The chemistry is equal, considering the results of Fourier-Transform Infrared Spectroscopy (FTIR). In these samples, the presence of ether bonds characteristic of the bands between 1000 cm−1 and 1250 cm−1 is also observed. The peaks located at 1091 cm−1 and 1215 cm−1 correspond to the stretching of the ether bond (CO) and the presence of dimethyl ether bridges (–CH2–O–CH2–) between the aromatic rings, respectively [64]. The peak located at 1473 cm−1 is associated with the stretching and flexion vibrations of CH2. The band located at 1608 cm−1 belongs to the stretching of the aromatic rings [65].
From this qualitative analysis, it was determined that the obtained aerogel in acidic medium presents the same composition as the material obtained in basic medium [66]. The synthesis method did not change the composition of the material.

3.5. Adsorption of CO2 at 0 °C

Figure 6 shows the CO2 adsorption isotherms at 0 °C and atmospheric pressure. The best adsorption of this contaminant under these conditions occurred in the carbonized materials. As shown in Session 3.1, it was determined that activation with CO2 produces a plugging of the ultramicropores, which is associated with the decrease in the capacity of adsorption of this greenhouse gas under these conditions after the activation of the carbonized materials. The textural parameters of surface area and micropore volume have the highest values in the aerogel obtained in basic and carbonized medium (ACB 1050); therefore, the capacity of CO2 adsorption is higher in this material.
The CO2 physisorption isotherms were carried out at 0 °C. Although CO2 has a critical dimension similar to that of N2 (0.33 nm and 0.364 nm, respectively), the relatively high adsorption temperature confers a speed of high diffusion to CO2 molecules; therefore, under these conditions, this gas only fills the ultramicropores (width < 0.7 nm) [55]. Therefore, there is no relationship between the BET area determined by the N2 adsorption isotherms (Section 3.1) and the CO2 adsorption in ultramicropores, since nitrogen only has access to pores with a width > 0.7 nm.

3.5.1. Kinetic Study of the CO2 Adsorption Process at 0 °C

Figure 7 shows the relationship between time and quantity adsorbed of CO2. The adsorption rate decreases as the process time increases, due to it reaching equilibrium.
Under the experimental conditions of adsorption, the data obtained from relative pressure vs. the number of mmol adsorbed per gram of sample were adjusted to the Pseudo first order, Pseudo first modified order, Pseudo second order, Elovich, and intra-particle (Figure 8) statistical models to determine the stages and mechanism of CO2 adsorption. The Pseudo first order model can describe the initial phase and the progress of adsorption and the Pseudo second order model describes the control of the chemisorption in the speed of progress. According to the model of intra-particle diffusion, different mechanisms are involved in this process of adsorption. The process can be described in the following three steps: (1) superficial external adsorption; (2) intra-particle diffusion corresponding to the limiting step and (3) the final equilibrium, which is very fast [67].
When adjusting the experimental CO2 adsorption data at 0 °C and atmospheric pressure to the kinetic models, the values of their respective parameters were obtained, as presented in Table 3.
The order in which the kinetic models were adjusted to the experimental data is as follows: Intra-particle diffusion > Elovich > pseudo first order > modified pseudo first order > pseudo second order.
The best fit to the experimental data was obtained by applying the intra-particle diffusion model. It has been reported that the following three main stages are carried out in the adsorption processes: superficial external adsorption, intra-particle diffusion, and the final equilibrium [67]. In Figure 8E, two linear stages can be observed due to CO2 adsorption process in the aerogels, corresponding to the intraparticle diffusion and the equilibrium plateau, while external diffusion is absent. The intra-particle diffusion constants (Kdi1 and Kdi2) are presented in Table 3 as expressions of the speed of diffusion in different states of the adsorption process. It can be observed that adsorption speed in the first stage (Kdi1) is greater than in the second stage (Kdi2). In principle, intra-particle diffusion is carried out in the ultramicropores; therefore, the adsorption rate was very high. The equilibrium plateau between CO2 and the aerogels was reached, and the adsorption rate at this stage was slower.
The second-best fit to the experimental data was obtained by applying the Elovich model; therefore, there was an energetic heterogeneity of the superficial adsorption sites. The other models studied had a smaller correlation coefficient; therefore, they do not explain the adsorption processes that occurred with the same reliability. However, it is important to mention that the Pseudo second order model presented the worst adjustment, confirming that chemisorption was not involved in this process [68], that is, the interactions between the adsorbate and the adsorbent were physical.
The α and β constants obtained by applying the Elovich model have units of mmol g−1 s−1 and g mmol−1, respectively. The values of α determine the initial adsorption speed. Their values were 0.0618, 0.0368, 0.0490 and 0.0239 mmol g−1 s−1 for the materials ACB 1050, AAB 850, ACA 1050, and AAA 850, respectively, indicating that the initial adsorption rate is related to the capacity of CO2 adsorption under these conditions. The value of the constant β presents the smallest value in the material ACB 1050 (0.0838 g mmol−1); therefore, this material had the highest capacity for adsorption of CO2 because it had the highest volume of ultramicropores.
In another work, it has also been reported that the Pseudo first order or Pseudo second order models have not been the best fit to the data obtained from the kinetics of CO2 adsorption at the surface of solids [15].

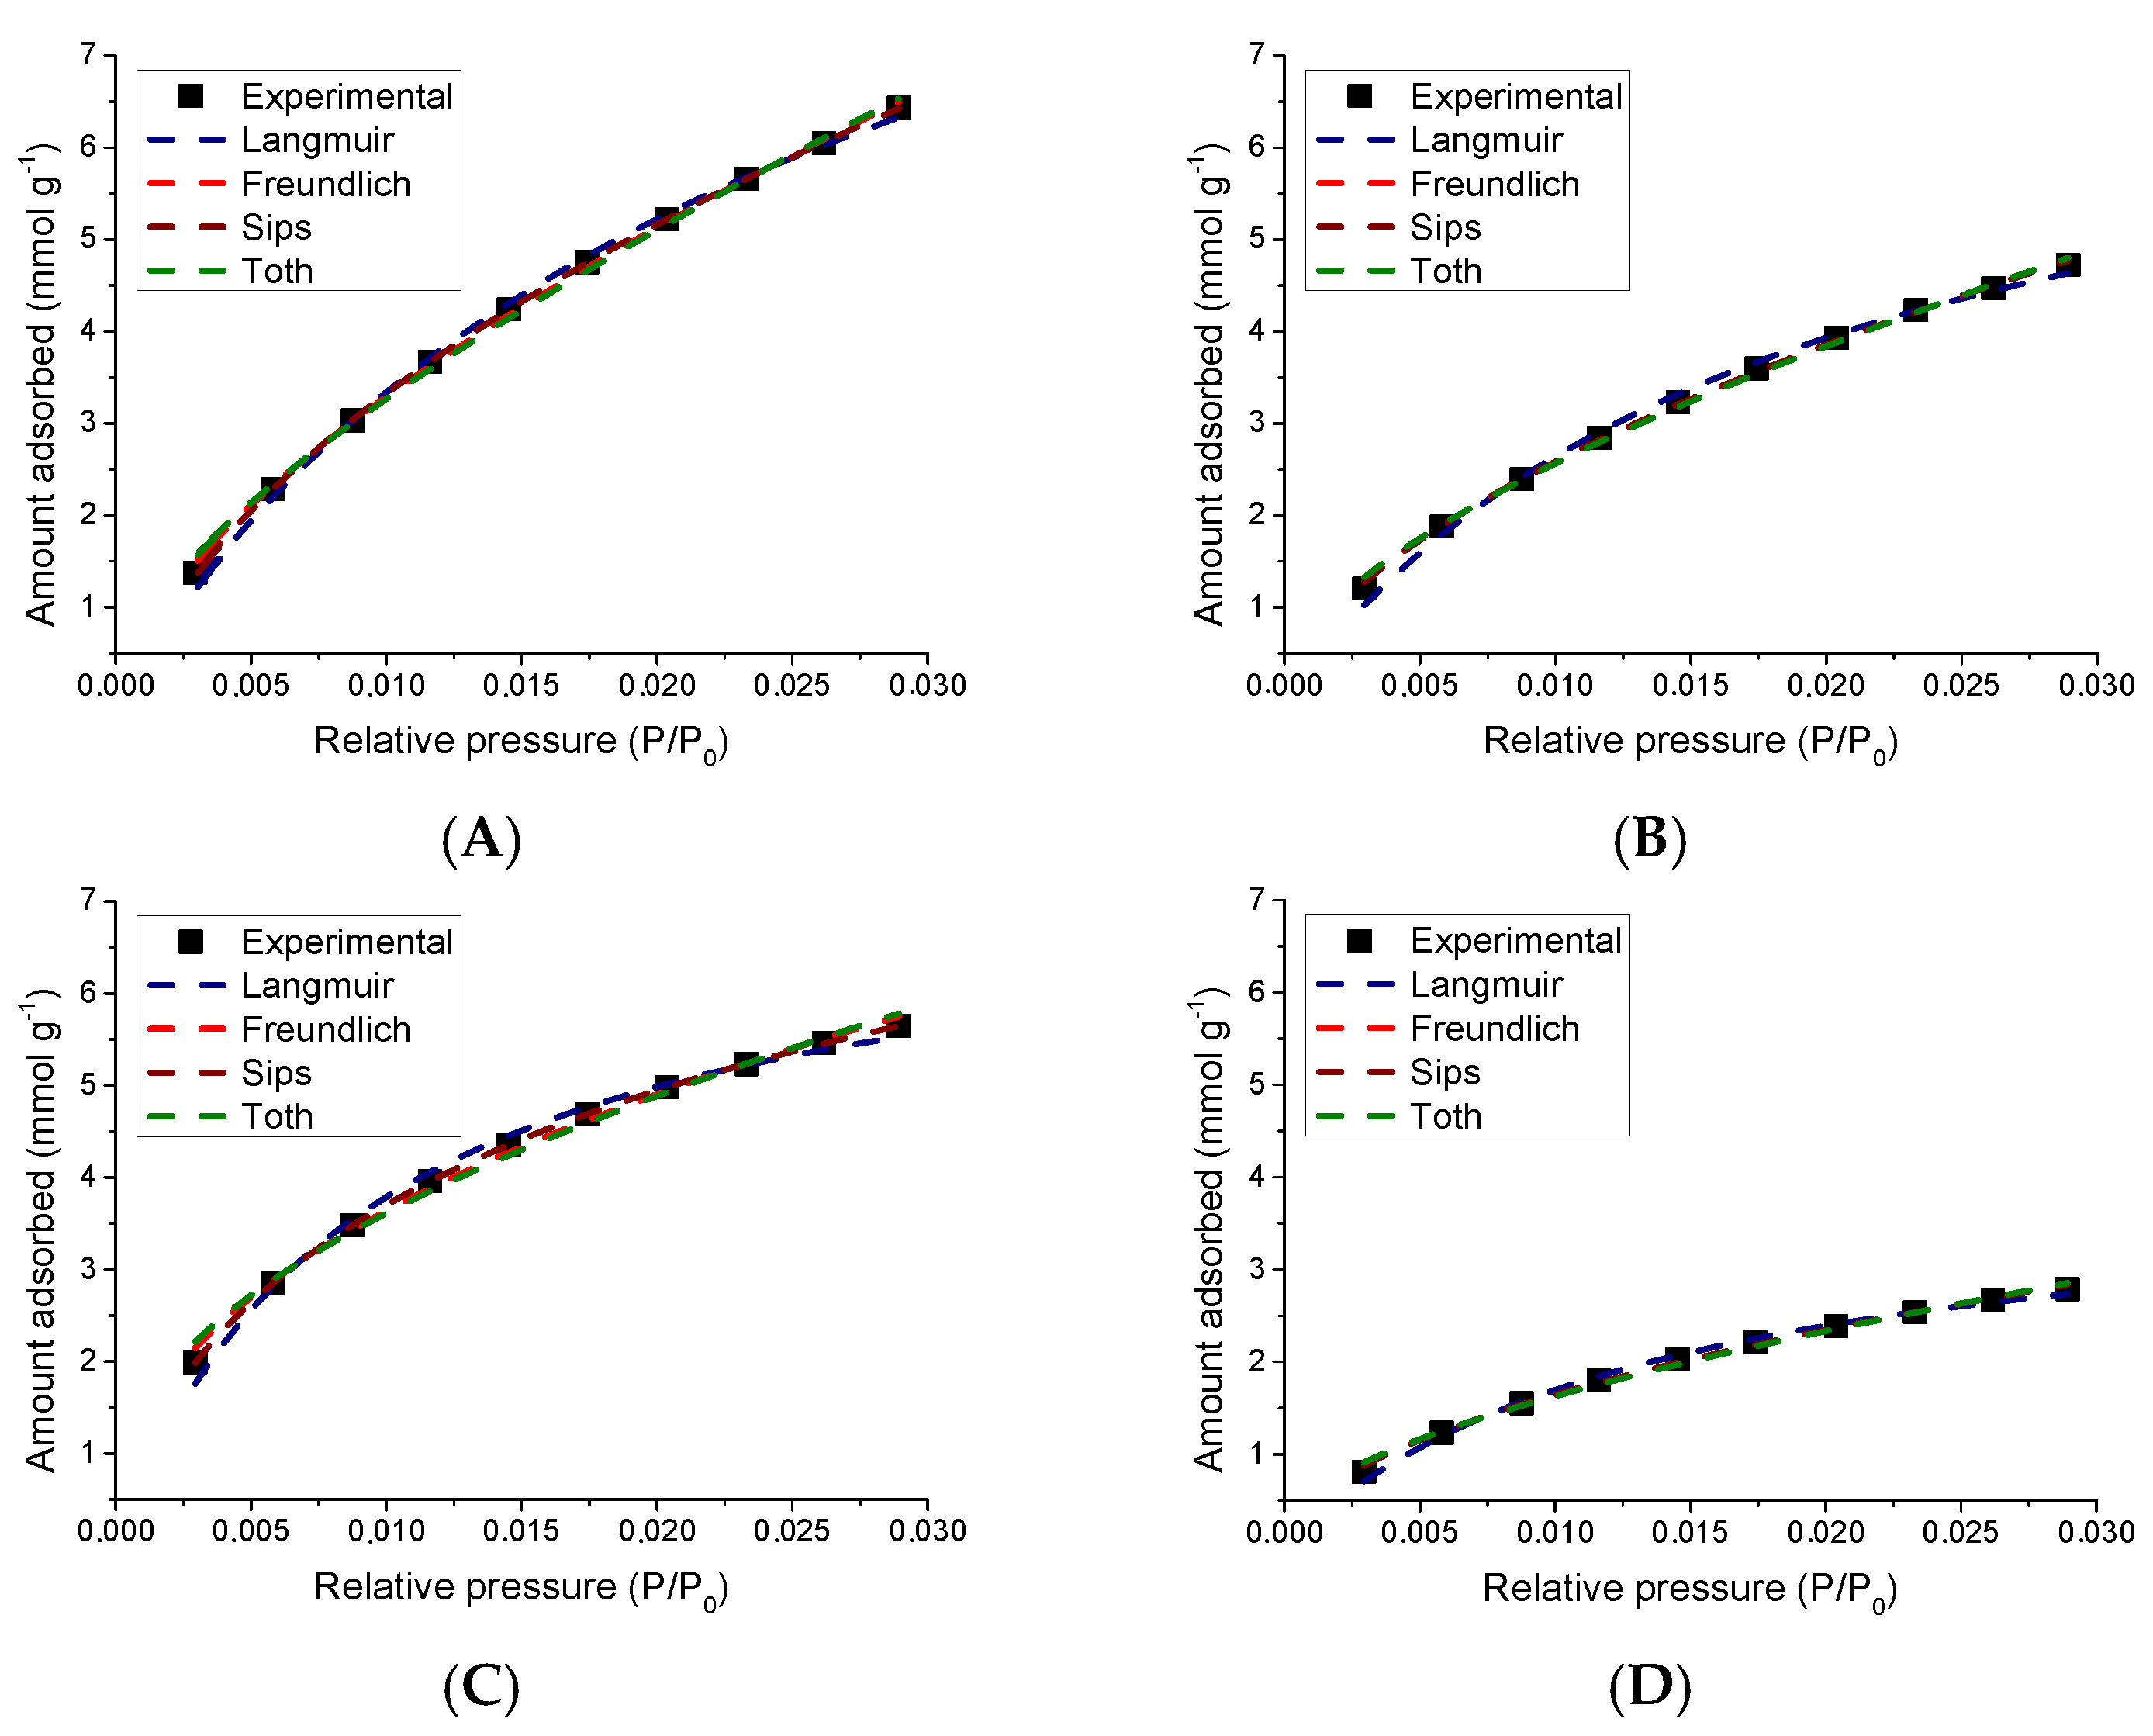
3.5.2. Study of the CO2 Adsorption Isotherms

Figure 9 shows the isotherms obtained by adjusting the experimental data to the adsorption models of Langmuir, Freundlich, Sips, and Toth. All models showed significant adjustment to the experimental data because the process was carried out in a range of low pressures where all behaviors are linear.
Table 4 shows that, in all studied models, the correlation factor R2 was greater than 0.99 because the parameters reported in this table are reliable and the applied models presented a good prediction of the results. This is consistent with reports in the literature, in which it is mentioned that the Langmuir and Freundlich models conform to the CO2 adsorption isotherms (at least from a macroscopic point of view) in certain partial pressure ranges. This is also given by the low-pressure range used and the adsorption capacity obtained, so that the shape of the theoretical isotherms fit the experimental data very well [8].
It has been reported that, at low adsorption temperatures, the Freundlich model presents the best fit, while, at high temperatures, the Langmuir model is best [8]. This is given by the amount of CO2 adsorbed, because this is an exothermic process, at lower temperatures, where the adsorbed amount of this pollutant increases, the competition for the adsorption sites is more intense and multilayers begin to form. Therefore, in the present work, 0 °C was used because at higher temperatures desorption is promoted. It should also be mentioned that the good fit of the Sips and Toth models is given since these two models are composed of the Langmuir and Freundlich equations.
Table 4 also shows the parameters obtained when adjusting the models of Langmuir, Freundlich, Sips, and Toth to the experimental data. The deviations observed in the correlation of these parameters are given because the Langmuir and Freundlich models are from two parameters and are applicable to surfaces with a homogeneous and heterogeneous energy distribution. The Sips and Toth models have three variables and were created from the variables of the Langmuir and Freundlich models. In addition, the studied solids have a different distribution in the size of the ultramicropores (Figure 2).
With respect to the different adsorbents, it can be observed that the values of the constants (qL and qs) predict that the maximum capacity of adsorption of CO2 is higher in material ACB 1050; therefore, this solid possesses the best adsorption capacity of this pollutant, which has been attributed to the high value of its textural properties, which were developed during the carbonization process, especially due to the high surface area (1927 m2 g−1) and ultramicropores volume (0.698 cm3 g−1).
In the Freundlich model, the following order is presented for the parameter KF: ACB 1050 > AAB 850 > ACA 1050 > AAA 850, with values corresponding to 62.88, 36.95, 26.50, and 17.41, respectively. This agrees with the capacity of adsorption of the materials observed in Figure 6, except for samples ACA 1050 and AAB 850, where it was observed that the adsorption capacity of ACA 1050 was greater than that of AAB 850. It should be noted that the shape of the isotherms is different, and the equilibrium of the adsorption capacity has not been reached (that is, when increasing the pressure, an increase in the amount of CO2 is still achieved). On the other hand, in Figure 2B, it is observed that material AAB 850 presents a greater distribution of the width of the ultramicropores compared to material ACA 1050 (Figure 2C); therefore, the Freundlich model predicts that AAB 850 can be a better adsorbent than ACA 1050.
The value of the constant n in the Freundlich model is greater than 1 in all samples; therefore, the samples had a good capacity for CO2 adsorption. The parameter ms of the Sips model was 0.99 and 0.66 for carbonized samples ACB 1050 and ACA 1050, respectively. After the activation process to obtain samples AAB 850 and AAA 850, the value of this parameter decreased in the two carbonized materials to values of 0.58 and 0.51 (farther away from 1) because the activation processes increased the heterogeneity of the CO2 adsorption sites. The value of the parameter mT in all materials was close to zero. This agrees with the theory that the Toth equation behaves according to Henry’s law when using low pressures.

4. Conclusions

The conditions under which the carbonization of the organic aerogels was carried out produced materials with a large volume of ultramicropores; therefore, they are efficient in the adsorption of this atmospheric pollutant.
The intraparticle diffusion model presents the best fit to the experimental data. This model was used to analyze the rate data from the experiments. Both the intraparticle diffusion and the equilibrium plateau models resulted in estimations that agreed with the experimental data.
The kinetic study showed that the Elovich model presents the second-best fit to the obtained data, so that on the surface of the materials an energy distribution is presented during the CO2 adsorption process, attributed to the distribution of the ultramicropores determined by the theoretical model NLDFT.
ACB 1050 had the best capacity of adsorption of CO2. This was attributed to the large volume of its ultramicropores and large surface area corresponding to 0.698 cm3 g−1 and 1927 m2 g−1, respectively, generated during the carbonization process in the presence of N2.

Author Contributions

J.R.G.R. performed the experimental work and wrote the manuscript. J.C.M.-P. and L.G.G. supervised the work and reviewed the manuscript. All authors reviewed the manuscript prior to submission.

Funding

This research received no external funding.

Acknowledgments

The authors thank the Framework Agreement between the Universidad de los Andes and the Universidad Nacional de Colombia and the act of agreement established between the Chemistry Departments of the two universities, under which this research was conducted. J.R.G.R. thank the science faculty of the University of the Andes for the support received in the call 2017-2 for the financing of research projects and presentation of results in academic events. Finally, the authors also thank the grant for the funding assignment of resources designated to the finalization of projects leading to the obtaining of a product of new knowledge 2018.

Conflicts of Interest

The authors declare no conflict of interest. The funding sponsors had no role in the design of the study, in the collection, analyses, or interpretation of data, in the writing of the manuscript, or in the decision to publish the results.

References

  1. Anas, M.; Gönel, A.G.; Bozbag, S.E.; Erkey, C. Thermodynamics of adsorption of carbon dioxide on various aerogels. J. CO2 Util. 2017, 21, 82–88. [Google Scholar] [CrossRef]
  2. Jedli, H.; Brahmi, J.; Hedfi, H.; Mbarek, M.; Bouzgarrou, S.; Slimi, K. Adsorption kinetics and thermodynamics properties of supercritical CO2 on activated clay. J. Pet. Sci. Eng. 2018, 166, 476–481. [Google Scholar] [CrossRef]
  3. Kumar, S.; Wani, M.Y.; Koh, J.; Gil, J.M.; Sobral, A.J.F.N. Carbon dioxide adsorption and cycloaddition reaction of epoxides using chitosan-graphene oxide nanocomposite as a catalyst. J. Environ. Sci. 2018, 69, 77–84. [Google Scholar]
  4. Yaumi, A.L.; Bakar, M.Z.A.; Hameed, B.H. Melamine-nitrogenated mesoporous activated carbon derived from rice husk for carbon dioxide adsorption in fixed-bed. Energy 2018, 155, 46–55. [Google Scholar] [CrossRef]
  5. Kouetcha, D.N.; Ramézani, H.; Mathieu-Cohaut, N.; Bhatia, S.K. Carbon dioxide adsorption through carbon adsorbent structures: Effect of the porosity size, chemical potential and temperature. Comput. Mater. Sci. 2018, 151, 255–272. [Google Scholar] [CrossRef]
  6. Lillia, S.; Bonalumi, D.; Grande, C.; Manzolini, G. A comprehensive modeling of the hybrid temperature electric swing adsorption process for CO2 capture. Int. J. Greenh. Gas Control 2018, 74, 155–173. [Google Scholar] [CrossRef]
  7. Li, J.-R.; Ma, Y.; McCarthy, M.C.; Sculley, J.; Yu, J.; Jeong, H.-K.; Balbuena, P.B.; Zhou, H.-C. Carbon dioxide capture-related gas adsorption and separation in metal-organic frameworks. Coord. Chem. Rev. 2011, 255, 1791–1823. [Google Scholar] [CrossRef]
  8. Raganati, F.; Alfe, M.; Gargiulo, V.; Chirone, R.; Ammendola, P. Isotherms and thermodynamics of CO2 adsorption on a novel carbon-magnetite composite sorbent. Chem. Eng. Res. Des. 2018, 134, 540–552. [Google Scholar] [CrossRef]
  9. Zeleňák, V.; Skřínska, M.; Zukal, A.; Čejka, J. Carbon dioxide adsorption over amine modified silica: Effect of amine basicity and entropy factor on isosteric heats of adsorption. Chem. Eng. J. 2018, 348, 327–337. [Google Scholar] [CrossRef]
  10. Zukal, A.; Shamzhy, M.; Kubů, M.; Čejka, J. The effect of pore size dimensions in isoreticular zeolites on carbon dioxide adsorption heats. J. CO2 Util. 2018, 24, 157–163. [Google Scholar] [CrossRef]
  11. Deng, S.; Chen, T.; Zhao, T.; Yao, X.; Wang, B.; Huang, J.; Wang, Y.; Yu, G. Role of micropores and nitrogen-containing groups in CO2 adsorption on indole-3-butyric acid potassium derived carbons. Chem. Eng. J. 2016, 286, 98–105. [Google Scholar] [CrossRef]
  12. Pires, J.; Juźków, J.; Pinto, M.L. Amino acid modified montmorillonite clays as sustainable materials for carbon dioxide adsorption and separation. Colloids Surf. A Physicochem. Eng. Asp. 2018, 544, 105–110. [Google Scholar] [CrossRef]
  13. Rashidi, N.A.; Yusup, S. An overview of activated carbons utilization for the post-combustion carbon dioxide capture. J. CO2 Util. 2016, 13, 1–16. [Google Scholar] [CrossRef]
  14. Wdowin, M.; Tarkowski, R.; Franus, W. Determination of changes in the reservoir and cap rocks of the chabowo anticline caused by CO2-brine-rock interactions. Int. J. Coal Geol. 2014, 130, 79–88. [Google Scholar] [CrossRef]
  15. Yang, Y.; Yan, X.; Hu, X.; Feng, R.; Zhou, M.; Cui, W. Development of zeolitic imidazolate framework-67 functionalized Co-Al LDH for CO2 adsorption. Colloids Surf. A Physicochem. Eng. Asp. 2018, 552, 16–23. [Google Scholar] [CrossRef]
  16. Álvarez-Gutiérrez, N.; Gil, M.V.; Rubiera, F.; Pevida, C. Kinetics of CO2 adsorption on cherry stone-based carbons in CO2/CH4 separations. Chem. Eng. J. 2017, 307, 249–257. [Google Scholar] [CrossRef]
  17. Liu, N.; Shen, J.; Liu, D. Activated high specific surface area carbon aerogels for EDLCs. Microporous Mesoporous Mater. 2013, 167, 176–181. [Google Scholar] [CrossRef]
  18. Brunauer, S.; Emmett, P.H. The use of low temperature van der waals adsorption isotherms in determining the surface areas of various adsorbents. J. Am. Chem. Soc. 1937, 59, 2682–2689. [Google Scholar] [CrossRef]
  19. Brunauer, S.; Emmett, P.H.; Teller, E. Adsorption of gases in multimolecular layers. J. Am. Chem. Soc. 1938, 60, 309–319. [Google Scholar] [CrossRef]
  20. Brunauer, S.; Emmett, P.H. The use of van der waals adsorption isotherms in determining the surface area of iron synthetic ammonia catalysts. J. Am. Chem. Soc. 1935, 57, 1754–1755. [Google Scholar] [CrossRef]
  21. Brunauer, S.; Deming, L.S.; Deming, W.E.; Teller, E. On a theory of the van der waals adsorption of gases. J. Am. Chem. Soc. 1940, 62, 1723–1732. [Google Scholar] [CrossRef]
  22. Thommes, M.; Kaneko, K.; Neimark, A.V.; Olivier, J.P.; Rodriguez-Reinoso, F.; Rouquerol, J.; Sing, K.S. Physisorption of gases, with special reference to the evaluation of surface area and pore size distribution (IUPAC Technical Report). Pure Appl. Chem. 2015, 87, 1051–1069. [Google Scholar] [CrossRef] [Green Version]
  23. Dubinin, M.M. Physical adsorption of gases and vapors in micropores. In Progress in Surface and Membrane Science; Cadenhead, D.A., Danielli, J.F., Rosenberg, M.D., Eds.; Elsevier: Moscow, Russia, 1975; Volume 9, pp. 1–70. [Google Scholar]
  24. Landers, J.; Gor, G.Y.; Neimark, A.V. Density functional theory methods for characterization of porous materials. Colloids Surf. A Physicochem. Eng. Asp. 2013, 437, 3–32. [Google Scholar] [CrossRef]
  25. Wei, M.; Zhang, L.; Xiong, Y.; Li, J.; Peng, P.A. Nanopore structure characterization for organic-rich shale using the non-local-density functional theory by a combination of N2 and CO2 adsorption. Microporous Mesoporous Mater. 2016, 227, 88–94. [Google Scholar] [CrossRef]
  26. Inyang, H.I.; Onwawoma, A.; Bae, S. The elovich equation as a predictor of lead and cadmium sorption rates on contaminant barrier minerals. Soil Tillage Res. 2016, 155, 124–132. [Google Scholar] [CrossRef]
  27. Lagergren, S. About the theory of so-called adsorption of soluble substances. Sven. Vetensk. Handl. 1898, 24, 1–39. [Google Scholar]
  28. Ho, Y.S.; McKay, G. Pseudo-second order model for sorption processes. Process Biochem. 1999, 34, 451–465. [Google Scholar] [CrossRef]
  29. Rodrigues, A.E.; Silva, C.M. What’s wrong with lagergreen pseudo first order model for adsorption kinetics? Chem. Eng. J. 2016, 306, 1138–1142. [Google Scholar] [CrossRef]
  30. Ofomaja, A.E.; Naidoo, E.B.; Modise, S.J. Dynamic studies and pseudo-second order modeling of copper(II) biosorption onto pine cone powder. Desalination 2010, 251, 112–122. [Google Scholar] [CrossRef]
  31. Yang, X.; Al-Duri, B. Kinetic modeling of liquid-phase adsorption of reactive dyes on activated carbon. J. Colloid Interface Sci. 2005, 287, 25–34. [Google Scholar] [CrossRef] [PubMed]
  32. Baghdadi, M. UT (University of Tehran) isotherm as a novel and useful adsorption isotherm for investigation of adsorptive removal of pollutants. J. Environ. Chem. Eng. 2017, 5, 1906–1919. [Google Scholar] [CrossRef]
  33. Rill, C.; Kolar, Z.I.; Kickelbick, G.; Wolterbeek, H.T.; Peters, J.A. Kinetics and thermodynamics of adsorption on hydroxyapatite of the [160Tb] terbium complexes of the bone-targeting ligands DOTP and BPPED. Langmuir 2009, 25, 2294–2301. [Google Scholar] [CrossRef] [PubMed]
  34. Zhang, H.; Wang, Y.; Bai, P.; Guo, X.; Ni, X. Adsorptive separation of acetic acid from dilute aqueous solutions: Adsorption kinetic, isotherms, and thermodynamic studies. J. Chem. Eng. Data 2015, 61, 213–219. [Google Scholar] [CrossRef]
  35. Uslu, H.; Majumder, S. Adsorption studies of lactic acid by polymeric adsorbent amberlite XAD-7: Equilibrium and kinetics. J. Chem. Eng. Data 2017, 62, 1501–1506. [Google Scholar] [CrossRef]
  36. Chen, J.; Yang, H.; Ring, Z. Study of intra-particle diffusion effect on hydrodesulphurization of dibenzothiophenic compounds. Catal. Today 2005, 109, 93–98. [Google Scholar] [CrossRef]
  37. Weber, W.J.; Morris, J.C. Kinetics of adsorption on carbon from solution. J. Sanit. Eng. Div. 1963, 89, 31–60. [Google Scholar]
  38. Hossain, M.A.; Ngo, H.H.; Guo, W.S.; Setiadi, T. Adsorption and desorption of copper (II) ions onto garden grass. Bioresour. Technol. 2012, 121, 386–395. [Google Scholar] [CrossRef] [PubMed]
  39. Langmuir, I. The adsorption of gases on plane surfaces of glass, mica and platinum. J. Am. Chem. Soc. 1918, 40, 1361–1403. [Google Scholar] [CrossRef]
  40. McKay, G.; Mesdaghinia, A.; Nasseri, S.; Hadi, M.; Solaimany, A.M. Optimum isotherms of dyes sorption by activated carbon: Fractional theoretical capacity & error analysis. Chem. Eng. J. 2014, 251, 236–247. [Google Scholar]
  41. Freundlich, H. Über die adsorption in lösungen. Z. Phys. Chem. 1907, 57, 385–470. [Google Scholar] [CrossRef]
  42. Barka, N.; Ouzaouit, K.; Abdennouri, M.; Makhfouk, M.E. Dried prickly pear cactus (opuntia ficus indica) cladodes as a low-cost and eco-friendly biosorbent for dyes removal from aqueous solutions. J. Taiwan Inst. Chem. Eng. 2013, 44, 52–60. [Google Scholar] [CrossRef]
  43. Brdar, M.; Šćiban, M.; Takači, A.; Došenović, T. Comparison of two and three parameters adsorption isotherm for Cr (VI) onto Kraft lignin. Chem. Eng. J. 2012, 183, 108–111. [Google Scholar] [CrossRef]
  44. Deniz, F.; Ersanli, E.T. Simultaneous bioremoval of two unsafe dyes from aqueous solution using a novel green composite biosorbent. Microchem. J. 2016, 128, 312–319. [Google Scholar] [CrossRef]
  45. Chatterjee, S.; Lee, M.W.; Woo, S.H. Adsorption of congo red by chitosan hydrogel beads impregnated with carbon nanotubes. Bioresour. Technol. 2010, 101, 1800–1806. [Google Scholar] [CrossRef] [PubMed]
  46. Bera, A.; Kumar, T.; Ojha, K.; Mandal, A. Adsorption of surfactants on sand surface in enhanced oil recovery: Isotherms, kinetics and thermodynamic studies. Appl. Surf. Sci. 2013, 284, 87–99. [Google Scholar] [CrossRef]
  47. Rangabhashiyam, S.; Anu, N.; Nandagopal, M.S.G.; Selvaraju, N. Relevance of isotherm models in biosorption of pollutants by agricultural byproducts. J. Environ. Chem. Eng. 2014, 2, 398–414. [Google Scholar] [CrossRef]
  48. Mirzaeian, M.; Hall, P.J. The control of porosity at nano scale in resorcinol formaldehyde carbon aerogels. J. Mater. Sci. 2009, 44, 2705–2713. [Google Scholar] [CrossRef] [Green Version]
  49. Yang, X.; Fei, B.; Ma, J.; Liu, X.; Yang, S.; Tian, G.; Jiang, Z. Porous nanoplatelets wrapped carbon aerogels by pyrolysis of regenerated bamboo cellulose aerogels as supercapacitor electrodes. Carbohydr. Polym. 2018, 180, 385–392. [Google Scholar] [CrossRef] [PubMed]
  50. Moreno, A.; Arenillas, A.; Calvo, E.; Bermúdez, J.; Menéndez, J. Carbonisation of resorcinol-formaldehyde organic xerogels: Effect of temperature, particle size and heating rate on the porosity of carbon xerogels. J. Anal. Appl. Pyrolysis 2013, 100, 111–116. [Google Scholar] [CrossRef] [Green Version]
  51. Fang, Y.; Hu, H.; Chen, G. Zeolite with tunable intracrystal mesoporosity synthesized with carbon aerogel as a secondary template. Microporous Mesoporous Mater. 2008, 113, 481–489. [Google Scholar] [CrossRef]
  52. Sierra, I.; Iriarte-Velasco, U.; Gamero, M.; Aguayo, A.T. Upgrading of sewage sludge by demineralization and physical activation with CO2: Application for methylene blue and phenol removal. Microporous Mesoporous Mater. 2017, 250, 88–99. [Google Scholar] [CrossRef]
  53. Kong, Y.; Zhong, Y.; Shen, X.; Cui, S.; Fan, M. Effect of silica sources on nanostructures of resorcinol-formaldehyde/silica and carbon/silicon carbide composite aerogels. Microporous Mesoporous Mater. 2014, 197, 77–82. [Google Scholar] [CrossRef]
  54. Shoaib, M.; Al-Swaidan, H.M. Optimization and characterization of sliced activated carbon prepared from date palm tree fronds by physical activation. Biomass Bioenergy 2015, 73, 124–134. [Google Scholar] [CrossRef]
  55. Prauchner, M.J.; Rodríguez-Reinoso, F. Chemical versus physical activation of coconut shell: A comparative study. Microporous Mesoporous Mater. 2012, 152, 163–171. [Google Scholar] [CrossRef]
  56. Zafra, M.; Lavela, P.; Rasines, G.; Macías, C.; Tirado, J. Effect of the resorcinol/catalyst ratio in the capacitive performance of carbon xerogels with potential use in sodium chloride removal from saline water. J. Solid State Electrochem. 2014, 18, 2847–2856. [Google Scholar] [CrossRef]
  57. Mahani, A.A.; Motahari, S.; Nayyeri, V. Synthesis, characterization and dielectric properties of one-step pyrolyzed/activated resorcinol-formaldehyde based carbon aerogels for electromagnetic interference shielding applications. Mater. Chem. Phys. 2018, 213, 492–501. [Google Scholar] [CrossRef]
  58. Laskowski, J.; Milow, B.; Ratke, L. Aerogel-aerogel composites for normal temperature range thermal insulations. J. Non-Cryst. Solids 2016, 441, 42–48. [Google Scholar] [CrossRef]
  59. Kong, Y.; Zhong, Y.; Shen, X.; Cui, S.; Yang, M.; Teng, K.; Zhang, J. Facile synthesis of resorcinol-formaldehyde/silica composite aerogels and their transformation to monolithic carbon/silica and carbon/silicon carbide composite aerogels. J. Non-Cryst. Solids 2012, 358, 3150–3155. [Google Scholar] [CrossRef]
  60. Laskowski, J.; Milow, B.; Ratke, L. Subcritically dried resorcinol-formaldehyde aerogels from a base-acid catalyzed synthesis route. Microporous Mesoporous Mater. 2014, 197, 308–315. [Google Scholar] [CrossRef]
  61. Chen, K.; Bao, Z.; Du, A.; Zhu, X.; Shen, J.; Wu, G.; Zhang, Z.; Zhou, B. One-pot synthesis, characterization and properties of acid-catalyzed resorcinol/formaldehyde cross-linked silica aerogels and their conversion to hierarchical porous carbon monoliths. J. Sol-Gel Sci. Technol. 2012, 62, 294–303. [Google Scholar] [CrossRef]
  62. Kinnertová, E.; Slovák, V. Influence of catalyst amount on properties of resorcinol-formaldehyde xerogels. Thermochim. Acta 2018, 660, 37–43. [Google Scholar] [CrossRef]
  63. Schwan, M.; Naikade, M.; Raabe, D.; Ratke, L. From hard to rubber-like: Mechanical properties of resorcinol-formaldehyde aerogels. J. Mater. Sci. 2015, 50, 5482–5493. [Google Scholar] [CrossRef]
  64. Li, W.-C.; Lu, A.-H.; Guo, S.-C. Characterization of the microstructures of organic and carbon aerogels based upon mixed cresol-formaldehyde. Carbon 2001, 39, 1989–1994. [Google Scholar] [CrossRef]
  65. Mulik, S.; Sotiriou-Leventis, C.; Leventis, N. Time-efficient acid-catalyzed synthesis of resorcinol-formaldehyde aerogels. Chem. Mater. 2007, 19, 6138–6144. [Google Scholar] [CrossRef]
  66. Pekala, R. Organic aerogels from the polycondensation of resorcinol with formaldehyde. J. Mater. Sci. 1989, 24, 3221–3227. [Google Scholar] [CrossRef]
  67. Yan, L.-G.; Qin, L.-L.; Yu, H.-Q.; Li, S.; Shan, R.-R.; Du, B. Adsorption of acid dyes from aqueous solution by CTMAB modified bentonite: Kinetic and isotherm modeling. J. Mol. Liq. 2015, 211, 1074–1081. [Google Scholar] [CrossRef]
  68. Liu, B.; Ge, N.; Peng, B.; Pan, S. Kinetic and isotherm studies on the adsorption of tenuazonic acid from fruit juice using inactivated LAB. J. Food Eng. 2017, 224, 45–52. [Google Scholar] [CrossRef]
Figure 1. Physisorption isotherms of N2 at −196 °C of the carbon aerogels obtained in: (A) basic medium; and (B) acidic medium.
Carbon 04 00052 g001
Figure 2. Size distribution of ultramicropores determined by physisorption of CO2 at 0 °C using the NLDFT theoretical method in materials: (A) ACA 1050; (B) AAB 850; (C) ACA 1050; and (D) AAA 850.
Carbon 04 00052 g002
Figure 3. Raman spectra of prepared aerogels.
Carbon 04 00052 g003
Figure 4. SEM micrographs of: (A) ACB 1050; (B) AAB 850; (C) ACA 1050 and (D) AAA 850.
Carbon 04 00052 g004
Figure 5. Infrared spectroscopy (IR) spectra of dry aerogels.
Carbon 04 00052 g005
Figure 6. Isotherms of adsorption of CO2 at 0 °C.
Carbon 04 00052 g006
Figure 7. Adsorption of CO2 vs. time at 0 °C.
Carbon 04 00052 g007
Figure 8. Results of applying the kinetic models to the data obtained from CO2 adsorption on the surface of the aerogels: (A) Pseudo first order; (B) Modified Pseudo first modified order; (C) Pseudo second order; (D) Elovich model and (E) Intra-particle diffusion.
Carbon 04 00052 g008
Figure 9. Adjustment of the experimental data of the CO2 adsorption isotherms to the different theoretical models in the samples: (A) ACB 1050; (B) AAB 850; (C) ACA 1050 and (D) AAA 850.
Carbon 04 00052 g009
Table 1. BET area of carbon aerogels.
SampleSBET (m2 g−1)
ACB 10501927
AAB 8501491
ACA 1050893
AAA 850629
Table 2. Volume of the ultramicropores determined by the Dubinin-Radushkevich model used with CO2 isotherms taken at 0 °C.
SampleVn (cm3 g−1)
ACB 10500.698
AAB 8500.357
ACA 10500.451
AAA 8500.230
Table 3. Obtained parameters for the kinetics of adsorption of CO2 on the surface of aerogels.
Kinetic ModelParameterSamples
ACB 1050AAB 850ACA 1050AAA 850
Pseudo first orderK10.02330.02120.02830.02395
R20.9450.9520.9470.941
Pseudo Second orderK20.00008660.00009030.0001.210.000230
R20.65210.66150.67340.689
Modified Pseudo first orderKm0.01640.01540.02210.0181
R20.8690.88720.8950.8771
Elovichα0.06180.03680.04900.0239
β0.08380.1020.09210.197
R20.9910.9820.9690.985
Intra-particle diffusionkdi12.041.822.370.888
R20.9980.9960.9950.999
kdi21.270.8760.9710.487
R20.9950.9920.9920.994
Table 4. Parameters of the Langmuir, Freundlich, Sips, and Toth isotherms for the adsorption of CO2 at atmospheric pressure in prepared aerogels.
ModelsParametersSample
ACB 1050AAB 850ACA 1050AAA 850
LangmuirqL12.017.707.294.04
KL38.4852.07107.8472.17
R20.990.990.990.99
FreundlichKF62.8836.9526.5017.41
N1.561.732.321.95
R20.990.990.990.99
SipsqS36.925.6210.756.27
KS18.986.5710.192.77
ms0.990.580.660.51
R20.990.991.000.99
TothqT0.0200.0230.1080.043
KT4.152.961.502.44
mT−0.19−0.18−0.16−0.19
R20.990.990.990.99

