Article

Operando DRIFTS-MS Study of WGS and rWGS Reaction on Biochar-Based Pt Catalysts: The Promotional Effect of Na

Departamento de Química Inorgánica, Instituto de Ciencia de Materiales de Sevilla, Centro Mixto CSIC–Universidad de Sevilla, 49 Av. Américo Vespucio, 41092 Sevilla, Spain
*
Author to whom correspondence should be addressed.
Submission received: 17 July 2018 / Revised: 14 August 2018 / Accepted: 15 August 2018 / Published: 21 August 2018
(This article belongs to the Special Issue Carbon-Based Catalyst)

Abstract

:
Biochar-based Pt catalysts, unpromoted and Na-promoted, were prepared by an incipient wetness impregnation method and characterised by Inductively coupled plasma mass spoectrometry (ICP-MS) analysis, X-ray diffraction, N2 adsorption and transmission, and scanning electron microscopy. It was demonstrated that a sodium promoter modifies the acid-base properties of the support, altering the Pt-support interaction. An operando Diffuse reflectance infrared fourier transform spectroscopy-mass spectrometry (DRIFTS-MS) study was performed to gain insights into the reaction pathways and the mechanism of the Water-Gass-Shift (WGS) and the Reverse Water-Gass-Shift (rWGS) reactions. It was demonstrated that the addition of Na enhances the catalytic performance due to the changes induced by the alkali in the electronic structure of the Pt active sites. This effect favours the activation of H2O molecules during the WGS reaction and the dissociation of CO2 during the rWGS reaction, although it may also favour the consecutive CO methanation pathway.

Graphical Abstract

1. Introduction

The depletion of fossil fuels and the environmental problems associated with their use as energy sources have encouraged research towards the renewable and sustainable energetic vector. Hydrogen is considered a more attractive energy option for the future when generated by technologies based on renewable feed-stocks such as water splitting or biomass gasification [1,2,3]. The water-gas shift (WGS) reaction is an essential process to produce CO-free hydrogen or to adjust the H2/CO ratio. The removal of CO to produce high-purity hydrogen through the water-gas shift (WGS) reaction has gathered increasing attention from an environmentally friendly point of view for generating electrical energy using polymer-electrolyte membrane fuel cells (PEMFCs) [4,5,6].
The water-gas shift is a moderately exothermic reaction and thermodynamically favoured at low temperatures but kinetically enhanced at high temperatures; in this way, the equilibrium CO conversion decreases on increasing the reaction temperature. Because of this, the reaction is normally carried out in two stages: a high-temperature shift (350–400 °C) with iron-based catalysts, and a low-temperature shift (200–250 °C) with copper-based catalysts [7]. Due to the low thermal stability and pyrophoric character of Cu-based catalysts, noble metal-based catalysts have attracted considerable interest for the low-temperature water-gas shift reaction as a potential alternative to industrial copper-based catalysts [8,9,10,11]. Noble-metal-based catalysts offer greater stability during start-up/shut-down cycles than conventional catalysts and their catalytic performance can be enhanced by modifying the support and/or by the addition of promoters. Recent reports have shown an increase in the WGS intrinsic activity by adding an alkali metal (Na, K, Li) as a promoter to platinum-based catalysts [8,9,12,13,14]. It is believed that the role of the alkali in the WGS reaction pathway can be attributed to the modification of the local electronic properties of Pt for increasing the number of water activation sites [15]. Other authors suggested that alkali metal facilitates the formate C–H bond cleavage, favouring the rate of formate decomposition in a mechanism via formate intermediates [16]. Zhai et al. [13] claim through experimental evidence and density functional theory (DFT) calculations that a partially oxidised Pt–Na–Ox(OH)y cluster is the active site for the low-temperature Pt-catalysed WGS reaction. They reported that water can easily be dissociated on these sites and that the CO reaction with hydroxyls takes place at low temperatures. The mechanism as well as the nature of the active site is highly controversial; for instance, Ding et al. [17] claim that Pt nanoparticles show activity in the WGS reaction, while Pt single atoms behave as spectators; on the contrary, Fu et al. [18] indicate that Au or Pt nanoparticles do not participate in the WGS reaction, being cationic isolated species strongly interacting with the support on the active sites.
Carbon materials are widely used as catalytic supports in numerous chemical reactions due to their textural properties area and a surface chemistry that is strongly influenced by the functional groups present on these carbon surfaces [19,20]. Biochar is a highly porous and carbon-rich material produced from the thermochemical degradation of the biomass. Biochar is a promising and environmentally friendly alternative to activated carbon and other conventional carbon materials [21,22]. The use of biochar materials with a high surface area as catalyst supports can enhance the catalyst performance, reducing the amount of catalyst used and consequently the cost. Moreover, the physico-chemical properties of biochar can be adjusted via acid/base treatment or carbonisation, and thus it is an excellent support for catalytic applications [23,24].
Infrared (IR) spectroscopic methods have not received much attention in the past due to the difficulty of obtaining data on highly opaque carbon-supported metal catalysts. Diffuse Reflectance (DRIFTS) can overcome the latter problem, and this more recently developed IR technique has been applied to several carbon materials [25]. DRIFTS is a surface-sensitive technique, and unlike transmission spectroscopy it suppresses the influence of light scattering on the spectral data, which is a source of interferences in absorption spectra [26]. Therefore, the use of the operando DRIFTS technique is a powerful method for analysing the nature of alkali promotion and gaining insight into the WGS and the rWGS reaction mechanism. This technique combines the evaluation of intermediate species on the catalyst surface and the kinetic performance under reaction conditions.
In this scenario, we have performed an operando DRIFTS study to gain a more detailed idea of the reactivity of the molecules involved in the forward and reverse WGS reactions (CO, H2O, CO2 and H2) over Pt-based biochar catalyst and the promotional effect of alkali element (Na) in the water activation or the CO2 dissociation. We emphasise the nature of the adsorption sites and hypothesise about the reaction pathway.

2. Materials and Methods

Biochar support was prepared by pyrolysis of commercial microcrystalline cellulose (Sigma-Aldrich, 100 mesh particle size) at 500 °C (2 h, 10 °C/min heating rate) in 200 mL·min−1 of a reductant (1:1 nitrogen/hydrogen) flow. Pt and Pt–Na-promoted catalysts were prepared by incipient wetness impregnation. The adequate amount of a 10−4 M aqueous solution of Pt(NH3)2(NO2)2 alone or with Na2CO3, respectively, in order to have the desired metal loading (1 wt. % for platinum and 5 wt. % for sodium) were dropped on the biochar support and the mixture was maintained under continuous stirring for 1 h. Then, the resulting solid was dried at room temperature and reduced at 350 °C for 1 h in 100 mL·min−1 of a 1:1 nitrogen/hydrogen flow.
The elemental analysis of the resulting catalyst was determined using a CHNS elementary analyser (LECO TRUSPEC CHNS MICRO, St. Joseph, MO, USA). Oxygen was determined indirectly by difference. The metal content of the catalysts was measured by inductively coupled plasma mass spectroscopy (ICP-MS) using an ULTIMA 2 ICP spectrometer (HORIBA Jobin Yvon Inc., Edison, NJ, USA).
X-ray diffraction (XRD) analysis was carried out on an X’Pert Pro PANalytical (Almelo, The Netherlands) instrument using Cu Kα radiation (40 mA, 45 kV) and a position-sensitive detector over a 2ϴ range from 10° to 90° using a step size of 0.05° and a corresponding step time of 300 s.
The size and size distributions of the metal nanoparticles were measured by Transmission Electron Microscopy (TEM). The micrographs were obtained on a PHILIPS CM-200 (Almelo, The Netherlands) transmission microscope equipped with microanalysis (EDS), with a minimum spot size of 15 nm and maximum resolution between two points of 2.8 Å. For the measurements, a few milligrams of each sample were deposited directly on 300 mesh holey carbon-coated copper TEM-grid. The mean platinum particle diameter was assessed on the basis of its homogeneity, degree of dispersion, and number of particles. The average platinum particle size was estimated considering the surface distribution calculation, expressed as follows:
D i = 1 n D i 3 v i , 1 n D i 2 v i
where Di is the geometric diameter of the ith particle, and vi the number of particles with this diameter. For every distribution the total number of measured particles is 200 per sample.
The morphology of the samples was measured using a scanning electron microscope SEM HITACHI (Chiyoda, Tokyo, Japan) S-4800 FEG-fitted with secondary and electron backscattered detectors and microanalysis energy-dispersive X-ray spectroscopy (EDX). SEM micrographs were recorded at a working distance of 4 mm and a voltage of 2 kV. Compositional analysis was performed using EDX, at a working distance of 15 mm and a voltage of 20 kV. Mapping compositional was obtained at the same working distance of 15 mm and a voltage of 5 kV.
The textural properties of the solids were analysed from the N2 physisorption isotherms at 77 K in Micromeritics (Norcross, GA, USA) Tristar II equipment. The samples were previously degassed at 350 °C for 12 h using vacuum degasser system 061 VacPrep from Micromeritics (Norcross, GA, USA). The Brunauer-Emmett-Teller (BET) method was applied to obtain the specific surface area from the adsorption isotherms. Sizes and pore distribution were calculated from the desorption curve of the isotherm by the Barrett-Joyner-Halenda (BJH) method.
The catalyst acidity was measured by titration using a Metrohm (Herisau, Switzerland) pH electrode. About 50 mg of a sample were dispersed in 50 mL of distilled water, according to Markus et al. [27]. The resulting slurry was stirred by a magnetic stirrer during the measurement. The pH data were collected versus time and the isoelectric point was obtained when a constant pH value was reached.
Operando DRIFTS experiments were performed in a Thermo (Waltham, MA, USA) Nicolet iS50 model spectrometer equipped with a liquid N2 cooled mercury cadmium telluride (MCT) detector. Spectra were obtained with a spectral resolution of 4 cm−1 and an accumulation of 128 scans. The optical path was continuously purged with a flow of pure nitrogen to eliminate CO2 and water vapour contributions to the spectra, and the background spectrum was collected without sample using a reflective mirror. Typically, 25 mg of a sample were placed in a high-temperature environmental reaction chamber fitted with ZnSe windows and equipped with a Praying Mantis attachment for diffuse reflection spectroscopy from Harrick (Pleasantville, NY, USA). Prior to the reaction, the catalysts were activated in situ at 300 °C for 1 h using a flow of 50 mL min−1 of 50% H2 in Ar and then cooled down to the reaction temperature by flushing with Ar.
The WGS reaction was carried out by feeding a stoichiometric mixture of 10 vol. % of CO and 10 vol. % of H2O in argon with a total flow rate of 50 mL min−1 into the catalytic cell. An adequate amount of water was fed continuously using a HPLC pump and vaporising the liquid in a homemade evaporator. The temperature was increased from 150 °C to 350 °C at intervals of 50 °C and each temperature was maintained for 30 min to achieve steady-state conditions. Analogously, the rWGS reaction was performed using a gas mixture of 10 vol. % CO2 and 10 vol. % H2 balanced with argon at a total flow rate of 50 mL min−1 and increasing the temperature within the range 200–500 °C. A PFEIFFER Vacuum Prisma Plus (Asslar, Germany) mass spectrometer controlled by Quadera® software (PFEIFFER, Asslar, Germany) was on-line coupled to the outlet of the catalytic cell in order to monitor the gas phase while simultaneously obtaining operando DRIFTS spectra of the catalyst surface. Furthermore, the carbon dioxide concentration at the cell outlet was determined using a Vaisala (Vantaa, Finland) CO2 gas analyser.
The catalytic activity was also evaluated in terms of turnover rate (TOF), which was calculated using the following equation:
T O F = r D P t   [ s 1 ]
where r is the reaction rate expressed in molecules of CO2 produced or consumed per unit time and platinum atom (mol·Pt−1·s−1) and DPt is the metal dispersion calculated on the basis of a hemispherical ball model assuming the average Pt particle size estimated by TEM. The dispersion discloses the total number of Pt atoms accessible for the WGS and the RWGS reaction.

3. Results and Discussion

3.1. Physico-Chemical Characterisation

The metal content (Na and Pt) was estimated by ICP-MS analysis, obtaining values in substantial agreement with the desired loading (Table 1). This indicates the suitability of the synthesis method and the anchorage of the active phase on the surface of biochar was in good agreement with previous works [9,28].
It is well known that the interaction of the active metal with the carbon support can be modified by pre-treatment of the surface carbon, altering their point of zero charge (PZC). It depends on the nature of the oxygen groups available on the surface of the carbon. Fraga et al. [29] reported that carbon surface basic sites are responsible for the strong adsorption of Pt on carbon and this interaction involves the formation of metal complexes between the Pt and the surface basic sites of carbon. As can be observed in Table 1, the addition of an alkaline solution of sodium carbonate notably increases the isoelectric point at a basic pH, altering the surface chemistry of the carbon and consequently the interaction degree of Pt with the support.
Figure 1 shows the XRD patterns of the carbon and the carbon-supported Pt catalysts. The diffraction peaks appearing at 2θ = 24.7°, 43.1°, 79.8° are related to amorphous biochar pyrolysed at 500 °C ((200), (100) and (110), respectively); meanwhile, peaks at 2θ = 39.8°, 46.2°, 67.5°, 81.3°, 85.7° are assigned to metallic platinum (ICDD: Cubic, 00-004-0802) and peaks at 2θ = 26°, 27.6°, 30.1°, 33°, 33.1°, 34.2°, 34.5°, 35.2°, 38°, 39.9°, 41.1°, 41.5°, 48.2° are assigned to sodium carbonate (ICDD: Monoclinic, 00-019-1130).
In order to evaluate the graphitisation degree of the samples, we estimated the stacking height parameter (Lc) using the empirical Braggs and Scherrer equations [30,31]:
L c = k c · λ β 002 · c o s θ 002 ,
where λ is the wavelength of the incident X-ray (in this case, 1.5406 Å for copper Kα radiation); θ002 is the peak position of (002) plane; β002 is the full width at half maximum (FWHM) of the corresponding peak and kc is a constant depending on X-ray reflection plane (0.89 for the (002) plane). As shown in Table 1, the average crystallite sizes (Lc) of carbon were 16 Å for raw material, 16 Å for unpromoted, and 20 Å for promoted catalyst, respectively. According to Zhu et al. [8], the crystallite sizes (Lc) and the stacking parameter (R-value) for the carbon support are not strongly influenced by the loading of Pt or Na. Similar Lc values, characteristic of biochar with a low grade of graphitisation, were found for the bare carbon and the unpromoted catalyst, indicating no modification of the support crystallinity during the synthesis procedure. However, for the Na-promoted catalyst the crystallite size increases, suggesting that sodium oxides modify the parent biochar, inducing a greater crystallinity.
The TEM results show similar trends to those obtained by XRD. Figure 2 displays representative TEM micrographs and metal particle size distribution for both samples. It can be observed that Pt particles with a hemispherical shape were obtained on both carbon supports. For the unpromoted sample, a monomodal distribution was found, whereas for the Na-promoted catalyst a broad, almost bimodal, distribution was evident. The corresponding Pt particle size distribution, estimated after counting about 300 particles in both samples, gave a mean Pt particle size of 12.1 (±4.4 nm) and 36.6 nm (±14.6 nm) for Pt/C and Pt–Na/C, respectively. Zhu et al. [8] carried out an exhaustive study about the effect of Na loading on Pt-based catalysts and observed that the particle size distribution broadened with increased Na loading. Furthermore, the Pt dispersion was estimated from TEM micrographs, assuming a cuboctahedral particle shapes and the Pt loading measured by ICP analysis. As can be observed in Table 1, the Pt dispersion for the Na-free sample (12.4%) is higher than Na-promoted sample (3.8 wt. %). Zhu et al. [8] found that 4 wt. % of Na loaded over Pt/TiO2 is the optimal value to partially cover the Pt particles, forming 2–4 layers of NaOx on the support and maximising the intrinsic reaction rate of WGS. In our study, the promoted sample was loaded with 5 wt. % Na and the Pt are likely highly covered by Na species, which, together with the larger platinum particle size, results in the observed decrease in the metallic dispersion.
All samples present type I isotherms characteristic of microporous materials (data not shown). However, there is also a given amount of mesoporosity, as the adsorption and desorption branches are not coincident (hysteresis loop) above a relative pressure of 0.6. In fact, the mesoporous volume is always slightly larger than the microporous volume. The textural properties of the biochar and the resulting catalysts calculated from the N2 physisorption isotherms are summarised in Table 2. We observed a continuous decrease in the BET surface area for the monometallic Pt-loaded carbon, and the same trend is obtained for the promoted platinum catalyst, leading to lower values of BET surface area.
The metal deposition leads to a substantial reduction in specific surface area and pore volume, due to blockage of pores by metal deposition [32]. According to Buitrago et al. [33], it should be taken into consideration that the presence of metal and promoter decreases the textural parameters of these materials as compared with those of the raw carbon, suggesting a large particle size, bigger than the microporosity diameter and leading to higher microporosity percentages in the catalyst compared with the parent carbon. Furthermore, a slight increase in the percentage of microporosity (Table 2) was found for all the catalysts, which could be related to the effect discussed above. However, in contrast, and although the use of the reductant conditions in the pyrolysis of biochar has not been extensively reported previously, the reductant atmosphere during the pyrolysis leads to lower percentages of microporosity area, which could allow its use as a catalytic support where microporosity is not desired.
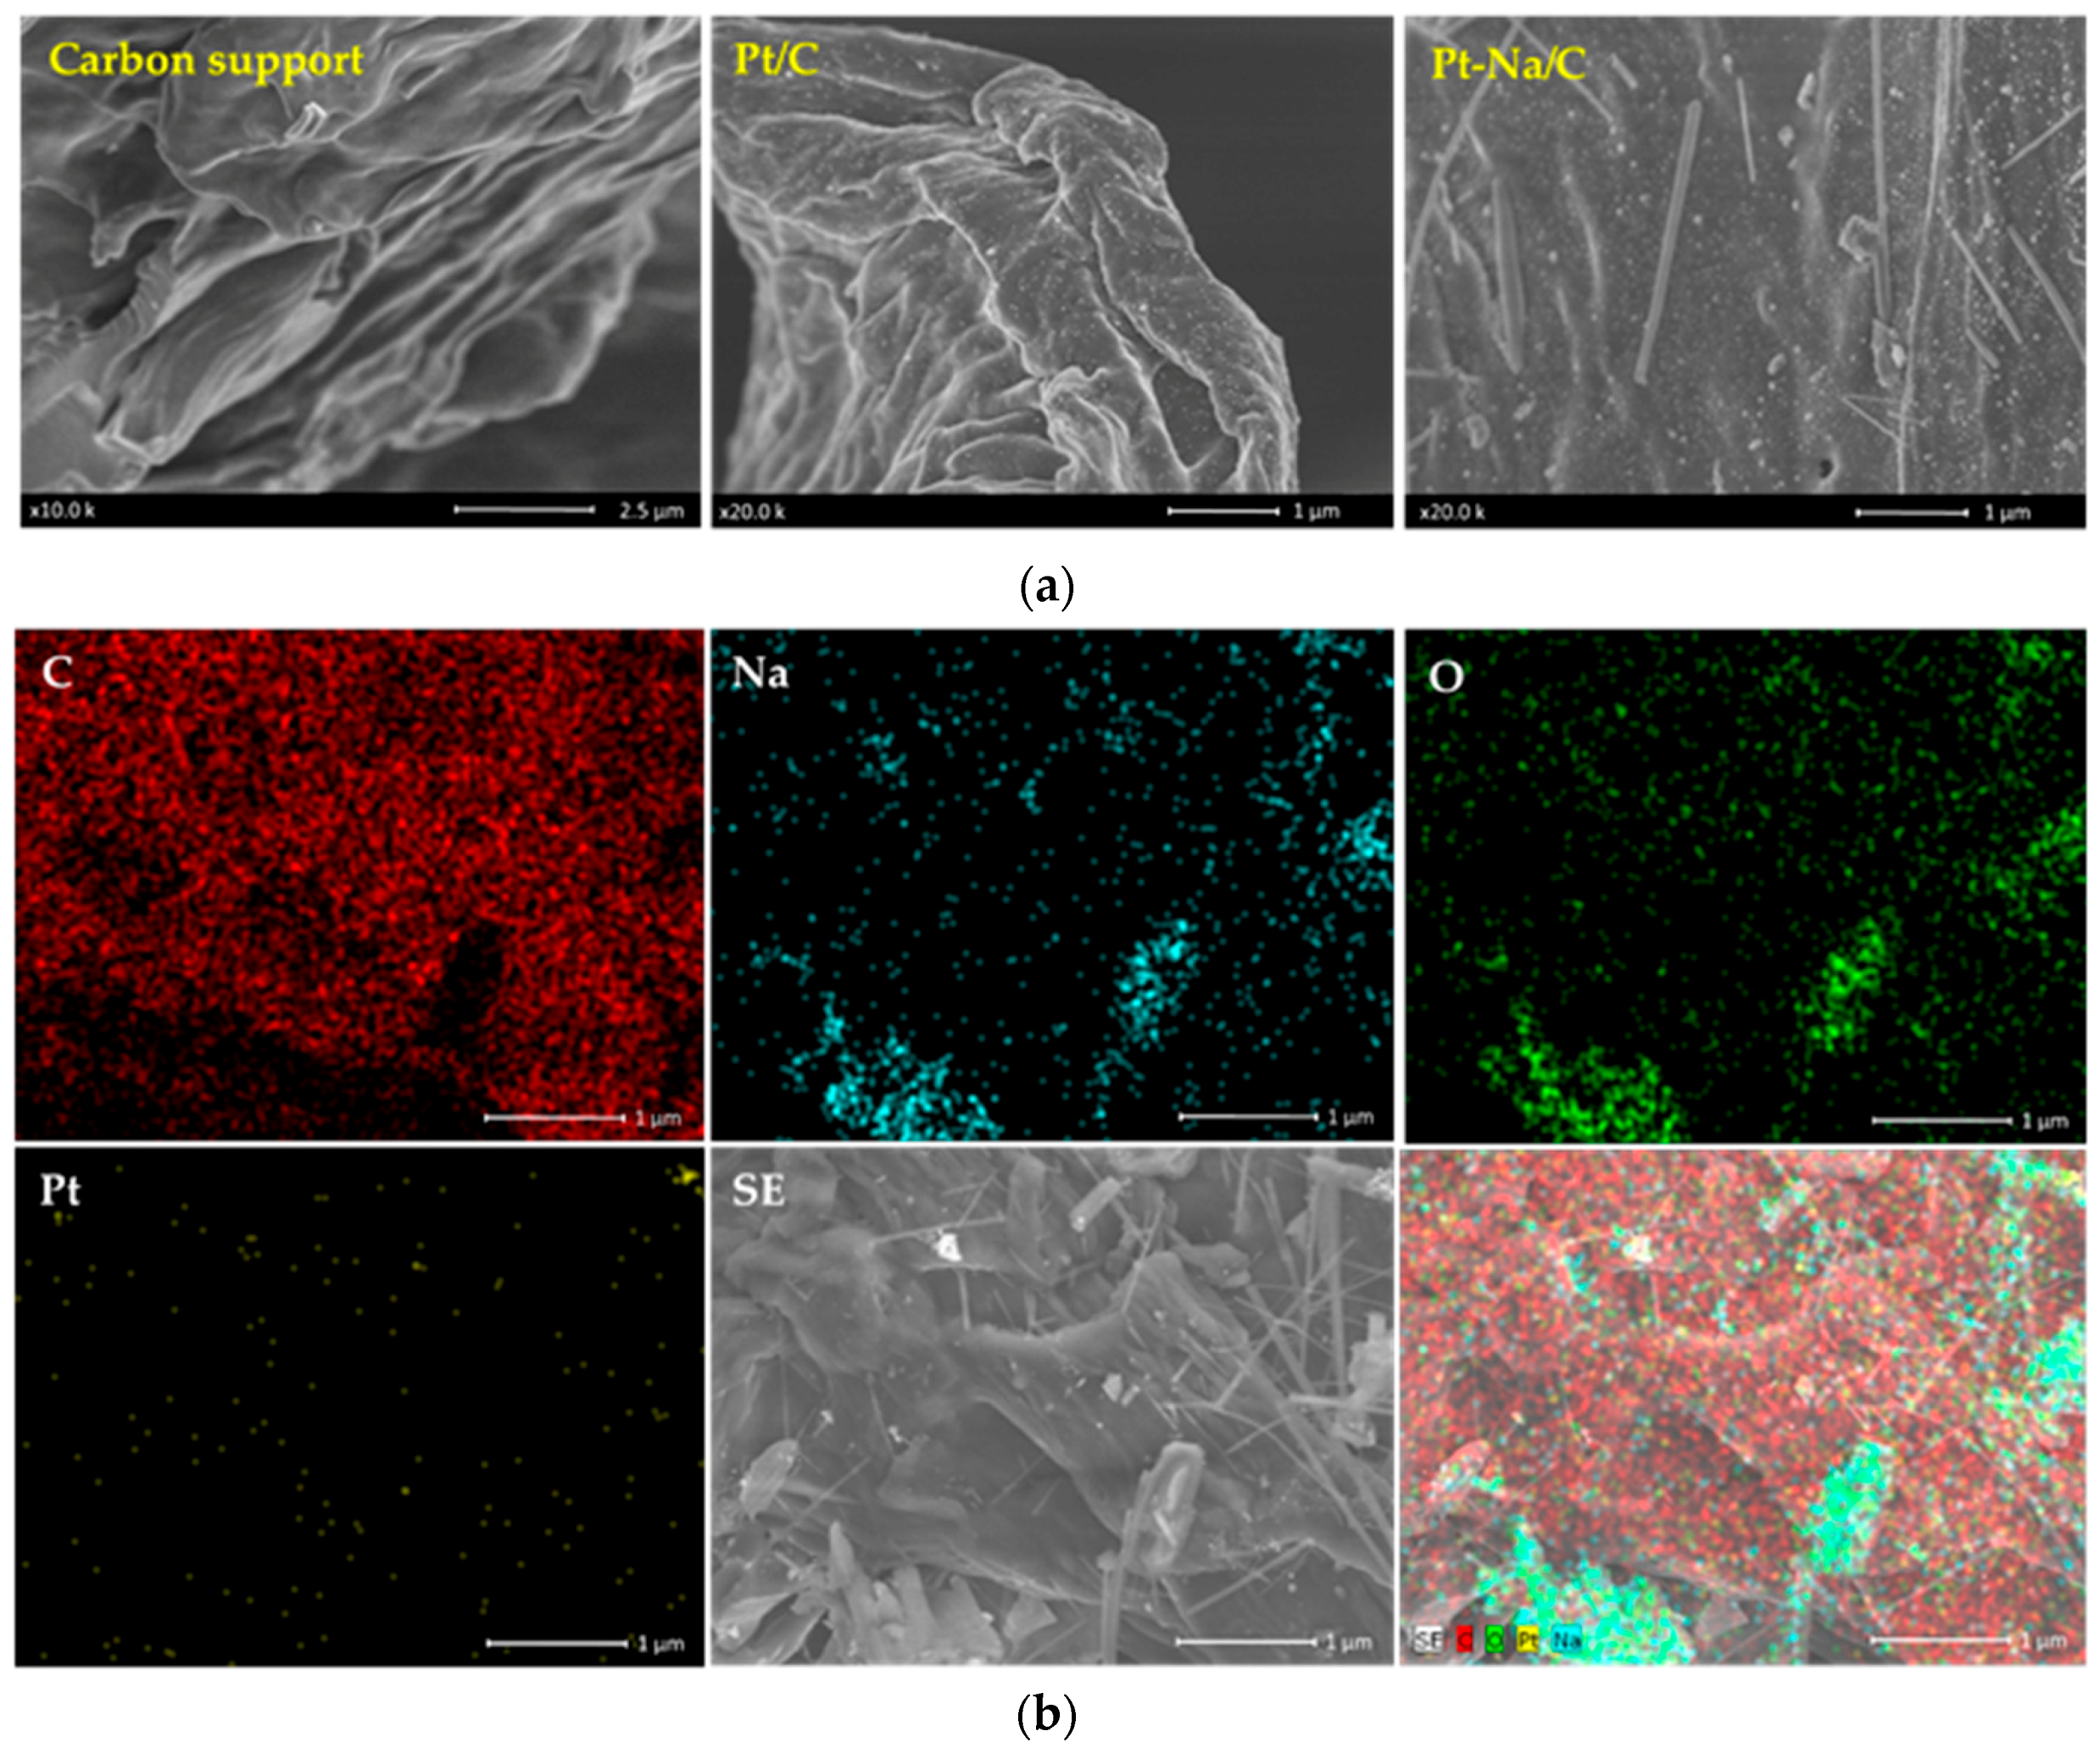
SEM results of biochar for both catalysts are shown in Figure 3a. It is observed that the Pt/C catalyst preserves the morphology of the support without apparent blocking of the mesoporosity, while the Na-promoted catalyst presents a laminar structure associated with sodium carbonate that partially blocked the porosity of the biochar support. This observation is coherent with the textural analysis results, in which a decrease in the BET surface was evidenced for the Pt–Na/C catalyst. A Scanning Electron Microscopy-Energy Dispersive X-ray Analysis (SEM-EDX) mapping analysis was performed on this sample in order to visualise the distribution of Pt and Na on the catalyst surface. As shown in Figure 3b, a heterogeneous dispersion of the platinum was observed apart from the appearance of anhydrous sodium carbonate with laminar morphology. This morphology is characteristic of the thermal decomposition of sodium sesquicarbonate into CO2 and H2O under an inert atmosphere at 350 °C [34].

3.2. Operando DRIFTS-MS Catalytic Studies

Operando DRIFTS-MS studies were performed to better understand the intermediate species formed during the WGS and rWGS reaction over both Pt and Pt–Na-supported carbon materials and investigate the promoter role of sodium.

3.2.1. Activation Pre-Treatment

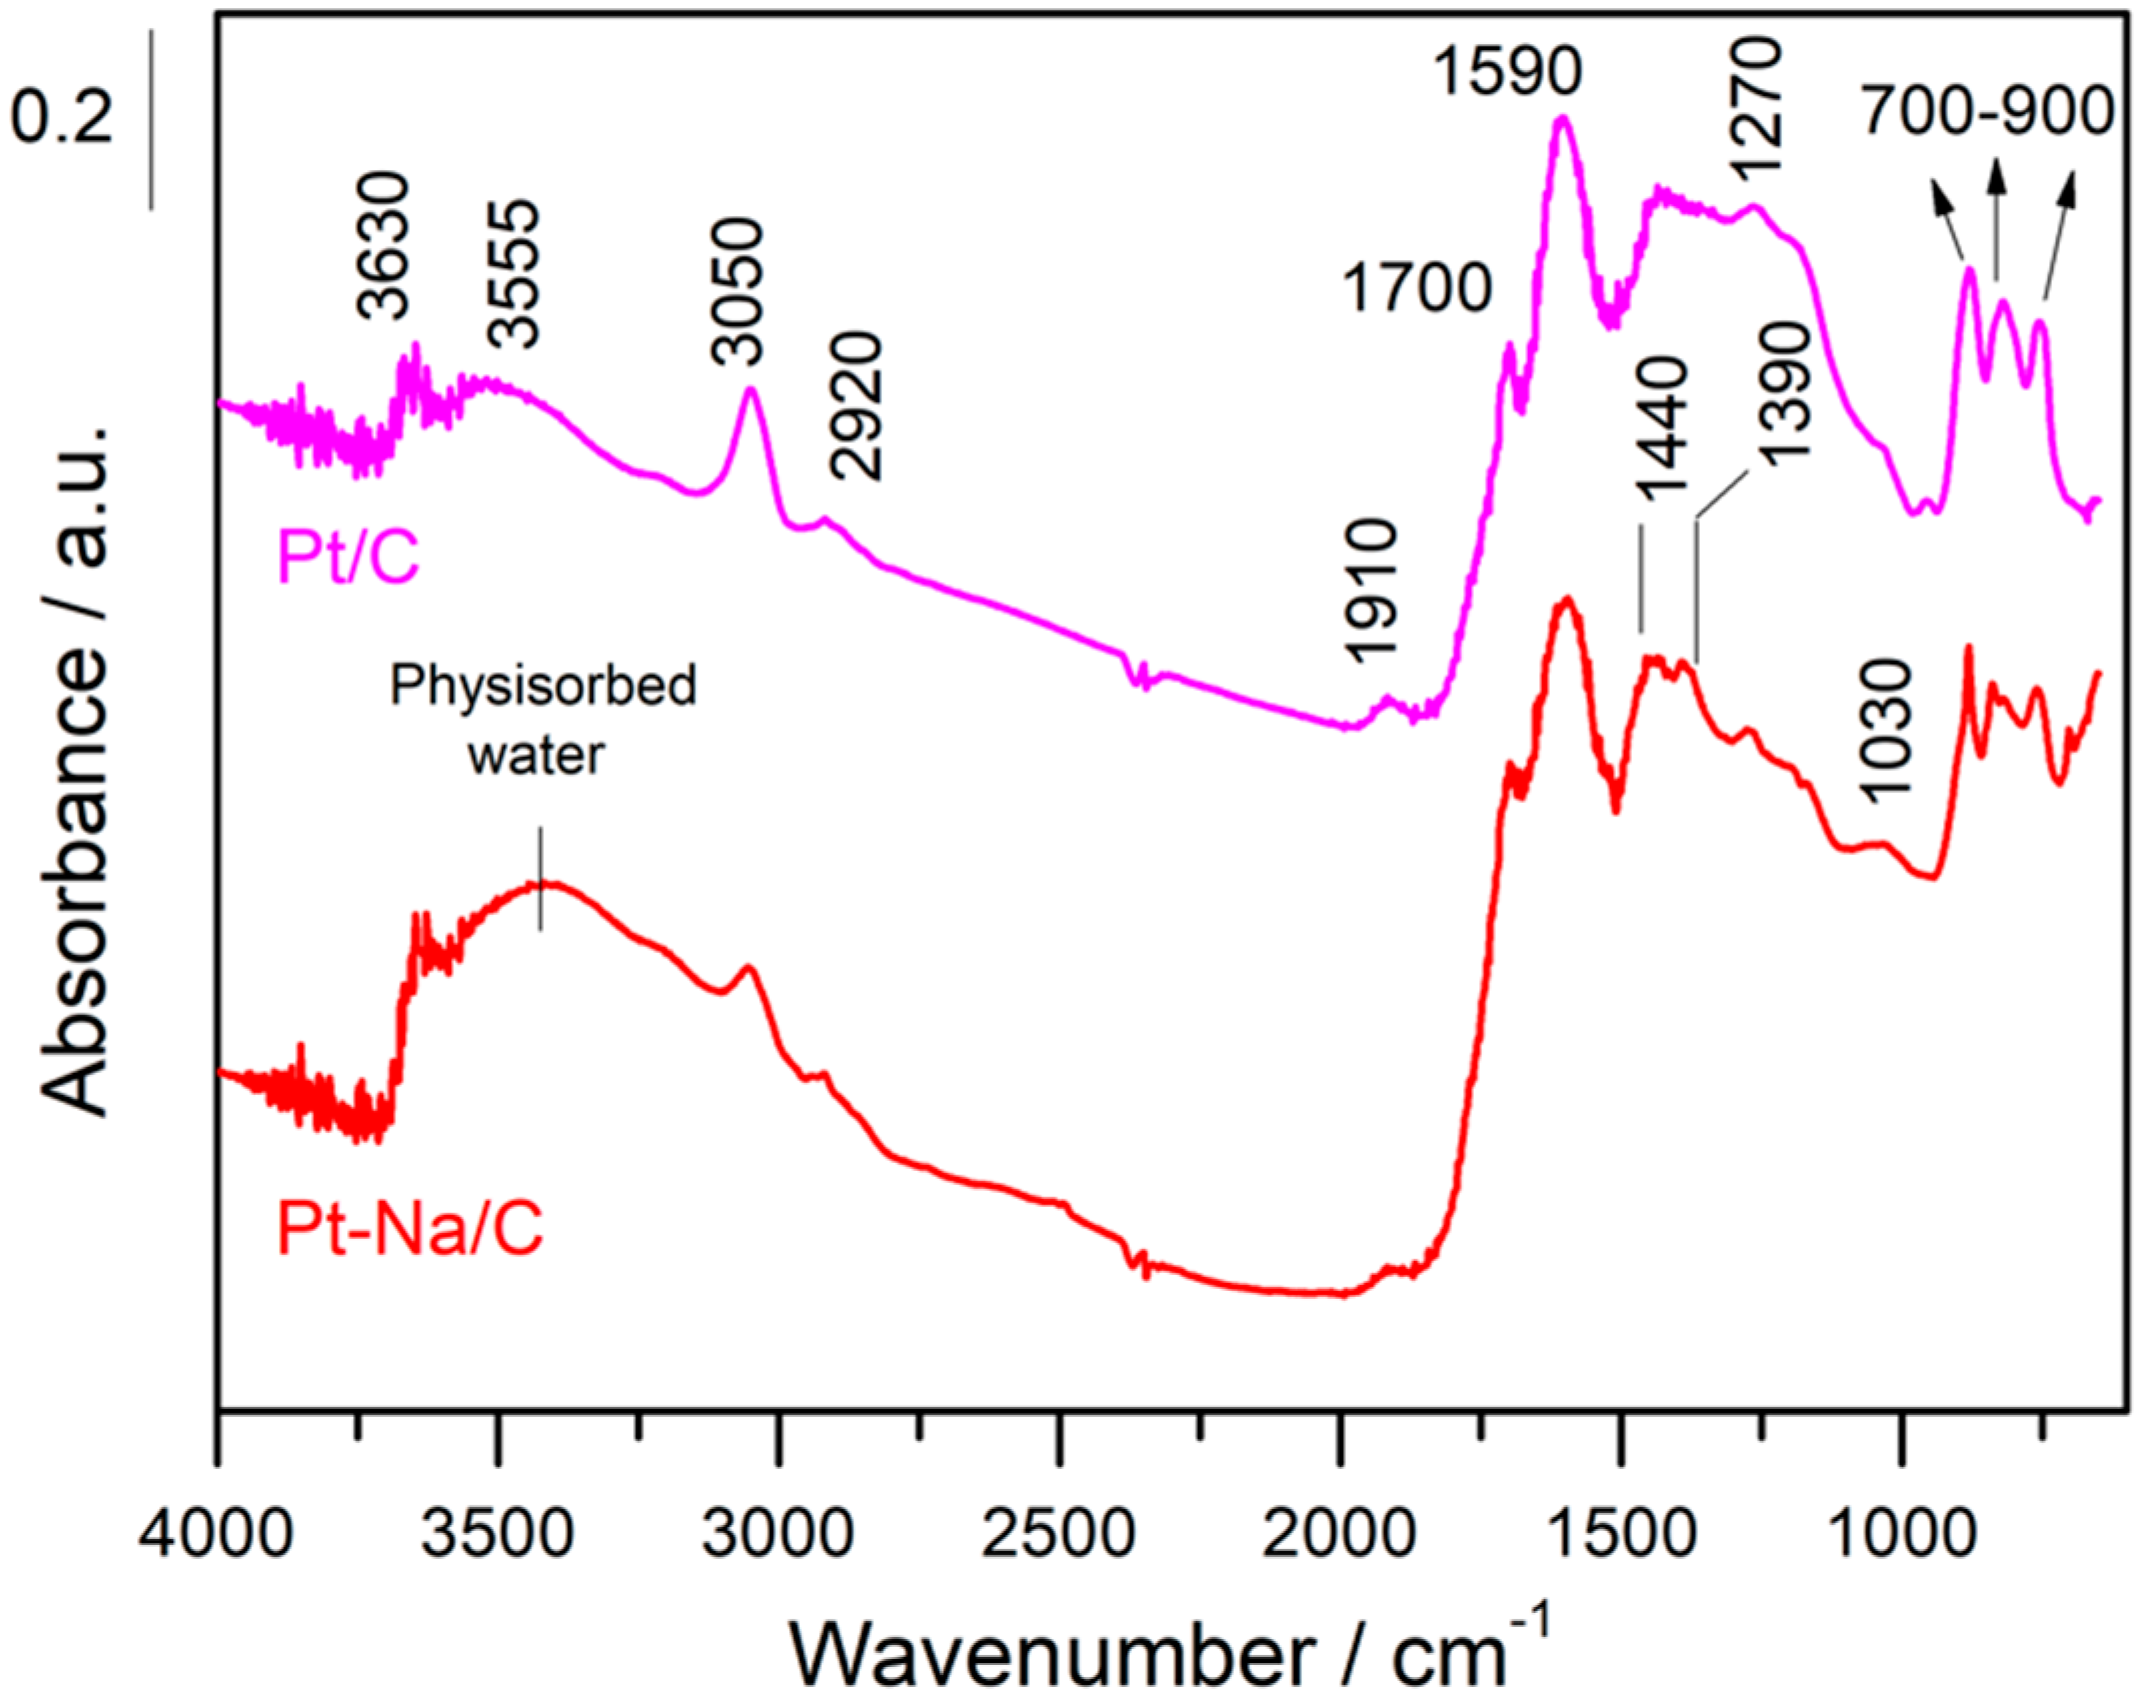
The prepared catalysts were first reduced in a 50% H2 in Ar flow at 300 °C to ensure the total reduction of Pt particles. Figure 4 includes the DRIFT spectra of the fresh samples before activation at room temperature (RT).
In both cases, the spectra are dominated by an adsorption band at 1590 cm−1 that is due to the ν (C=C) vibrations belonging to the sp2 rings and a wide set of bands in the 1000–1500 cm–1 region that mainly includes bands associated with C–O stretching in ethers, lactones, phenols and carboxylic anhydrides [19]. Additionally, the spectral features that appear in the 700–900 cm−1 region can be attributed to the ν(C–H) vibrations out of the plane of aromatic compounds and the band at 3050 cm−1 is due to the stretching vibration of the ring CH bonds, while the C–H stretching bands of aliphatic species occur at 2920 cm−1 [35]. On the other hand, the bands observed in the 1950–1600 cm−1 range can be attributed to the C=O stretching vibration of carbonyl groups in aldehydes, ketones, carboxylic acids, esters, and acid anhydrides [25]. The bands observed in the 3500–3700 cm−1 range indicate the presence of hydroxyl groups that are interacting with the physisorbed water by hydrogen bonds, although the assignment in this region is of a complex nature since it includes contributions from various groups. It should be noted that the intensity of these bands is remarkably inferior in the Na-free sample. This indicates that the presence of Na increases the hydrophilic character of the carbon, altering their surface properties as mentioned above. Moreover, the sodium carbonate is highly hygroscopic and for this reason the amount of physisorbed water is increased in the Na-promoted sample.
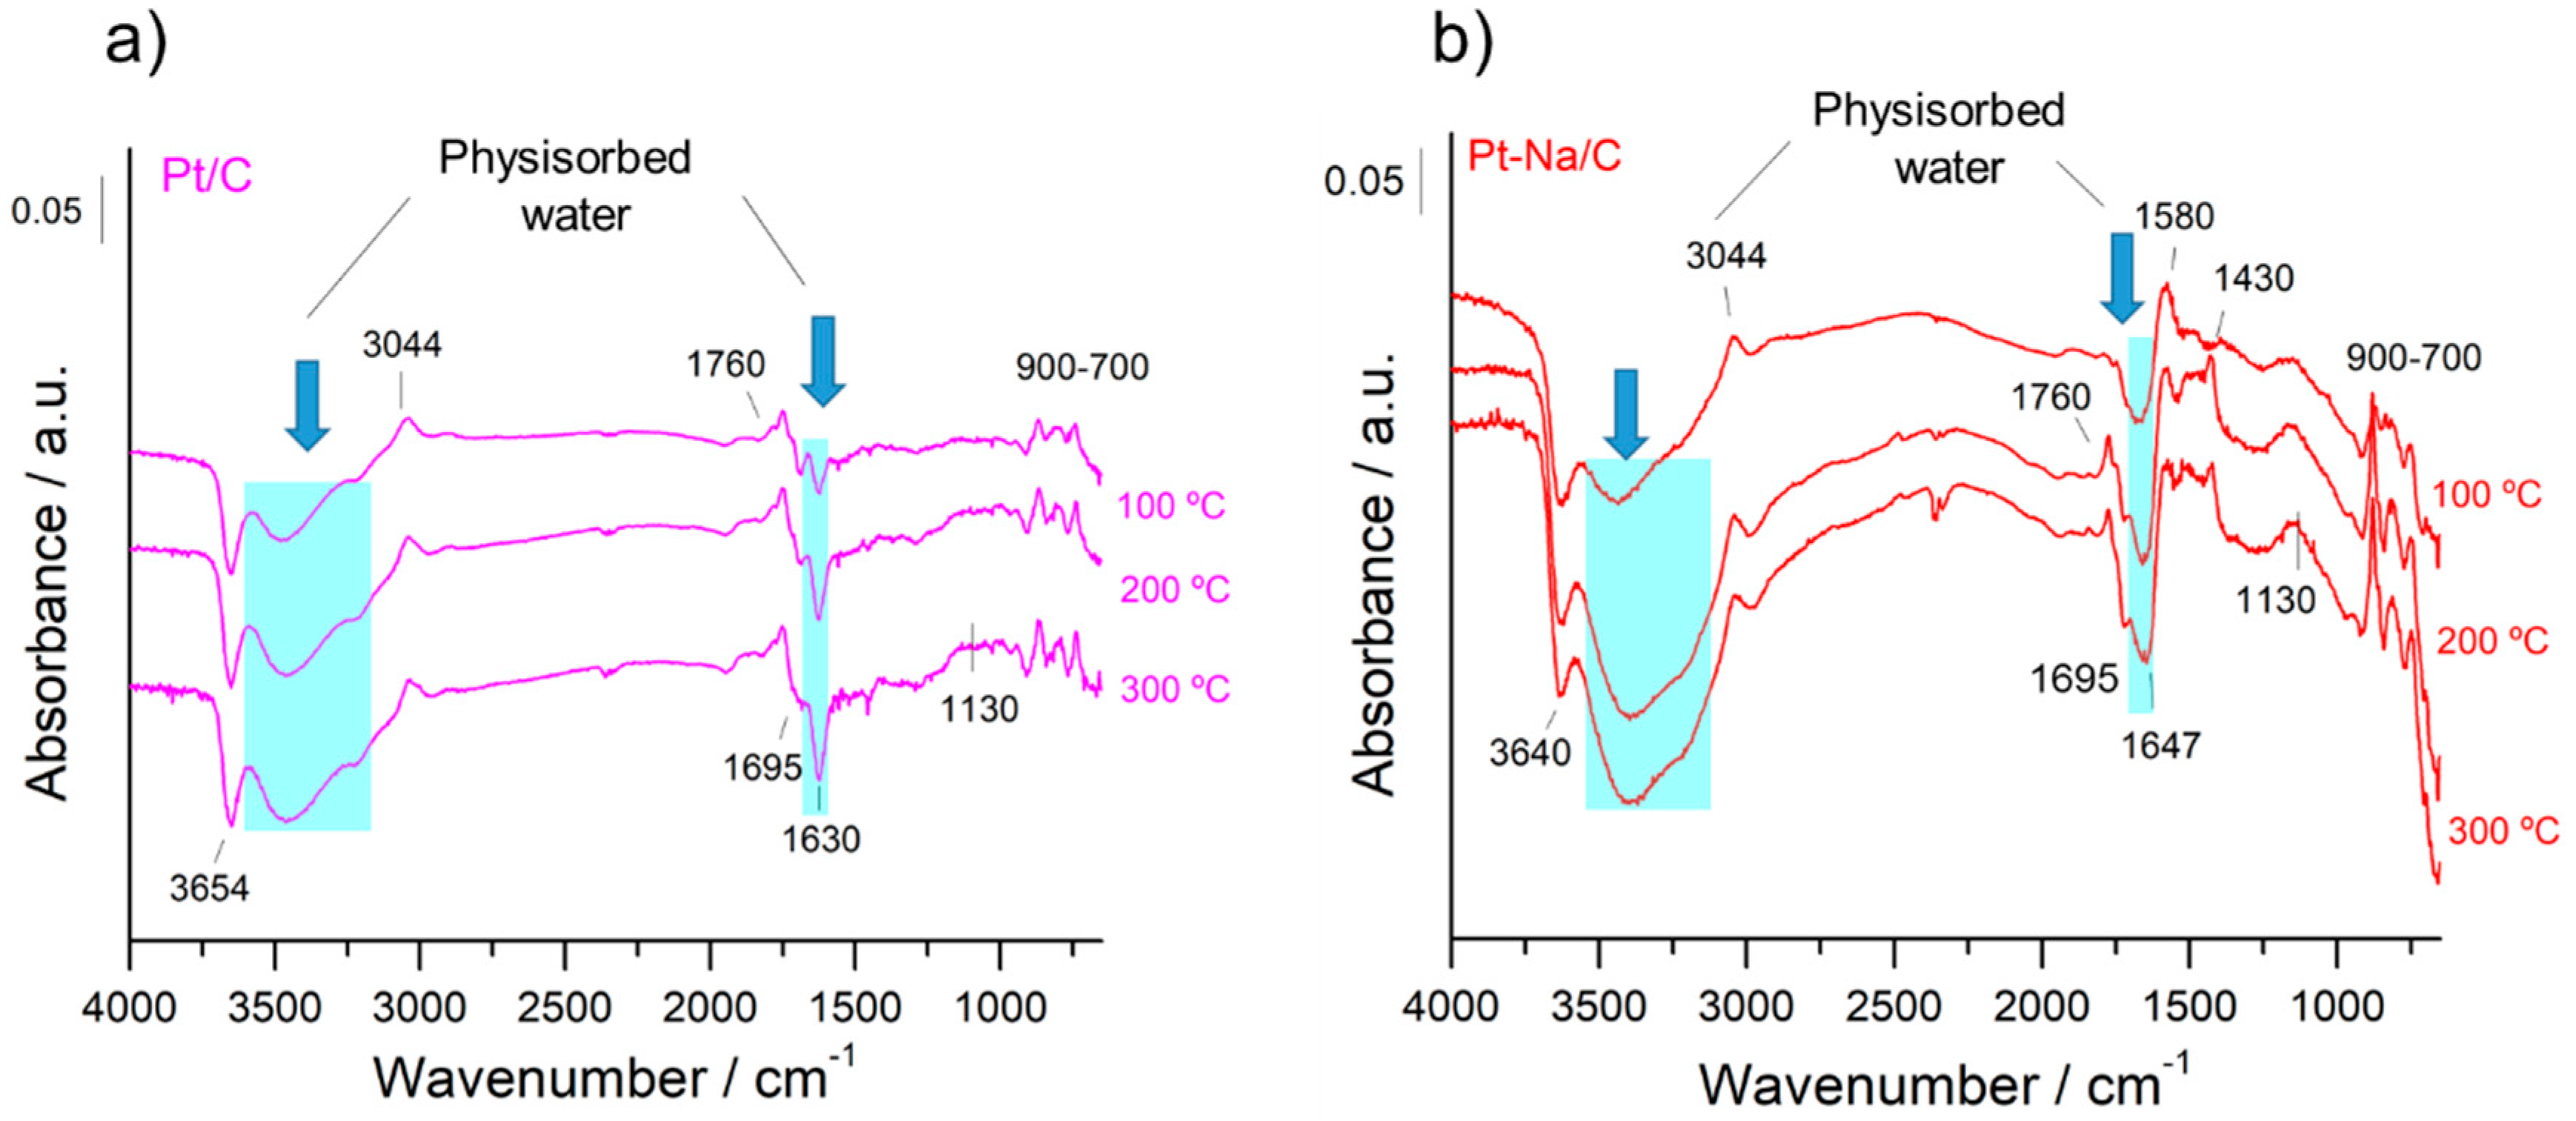
Figure 5 presents the evolution of the DRIFT spectra during the activation treatment for both catalysts. As can be observed, the carbon surface was not completely inert during the reduction pre-treatment and some changes were produced in the IR bands of the oxygen functional groups initially present on the surface. However, the interpretation of the DRIFT spectra and the assignment of the bands are highly complicated. In general, the disappearance of physisorbed water in both samples with increasing temperature is remarkable. On the other hand, the new spectral bands that develop at 1780 and 1130 cm−1 are indicative of the production of new oxygenated groups such as lactones, while the band at 1695 cm−1 that disappears can be assigned to the C=O stretching mode of carboxyl groups [19]. The bands associated with hydroxyl species that disappear at 3250 cm−1 can also be associated with the hydroxyl of the carboxylic acid groups, while the bands at ca. 3650 cm−1 are attributable to hydroxyl species [36]. Figuereido et al. [19] reported H2 consumption associated with the decomposition of carboxylic groups over Pt supported on active carbon catalysts towards TPR measurements. The oscillatory nature of the bands related to C–H out-of-plane vibrations and the bands appearing at 1580 cm−1 due to C=C double bonds located near the newly formed oxygenated groups suggest that a graphitisation process of the carbon surface is taking place at the expense of H-containing terminations and of the oxygen-containing functional groups, in agreement with the literature [35]. Moreover, a band at 3044 cm−1 associated with CH stretching vibration is also formed, revealing the formation of new aromatic species. It should be noted that this graphitisation process is more pronounced on the Na-promoted sample. This is coherent with literature data that report carbon gasification catalysed by alkali metal oxides [37]. These results demonstrate that during the hydrogenation pre-treatment a fraction of the surface-oxygenated species are decomposed or reduced, altering the carbon surface. A similar observation was reported by Zugic et al. [14] on analysing a study of Temperature programmed desorption (He–TPD) on carbon-supported platinum catalysts.

3.2.2. Forward and Reverse WGS Reaction: Promotional Effect of Na

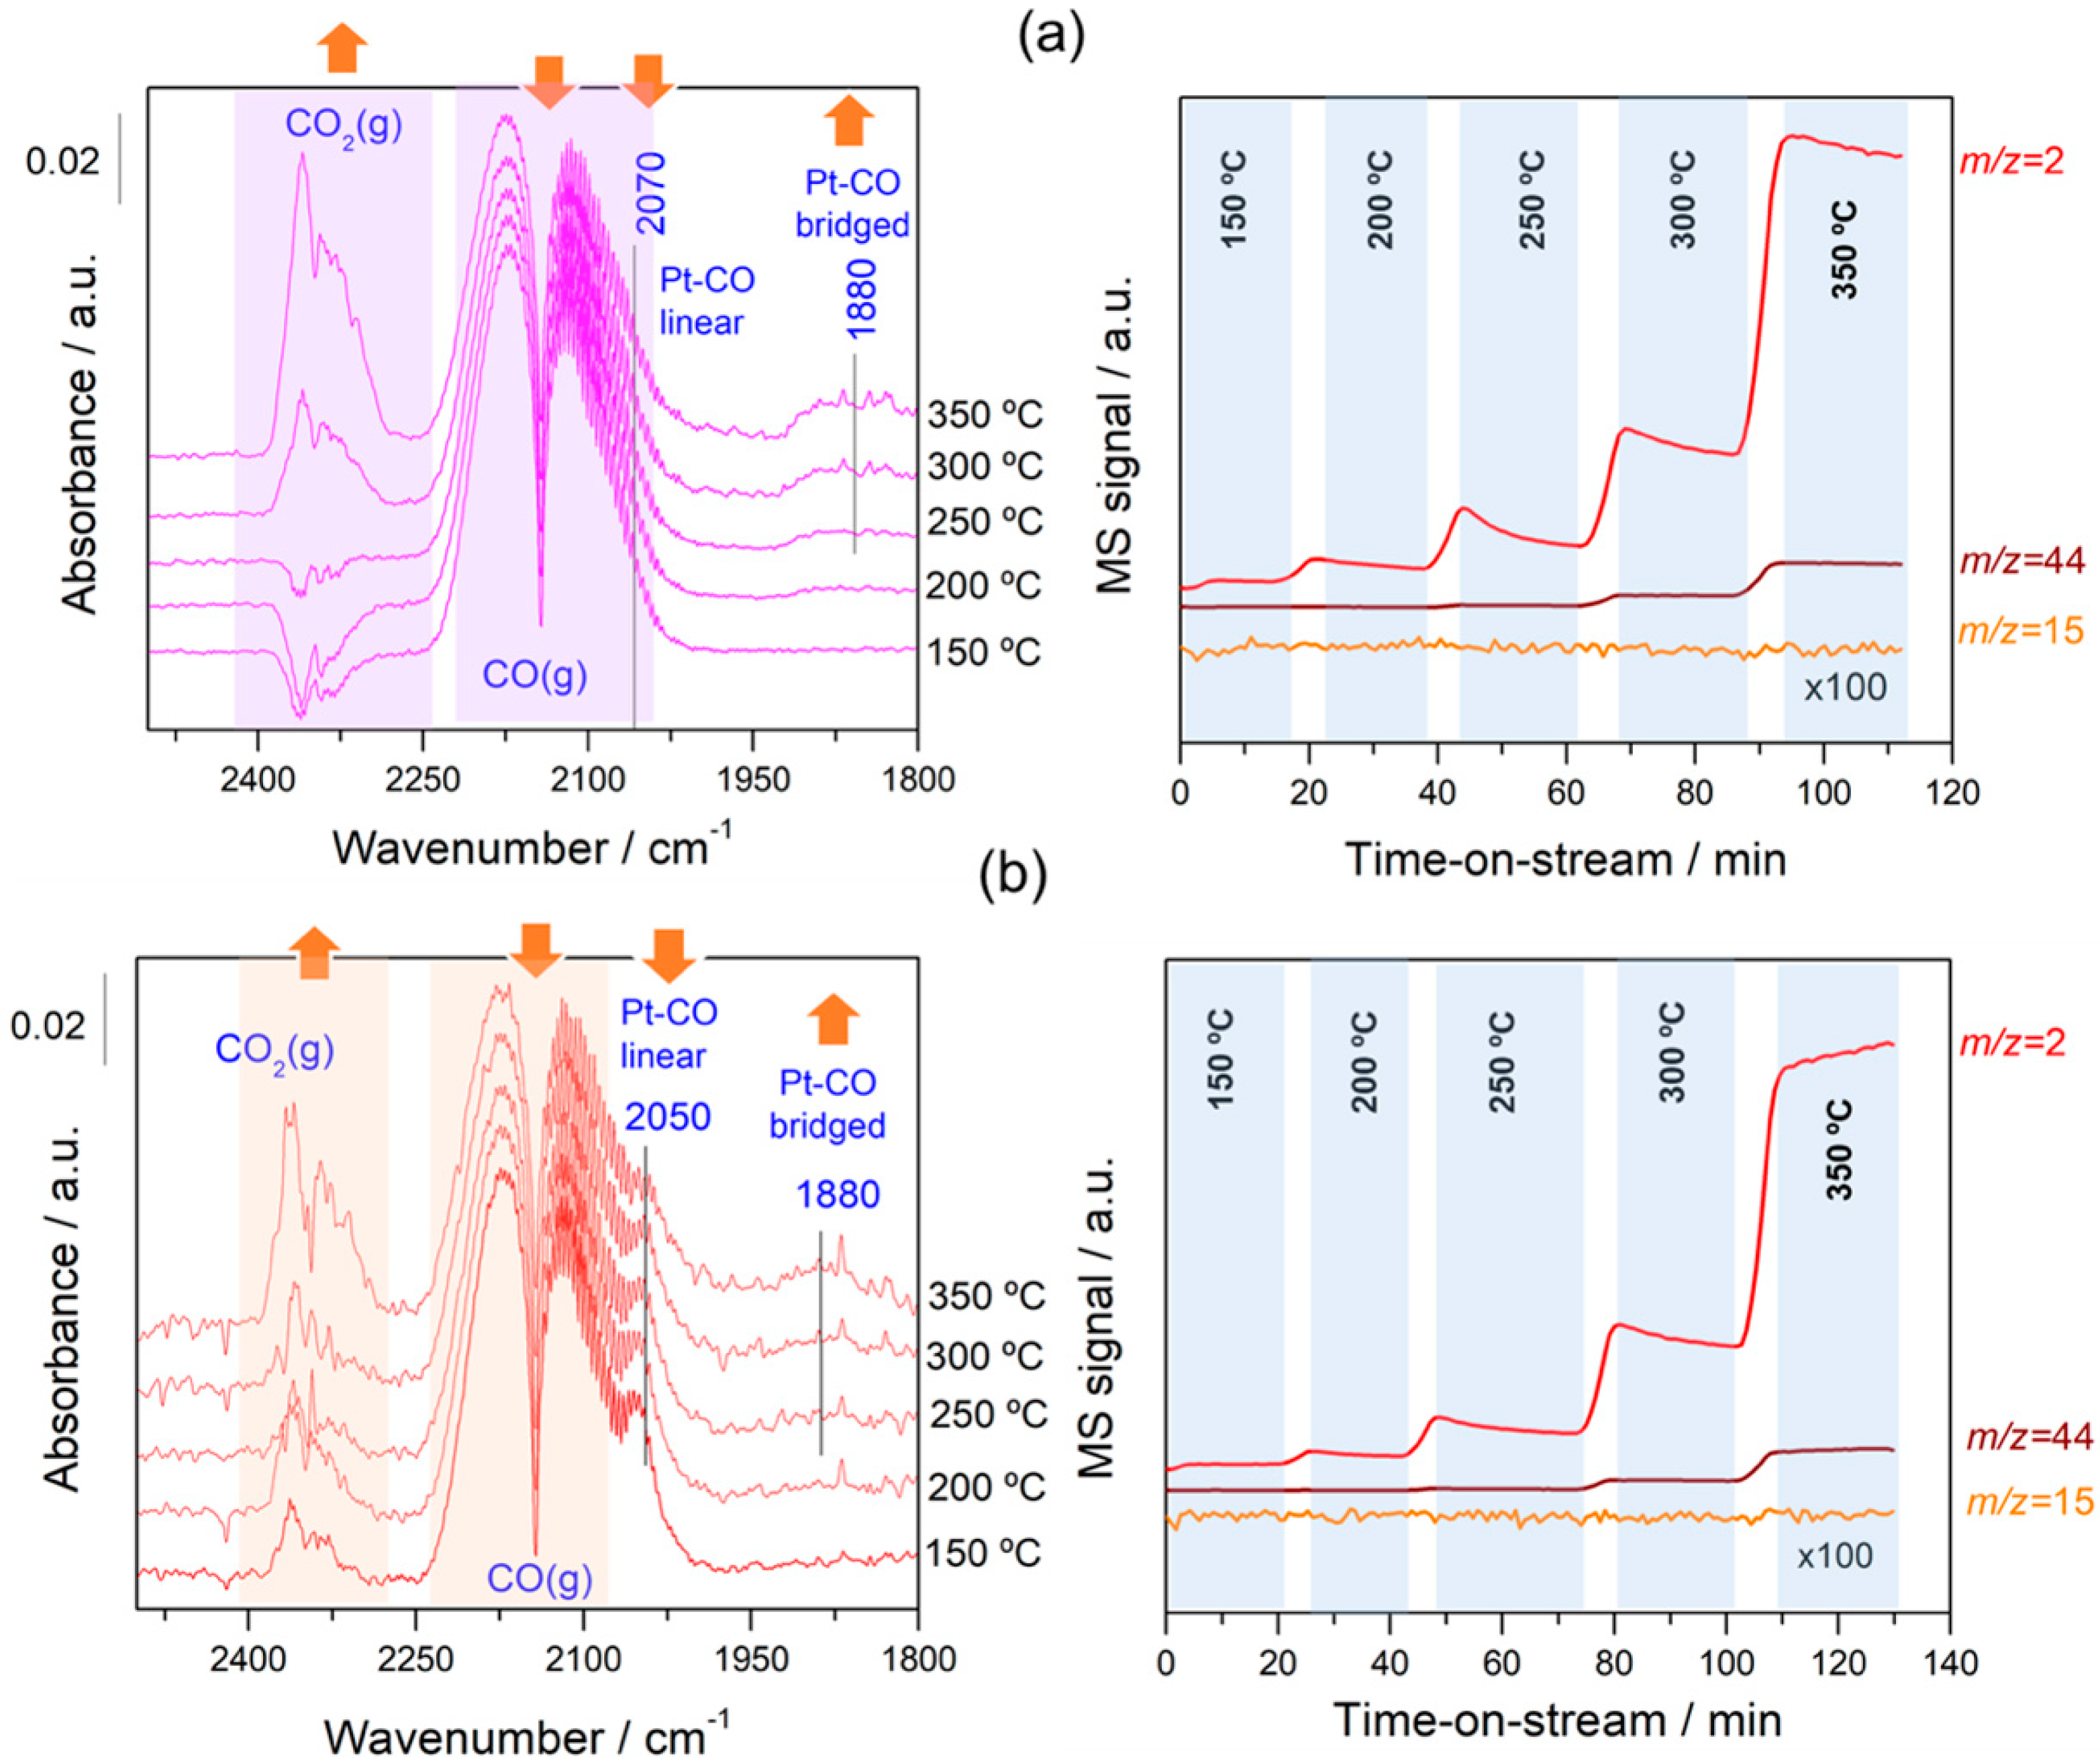
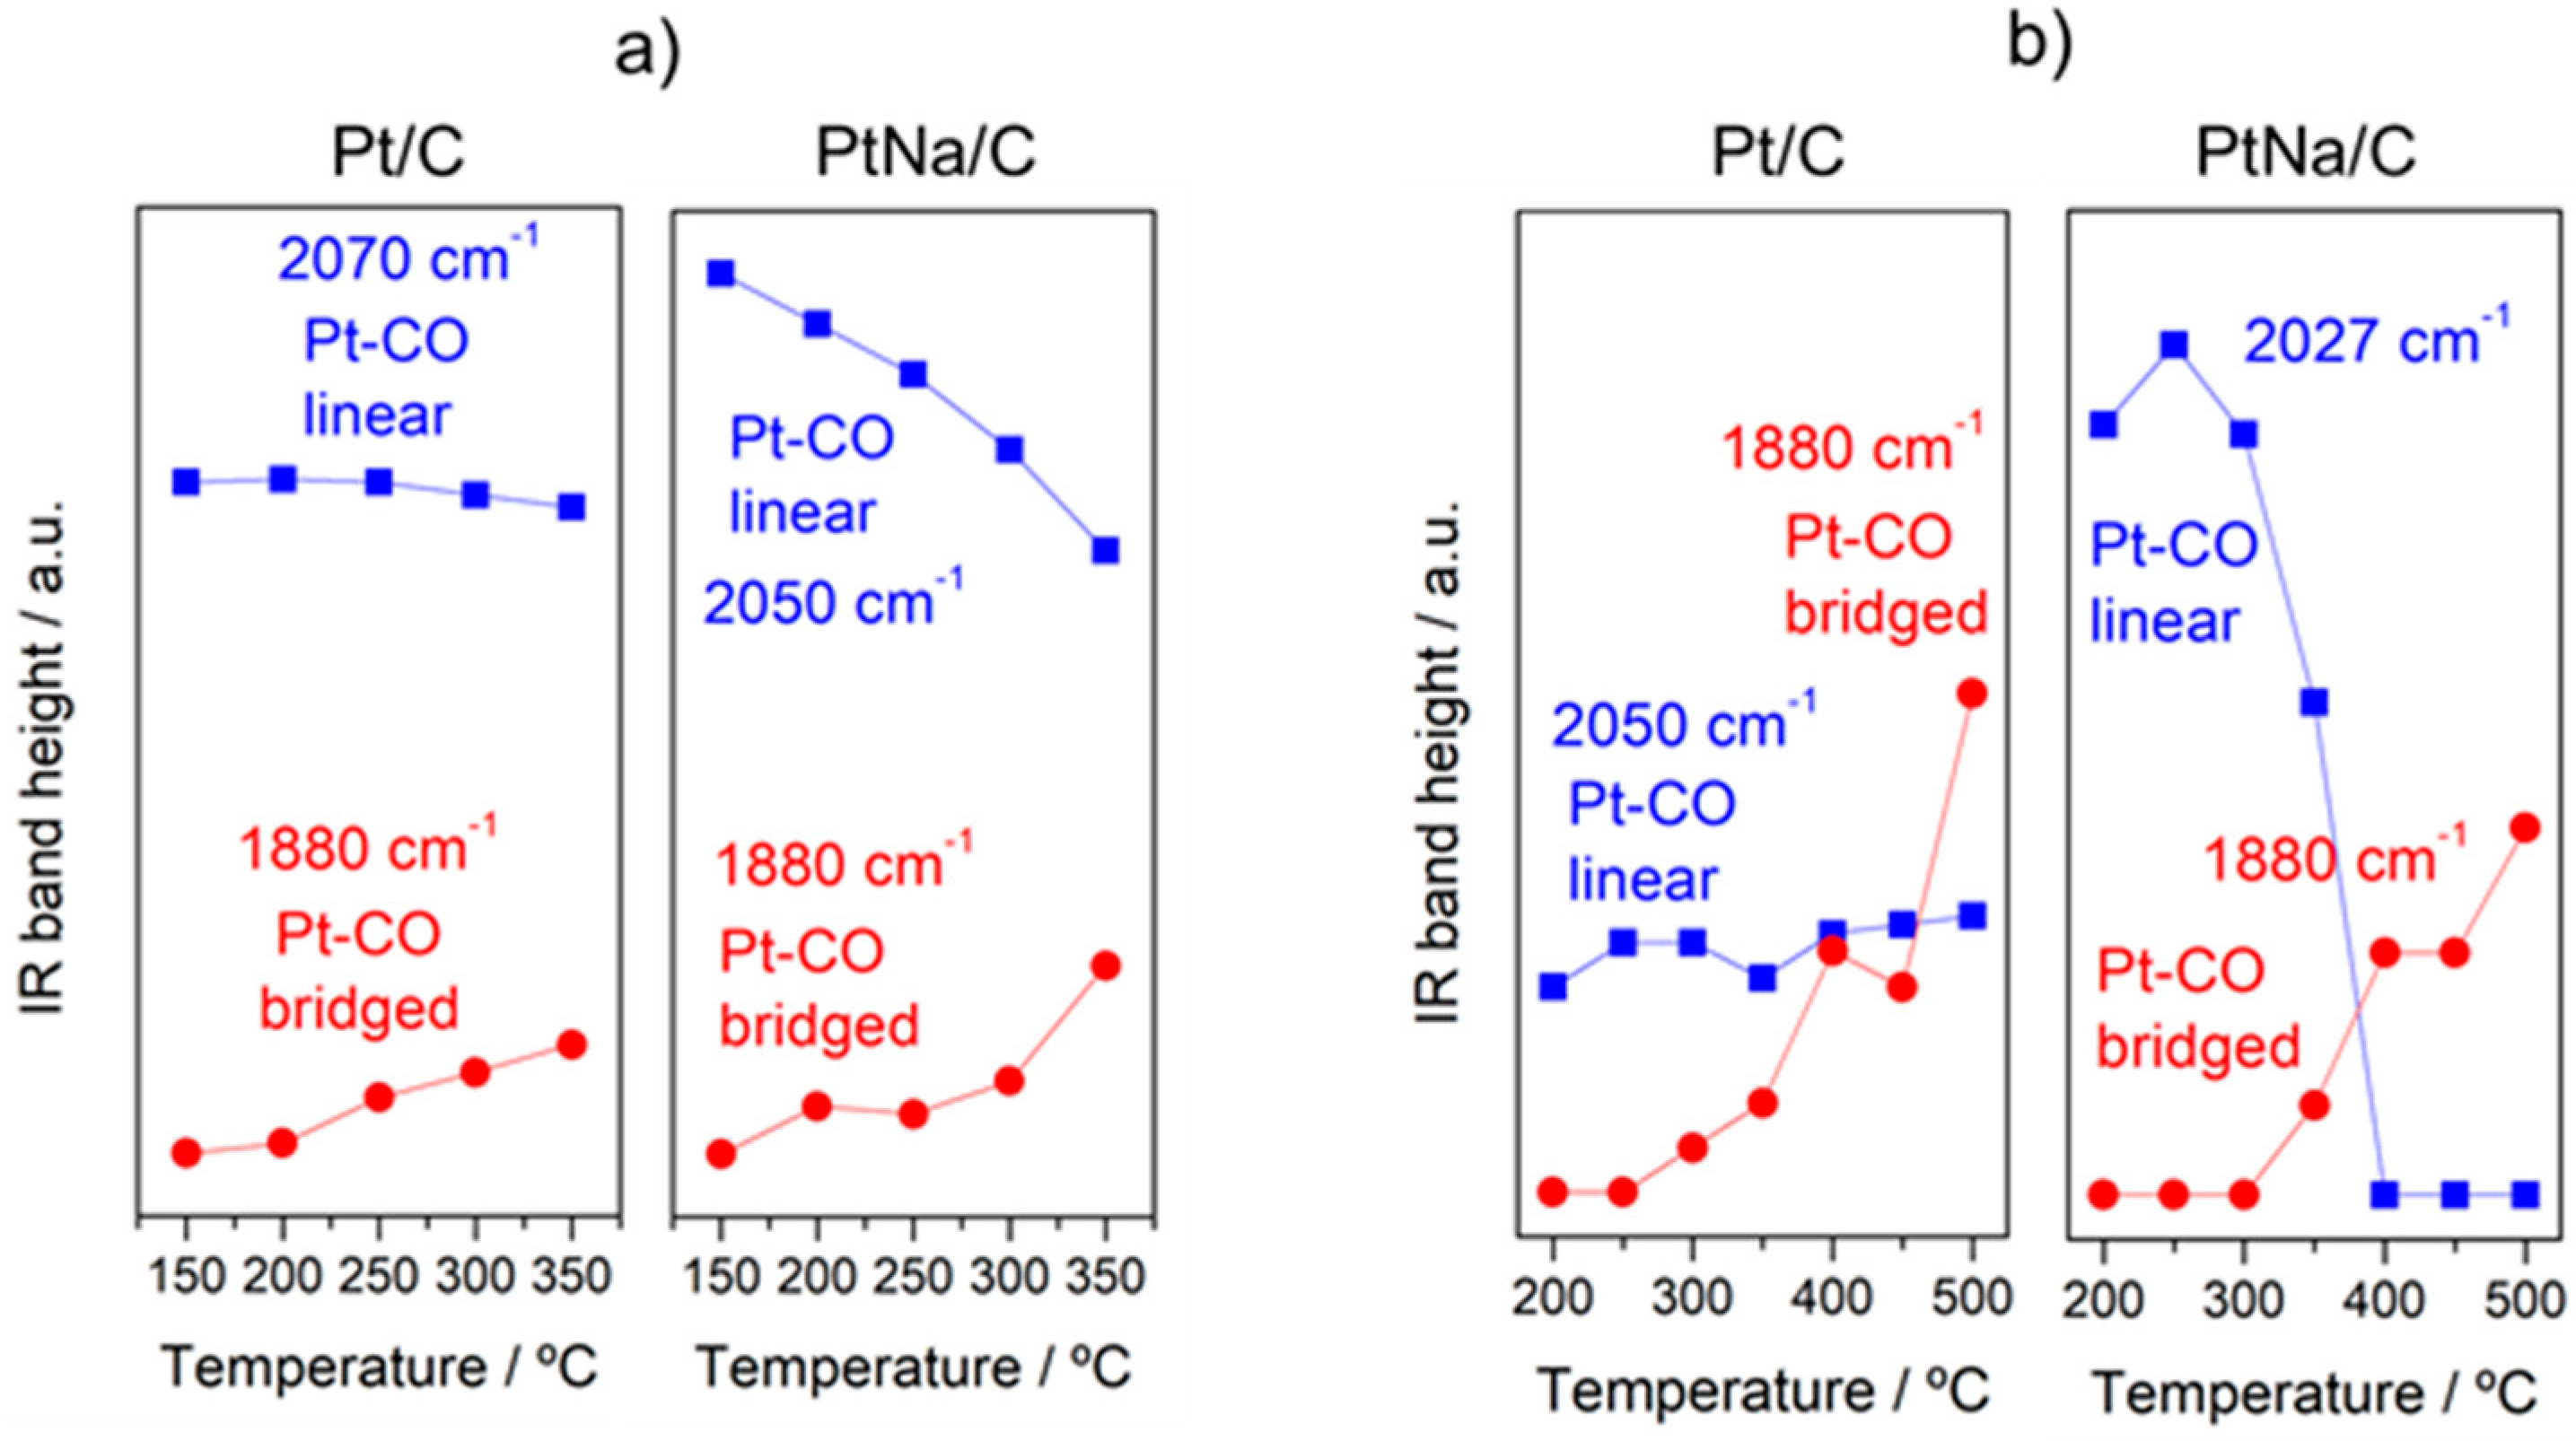
In order to follow the steps occurring on the surface during forward and reverse WGS reactions, the catalysts were analysed by operando DRIFTS-MS measurements. Figure 6 and Figure 7 show the effect of the reaction temperature on the adsorbed/desorbed species followed by DRIFTS-coupled MS over the Pt/C and Pt–Na/C catalysts during the WGS and rWGS reactions, respectively. IR bans in the 2250–2100 cm−1 were assigned to gas-phase CO, while IR bands in the 2250 to 2400 cm−1 region correspond to gas-phase CO2 [38]. We focused our attention on the 2100–1800 region associated with the carbonyl species adsorbed on metal sites. As shown in Figure 6 and Figure 7, linear and bridged or multiply-bonded CO species adsorbed on Pt sites were observed in the regions of 2000 to 2070 cm−1 and 1800 to 1900 cm−1, respectively [15]. It is worth noting that on increasing the reaction temperature CO bridged species form. The appearance of these adsorption sites indicates that the average size of Pt particles could be increased during the reaction. This feature was observed both in WGS and rWGS reactions and it suggests that a reorganisation of the Pt particles could take place during the reaction. Cybulski et al. [15] found a direct correlation between the WGS rate and an increase in the intensity of multiply-bonded CO bands during the reaction. They proposed that multiple-bonded CO species are the more active species in the WGS reaction, showing that the concentration of these species increases in the presence of sodium. In this sense, we plotted the evolution of the IR peak height associated with Pt–CO linear and Pt–CO-bridged species, respectively, against the reaction temperature during the WGS and rWGS reaction for both catalysts (Figure 8). As can be observed, the relative number of Pt–CO bridged species increases with the reaction temperature in all cases. Furthermore, as shown in Figure 8, the intensity of Pt–CO linear species remains almost unaltered in the free-sodium sample, whereas the presence of sodium notably decreases the intensity of these species with the temperature. This may indicate that the addition of sodium decreases the concentration of Pt–CO linear species, forming more reactive Pt–CO-bridged species, or, alternatively, that these Pt–CO linear species are involved directly in the reaction mechanism, with their intensity reduction being a consequence of a faster reaction rate. The effect of the Pt particle size must also be considered. Several trends are found in the literature. As recently reported by Vogt et al. [39] for CO2 methanation on Ni catalysts, the metal particle size determines the stability of the adsorbed CO species upon activation, and therefore a differential coverage of stable-bridged CO species vs. weakly adsorbed CO linear species on the Ni surface. According to this, the reactivity is associated with the easy desorption of weakly adsorbed CO species and, therefore, it is structure-sensitive as these authors show decreasing CO adsorption strength with decreasing particle size. On the other hand, Laletina et al. [40] have estimated from DFT calculations that CO adsorption strength on the top sites of Pt (111) surfaces increases with decreasing particle size, varying from −196.8 to −167.9 kJ mol−1 on going from 38 to 201 atoms of cuboctahedron Pt particles.
Additionally, a band located at 1938 cm−1 was observed during the rWGS reaction on the Na-free catalyst. Generally, CO adsorption on Pt metal rarely leads to bands at this frequency. Bazin et al. [39] studied the nature of the adsorption sites associated with this band and proposed that it is caused by CO adsorption on very low coordinated Pt atoms or, in an isolated way, interacting strongly with the support. In our study this band was only observed in the Pt/C catalyst during the rWGS reaction (Figure 7), suggesting that the presence of Na notably affects the interaction between Pt particles and the carbon support, as mentioned above.
It should be noted that the addition of Na provokes a redshift to lower frequencies of ca. 20 cm−1 in the linear Pt–CO species during the WGS and rWGS reactions, clearly indicating an increase in Pt 5d backdonation into 2π* orbitals of the CO molecule upon adsorption. Apparently, this effect was not observed in the formation of bridged CO species, although the bands associated with these species are very broad and the redshift in the Na-promoted sample should not be ruled out. It may also be noted that the broad particle size distribution in the Na-promoted catalyst may affect the width of the linear CO band that overlaps the gas phase CO signals, introducing some uncertainties about the effect of the particle size; a possibility that cannot be discarded is to associate the band at 2050 cm−1 to CO adsorbed on the larger Pt particles, while the bands associated with the smaller ones were obscured by the gas phase CO signal. Ding et al. [17] studied the promotional effect of alkali cations on single Pt sites over the WGS performance and observed by IR spectroscopy that the linear and bridge CO features corresponding to Pt on Pt–Na/SiO2 are redshifted by 30 and 90 cm−1, respectively, compared with those of the Na-free sample. It is well known that alterations in the Pt local surface electronic structure should affect the extent of backdonation in the bonding of CO to platinum. For instance, Garfunkel et al. [41] found that the presence of potassium enhances electron backdonation from the Pt into the 2π* antibonding orbital of CO, causing notable changes in the adsorption energy, vibrational frequency, and site selectivity of CO adsorption. Tong et al. [42], using 13C NMR and FTIR, demonstrated a redshift of the stretching frequency of adsorbed CO linear species on decreasing particle size (2051 to 2037 cm−1 going from 8.8 to 2.0 nm average particle size). This shift is the result of the strong interaction of the Pt particle with a conductive carbon support, as demonstrated using 13C NMR [43]. The presence of Na induces an increase in the average Pt particle size, therefore reducing the Pt–carbon interaction, which should result in a blueshift of the CO stretching frequency upon Na addition to the Pt/C catalyst. However, we do observe a redshift and hence we can deduce that backdonation from Pt 5d orbitals to CO antibonding orbitals enhanced by sodium atoms overrules the expected reduction in backdonation by the higher Pt particle size upon Na addition. This balance results in a decrease in the CO stretching frequency, as observed in Figure 6 and Figure 7. On the other hand, the vibrational frequency also depends on the CO coverage and typically a shift to higher frequencies is observed at high CO coverages caused by the dipole–dipole coupling between CO-adsorbed molecules on neighbouring sites. Under kinetic reaction conditions, the rWGS reaction (Figure 7) implies a low CO coverage, whereas the WGS reaction (Figure 6) leads to high CO coverage. This explains the differences observed in the wavenumber associated with linear CO adsorbed on Pt species during the forward and reverse water gas shift reactions.
Regarding the evolution of the gas-phase analysed on-line by MS, substantial formation of hydrogen and CO2 was observed during the WGS reaction (Figure 6), while during the rWGS reaction H2O and CO were observed at temperatures above 300 °C during the rWGS reaction on both catalysts (Figure 7). In addition, a small amount of methane was observed in both catalysts during the rWGS reaction, particularly notable in the case of the Na-promoted catalyst. On the contrary, the formation of methane was almost negligible during the WGS reaction. Although it is well known that Ni and Ru metals are the most active for the CO2 methanation reaction, Pt catalysts can also perform a methanation reaction in conjunction with the rWGS reaction at low temperatures [44]. Moreover, the addition of alkaline salts promoted the catalytic activity of CO2 methanation, probably due to a synergetic effect including the modification of local electron density on metal by the electron donation of alkali metals [45,46]. Another possible explanation for the formation of methane could be the consecutive methanation of CO formed during the rWGS reaction. Kapteijn and Moluijn [47] reported that all alkali metals on activated carbon catalyse the methanation of CO at ca. 250 °C. We believe that this consecutive secondary reaction is more probable in our system since Pt is more active for the rWGS reaction than for the CO2 methanation because the presence of sodium favours methane formation.
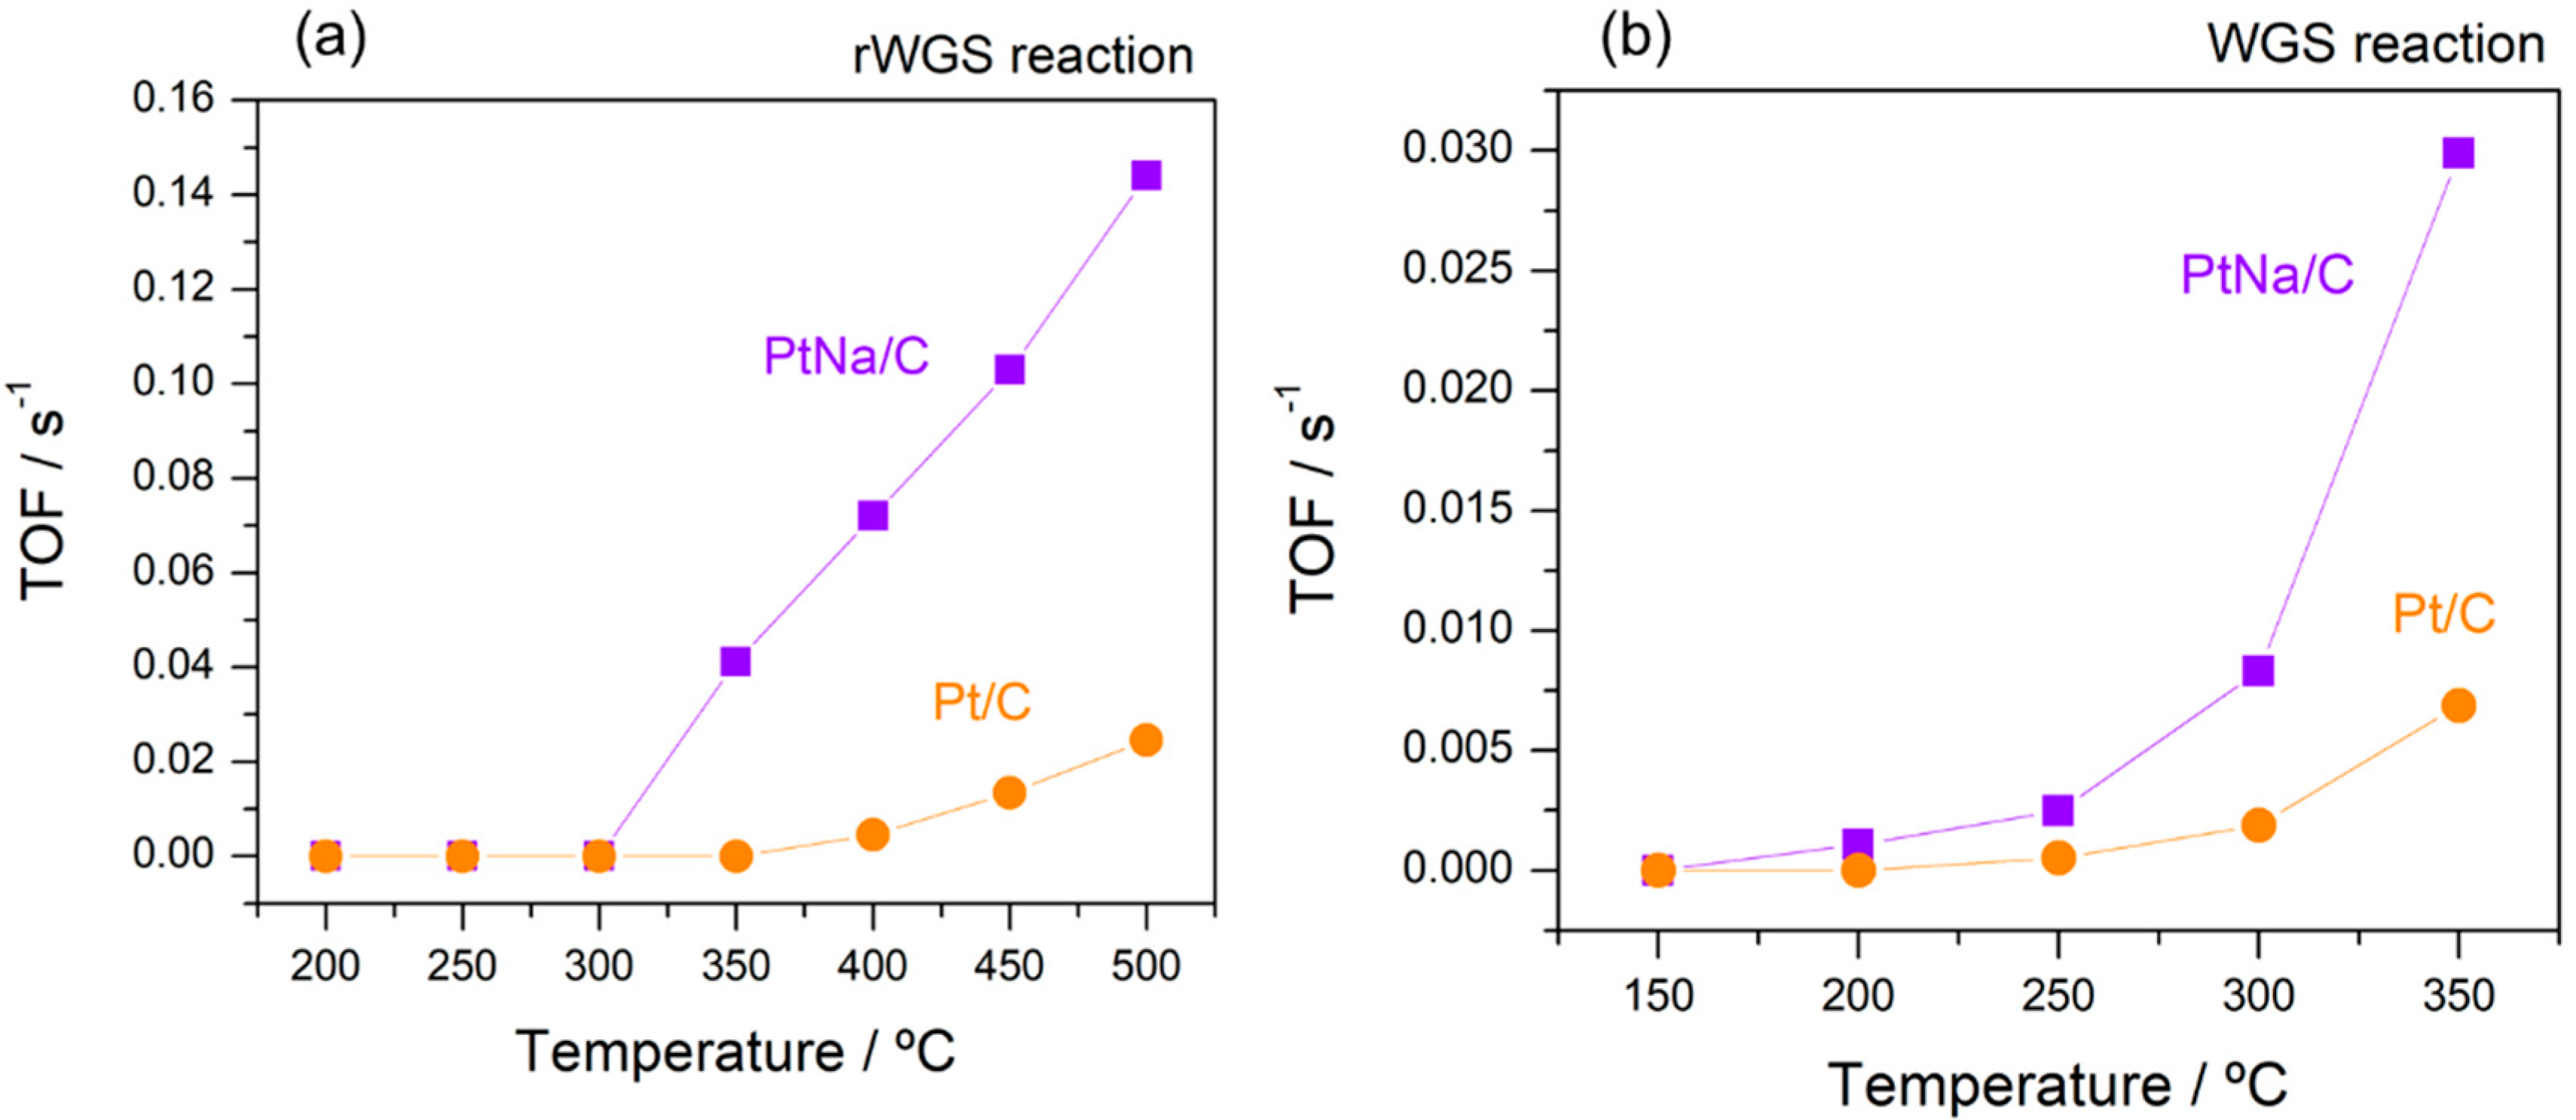
Figure 9 compares the catalytic performance of both catalysts under rWGS and WGS reactions in terms of turnover frequency (TOF) estimated from CO2 rates consumed and produced, respectively. The intrinsic reaction rates were estimated under kinetic regime at conversions lower than 10%. The presence of Na increases the catalytic activity in the WGS and rWGS reaction. However, this activity enhancement is higher in the rWGS than in the WGS reaction since Pt-based catalysts are WGS active at high temperature [11] and, therefore, differences are observed just above 300 °C for this reaction. The improved catalytic performances of the Na-promoted catalyst can be explained by considering the changes induced by the alkali in the electronic structure of the Pt active sites. These results agree with those of other studies. The role of alkali promoters in the WGS reaction has been related either to the creation of new sites on the Pt surface that favours CO adsorption, or to a close interface contact between the dispersed metal and the alkali promoter that facilitates water dissociation. Cybulski et al. [15] reported that the effect of the Na promoter on the WGS activity of Pt/Al2O3 catalysts is to modify the local electronic properties of Pt and to create new H2O activation sites; this enhances the mobility of surface OH/H species to react with CO on the metallic Pt sites through a non-formate mechanism. The increase in the OH/H mobility on the support and the resulting increased concentration of H2O molecules at the metal-support interface have been highlighted by our group as being responsible for the enhancement of the WGS activity in Pt catalysts [11,48]. The group of Flytzani-Stephanopoulos [12,13,14] postulated the presence of Pt–O–(OH)–Na clusters on carbon nanotube walls as the active sites in the WGS reaction at 250–300 °C.
Arrhenius plots for estimating the apparent activation energy in the reverse and the forward WGS reaction are plotted in Figure 10. The obtained values of activation energy for WGS and rWGS reaction are in good agreement with the experimental and theoretical values reported for supported Pt-based catalysts [9,15,41,49]. The apparent activation energy in WGS reaction estimated by Zhai et al. [13] presented a 15 kJ mol−1 decrease on the Na-promoted catalyst with respect to their Pt/Al2O3 homologous catalyst, which had an activation energy of 65 kJ mol−1. Nevertheless, contrary to those observations, Pazmiño et al. [9] showed an increase in the activation energy on the Na-promoted catalyst with respect to the Pt/Al2O3 and Pt/TiO2 parent catalysts. A similar tendency was observed by Zugic et al. [12] on Na-promoted platinum catalysts stabilised on carbon supports in a study of the WGS reaction under full reformate gas conditions. They associated the cause of this inhibition of the WGS rate with the presence of hydrogen in the reaction gas and interpreted such a deviation in simple kinetic terms as a shift to a H2 desorption-limited rate. In our case, the activation energy estimated for both catalysts in the WGS reaction was very similar, although, as shown by the TOF data (Figure 9), the presence of sodium considerably promotes the WGS reaction. According to the literature [9,15], we believe that the presence of sodium enhances the water adsorption, increasing the intrinsic activity. However, an important decrease in the activation energy from 74 kJ mol−1 in the Na-free sample to 34 kJ mol−1 in the Na-promoted catalyst was observed in the rWGS reaction. A similar variation was observed by Liang et al. [49] in a study of the promotion effect of potassium over a Pt-based catalyst. This notable difference in activation energy suggests that alkali influenced the CO2 adsorption on Pt, creating new sites that favour CO2 dissociation.
From the abovementioned operando spectroscopic evidence and considering previous studies, we conclude that the addition of sodium modifies the electronic structure of Pt active sites, enhancing the activation of H2O molecules in the WGS reaction and favouring the CO2 dissociation in the rWGS reaction. Moreover, the presence of Na can also favour the CO methanation reaction.

4. Conclusions

Towards an operando DRIFTS-MS study, we have investigated the promotional role of sodium in the forward and the reverse WGS reaction on biochar-based Pt catalysts. The characterisation results suggest that the presence of sodium alters the interaction between the Pt sites and the carbon support, although future work will be needed to assess the effect of Na content on the catalytic activity as well as to clearly differentiate this effect from any possible Pt particle size effect. Our IR data show that the promotional effect of Na in rWGS/WGS reaction mainly originates from altering the electronic structure of Pt particles. The electronic perturbations caused by sodium on the Pt adatoms likely modify their chemical behaviour, creating new sites that favour the CO2 dissociation in the rWGS and the H2O activation in the WGS reaction. Finally, it was found that the presence of sodium also decreases the activation energy of the rWGS reaction, although it also produces methane towards the consecutive CO methanation reaction.

Author Contributions

M.A.C. and J.A.O. conceived and designed the experiments; J.L.S. and L.F.B. performed the experiments; M.A.C. and J.L.S. and L.F.B. analyzed the data; J.A.O. and L.F.B. wrote the paper.

Funding

This research was funded by the Spanish Ministerio de Economía y Competitividad (MINECO) (ENE2013-47880-C3-2-R and ENE2017-82451-C3-3R), co-financed by FEDER funds from the European Union.

Acknowledgments

J.L. Santos and L.F. Bobadilla also acknowledge MINECO for the PhD fellowship (BES-2014-068244) and the postdoctoral contract Juan de la Cierva-Incorporación (FJCI-2017-32128), respectively.

Conflicts of Interest

The authors declare no conflict of interest.

References

  1. Turner, J.A. Sustainable hydrogen production. Science 2004, 305, 972–974. [Google Scholar] [CrossRef] [PubMed]
  2. Noguchi, H.; Takegami, H.; Kasahara, S.; Tanaka, N.; Kamiji, Y.; Iwatsuki, J.; Aita, H.; Kubo, S. R&D status in thermochemical water-splitting hydrogen production iodine-sulfur process at JAEA. Energy Procedia 2017, 131, 113–118. [Google Scholar]
  3. Guan, G.; Kaewpanha, M.; Hao, X.; Abudula, A. Catalytic steam reforming of biomass tar: Prospects and challenges. Renew. Sustain. Energy Rev. 2016, 58, 450–461. [Google Scholar] [CrossRef] [Green Version]
  4. Graciani, J.; Sanz, J.F. Designing a new generation of catalysts: Water gas shift reaction example. Catal. Today 2015, 240, 214–219. [Google Scholar] [CrossRef] [Green Version]
  5. Hwang, J.-J. Sustainability study of hydrogen pathways for fuel cell vehicle applications. Renew. Sustain. Energy Rev. 2013, 19, 220–229. [Google Scholar] [CrossRef]
  6. Lee, Y.-L.; Jha, A.; Jang, W.-J.; Shim, J.-O.; Rode, C.V.; Jeon, B.-H.; Bae, J.W.; Roh, H.-S. Effect of alkali and alkaline earth metal on Co/CeO2 catalyst for the water-gas shift reaction of waste derived synthesis gas. Appl. Catal. A Gen. 2018, 551, 63–70. [Google Scholar] [CrossRef]
  7. Pastor-Pérez, L.; Buitrago-Sierra, R.; Sepúlveda-Escribano, A. CeO2-promoted Ni/activated carbon catalysts for the water-gas shift (WGS) reaction. Int. J. Hydrogen Energy 2014, 39, 17589–17599. [Google Scholar] [CrossRef]
  8. Zhu, X.; Shen, M.; Lobban, L.L.; Mallinson, R.G. Structural effects of Na promotion for high water gas shift activity on Pt–Na/TiO2. J. Catal. 2011, 278, 123–132. [Google Scholar] [CrossRef]
  9. Pazmiño, J.H.; Shekhar, M.; Damion Williams, W.; Cem Akatay, M.; Miller, J.T.; Nicholas Delgass, W.; Ribeiro, F.H. Metallic Pt as active sites for the water-gas shift reaction on alkali-promoted supported catalysts. J. Catal. 2012, 286, 279–286. [Google Scholar] [CrossRef]
  10. González-Castaño, M.; Reina, T.R.; Ivanova, S.; Martínez Tejada, L.M.; Centeno, M.A.; Odriozola, J.A. O2-assisted Water Gas Shift reaction over structured Au and Pt catalysts. Appl. Catal. B Environ. 2016, 185, 337–343. [Google Scholar] [CrossRef]
  11. González Castaño, M.; Reina, T.R.; Ivanova, S.; Centeno, M.A.; Odriozola, J.A. Pt vs. Au in water-gas shift reaction. J. Catal. 2014, 314, 1–9. [Google Scholar] [CrossRef]
  12. Zugic, B.; Zhang, S.; Bell, D.C.; Tao, F.; Flytzani-Stephanopoulos, M. Probing the low-temperature water-gas shift activity of alkali-promoted platinum catalysts stabilized on carbon supports. J. Am. Chem. Soc. 2014, 136, 3238–3245. [Google Scholar] [CrossRef] [PubMed]
  13. Zhai, Y.; Pierre, D.; Si, R.; Deng, W.; Ferrin, P.; Nilekar, A.U.; Peng, G.; Herron, J.A.; Bell, D.C.; Saltsburg, H.; et al. Alkali-stabilized Pt-OHx species catalyze low-temperature water-gas shift reactions. Science 2010, 329, 1633–1636. [Google Scholar] [CrossRef] [PubMed]
  14. Zugic, B.; Bell, D.C.; Flytzani-Stephanopoulos, M. Activation of carbon-supported platinum catalysts by sodium for the low-temperature water-gas shift reaction. Appl. Catal. B Environ. 2014, 144, 243–251. [Google Scholar] [CrossRef]
  15. Cybulskis, V.J.; Wang, J.; Pazmiño, J.H.; Ribeiro, F.H.; Delgass, W.N. Isotopic transient studies of sodium promotion of Pt/Al2O3 for the water-gas shift reaction. J. Catal. 2016, 339, 163–172. [Google Scholar] [CrossRef]
  16. Evin, H.N.; Jacobs, G.; Ruiz-Martinez, J.; Thomas, G.A.; Davis, B.H. Low temperature water-gas shift: Alkali doping to facilitate formate C–H bond cleaving over Pt/Ceria catalysts—An optimization problem. Catal. Lett. 2008, 120, 166–178. [Google Scholar] [CrossRef]
  17. Ding, K.; Gulec, A.; Johnson, A.M.; Schweitzer, N.M.; Stucky, G.D.; Marks, L.D.; Stair, P.C. Identification of active sites in CO oxidation and water-gas shift over supported Pt catalysts. Science 2015, 350, 189–192. [Google Scholar] [CrossRef] [PubMed]
  18. Fu, Q.; Saltsburg, H.; Flytzani-Stephanopoulos, M. Active nonmetallic au and pt species on Ceria-Based Water-Gas shift catalysts. Science 2003, 301, 935–938. [Google Scholar] [CrossRef] [PubMed]
  19. Figueiredo, J.L.; Pereira, M.F.R.; Freitas, M.M.A.; Órfão, J.J.M. Modification of the surface chemistry of activated carbons. Carbon 1999, 37, 1379–1389. [Google Scholar] [CrossRef]
  20. Gil, S.; Romero, A.; Lucas, A.d.; Sánchez, P.; Dorado, F.; Osa, A.R.d.l.; García-Vargas, J.M.; Valverde, J.L. Nano-scale Au supported on carbon materials for the low temperature water gas shift (WGS) reaction. Catalysts 2011, 1, 155–174. [Google Scholar] [CrossRef]
  21. Cha, J.S.; Park, S.H.; Jung, S.-C.; Ryu, C.; Jeon, J.-K.; Shin, M.-C.; Park, Y.-K. Production and utilization of biochar: A review. J. Ind. Eng. Chem. 2016, 40, 1–15. [Google Scholar] [CrossRef]
  22. Lee, J.; Kim, K.-H.; Kwon, E.E. Biochar as a catalyst. Renew. Sustain. Energy Rev. 2017, 77, 70–79. [Google Scholar] [CrossRef]
  23. Oliveira, F.R.; Patel, A.K.; Jaisi, D.P.; Adhikari, S.; Lu, H.; Khanal, S.K. Environmental application of biochar: Current status and perspectives. Biores. Technol. 2017, 246, 110–122. [Google Scholar] [CrossRef] [PubMed]
  24. Xiong, X.; Yu, I.K.M.; Cao, L.; Tsang, D.C.W.; Zhang, S.; Ok, Y.S. A review of biochar-based catalysts for chemical synthesis, biofuel production, and pollution control. Biores. Technol. 2017, 246, 254–270. [Google Scholar] [CrossRef] [PubMed]
  25. Fanning, P.E.; Vannice, M.A. A DRIFTS study of the formation of surface groups on carbon by oxidation. Carbon 1993, 31, 721–730. [Google Scholar] [CrossRef]
  26. Muckenhuber, H.; Grothe, H. A DRIFTS study of the heterogeneous reaction of NO2 with carbonaceous materials at elevated temperature. Carbon 2007, 45, 321–329. [Google Scholar] [CrossRef]
  27. Markus, H.; Mäki-Arvela, P.; Kumar, N.; Kul’kova, N.V.; Eklund, P.; Sjöholm, R.; Holmbom, B.; Salmi, T.; Murzin, D.Y. Hydrogenolysis of hydroxymatairesinol over carbon-supported palladium catalysts. Catal. Lett. 2005, 103, 125–131. [Google Scholar] [CrossRef]
  28. Wang, C.; Yi, G.; Lin, H.; Yuan, Y. Na+-intercalated carbon nanotubes-supported platinum nanoparticles as new highly effective catalysts for preferential CO oxidation in H2-rich stream. Int. J. Hydrogen Energy 2012, 37, 14124–14132. [Google Scholar] [CrossRef]
  29. Fraga, M.A.; Jordão, E.; Mendes, M.J.; Freitas, M.M.A.; Faria, J.L.; Figueiredo, J.L. Properties of Carbon-Supported Platinum Catalysts: Role of Carbon Surface Sites. J. Catal. 2002, 209, 355–364. [Google Scholar] [CrossRef]
  30. Takagi, H.; Maruyama, K.; Yoshizawa, N.; Yamada, Y.; Sato, Y. XRD analysis of carbon stacking structure in coal during heat treatment. Fuel 2004, 83, 2427–2433. [Google Scholar] [CrossRef] [Green Version]
  31. Iwashita, N.; Park, C.R.; Fujimoto, H.; Shiraishi, M.; Inagaki, M. Specification for a standard procedure of X-ray diffraction measurements on carbon materials. Carbon 2004, 42, 701–714. [Google Scholar] [CrossRef]
  32. Santos, J.L.; Alda-Onggar, M.; Fedorov, V.; Peurla, M.; Eränen, K.; Mäki-Arvela, P.; Centeno, M.Á.; Murzin, D.Y. Hydrodeoxygenation of vanillin over carbon supported metal catalysts. Appl. Catal. A Gen. 2018, 561, 137–149. [Google Scholar] [CrossRef]
  33. Buitrago, R.; Ruiz-Martínez, J.; Silvestre-Albero, J.; Sepúlveda-Escribano, A.; Rodríguez-Reinoso, F. Water gas shift reaction on carbon-supported Pt catalysts promoted by CeO2. Catal. Today 2012, 180, 19–24. [Google Scholar] [CrossRef]
  34. Ball, M.C.; Snelling, C.M.; Strachan, A.N.; Strachan, R.M. Thermal decomposition of solid sodium sesquicarbonate, Na2CO3·NaHCO3·2H2O. J. Chem. Soc. Faraday Trans. 1992, 88, 631–636. [Google Scholar] [CrossRef]
  35. Lazzarini, A.; Piovano, A.; Pellegrini, R.; Agostini, G.; Rudić, S.; Lamberti, C.; Groppo, E. Graphitization of activated carbons: A molecular-level Investigation by INS, DRIFT, XRD and Raman techniques. Phys. Procedia 2016, 85, 20–26. [Google Scholar] [CrossRef]
  36. Caglayan, B.S.; Soykal, İ.I.; Aksoylu, A.E. Preferential oxidation of CO over Pt–Sn/AC catalyst: Adsorption, performance and DRIFTS studies. Appl. Catal. B Environ. 2011, 106, 540–549. [Google Scholar] [CrossRef]
  37. Mul, G.; Kapteijn, F.; Moulijn, J.A. A DRIFTS study of the interaction of alkali metal oxides with carbonaceous surfaces. Carbon 1999, 37, 401–410. [Google Scholar] [CrossRef]
  38. Stuart, B.H. Infrared Spectroscopy: Fundamentals and Applications; Wiley & Sons: West Sussex, UK, 2005; ISBN 978-0-470-85428-0. [Google Scholar]
  39. Vogt, C.; Groeneveld, E.; Kamsma, G.; Nachtegaal, M.; Lu, L.; Kiely, C.J.; Berben, P.H.; Meirer, F.; Weckhuysen, B.M. Unravelling structure sensitivity in CO2 hydrogenation over nickel. Nat. Catal. 2018, 1, 127–134. [Google Scholar] [CrossRef]
  40. Laletina, S.S.; Mamatkulov, M.; Shor, E.A.; Kaichev, V.V.; Genest, A.; Yudanov, I.V.; Rösch, N. Size-Dependence of the adsorption energy of co on pt nanoparticles: Tracing two intersecting trends by DFT calculations. J. Phys. Chem. C 2017, 121, 17371–17377. [Google Scholar] [CrossRef]
  41. Garfunkel, E.L.; Crowell, J.E.; Somorjai, G.A. The strong influence of potassium on the adsorption of carbon monoxide on platinum surfaces: A TDS and HREELS study. J. Phys. Chem. 1982, 86, 310–313. [Google Scholar] [CrossRef]
  42. Tong, Y.Y.; Rice, C.; Wieckowski, A.; Oldfield, E. A detailed NMR-Based model for CO on Pt catalysts in an electrochemical environment:  shifts, relaxation, Back-Bonding, and the Fermi-Level local density of states. J. Am. Chem. Soc. 2000, 122, 1123–1129. [Google Scholar] [CrossRef]
  43. Rice, C.; Tong, Y.Y.; Oldfield, E.; Wieckowski, A.; Hahn, F.; Gloaguen, F.; Léger, J.-M.; Lamy, C. In situ infrared study of carbon monoxide adsorbed onto commercial Fuel-Cell-Grade Carbon-Supported platinum nanoparticles:  Correlation with 13C NMR results. J. Phys. Chem. B 2000, 104, 5803–5807. [Google Scholar] [CrossRef]
  44. Stangeland, K.; Kalai, D.; Li, H.; Yu, Z. CO2 methanation: The effect of catalysts and reaction conditions. Energy Procedia 2017, 105, 2022–2027. [Google Scholar] [CrossRef]
  45. Li, D.; Ichikuni, N.; Shimazu, S.; Uematsu, T. Catalytic properties of sprayed Ru/Al2O3 and promoter effects of alkali metals in CO2 hydrogenation. Appl. Catal. A Gen. 1998, 172, 351–358. [Google Scholar] [CrossRef]
  46. Le, T.A.; Kim, T.W.; Lee, S.H.; Park, E.D. Effects of Na content in Na/Ni/SiO2 and Na/Ni/CeO2 catalysts for CO and CO2 methanation. Catal. Today 2018, 303, 159–167. [Google Scholar] [CrossRef]
  47. Kapteijn, F.; Moulijn, J.A. Methanation of CO over alkali metal-carbon catalysts. J. Chem. Soc., Chem. Commun. 1984, 5, 278–279. [Google Scholar] [CrossRef]
  48. García-Moncada, N.; Bobadilla, L.F.; Poyato, R.; López-Cartes, C.; Romero-Sarria, F.; Centeno, M.Á.; Odriozola, J.A. A direct in situ observation of water-enhanced proton conductivity of Eu-doped ZrO2: Effect on WGS reaction. Appl. Catal. B Environ. 2018, 231, 343–356. [Google Scholar] [CrossRef]
  49. Liang, B.; Duan, H.; Su, X.; Chen, X.; Huang, Y.; Chen, X.; Delgado, J.J.; Zhang, T. Promoting role of potassium in the reverse water gas shift reaction on Pt/mullite catalyst. Catal. Today 2017, 281, 319–326. [Google Scholar] [CrossRef]
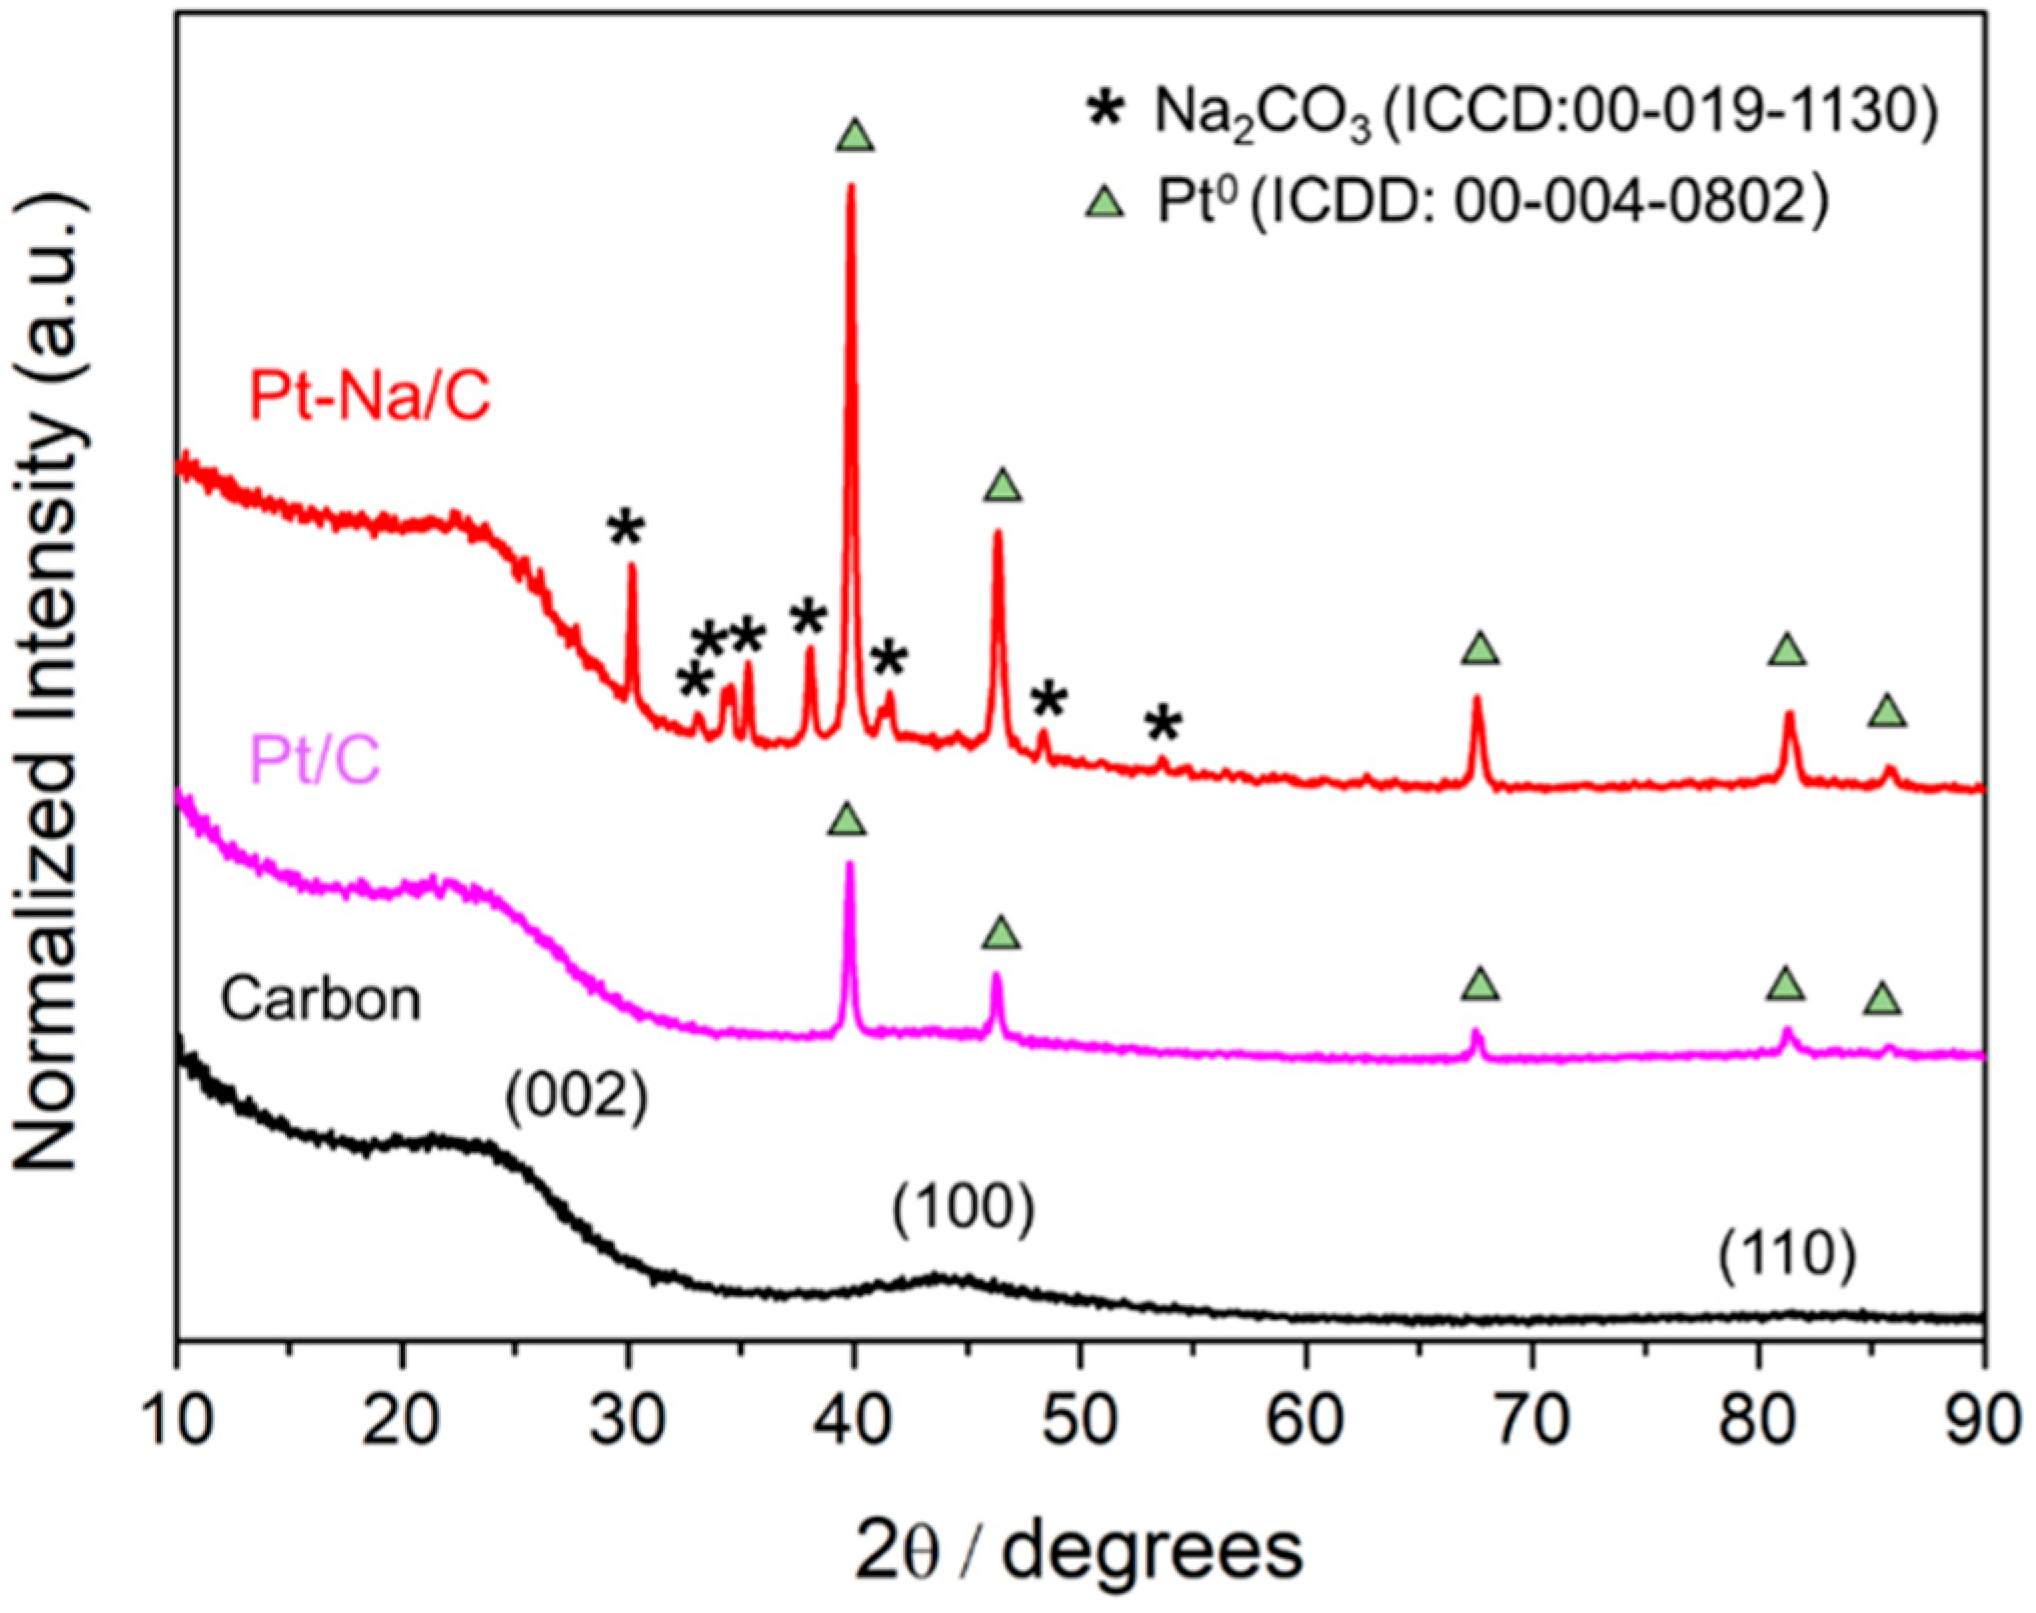
Figure 1. XRD patterns of the support and the prepared catalysts.
Carbon 04 00047 g001
Figure 2. TEM micrographs and metal particle size distribution of Pt/C and Pt–Na/C samples.
Carbon 04 00047 g002
Figure 3. (a) SEM micrographs of the samples: carbon support, Pt/C, and Pt–Na/C, and (b) SEM micrograph of Pt–Na/C catalyst including the elemental mapping obtained by EDX analysis.
Carbon 04 00047 g003
Figure 4. DRIFT spectra of both catalysts recorded at room temperature (RT).
Carbon 04 00047 g004
Figure 5. Evolution of difference DRIFT spectra in function of the temperature under activation pre-treatment for the carbon supported catalysts; (a) Pt/C, and (b) Pt–Na/C. The reference spectrum was recorded prior to activation at RT.
Carbon 04 00047 g005
Figure 6. Evolution of different DRIFT spectra and gas-phase species produced as a function of the WGS reaction temperature for the samples (a) Pt/C and (b) Pt–Na/C. The reference spectrum was recorded after activation at 150 °C. The amount of H2, CO2, and CH4 was measured with a mass spectrometer located at the exit of the DRIFTS cell.
Carbon 04 00047 g006
Figure 7. Evolution of difference DRIFT spectra and gas-phase species produced as a function of the rWGS reaction temperature for the samples (a) Pt/C and (b) Pt–Na/C. The reference spectrum was recorded after activation at 200 °C. The amount of H2O, CO, and CH4 was measured with a mass spectrometer located at the exit of the DRIFTS cell.
Carbon 04 00047 g007
Figure 8. Evolution of the IR band height associated to Pt–CO linear and Pt–CO bridged species as a function of the temperature during the (a) WGS and (b) rWGS reaction for the Pt/C and Pt–Na/C catalysts, respectively.
Carbon 04 00047 g008
Figure 9. TOF plots of intrinsic reaction rates of (a) rWGS and (b) WGS measured for both catalysts.
Carbon 04 00047 g009
Figure 10. Arrhenius-type plots for both catalysts obtained in (a) rWGS and (b) WGS reactions.
Carbon 04 00047 g010
Table 1. ICP-MS analysis, XRD parameters, particle size, estimated dispersion by TEM and measured isoelectric point (IEP) for the raw carbon support and the prepared catalysts.
SampleMetal Loading (ICP, wt. %)Lc Parameter (XRD, Å)Average Particle Size (XRD, nm)Average Particle Size (TEM, nm)Calculated Dispersion (%)IEP (pH)
PtNa
Carbon--16---5.42
Pt/C1.0-16121212.46.01
Pt–Na/C1.04.82040363.89.96
Table 2. Textural properties of the prepared samples.
SampleSBET (m2 g−1)Micropore Area (m2 g−1)External Area (m2 g−1)Microporosity (%)VBHJ (cm3 g−1)Dmean (4V/A) (nm)
Carbon4093268320.30.0361.97
Pt/C3662838322.70.0392.00
Pt–Na/C33726374220.0361.99