Article

Raman Spectra of Carbon-Based Materials (from Graphite to Carbon Black) and of Some Silicone Composites

Institut des Sciences Moléculaires, UMR 5255, Université de Bordeaux 1, CNRS-UMR 5255, 351 cours de la Libération, Talence 33405, Cedex, France
*
Author to whom correspondence should be addressed.
C 2015, 1(1), 77-94; https://doi.org/10.3390/c1010077
Submission received: 15 October 2015 / Revised: 1 December 2015 / Accepted: 9 December 2015 / Published: 16 December 2015
(This article belongs to the Special Issue Graphene Nanocomposite for Advanced Applications)

Abstract

:
Carbon-based nanomaterials have emerged as a subject of enormous scientific attention due to their outstanding mechanical, electrical and thermal properties. Incorporated in a polymeric matrix, they are expected to significantly improve physical properties of the host medium at extremely small filler content. In this work, we report a characterization of various carbonaceous materials by Raman spectroscopy that has become a key technique for the analysis of different types of sp2 nanostructures, including one-dimensional carbon nanotubes, two-dimensional graphene and the effect of disorder in their structures. The dispersion behavior of the D and G’ Raman bands, that is, their shift to higher frequencies with increasing laser excitation energy, is used to assess the interfacial properties between the filler and the surrounding polymer in the composites.

Graphical Abstract

1. Introduction

In recent decades, the intense research in the area of polymer composites has motivated a great interest towards carbon-based materials including carbon black, carbon nanotubes, graphite or graphene. One type of carbon particle, carbon black, has been used for a long time in the rubber industry to prepare composites with greatly improved properties with regard to the unfilled polymer. The field of rubber composites is of particular importance because elastomers, in most of their industrial applications, have to be compounded with mineral fillers on account of their poor elastic modulus and the lack of electrical and thermal conductivity in the pristine form. The reinforcing ability of carbon black is related to its complex structure [1,2,3]. Carbon black is composed of primary particles, ranging from 10 to 50 nm, fused together to build up stable aggregates that form a persistent and irreversible structure, the size of which varies from 50 to some hundred nanometers. These aggregates stick together to form loosely bonded agglomerates that are fully reversible and are known as transient structures. Parameters such as surface area, morphology of aggregates and essentially surface chemical characteristics have been shown to have a large influence on the reinforcing properties of carbon black [4].
The last few years have seen the extensive use of fillers with at least one dimension in the nanometric scale because of the small size of the filler and the corresponding increase in the surface area, allowing to achieve the desired properties at much lower filler loadings than those required with the conventional carbon black [5]. These nanoparticles include spherical particles such as silica or titanium dioxide generated in situ by the sol-gel process; layered silicates; carbon or clay fibers; carbon nanotubes; and graphene [5,6,7]. In particular, nano fillers with high anisotropic geometrical factor have attracted a huge scientific interest due to their ability to form a percolation network at much lower content than conventional fillers [8,9,10,11]. The formation of an interconnecting filler network within the soft elastomeric matrix has a strong impact on the electrical, mechanical and thermal response of the composite material. For example, very small quantities of carbon nanotubes (around 0.5 phr, “phr” means parts by weight per hundred parts of rubber) have been shown to provide electrical conduction when incorporated into elastomeric media usually considered as electrical insulators [12]. Conventional carbon black particles have to be used at contents as high as 10–50 phr to reach the percolation threshold characterized by a sharp drop, by several orders of magnitude in the electrical resistance.
Despite the extensive research based on carbon nanotube-based composite materials, major issues limit the full realization of the filler properties on account of the strong tendency of the tubes to form agglomerates that act as defects in the composite and reduce the performance of the resulting material [13,14]. Moreover, significant progress in nanotube production at a large-scale and affordable cost still remains challenging.
Graphene, considered as the building unit of all graphitic carbon allotropes, is a flat sheet—one atom thick—formed by a network of sp2 carbons arranged in a honeycomb structure. It can be rolled into seamless one-dimensional nanotubes or stacked into three-dimensional graphite. The possible exfoliation of graphite—abundant in nature and thus cost effective as a raw material—to graphene has attracted enormous interest because of its potential in-plane electrical, thermal and mechanical properties that make graphene one of the most exciting materials for polymer nanocomposites.
However, as for other fillers, the extent of property improvement of the pristine polymer highly depends on the state of dispersion of graphene layers in the host matrix and on interfacial interactions with the surrounding medium. Graphene is known to be incompatible with most polymers and thus has often been appropriately modified to enhance compatibility with the polymer matrix [15]. Graphene oxide, that is an oxidized form of graphene bearing several oxygen functionalities, has been considered as more suitable for the synthesis of graphene-based composites.
Graphene-based polymer nanocomposites have been the subject of recent reviews [15,16,17,18] and several studies have illustrated the potential of graphene and its derivatives as fillers for polymer matrices in the glassy [19,20,21,22,23,24] and rubbery states [25,26,27,28,29,30].
In the field of elastomeric matrices, graphene oxide was used as a compatilizer to help dispersion of multiwall carbon nanotubes in a silicone rubber because it can react with both polymer matrix and the tubes [25]. Functionalized graphene sheets incorporated in natural rubber were shown to increase the electrical conductivity and the tensile stress owing to a strong rubber-to-filler interaction due to defects, free radicals and irregularities in the modified graphene surface [26]. Stanier et al. [30] showed that beside the significant increase in the Young’s modulus of the composites even at low filler loading, exfoliated graphene oxide decreases the strain value at which the strain induced crystallization of natural rubber occurs. Araby et al. [27,28] have demonstrated that graphene platelets do not provide significantly higher reinforcement efficiency than ethylene-propylene-diene and styrene-butadiene rubbers. However, graphene oxide/styrene-butadiene composites prepared with the assistance of butadiene-styrene-vinyl-pyridine acting as an interface bridge, display better mechanical properties than composites filled with conventional carbon black [29]. Moreover, the use of graphene oxide in combination with silica results in a lower rolling resistance of the composite than with silica alone, thus allowing a new opportunity for the green tire application [29].
Raman spectroscopy has become an important tool for the characterization of the different carbon allotropes and disordered varieties on account of its sensitivity to changes in the structure of carbons. The interpretation of the Raman spectra of carbonaceous materials has been widely discussed in the literature with studies covering a wide range of carbon structures such as highly pyrolytic graphite, graphene, carbon nanotubes, etc. However, despite the fact that many papers have been already published on the Raman spectra of carbon species, it was thought worthwhile to take up a comparison between different carbonaceous materials.
In previous papers, we have shown the significance of Raman spectroscopy in addressing the behavior of composites filled with carbon black, carbon nanotubes or multilayer graphene [31,32,33,34]. The present paper extends the study to other graphitic fillers such as graphite flakes, graphite nanoplatelets and to graphene oxide for a thorough comparison between the spectroscopic properties of the various carbon species. It aims exclusively at investigating the important problem of the polymer-filler interface in order to produce advanced high-performance elastomeric composites. The chosen elastomeric matrix is poly(dimethylsiloxane) (PDMS) that requires, in most applications, to be reinforced by fillers to improve its poor mechanical properties in the unfilled state. Significant changes in mechanical and electrical properties of PDMS have been observed by addition of carbon nanotubes at extremely low filler content with a reinforcing effect much more important than that provided by silica commonly used to increase the mechanical properties of the pristine matrix [35,36]. It was of interest to investigate if other carbon species and especially graphene oxide have the potential to be used as reinforcing fillers for silicone rubbers.

2. Results and Discussion

2.1. Raman Spectra of Carbon Species: An Overview

Figure 1 compares the Raman spectra of the different carbonaceous materials excited at 633 nm. These spectra show deconvolutions into Gauss–Lorentz band shapes after a hand-made subtraction of the baseline.
Figure 1. Deconvoluted Raman spectra of the different carbonaceous materials excited at 633 nm. (a) highly oriented pyrolitic graphite (HOPG); (b) multilayer grapheme (MLG); (c,d,e) graphites of grade 3775, 4827 and 4124, respectively; (f) multiwall carbon nanotubes (MWCNTs); (g) graphene oxide, GO; (h) carbon black (CB).
Carbon 01 00077 g001
The Raman spectrum of highly oriented pyrolytic graphite, HOPG, a treated graphite that displays the highest degree of three-dimensional ordering, consists of two main bands observed at 1581 and 2687 cm−1 (Figure 1a), denoted as the G band and 2D (or G’) band, respectively [37,38]. These bands correspond to the degenerate in-plane E2g optical mode at the center of the Brillouin zone, and to the harmonic (second order Raman scattering) of an in-plane transverse optical (TO) mode close to the zone boundary K point, respectively [39]. The second order Raman spectrum also contains two weak bands at 2458 and 3246 cm−1, assigned to the combination D + D” and to the harmonic 2D’, respectively. D” corresponds to a phonon belonging to the in-plane longitudinal acoustic (LA) branch close to the K point [40] and D’ corresponds to a phonon of the in-plane longitudinal optical (LO) branch close to the zone center (Г point) [39].
New features take place on the spectra of multilayer graphene (MLG) and of a flake graphite (grade 3775) at 1333 (weak) and 1604 cm−1 (very weak) (Figure 1b,c). They are assigned to the D band (i.e., the fundamental of 2D) and to the D’ band (i.e., the fundamental of 2D’), respectively [38]. These modes are not Raman active in first order Raman scattering of perfect crystals (HOPG), just because they are not zone-center modes, but they become Raman active in defective graphitic materials owing to defect-induced double resonance Raman scattering processes involving the electronic π–π* transitions [38]. In fact, the D band involves a defect-induced electron-hole “inter-valley” double resonance process that activates a TO phonon close to the zone boundary K point, while the D’ band is activated by a similar “intra-valley” double resonance process that activates a LO phonon close to the Г point. Due to the shape of the π–π* bands, the electronic transitions move inside the (a*,b*) reciprocal plane of the Brillouin zone as a function of the excitation energy. Conversely, the phonons (D or D’) excited with different laser wavelengths describe the dispersion of their respective branches (TO or LO) [37,38]. It turns out that the TO branch is highly dispersive in the vicinity of the K point, so that the position of the D band exhibits a marked blue shift as the excitation energy increases, as does also the harmonic 2D. In contrast, the LO branch is quasi-flat in the vicinity of the Г point, so that no change can be detected in the position of the D’ band (and also of the 2D’ band) by varying the excitation energy. Hence, as a consequence of the particular shape and symmetry of the π and π* electronic states around the K point of the Brillouin zone, the energy and momentum transfer of the resonant phonons vary according to the slope of the dispersion branches involved in the double resonance process [38,41,42,43,44]. In the present study, the dispersive behaviors consisting of downshifts between 40 and 60 cm−1 for the D band and around 100 cm−1 for the 2D(G’) band, are observed with a change in excitation wavelength from 457 to 752 nm (Table 1 and Figure 4).
So, the presence of the D band in these materials is assigned to structural defects (probably edge defects in these cases). It has been shown that the intensity of the D band relative to that of the G band increases with the amount of disorder, so that the intensity ratio ID/IG has often been used to characterize the average crystal planar domain size La [45,46]. It follows that the correlation length La in MLG and graphite (grade 3775) can be evaluated around 110 and 105 Å, respectively.
Note also that the 2D band appears as a doublet for these materials (Figure 1a–c). This is due to the splitting’s of the π and π* electronic states, owing to the interactions between the successive layer planes. For one-layer (1 L) graphene, the 2D band is a singlet, for 2 L graphene it is a quadruplet and finally for more than five layers, the Raman spectrum is quasi indistinguishable from that of graphite, i.e., the 2D band splitting’s merge into a doublet [38]. The fact that the 2D band in MLG and graphite 3775 exhibits a doublet structure means that the stacking of the graphene layers along the hexagonal axis remains ordered at least in short or medium ranges. Indeed, the transmission electron microscopy (TEM) image of MLG (Figure 2) reveals the quasi-regular staking of about 50 layers corresponding to a thickness around 15 nm, in agreement with that indicated by the supplier.
Table 1. Wavenumbers of the D and G’ (or 2D) bands at different excitation wavelengths for the various carbonaceous materials investigated in this study.
Sampleλ = 457 nmλ = 515 nmλ = 515 nmλ = 752 nm
D (cm−1)G’ (cm−1)D (cm−1)G’ (cm−1)D (cm−1)G’ (cm−1)D (cm−1)G’ (cm−1)
HOPG*2755*2727*2687*2656
MLG13642750135127181333267713222647
Graphite 37751365274713532725133326811314
Graphite 48271358272813492697132426501313
Graphite 41241358272213462694132926581311
MWCNTs13602716134926931325263913072614
GO1369136113371325
CB1375135513321312
* not present; — difficult to determine on account of a weak and broad signal.
Figure 2. Transmission electron microscopy (TEM) image of MLG (a) and of PDMS/MLG (1 wt %) (b).
Carbon 01 00077 g002
New features are observed on the Raman spectra of two other graphites (grade 4827 and 4124) that are graphite nano-platelets (GNPs) (Figure 1d,e). In the first order spectral range, we notice an increase of the intensity ratio ID/IG together with ID’/IG. This clearly reflects an increase of the amount of disorder compared to the flake graphite. Indeed, from the intensity ratio ID/IG the correlation length La is evaluated around 27 and 18 Å in these cases, respectively. Note that we are here at the very limit of validity of the Tuinstra and Koenig relation [38]. We also notice the emergence of two broad features at about 1500 and 1200 cm−1 that are referred to as D3 and D4, respectively [47,48]. The D4 is a broad low frequency shoulder of the D band, while the D3 band does not present any apparent maximum on the observed spectra but its introduction is found necessary to fit correctly the spectral shape between the D and the G bands. The assignment of these modes is not obvious. It is tempting to assign the D4 band to D” as suggested by May et al. [40], but the observed dispersion of the D4 band with the excitation energy cannot be clearly correlated with that expected for the LA phonon close to the K point responsible for D”, because of its large width and the strong overlap of D4 with the D band (Figure 1d,e). Note that the D4 and D3 bands are present in highly defective carbons like carbon black (CB), and have been assigned to the presence of amorphous carbon (D3) and of hydrocarbon or aliphatic moieties connected on graphitic basic structural units (D4) [47,48].
The second order spectra are markedly broadened (Figure 1d,e). In particular the 2D band appears now as a singlet as a consequence of the presence of some orientation and stacking defects resulting in a broadened “Dirac-like” single 2D band [38]. We also notice the presence of a new band at 2900 cm−1 whose intensity increases with the amount of disorder. It was assigned to the combination D + G [49], which corresponds to a defect-induced double resonance “inter-valley” scattering process, or to the combination D + D’, which is allowed through a defect-induced triple resonance process involving both “inter valley” and “intra-valley” scattering processes [38]. In the present case, the measured frequency (2901 cm−1) is closer to the calculated one for D + G (2895 cm−1) than that calculated for D + D’ (2929 cm−1).
The multiwall carbon nanotubes (MWCNTs) are composed of multiple concentric graphite cylinders. Their Raman spectra have been shown to depend on their crystalline arrangement: while the ID/IG ratio, which is commonly taken as a measure of the graphitization index reflects the amount of structural defects, the I2D/ID ratio is sensitive to the overall crystalline quality of the graphitic network and increases with long-range ordering [50]. The Raman spectrum of MWCNTs used in this study is shown in Figure 1f. The observed Raman characteristics are very similar to those of commercial MWCNTs analyzed by Santangelo et al. [50], i.e., high ID/IG ratio and low I2D’/ID ratio. They are also similar to those of the GNPs previously analyzed. It was mentioned that the position of the G band in MWCNTs is somehow higher (1596 cm−1) than that of other carbonaceous materials, and this was associated to a large compressive stress affecting the C=C bonds in highly defective tube walls [50]. Note, however, that such an apparent blue shift of the broadened G band may be explained as well by an overlap with the unresolved D’ band at 1610 cm−1 (Figure 1f).
Graphene (GO) has been successfully used in practical applications and is considered as one of the most promising material for large-scale production of graphene. GO is produced through chemical oxidation of graphite and subsequent exfoliation via sonication. The structural model proposed for graphite oxide composed of graphene oxide sheets involves two kinds of regions: aromatic regions with unoxidized benzene rings and regions containing aliphatic six-membered rings containing C–OH, epoxide and double bonds, the relative size of the two regions depending on the degree of oxidation [51,52]. The structural defects of GO that disrupt the electronic structure of graphene have been already mentioned in the literature [18,53,54].
Hence, the oxidation process generates much structural defects as evidenced by Raman spectroscopy. Indeed, the spectrum of GO is similar to that of carbon black (CB) (Figure 1 g,h). In both cases, the first order spectra consist of two broad bands centered at 1590 cm−1 (including the unresolved G and D’ bands) and at 1337 cm−1 for GO (including the unresolved D3, D and D4 bands). As shown by the deconvolutions (Figure 1g,h), the D3 band exhibits a large intensity that could be related to the presence of large amounts of amorphous carbon [48]. The second order Raman spectra present two main broad bands, from which none of the different components (D + D”, 2D, D + G and 2D’) can be clearly located (Figure 1g,h).
To summarize, the changes observed on the Raman spectra of carbonaceous materials when excited at different incident energy concern the following.
(i)
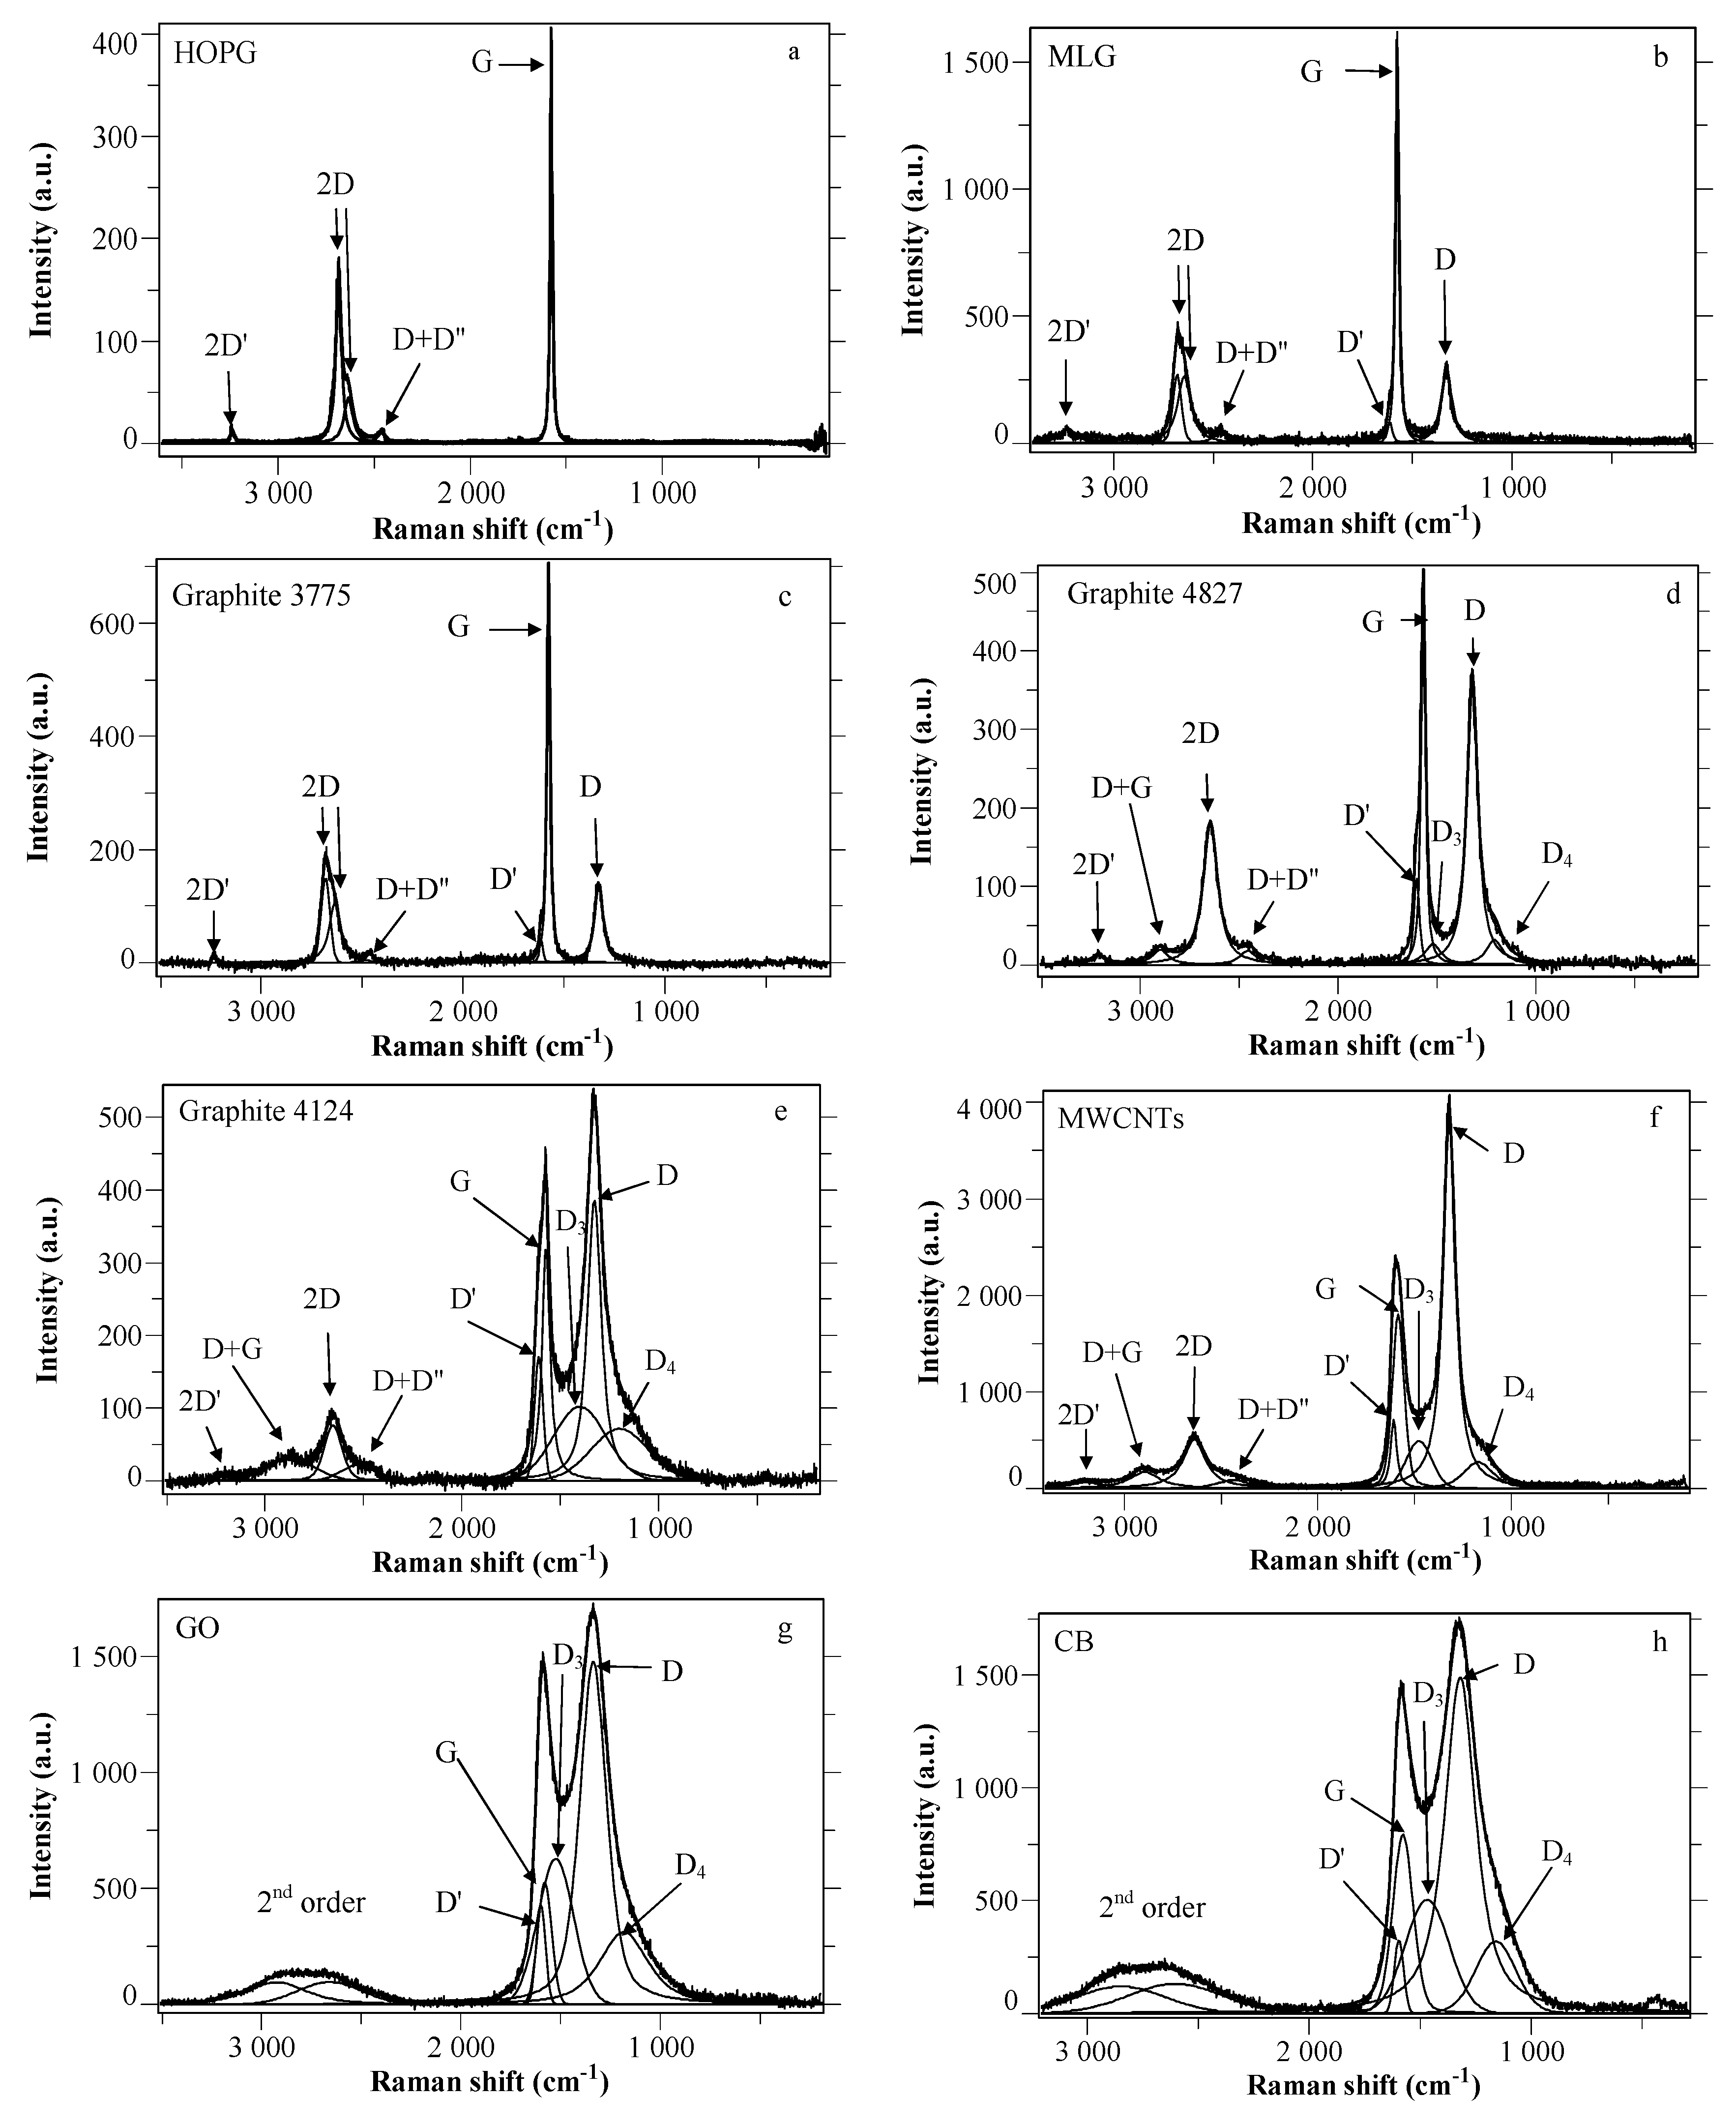
Intensity changes: As the efficiency of the defect-induced double resonance process diminishes with increasing excitation energy, the intensities of the disorder induced first and second order Raman bands diminish relative to that of the G band. In particular, the ID/IG ratio diminishes from red to blue excitation wavelengths, so that an adaptation of the Tuinstra and Koenig relation has been proposed [46].
(ii)
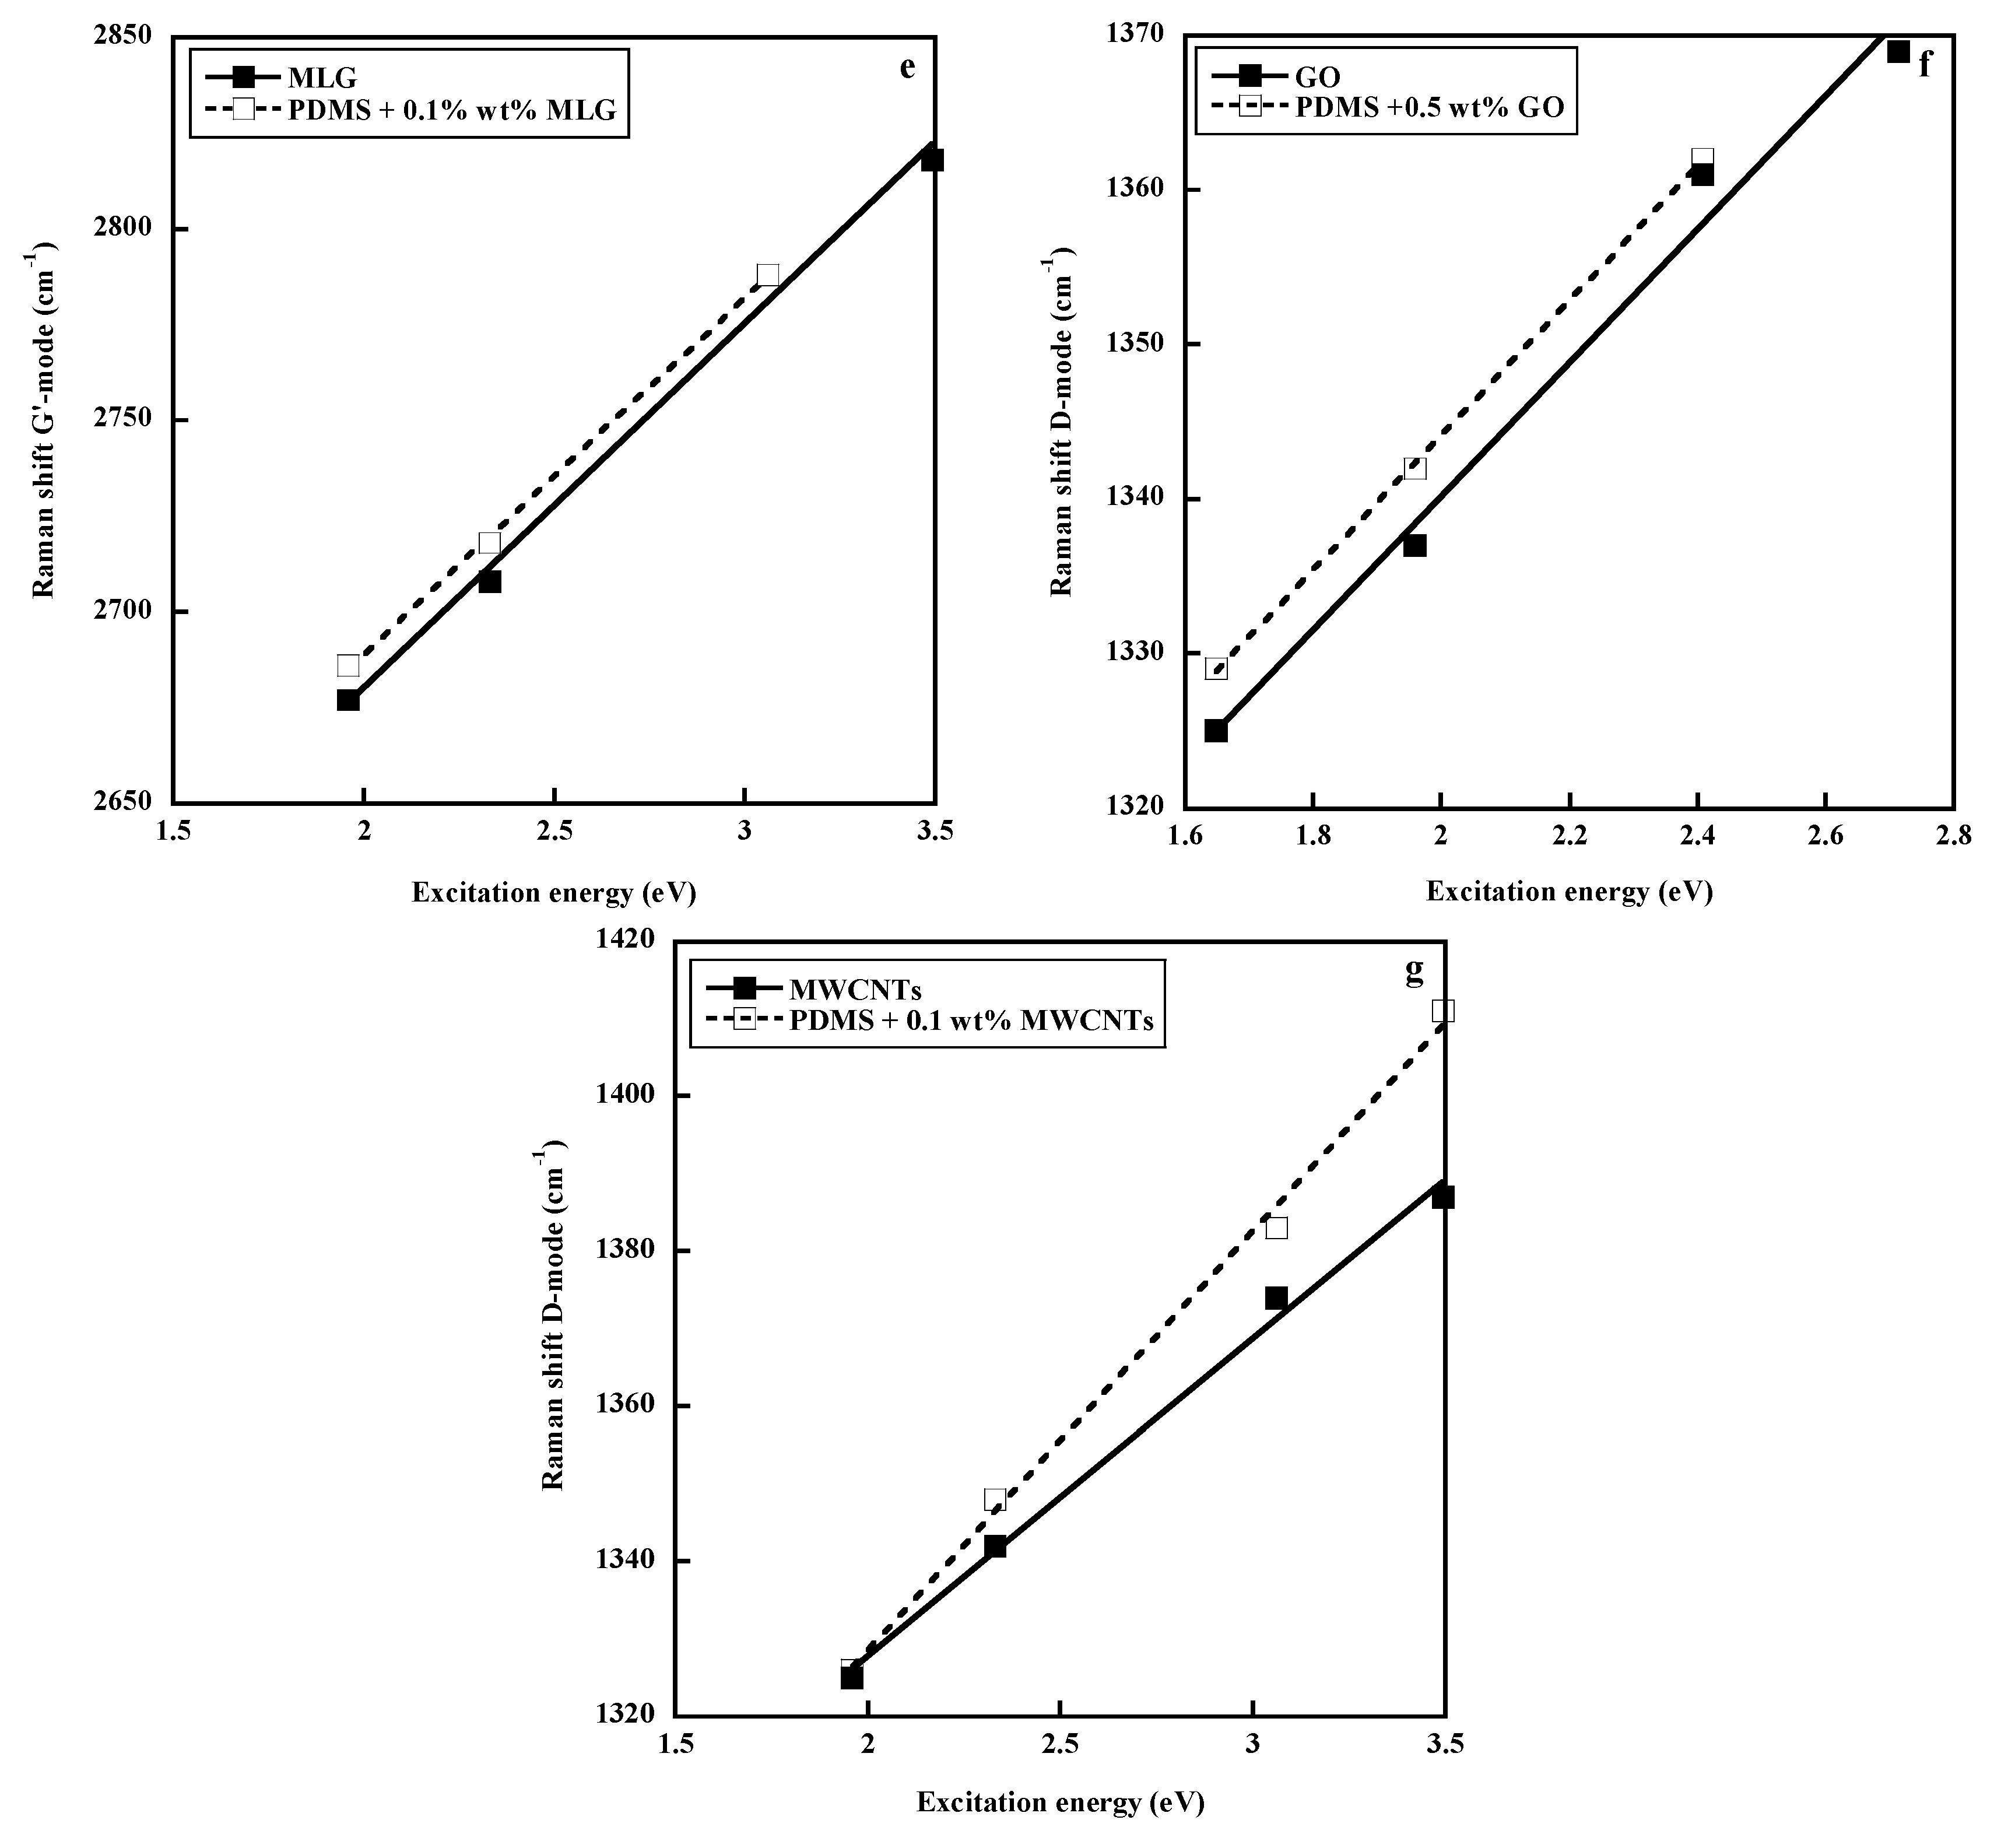
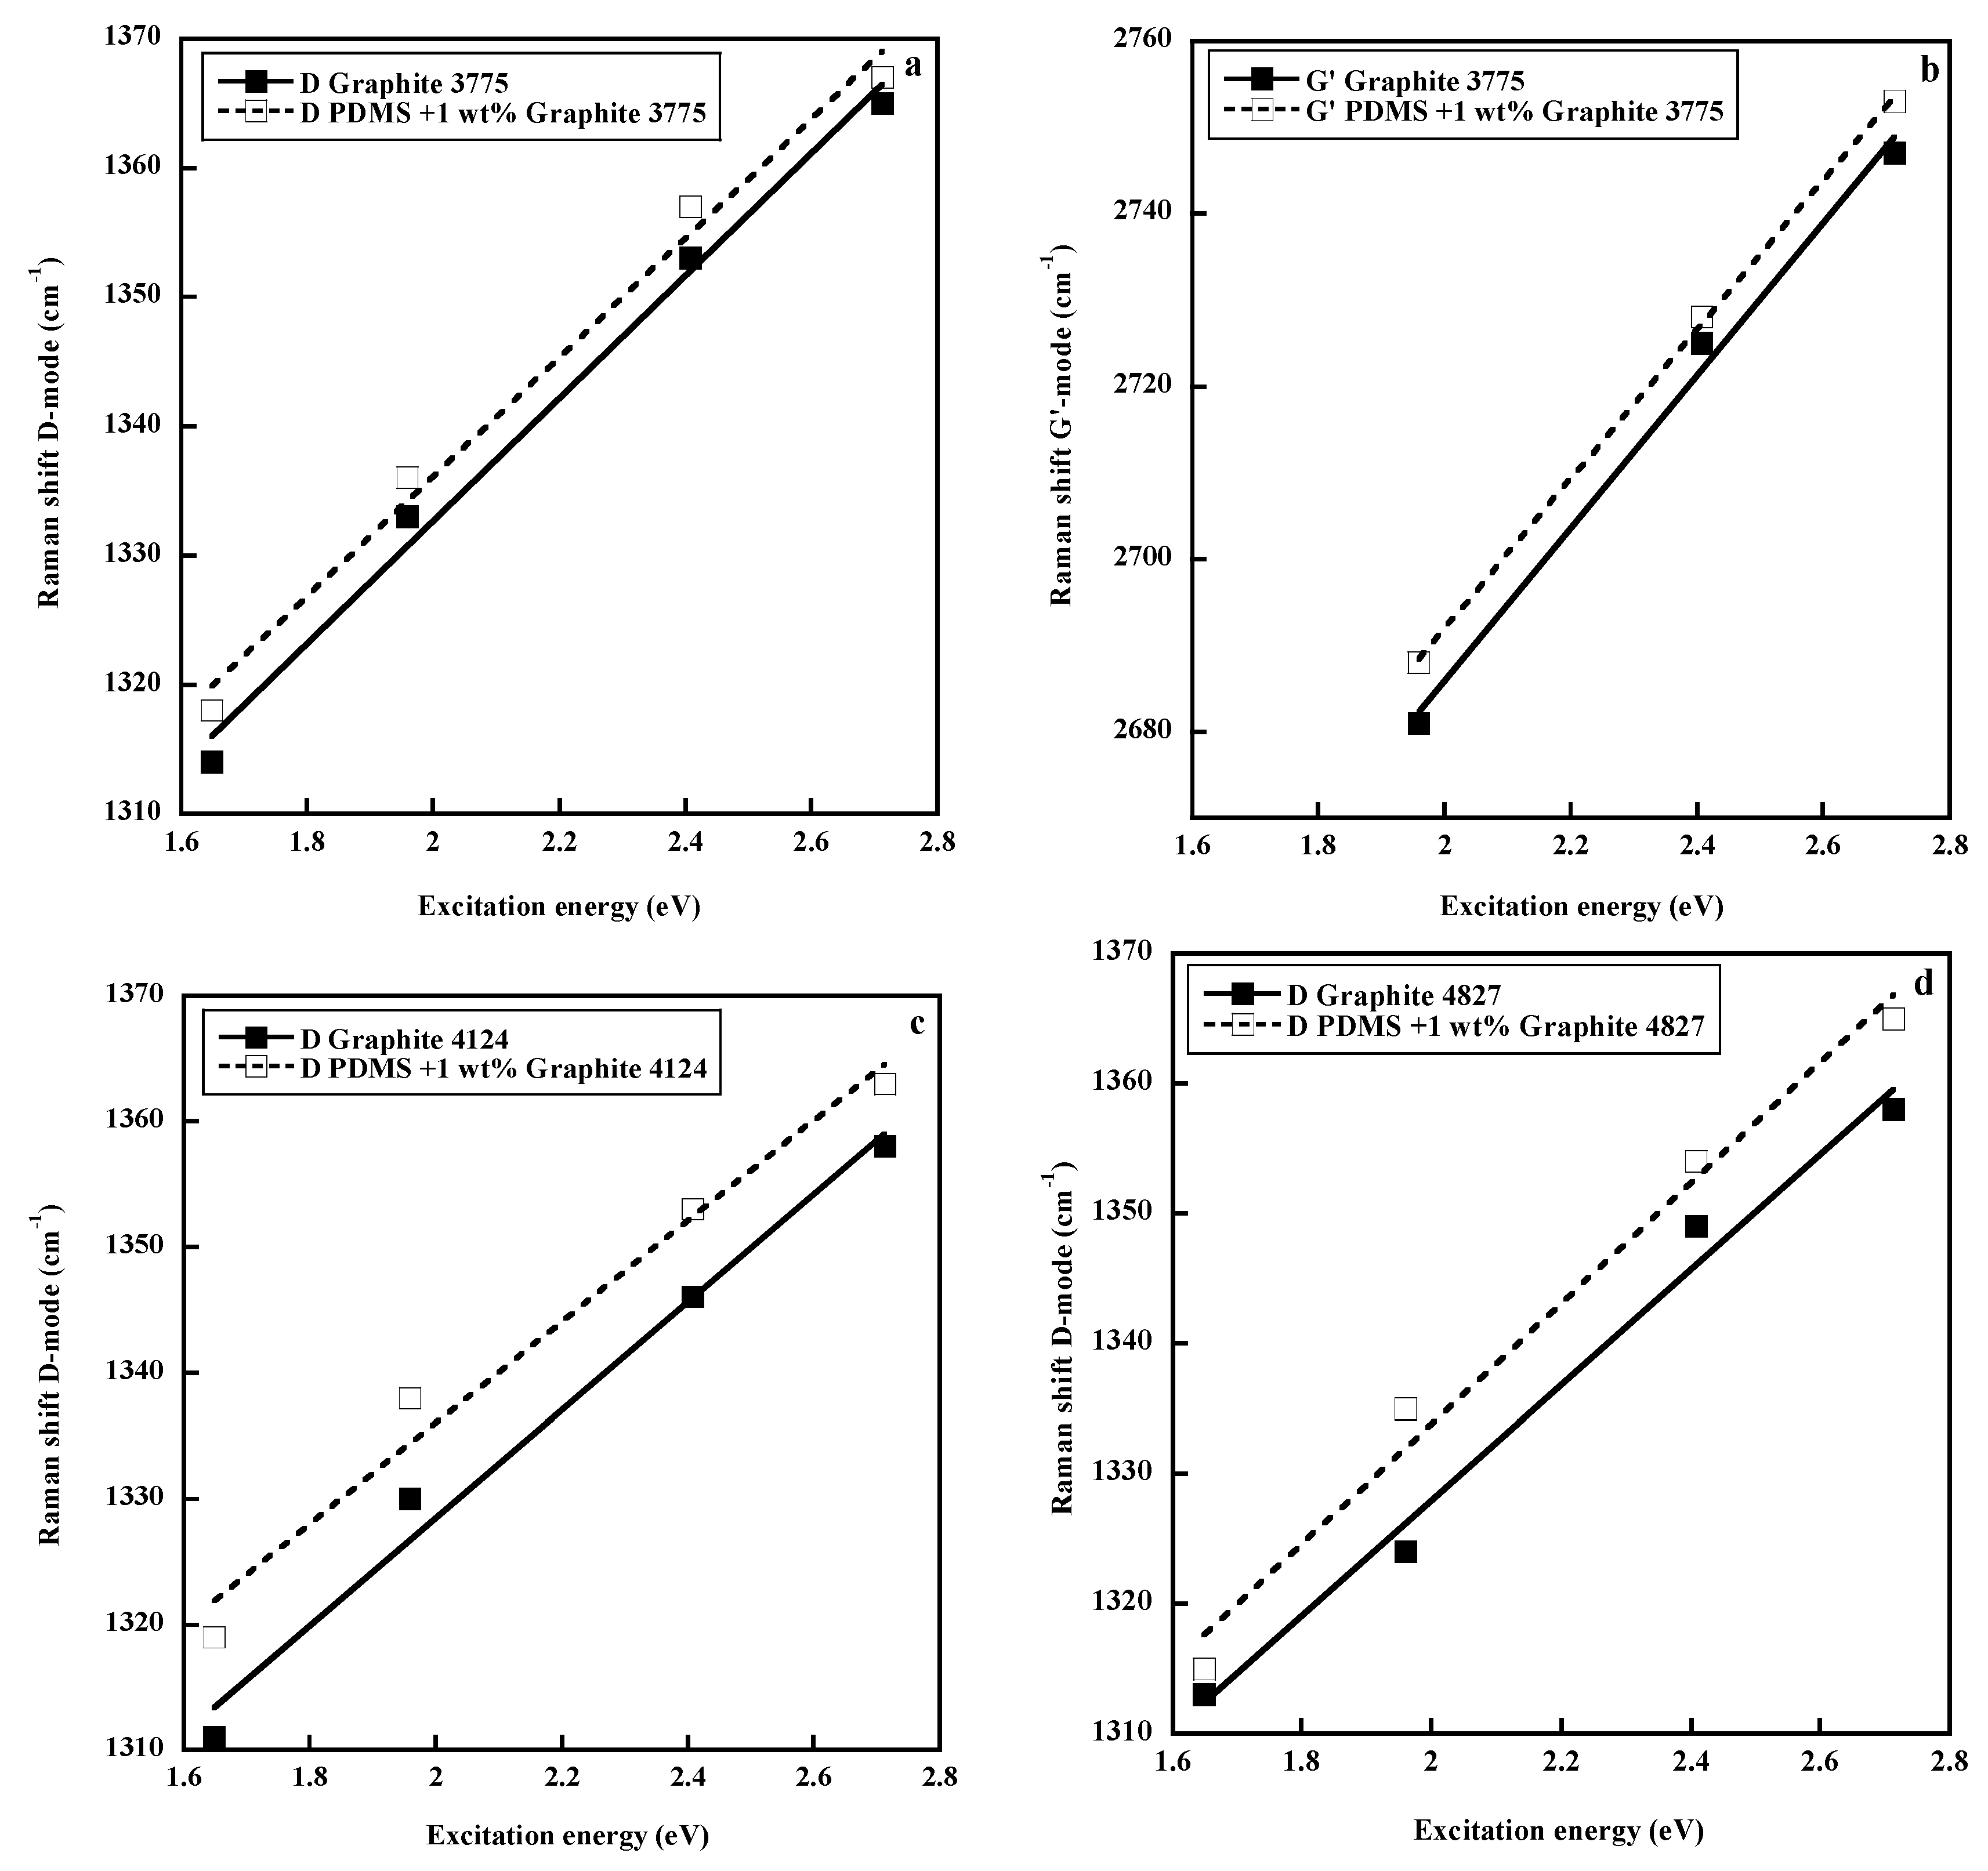
Frequency changes: As already explained, the dispersion of the frequencies of disorder induced modes follows the slope of the corresponding phonon branches [55]. Accordingly, no dispersion is observed for the D’ and 2D’ bands (flat LO branch), blue shifts are observed for the D, 2D(G’) and D + G bands (negative slope of the TO branch) and a red shift is observed for the D + D” band (the positive slope of the LA branch prevails over the negative slope of the TO branch [55]). No clear conclusion can be drawn for the D3 and D4 bands.
Finally, our results clearly show that the D and 2D bands are the most suited to study the dispersion of phonon modes in carbons. They are easily observed in all samples (excepted of course the D band in HOPG), and furthermore, their positions determined after spectral deconvolution closely match those observed directly on the experimental spectra (excepted the 2D band in GO and CB samples). This will be of great help for the interpretation of the Raman spectra of the composites, where the carbon spectrum is superimposed on that of the polymer. Our results obtained for the D and 2D(G’) bands are summarized in Table 1.

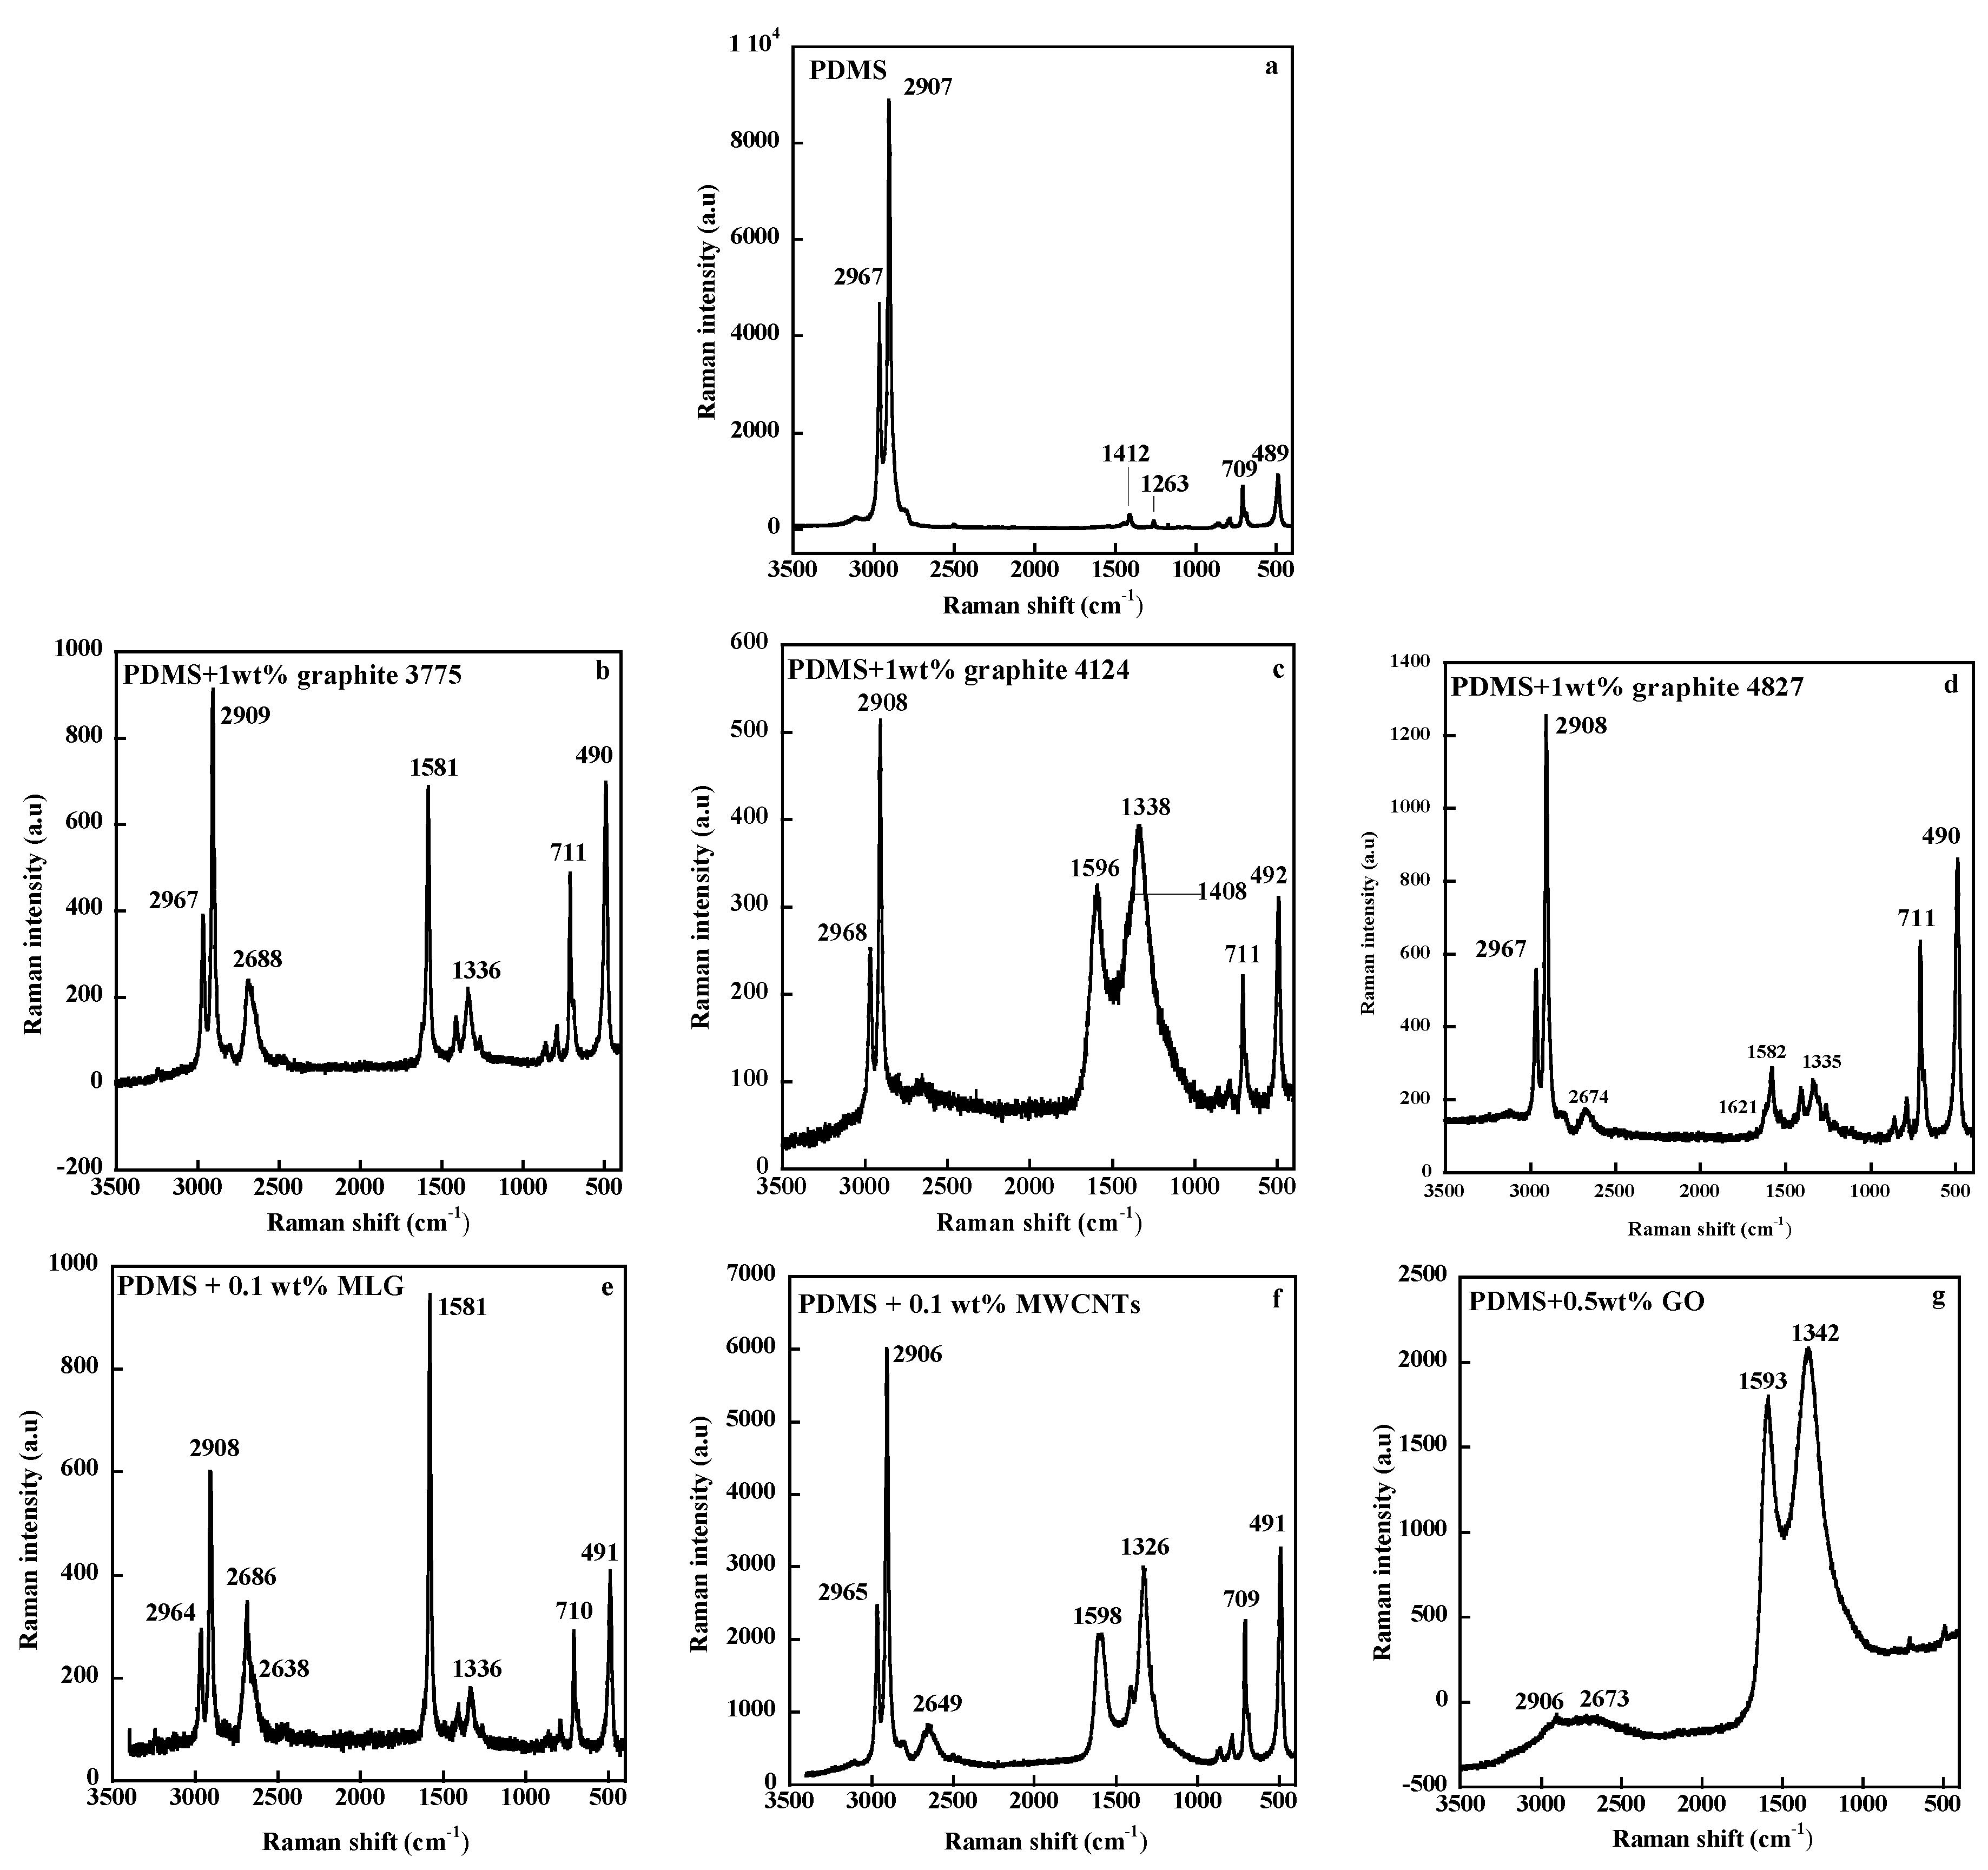
2.2. Raman Spectra of Silicone Composites

Silicone elastomers are an interesting class of materials and poly(dimethylsiloxane) (PDMS), with a repeat unit [–Si(CH3 )2 O–] is the most commonly used member of this class. PDMS is traditionally reinforced with silica in order to improve mechanical properties required in almost all commercial applications. The sol-gel process developed for the in situ generation of silica into PDMS has been shown to be the most efficient way to fill this type of elastomeric matrix on account of the uniformity of filler dispersion [56,57].
Surprisingly, PDMS has been shown to display an unexpected affinity for MWCNTs reflected by the spectacular increase in viscosity observed upon addition of carbon nanotubes to the unfilled PDMS, this increase in viscosity is much more important than that imparted by other anisotropic fillers such as layered or fibrous clays [58]. This unexpected affinity has been shown, through modeling studies, to be connected to strong CH–π interactions between the PDMS methyl groups and the π-electron-rich surface of the carbon nanotube. Of specific interest is the formation of an electrically conductive network at a MWCNT content less than 0.1 wt % and an improvement in mechanical properties much higher than that imparted by highly reinforcing silica’s at a same filler loading [35,36].
The Raman spectrum of the composite filled with 0.1 wt % of MWCNTs is represented in Figure 3 together with the Raman spectra of other PDMS composites. It is very difficult to fill the silicone matrix with higher filler contents on account of the strong increase in viscosity that hinders the cross-linking reaction. However, even at this very low filler loading, the bands of carbon nanotubes can be easily identified and are as for all the other carbon species, identical to those in the isolated state (except some frequency shift that will be discussed later), thus showing that their structural characteristics are essentially not affected when the carbon materials are embedded in the polymer matrix.
Figure 3. Raman spectra of unfilled PDMS (a) and of PDMS composites (bg) excited at 633 nm.
Carbon 01 00077 g003
As already mentioned, one crucial parameter in the extent of property improvement imparted by addition of filler in a polymeric matrix is the interfacial interaction between the organic and inorganic phases. This interfacial interaction has been investigated in the literature through Raman spectroscopy by looking at shifts of the Raman peaks when the composite is submitted to a uniaxial strain [59,60]. Linear downshifts have been found between peak shifts of the carbon material and the applied strain, the amplitude of the shift depending on the ability to transfer load from the matrix to the filler.
Our approach is to compare the dispersive behavior of the black fillers in the pure state and embedded in the silicone matrix because we expect that interfacial interactions will effect the electronic properties of the carbon species and thus the excitation energy-dependence of the D or G’ bands. For MWCNTs in the silicone matrix, a higher slope is obtained (54 cm−1/eV) with regard to that obtained for isolated MWCNTs (41 cm−1/eV)) (Figure 4g). This reflects an effect of the surrounding polymer on the electronic structure of the filler and suggests wrapping of the PDMS chains around the CNT surface making more efficient the CH–π interactions. The coating or wrapping process, considered as a general phenomenon occurring between polymers and carbon nanotubes [61] in CNT-filled silicones is very likely to happen on account of the high flexibility of PDMS chains.
Figure 4. Comparison between the dispersive behavior of fillers in the pure state and embedded in the silicone matrix. Data for (a,b) graphite 3775; (c,d) graphites of grade 4124 and 4827 respectively; (e) multilayer graphene, MLG; (f) graphene oxide, GO; (g) multiwall carbon nanotubes, MWCNTs. (e,g) Reproduced with permission from Bokobza et al., Vibrational Spectroscopy; published by Elsevier, 2014.
Carbon 01 00077 g004aCarbon 01 00077 g004b
For the other carbon nanomaterials (graphite, MLG and GO), their dispersive behavior (slope of the curve representing the wavenumber of the D or G’ bands against the excitation energy) in the silicone matrix is quite similar to that of the unembedded state (Figure 4a–f). This indicates that the interaction of PDMS with the filler surface seems to be poor. For the PDMS/MLG composite only the G’ band was investigated on account of the weak intensity of the D band (Figure 4e).
For each excitation wavelength, the wavenumber of the D (or G’) band of the filler in the composite is higher than that in the pure filler. It is interesting to mention that the shift to higher wavenumbers of the G’ band (represented as a typical example for the PDMS/Graphite 3775 composite) is about twice that of the D band (Figure 4b). According to the work of del Corro et al. [62] on the Raman modes of graphite under compressive stress, we explain the upshifts by compressive forces exerted by polymer chains on the filler surface. It has to be mentioned that the upshift of the D band is higher for the two graphite nano platelets GNPs, the upshift at 633 nm being 8 and 11 cm−1 for the GNPS 4124 and 4827, respectively. This may be related to their huge surface area (350 and 250 m2/g, respectively) allowing a large polymer-filler interface that makes more important confinement of polymer chains between filler particles and thus compressive effects. The effect of the high surface area of graphene nano platelets on the mechanical properties of the nanocomposites has been discussed by Ahmad et al. [63].
As mentioned already, graphene oxide (or graphite oxide) was expected to ensure, if well dispersed in polymeric matrices, strong interfacial adhesion with polymer chains through oxygen functionalities. In fact, the dispersive behavior of the D band in the composite is exactly the same of the pure filler (Figure 4f). This indicates poor interactions between graphene oxide and PDMS. This result has also been reached in other studies [64,65]. In an analysis of the viscoelastic behavior of graphite oxide-loaded PDMS suspensions, Guimont et al. [64] have shown that the presence of oxygen functions on the surface of graphene oxide leads to the agglomeration of graphite sheets. Moreover, it is demonstrated that the graphite oxide/PDMS suspensions show, unlike graphite and functionalized graphite oxide/PDMS suspensions, a drastic change in the viscoelastic properties associated with the formation of a filler network resulting from agglomeration on non-fractal graphite oxide sheets. Niu et al. [65] also conclude that hydrogen-bonding interaction between graphene oxide sheets is stronger than attractive interaction between GO and PDMS and that the network structure is formed by the aggregation of GO clusters. It is well known that a uniform dispersion should be achieved in the resulting composite in order to increase the interactions between the two phases decreasing simultaneously filler-filler interactions. This can only be done by forming a strong polymer-interface by modifying chemically the filler surface that may lead to a loss of integrity of the carbon species.

3. Experimental Section

3.1. Materials

HOPG is highly oriented pyrolytic graphite purchased from Carbone Lorraine, France.
Graphites of grade 3775, 4124 and 4827 have been kindly supplied by Asbury Carbons. Graphite 3775 is surface-enhanced flake graphite with a specific surface area of 24 m2·g−1 while graphites 4124 and 4827 are graphite nano-platelets (GNPs) powders that are fully graphitized products composed of nanometric graphite lamellae. Their specific areas are 350 and 250 m2·g−1 and the number of graphene layers is about 7–8 and 10–11, respectively.
Graphene powder (N006-P), consisting in multilayer graphene (MLG) with grain sizes of ~10–20 nm in thickness and approximate lateral dimensions of 14.0 μm and graphene oxide, GO, (N002-PDE product with single to few-layers), were purchased from Angstron Materials Inc., Dayton, OH, USA.
Multiwall carbon nanotubes (MWCNTs) were purchased from Nanocyl S.A. (Belgium). In this study, we have used the Nanocyl 7000 series (purity: 90%) produced via the catalytic carbon vapor deposition (CVD) process without any further purification. Their average diameter and length are around 10 nm and 1.5 μm, respectively, and their surface area are between 250 and 300 m2·g−1. The average dimensions provided by the supplier have been confirmed by transmission electron microscopy.
Carbon black (CB) (N330: surface area around 78 m2·g−1) was obtained from Cabot.
Hydroxyl-terminated PDMS (average molecular weight of 18,000 g·mol−1) was purchased from Gelest.

3.2. Synthesis of Silicone Rubber Composites

The unfilled network was prepared from the hydroxyl-terminated PDMS by an end-linking reaction with tetraethoxysilane (TEOS) as the cross-linking agent and stannous-2-ethyl-hexanoate as the catalyst. Theoretically, a stoichiometric balance between ethoxy groups of the tetrafunctional alkoxysilane cross-linker and the hydroxyl chain ends of the PDMS precursor chain, should lead to model networks in which the molecular weight Mc between cross-links is predetermined as well as the functionality of the cross-links (specifically 4). In fact, as reported in the literature, the end-linking reaction requires larger amounts of TEOS than the stoichiometric equivalent. In this study, an excess of TEOS of 50% with regard to the stoichiometric conditions, is used to ensure correct modulus and reasonable soluble fraction.
As already mentioned, nanotube dispersion in a host medium is really a challenge on account of the tendency of pristine tubes to assemble into bundles. It has been observed that homogeneous distributions of CNTs in the resulting material can be achieved by sonicating CNTs in a suitable solvent before incorporating the solution in the polymer. For the preparation of the PDMS/MWCNTs composite, the adequate amount of MWCNTs is dispersed in isopropyl alcohol by sonicating the suspension for 30 min using a Vibra-Cell VCX 500 operating at 40% amplitude with on and off cycles, respectively, equal to 4 and 2 seconds. After a rest of 30 min, the mixture is submitted to a further sonication for 30 min. PDMS is then mixed to the MWNTs suspension by agitation under magnetic stirring until total evaporation of the alcohol. The cross-linking agent and then the catalyst are incorporated and after further mixing for a few minutes, the mixture is slowly cast into a Teflon mold and left overnight at room temperature for complete curing.
For the composites prepared with MLG, GO and the various graphite’s, no ultrasonic treatments are required as recommended by the suppliers. The powders are directly dispersed in PDMS under magnetic stirring till obtaining a homogeneous mixture. Then curing reaction and film formation proceed as described above.

3.3. Raman Spectra

The Raman spectra were recorded in the backscattering geometry on a Labram HR (Jobin-Yvon, Horiba Group, France) micro spectrometer in conjunction with a confocal microscope. The experiments were carried out with different excitation wavelengths: 457 nm (2.71 eV), 514.5 nm (2.41 eV), 633 nm (1.96 eV) and 752 nm (1.65 eV) from an Ar–Kr ion laser except for the 633 nm obtained from a He–Ne laser with a spectral resolution, respectively, equal to 8, 6, 4 and 3 cm−1. The laser is focused on the sample by means of a 50× objective of 0.75 numerical aperture. The analyzed diameter is around 7 µm with a confocal hole of 500 µm with a beam intensity is less than 600 μW, acquisition time of 120 s and 3 accumulations. A low laser power is used in order to avoid overheating effects due to laser irradiation. Overheating effects induced by the laser power of the Raman experiment have been shown to cause changes to the Raman spectrum of CNTs and of other carbon materials except HOPG [31,32,66]. Increases of the incident laser power induce corresponding increases in the temperature of CNTs resulting in the shift to lower frequency of the Raman bands [31,32,66]. After changing the excitation wavelength and before recording the spectrum of a new sample, the calibration of the spectrometer is checked using the narrow Raman line of silicon at 521 cm−1. We proceeded to hand-made baseline corrections before deconvolutions of the spectra by means of the LabSpec 5 software.

4. Conclusions

Carbon nanomaterials that can be used as fillers in the synthesis of polymer nanocomposites on account of their outstanding electrical, mechanical and thermal properties, have been characterized by Raman spectroscopy.
Adhesion between nano fillers and polymers is also an important parameter in the extent of property improvement of the resulting composite. An original approach based on the analysis of the dispersive behavior of the carbonaceous filler in the pure state and embedded in a silicone matrix has been developed to evaluate the quality of the polymer-filler interface. The results show poor interfacial adhesion between all the carbon nanomaterials-based composites except for the PDMS/MWCNTs where it is supposed that wrapping of the tubes by the polymer chains makes possible CH–π interactions between the methyl groups of PDMS and the π-electron of the carbon nanotube. The Raman spectrum of graphene oxide reveals a high level of disorder as a result of defects generated by the oxidation process. Interactions between graphene oxide sheets seem more important than between the filler and the polymer matrix.

Acknowledgments

The authors are very thankful to Patricia Beaunier (Laboratoire de Réactivité de Surface, UPMC Université Paris 6, UMR 7197-CNRS, 3 rue Galilée, 94200 Ivry, France) for the TEM images of the multilayer graphene and to Albert V. Tamashausky (Asbury Carbons PO Box 144, 405 Old Main Street, Asbury, NJ 08802, USA) for supplying the graphite materials.

Author Contributions

Liliane Bokobza prepared the composites filled with the various carbon materials; Jean-Luc Bruneel carried out all the Raman measurements; Liliane Bokobza analyzed the data and wrote the paper; and Michel Couzi brought all his expertise and advice in Raman spectroscopy of carbons.

Conflicts of Interest

The authors declare no conflict of interest.

References

  1. Rigbi, Z. Reinforcement of rubber by carbon black. Adv. Polym. Sci. 1980, 36, 21–68. [Google Scholar]
  2. Donnet, J.-B.; Vidal, A. Carbon black: Surface properties and interactions with elastomers. Adv. Polym. Sci. 1986, 76, 103–127. [Google Scholar]
  3. Donnet, J.-B. Black and white fillers and tire compounds. Rubber Chem. Technol. 1998, 71, 323–341. [Google Scholar] [CrossRef]
  4. Voet, A. Reinforcement of elastomers by fillers: Review of period 1967–1976. J. Polym. Sci. Macromol. Rev. 1980, 15, 327–373. [Google Scholar] [CrossRef]
  5. Bokobza, L. Elastomeric composites based on nanospherical particles and carbon nanotubes: A comparative study. Rubber Chem. Technol. 2013, 86, 423–448. [Google Scholar] [CrossRef]
  6. Maiti, M.; Bhattacharya, M.; Bhowmick, A.K. Elastomer nanocomposites. Rubber Chem. Technol. 2008, 81, 384–469. [Google Scholar] [CrossRef]
  7. Papageorgiou, D.G.; Kinloch, I.A.; Young, R.J. Graphene/elastomer nanocomposites. Carbon 2015, 95, 460–484. [Google Scholar] [CrossRef]
  8. Schön, F.; Gronski, W. Filler networking of silica and organoclay in Rubber composites: Reinforcement and dynamic-mechanical properties. Kautsch. Gummi Kunstst. 2003, 56, 166–171. [Google Scholar]
  9. Ramorino, G.; Bignotti, F.; Pandini, S.; Riccò, T. Mechanical Reinforcement in natural rubber/organoclay nanocomposites. Compos. Sci. Technol. 2009, 69, 1206–1211. [Google Scholar] [CrossRef]
  10. Galimberti, M.; Coombs, M.; Cipolletti, V.; Riccio, P.; Riccò, T.; Pandini, S.; Conzatti, L. Enhancement of mechanical reinforcement due to hybrid filler networking promoted by an organoclay in hydrocarbon-based nanocomposites. Appl. Clay Sci. 2012, 65–66, 57–66. [Google Scholar] [CrossRef]
  11. Galimberti, M.; Coombs, M.; Riccio, P.; Riccò, T.; Passera, S.; Pandini, S.; Conzatti, L.; Ravasio, A.; Tritto, I. The role of CNTs in promoting hybrid filler networking and synergism with carbon black in the mechanical behavior of filled polyisoprene. Macromol. Mater. Eng. 2013, 298, 241–251. [Google Scholar] [CrossRef]
  12. Bokobza, L. Enhanced electrical and mechanical properties of multiwall carbon nanotube rubber composites. Polym. Adv. Technol. 2012, 23, 1543–1549. [Google Scholar] [CrossRef]
  13. Moniruzzaman, M.; Winey, K.I. Polymer nanocomposites containing carbon nanotubes. Macromolecules 2006, 39, 5194–5205. [Google Scholar] [CrossRef]
  14. Bokobza, L. Multiwall carbon nanotube elastomeric composites: A review. Polymer 2007, 48, 4907–4920. [Google Scholar] [CrossRef]
  15. Kuilla, T.; Bhadra, S.; Yao, D.; Kim, N.H.; Bose, S.; Lee, J.H. Recent advances in graphene based polymer composites. Prog. Polym. Sci. 2010, 35, 1350–1375. [Google Scholar] [CrossRef]
  16. Kim, H.; Abdala, A.A.; Macosko, C.W. Graphene/Polymer nanocomposites. Macromolecules 2010, 43, 6515–6530. [Google Scholar] [CrossRef]
  17. Potts, J.R.; Dreyer, D.R.; Bielawski, C.W.; Ruoff, R.S. Graphene-based polymer nanocomposites. Polymer 2011, 52, 5–25. [Google Scholar] [CrossRef]
  18. Singh, V.; Joung, D.; Zhai, L.; Das, S.; Khondaker, S.I.; Seal, S. Graphene-based materials: Past, present and future. Prog. Mater. Sci. 2011, 56, 1178–1271. [Google Scholar] [CrossRef]
  19. Kim, H.; Macosko, C.W. Processing-property relationships of polycarbonate/graphene composites. Polymer 2009, 50, 3797–3809. [Google Scholar] [CrossRef]
  20. Liao, K.-H.; Qian, Y.; Macosko, C. Ultralow percolation graphene/polyurethane acrylate nanocomposites. Polymer 2012, 53, 3756–3761. [Google Scholar] [CrossRef]
  21. Song, W.-L.; Veca, L.M.; Kong, C.Y.; Ghose, S.; Connell, J.W.; Wang, P.; Cao, L.; Lin, Y.; Meziani, M.J.; Qian, H.; et al. Polymeric nanocomposites with graphene sheets—Materials and device for superior thermal transport properties. Polymer 2012, 53, 3910–3916. [Google Scholar] [CrossRef]
  22. Scognamillo, S.; Gioffredi, E.; Piccini, M.; Lazzari, M.; Alzari, V.; Nuvoli, D.; Sanna, R.; Piga, D.; Malucelli, G.; Mariani, A. Synthesis and characterization of thermoplastic polyurethane with both graphene and graphene nanoribbon fillers. Polymer 2012, 53, 4019–4024. [Google Scholar] [CrossRef]
  23. Bhattacharyya, A.; Chen, S.; Zhu, M. Graphene reinforced ultra high molecular weight polyethylene with improved tensile strength and creep resistance properties. Express Polym. Lett. 2014, 8, 74–84. [Google Scholar] [CrossRef]
  24. Syurik, J.; Alyabyeva, N.; Alekseev, A.; Ageev, O.A. AFM-based model of percolation in graphene-based nanocomposites. Compos. Sci. Technol. 2014, 95, 38–43. [Google Scholar] [CrossRef]
  25. Hu, H.; Zhao, L.; Liu, J.; Cheng, J.; Luo, J.; Liang, Y.; Tao, Y.; Wang, X.; Zhao, J. Enhanced dispersion of carbon nanotube in silicone rubber assisted by graphene. Polymer 2012, 53, 3378–3385. [Google Scholar] [CrossRef]
  26. Hernández, M.; del Mar Bernal, M.; Verdejo, R.; Ezquerra, T.A.; López-Manchado, M.A. Overall performance of natural rubber/graphene nanocomposites. Compos. Sci. Technol. 2012, 73, 40–46. [Google Scholar] [CrossRef]
  27. Araby, S.; Zaman, I.; Meng, Q.; Kawashima, N.; Michelmore, A.; Kuan, H.-C.; Majewski, P.; Ma, J.; Zhang, L. Melt compounding with graphene to develop functional, high performance elastomers. Nanotechnology 2013, 24. [Google Scholar] [CrossRef] [PubMed]
  28. Araby, S.; Zhang, L.; Kuan, H.-C.; Dai, J.-B.; Majewski, P.; Ma, J. A novel approach to electrically and thermally conductive elastomers using graphene. Polymer 2013, 54, 3663–3670. [Google Scholar] [CrossRef]
  29. Mao, Y.; Wen, S.; Chen, Y.; Zhang, F.; Panine, P.; Chan, T.W.; Zhang, L.; Liang, Y.; Liu, L. High performance graphene oxide based rubber composites. Sci. Rep. 2013, 3. [Google Scholar] [CrossRef] [PubMed]
  30. Stanier, D.C.; Patil, A.J.; Sriwong, C.; Rahatekar, S.S.; Ciambella, J. The reinforcement effect of exfoliated graphene oxide nanoplatelets on the mechanical and viscoelastic properties of natural rubber. Compos. Sci. Technol. 2014, 95, 59–66. [Google Scholar] [CrossRef]
  31. Bokobza, L.; Zhang, J. Raman spectroscopic characterization of multiwall carbon nanotubes and of composites. Express Polym. Lett. 2012, 6, 601–608. [Google Scholar] [CrossRef]
  32. Bokobza, L.; Bruneel, J.-L.; Couzi, M. Raman spectroscopic investigations of carbon-based materials and their composites. Comparison between carbon nanotubes and carbon black. Chem. Phys. Lett. 2013, 590, 153–159. [Google Scholar] [CrossRef]
  33. Bokobza, L.; Garnaud, G.; Beaunier, P.; Bruneel, J.-L. Vibrational and electrical investigations of a unuaxially stretched polystyrene/carbon nanotube composite. Vib. Spectrosc. 2013, 67, 6–13. [Google Scholar] [CrossRef]
  34. Bokobza, L.; Bruneel, J.-L.; Couzi, M. Raman spectroscopy as a tool for the analysis of carbon-based materials (highly oriented pyrolitic graphite, multilayer graphene and multiwall carbon nanotubes) and of some of their elastomeric composites. Vib. Spectrosc. 2014, 74, 57–63. [Google Scholar] [CrossRef]
  35. Bokobza, L. Some issues in rubber nanocomposites: New opportunities for silicone materials. Viewpoint. Silicon 2009, 1, 141–145. [Google Scholar] [CrossRef]
  36. Bokobza, L.; Rahmani, M. Carbon nanotubes: Exceptional reinforcing fillers for silicon rubbers. Kautsch. Gummi Kunstst. 2009, 62, 112–117. [Google Scholar]
  37. Ferrari, A.C.; Meyer, J.C.; Scardaci, V.; Casiraghi, C.; Lazzeri, M.; Mauri, F.; Piscanec, S.; Jiang, D.; Novoselov, K.S.; Roth, S.; et al. Raman spectrum of graphene and graphene layers. Phys. Rev. Lett. 2006, 97. [Google Scholar] [CrossRef] [PubMed]
  38. Ferrari, A.C.; Basko, D.M. Raman spectroscopy as a versatile tool for studying the properties of graphene. Nat. Nanotechnol. 2013, 8, 235–246. [Google Scholar] [CrossRef] [PubMed]
  39. Jorio, A. Raman spectroscopy in graphene-based systems: Prototypes for nanoscience and nanometrology. Int. Sch. Res. Netw. 2012. [Google Scholar] [CrossRef]
  40. May, P.; Lazzeri, M.; Venezuela, P.; Herziger, F.; Callsen, G.; Reparaz, J.S.; Hoffmann, A.; Mauri, F.; Maultzsch, J. Signature of the two-dimensional dispersion in graphene probed by double-resonant Raman scattering. Phys. Rev. B 2013, 87. [Google Scholar] [CrossRef]
  41. Maultzch, J.; Reich, S.; Thomsen, C. Raman scattering in carbon nanotubes revisited. Phys. Rev. B 2002, 65. [Google Scholar] [CrossRef]
  42. Saito, R.; Grüneis, A.; Samsonidze, G.G.; Brar, V.W.; Dresselhaus, G.; Dresselhaus, M.S.; Jorio, A.; Cançado, L.G.; Fantini, C.; Pimenta, M.A.; et al. Double resonance Raman spectroscopy of single-wall carbon nanotubes. New J. Phys. 2003, 5. [Google Scholar] [CrossRef]
  43. Jorio, A.; Pimenta, M.A.; Souza Filho, A.G.; Saito, R.; Dresselhaus, G.; Dresselhaus, M.S. Characterizing carbon nanotube samples with resonance Raman scattering. New J. Phys. 2003, 5. [Google Scholar] [CrossRef]
  44. Graupner, R. Raman spectroscopy of covalently functionalized single-wall carbon nanotubes. J. Raman Spectrosc. 2007, 38, 673–683. [Google Scholar] [CrossRef]
  45. Tuinstra, F.; Koenig, J.L. Raman spectra of graphite. J. Chem. Phys. 1970, 53, 1126–1130. [Google Scholar] [CrossRef]
  46. Matthews, M.J.; Pimenta, M.A.; Dresselhaus, G.; Dresselhaus, M.S.; Endo, M. Origin of dispersive effects of the Raman D band in carbon materials. Phys. Rev. B 1999, 59, R6585–R6588. [Google Scholar] [CrossRef]
  47. Sadezky, A.; Muckenhuber, H.; Grothe, H.; Niessner, R.; Pöschl, U. Raman spectroscopy of soot and related carbonaceous materials: Spectral analysis and structural information. Carbon 2005, 43, 1731–1742. [Google Scholar] [CrossRef]
  48. Pawlyta, M.; Rouzaud, J.N.; Duber, S. Raman microspectroscopy characterization of carbon black: Spectral analysis and structural information. Carbon 2015, 84, 479–490. [Google Scholar] [CrossRef]
  49. Saito, A.; Hofmann, M.; Dresselhaus, G.; Jorio, A.; Dresselhaus, M.S. Raman scattering of graphene and carbon nanotubes. Adv. Phys. 2011, 60, 413–550. [Google Scholar] [CrossRef]
  50. Santangelo, S.; Messina, G.; Faggio, G.; Lanza, M.; Milone, C. Evaluation of crystalline perfection degree of multi-walled carbon nanotubes: Correlations between thermal kinetic analysis and micro-Raman spectroscopy. J. Raman Spectrosc. 2011, 42, 593–602. [Google Scholar] [CrossRef]
  51. He, H.; Klinowski, J.; Forster, M.; Lerf, A. A new structural model for graphite oxide. Chem. Phys. Lett. 1998, 287, 53–56. [Google Scholar] [CrossRef]
  52. Lerf, A.; He, H.; Forster, M.; Klinowski, J. Structure of graphite oxide revisited. J. Phys. Chem. B 1998, 102, 4477–4482. [Google Scholar] [CrossRef]
  53. Xu, L.; Cheng, L. Graphite oxide under high pressure: A Raman spectroscopic study. J. Nanomater. 2013. [Google Scholar] [CrossRef]
  54. Kim, H.J.; Lee, S.-M.; Oh, Y.-S.; Yang, Y.-H.; Lim, Y.S.; Yoon, D.Y.; Lee, C.; Kim, J.-Y.; Ruoff, R.S. Unoxidized graphene/alimina nanocomposite: Fracture- and wear-resistance effects of graphene on alumina matrix. Sci. Rep. 2014, 4. [Google Scholar] [CrossRef]
  55. Mohr, M.; Maultzsch, J.; Dobardzic, E.; Milosevic, I.; Damnjanovic, M.; Bosak, A.; Krish, M.; Thomsen, C. Phonon dispersion of graphite by inelastic x-ray scattering. Phys. Rev. B 2007, 76. [Google Scholar] [CrossRef]
  56. Dewimille, L.; Bresson, B.; Bokobza, L. Synthesis, structure and morphology of poly(dimethylsiloxane) networks filled with in situ generated silica particles. Polymer 2005, 46, 4135–4143. [Google Scholar] [CrossRef]
  57. Bokobza, L.; Diop, A.L. Reinforcement of poly(dimethylsiloxane) by sol-gel in situ generated silica and titania particles. Express Polym. Lett. 2010, 4, 355–363. [Google Scholar] [CrossRef]
  58. Beigbeder, A.; Linares, M.; Devalckenaere, M.; Degée, P.; Claes, M.; Beljonne, D.; Lazzaroni, R.; Dubois, P. CH-π Interactions as the driving force for silicone-based nanocomposites with exceptional properties. Adv. Mater. 2008, 20, 1003–1007. [Google Scholar] [CrossRef]
  59. Cooper, C.A.; Young, R.J.; Halsall, M. Investigation into the deformation of carbon nanotubes and their composites through the use of Raman spectroscopy. Compos. A 2001, 32, 401–411. [Google Scholar] [CrossRef]
  60. Frogley, M.D.; Ravich, D.; Wagner, H.D. Mechanical properties of carbon nanoparticle-reinforced elastomers. Compos. Sci. Technol. 2003, 63, 1647–1654. [Google Scholar] [CrossRef]
  61. Baskaran, D.; Mays, J.W.; Bratcher, M.S. Noncovalent and nonspecific molecular interactions of polymers with multiwalled carbon nanotubes. Chem. Mater. 2005, 17, 3389–3397. [Google Scholar] [CrossRef]
  62. Del Corro, E.; Otero de la Roza, A.; Taravillo, M.; Baonza, V. Raman modes and Grüneisen parameters of graphite under compressive biaxial stress. Carbon 2012, 50, 4600–4606. [Google Scholar] [CrossRef]
  63. Ahmad, S.R.; Young, R.J.; Kinloch, I.A. Raman spectra and mechanical properties of graphene/polypropylene nanocomposites. Int. J. Chem. Eng. Appl. 2015, 6, 1–5. [Google Scholar]
  64. Guimont, A.; Beyou, E.; Martin, G.; Sontag, P.; Cassagnau, P. Viscoelasticity of graphite oxide-based suspensions in PDMS. Macromolecules 2011, 44, 3893–3900. [Google Scholar] [CrossRef]
  65. Niu, R.; Gong, J.; Xu, D.; Tang, T.; Sun, Z.-Y. Influence of molecular weight of polymer matrix on the structure and rheological properties of graphene oxide/polydimethylsiloxane composites. Polymer 2014, 55, 5445–5453. [Google Scholar] [CrossRef]
  66. Huang, F.; Yue, K.T.; Tan, P.; Zhang, S.-L.; Shi, Z.; Zhou, X.; Gu, Z. Temperature dependence of the Raman spectra of carbon nanotubes. J. Appl. Phys. 1998, 84, 4022–4024. [Google Scholar] [CrossRef]

