Determining the Effect of Inlet Flow Conditions on the Thermal Efficiency of a Flat Plate Solar Collector


1
Energy 2050 Group, Department of Mechanical Engineering, University of Sheffield, Western Bank, Sheffield S10 2TN, UK
2
Department of Mechanical Engineering, Majmaah University, Al Majma’ah, 11952 Riyadh, Saudi Arabia
3
Department of Mechanical Engineering, University of Strathclyde, Glasgow G1 1XQ, UK
*
Author to whom correspondence should be addressed.
Fluids 2018, 3(3), 67; https://doi.org/10.3390/fluids3030067
Submission received: 30 July 2018
/
Revised: 7 September 2018
/
Accepted: 12 September 2018
/
Published: 17 September 2018
(This article belongs to the Special Issue Ventilation and Passive Cooling for Healthy and Comfortable Buildings)
Abstract
:The main objective of this study was to investigate the effect of inlet temperature (Tin) and flowrate () on thermal efficiency of flat plate collectors (FPC). Computational Fluid Dynamics (CFD) was employed to simulate a FPC and the results were validated with experimental data from literature. The FPC was examined for high and low level flowrates and for inlet temperatures which varied from 298 to 373 K. Thermal efficiency of 93% and 65% was achieved at 298 K and 370 K inlet temperature’s respectively. A maximum temperature increase of 62 K in the inlet temperature was achieved at a flowrate of 5 × 10⁻⁴ kg/s inside the riser pipe. Tin and were optimised in order to achieve the minimum required feed temperature for a 10 kW absorption chiller.
1. Introduction
In response to the need for alternative energy sources, solar cooling technologies have become an important factor especially in hot countries due to the amount of solar radiation and the need for cooling. Solar cooling systems, which include solar collectors, storage tanks and chillers, are more environmentally friendly compared to conventional cooling systems [1]. The number of worldwide solar cooling systems in 2014 was estimated to be 1200 projects [2]. The worldwide installed capacity of solar thermal collectors was 409 GW in 2014 while it was 50 GW for installed photovoltaic collectors in 2015 [3].
The overall thermal efficiency of solar absorption cooling systems is significantly low. Experimentally, the thermal efficiency of a flat plate collector (FPC) coupled with an absorption chiller is 0.27, which restricts the coefficient of performance of the solar cooling system (SCOP) significantly to 0.06 [4]. Bellos et al. (2016) reported that the thermal efficiency of the collector was 0.42 and SCOP was 0.31. The authors highlighted that the optimum driven temperature for FPC and single absorption chiller was 378 K (105 °C) [5]. Minimising the heat source temperature in solar absorption cooling systems leads to maximising the overall efficiency of solar cooling systems [5,6,7,8].
The performance of the solar collector is highly affected by ambient temperature, inlet temperature and solar radiation. Previous research in FPCs focused on heating applications but have not made substantial progress for cooling systems. In solar heating systems, inlet temperatures were in the range of ambient temperature in most of the research in this field [9].
Table 1 shows the thermal efficiency of flat plate solar collectors that are employed in solar cooling systems. Table 1 shows that the maximum thermal efficiency in the theoretical and simulation studies of FPC with sustainable cooling systems was 55%. However, operation conditions for the collectors were not optimized; therefore, this will be considered in this study in order to increase thermal efficiency of FPC with single absorption chiller.
A sufficient thermal efficiency of solar collectors could be achieved in the range of 60 to 80 °C outlet temperature. The opportunity to utilise the outlet water temperature of the FPC for cooling systems such as absorption cooling systems, adsorption-cooling systems and desiccant cooling systems has not been investigated for different ranges of inlet temperature and flowrate. As an example, the inlet temperature range (driven temperature) for the small capacity of single absorption chillers was in the range of 75 to 90 °C [17].
Mathematical methods were employed to calculate solar collector efficiency in order to be used as an input parameter in transient system software or analytical methods for solar cooling systems [5,18]. In most research, thermal efficiency was calculated without taking into account the flowrate of the solar collector, which affects the accuracy of the overall evaluation of the solar cooling system. Transient software such as TRNSYS has been used widely in order to maximize cooling production of the solar absorption system or selecting the optimum type of absorption chiller [11,12,14,19,20]. From previous studies in solar cooling systems, there is no study optimised inlet temperature and flowrate of FPC in accordance with the minimum driving temperature. In addition, there is no study optimised FPC parameters using a 3-D CFD model for a specified outlet temperature.
Zhang et al. [21] investigated the performance of FPC experimentally using the results to validate a mathematical method to calculate thermal performance of FPC collectors. The geometry of the collector was 2 m in length, 1 m in width and 0.065 in thickness. The authors highlighted that the mass flow rate is a key factor that affected the performance and outlet temperature. The ambient temperature was 15.5 to 23.9 °C. The inlet temperature was 21.1 to 45.1 °C while the outlet temperature was in the range of 37 to 55.4 °C. The average thermal efficiency was 51.4%. The authors concluded that thermal efficiency, outlet water temperature and heat transfer effectiveness were affected significantly by the flowrate. The heat removal factor did not change when the flowrate exceed 0.1 kg/s. With regards to thermal efficiency and outlet temperature, the recommended water flowrate was 0.06–0.08 kg/s.
A large number of works employed the CFD technique to enhance the performance of solar collectors. Selmi et al. [22] established a CFD model for FPC to study the performance with and without flow circulation. The maximum outlet temperature was 327 K for a flowrate of 0.0014 kg/s with temperature increased by 9 K. Villar et al. [23] developed a numerical finite volume model for flat plate collectors (10 riser) in order to study the flow and thermal behaviour of the collector. The study showed that the outlet temperature of each riser was mostly the same for a uniform flow. Martinopoulos et al. (2010) developed a CFD model of a polymer solar collector in order to study the performance [24]. The study highlighted that including body and buoyancy force was important for large computational domain. The behaviour of the heat transfer was also investigated in order to enhance the performance for polymer solar collector using a CFD technique. It was highlighted that the buoyancy and gravity effect need to be considered in the momentum equation for inclined solar collectors. Thermal efficiency increased with the increase in the uniformity of the flow and temperature distribution [25]. Laminar and turbulent flow were considered to predict outlet temperature for a parabolic trough collector. ANSYS FLUENT (version 16.1) was employed with a heat flux boundary condition on the absorber tube. Inlet temperature was in the range of 30.5 to 54 °C while the maximum increased was 10.5 °C [26].
Rangababu et al. [27] investigated FPC to improve thermal efficiency. The author highlighted that thermal efficiency could be improved by changing the parameters of the geometry or working fluid properties. They developed a CFD model with a heat flux boundary condition on the top and assumed other sides of the collector as fully insulated. Mixed radiation model was applied on the cover glass. Outlet water temperature was validated to analytical and experimental data with an error of 30% and 20% respectively. They reported an increase in the collector efficiency by 22% by using CuO nano fluid compared to water.
This study presents a 3-D CFD model for a FPC in order to predict the outlet temperature and calculate thermal efficiency accurately. The output from the CFD model is utilised to establish new efficiency curves and equations to calculate thermal efficiency for FPC at low and high level flowrate in order to generalize the results in this study for other conditions. Inlet temperature and flowrate were optimised for the highest thermal efficiency in accordance with the minimum absorption cooling driving temperature currently available in the market in order to increase the coefficient of performance of solar cooling absorption systems (SCOP).
2. Model Description
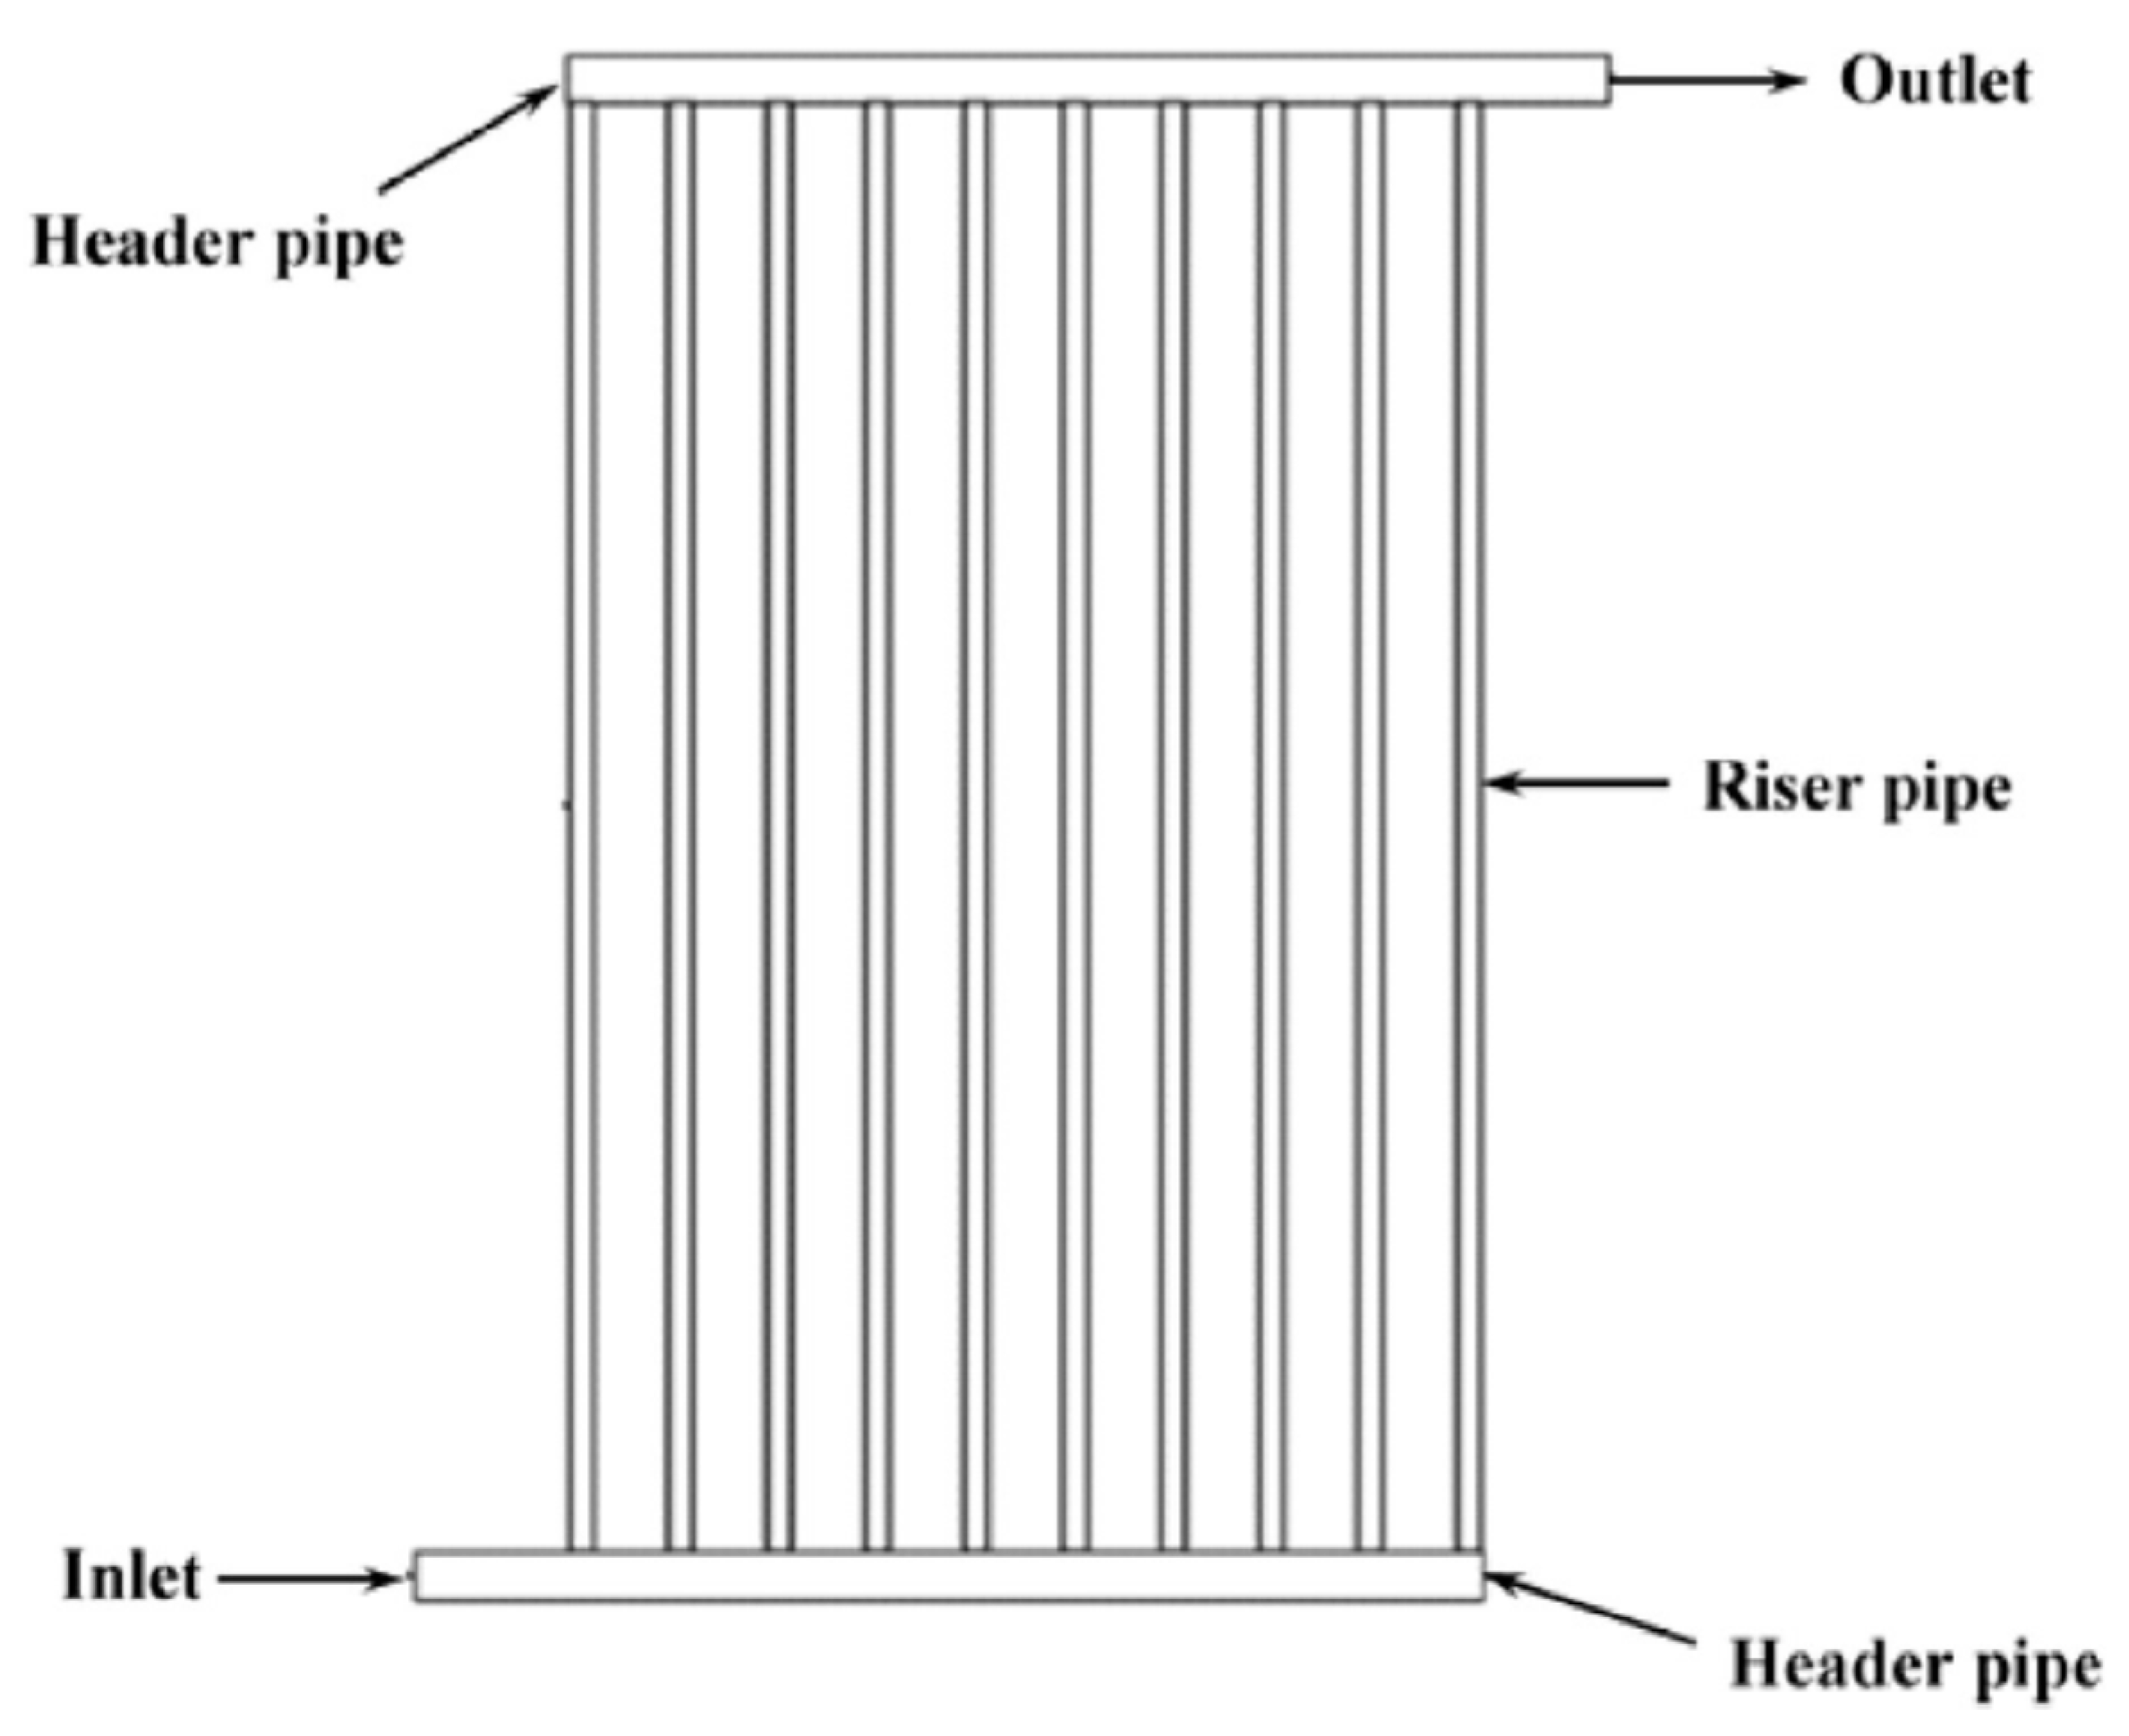
Solar collectors such as flat plate collectors (FPC) convert solar radiation to useful thermal energy and can be designed to transfer energy to fluid up to a level of 100 °C above the ambient temperature. The absorber plate is the main component of the FPC. It transfers the absorbed energy to a fluid, which moves through a pipe or duct system. FPCs configurations include front cover and back insulation to reduce heat losses from the collector [28,29]. Figure 1 illustrates a schematic diagram of a FPC.
2.1. Governing Equations
The main governing equations that represent the conservation law of physics for fluid flow are conservation of mass (continuity equations), Newton’s second law and the first law of thermodynamics.
The flow through each side of the control volume according to [30] is approximately one-dimensional flow. Therefore, the outlet mass flow on x direction is equal to the inlet flow plus the change in flow through x direction . Since the inlet and outlet were on the same level (horizontal) and the diameter of the flow domain inside the riser was small, body and buoyancy force were not taking into account. Applying conservation of mass on the three directions of the control volume with the same approach provide the following relations, which is known by the continuity equation:
As stated by Newton‘s second law for a fluid particle, the rate of change of momentum equals the summation of forces acting on the particle [31]. The rates of change of x, y and z-momentum per unit volume can be written as:
Body forces and surface forces are the two types of forces acting on fluid particles. The momentum is represented by considering that the rate of change of momentum is equal to the summation of forces in the same direction [30].
The first law of thermodynamics represents the energy change in an element by the net flux in plus the rate of work done on the element. Energy equation can be represented in the following form [32]:
where is the effective conductivity, is the diffusion flux j, energy transfer by conduction, species diffusion, viscous dissipation and heat sources.
Energy equation in static solid zones is represented as in Equation (4) [32]:
where is the density, h is sensible enthalpy, k = conductivity and Sh is volumetric heat source.
2.2. System Performance
Thermal efficiency of the FPC is calculated by the following expression:
where: is mass flowrate of the coolant; Cp is the specific heat of the coolant, kJ/(kg K); is the collector area, m2; Ti is the inlet temperature of the coolant, K; To is the outlet temperature of the coolant, K; and G is the incidence solar irradiance normal to the surface, W/m2 [33,34].
Another efficiency indicator is the coefficient of performance (COP) which calculates the ratio of the cooling energy need (usually represent the energy removed from the zone and absorbed by the evaporator) to the energy absorbed by the solar collector and is written as [35]:
2.3. Boundary Conditions
CFD was employed to solve fluid flow and heat transfer equations for FPC. ANSYS-FLUENT applies conservation law and integrates the governing equations (continuity, momentum and energy equations) over all the control volumes at solid and fluid zones for the FPC. Three-dimensional CFD model was presented in order to determine the performance of the FPC. Total energy absorbed by the absorber () was determined based on the global solar radiation (G), glass transmissivity (τ) and the absorptivity of the plate (α) [28].
Constant heat flux was applied on the top of the absorber plate whereas the fully insulated boundary condition was applied to the other surfaces that contact with the surroundings. A convective boundary condition was applied on the bottom layers and the convective heat transfer coefficient (h = 2.8 + 3Vw) was determined based on [36,37]. Mass weighted average method in FLUENT was used to predict fluid temperature with respect to the variation of the velocity across the pipe. Table 2 showed the boundary conditions in this study.
2.4. Geometry Description
A benchmark model was selected based on experimental geometry from literature [37]. The FPC was characterised by an absorber plate with 1.65 m length, 1 m width and 0.0005 m thickness, riser copper pipes along the absorber plate with 0.0125 m diameter, and glass wool insulation with 0.04 m. The distance between riser pipes is 0.1125 m and the pipes were located under the bottom surface of the absorber plate as in Figure 2.
3. Grid Independence
A grid independence study was carried out on the computational domain, which consisted of an absorber plate, riser pipe and water inside the pipe. Numerical sensitivity tests were applied on the outlet fluid temperature and the average temperature of the absorber plate. As in Figure 3, the difference between simulation results decreased by increasing the number of elements in the mesh domain. For both outlet water temperature and the temperature of the plate, the results for 126,768 and 204,881 elements were approximately the same. Therefore, a mesh size of 126,768 was chosen for the simulation to reduce the computational time.
4. Model Validation
The outlet fluid temperature of the FPC in this study was used as a performance indicator and is compared to the experiment in Gunjo et al. [37]. Figure 4 shows that outlet water temperature in this study followed the same trend of the experiment with a relative error of 0.47 to 1.5%. The validation in this study showed less relative error to predict outlet temperature compared to the literature [27,37].
The effect of inlet flowrate on thermal efficiency, outlet fluid temperature and the temperature rise was studied. All parameters such as solar radiation (G = 1000 W/m2), ambient temperature (Tamb = 298 K) and inlet temperature (Tin = 298 K if it is not specified) were taken as constant input parameters. The maximum flowrate to keep the flow at laminar regime is 0.0225 kg/s (Re = 2300) which is the maximum flowrate (in each riser) in this investigation. The effect of flowrate on the performance of the FPC was investigated at Low-Level (Tin = 298 K) and High-Level (Tin =370 K) inlet temperature. The significant impact of the mass flowrate on the performance occurred at the range of 5 × 10⁻⁴ to 60 × 10−4 kg/s inside each riser pipe.
5. Results and Discussion
The validated CFD model was used to determine the effect of flowrate on the performance of FPC at High and Low-Level of inlet temperature. Inlet temperature was investigated at high and low levels of flowrate. The effect of flowrate on the thermal efficiency was investigated in accordance with the minimum absorption cooling feed temperature.
5.1. Effect of Flowrate on FPC Performance at High and Low Level of Inlet Temperature
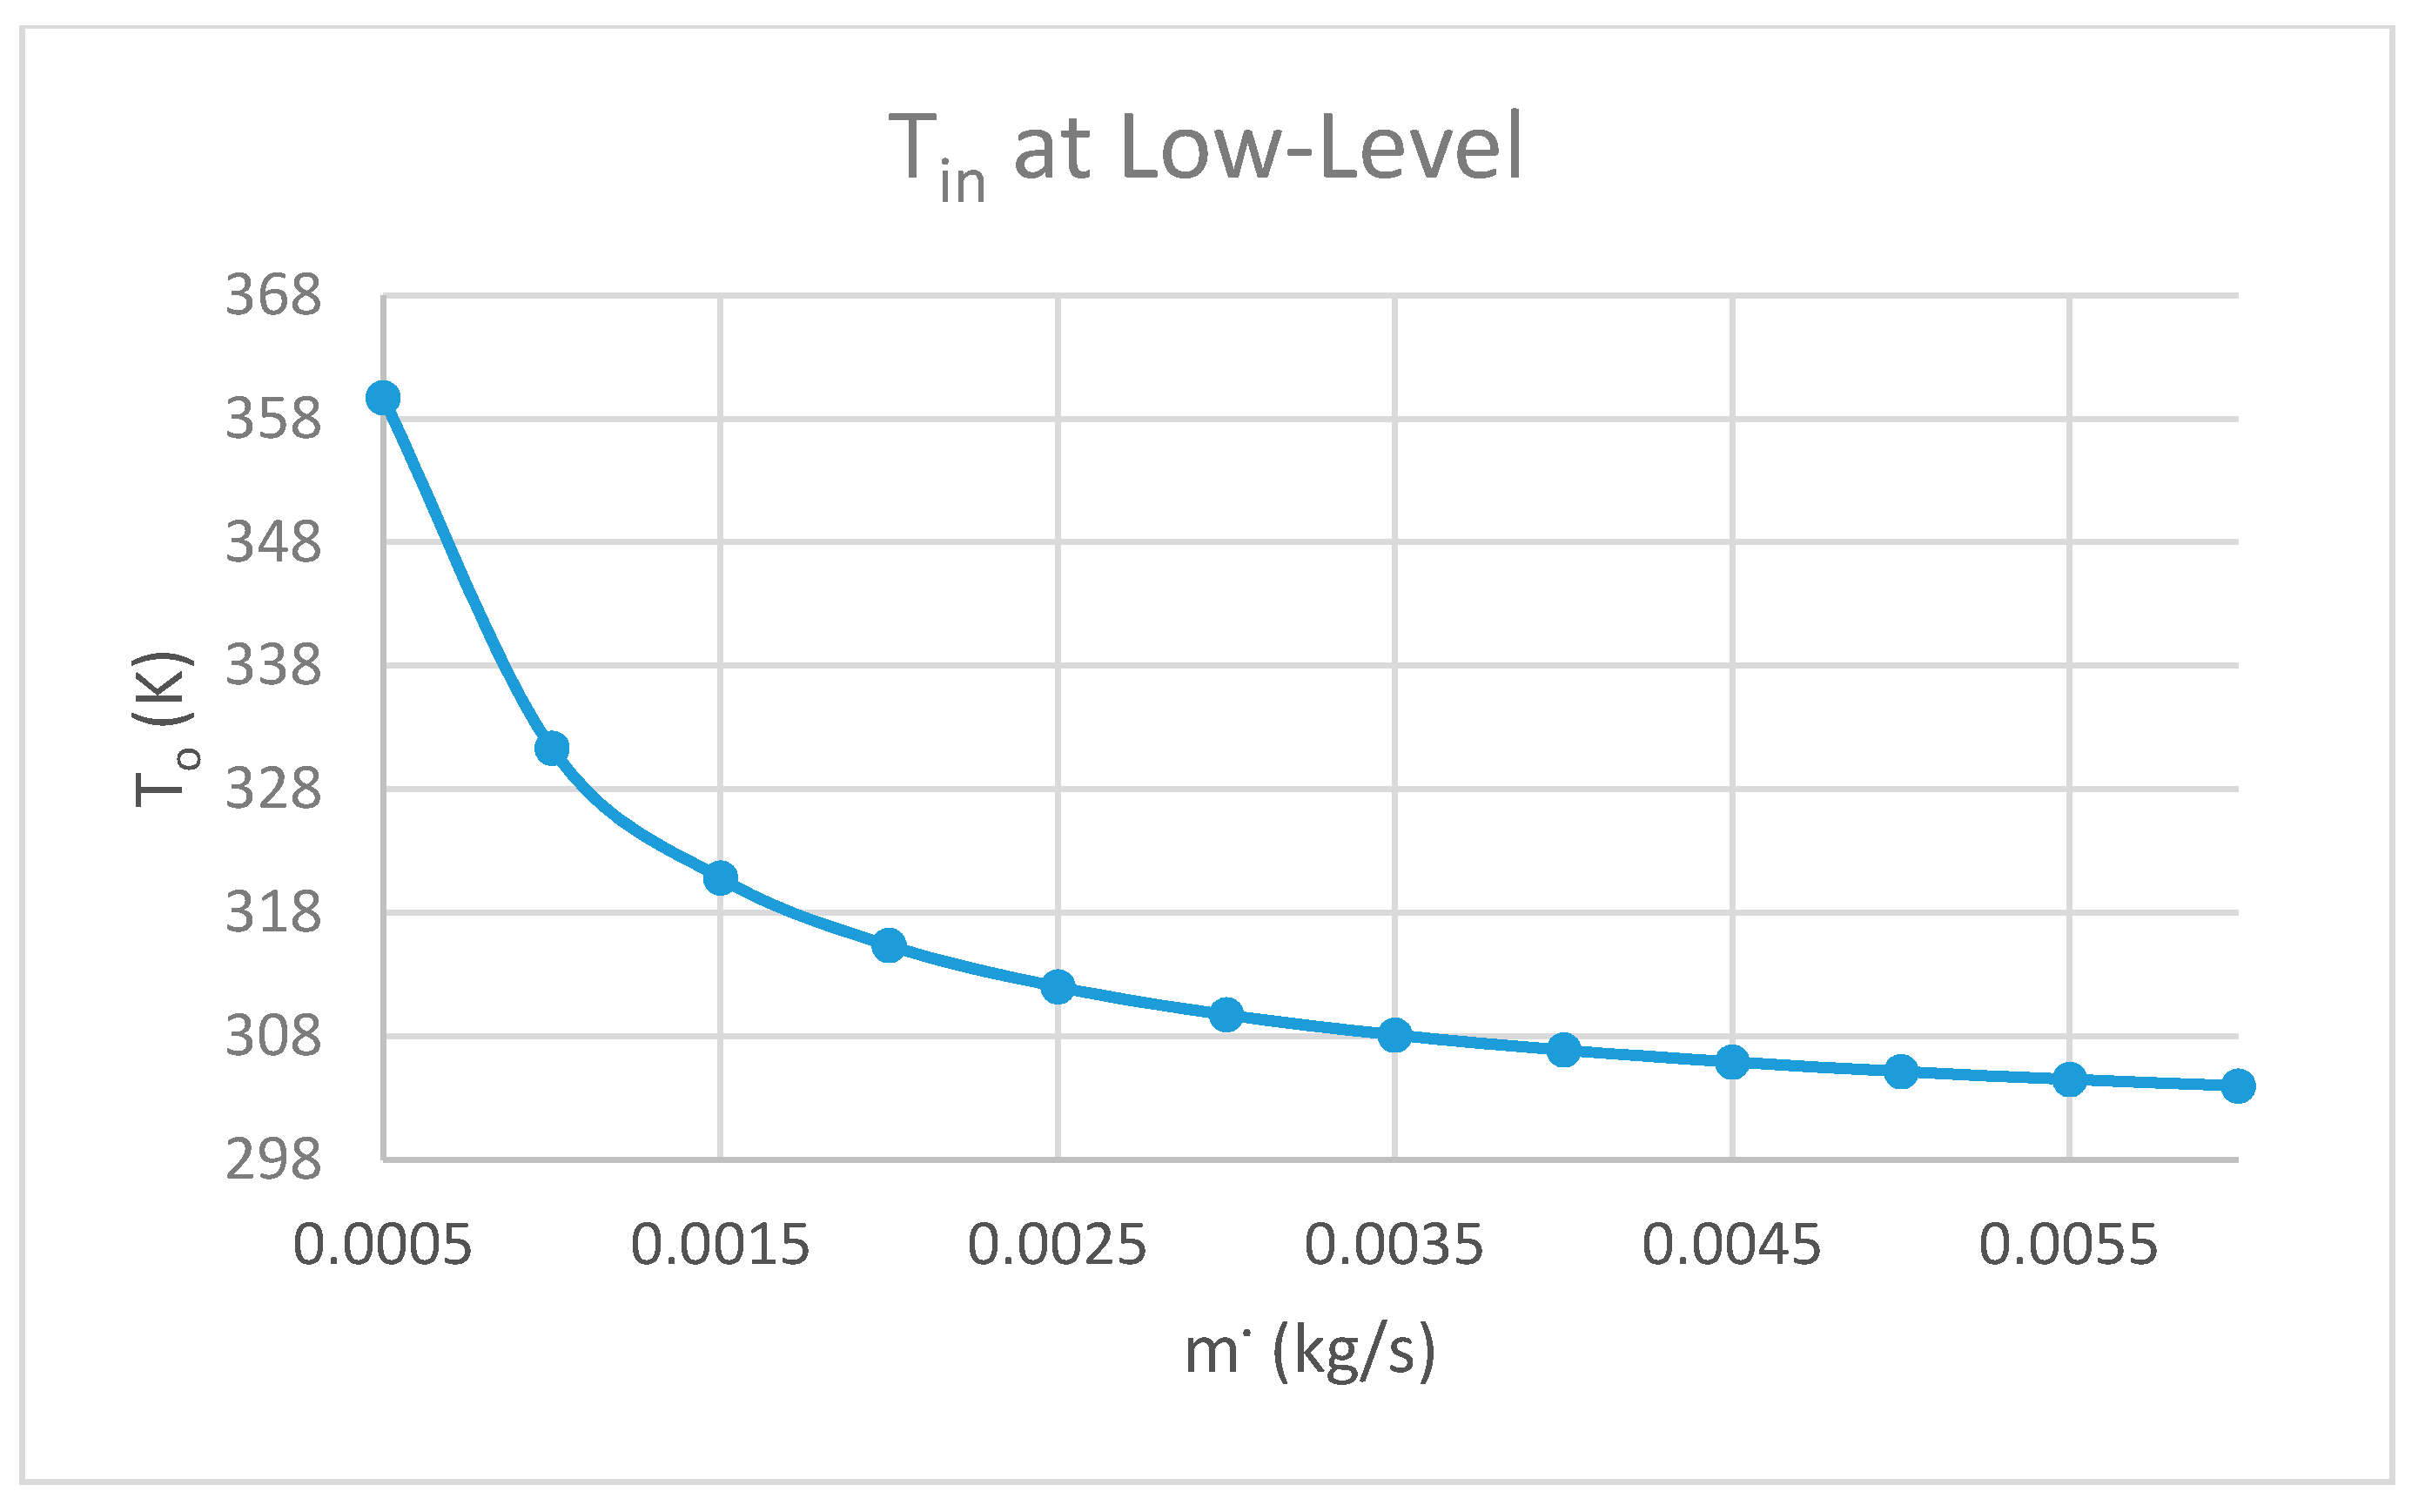
Figure 5 illustrates the effect of inlet flowrate on the outlet water temperature at Low-Level inlet temperature. Both outlet water temperature and gradient decreased with the increase in flowrate due to a high temperature difference between the absorber plate and the bulk temperature inside the fluid domain, which leads to higher heat transfer (Tp − Tf). Outlet water temperature decreased significantly for 38 K with changing flow rate from 5 × 10⁻⁴ to 15 × 10−4 kg/s. The effect of flowrate on To decreased to 10 K by increasing flowrate from 15 × 10−4 to 25 × 10−4 kg/s and 4.5 K from 25 × 10−4 to 35 × 10−4 kg/s respectively. The effect of flowrate on To then decreased to 2.5 K by increasing flowrate from 35 × 10−4 to 45 × 10−4 kg/s and less than 1.75 K for the same change in flowrate below 45 × 10−4 kg/s.
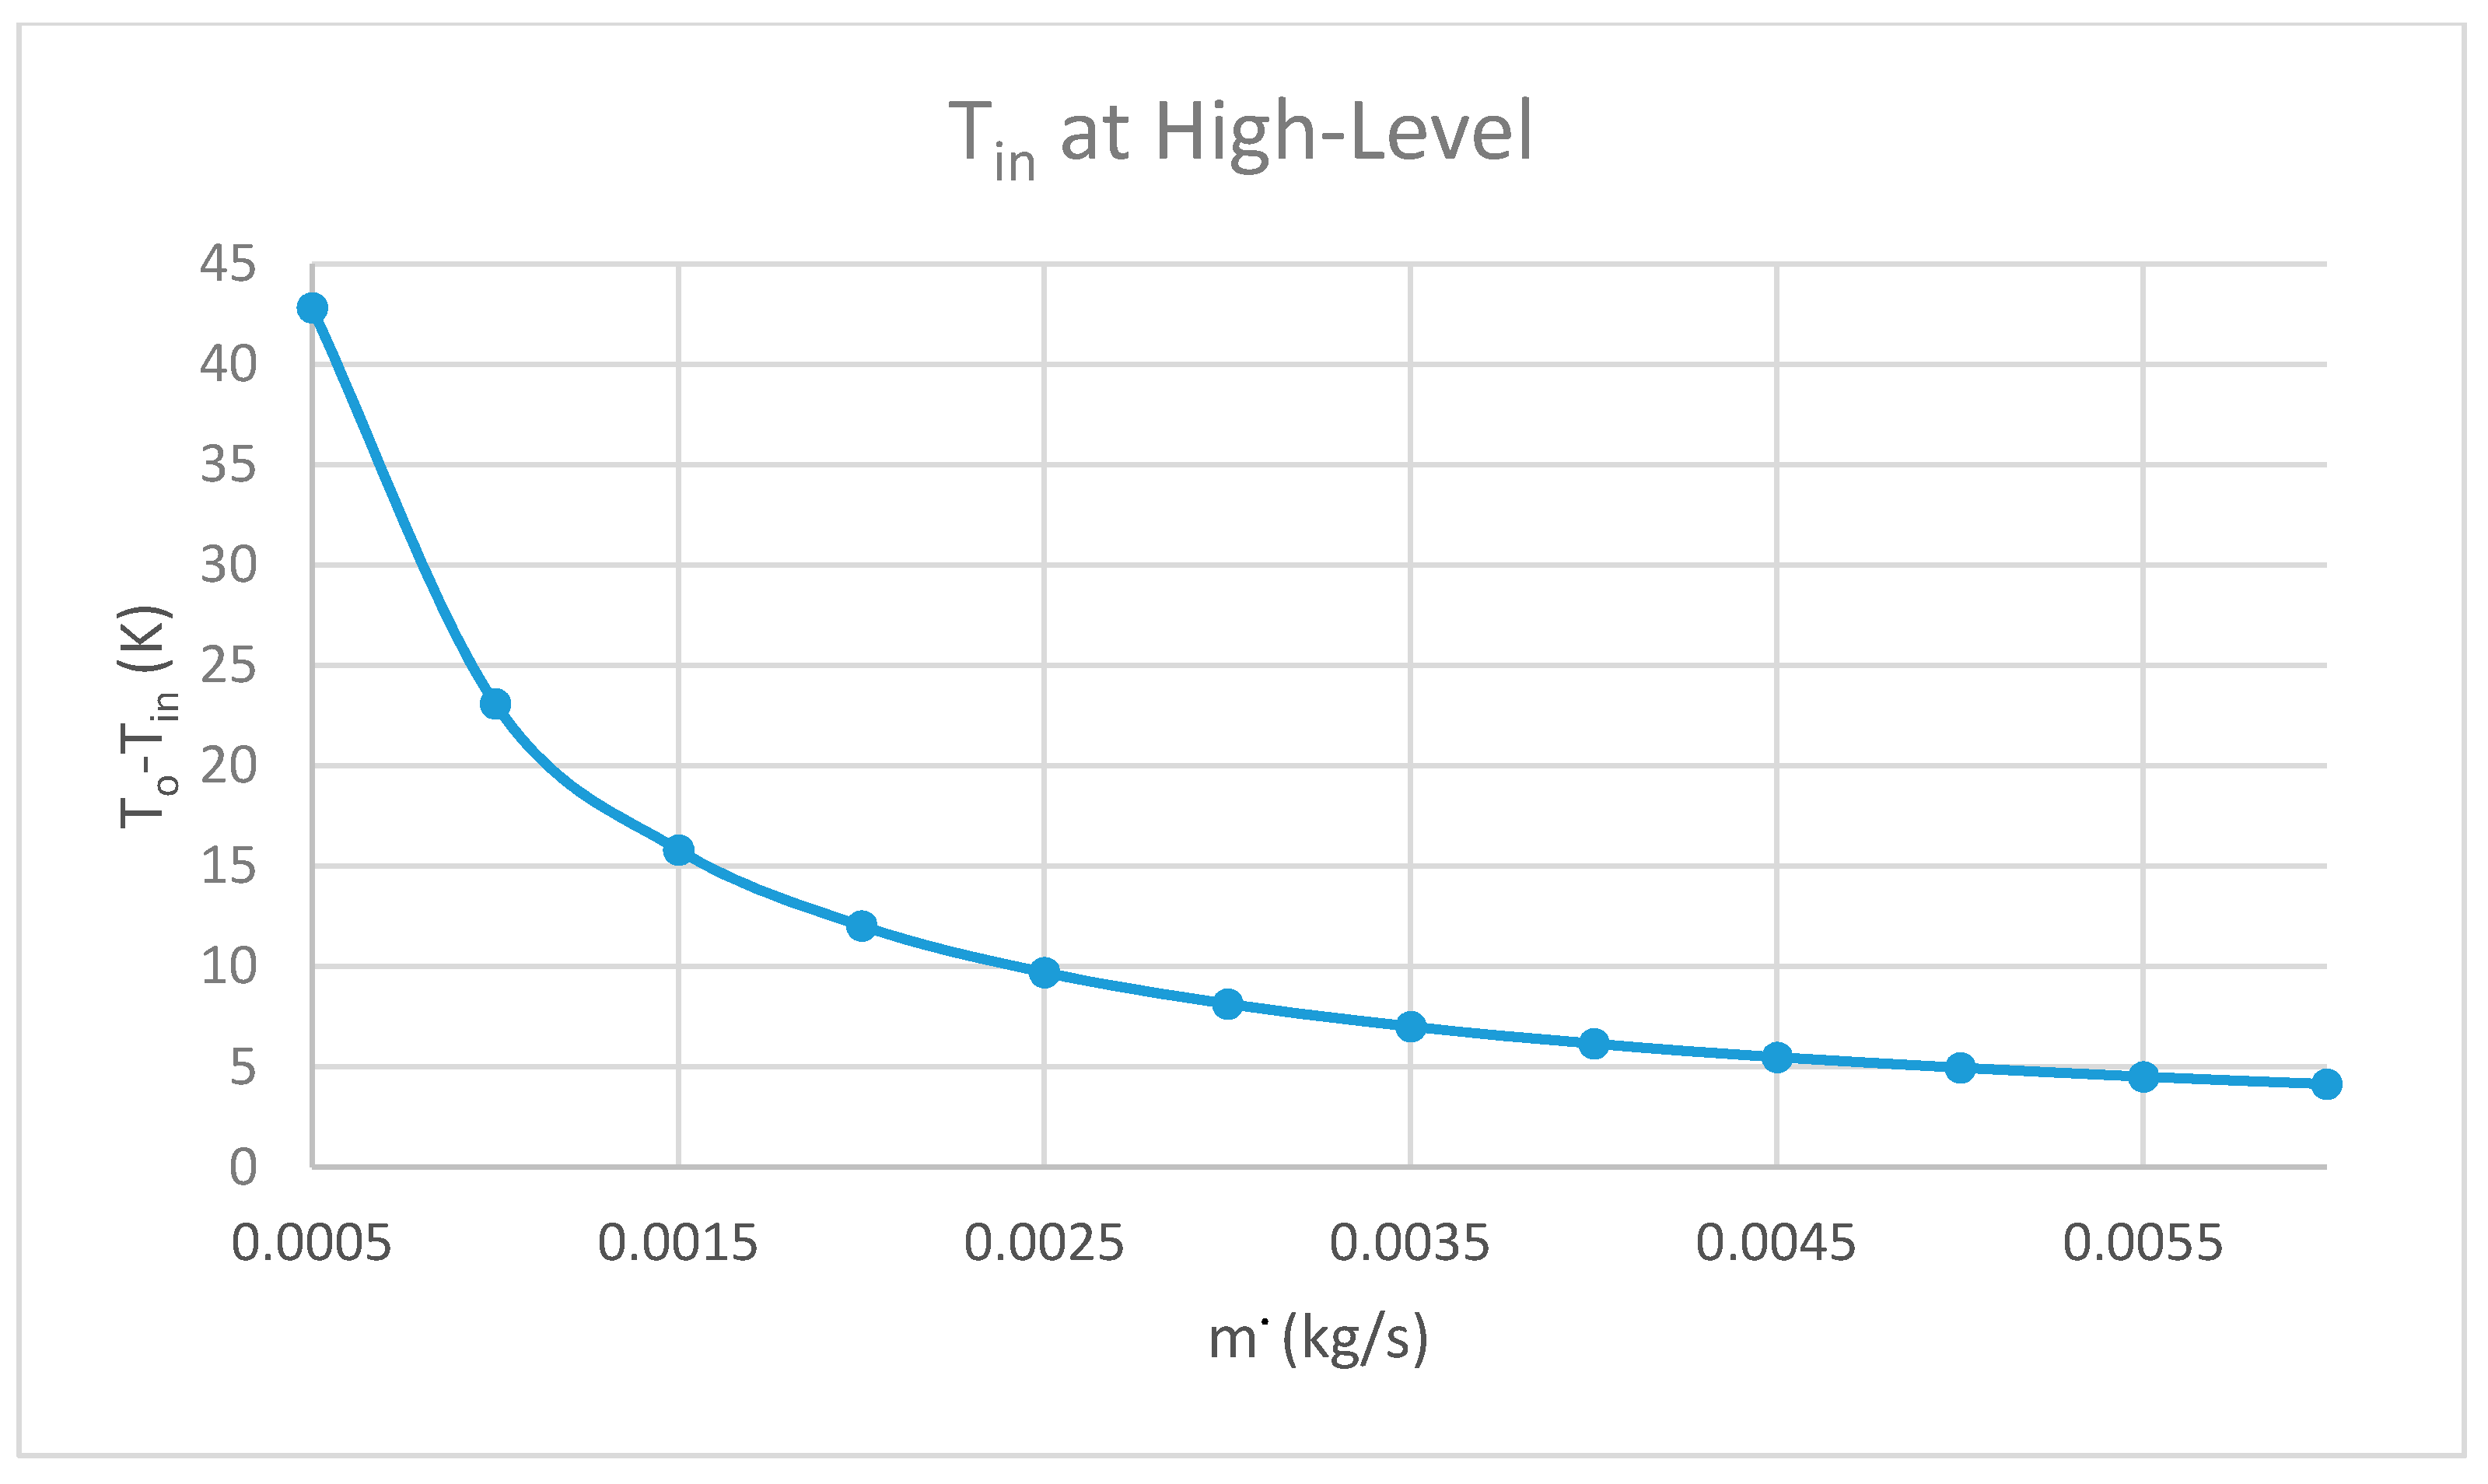
Figure 6 illustrates the effect of inlet flowrate on the outlet water temperature at High-level inlet temperature. As in the Low-Level inlet temperature, both outlet water temperature and the gradient were decreased with increasing flowrate inside the riser tube. Outlet water temperature decreased significantly for 27 K with changing flow rate from 5 × 10⁻⁴ to 15 × 10−4 kg/s but less than the decrease at Low-Level inlet temperature. The effect of flowrate on To decreased to 7 K by increasing flowrate from 15 × 10−4 to 25 × 10−4 kg/s and 3 K from 25 × 10−4 to 35 × 10−4 kg/s respectively. The effect of flowrate on To then decreased to 1.3 K by increasing flowrate from 35 × 10−4 to 45 × 10−4 kg/s and less than 1.2 K for the same change in flowrate below 45 × 10−4 kg/s.
The gradient of outlet water temperature decreased with the increase in flowrate, due to the decrease in the contact time between the fluid and the pipe, which leads to a reduction of heat transfer.
Figure 7 shows the impact of flow rate on the variation in outlet water temperature for a range of flow rates for both High and Low-level inlet temperatures.
A maximum increase in (To − Tin) of 62 K occurred at the minimum flowrate inside the riser pipe ( = 5 × 10⁻⁴ kg/s) at Low-Level inlet temperature while the minimum of 6 K occurred at the maximum flowrate ( = 60 × 10−4 kg/s) as in Figure 8.
At Low-Level inlet temperature, both the increase in inlet temperature and the gradient decreased with the increase in flowrate. A maximum increase (To − Tin) of 43 K occurred at the minimum flowrate inside the riser pipe ( = 5 × 10⁻⁴ kg/s) at Low-Level inlet temperature while the minimum of 4.1 K occurred at the maximum flowrate ( = 60 × 10−4 kg/s) as shown in Figure 9. For all cases of flowrate, (To − Tin) at Low-Level inlet temperature was higher than High-Level temperature.
Figure 10 illustrates the effect of inlet flowrate on thermal efficiency () at low-level inlet temperature. increased with the increase in mass flowrate due to the decrease in temperature difference between the water inside the pipe and the ambient temperature (Tf − Tamb), which decreased losses. A maximum of 93% occurred at the maximum flowrate ( = 60 × 10−4 kg/s) while the minimum of 80% occurred at the minimum flowrate (5 × 10⁻⁴ kg/s). increased significantly by 8.7% with changing flow rate from 5 × 10⁻⁴ kg/s to 15 × 10−4 kg/s. The effect of flowrate on decreased to 2% by increasing flowrate from 15 × 10−4 kg/s to 25 × 10−4 kg/s and 1% from 25 × 10−4 kg/s to 35 × 10−4 kg/s respectively. The effect of flowrate on then decreased to 0.6 % by increasing flowrate from 35 × 10−4 kg/s to 45 × 10−4 kg/s and less than 0.4% for the same change in flowrate exceeded 45 × 10−4 kg/s.
Figure 11 illustrates the effect of inlet flowrate on thermal efficiency () at High-Level inlet temperature. increased with the increase in mass flowrate but lower than the one at Low-Level inlet temperature due to the increase in temperature difference between the water inside the pipe and the ambient temperature which increased the losses. A maximum of 64.5% occurred at the maximum flowrate ( = 60 × 10−4 kg/s) while the minimum of 55.5% occurred at the minimum flowrate (5 × 10⁻⁴ kg/s). increased significantly for 6% with changing flow rate from 5 × 10⁻⁴ kg/s to 15 × 10−4 kg/s. The effect of flowrate on decreased to 1.41% by increasing flowrate from 15 × 10−4 kg/s to 25 × 10−4 kg/s and 0.7% from 25 × 10−4 kg/s to 35 × 10−4 kg/s respectively. The effect of flowrate on then decreased to 0.4% by increasing flowrate from 35 × 10−4 kg/s to 45 × 10−4 kg/s and less than 0.3% for the same change in flowrate exceeded 45 × 10−4 kg/s.
5.2. Effect of Inlet Temperature on FPC Performance at High and Low Level of Flowrate:
There was an increase in To due to the increase in inlet water temperature for both high and low level flowrate. Maximum outlet temperature of 394 K for the FPC was achieved at Low-Level flowrate and the maximum inlet temperature (370 K) as in Figure 12.
Figure 13 shows that the inlet temperature rise (To − Tin) was highly dependent on inlet temperature at Low-Level flow rate, while there was no effect at High-Level. A maximum temperature rise of 33 K occurred at Low-Level flowrate and minimum inlet temperature due to a high temperature difference between the absorber plate and water (Tp − Tf), which leads to higher heat transfer. At High-Level flowrate, the potential to rise the water temperature inside the pipe is also high due to the temperature difference between the absorber and water but this did not affect the temperature rise due to the high flowrate.
There was a decrease in with the increase in inlet water temperature due to the increase in temperature difference between the water inside the pipe and the ambient temperature (Tf − Tamb), which increased losses. Maximum of 94% for the FPC was achieved at High-Level flowrate and the minimum inlet temperature as in Figure 14. Thermal efficiency at High-Level flowrate is higher than the one at Low-Level flow for all cases. In contrast, the temperature rise was higher at Low-Level flowrate for all cases. However, for any application, inlet temperature and flowrate must be optimised in order to achieve a specified temperature raise (To − Tin) with high thermal efficiency or specified outlet temperature (To).
5.3. Employing FPC Outlet Water Temperature for Solar Absorption Cooling System
Solar absorption cooling systems generally consist of solar collectors and storage systems in order to collect and store thermal energy, absorption chiller which required thermal energy and provides chilled water, and the cooling tower to cool the condenser in the absorption chiller. Thermal power, which can be achieved with a FPC, is the dominant driving power in solar absorption cooling systems. Thermal energy is delivered from FPC to a storage tank via a hydraulic pump. A backup heating system is normally connected to the storage tank in order to maintain the required feed temperature for the absorption chiller. The minimum driving temperature (Tg) for small capacity absorption chillers in the market (10 kW, Sonnenklima) is 75 °C (348 K) with return temperature (Tr) from the chiller of 65 °C (338 K).
Therefore, in order to improve SCOP in the solar absorption system, the inlet water temperature and flowrate need to be optimised [40]. A range of inlet water temperature was examined at high ambient temperature (318 K) in order to achieve the driven temperature for the chiller with high FPC thermal efficiency. As in Figure 15, the minimum required feed temperature (348 K) was achievable for five different inlet temperatures and flowrates. Namely; Tin = 313 K and = 0.001 kg/s, Tin = 323 K and 0.0013 kg/s, Tin = 333 K and = 0.0022 kg/s, Tin = 338 K and 0.0034 kg/s, Tin = 343 K and = 0.005 kg/s.
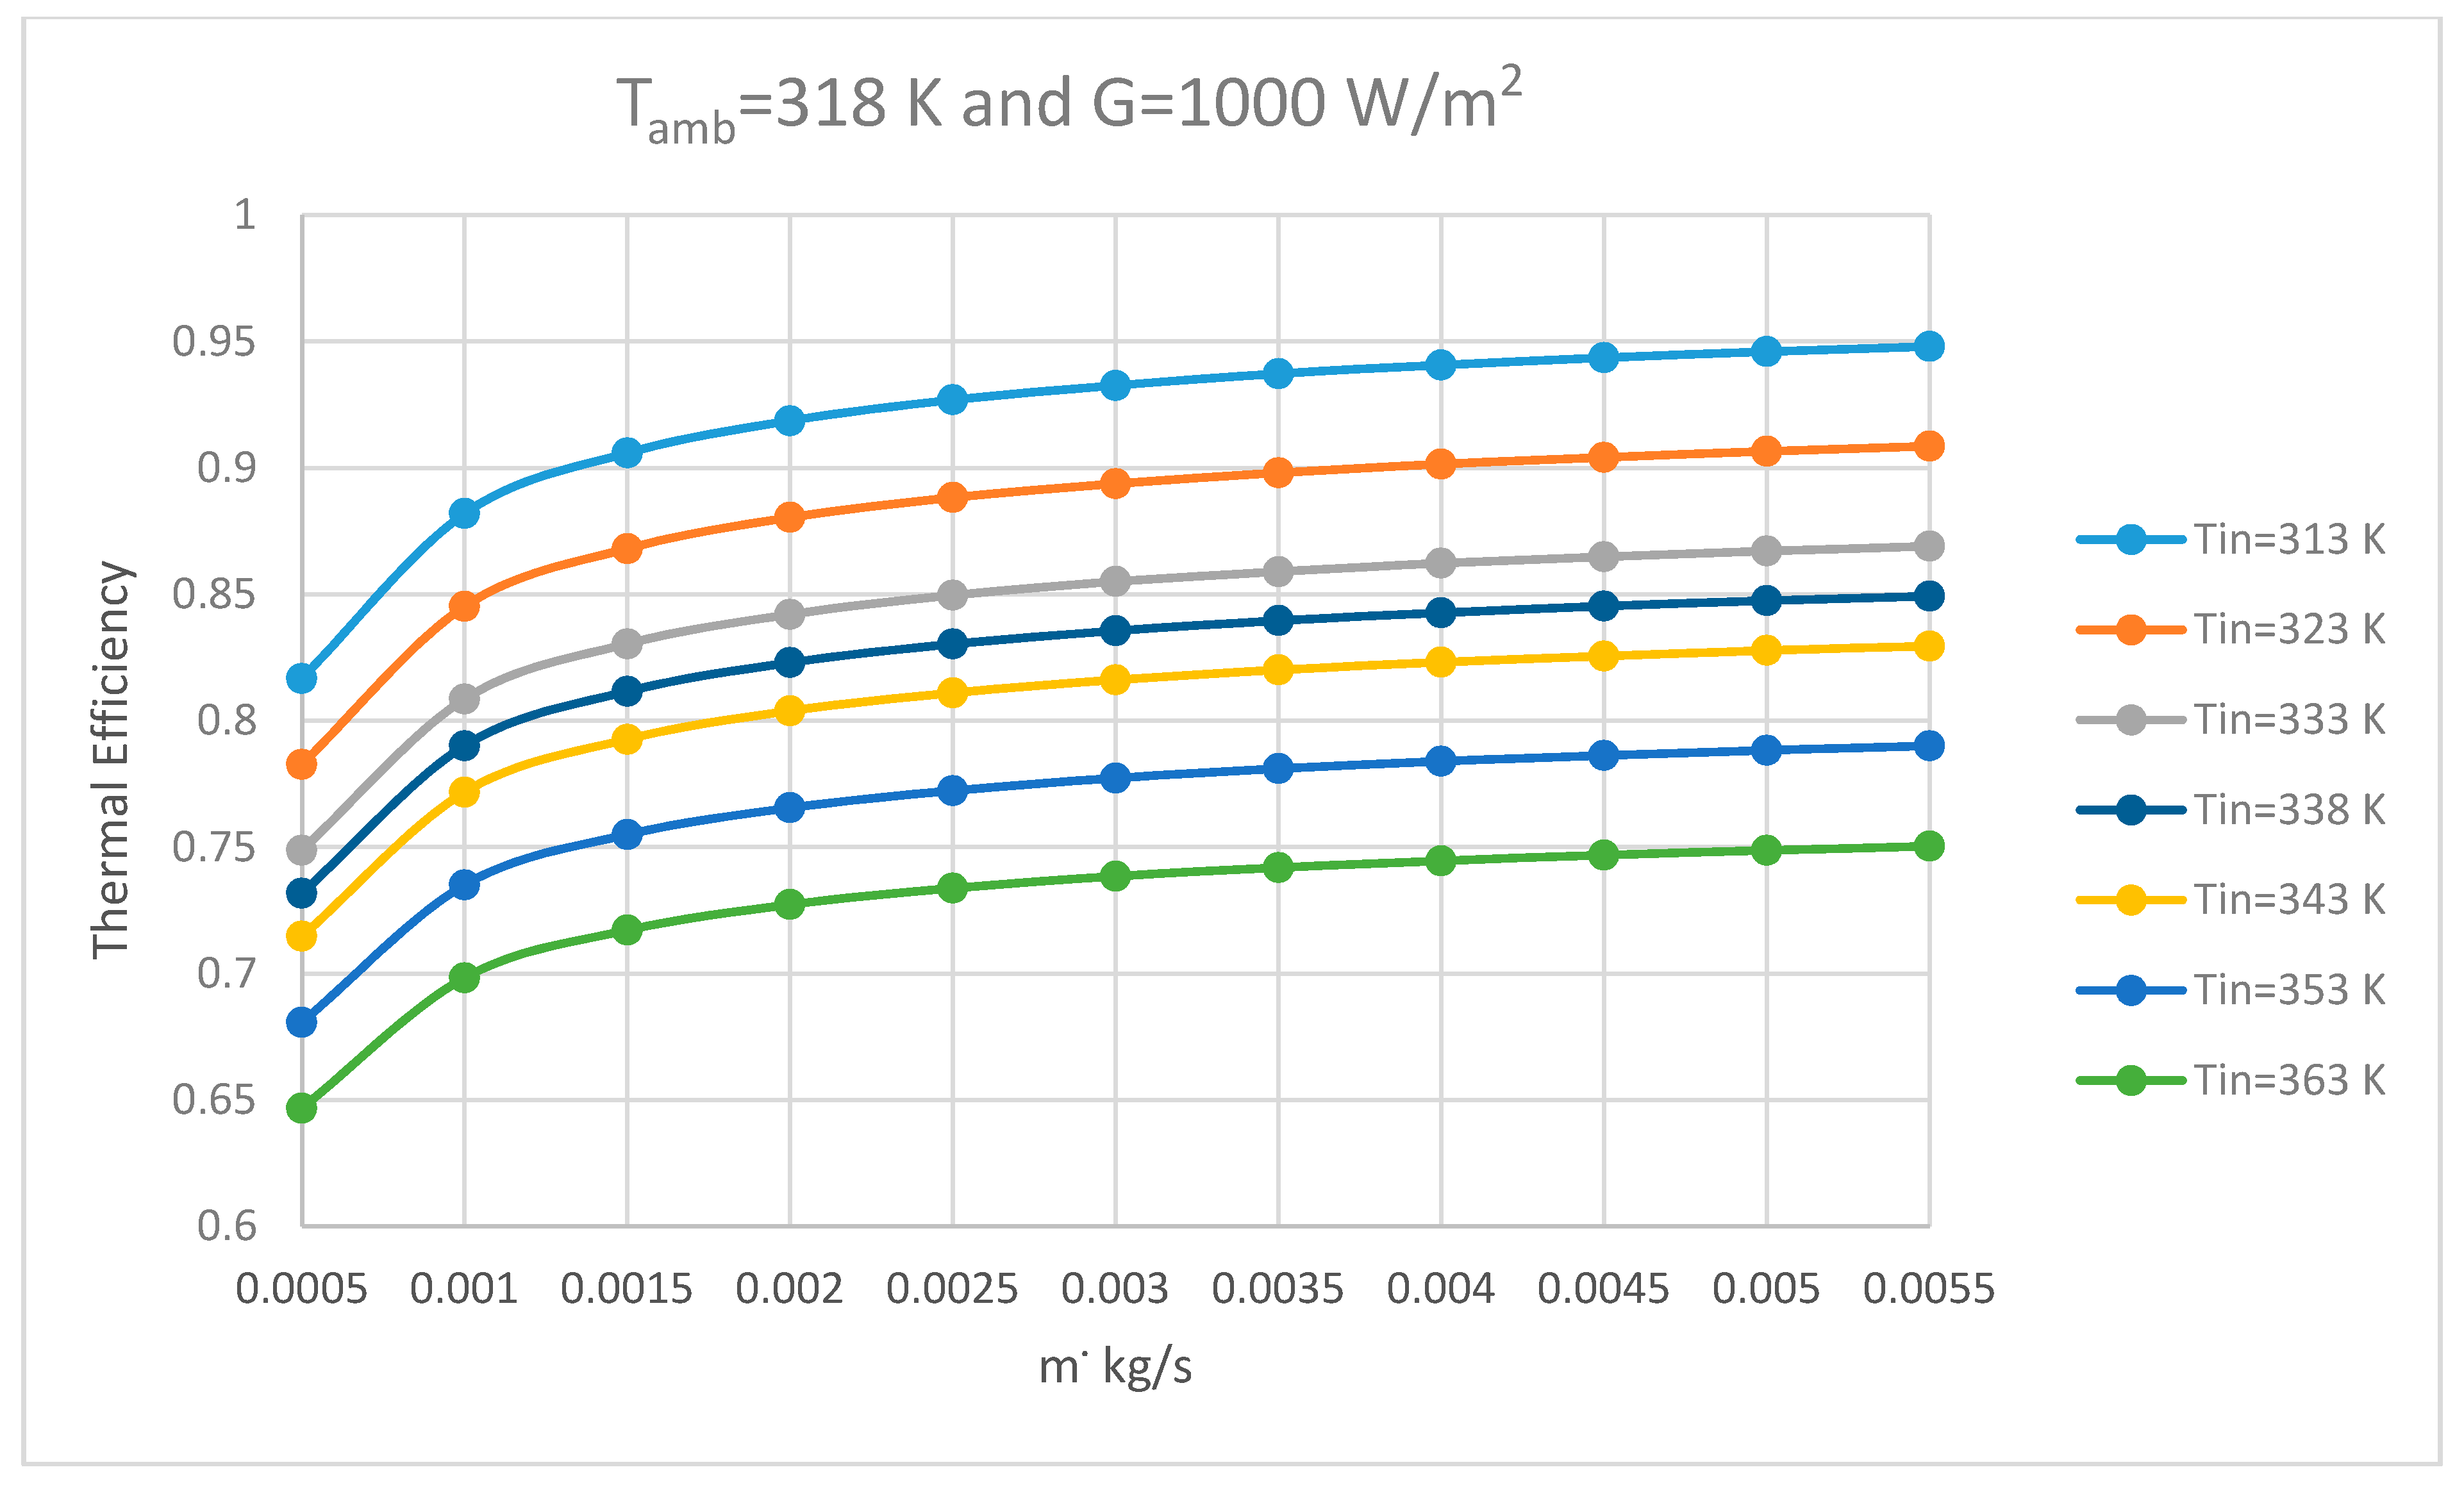
The optimum inlet temperature and flowrate (to meet the minimum feed temperature for the absorption chiller) based on the highest thermal efficiency for the FPC is Tin = 313 K and 0.001 kg/s, for = 88% as in Figure 16. Based on the design criteria of the selected absorption chiller and the losses to the environment from the piping system and from the storage tank, Tamb < Tin < Tr. This constraint leads to minimize the options to: Tin = 323 K, 0.0013 kg/s and = 86% or Tin = 333 K, 0.0022 kg/ and = 84%.
5.4. Performance of FPC Versus Energy Loss Parameter
Energy loss parameter is an important factor as it characterises solar collectors in order to be used for different operating conditions. The thermal efficiency of the FPC can be determined in different weather conditions. The influence of the energy loss parameter ((Ti − Ta)/G) on the FPC performance was investigated for high and low level flowrate by varying the inlet water temperature. Figure 17 illustrates that there was a decrease in due to the increase in the energy loss parameter for both levels of water flowrate.
Thermal efficiency equations were determined using Figure 17 in order to estimate the thermal efficiency of the FPC in different weather conditions. FR* (Heat Removal Factor, τα) is the intercept of thermal efficiency versus energy loss parameter and the slope is −FR UL [28,41]. Based on simulation results; Equations (7) and (8) represent thermal efficiency for the low and high level flowrate respectively:
6. Conclusions
A CFD model of a FPC was developed and validated within maximum error of 1.5% in outlet temperature. The validated CFD model of the FPC was utilised to investigate the effect of inlet water temperature and flowrate on the performance of the FPC that includes thermal efficiency () and temperature raise (To − Tin).
High-Level and Low-Level inlet temperature (298 K and 370 K) have been examined for different inlet flowrates and the results show that a significant impact of the mass flowrate on the performance of FPC occurred at < 60 × 10−4 kg/s inside each riser pipe. At Low-Level inlet temperature, Thermal efficiency () increased significantly for 8.7% with increasing flow rate from 5 × 10⁻⁴ kg/s to 15 × 10−4 kg/s while the effect decreased to less than 0.4% when the flowrate exceeded 45 × 10−4 kg/s. At High-Level inlet temperature, increased significantly for 6% with increasing flow rate from 5 × 10⁻⁴ kg/s to 15 × 10−4 kg/s while the effect decreased to less than 0.3% when the flowrate exceeded 45 × 10−4 kg/s.
There was a decrease in with the increase in inlet water temperature for both High-Level and Low-Level flowrate. Increasing inlet temperature for a degree Kelvin, decreased thermal efficiency by 0.4%. Maximum thermal efficiency of 93% and 65% was achieved at 298 K and 370 K inlet temperature respectively. A maximum increase in the inlet temperature of 62 K occurred at the minimum flowrate ( = 5 × 10⁻⁴ kg/s).
Inlet water flowrate and temperature of the FPC were optimised for the higher thermal efficiency in order to achieve the minimum required feed temperature for 10 kW absorption chiller. The optimum inlet parameters (under the condition Tamb < Tin < Tr) for the highest thermal efficiency of the collector was (Tin = 323 K and 0.0013 kg/s and = 86%).
Author Contributions
The authors contributed the following to the research article: Conceptualization, M.A. and B.H.; Methodology, M.A. and B.H.; Software, M.A.; Validation, M.A. and B.H.; Formal Analysis, M.A., B.H. and D.O.; Investigation, M.A. and B.H.; Resources, M.A. and B.H.; Data Curation, M.A.; Writing-Original Draft Preparation, M.A., B.H.; Writing-Review & Editing M.A., B.H. and D.O.; Visualization, M.A., B.H. and D.O.; Supervision, B.H. and A.H.; Project Administration, M.A. and B.H.
Funding
This research was funded by [Majmaa University grant from Saudi Arabia government].
Acknowledgments
This research was made possible by Majmaa University grant from Saudi Arabia government fund. The statements made are solely the responsibility of the authors.
Conflicts of Interest
The authors declare no conflict of interest. The funders had no role in the design of the study; in the collection, analyses, or interpretation of data; in the writing of the manuscript, and in the decision to publish the results.
References
- Martinopoulos, G. Energy efficiency and environmental impact of solar heating and cooling systems. In Advances in Solar Heating and Cooling, 1st ed.; Ge, T., Wang, R., Eds.; Woodhead Publishing: Sawston, Cambridge, UK, 2016; pp. 43–59. [Google Scholar]
- Shirazi, A.; Taylor, R.A.; Morrison, G.L.; White, S.D. Solar-powered absorption chillers: A comprehensive and critical review. Energy Convers. Manag. 2018, 171, 59–81. [Google Scholar] [CrossRef]
- Settino, J.; Sant, T.; Micallef, C.; Farrugia, M.; Spiteri Staines, C.; Licari, J.; Micallef, A. Overview of solar technologies for electricity, heating and cooling production. Renew. Sustain. Energy Rev. 2018, 90, 892–909. [Google Scholar] [CrossRef]
- Lizarte, R.; Izquierdo, M.; Marcos, J.; Palacios, E. An innovative solar-driven directly air-cooled LiBr–H2O absorption chiller prototype for residential use. Energy Build. 2012, 47, 1–11. [Google Scholar] [CrossRef]
- Bellos, E.; Tzivanidis, C.; Antonopoulos, K.A. Exergetic, energetic and financial evaluation of a solar driven absorption cooling system with various collector types. Appl. Therm. Eng. 2016, 102, 749–759. [Google Scholar] [CrossRef]
- Praene, J.P.; Marc, O.; Lucas, F.; Miranville, F. Simulation and experimental investigation of solar absorption cooling system in Reunion Island. Appl. Energy 2011, 88, 831–839. [Google Scholar] [CrossRef]
- Aman, J.; Ting, D.-K.; Henshaw, P. Residential solar air conditioning: Energy and exergy analyses of an ammonia–water absorption cooling system. Appl. Therm. Eng. 2014, 62, 424–432. [Google Scholar] [CrossRef] [Green Version]
- Li, Z.; Ye, X.; Liu, J. Optimal temperature of collector for solar double effect LiBr/H2O absorption cooling system in subtropical city based on a year round meteorological data. Appl. Therm. Eng. 2014, 69, 19–28. [Google Scholar] [CrossRef]
- Calise, F.; d’Accadia, M.D.; Palombo, A.; Vanoli, L. Dynamic simulation of a novel high-temperature solar trigeneration system based on concentrating photovoltaic/thermal collectors. Energy 2013, 61, 72–86. [Google Scholar] [CrossRef]
- Mateus, T.; Oliveira, A.C. Energy and economic analysis of an integrated solar absorption cooling and heating system in different building types and climates. Appl. Energy 2009, 86, 949–957. [Google Scholar] [CrossRef]
- Martínez, P.J.; Martínez, J.C.; Lucas, M. Design and test results of a low-capacity solar cooling system in Alicante (Spain). Solar Energy 2012, 86, 2950–2960. [Google Scholar] [CrossRef]
- Fong, K.; Chow, T.T.; Lee, C.K.; Lin, Z.; Chan, L. Solar hybrid cooling system for high-tech offices in subtropical climate–Radiant cooling by absorption refrigeration and desiccant dehumidification. Energy Convers. Manag. 2011, 52, 2883–2894. [Google Scholar] [CrossRef]
- Agrouaz, Y.; Bouhal, T.; Allouhi, A.; Kousksou, T.; Jamil, A.; Zeraouli, Y. Energy and parametric analysis of solar absorption cooling systems in various Moroccan climates. Case Stud. Therm. Eng. 2017, 9, 28–39. [Google Scholar] [CrossRef]
- Martínez, P.J.; Martínez, J.C.; Martínez, P. Performance comparison of solar autonomous and assisted absorption systems in Spain. Int. J. Refrig. 2016, 71, 85–93. [Google Scholar] [CrossRef]
- Marc, O.; Lucas, F.; Sinama, F.; Monceyron, E. Experimental investigation of a solar cooling absorption system operating without any backup system under tropical climate. Energy Build. 2010, 42, 774–782. [Google Scholar] [CrossRef]
- Sumathy, K.; Huang, Z.; Li, Z. Solar absorption cooling with low grade heat source—A strategy of development in South China. Solar Energy 2002, 72, 155–165. [Google Scholar] [CrossRef]
- Alobaid, M.; Hughes, B.; Calautit, J.K.; O’Connor, D.; Heyes, A. A review of solar driven absorption cooling with photovoltaic thermal systems. Renew. Sustain. Energy Rev. 2017, 76, 728–742. [Google Scholar] [CrossRef] [Green Version]
- Ketfi, O.; Merzouk, M.; Merzouk, N.K.; Metenani, S.E. Performance of a Single Effect Solar Absorption Cooling System (Libr-H2O). Energy Procedia 2015, 74, 130–138. [Google Scholar] [CrossRef]
- Fong, K.; Lee, C. Performance advancement of solar air-conditioning through integrated system design for building. Energy 2014, 73, 987–996. [Google Scholar] [CrossRef]
- Shirazi, A.; Taylor, R.A.; Morrison, G.L.; White, S.D. A comprehensive, multi-objective optimization of solar-powered absorption chiller systems for air-conditioning applications. Energy Convers. Manag. 2017, 132, 281–306. [Google Scholar] [CrossRef]
- Zhang, D.; Li, J.; Gao, Z.; Wang, L.; Nan, J. Thermal performance investigation of modified flat plate solar collector with dual-function. Appl. Therm. Eng. 2016, 108, 1126–1135. [Google Scholar] [CrossRef]
- Selmi, M.; Al-Khawaja, M.J.; Marafia, A. Validation of CFD simulation for flat plate solar energy collector. Renew. Energy 2008, 33, 383–387. [Google Scholar] [CrossRef]
- Villar, N.M.; López, J.M.C.; Muñoz, F.D.; García, E.R.; Andrés, A.C. Numerical 3-D heat flux simulations on flat plate solar collectors. Solar Energy 2009, 83, 1086–1092. [Google Scholar] [CrossRef]
- Martinopoulos, G.; Missirlis, D.; Tsilingiridis, G.; Yakinthos, K.; Kyriakis, N. CFD modeling of a polymer solar collector. Renew. Energy 2010, 35, 1499–1508. [Google Scholar] [CrossRef]
- Missirlis, D.; Martinopoulos, G.; Tsilingiridis, G.; Yakinthos, K.; Kyriakis, N. Investigation of the heat transfer behaviour of a polymer solar collector for different manifold configurations. Renew. Energy 2014, 68, 715–723. [Google Scholar] [CrossRef]
- Sekhar, T.V.R.; Nandan, G.; Prakash, R.; Muthuraman, M. Modeling a Renewable Energy Collector and Prediction in Different Flow Regimes Using CFD. Mater. Today Proc. 2018, 5, 4563–4574. [Google Scholar] [CrossRef]
- Rangababu, J.A.; Kumar, K.; Rao, S. Numerical Analysis and Validation of Heat Transfer Mechanism of Flat Plate Collectors. Procedia Eng. 2015, 127, 63–70. [Google Scholar] [CrossRef]
- Duffie, J.A.; Beckman, W.A. Solar Engineering of Thermal Processes; John Wiley & Sons Inc.: New York, NY, USA, 1980. [Google Scholar]
- Hajabdollahi, Z.; Hajabdollahi, H. Thermo-economic modeling and multi-objective optimization of solar water heater using flat plate collectors. Solar Energy 2017, 155, 191–202. [Google Scholar] [CrossRef]
- White, F.M. Fluid Mechanics, in SI Units, 7th ed.; McGraw Hill Higher Education: Columbus, OH, US, 2011. [Google Scholar]
- Calautit, J.K.; Chaudhry, H.N.; Hughes, B.R.; Ghani, S.A. Comparison between evaporative cooling and a heat pipe assisted thermal loop for a commercial wind tower in hot and dry climatic conditions. Appl. Energy 2013, 101, 740–755. [Google Scholar] [CrossRef]
- A nsys. CFD. In ICEM CFD Theory Guide; Ansys Inc.: Canonsburg, PA, USA, 2015. [Google Scholar]
- Chow, T.T. A review on photovoltaic/thermal hybrid solar technology. Appl. Energy 2010, 87, 365–379. [Google Scholar] [CrossRef]
- Dubey, S.; Tay, A.A. The theoretical modelling and optimization of a 10 KWP photovoltaic thermal system for a student hostel in Singapore. Int. J. Green Energy 2014, 11, 225–239. [Google Scholar] [CrossRef]
- Allouhi, A.; Kousksou, T.; Jamil, A.; Bruel, P.; Mourad, Y.; Zeraouli, Y. Solar driven cooling systems: An updated review. Renew. Sustain. Energy Rev. 2015, 44, 159–181. [Google Scholar] [CrossRef]
- Cerón, J.F.; Pérez-García, J.; Solano, J.P.; García, A.; Herrero-Martín, R. A coupled numerical model for tube-on-sheet flat-plate solar liquid collectors. Analysis and validation of the heat transfer mechanisms. Appl. Energy 2015, 140, 275–287. [Google Scholar] [CrossRef]
- Gunjo, D.G.; Mahanta, P.; Robi, P.S. CFD and experimental investigation of flat plate solar water heating system under steady state condition. Renew. Energy 2017, 106, 24–36. [Google Scholar] [CrossRef]
- Rejeb, O.; Sardarabadi, M.; Ménézo, C.; Passandideh-Fard, M.; Dhaou, M.H.; Jemni, A. Numerical and model validation of uncovered nanofluid sheet and tube type photovoltaic thermal solar system. Energy Convers. Manag. 2016, 110, 367–377. [Google Scholar] [CrossRef]
- Hung, T.-C.; Huang, T.-J.; Lee, D.-S.; Lin, C.-H.; Pei, B.-S.; Li, Z.-Y. Numerical analysis and experimental validation of heat transfer characteristic for flat-plate solar air collector. Appl. Therm. Eng. 2017, 111, 1025–1038. [Google Scholar] [CrossRef]
- Alobaid, M.; Hughes, B.; O’Connor, D.; Calautit, J.; Heyes, A. Improving Thermal and Electrical Efficiency in Photovoltaic Thermal Systems for Sustainable Cooling System Integration. J. Sustain. Dev. Energy Water Environ. Syst. 2018, 6, 305–322. [Google Scholar] [CrossRef] [Green Version]
- Shojaeizadeh, E.; Veysi, F.; Kamandi, A. Exergy efficiency investigation and optimization of an Al2O3–water nanofluid based Flat-plate solar collector. Energy Build. 2015, 101, 12–23. [Google Scholar] [CrossRef]
Figure 1.
Schematic diagram of Flat plate collector. Adopt from [29].
Figure 1.
Schematic diagram of Flat plate collector. Adopt from [29].

Figure 2.
Schematic diagram of the FPC. Adopt from [37].
Figure 2.
Schematic diagram of the FPC. Adopt from [37].

Figure 3.
Grid independent study for the FPC computational domain.

Figure 4.
Outlet fluid temperature in this study and the experiment in the literature.
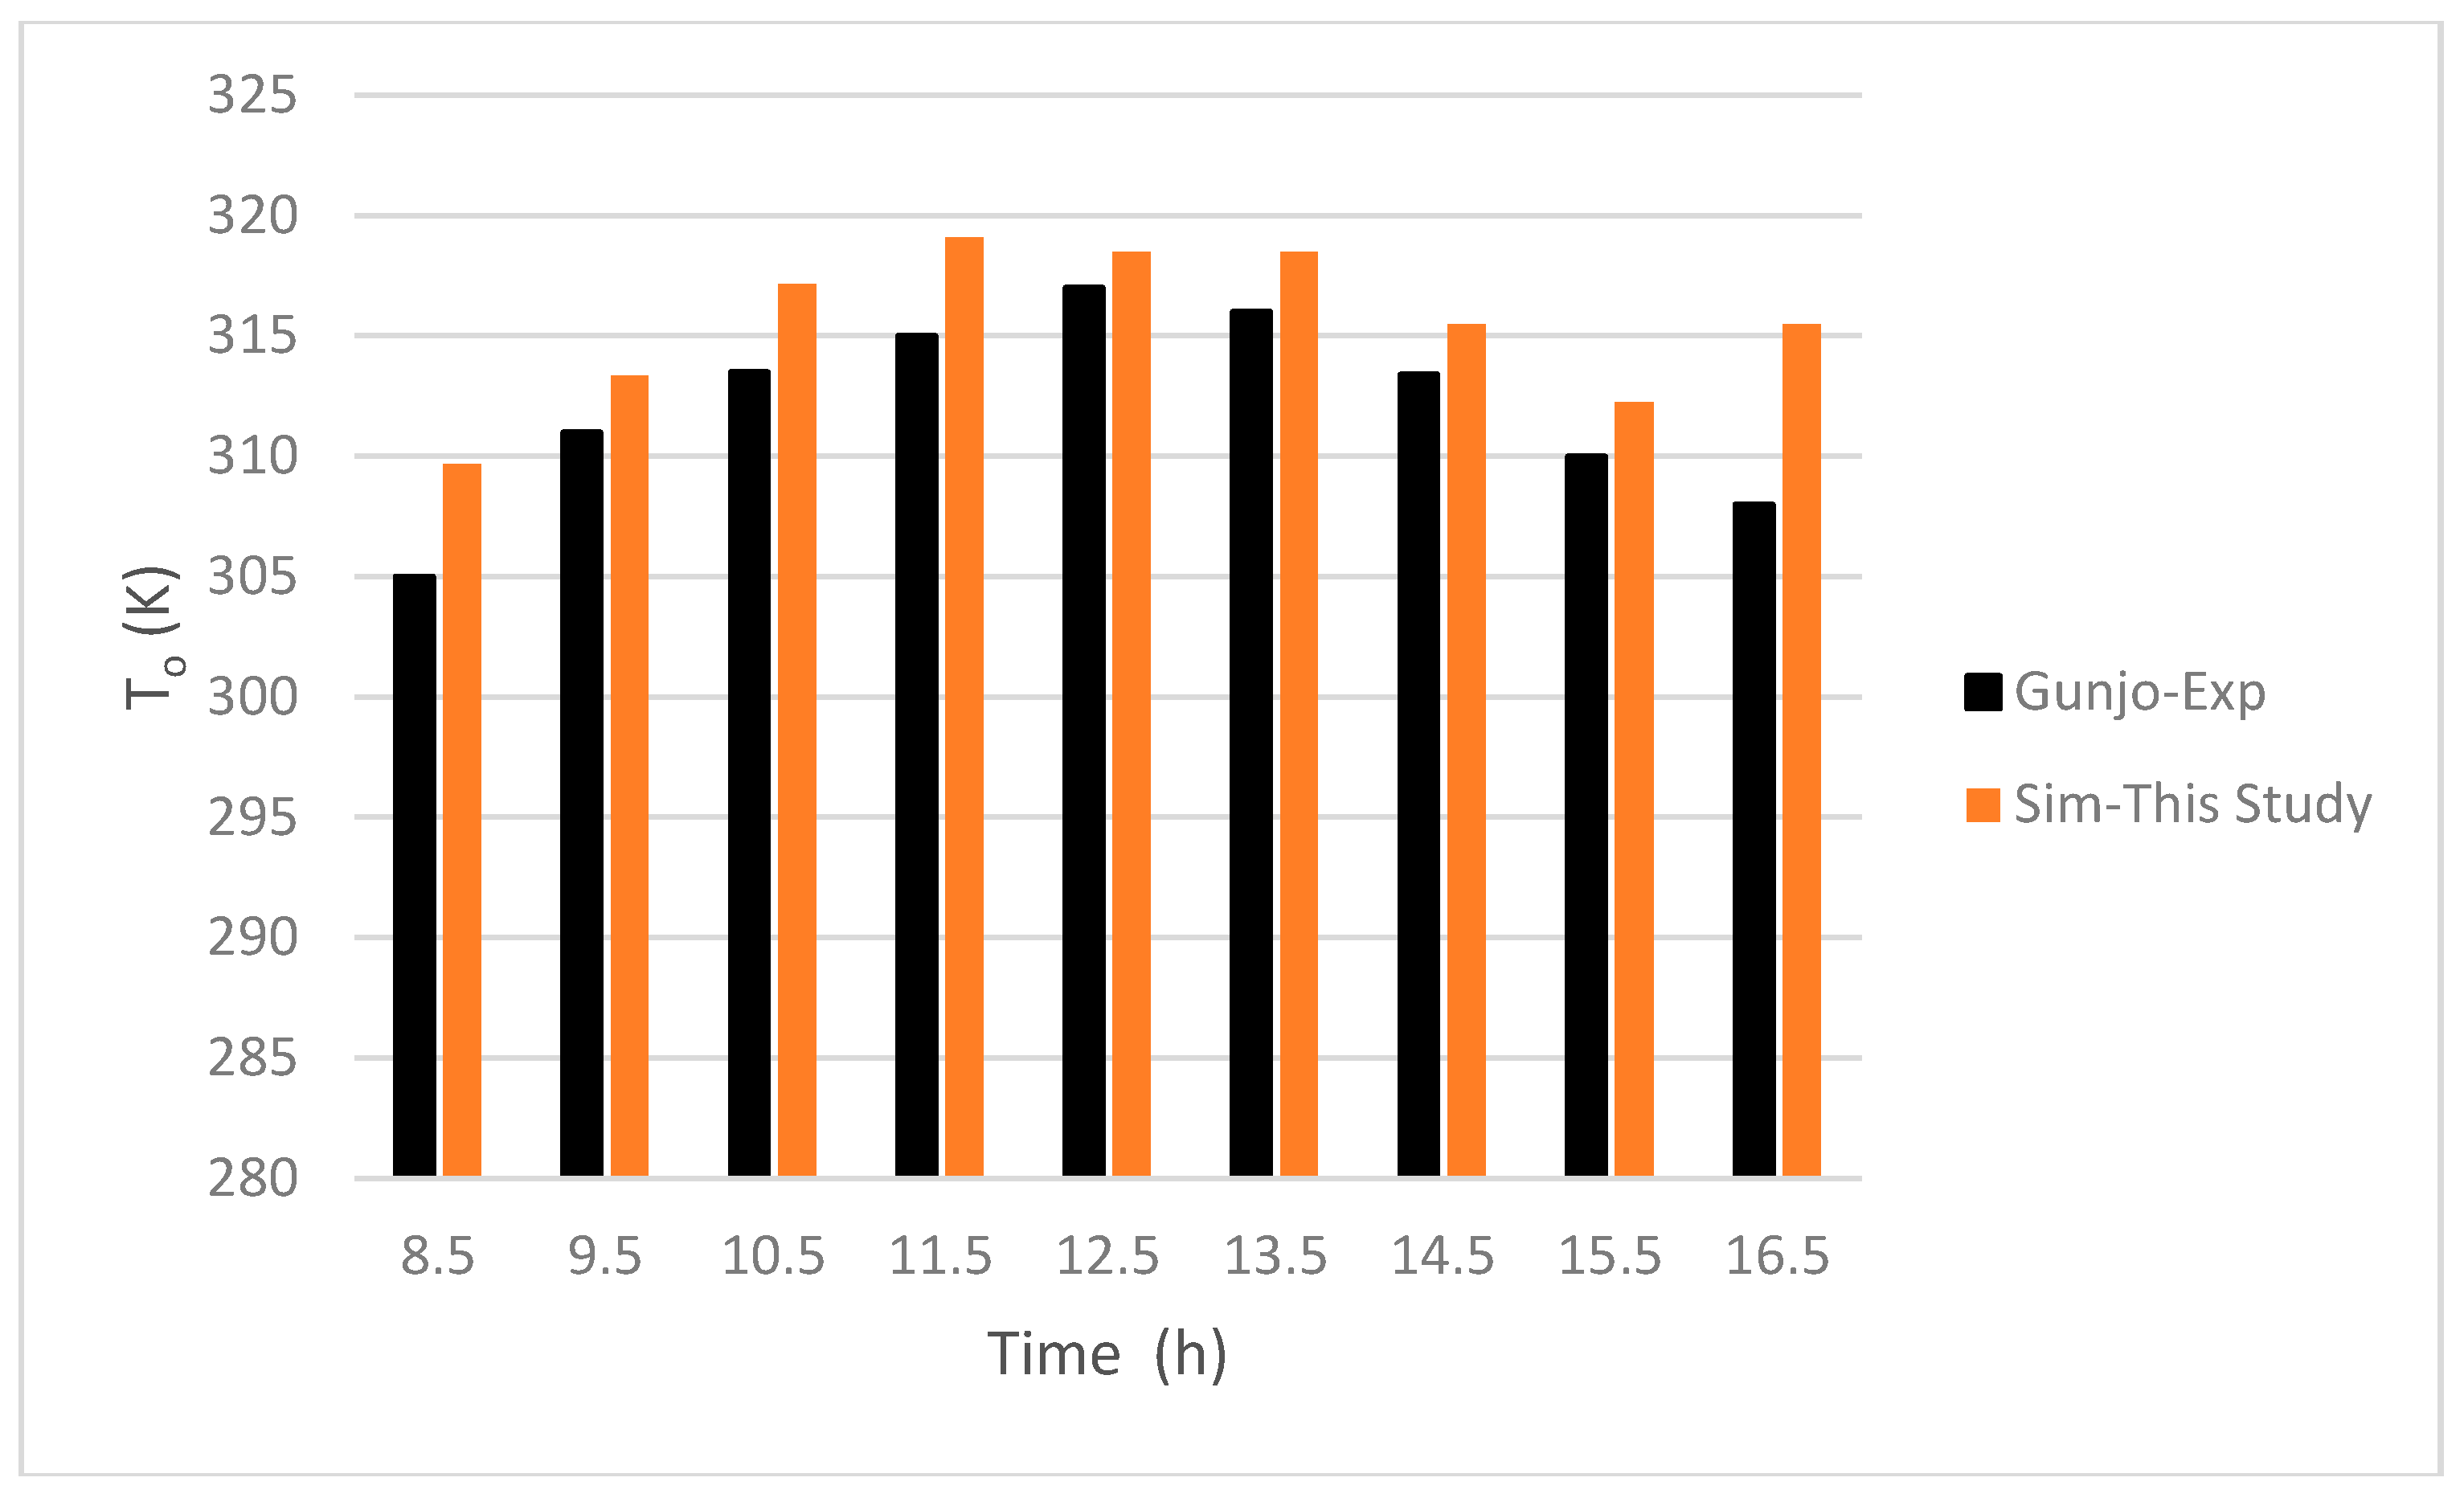
Figure 5.
The effect of inlet flowrate on the outlet water temperature at low-level inlet temperature.
Figure 5.
The effect of inlet flowrate on the outlet water temperature at low-level inlet temperature.

Figure 6.
The effect of inlet flowrate on the outlet water temperature at high-level inlet temperature.
Figure 6.
The effect of inlet flowrate on the outlet water temperature at high-level inlet temperature.
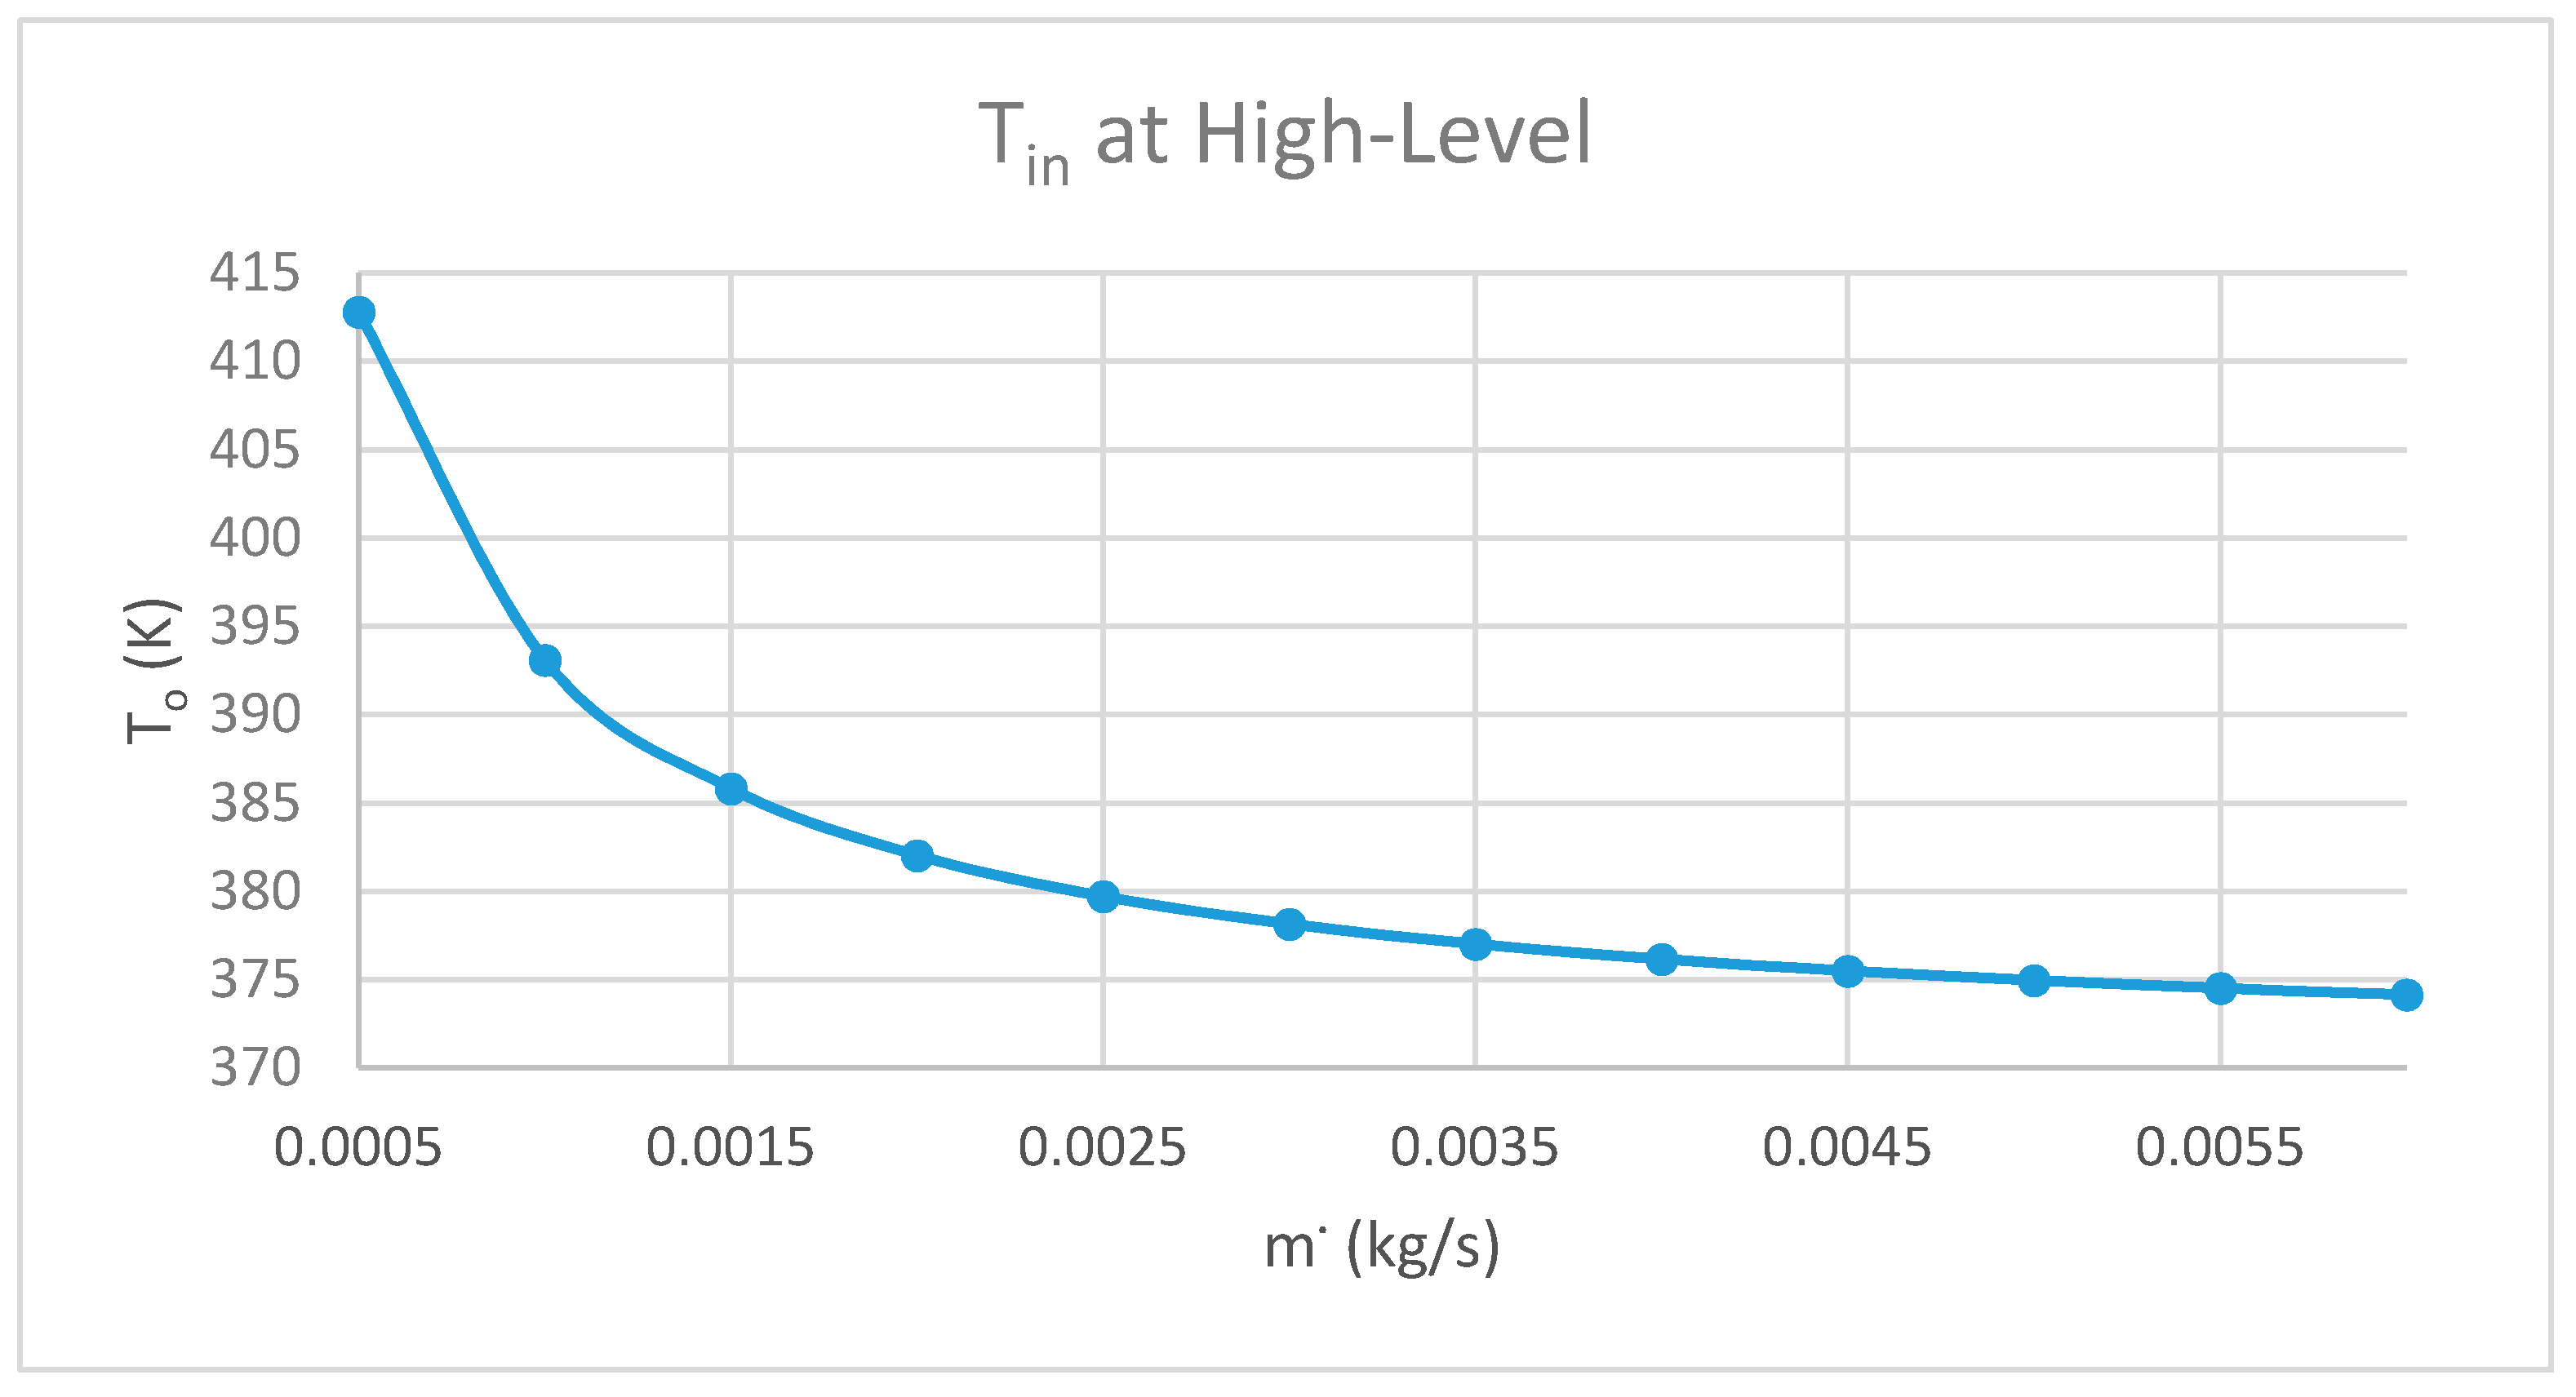
Figure 7.
The impact of flow rate on the variation water temperature for different range of flow rate.
Figure 7.
The impact of flow rate on the variation water temperature for different range of flow rate.
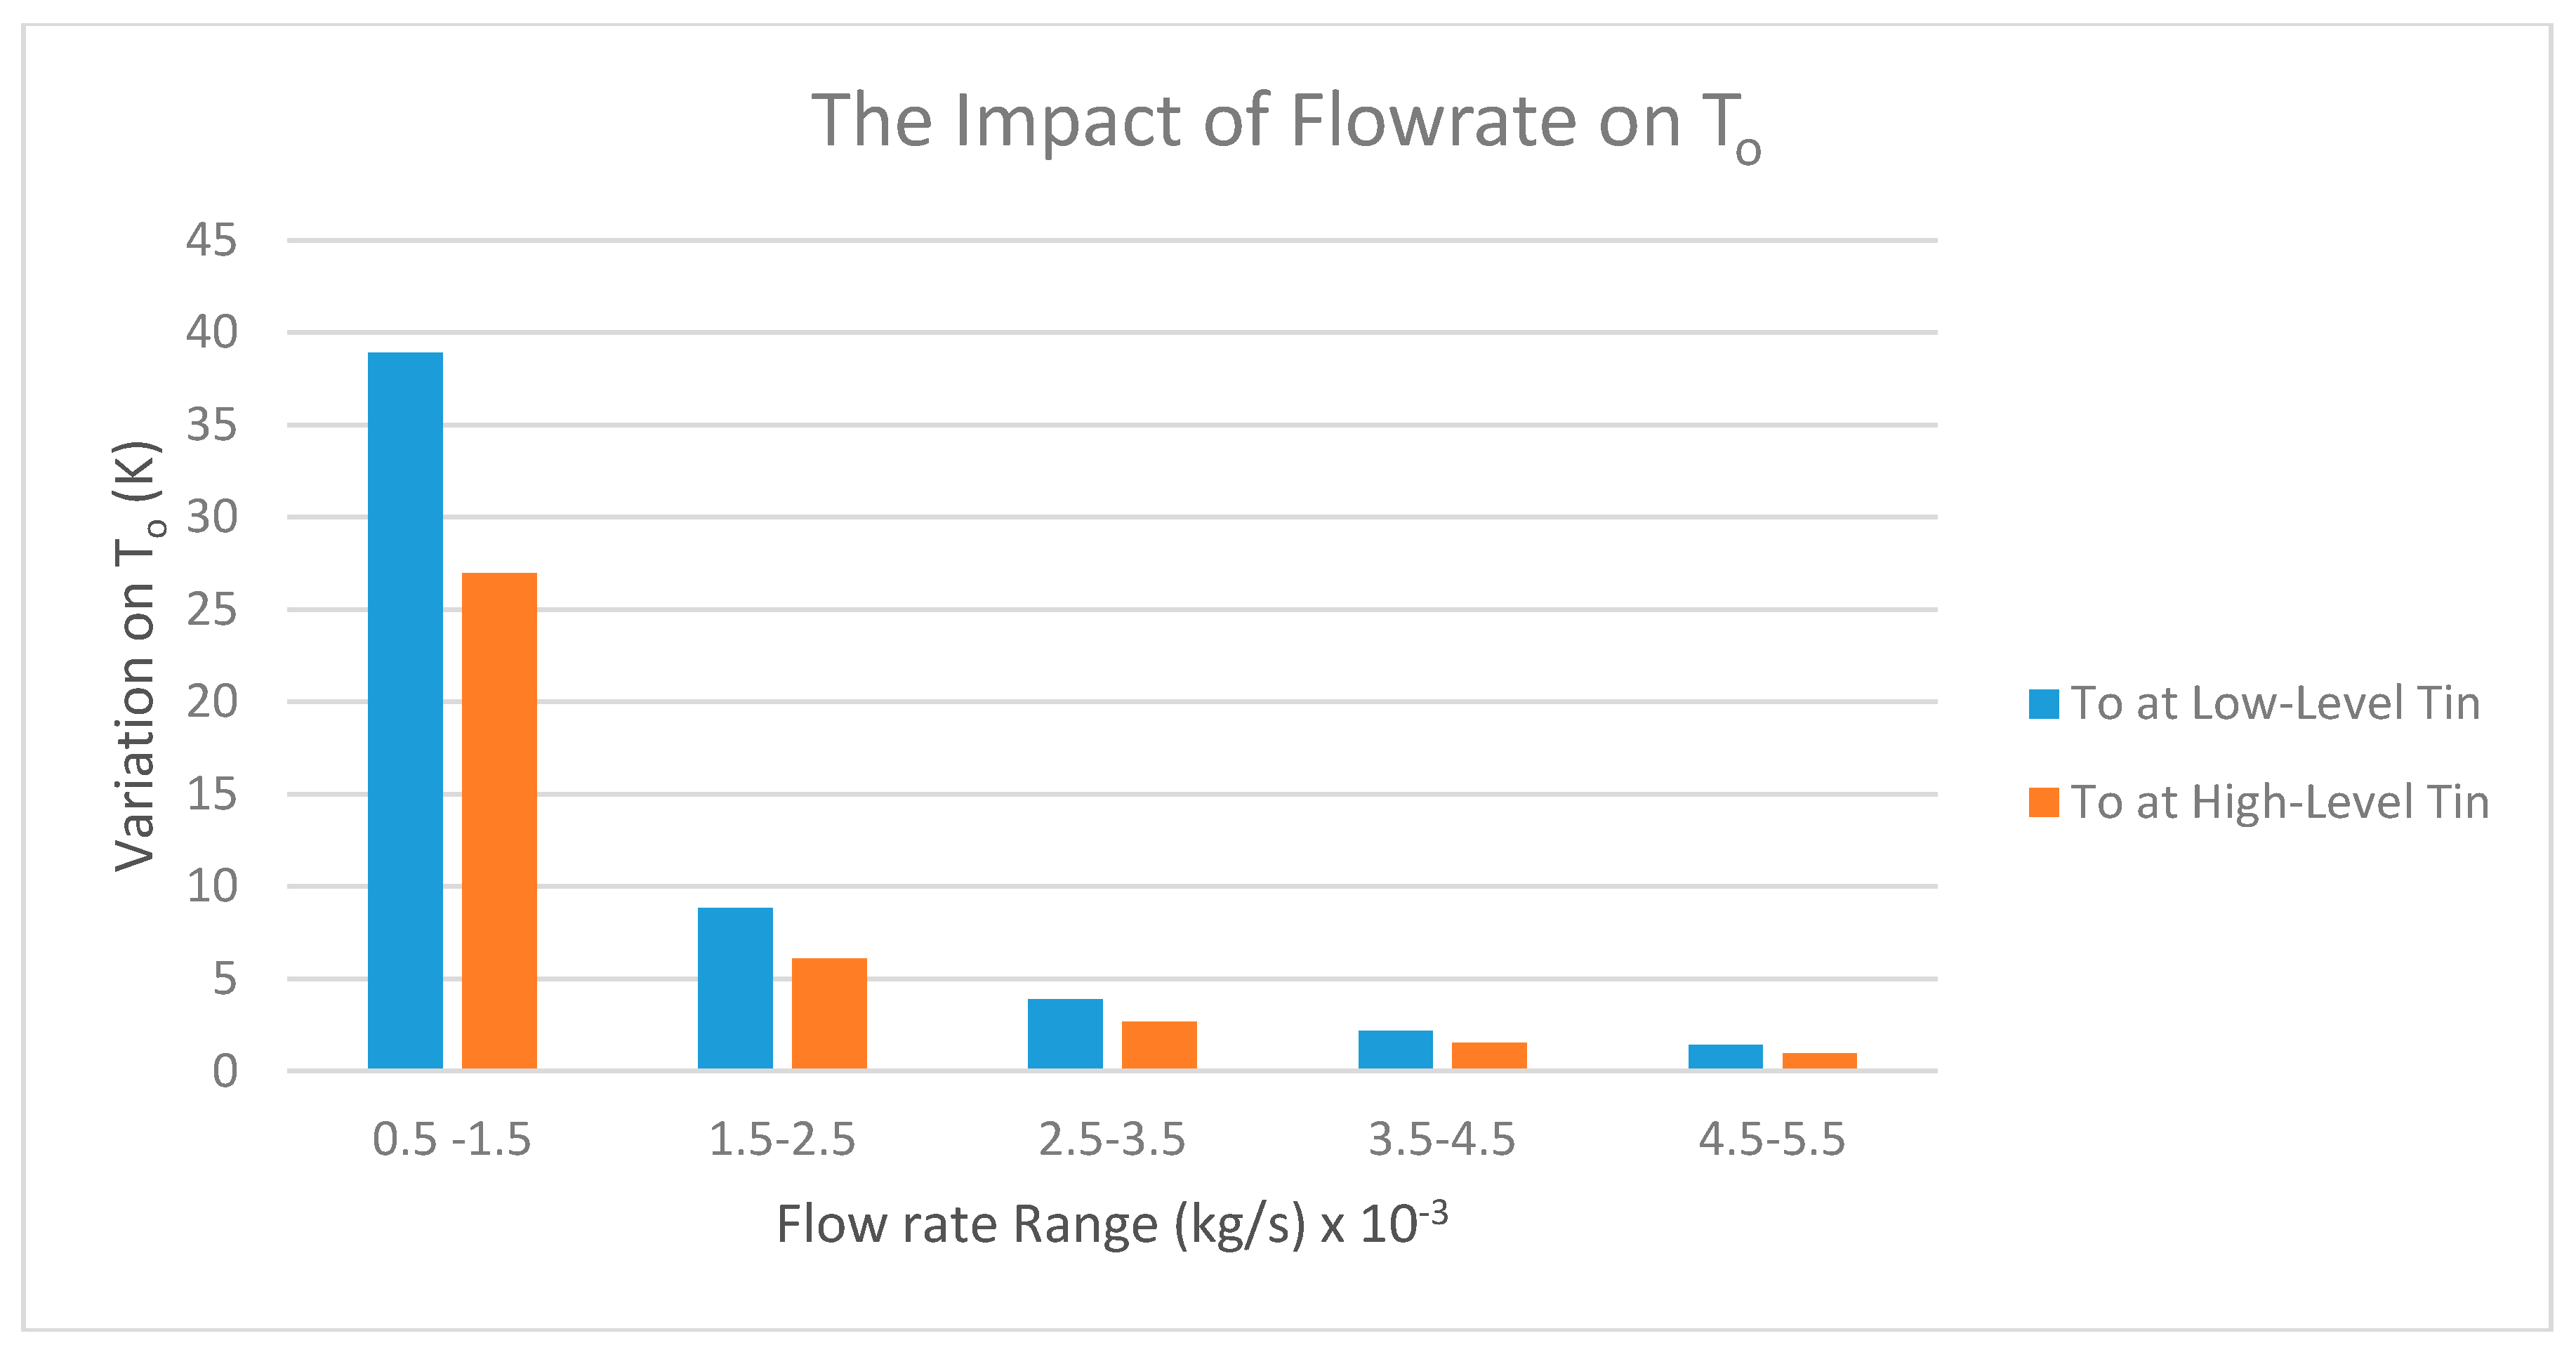
Figure 8.
The effect of inlet flowrate on the outlet water temperature raise at Low-Level inlet temperature.
Figure 8.
The effect of inlet flowrate on the outlet water temperature raise at Low-Level inlet temperature.
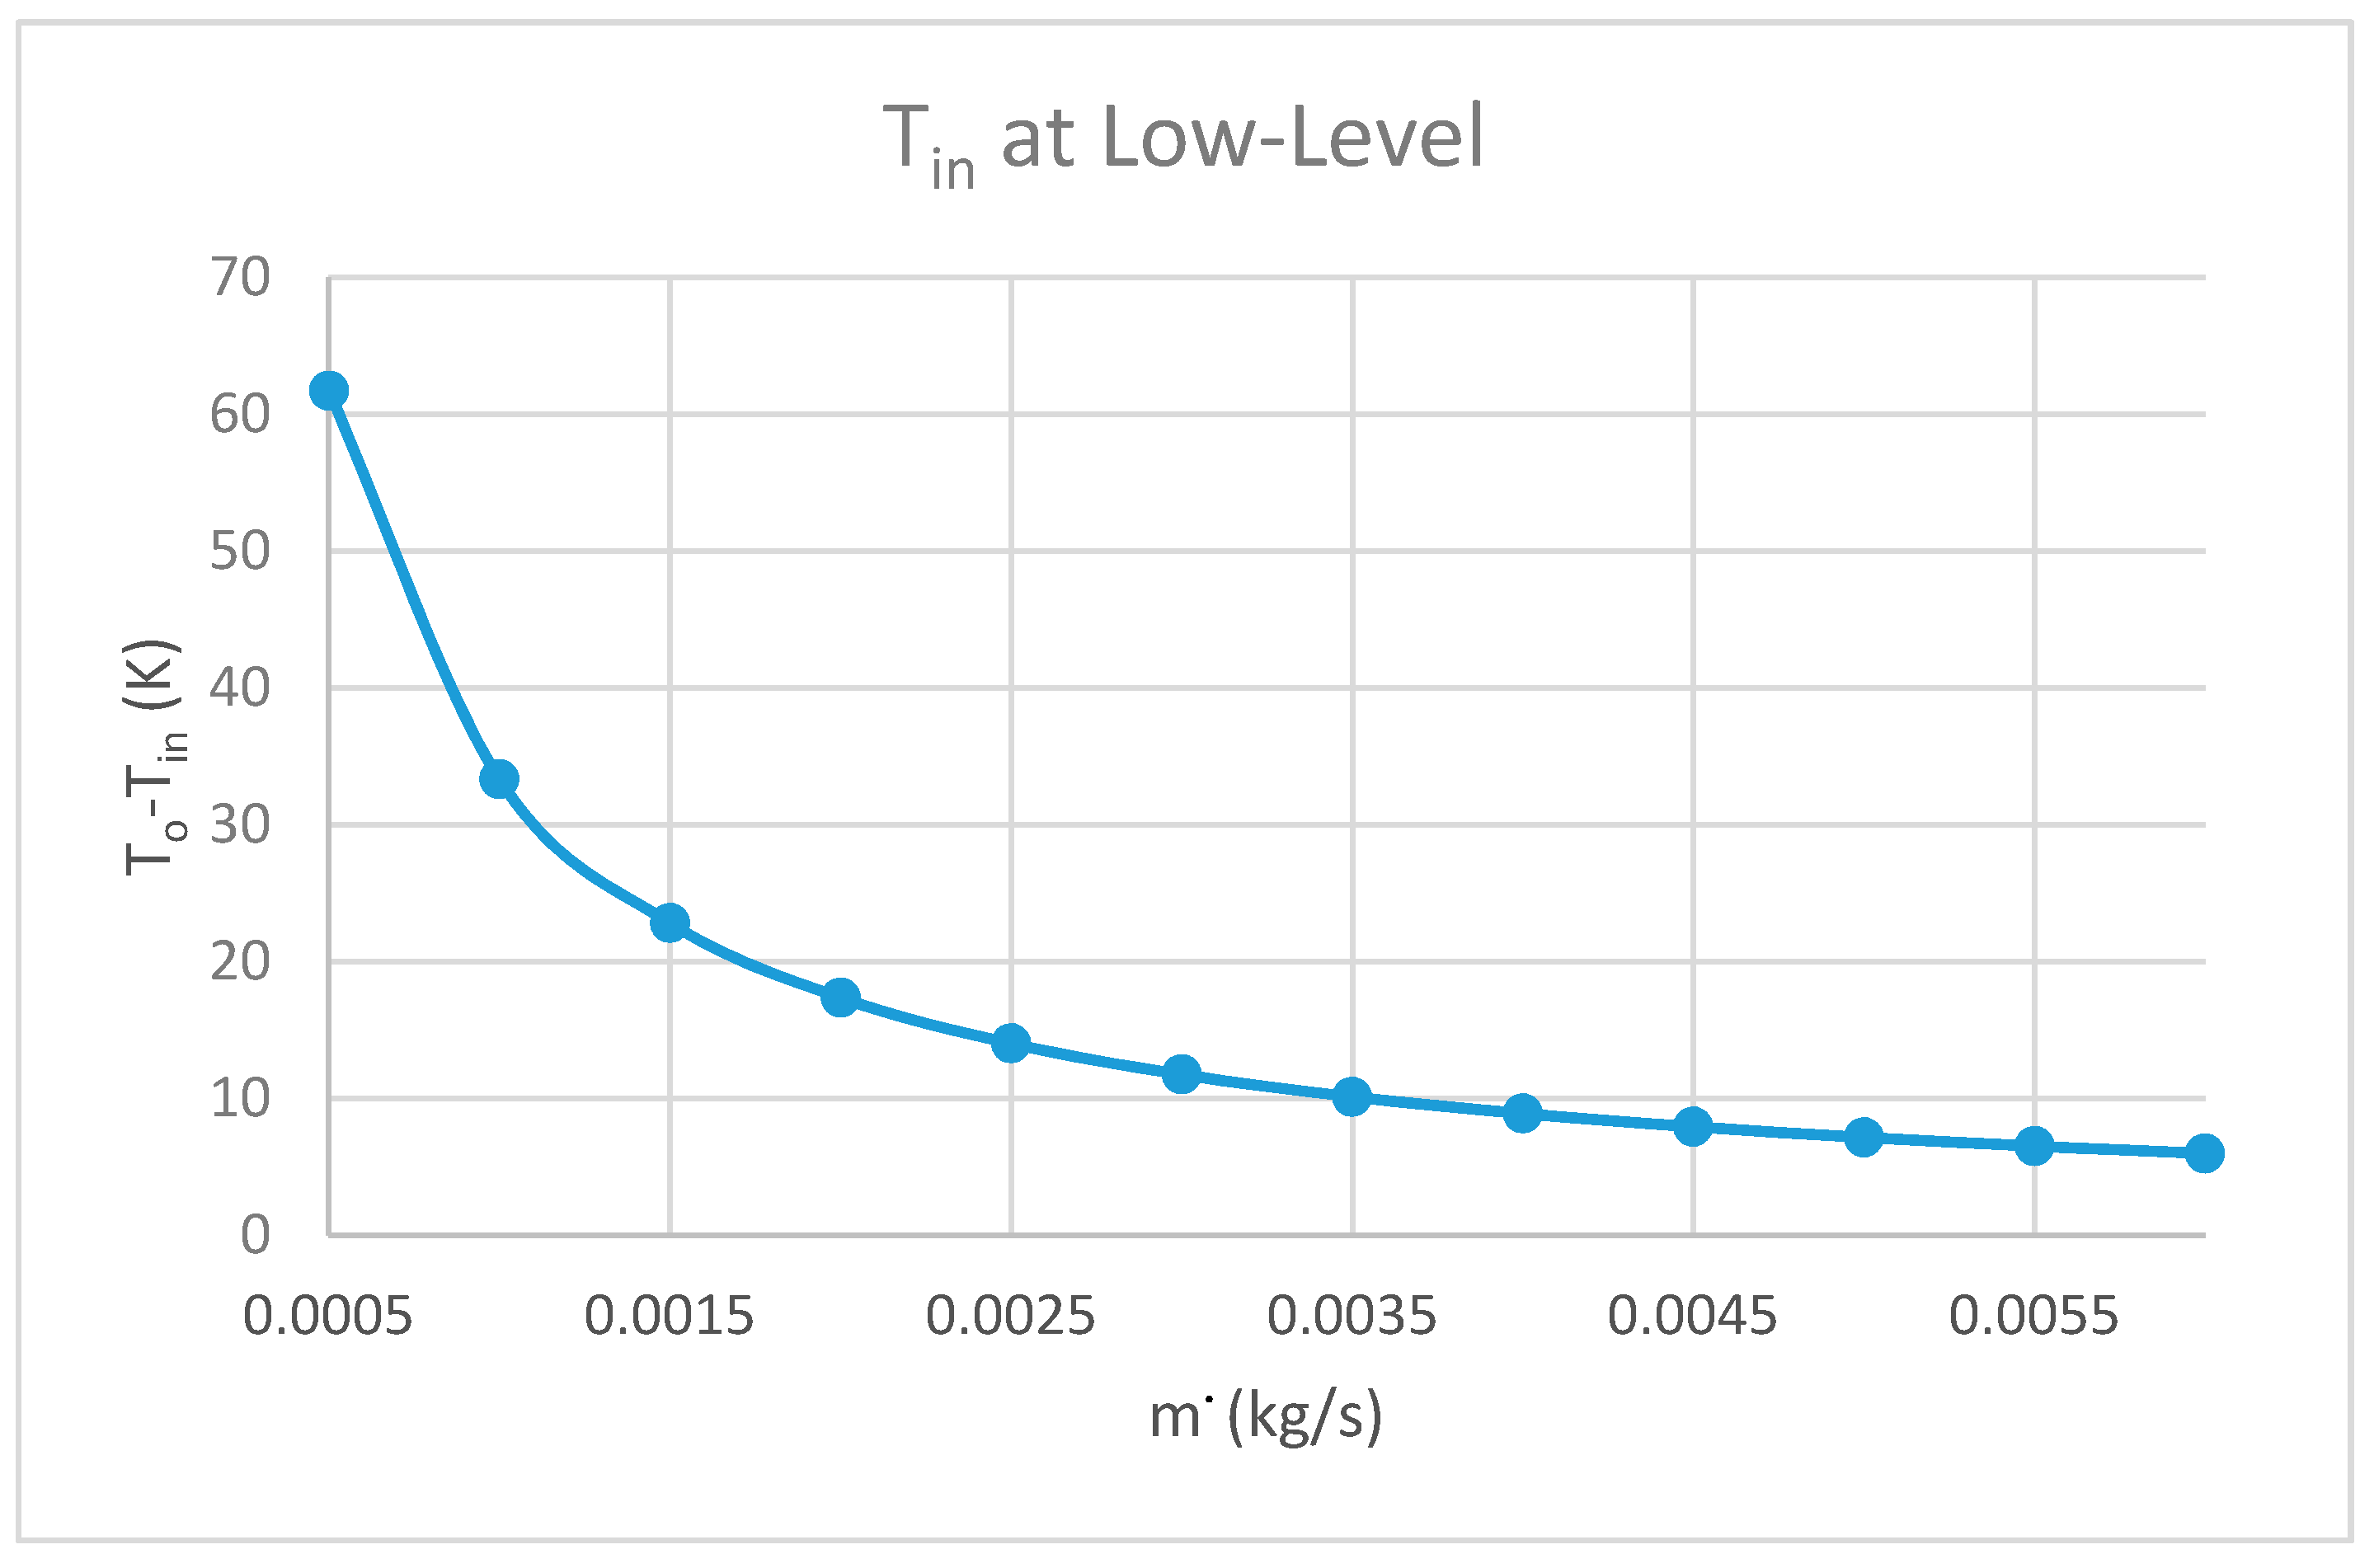
Figure 9.
The effect of inlet flowrate on To − Tin at High-Level inlet temperature.

Figure 10.
The effect of inlet flowrate on at Low-Level inlet temperature.
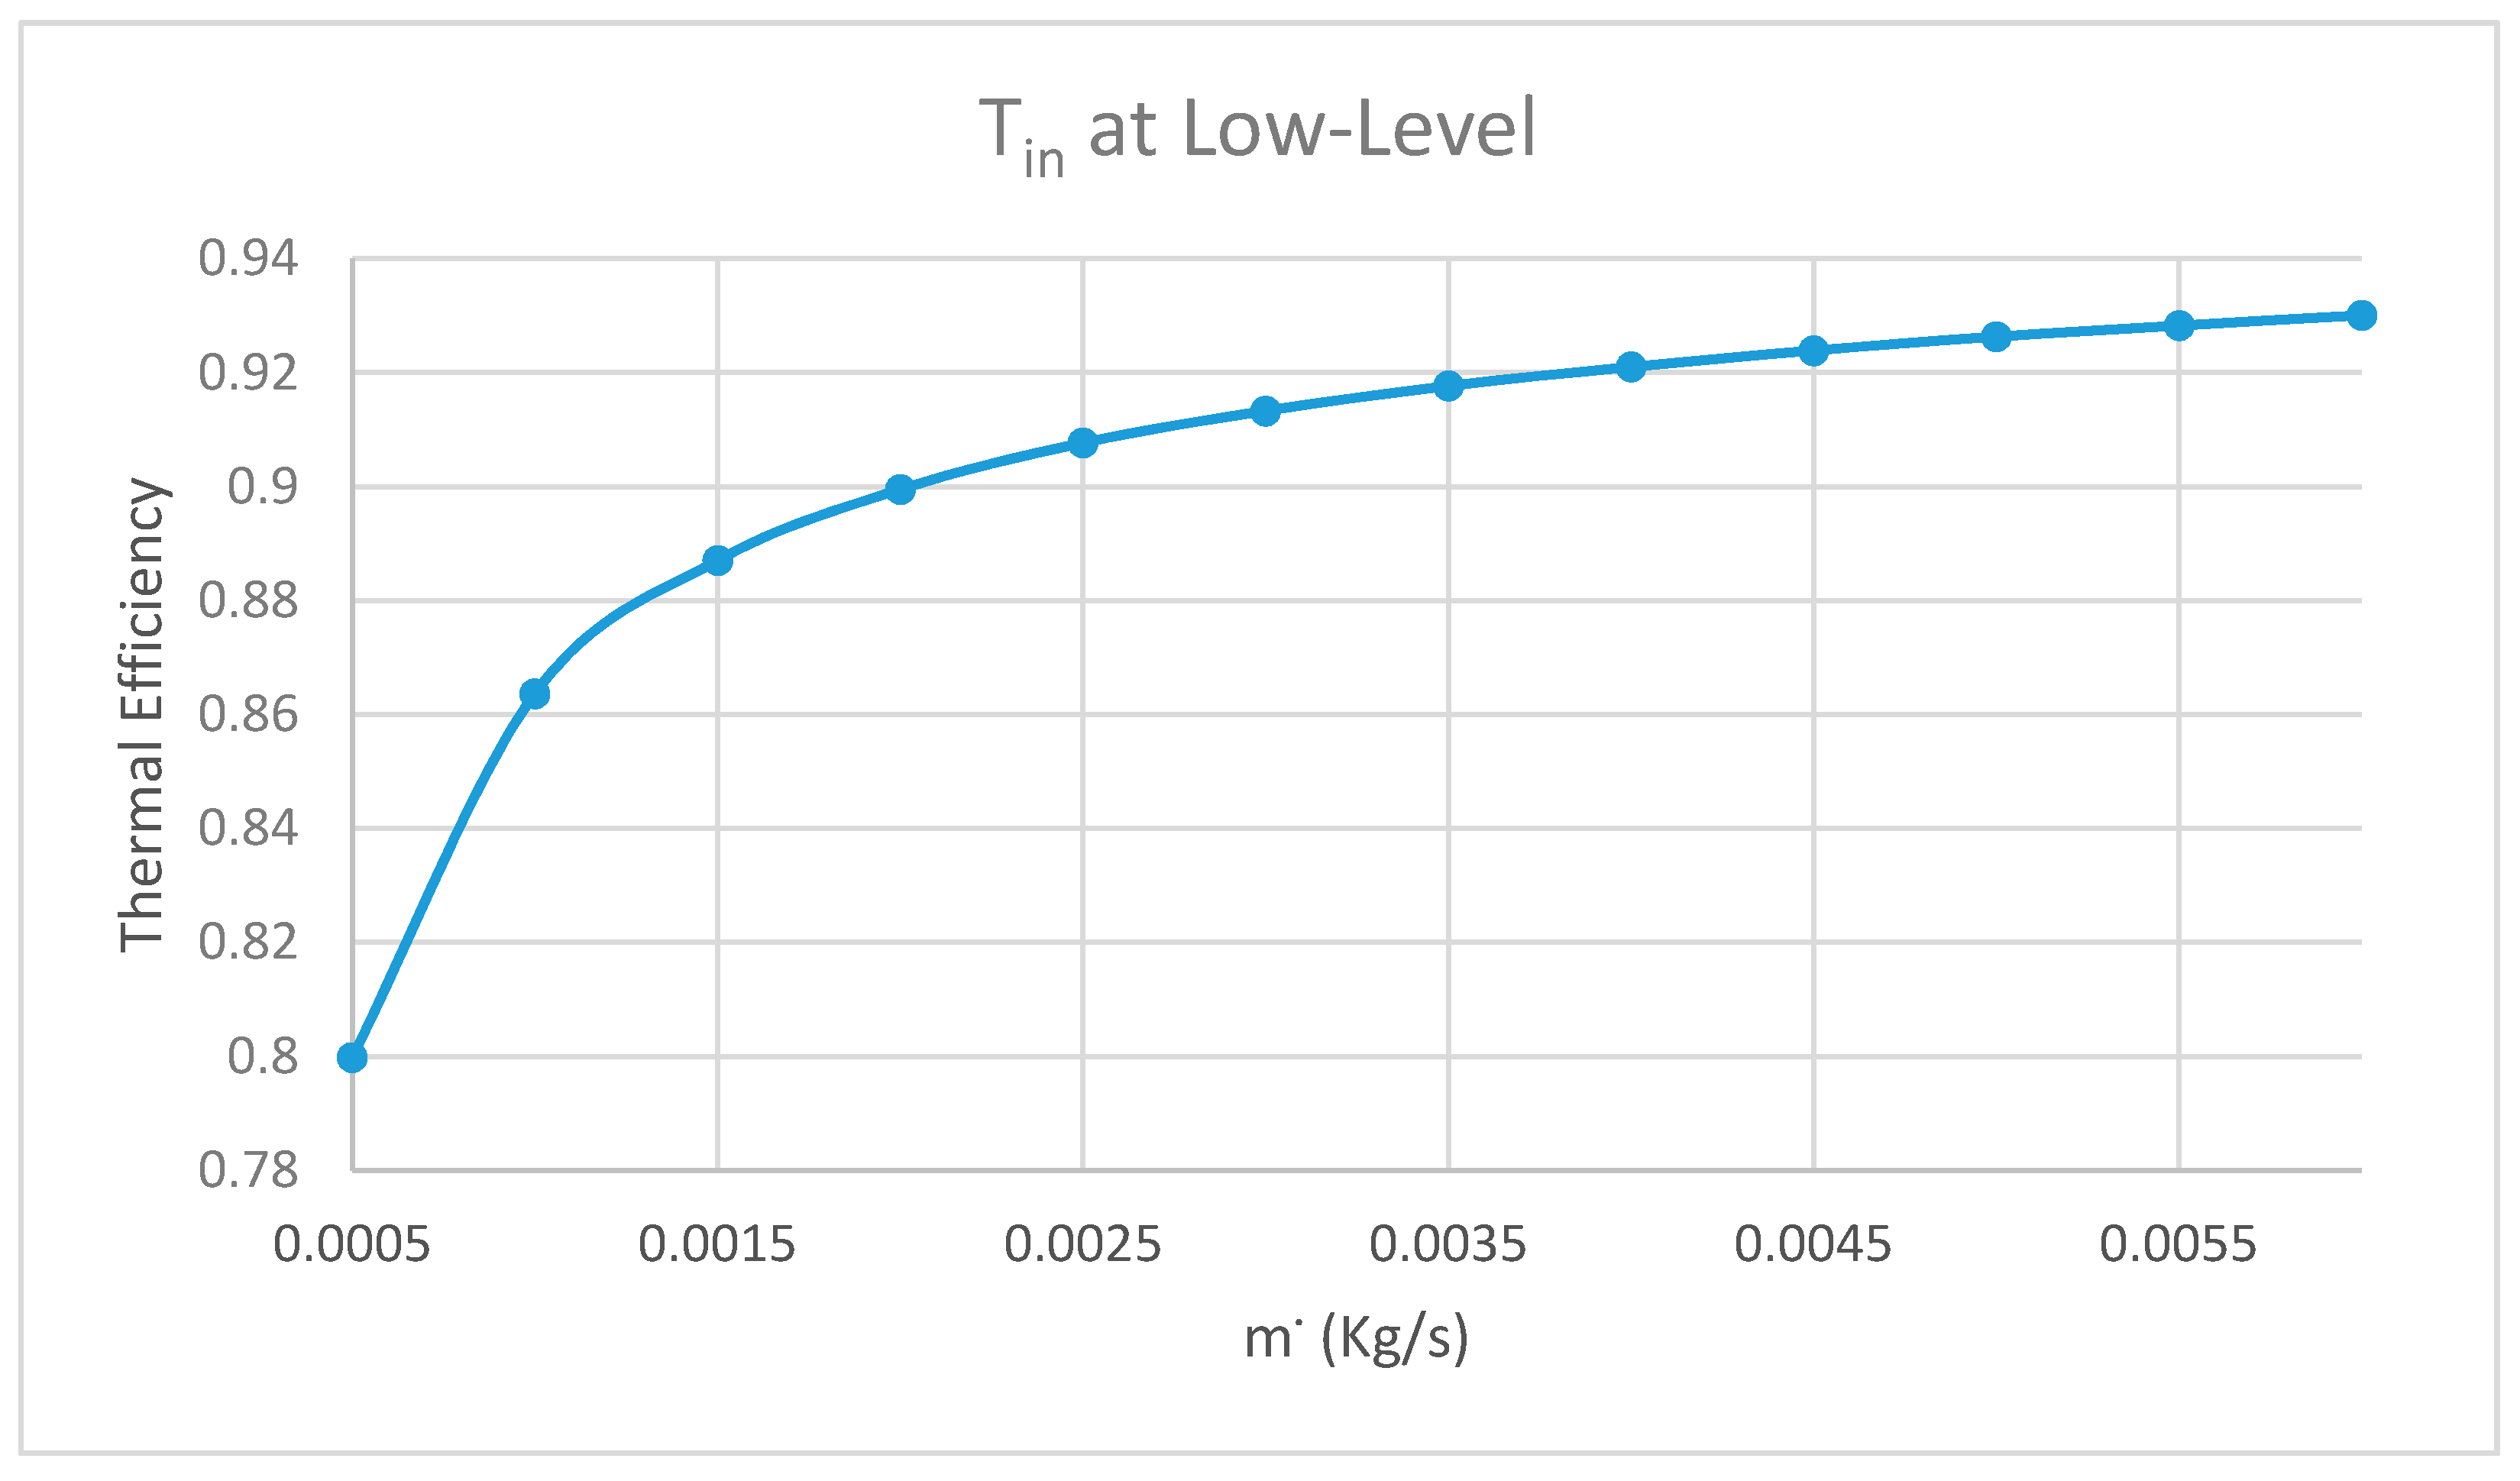
Figure 11.
The effect of inlet flowrate on at High-Level inlet temperature.

Figure 12.
Effect of flowrate on Outlet temperature at two levels flowrate.
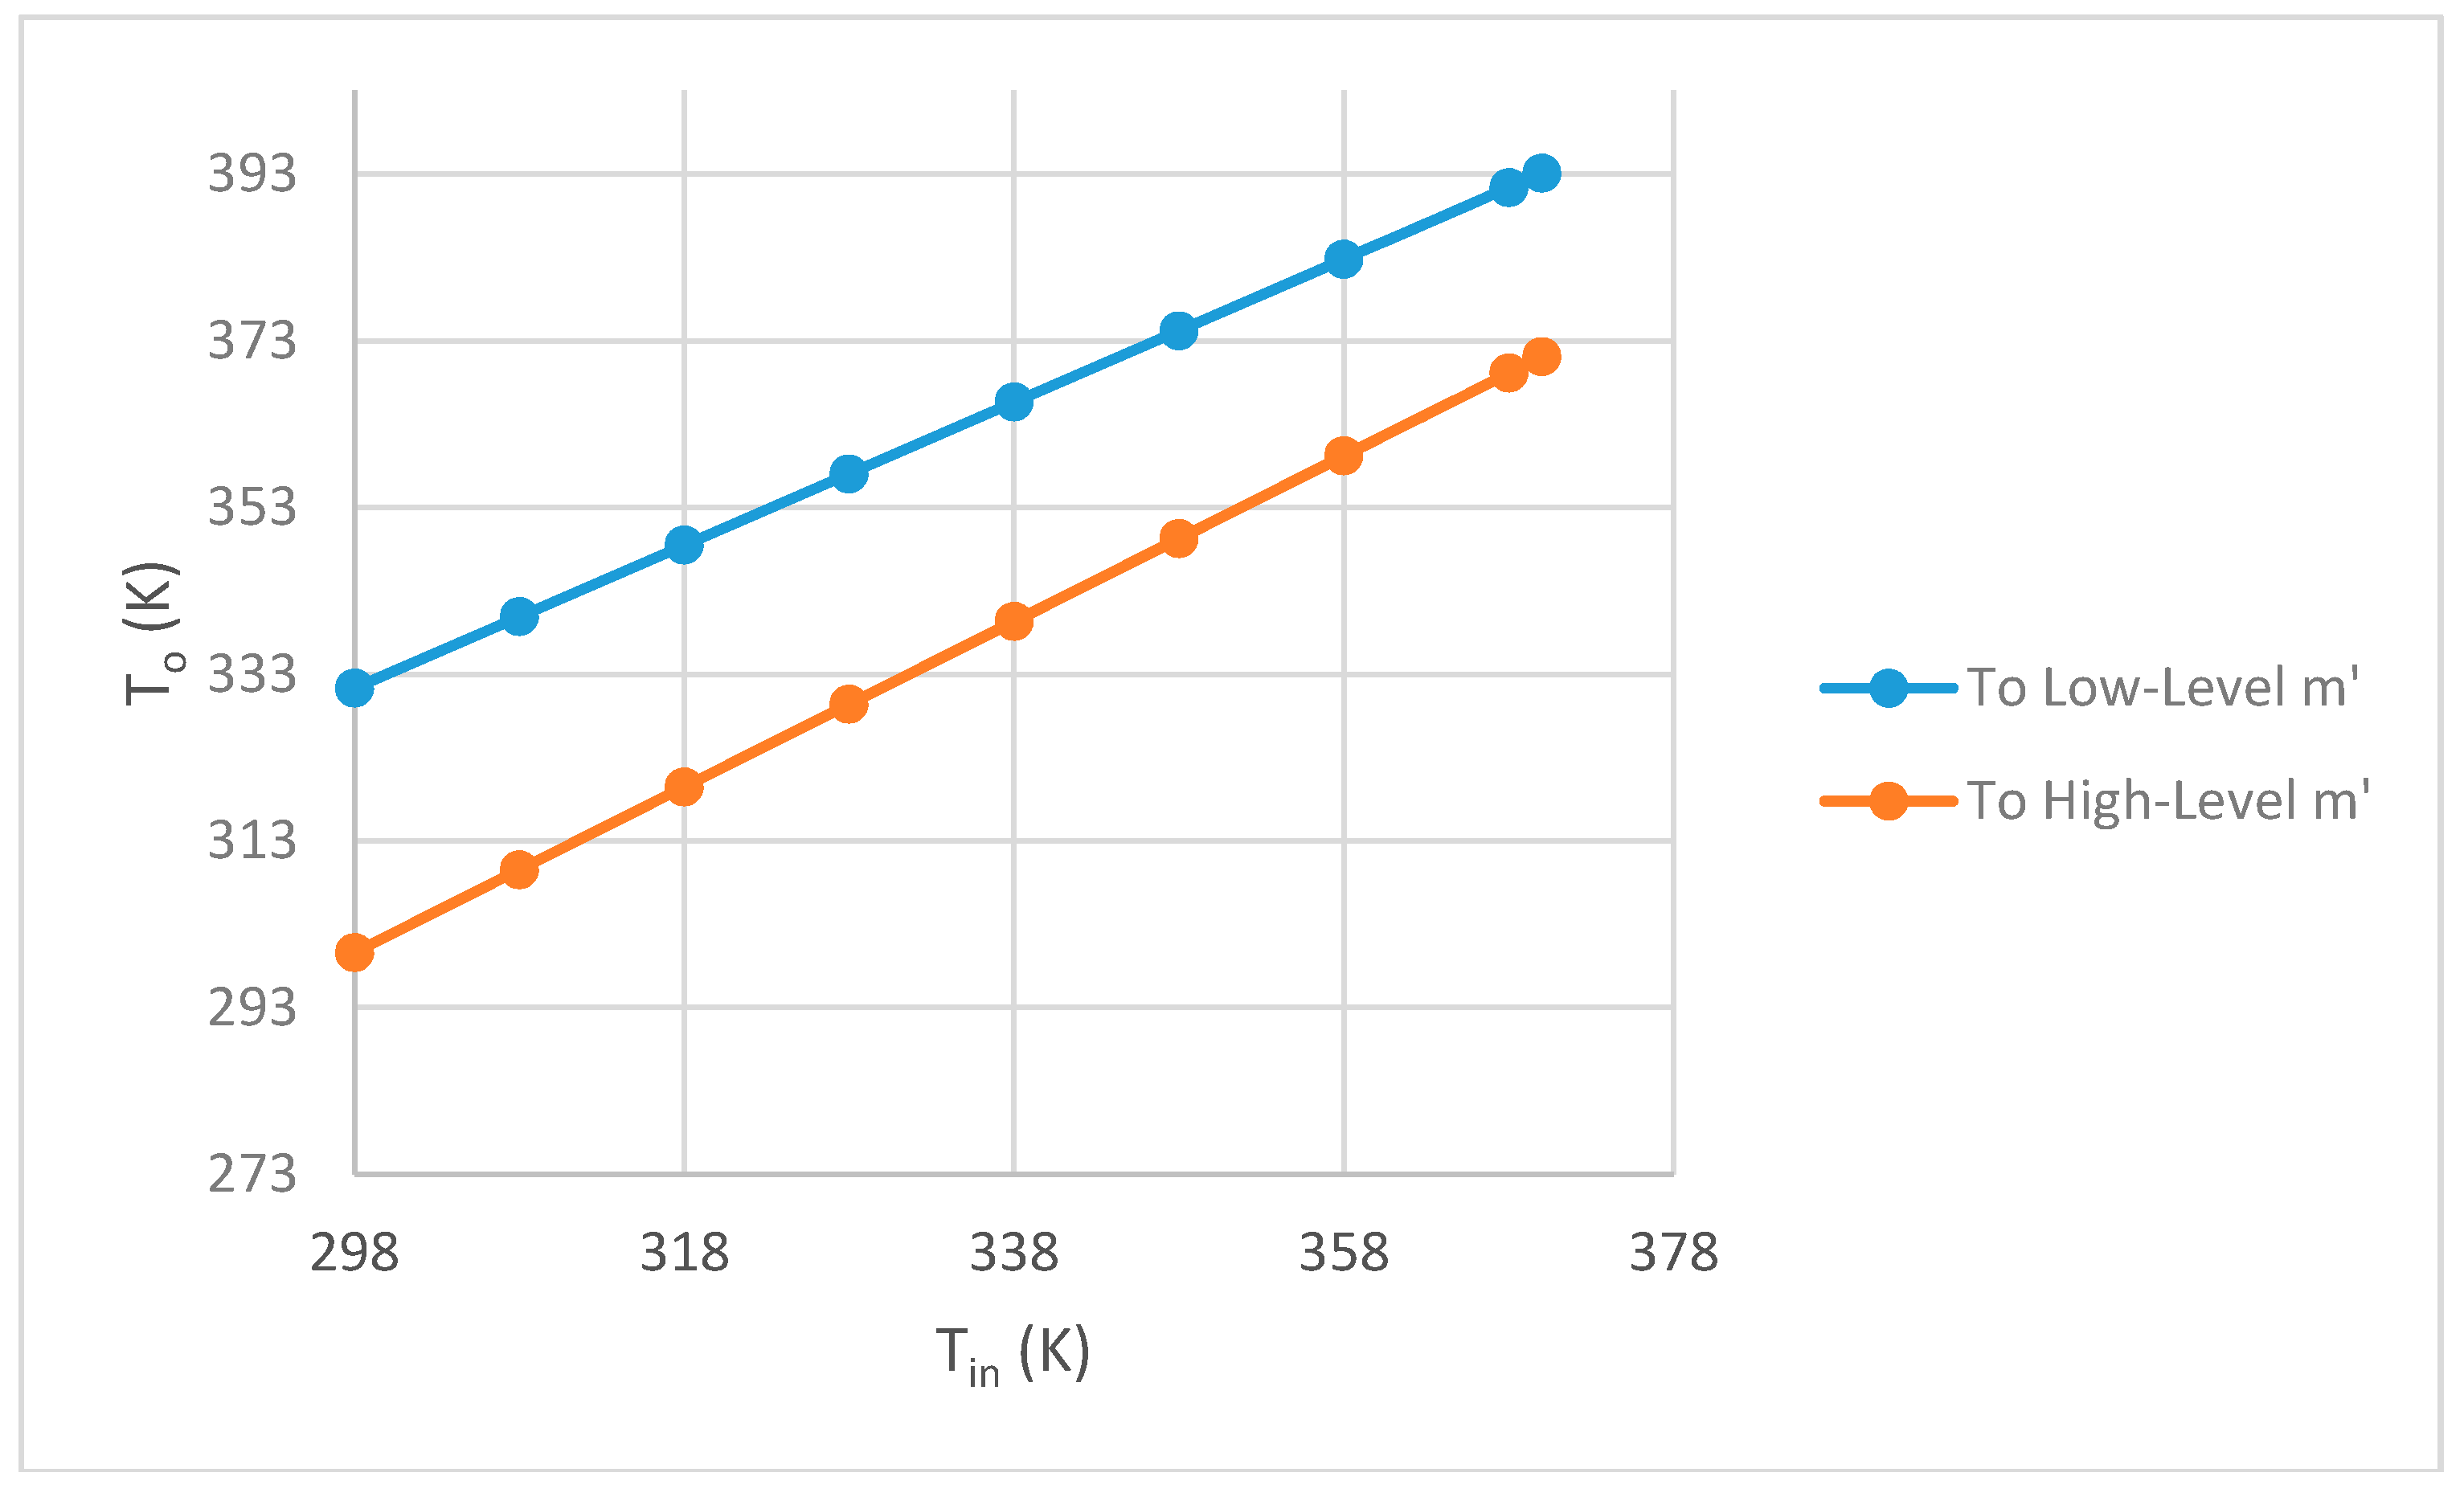
Figure 13.
Effect of flowrate on To − Tin at two levels flowrate.
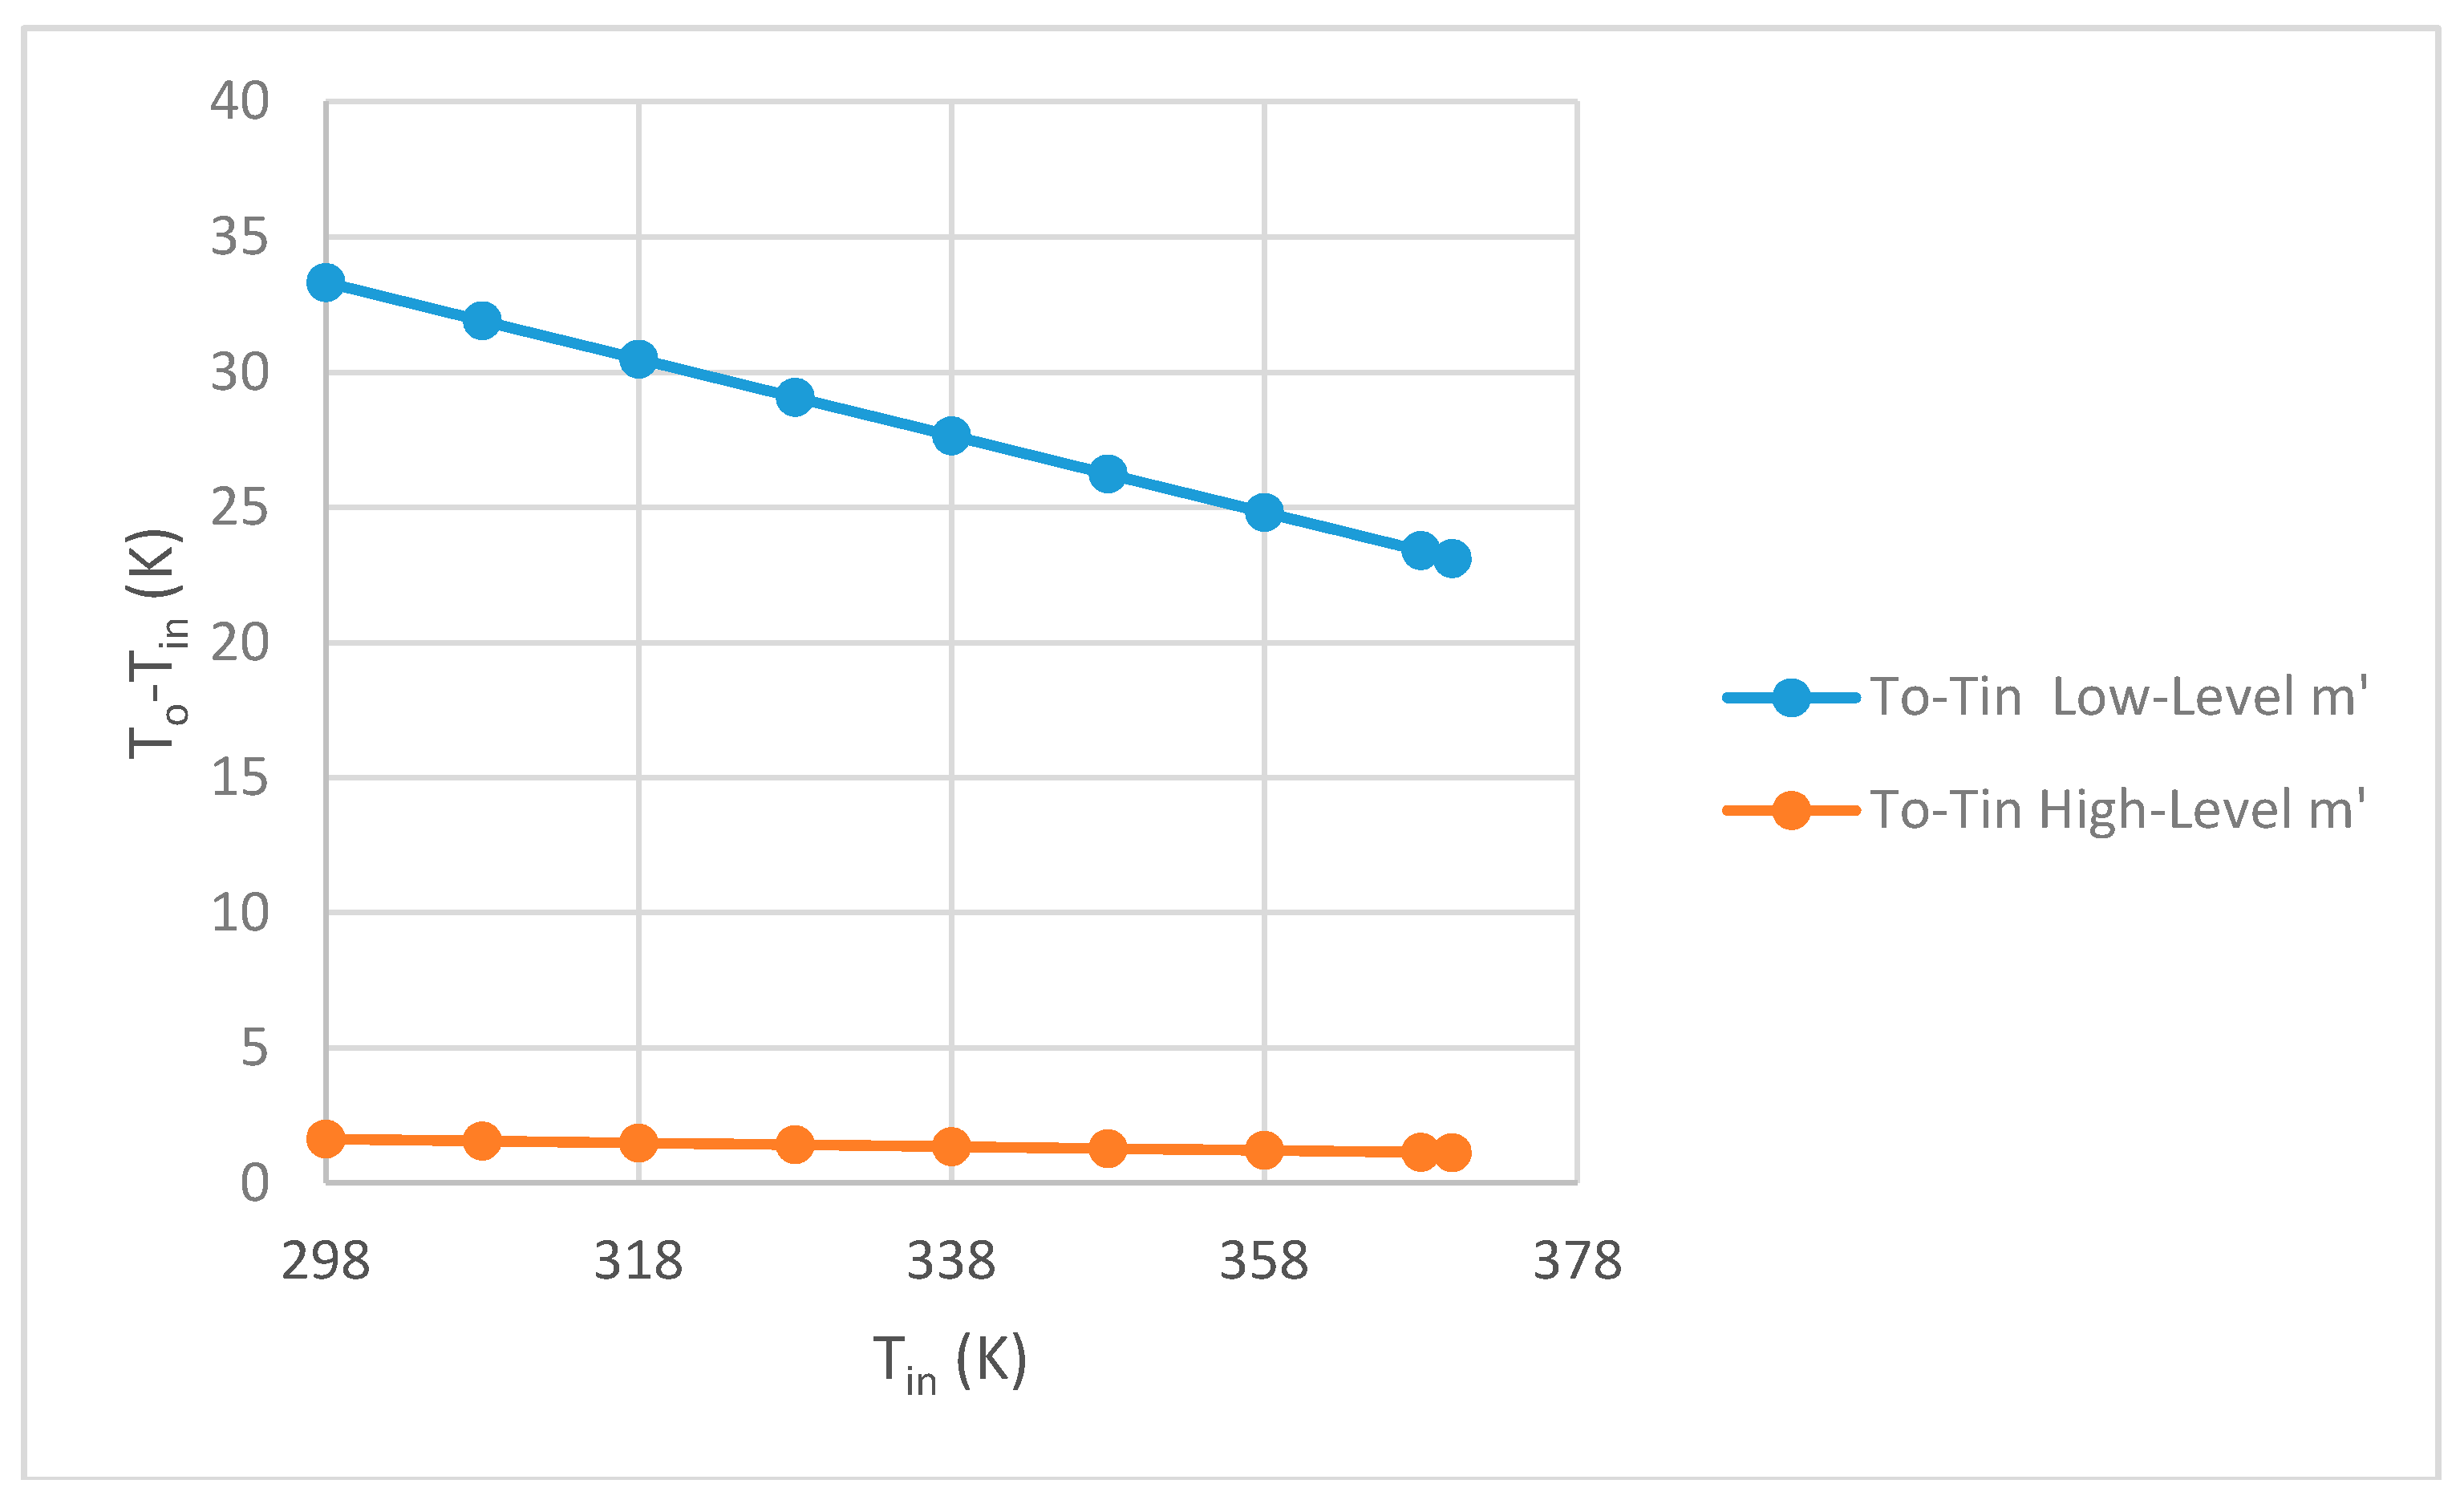
Figure 14.
Effect of flowrate thermal efficiency at two levels flowrate.
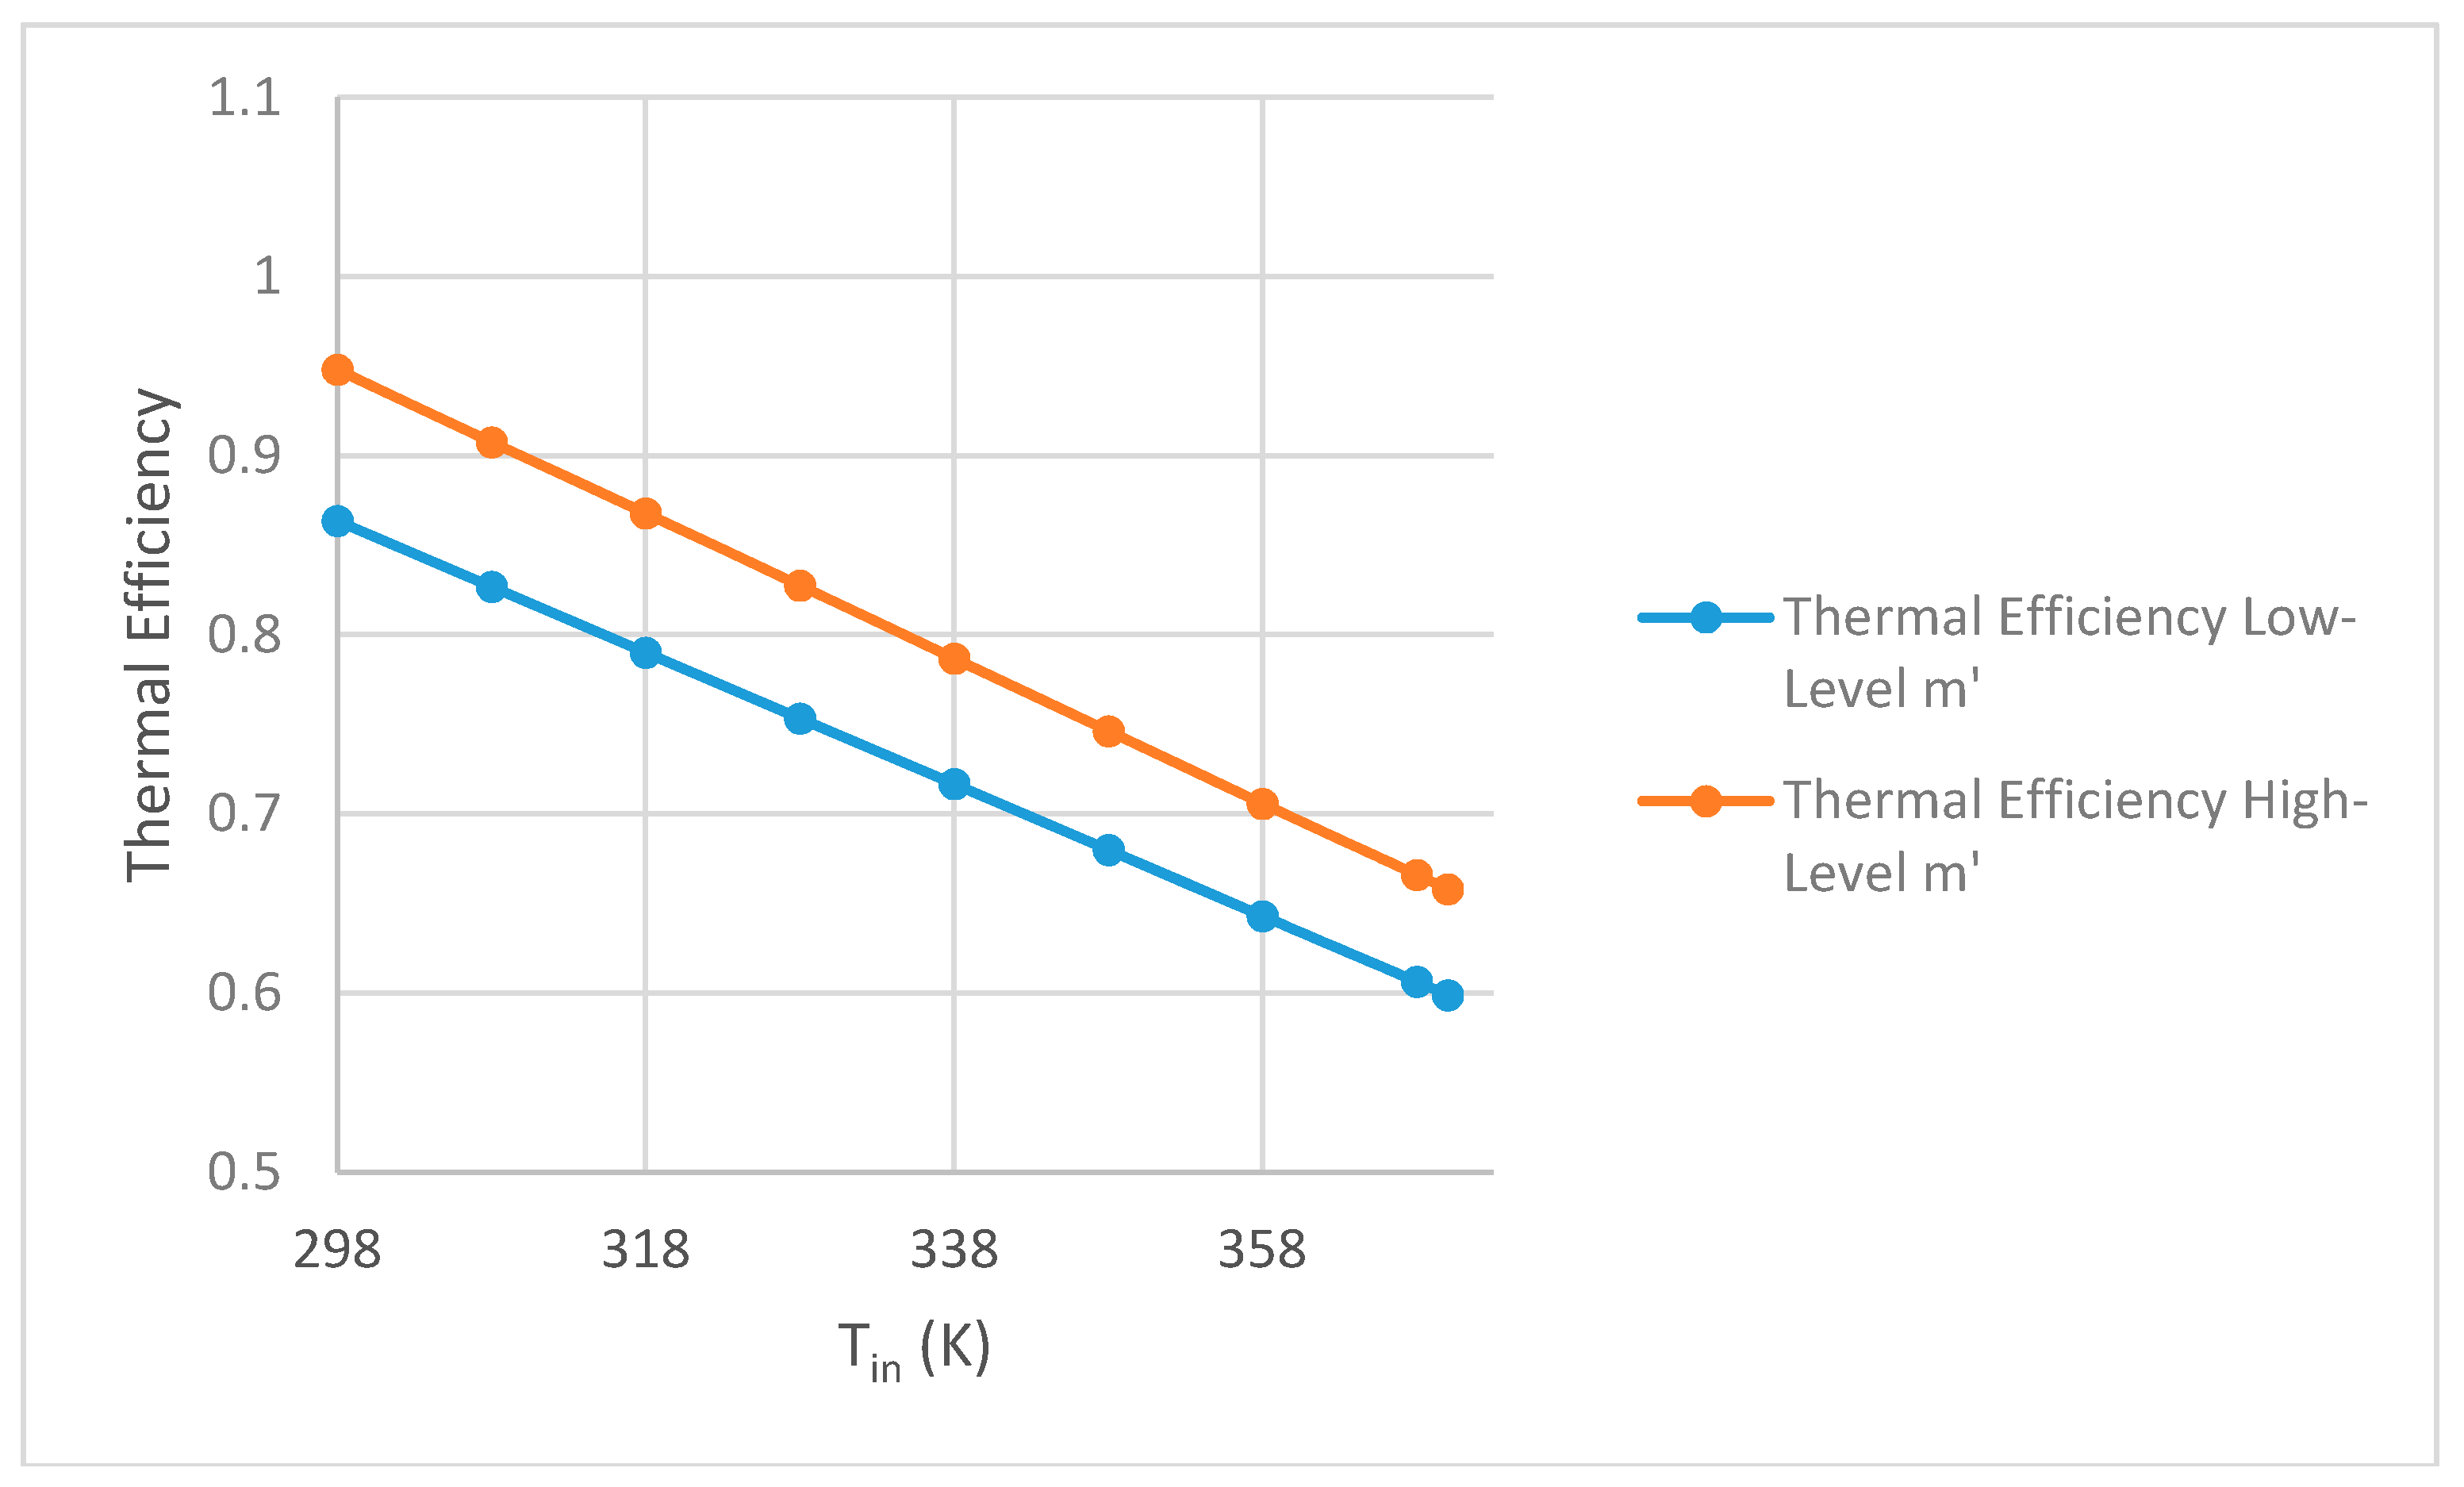
Figure 15.
Outlet water temperature for different inlet temperature versus flowrate.
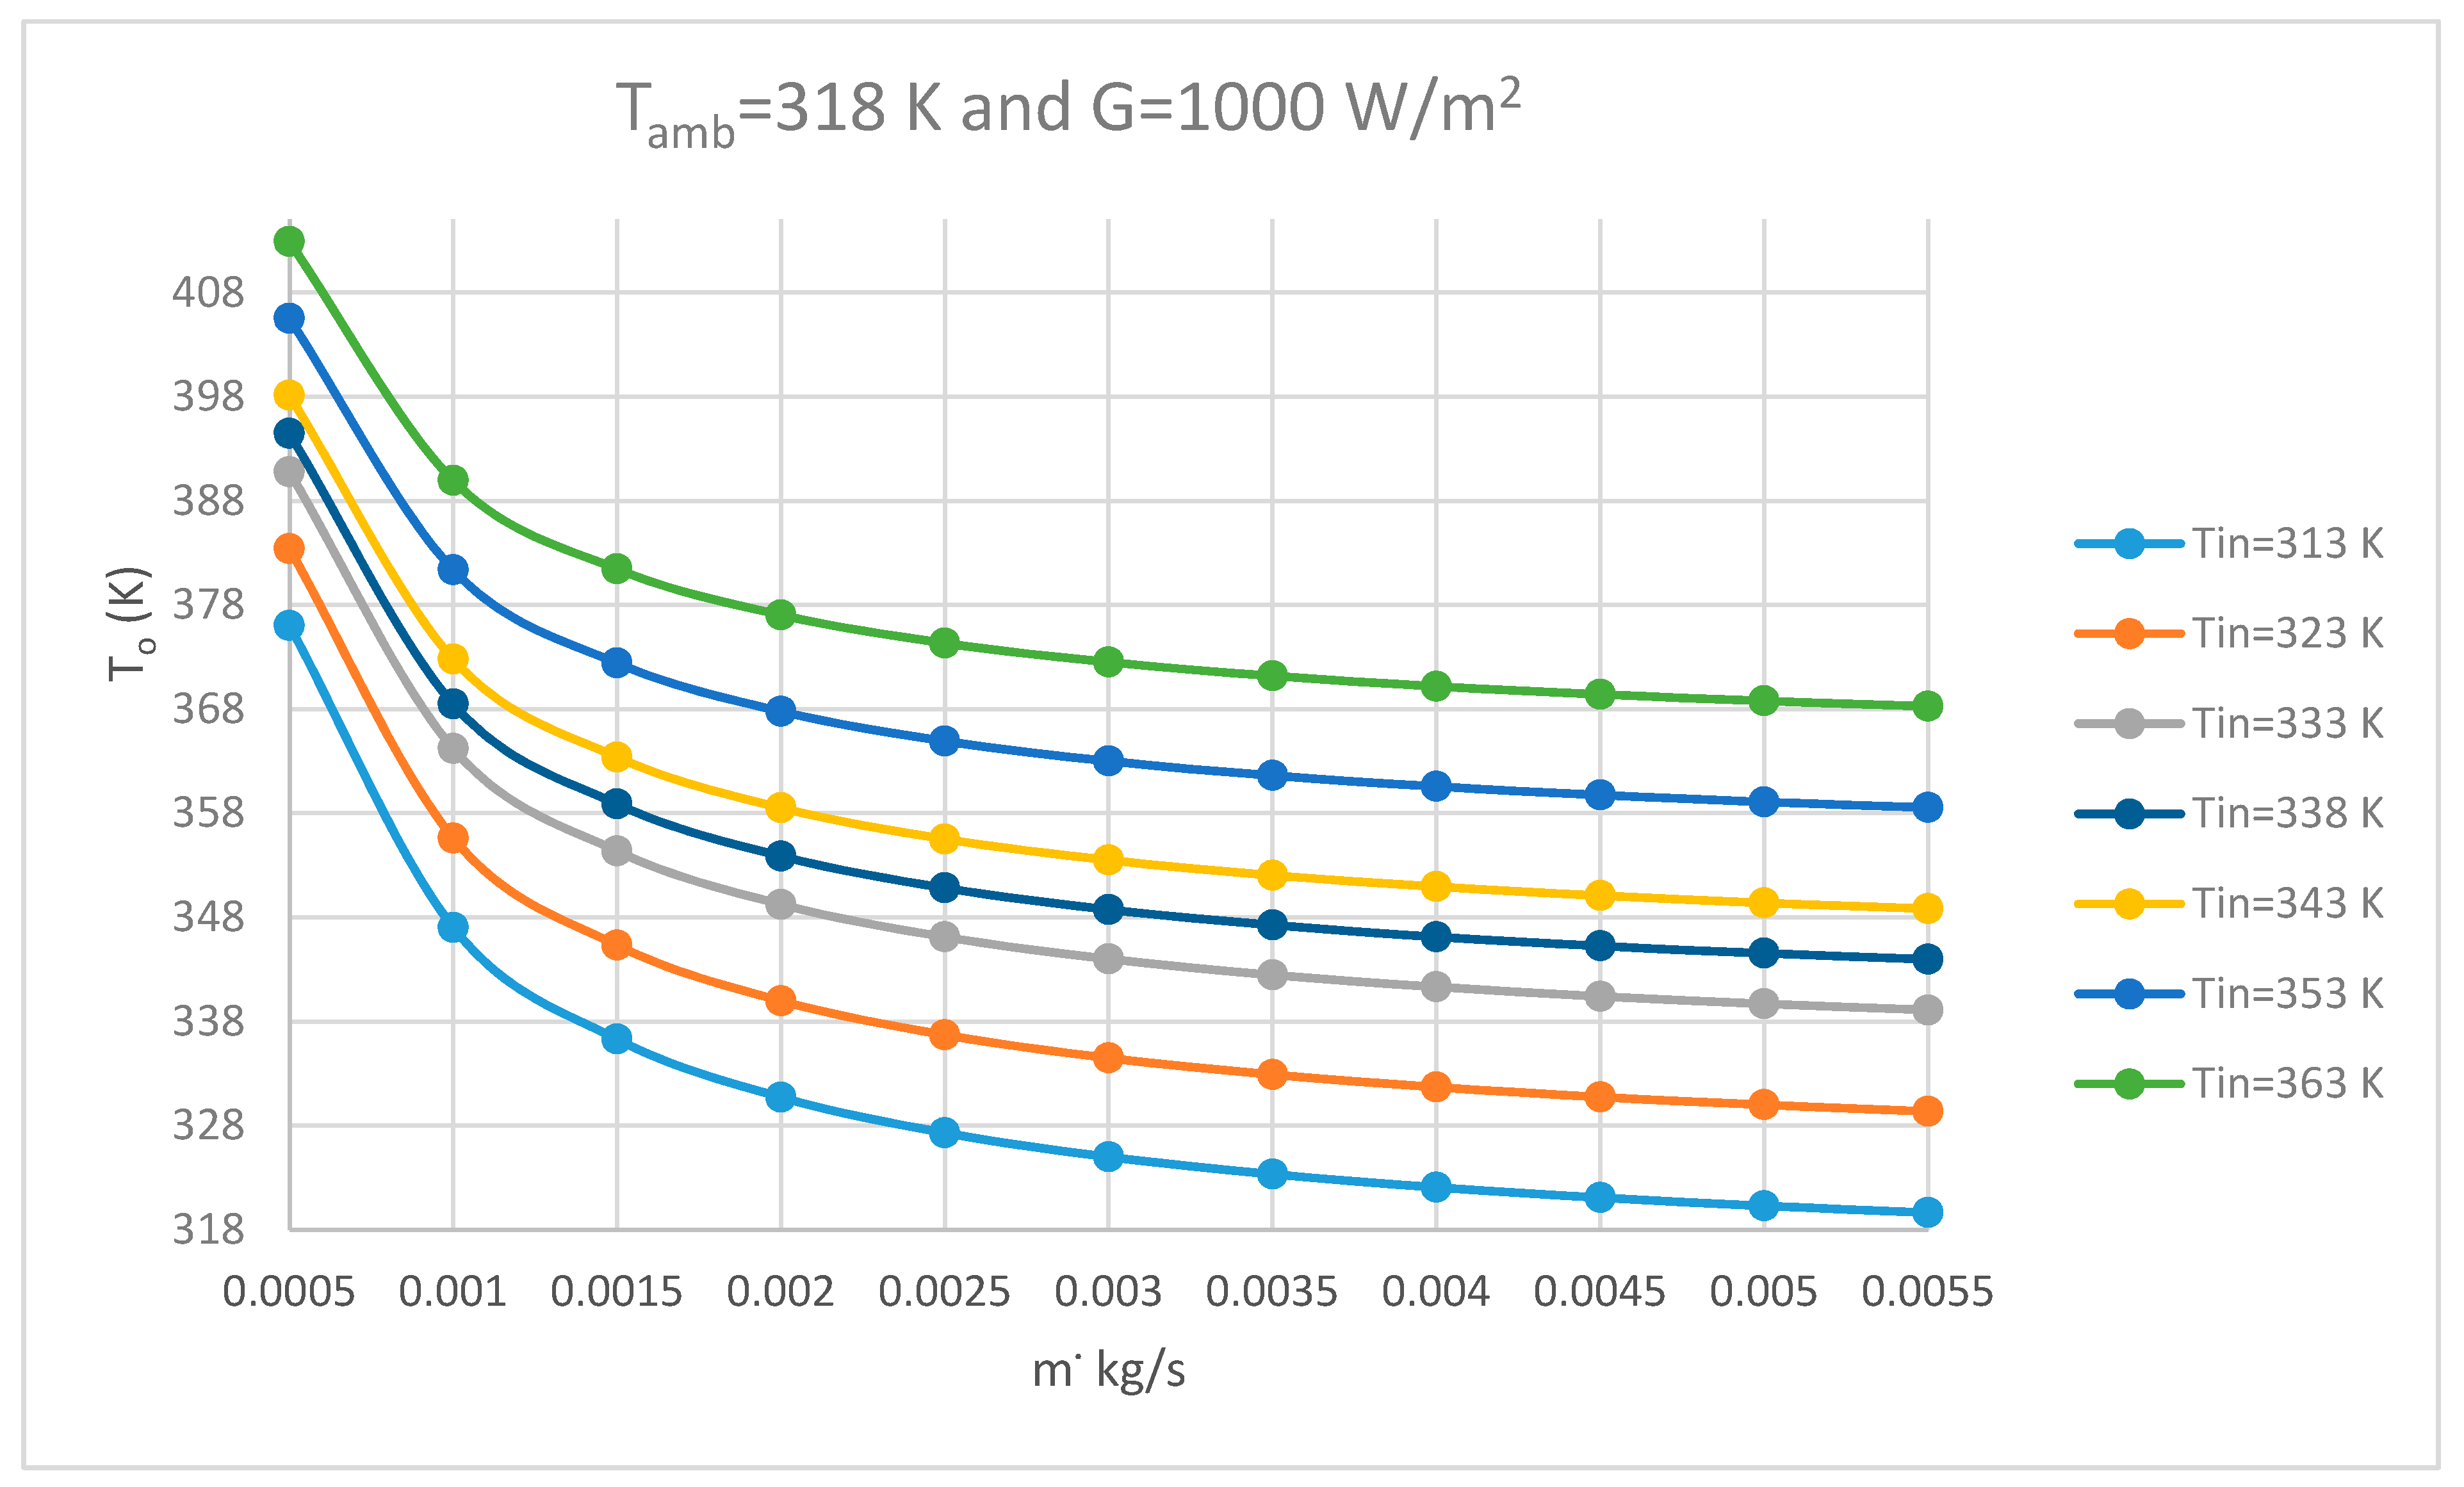
Figure 16.
Thermal efficiency () for different inlet temperature versus flowrate.

Figure 17.
Thermal efficiency of FPC versus energy loss parameter.


Table 1.
Summary of FPC (flat plate collector) for solar absorption cooling system.
| Collector Type | Ac (m2) | Solar Collector Efficiency | Cooling Capacity(kW) | COP (Coefficient of Performance) | Method | Reference |
|---|---|---|---|---|---|---|
| FPC (computational studies) | 5–220 | 0.27–0.50 | 2.7–3 (m2/kWc) | 0.1–0.82 | TRANSYS | [10] |
| 37.5 | 4.5 | TRANSYS | [6] | |||
| 38.4 | 17.6 | TRANSYS | [11] | |||
| 100 | 2.6 | TRANSYS | [12] | |||
| N/A | 10 | Analytical method | [7] | |||
| 25 | 10 | Transol | [13] | |||
| 38.4 | 17.6 | TRANSYS | [14] | |||
| FPC (experimental studies) | 42.2 | 0.24–0.55 | 4.5 | 0.30–0.8 | Outdoor | [4] |
| 90 | 30 | Outdoor | [6] | |||
| 90 | 30 | Outdoor | [15] | |||
| 500 | 100 | Outdoor | [16] |
Table 2.
Boundary conditions for the FPC.
| Boundary | Condition |
|---|---|
| Inlet temperature (Tin) | 298 K (If it is not mentioned) |
| Outlet temperature (To) | Pressure outlet |
| Maximum mass flowrate | 0.0225 kg/s |
| Ambient temperature (Tamb) | 298 K |
| Side walls | Adiabatic walls |
| The absorber plate | Heat flux (q) = α·τ·G |
| The bottom layer | h = 2.8 + 3Vw |
| Wind speed | 1 m/s |
Table 3.
FPC materials properties.
| Material | Density (kg/m3) | Thermal Conductivity (W/(m K)) | Heat Capacity (J/(kg K)) |
|---|---|---|---|
| Glass | 2500 | 1.4 | 750 |
| Absorber | 8954 | 386 | 385 |
| Insulation | 200 | 0.044 | 840 |
© 2018 by the authors. Licensee MDPI, Basel, Switzerland. This article is an open access article distributed under the terms and conditions of the Creative Commons Attribution (CC BY) license (http://creativecommons.org/licenses/by/4.0/).
Share and Cite
MDPI and ACS Style
Alobaid, M.; Hughes, B.; Heyes, A.; O’Connor, D. Determining the Effect of Inlet Flow Conditions on the Thermal Efficiency of a Flat Plate Solar Collector. Fluids 2018, 3, 67. https://doi.org/10.3390/fluids3030067
AMA Style
Alobaid M, Hughes B, Heyes A, O’Connor D. Determining the Effect of Inlet Flow Conditions on the Thermal Efficiency of a Flat Plate Solar Collector. Fluids. 2018; 3(3):67. https://doi.org/10.3390/fluids3030067
Chicago/Turabian StyleAlobaid, Mohammad, Ben Hughes, Andrew Heyes, and Dominic O’Connor. 2018. "Determining the Effect of Inlet Flow Conditions on the Thermal Efficiency of a Flat Plate Solar Collector" Fluids 3, no. 3: 67. https://doi.org/10.3390/fluids3030067