Experimental Analysis of a Bubble Wake Influenced by a Vortex Street


Institute of Multiphase Flows, Hamburg University of Technology, Eissendorfer Str. 38, D-21073 Hamburg, Germany
*
Author to whom correspondence should be addressed.
Fluids 2018, 3(1), 8; https://doi.org/10.3390/fluids3010008
Submission received: 29 November 2017
/
Revised: 16 January 2018
/
Accepted: 18 January 2018
/
Published: 20 January 2018
(This article belongs to the Special Issue Flow and Heat or Mass Transfer in the Chemical Process Industry)
Abstract
:Bubble column reactors are ubiquitous in engineering processes. They are used in waste water treatment, as well as in the chemical, pharmaceutical, biological and food industry. Mass transfer and mixing, as well as biochemical or chemical reactions in such reactors are determined by the hydrodynamics of the bubbly flow. The hydrodynamics of bubbly flows is dominated by bubble wake interactions. Despite the fact that bubble wakes have been investigated intensively in the past, there is still a lack of knowledge about how mass transfer from bubbles is influenced by bubble wake interactions in detail. The scientific scope of this work is to answer the question how bubble wakes are influenced by external flow structures like a vortex street behind a cylinder. For this purpose, the flow field in the vicinity of a single bubble is investigated systematically with high spatial and temporal resolution. High-speed Particle Image Velocimetry (PIV) measurements are conducted monitoring the flow structure in the equatorial plane of the single bubble. It is shown that the root mean square (RMS) velocity profiles downstream the bubble are influenced significantly by the interaction of vortices. In the presence of a vortex street, the deceleration of the fluid behind the bubble is compensated earlier than in the absence of a vortex street. This happens due to momentum transfer by cross-mixing. Both effects indicate that the interaction of vortices enhances the cross-mixing close to the bubble. Time series of instantaneous velocity fields show the formation of an inner shear layer and coupled vortices. In conclusion, this study shows in detail how the bubble wake is influenced by a vortex street and gives deep insights into possible effects on mixing and mass transfer in bubbly flows.
1. Introduction
The efficiency of process engineering operations strongly depends on the transport of heat, mass, and momentum. As the transport from a dispersed phase into a bulk phase is often the limiting step, fundamental knowledge of phenomena close to fluidic interfaces is crucial to selectively improve chemical reactors like, e.g., bubble columns, stirred tanks or jet loop reactors. The hydrodynamics of bubbly flows is dominated by bubble wake interactions. There is a large number of experimental, as well as numerical studies dealing with the characterization of bubble wakes. While there are good standard references on mass transfer and multiphase flows [1,2], Fan and Tsuchiya were the first who collected the state of the art for a book dealing with bubble wakes [3]. There are many experimental studies dealing with single rising bubbles, e.g., [4,5,6,7,8] or bubble swarms, e.g., [9]. It is known that bubbles are able to induce turbulence [10] and that they can enhance mixing processes [11]. Furthermore, the primary bubble wake is known to dictate transport phenomena in multiphase systems [3]. There are also recent numerical studies on reactive mass transfer from single bubbles which are much elaborated [12,13,14]. Despite the great amount of carefully performed studies, the question of how bubble wakes are influenced by external flow structures is still not answered completely. Due to the wide knowledge of flows around cylinders [15,16,17,18], an experiment has been designed with the aim to investigate the influence of a vortex street generated within a cylinder wake on the hydrodynamics of a single bubble, which is fixed in place.
There are studies on fixed bubbles presented in literature: No et al. [19] and Tokuhiro et al. [20] compared the flow around a bubble, which is kept in place by a cap, to the flow around a solid ellipsoid. They found a major difference in turbulent production terms. Tokuhiro et al. [21] investigated the hydrodynamics around two confined bubbles. They observed wake interaction and a jet-like flow between the bubbles. When comparing a confined ellipsoidal bubble to a solid ellipsoid, Tokuhiro et al. [22] found the turbulent kinetic energy to be more uniformly distributed directly behind the bubble than it was directly behind the solid body.
The flow behind one or two cylinders has been studied extensively in the literature for many years [23,24]. It is well known how Strouhal numbers, i.e., dimensionless frequencies, depend on Reynolds numbers. There are correlations for different Reynolds numbers. Roshko [23] proposed the following correlations:
Due to the wide knowledge of von Karman vortex streets, a cylinder can be used to produce well-defined vortices with a certain frequency. There are two flow instability points that describe the bifurcation process in the subcritical Reynolds number regime: The first flow instability that occurs in the cylinder wake is at Re = 49. From this point, it is unsteady, but two-dimensional. At Re = 190, the second instability occurs, and the cylinder wake becomes three-dimensional and is no longer laminar [25]. The wake transition regime occurs at Re = 190 [25,26]. The irregular regime of the von Karman vortex street is found for Reynolds numbers higher than Re = 300 [23,25].
A thorough understanding of processes at fluidic interfaces and how they are influenced by external structures is crucial to specifically influence multiphase processes in the future. This study is a first step towards this aim. It deals with the interaction of a cylinder wake and a fixed bubble held in place by a cap. The cap ensures a nearly spherical bubble shape. Strouhal numbers of the bubble wake and the cylinder wake are calculated on the basis of Particle Image Velocimetry (PIV) data. The fluctuating motions behind the bubble are monitored, and the velocity field of the bubble is characterized for different Reynolds numbers. This paper is organized as follows: In Section 2, the experimental setup is depicted, and the data processing is described. Section 3 consists of three parts. The first part gives information about the cylinder wake, which is used to create vortical structures within the fluid flow that approaches the bubble. The second part shows the analysis of the flow situation around the single bubble without an upstream cylinder wake. Finally, the third part illustrates the flow structure of the flow around the single bubble influenced by cylinder wakes.
2. Experimental Set-up and Data Processing
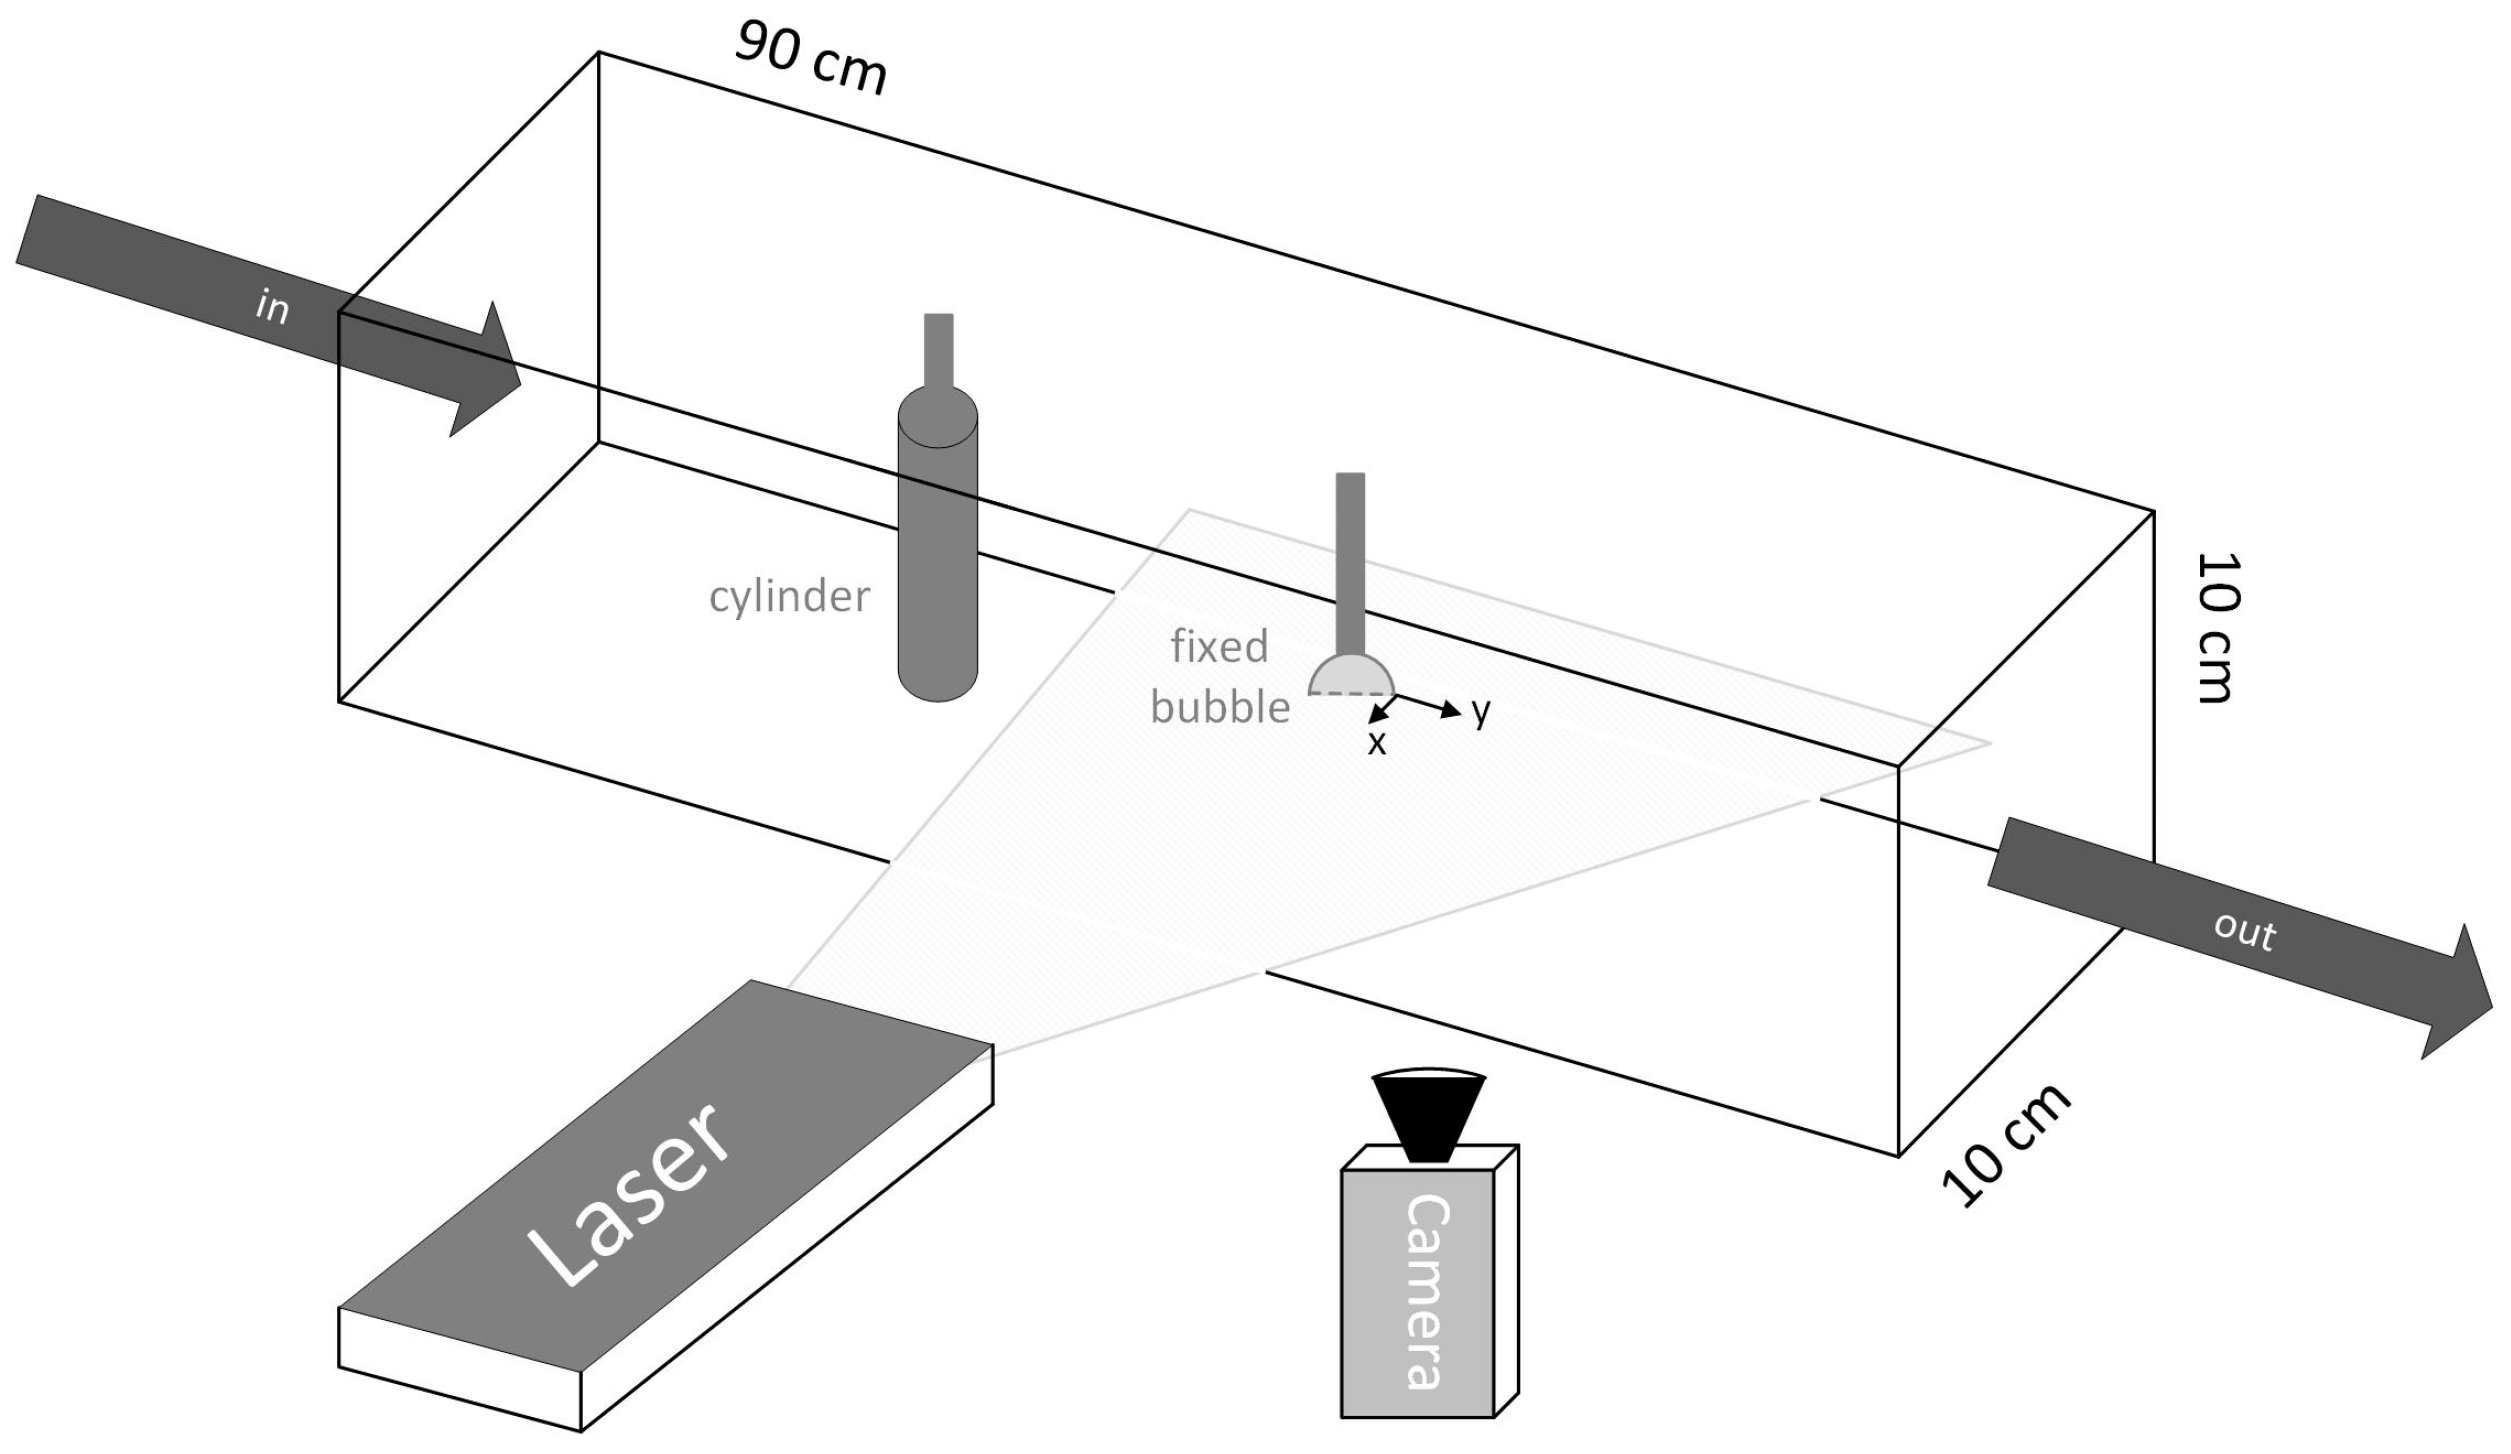
2D2C high-speed PIV measurements are conducted in a duct made from acrylic glass with a cross-section of 0.1 × 0.1 m2. Demineralized water with PIV seeding particles (details are listed in Table 1), which have a density very close to water, is supplied continuously through the duct with adjustable volumetric flow rates (250–875 L/h). The single bubble is produced by a hypodermic needle, which is pushed through a septum into the fluid flow. The bubble (CO2 or air) is kept in place using a spherical cap. A cylinder is brought into the duct to produce vortices of different frequencies by means of a von Karman vortex street. The streamwise distance between the cylinder and the bubble is varied while the transverse distance is held constant. In Figure 1, the staggered configurations of bubble and cylinder within the duct are sketched in detail. The first configuration (Figure 1a) has the cylinder diameter as the distance between the bubble and cylinder; the second (Figure 1b) has several cylinder diameters as the distance. This is chosen in order to observe different wake interactions.
PIV experiments are conducted to characterize the flow field around the bubble and to monitor the influence of the cylinder wake. For this purpose, the laser light sheet (thickness ≈ 1 mm), which is produced using a light sheet optics with a 50° rod lens (ILA_5150 GmbH, Aachen, Germany), is adjusted at the equatorial plane of the bubble (see Figure 2). In Table 1, the experimental parameters are summarized. The temperature of the fluid is held nearly constant, and the experiments are conducted under atmospheric pressure.
The high-speed images with an equidistant timing of 2 ms between the images are processed using commercial software (see Table 1). A Fast Fourier Transformation (FFT) correlation with a multi-grid refinement algorithm is used. Peak search is conducted using the least squares Gauss algorithm.
In Figure 3, a raw PIV image and the related instantaneous velocity field is shown. The axis coordinates, as well as the velocity magnitude values are given in physical coordinates to obtain a first overview of the flow case. The direction of flow is from left to right. Later on in this study, velocity fields are shown turned 90° counterclockwise. This is done for an easier readability when comparing to velocity profiles. Velocity vector arrows are included, as well as stream traces. By following the stream traces, one can easily observe the vortices generated within the cylinder wake approaching the bubble.
Via MATLAB® (The MathWorks, Natick, MA, USA), the PIV data are processed further. Fast Fourier Transformation (FFT) is used to obtain frequencies dominating the bubble wake or the cylinder wake, respectively. Strouhal numbers are calculated using the frequencies obtained by FFT. The frequency analysis is carried out 1 cm downstream of the bubble or the cylinder (see Figure 4).
At this point, the velocity fluctuations over time perpendicular to the flow are monitored (see Figure 4). An FFT leads to a spectrum of frequencies with a sharp peak. This frequency f is the frequency of the wake and can therefore be used to characterize it. This is taken to calculate the Strouhal number of the bubble:
with the frequency f, the bubble diameter db and the mean velocity that approaches the bubble . For , which is calculated from the volumetric flow rate and the cross-section of the duct Aduct:
the conservation of mass is used. This is done because due to the field of view, a complete flow profile of the duct flow is not obtained. Due to a preferably high spatial resolution (see Table 1), the whole duct was not recorded. With the so calculated velocity, also the Reynolds numbers:
are calculated (kinematic viscosity ). If the cylinder is characterized (, ), the diameter of the cylinder is used as a characteristic length.
3. Results and Discussion
3.1. Characterization of the Vortex Street
The vortex street arising from the flow around the circular cylinder is analyzed via the calculation of Strouhal numbers for several Reynolds numbers. Table 2 shows the results in combination with well-established correlations from the literature [23], which are depicted in Section 1. The flow regimes are also added to the table so that it becomes clear that the laminar and irregular vortex street with three-dimensional effects can be produced within the experimental setup. It is visible that the Strouhal numbers achieved in the experimental setup deviate from the theoretical values. Slightly different geometric relationships may be the reason for this fact: The cylinder diameter is 2 cm, and the hydraulic diameter of the duct is 10 cm (see Figure 1). Therefore, the vortex street can be influenced by the proximity of the walls. The geometry of the duct is chosen this way to obtain the best optical access to investigate the bubble. The optical access can be limited by choosing, e.g., a large cross-sectional area.
From the comparably high Strouhal numbers achieved in this work, it can be deduced that the wake is stable and remains more two-dimensional than an ideal von Karman vortex street would. This is found when comparing the results to data from numerical simulation in the transition regime [25]. Furthermore, the cylinder has a mean averaged surface roughness of 8.8 µm. In many literature references, also the one used for Table 2 [23], there is no information about surface roughness. The cylinder used may therefore be rougher than the ones used by other authors. This can lead to an enhanced detachment of the boundary layer and, thus, to enhanced vortex shedding. However, Chen [24] summarizes that the roughness does not have a great influence on the subcritical Reynolds number regime (). Nevertheless, there is a noticeable frequency of velocity fluctuation (see Table 2). In particular, the vortices generated behind the cylinder are very well visible when having a look at the streamlines in Figure 3. Therefore, it can be concluded the von Karman vortex street is generated successfully.
3.2. Characterization of the Single Bubble
In the following, the fluid flow around the single bubble (no cylinder) is characterized. This is done by a frequency analysis and by the analysis of the streamwise velocity component . Since only the equatorial plane of the bubble is illuminated by the laser light sheet (2D experiments), the velocity is evaluated for three azimuthal angles . By monitoring several Reynolds numbers, an overview of the flow structure depending on the relative velocity between the bubble and the liquid is obtained.
A dependency of the frequencies behind the bubble on the Reynolds number is clearly visible in Figure 5. There, the Strouhal number of the single bubbles (right red y axis) and the frequency of velocity fluctuations (left blue y axis) is plotted against the Reynolds number of the bubble. For the flow regime investigated in this work, no asymptotic value for the Strouhal number is achieved. For the Reynolds numbers in this regime, Strouhal numbers between 0.1 and 0.18 are expected, similar to the cylinder Strouhal number. This can be estimated from the first equation given in Section 1. While the Strouhal numbers for the lower three Reynolds numbers are slightly below the values estimated from the equation, the Strouhal number for Re = 148 is higher. The differences of the values that are presented in Figure 5 may arise due to the fluidic interface; they can also be caused by three-dimensional effects. In Section 1, critical points for the cylinder wake are mentioned. For the bubble, the three-dimensional effects are different from the ones of the cylinder wake. For spheres, a large amount of information is available from the literature [27]. In contrast to flow past cylinders, the wake structure behind spheres looks different and stays planar up to Re = 350. However, there is still a lack of information regarding the flow past spheres with the fluidic interface, as is the case for a bubble in three-dimensional flow. For this reason, a clear statement concerning three-dimensional effects in the bubble wake cannot be made, and further research is needed. Furthermore, it is also likely that the differences arise due to experimental limits. For example, there is only a given amount of frequencies that can be calculated during the FFT. When the flow is non-linear and the data are noisy, higher order dynamic mode decomposition can be used to calculate dominant frequencies [28]. However, with the given temporal resolution (see Table 1), the data basis in this study is considered to be large enough. It is worth noting that the Reynolds numbers in this work are in a low-to-medium regime. For bubbles, there are only Strouhal number correlations for much higher Reynolds numbers [2,29]. The duct Reynolds numbers are added to an upper x axis. The fact that the data points at the highest Reynolds number are already in a transitional regime () can be an explanation for the remarkably higher Strouhal number.
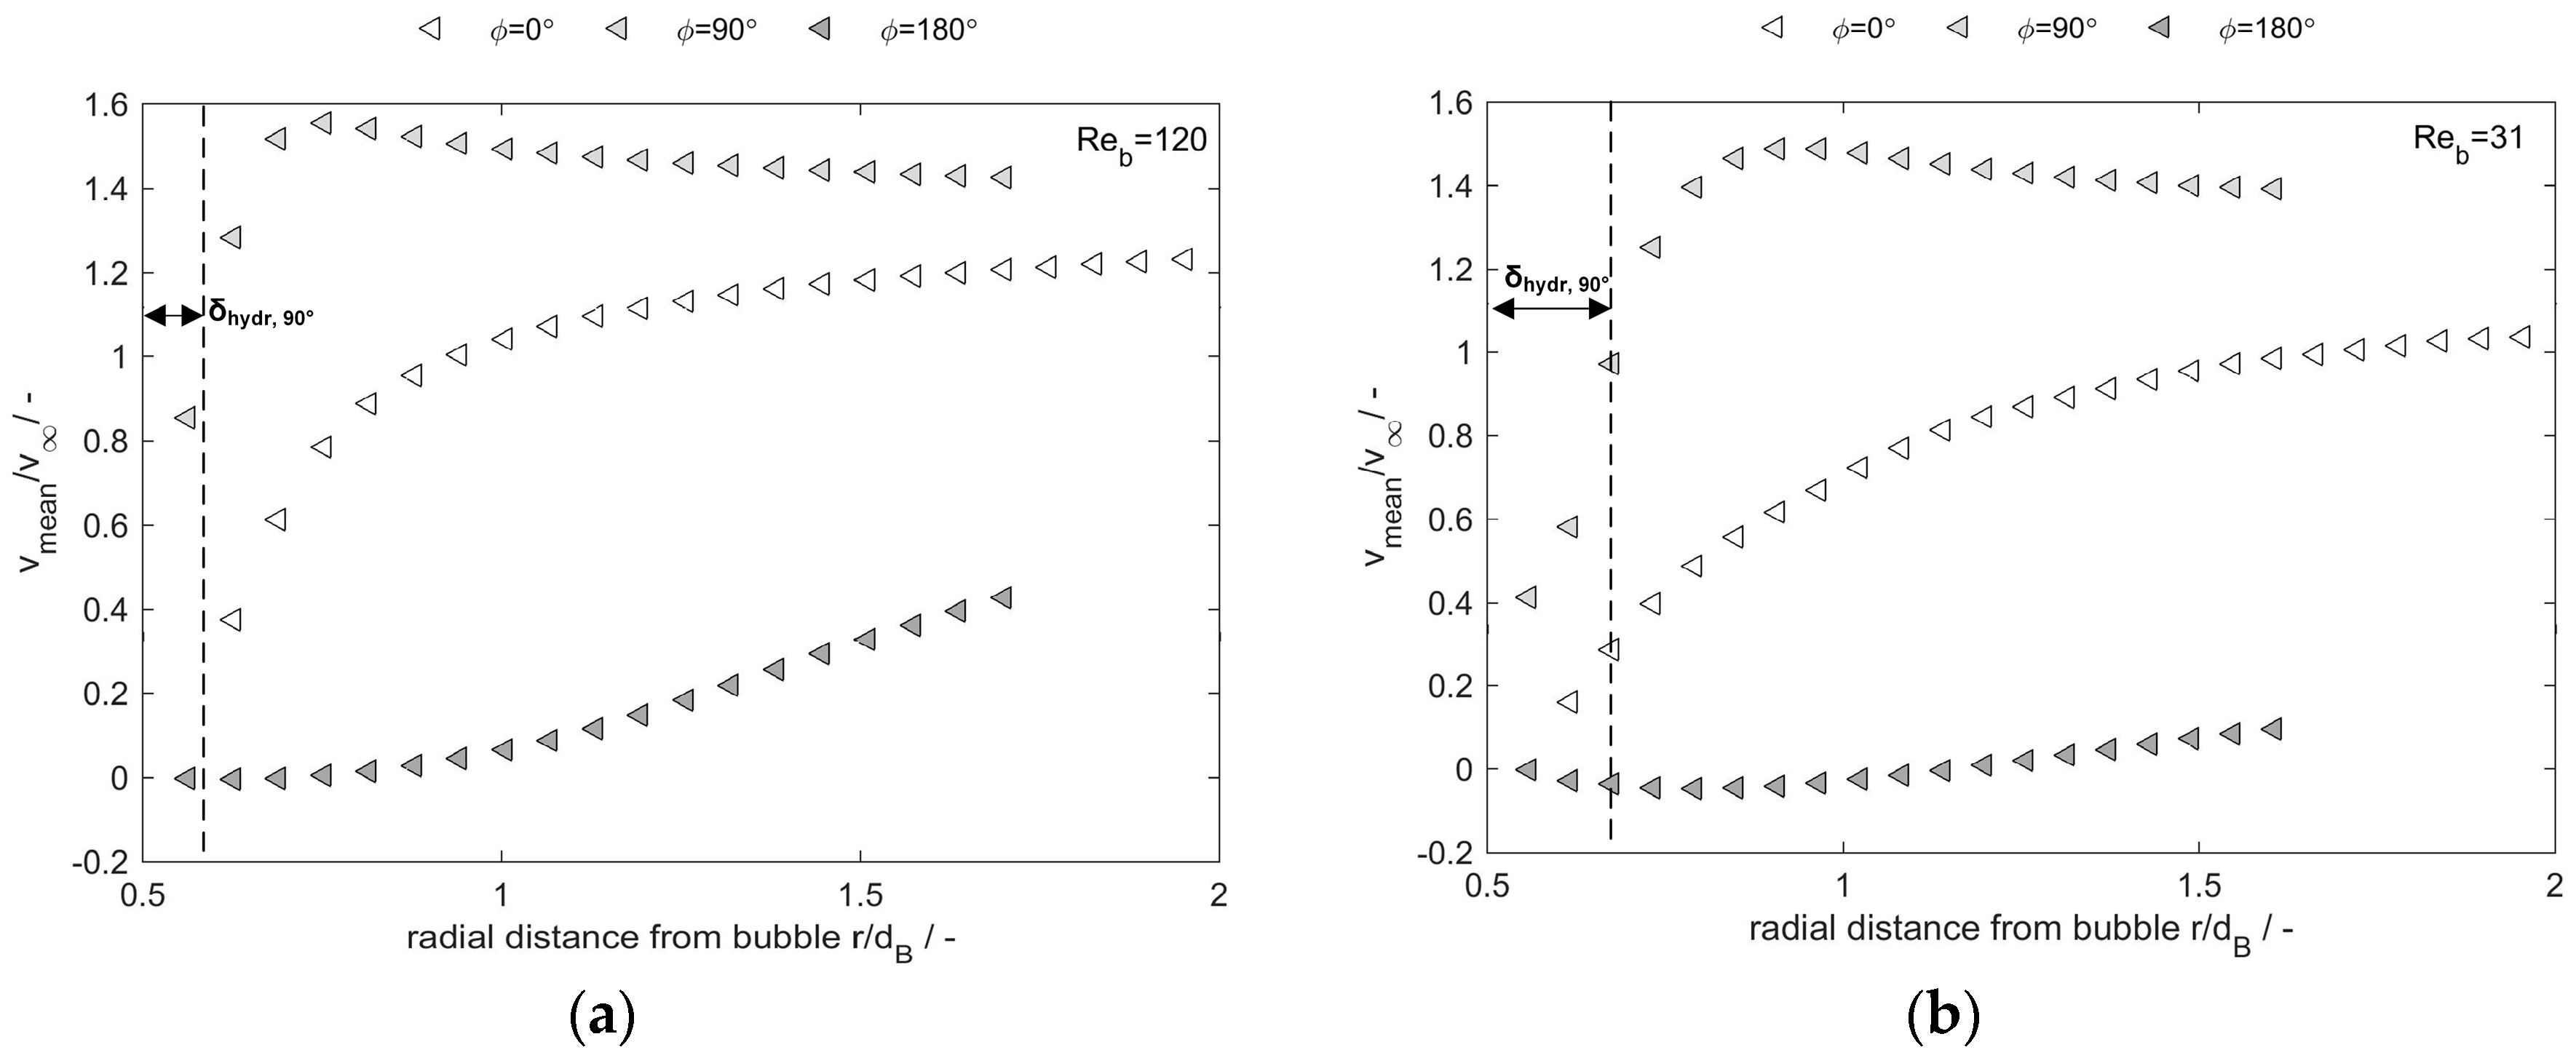
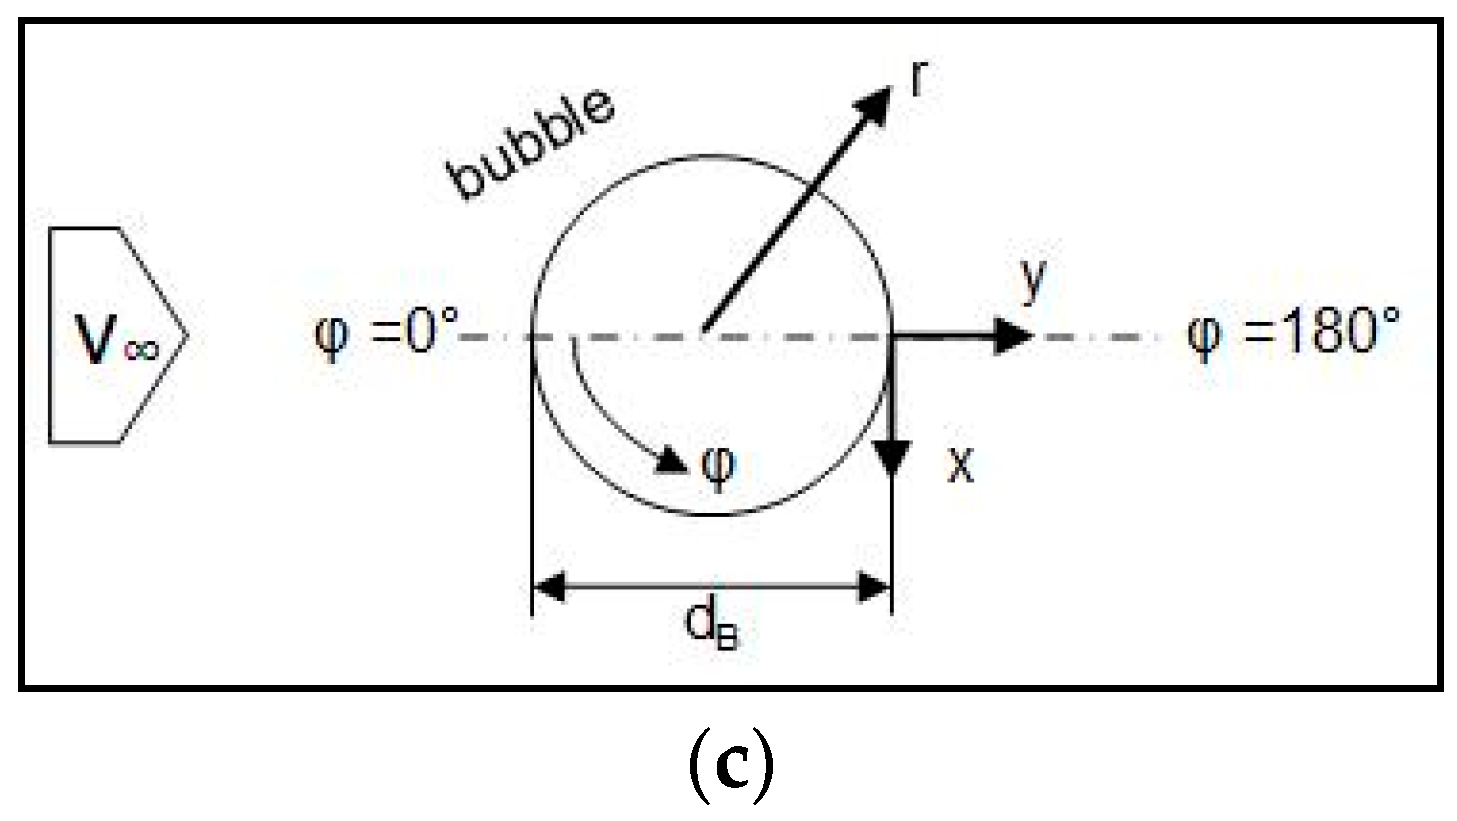
To characterize the flow field in the vicinity of the bubble, the mean velocity in the direction of flow is used. The non-dimensional velocities of the single bubble depend strongly on the azimuthal angle and scale with the Reynolds number of the bubble. In Figure 6, velocities of the bubble are plotted for two different Reynolds numbers. They are plotted over the distance from the bubble center. Utilizing and , the axes are made non-dimensional. The horizontal axis starts with 0.5, since PIV only yields information regarding the flow of the continuous phase outside the bubble. For detailed information on the coordinate system, a schematic overview is added to Figure 6. Data points are shown for three azimuthal angles of 0°, 90° and 180°.
At the angle (empty icons), the velocity decreases with decreasing distance from the bubble until the stagnation point is nearly reached. Further away from the bubble, at , it is well visible that is nearly equal to one. This means that the velocity calculated from the continuity equation dominates there. At the very surface of the bubble, no velocity field information is available since a mask has to be used to cover the bubble during PIV data processing.
At (light-colored icons), the fluid is accelerated near the bubble and then approaches to a profile which is the undisturbed flow profile in the duct. Due to the position of the bubble in the center of the duct, the undisturbed flow profile does not equal one. In the literature, there is a theoretical curve given by Oellrich et al. [29] (semi-analytical solution for a single bubble of constant spherical shape). This curve goes at 90 straight to . The reason why the experimental results from this study differ slightly from [29] is that there is a flow profile approaching the bubble and not one single velocity . Close to the interface, the experimental data from Figure 6 decrease significantly. This leads to the assumption that the single bubble in the experiments has only a little inner circulation. This can be a result of the bubble fixation.
Behind the bubble, which is = 180° (dark-colored icons), the tangential velocity is very low and also can be slightly negative due to back flow (Figure 6b). Here, the fluid is decelerated due to the bubble. However, there is no back flow for the higher Reynolds number (Figure 6a). The wake at Re = 31 is very steady, and vortex shedding is very low or does not occur at all. According to Komasawa et al. [30], Re = 31 lies in the regime of a laminar wake, while Re = 120 lies in the regime of a transitional wake. When comparing the findings of Komasawa et al. [30] to the findings of this work, it has to be kept in mind that this study deals with fixed bubbles. Due to the fixation, the relative velocity between bubble and liquid is determined by the duct flow. The shape of the bubble is spherical due to the fixation cap, although free rising bubbles with a comparable diameter may often be already of an ellipsoidal or cap shape. Clift et al. [2] present cases of wake shapes for several Reynolds numbers. They describe a change from a convex to a concave shape at Re = 35.
Finally, some considerations concerning the hydrodynamic boundary layer can be made by further analyzing the = 90° curve. The hydrodynamic boundary layer is defined as the thickness that is needed until 99% of the velocity far away from the interface is reached. This is highlighted in Figure 6a,b for the location = 90°. It is well visible that this boundary layer is thicker for the lower Reynolds number and thinner for the higher one. This meets the expectations. There is a rule of thumb to estimate the boundary layer thickness of spheres [31]:
Utilizing this equation leads to theoretical values of mm for the lower Reynolds number and mm for the higher Reynolds number. The values match the experimental results well.
3.3. Characterization of the Single Bubble Wake Influenced by the Vortex Street
The observation of velocity fluctuations is a helpful and widely-used tool to describe unsteady flow structures. By decomposing the velocity vector into a temporal mean (highlighted by a bar over the symbol or a mean in the lower index) and a fluctuating part (Reynolds decomposition), statements on the turbulence and unsteadiness of a fluid flow can be made. In the Reynolds number regime investigated in this work, the fluid flow around the bubble cannot be described as turbulent. Nevertheless, there are unsteady motions in the wake of the bubble, and therefore, it is reasonable to use root mean square (RMS) velocities. They are calculated by the following:
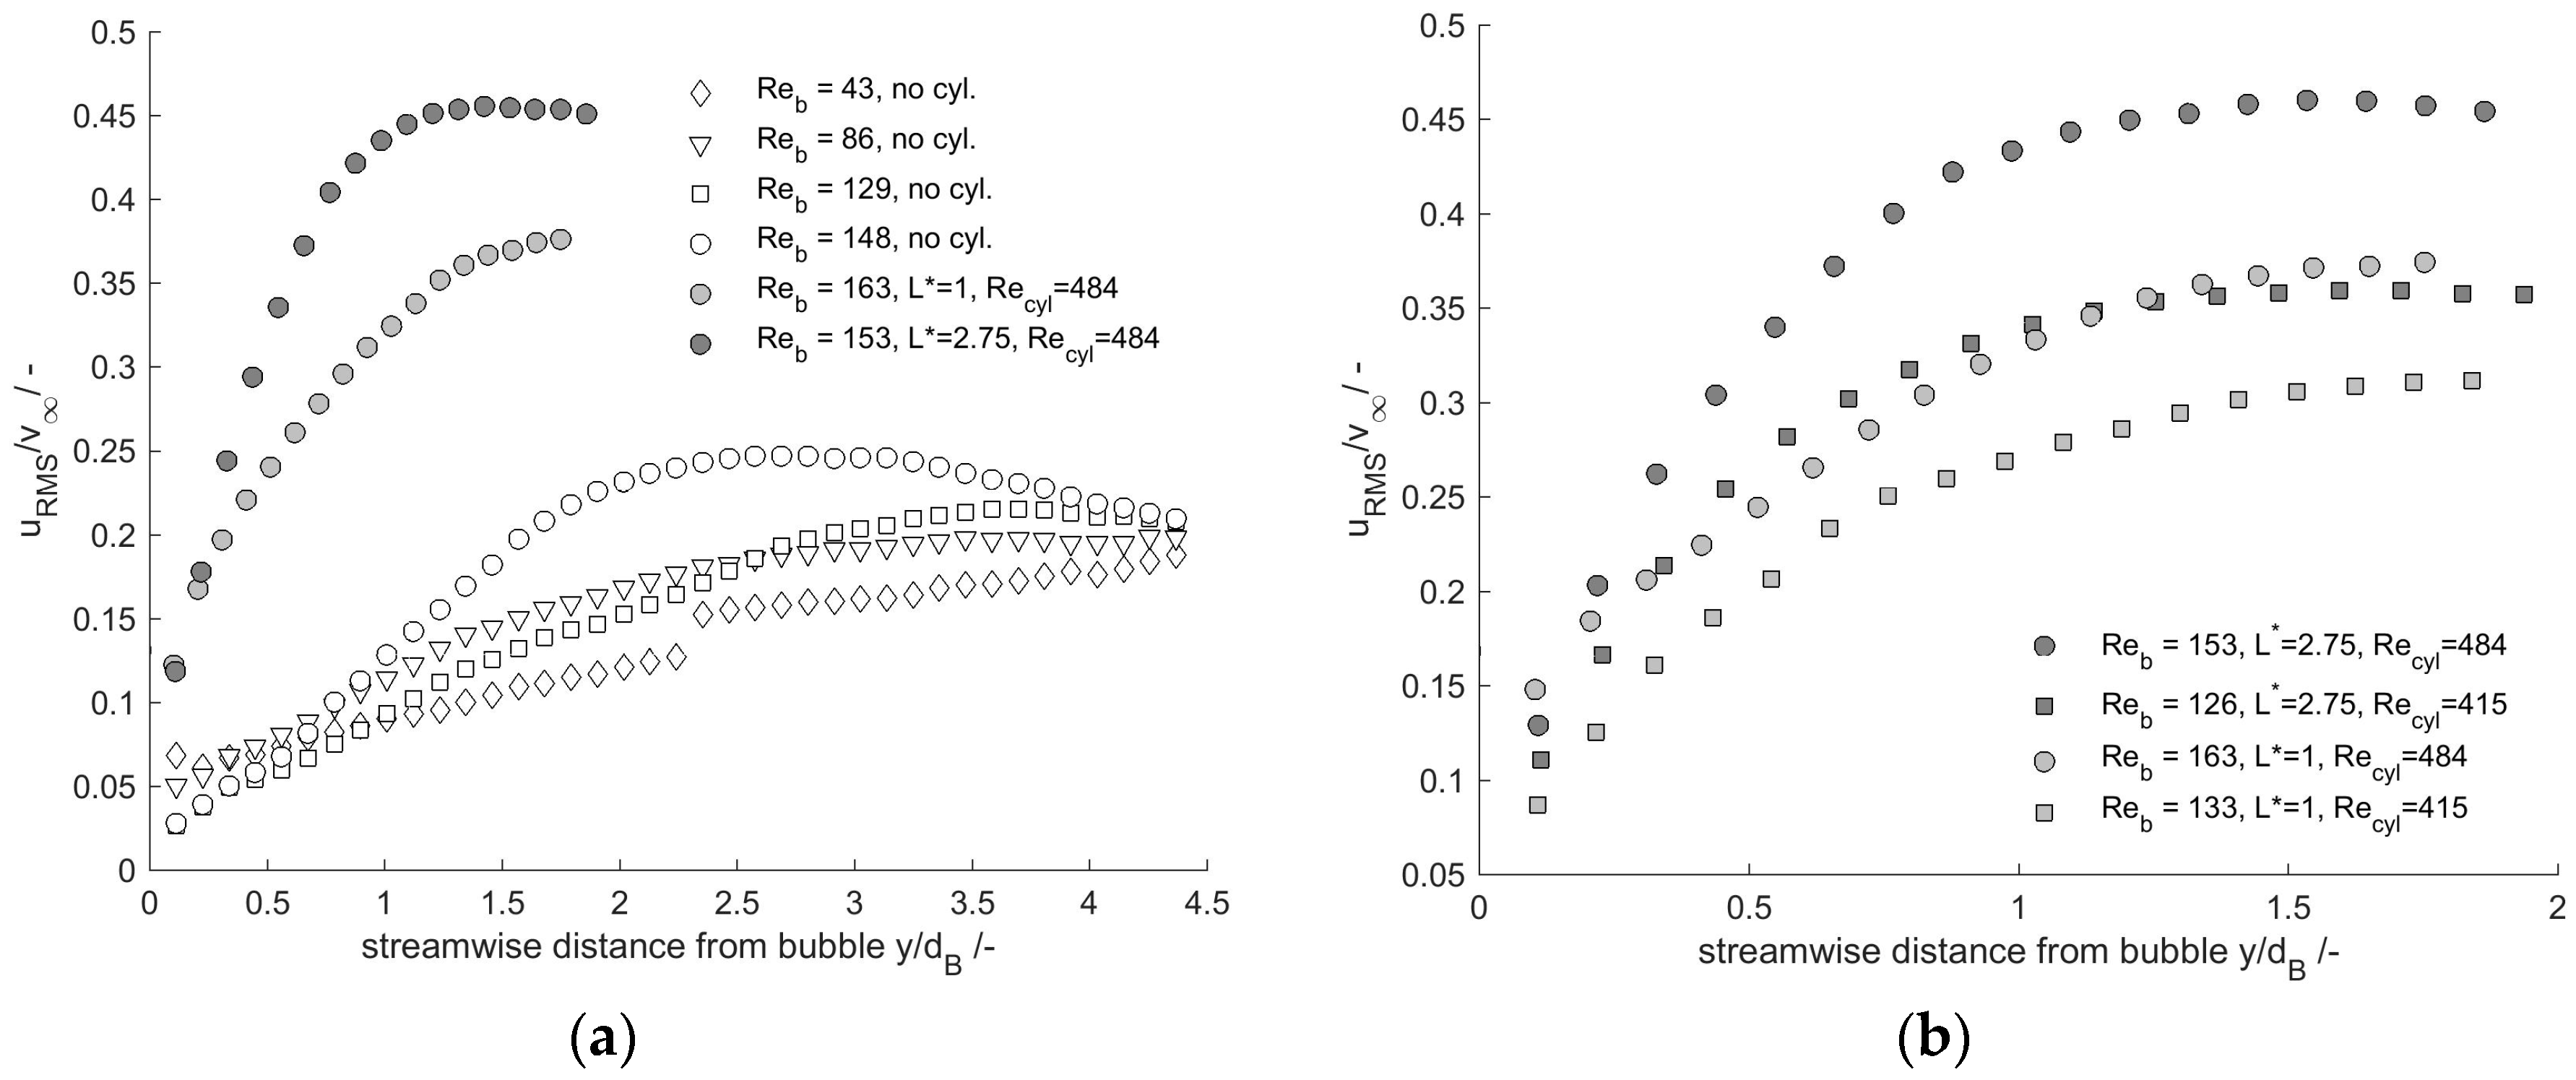
In this work, depicts the fluctuations perpendicular to the flow direction. This is shown in Figure 7a,b along the y coordinates along a line downstream the bubble (see Figure 4 or Figure 6 for orientation). Utilizing and , the axes are made non-dimensional. Expectedly, is dependent on the Reynolds number and increases with increasing distance from the bubble. It is expected to again decrease further downstream. The dependency on the Reynolds number is weak for the lower three Reynolds numbers. The profiles for Re = 43, Re = 86 and Re = 129 do not differ much; they even intersect. However, what is remarkable is that for similar Reynolds numbers of about Re = 150 (circular symbols), is influenced by the vortex street (filled icons). There are two different staggered configurations presented in Figure 7: A cylinder with 2 cm in diameter, 5.5 cm from the bubble (L* = 5.5 cm/2 cm = 2.75), and a cylinder with 2 cm in diameter, 2 cm from the bubble (L* = 2 cm/2 cm = 1) (see Figure 1). Both cylinders enhance the velocity fluctuations downstream the bubble and, thus, the cross-mixing within the bubble wake. The cylinder further away (L* = 2.75) increases to a higher extent (dark-colored icons) than the cylinder which is closer to the bubble (L* = 1) (light-colored icons). To further discuss this point, the fluctuations for the two configurations are plotted for two different Reynolds numbers in Figure 7b. There, it is visible that the type of configuration, i.e., the value of L*, affects the fluctuations to a greater extent than the Reynolds number. The development of is very similar for Re = 126/L* = 2.75 and Re = 163/L* = 1, even though the Reynolds numbers differ. The stronger influence of the L* = 2.75 configuration of the profile can be explained as follows. Due to the larger distance between the bubble and the cylinder, the vortex street is further developed for L* = 2.75. With increasing distance from the cylinder, this momentum affects a larger area of the flow field (like in a free jet) and therefore leads to higher values for and to a wake that remains for a longer distance because even the dissipation of energy in the larger area needs a longer time (respectively longer way) compared to the case for the L* = 1 configuration. The vortices are detached from the cylinder over a longer distance and are accelerated by the surrounding fluid flow. This development leads to a higher momentum within the wake.
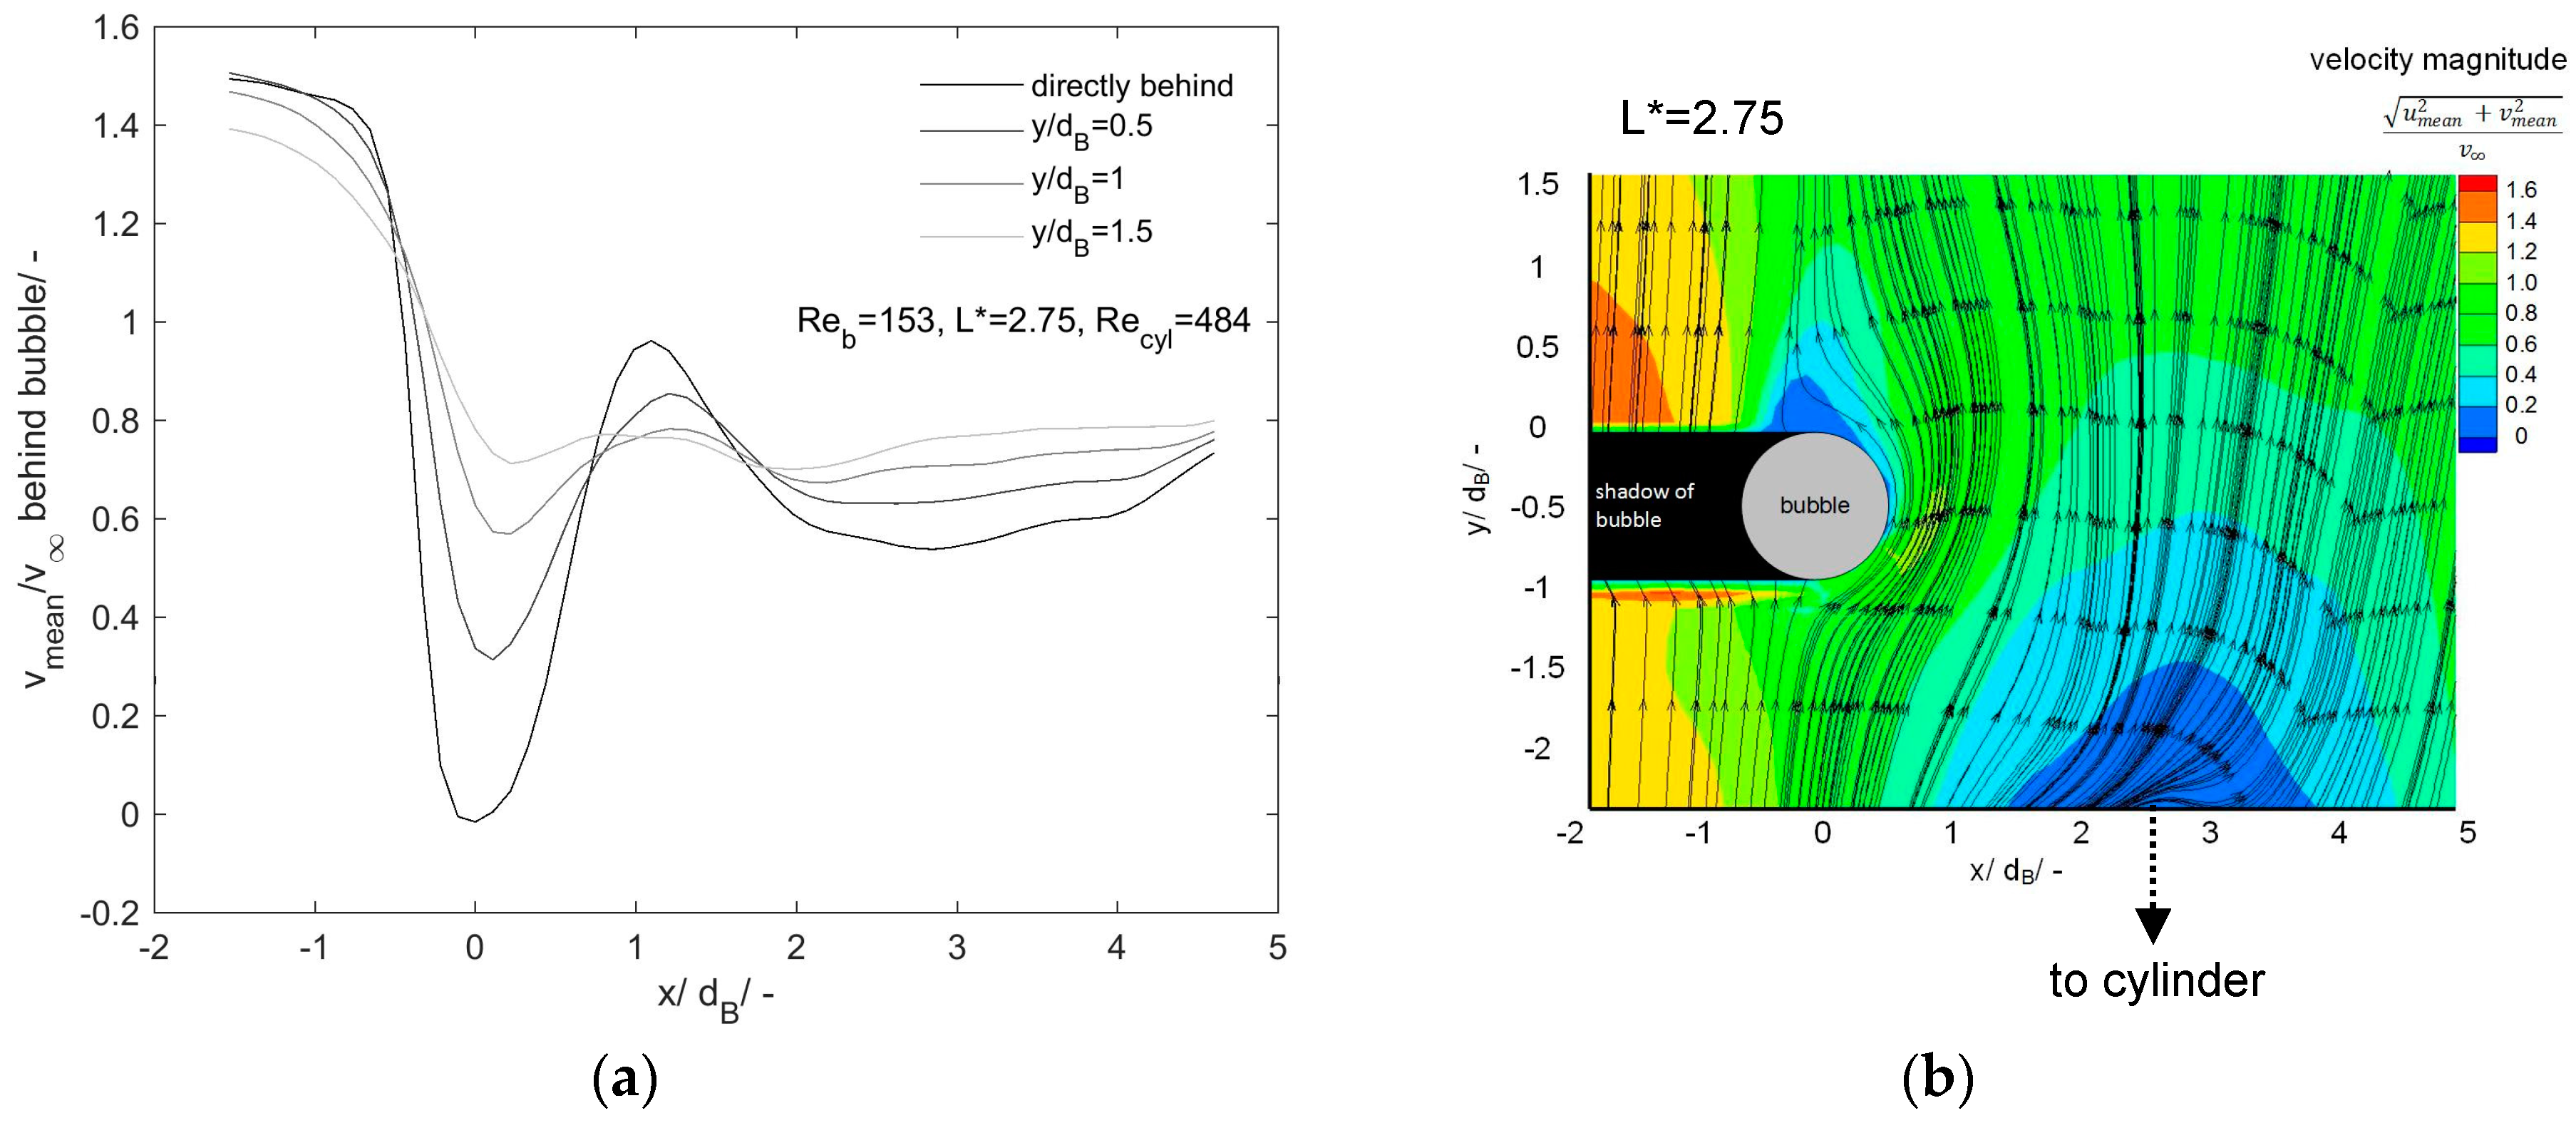
To get a deeper insight into this finding, velocity profiles of mean velocities in the flow direction (y direction) are plotted in Figure 8, Figure 9 and Figure 10 at several locations downstream the bubble. The distances from the bubble are given in bubble diameters (d). Velocity fields for the whole viewing field including streamlines are added in small pictures to the profiles. The bubble, as well as the shadow of the bubble, which occurs as a result of the laser light sheet illumination, are marked. Due to the bubble, the mean velocity in the y direction decreases dramatically. Further away from the bubble, again increases. The width of the primary bubble wake is in the order of the bubble diameter. The sharp changes in depict the spatial extension of the primary bubble wake. In Figure 8, it can be seen that in absence of a cylinder wake, these sharp changes blur with increasing distance from the bubble until they are no longer sharp for a distance three bubble diameters from the rear stagnation point (180°). In the presence of cylinder wakes (Figure 9 and Figure 10), the velocity profiles look different. Due to the cylinder, which is located at positive x values, upstream the bubble, the velocity increases to a lesser extent to the right from the bubble (increasing x values). The influence of the different cylinder setups is well visible: for the L* = 1 configuration, the primary cylinder wake is still visible. This leads to a more rapid blurring of the bubble wake: already one bubble diameter behind the rear stagnation point, the bubble wake is no longer sharply recognizable. For the L* = 2.75 configuration, the bubble wake is blurred 1.5 diameters behind the rear stagnation point. This means that the presence of the cylinder wake shortens the primary bubble wake length. The three-dimensional effects found in the cylinder wake may enhance this effect. The higher value of L* leads to a stronger increase of the vertical RMS velocities, whereas the bubble wake length remains longer. Between the bubble and the cylinder, an inner shear layer is formed, which is described later on when Figure 11 is discussed. This shear layer transfers momentum from the cylinder wake into the bubble wake. Since the momentum within the cylinder wake for the L* = 2.75 configuration is considered to have a larger momentum (see the discussion of Figure 7b) close to the bubble, the inner shear layer can transfer the momentum to the bubble wake. Thus, the bubble wake remains longer for this configuration. Furthermore, it is visible that for the L* = 1 configuration, the bubble wake is attracted strongly to the cylinder wake. The bubble wake is therefore pulled away. It does not remain downstream the bubble, but it is drawn in the positive direction. As mentioned earlier, the cylinders enhance the cross-mixing (higher velocities, Figure 7) and, thus, the interaction of the wake with the external flow. The observation of the shortened primary wake leads to the assumption that not only the cross-mixing, but also the downstream mixing is enhanced. This downstream mixing is enhanced more strongly for the L* = 1 configuration due to the shortened wake. Transferred mass from the bubble into the liquid may therefore be mixed into the liquid remarkably faster.
Due to the fact that the centers of the cylinder and the bubble are at different x coordinates, the cylinder wake attracts the bubble wake, and therefore, it is slightly shifted to the right (higher x values). This is more clearly visible for the L* = 1 configuration. The formation of an asymmetric wake structure of both the bubble and the cylinder is a convincing explanation of why the L* = 2.75 configuration leads to higher velocity fluctuations directly behind the bubble in Figure 7.
For both configurations of bubble and cylinder, no dominating frequency could be found at the observation point 1 cm behind the bubble. Thus, no Strouhal numbers are calculated. From Figure 7, it could be learned, however, that the vertical velocity fluctuations increase behind the bubble. By observation of the temporal vertical velocity profiles, it could be deduced that the fluctuations increase in an irregular manner, which explains the fact that no sharp peak in the power spectrum is found.
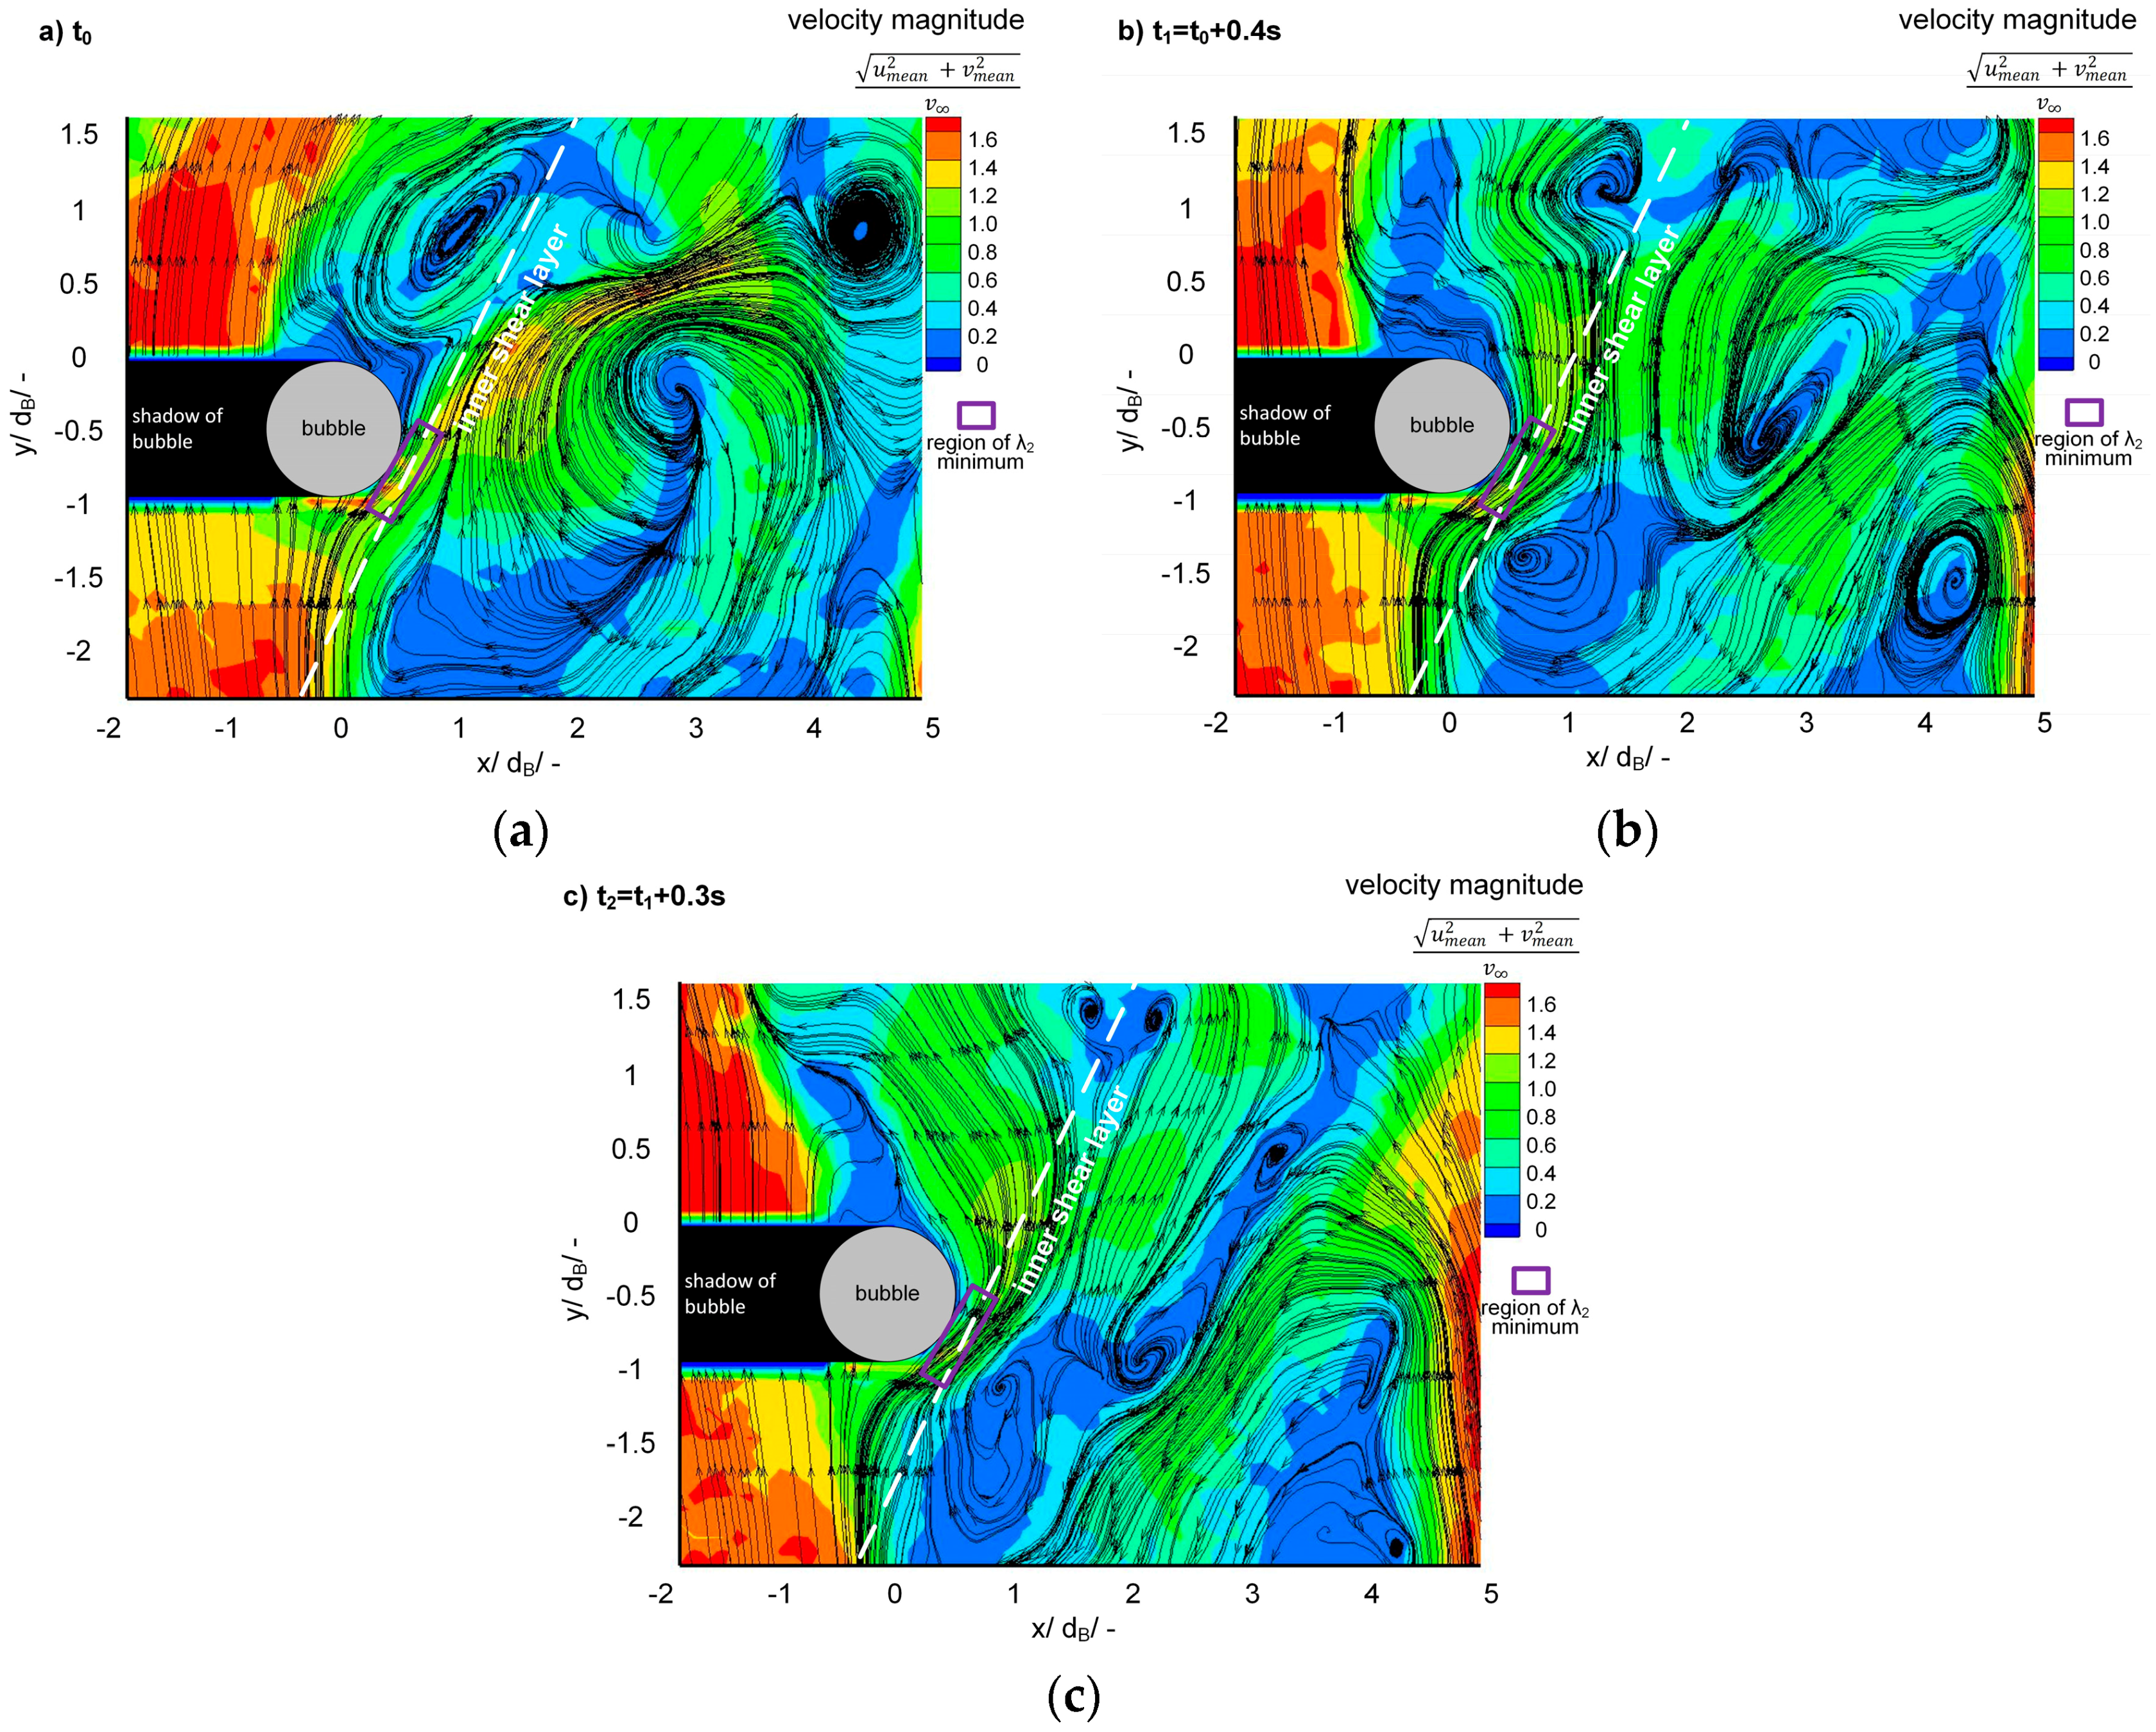
The interaction of the bubble wake and the cylinder wake is strongly dependent on the distance between them. Strong wake interaction is well visible for L* = 1. The formation of an inner shear layer resulting from proximity and wake interference can be observed by following the stream traces. In this study, for the sake of simplicity, it is called the inner shear layer. Strictly speaking, according to Sumner [17], it consists of the upstream inner shear layer (cylinder), the downstream inner shear layer (bubble), as well as the gap between them. Tokuhiro et al. [21] observed a jet-like behavior when investigating two bubbles in a parallel configuration. Due to the staggered configuration of this work, a jet-like behavior cannot arise; however, the complex interaction of shear layers is visible. Along the inner shear layer, vortices and even coupled vortices occur. It has to be pointed out that wake interaction can be investigated better by analyzing instantaneous velocity fields. This is depicted in Figure 11. Instantaneous velocity fields of the velocity magnitude are presented for three time steps. Again, the bubble and the bubble shadow are marked. Observation of the stream traces gives insight into the vortex structures, which approach the interface. Many vortices are formed along the inner shear layer, which is highlighted white in Figure 11. A good way to analyze flow structures is to use flow topology [32,33,34]. For the flow around cylinders, proper orthogonal decomposition, dynamic mode decomposition and critical point theory have been applied to experimental and numerical data to analyze the flow structure [35,36]. This gives the opportunity to make statements concerning the kinetic energy distribution within nonlinear and unsteady flow [35]. Vortices can be detected furthermore via vortex detection criteria [37,38,39]. Following the streamlines can give a first visualization of vortices within instantaneous flow fields. A node (critical point) shows the presence of a vortex, while the limiting streamlines follow the trajectory of the inner shear layer. The vortex is separated from the bubble by the inner shear layer. Jeong and Hussain [38] suggest a criterion that identifies local pressure minima by making a critical point analysis of the Hessian of pressure. Starting with the Navier–Stokes equation for incompressible flows and neglecting unsteady irrotational straining and viscous effects, they find that a vortex core is a connected region with two negative eigenvalues of . This condition is equivalent to the condition that after ordering the eigenvalues according to size (), the second eigenvalue has to be negative: . For this reason, it is called the criterion. At the point where the inner shear layer touches the bubble, the application of the criterion yields a minimum (see Figure 11, marked purple). This location can therefore be interpreted as an important point from which the separation of vortices from the bubble starts. Only the vortices that are formed downstream the bubble move visibly in the direction of flow. Interestingly, it can be observed how a coupled vortex is formed, which is also located close to the inner shear layer: in Figure 11c, two vortices rotating in opposite directions are visible at the upper part of the image. This is also found by Hu and Zhou [40], who call this phenomenon vortex pairing and enveloping. In studies dealing with flow around circular cylinders [15,16], the flow is classified based on interference. This classification says for the flow case in this work that there should be proximity and wake interference, which matches the findings of this work. This accordance is remarkable since most studies are carried out at much higher Reynolds numbers and with cylindrical bodies with equal diameters.
As is the case for all experimental investigations, there are several shortcomings of this study, which will be discussed in the following. It has to be mentioned that the measurements take place in a two-dimensional plane. Therefore, three-dimensional effects cannot be observed. Vortices moving out of the laser light sheet plane cannot be tracked once they have left the illuminated area. Trajectories of vortices are therefore not identified in this work. This can be overcome in the future by carrying out three-dimensional measurement methods, e.g., tomographic PIV [41]. As was already discussed earlier, events that take place very close to the interface cannot be tracked via PIV. This is observable in Figure 6. Due to a mask, which has to be put over the bubble during PIV processing, the velocities close to the bubble are low. It is not clear whether there is in fact only very little internal circulation within the bubble or whether the velocities close to the bubble are underestimated due to the data processing. Eventually, the fixation of the bubble reduces the degrees of freedom of the bubble motion. Free rising bubbles undergo different shape regimes as a function of the three non-dimensional numbers, Reynolds, Eotvos and Morton [2]. In contrast to free rising bubbles, the shape of the bubble in this study is constantly spherical. This slightly idealized system has been chosen deliberately since only with a fixed bubble, these deep insights into bubble and cylinder interactions could be carried out.
4. Conclusions
This study presents the detailed experimental investigation of a single bubble wake in a vortex street behind a cylinder. 2D2C high-speed PIV experiments are conducted to obtain information about velocity profiles and flow structures close to the single bubble. After characterizing the cylinder wake, the flow field around the single bubble is analyzed. For this purpose, streamwise velocity components are determined for three azimuthal angles and discussed. Perpendicular to the direction of flow, at = 90°, the thickness of the hydrodynamic boundary layer is estimated.
The streamwise velocity profiles of the single bubble are highly dependent on the azimuthal angle and on the Reynolds number of the bubble. The hydrodynamic boundary layer scales with the Reynolds number. Due to the flow profile within the duct, the velocity towards the bubble is not uniformly . This leads to the question of how the boundary layer can be estimated even if there is no uniform velocity. This is also the case for the flow field of the interacting bubble and cylinder. From our point of view, it is necessary to have a more general definition of the boundary layer than the 99% criterion.
By analyzing the root mean square velocities behind the bubble, the influence of the cylinder wake is clearly visible. Velocity profiles of the mean velocity in the direction of flow show the different effects of the two configurations of a bubble with and without a cylinder. The type of configuration (L*) influences the fluctuations to a greater extent than the Reynolds number. Both configurations show that the deceleration of the fluid behind the bubble is compensated earlier than in absence of a cylinder due to momentum transfer by cross-mixing. In combination with the higher RMS velocity profiles, this finding indicates that the cylinder wake enhances the cross-mixing close to the bubble.
For the L* = 1 configuration, direct wake interactions are apparent. The evaluation of instantaneous velocity fields shows the formation of an inner shear layer, which is comprised of the shear layers of the bubble and the cylinder and a gap between them. Along this inner shear layer, vortices and even coupled vortices are formed. It furthermore turns out that the cylinder wake attracts the bubble wake and a joint wake is formed. This interaction of shear layers is considered to be a dominant mechanism for mixing and mass transfer in bubble swarms. Furthermore, in the case of fast parallel or consecutive reactions, the contact time between gaseous and liquid educts might be influenced by the interaction of shear layers, leading to different yield and selectivity.
Future studies are intended to study how mass transfer from a single bubble is influenced by the interaction of shear layers in a vortex street without and with chemical reaction. In combination with the results of this study, a deeper understanding of the influence of vortex structures on the transport of momentum and mass at fluidic interfaces will be achieved.
Acknowledgments
The authors gratefully acknowledge the support that was given by the German Research Foundation (Deutsch Forschungsgemeinschaft (DFG)) within the priority program SPP1740 “Reactive bubbly flows” under Grant No. SCHL 617/12-2.
Author Contributions
Sophie Rüttinger, Marko Hoffmann, and Michael Schlüter conceived and designed the experiments; Sophie Rüttinger performed the experiments; Sophie Rüttinger and Michael Schlüter analyzed the data; Marko Hoffmann contributed reagents/materials/analysis tools; Sophie Rüttinger wrote the paper.
Conflicts of Interest
The authors declare no conflict of interest.
References
- Brauer, H. Grundlagen der Einphasen-und Mehrphasenstroemungen, 1st ed.; Sauerlaender AG: Aarau, Switzerland, 1971. [Google Scholar]
- Clift, R.; Grace, J.R.; Weber, M.E. Bubbles, Drops, and Particles; Dover Publication, Inc.: Mineola, NY, USA, 1978. [Google Scholar]
- Fan, L.S.; Tsuchiya, K. Bubble Wake Dynamics in Liquids and Liquid-Solid Suspensions; Butterworth-Heinemann: Quebec City, QC, Canada, 1990. [Google Scholar]
- Tsuchiya, K.; Mikasa, H.; Saito, T. Absorption dynamics of CO2 bubbles in a pressurized liquid flowing downward and its simulation in seawater. Chem. Eng. Sci. 1997, 52, 4119–4126. [Google Scholar] [CrossRef]
- Tsuchiya, K.; Ishida, T.; Saito, T.; Kajishima, T. Dynamics of interfacial mass transfer in a gas-dispersed system. Can. J. Chem. Eng. 2003, 81, 647–654. [Google Scholar] [CrossRef]
- Dani, A.; Guiraud, P.; Cockx, A. Local measurement of oxygen transfer around a single bubble by planar laser-induced fluorescence. Chem. Eng. Sci. 2007, 62, 7245–7252. [Google Scholar] [CrossRef]
- Hanyu, K.; Saito, T. Dynamical mass-transfer process of a CO2 bubble measured by using LIF/HPTS visualisation and photoelectric probing. Can. J. Chem. Eng. 2010, 139, 551–560. [Google Scholar] [CrossRef]
- Saito, T.; Toriu, M. Effects of a bubble and the surrounding liquid motions on the instantaneous mass transfer across the gas-liquid interface. Chem. Eng. J. 2015, 265, 164–175. [Google Scholar] [CrossRef]
- Bork, O.; Schlueter, M.; Raebiger, N. The impact of local phenomena on mass transfer in gas-liquid systems. Can. J. Chem. Eng. 2005, 83, 658–666. [Google Scholar] [CrossRef]
- Joshi, J.B.; Nandakumar, K.; Evans, G.M.; Pareek, V.K.; Gumulya, M.M.; Sathe, M.J.; Khanwale, M.A. Bubble generated turbulence and direct numerical simulations. Chem. Eng. Sci. 2017, 157, 26–75. [Google Scholar] [CrossRef]
- Alméras, E.; Cazin, S.; Roig, V.; Risso, F.; Augier, F.; Plais, C. Time-resolved measurement of concentration fluctuations in a confined bubbly flow by LIF. Int. J. Multiph. Flow 2016, 83, 153–161. [Google Scholar] [CrossRef] [Green Version]
- Falcone, M.; Bothe, D.; Marschall, H. 3D direct numerical simulations of reactive mass transfer from deformable single bubbles: An analysis of mass transfer coefficients and reaction selectivities. Chem. Eng. Sci. 2018, 177, 523–536. [Google Scholar] [CrossRef]
- Weber, P.S.; Marschall, H.; Bothe, D. Highly accurate two-phase species transfer based on ALE Interface Tracking. Int. J. Heat Mass Transf. 2017, 104, 759–773. [Google Scholar] [CrossRef]
- Krauβ, M.; Rzehak, R. Reactive absorption of CO2 in NaOH: Detailed study of enhancement factor models. Chem. Eng. Sci. 2017, 166, 193–209. [Google Scholar] [CrossRef]
- Zdravkovich, M.M. Review of flow interference between two circular cylinders in various arrangements. J. Fluids Struct. 1977, 1, 239–261. [Google Scholar] [CrossRef]
- Zdravkovich, M.M. The effects of interference between circular cylinders in cross flow. J. Fluid. Struct. 1987, 1, 239–261. [Google Scholar] [CrossRef]
- Sumner, D. Two circular cylinders in cross-flow: A review. J. Fluid. Struct. 2010, 26, 849–899. [Google Scholar] [CrossRef]
- Zhou, Y.; Alam, M.M. Wake of two interacting circular cylinders: A review. Int. J. Heat Fluid Flow 2016, 62, 510–537. [Google Scholar] [CrossRef]
- No, H.; Call, M.; Tokuhiro, A.T. Comparison of Near Wake-Flow Structure Behind a Solid Cap with an Attached Bubble and a Solid Counterpart. In Proceedings of the 4th Joint Fluids Summer Engineering Conference, Honolulu, HI, USA, 6–10 July 2003; pp. 1721–1725. [Google Scholar]
- Tokuhiro, A.T.; No, H.; Call, M.; Hishida, K. Comparison of near wake-flow structure behind a solid cap with an attached bubble and a solid counterpart. JSME Int. J. Ser. B 2006, 49, 737–747. [Google Scholar] [CrossRef]
- Tokuhiro, A.; Fujiwara, A.; Hishida, K.; Maeda, M. Measurement in the wake region of two bubbles in close proximity by combined shadow-image and PIV techniques. J. Fluid. Eng. 1999, 121, 191–197. [Google Scholar] [CrossRef]
- Tokuhiro, A.; Maekawa, M.; Iizuka, K.; Hishida, K.; Maeda, M. Turbulent flow past a bubble and an ellipsoid using shadow-image and PIV techniques. Int. J. Multiph. Flow 1998, 24, 1383–1406. [Google Scholar] [CrossRef]
- Roshko, A. On the Development of Turbulent Wakes from Vortex Streets. Tech. Rep. Arch. Image Libr. 1954, 1–28. [Google Scholar]
- Chen, Y.N. Jahre Forschung über die Kàrmànschen Wirbelstrassen-Ein Rückblick. Schweiz. Bauz. 1973, 44, 1079–1096. [Google Scholar]
- Williamson, C.H.K. Three-Dimensional Wake Transition. In Advances in Turbulence VI; Moreau, R., Gavrilakis, S., Machiels, L., Monkewitz, P.A., Eds.; Springer: Dordrecht, The Netherlands, 1996; pp. 399–402. [Google Scholar]
- Barkley, D.; Henderson, R.D. Three-dimensional Floquet stability analysis of the wake of a circular cylinder. J. Fluid Mech. 1996, 322, 215–241. [Google Scholar] [CrossRef]
- Tomboulides, A.G.; Orszag, S.A. Numerical investigation of transitional and weak turbulent flow past a sphere. J. Fluid Mech. 2000, 416, 45–73. [Google Scholar] [CrossRef]
- Le Clainche, S.; Vega, J.M. Higher order dynamic mode decomposition. SIAM J. Appl. Dyn. Syst. 2017, 16, 882–925. [Google Scholar] [CrossRef]
- Oellrich, L.; Schmidt-Traub, H.; Brauer, H. Theoretische berechnung des stofftransports in der umgebung einer einzelblase. Chem. Eng. Sci. 1973, 28, 711–721. [Google Scholar] [CrossRef]
- Komasawa, I.; Otake, T.; Kamojima, M. Wake behavior and its effect on interaction between spherical-cap bubbles. J. Chem. Eng. Jpn. 1980, 13, 103–109. [Google Scholar] [CrossRef]
- Böswirth, L.; Bschorer, S. Technische Strömungslehre, 10th ed.; Springer: Berlin, Germany, 2014. [Google Scholar]
- Perry, A.E.; Fairlie, B.D. Critical points in flow patterns. Adv. Geophys. 1975, 18, 299–315. [Google Scholar]
- Dallmann, U. Topological structures of three-dimensional vortex flow separation. In Proceedings of the AIAAA 16th Fluid and Plasma Dynamics Conference, Danvers, MA, USA, 12–14 July 1983. [Google Scholar]
- Chong, M.S.; Perry, A.E.; Cantwell, B.J. A general classification of three-dimensional flow fields. Phys. Fluids A Fluid Dyn. 1990, 2, 765–777. [Google Scholar] [CrossRef]
- Le Clainche, S.; Li, J.I.; Theofilis, V.; Soria, J. Flow around a hemisphere-cylinder at high angle of attack and low Reynolds number. Part I: Experimental and numerical investigation. Aerosp. Sci. Technol. 2015, 44, 77–87. [Google Scholar] [CrossRef]
- Le Clainche, S.; Rodríguez, D.; Theofilis, V.; Soria, J. Flow around a hemisphere-cylinder at high angle of attack and low Reynolds number. Part II: POD and DMD applied to reduced domains. Aerosp. Sci. Technol. 2015, 44, 88–100. [Google Scholar] [CrossRef]
- Hunt, J.C.R.; Wray, A.A.; Moin, P. Eddies, Streams, and Convergence Zones in Turbulent Flows. Center for Turbulence Research. In Proceedings of the Summer Program, Stanford, CA, USA, 27 June–22 July 1988; pp. 193–208. [Google Scholar]
- Jeong, J.; Hussain, F. On the identification of a vortex. J. Fluid Mech. 1995, 285, 69–94. [Google Scholar] [CrossRef]
- Kolář, V. Vortex identification: New requirements and limitations. Int. J. Heat Fluid Flow 2007, 28, 638–652. [Google Scholar] [CrossRef]
- Hu, J.C.; Zhou, Y. Flow structure behind two staggered circular cylinders. Part 1. Downstream evolution and classification. J. Fluid Mech. 2008, 607, 51–80. [Google Scholar] [CrossRef]
- Elsinga, G.E.; Scarano, F.; Wieneke, B.; van Oudheusden, B.W. Tomographic particle image velocimetry. Exp. Fluids 2006, 41, 933–947. [Google Scholar] [CrossRef]
Figure 1.
Staggered configurations of the cylinder and bubble.
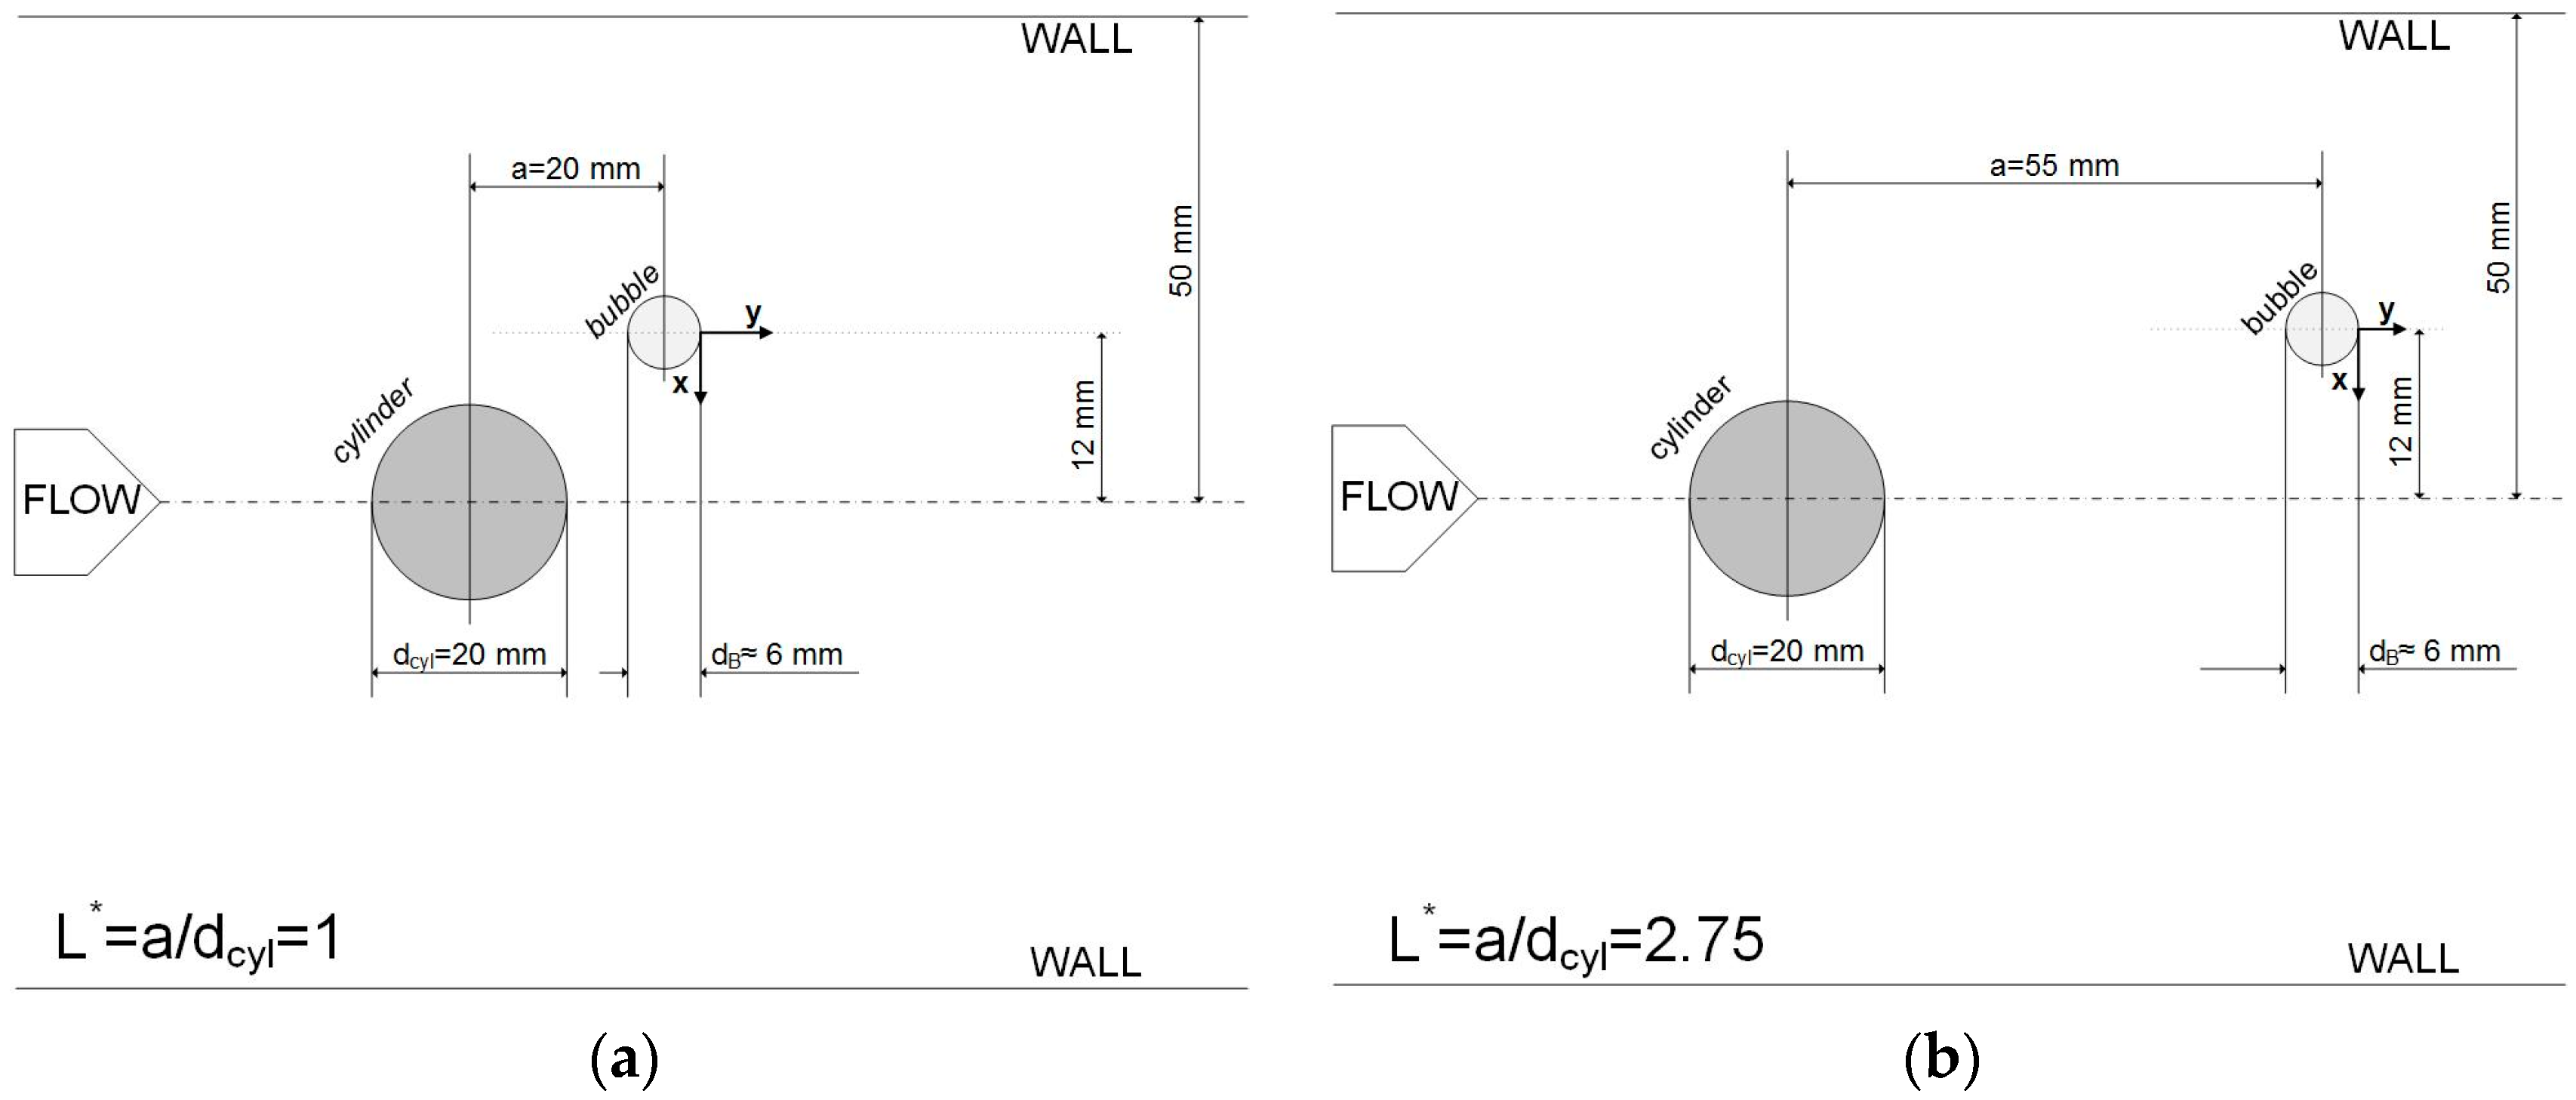
Figure 2.
Schematic diagram of the experiment.

Figure 3.
PIV processing: raw image (a) and instantaneous velocity field with physical coordinates (b).
Figure 3.
PIV processing: raw image (a) and instantaneous velocity field with physical coordinates (b).
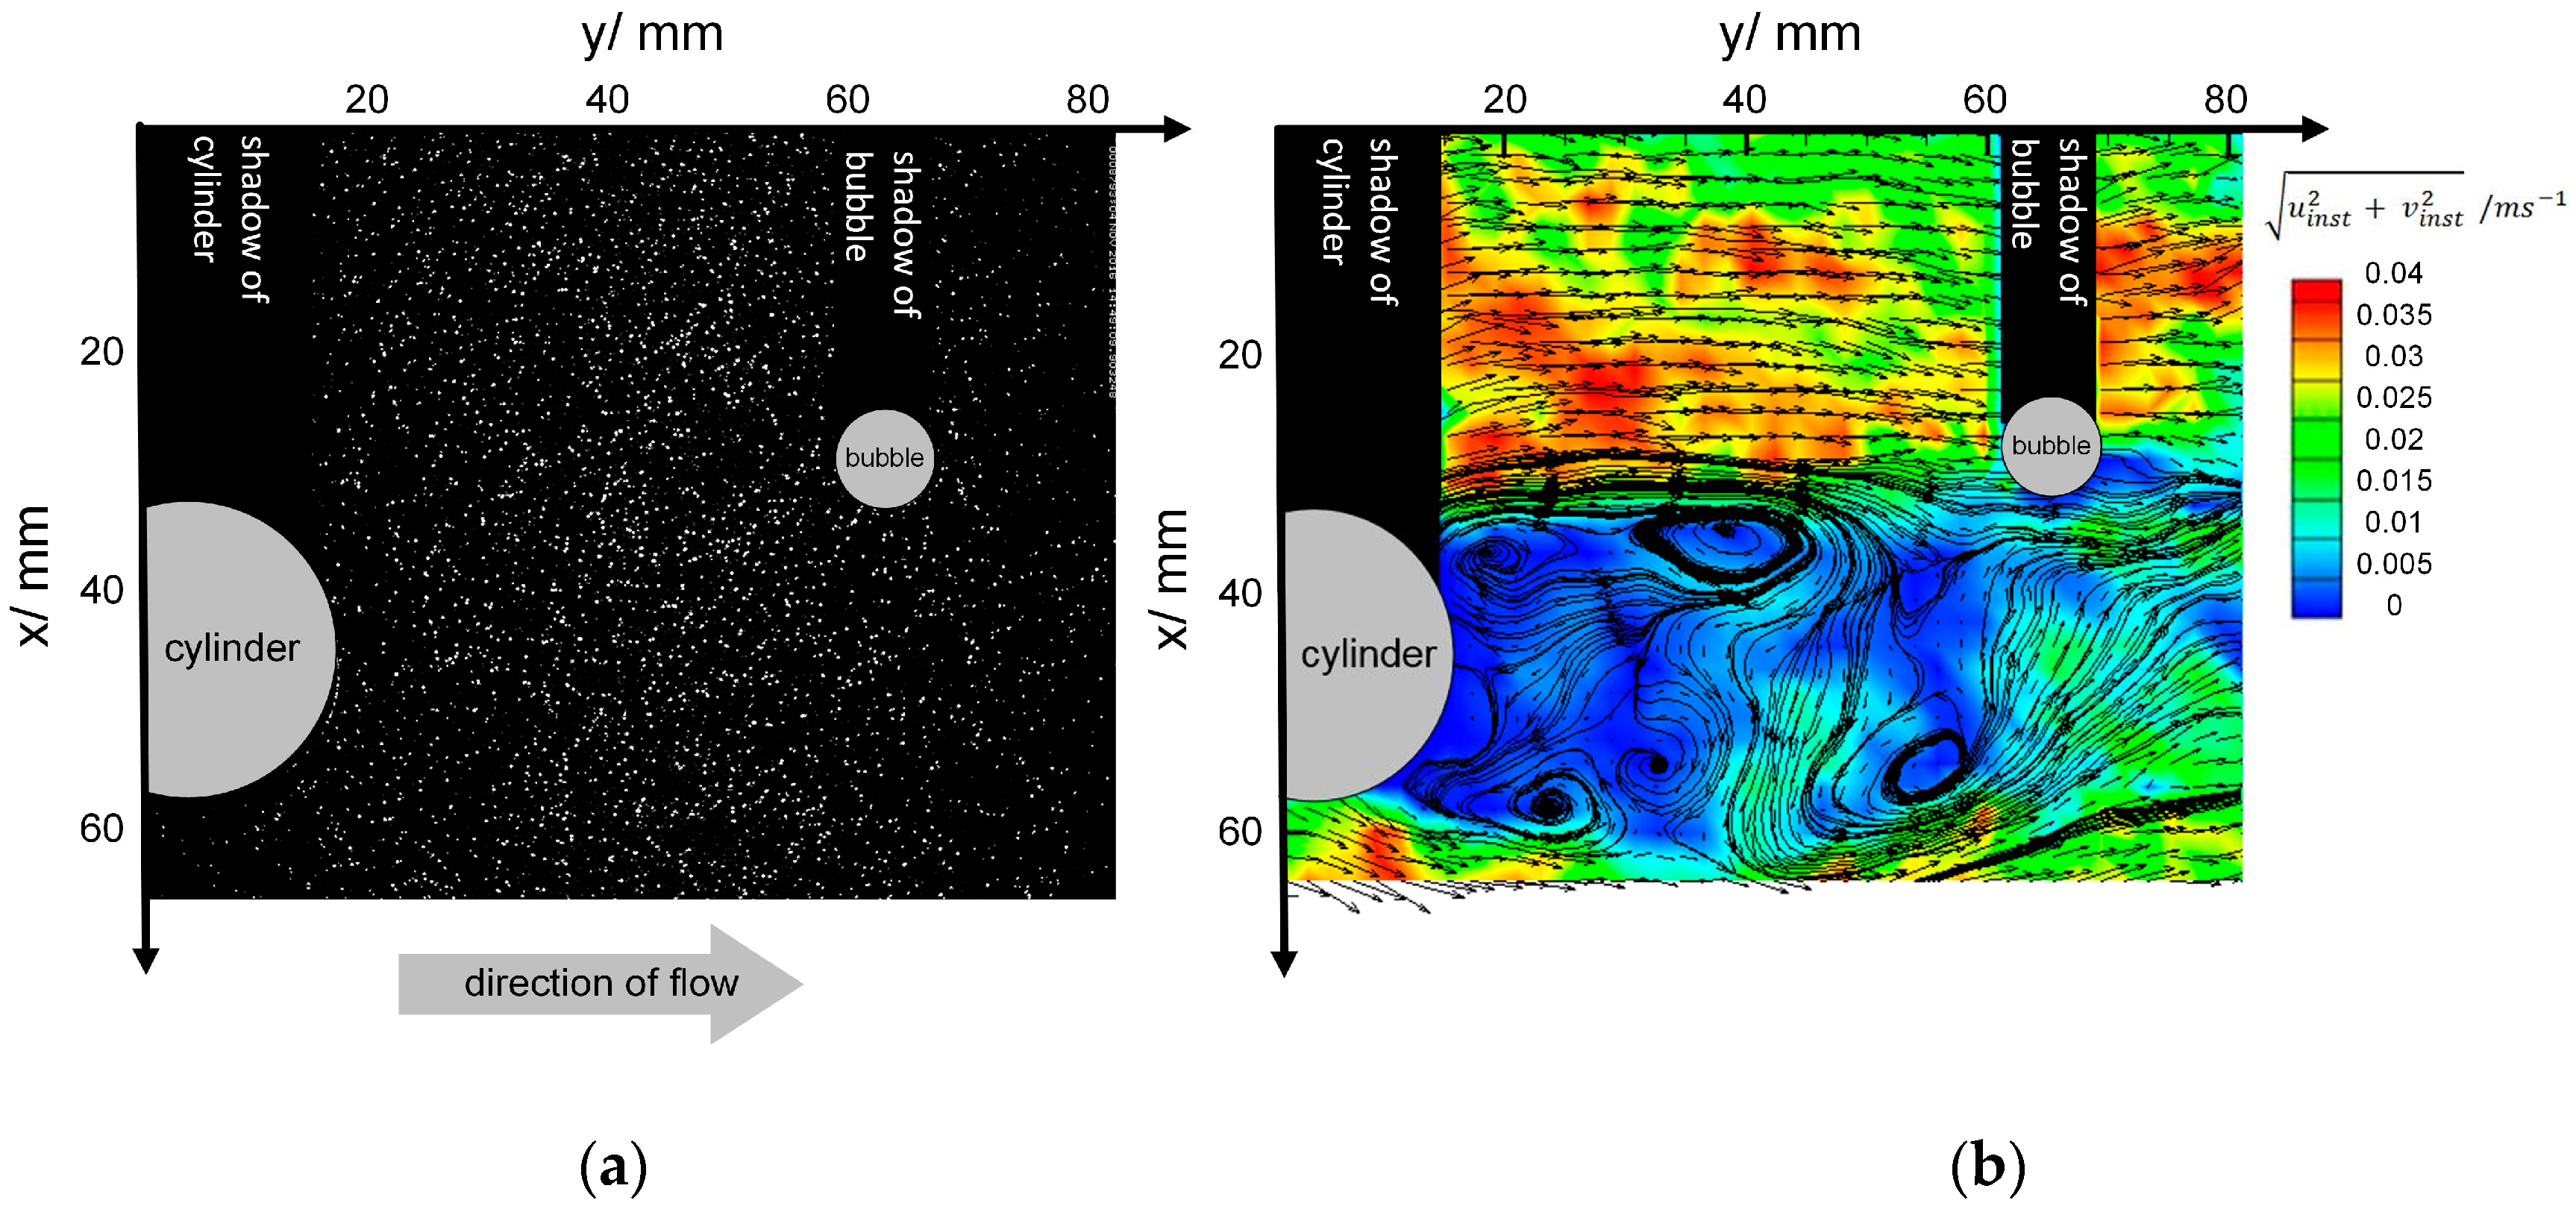
Figure 4.
Nomenclature (a); procedure of velocity analysis (b) and frequency analysis (power spectrum) (c).
Figure 4.
Nomenclature (a); procedure of velocity analysis (b) and frequency analysis (power spectrum) (c).
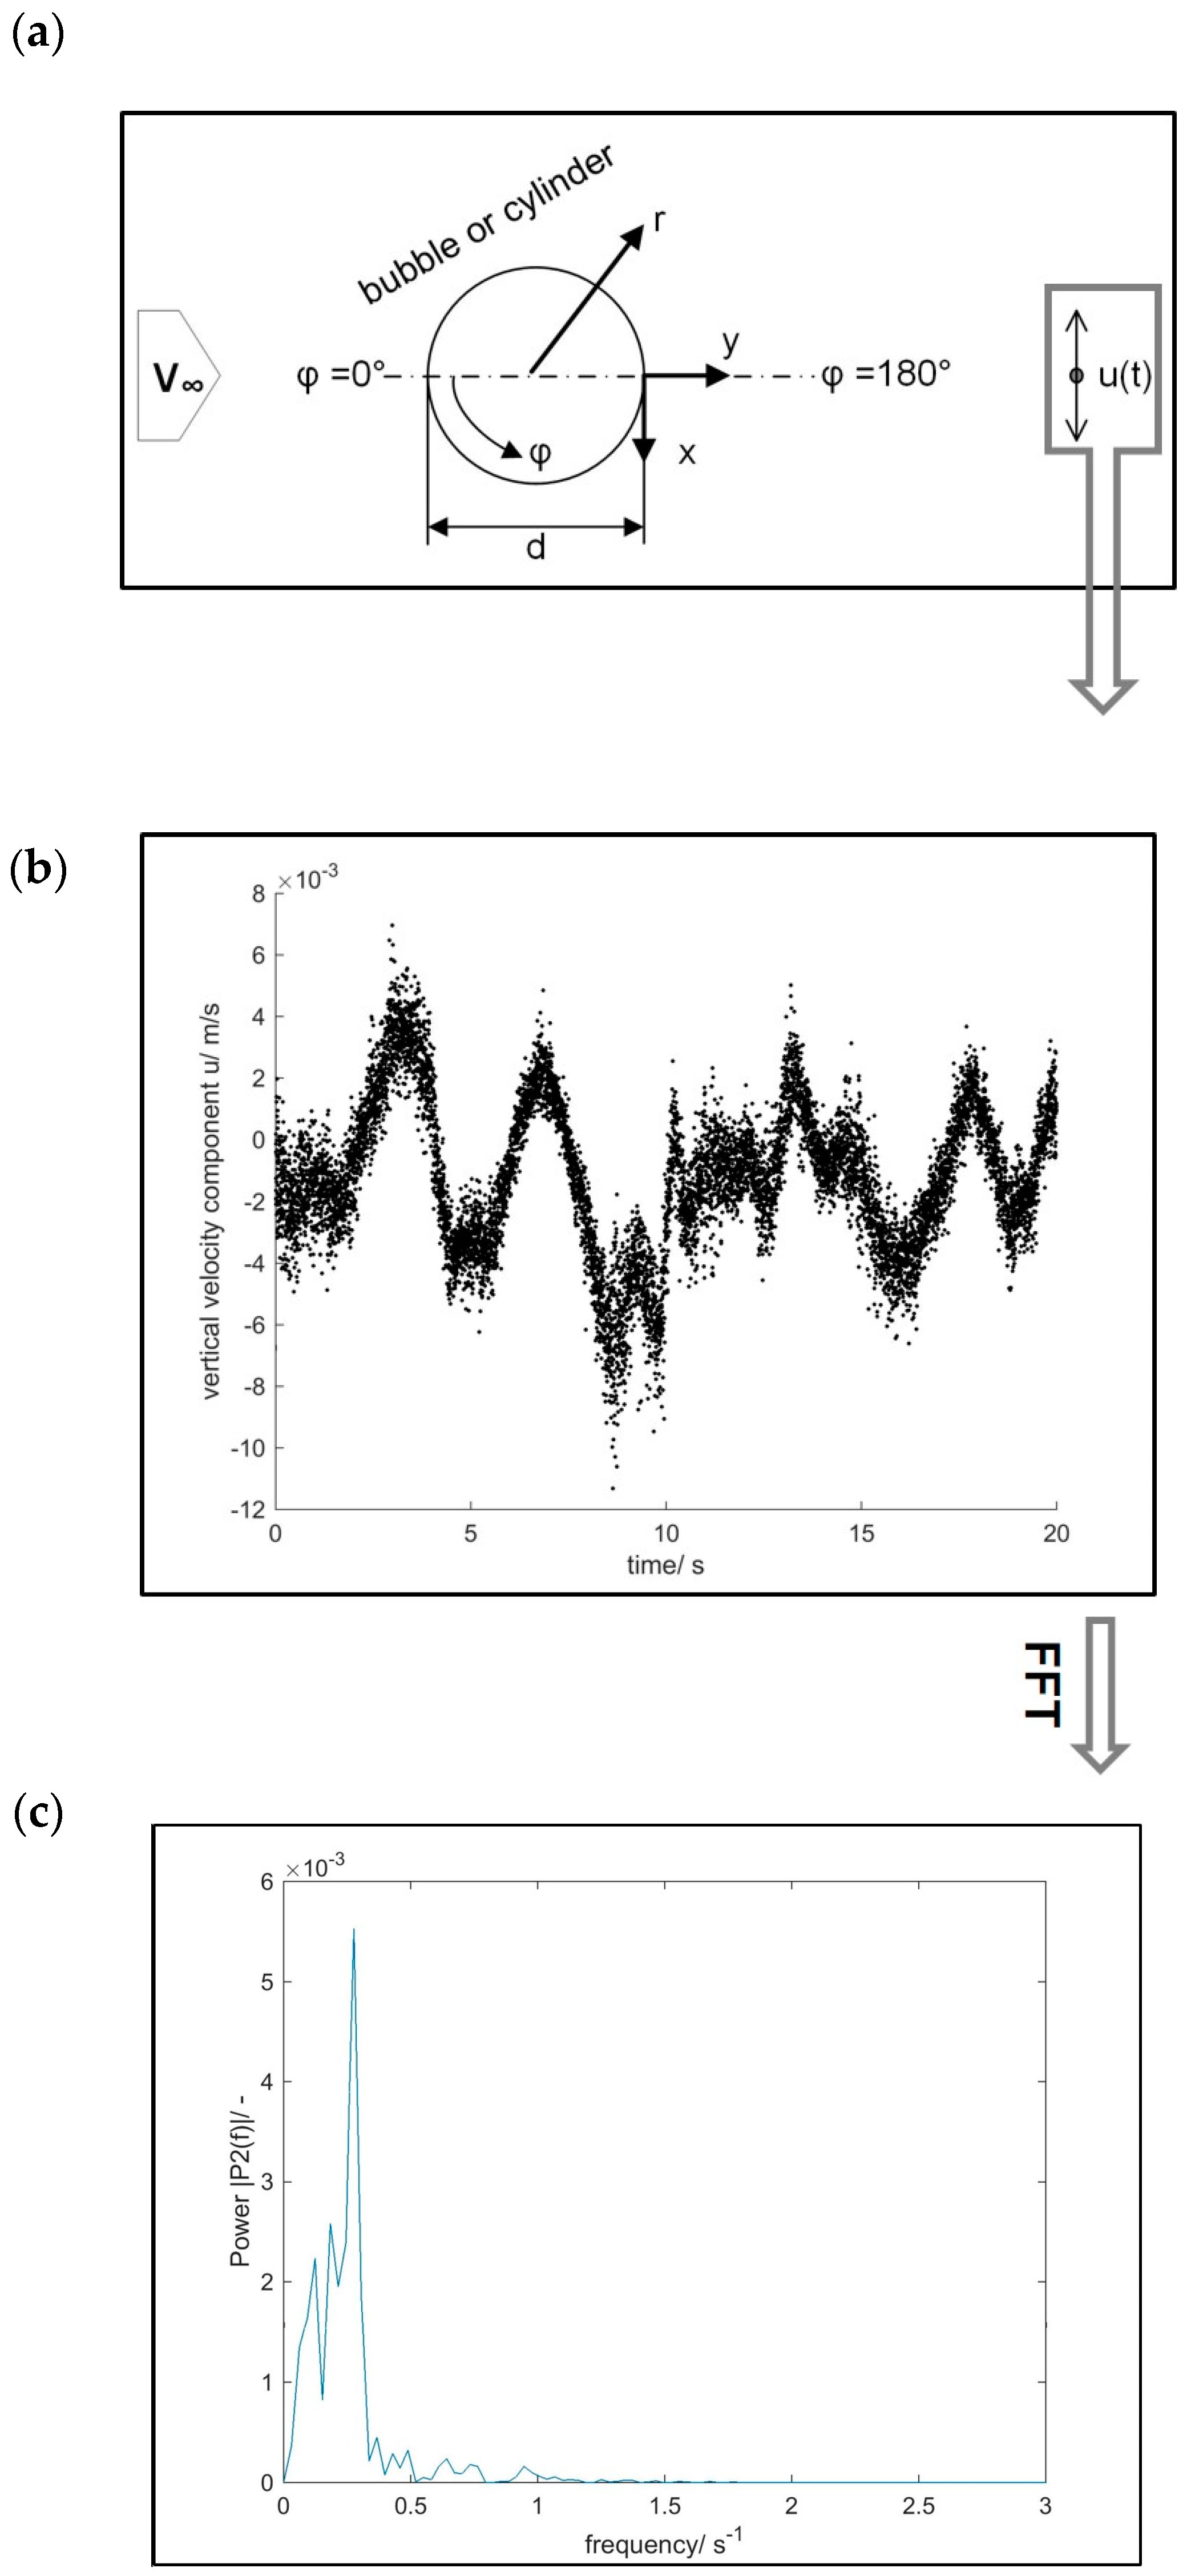
Figure 5.
Strouhal numbers of the bubble. Red diamond items belong to the red (right) axis, and blue star items belong to the blue (left) axis.
Figure 5.
Strouhal numbers of the bubble. Red diamond items belong to the red (right) axis, and blue star items belong to the blue (left) axis.
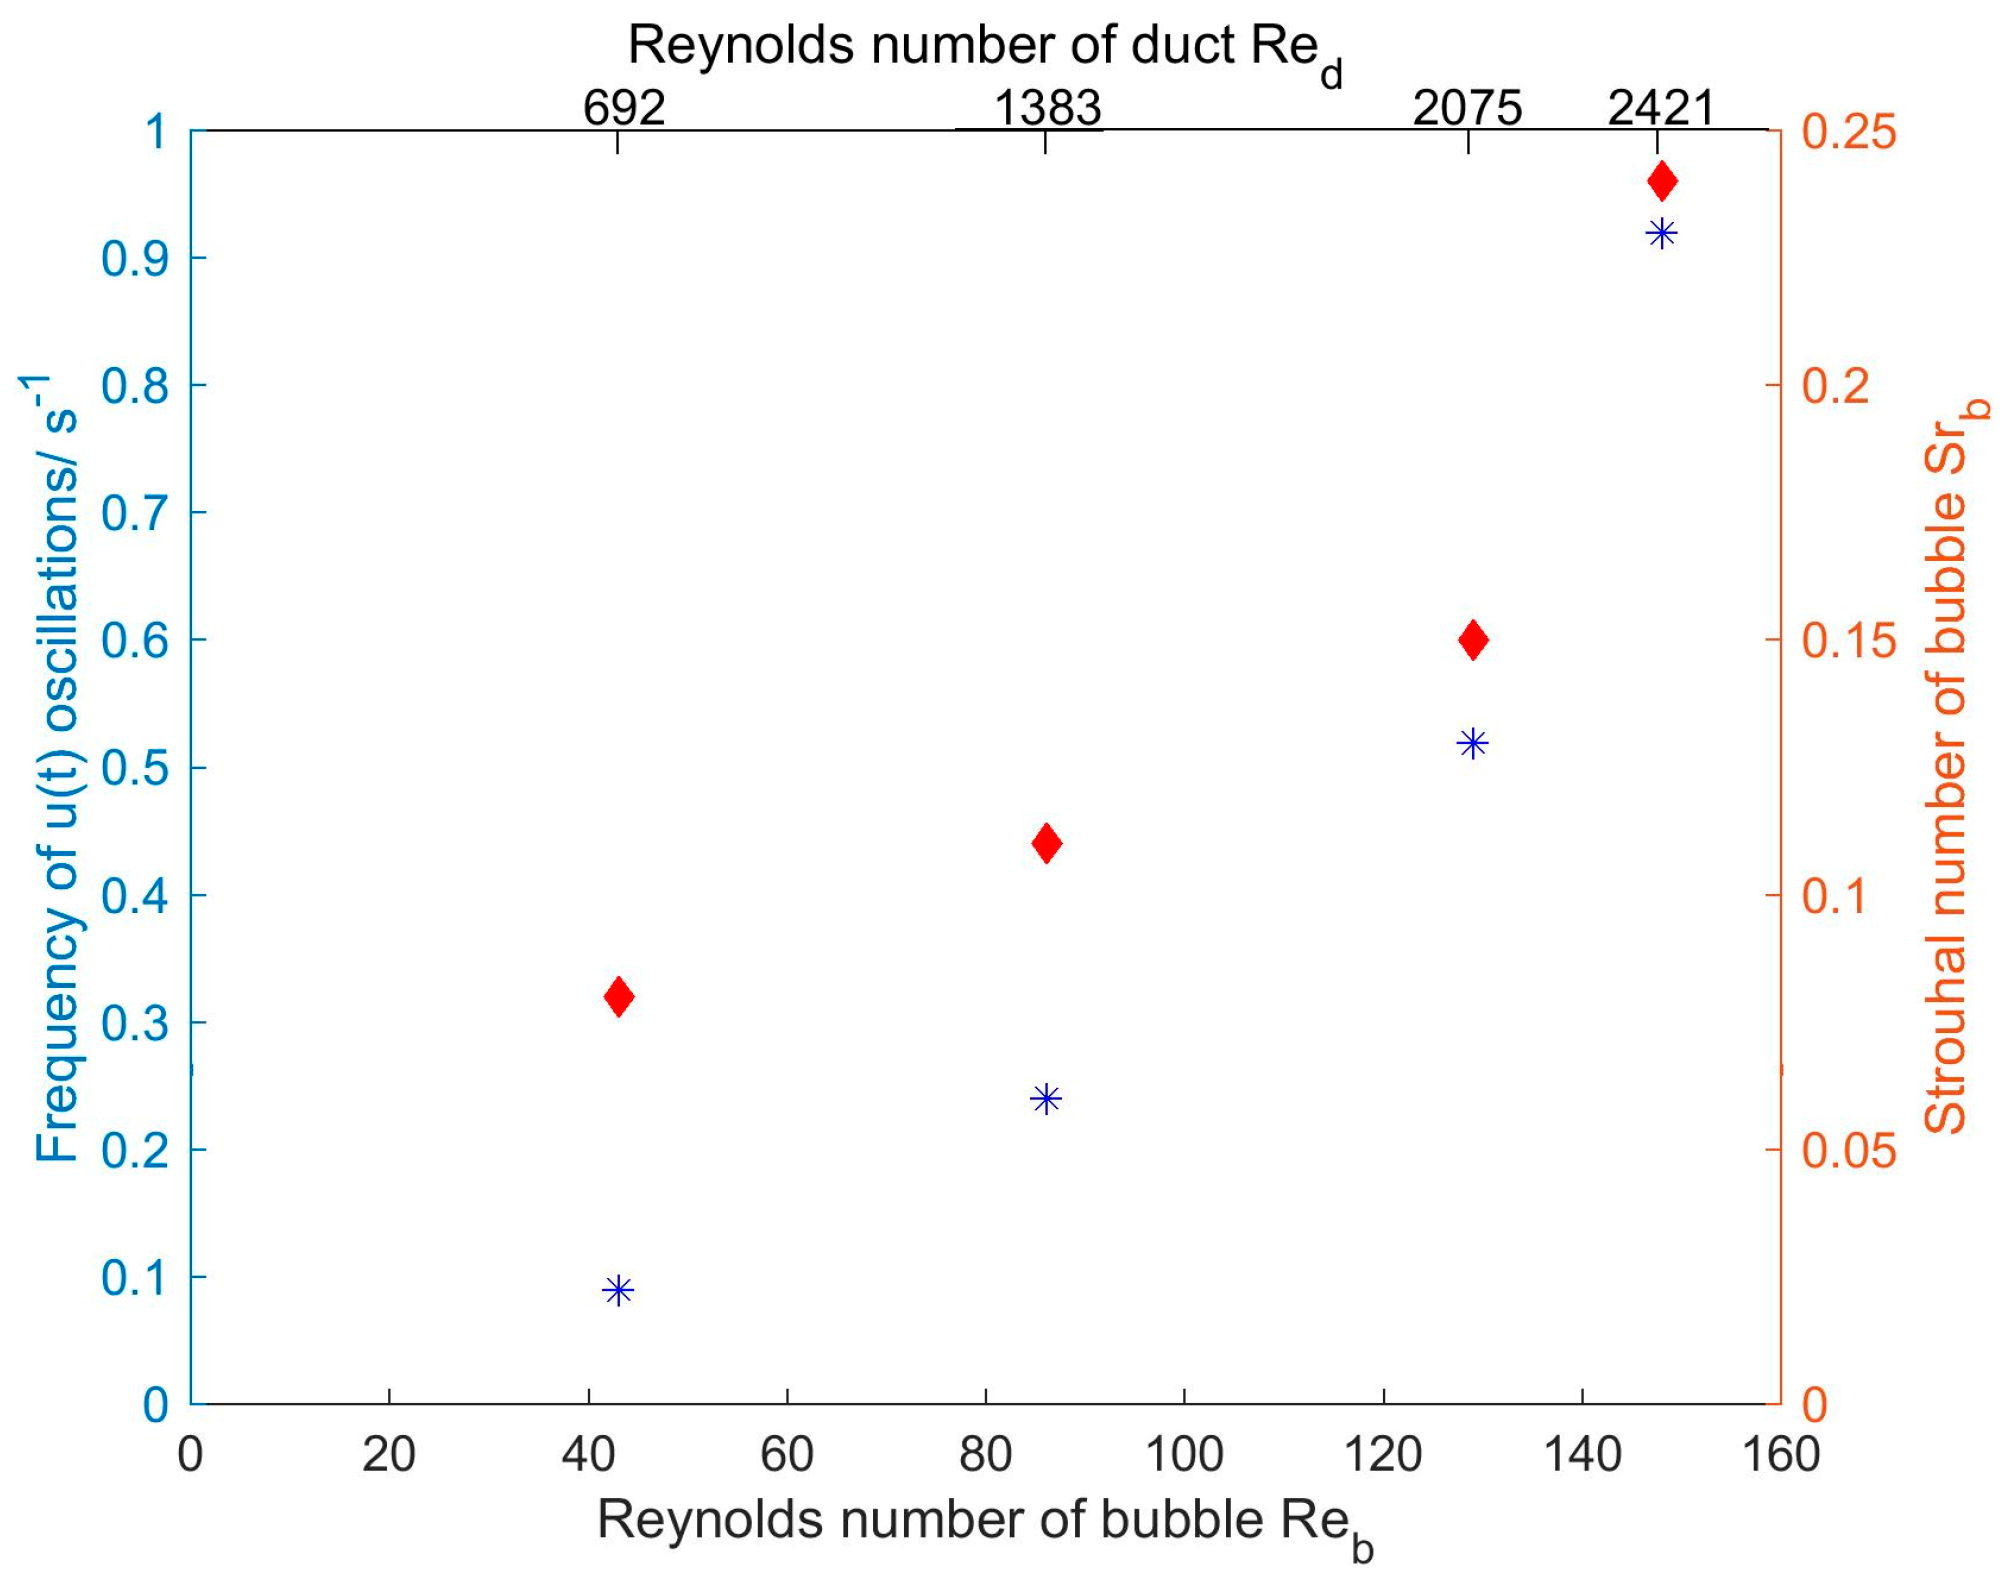
Figure 6.
Non-dimensional streamwise velocity component of the single bubble for two different Reynolds numbers (a,b); and nomenclature (c). denotes the surface of the single bubble.
Figure 6.
Non-dimensional streamwise velocity component of the single bubble for two different Reynolds numbers (a,b); and nomenclature (c). denotes the surface of the single bubble.
Figure 7.
Vertical root mean square velocities downstream the bubble at the rear stagnation point, ( 0: surface of the bubble). (a) Comparison with and without the vortex street; (b) comparison of different configurations and Reynolds numbers.
Figure 7.
Vertical root mean square velocities downstream the bubble at the rear stagnation point, ( 0: surface of the bubble). (a) Comparison with and without the vortex street; (b) comparison of different configurations and Reynolds numbers.

Figure 8.
Horizontal velocity profiles (a) and velocity fields with stream traces (b) around a single bubble (no cylinder).
Figure 8.
Horizontal velocity profiles (a) and velocity fields with stream traces (b) around a single bubble (no cylinder).
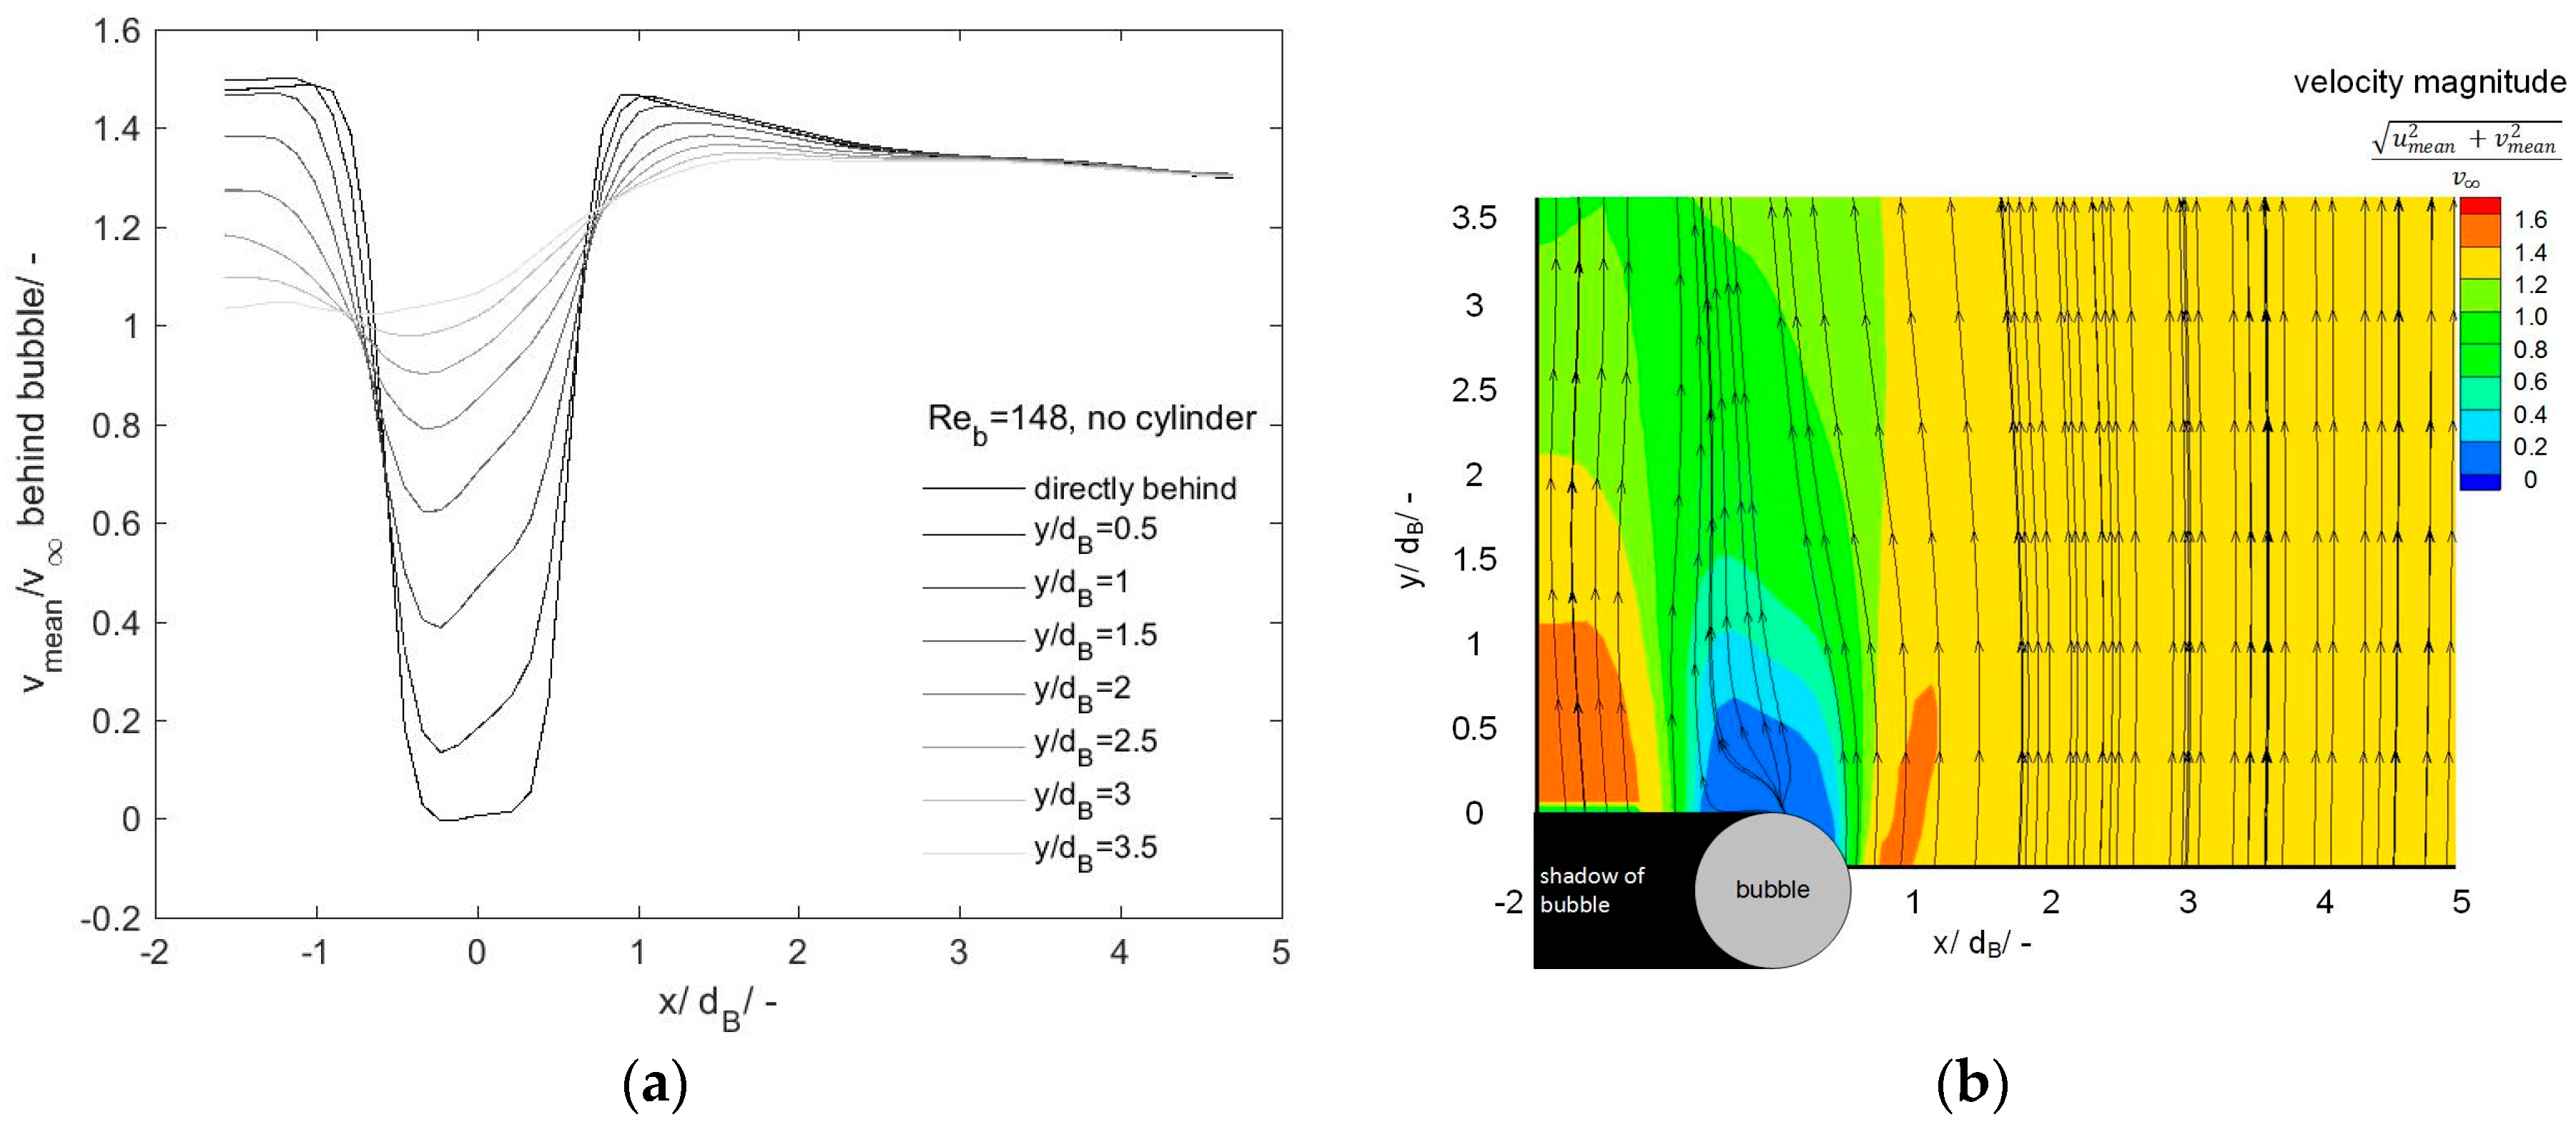
Figure 9.
Horizontal velocity profiles (a) and velocity fields with stream traces (b) around a staggered configuration of a single bubble and a cylinder (L* = 2.75).
Figure 9.
Horizontal velocity profiles (a) and velocity fields with stream traces (b) around a staggered configuration of a single bubble and a cylinder (L* = 2.75).
Figure 10.
Horizontal velocity profiles (a) and velocity fields with stream traces (b) around a staggered configuration of a single bubble and a cylinder (L* = 1).
Figure 10.
Horizontal velocity profiles (a) and velocity fields with stream traces (b) around a staggered configuration of a single bubble and a cylinder (L* = 1).

Figure 11.
Instantaneous velocity fields and stream traces of a staggered configuration of a single bubble and a cylinder (L* = 1); Reb = 163, Recyl = 484.
Figure 11.
Instantaneous velocity fields and stream traces of a staggered configuration of a single bubble and a cylinder (L* = 1); Reb = 163, Recyl = 484.


Table 1.
Parameters of 2D high-speed Particle Image Velocimetry (PIV) experiments.
| Parameters | Settings |
|---|---|
| Camera | PCO dimax HS2 (PCO AG, Kelheim, Germany), 1400 × 1000 Px2, 12 bit |
| Objective | Zeiss macro planar 2/50 mm |
| Laser | Quantronix Darwin-Duo-100M, Nd:YLF (Quantronix Inc., Hamden, CT, USA), total energy > 60 mL, average power at 3 kHz > 90 W |
| Seeding Particles | PS-FluoRed-Fi203, monodisperse 3.16 µm, abs/em = 530/607 nm (MicroParticles GmbH, Berlin, Germany) |
| Frame Rate | 500 fps |
| Acquisition Time | 20 s |
| Number of Images Processed | 10,000 |
| Spatial Resolution (vector-to-vector spacing) | 0.36 … 0.69 mm (24 Px) |
| Temperature | 20 ± 1.5 °C |
| PIV Data Processing Software | PivView 3.60 (PivTec GmbH, ILA_5150 GmbH, Aachen, Germany) |
Table 2.
Details of frequency analysis behind the cylinder.
| Reynolds Number Recyl | Flow Regime [25] | Frequency of u(t) Fluctuation/s−1 | Strouhal Number Srcyl | Calculated Strouhal Number [23] Srcalc |
|---|---|---|---|---|
| 100 | 2D (laminar) | 0.06 | 0.24 | 0.17 |
| 418 | 3D (irregular) | 0.24 | 0.23 | 0.21 |
| 418 | 3D (irregular) | 0.27 | 0.26 | 0.21 |
| 478 | 3D (irregular) | 0.31 | 0.25 | 0.21 |
© 2018 by the authors. Licensee MDPI, Basel, Switzerland. This article is an open access article distributed under the terms and conditions of the Creative Commons Attribution (CC BY) license (http://creativecommons.org/licenses/by/4.0/).
Share and Cite
MDPI and ACS Style
Rüttinger, S.; Hoffmann, M.; Schlüter, M. Experimental Analysis of a Bubble Wake Influenced by a Vortex Street. Fluids 2018, 3, 8. https://doi.org/10.3390/fluids3010008
AMA Style
Rüttinger S, Hoffmann M, Schlüter M. Experimental Analysis of a Bubble Wake Influenced by a Vortex Street. Fluids. 2018; 3(1):8. https://doi.org/10.3390/fluids3010008
Chicago/Turabian StyleRüttinger, Sophie, Marko Hoffmann, and Michael Schlüter. 2018. "Experimental Analysis of a Bubble Wake Influenced by a Vortex Street" Fluids 3, no. 1: 8. https://doi.org/10.3390/fluids3010008