Characterization of Bubble Size Distributions within a Bubble Column


Mechanical and Aerospace Engineering, Oklahoma State University, Stillwater, OK 74078, USA
*
Author to whom correspondence should be addressed.
Fluids 2018, 3(1), 13; https://doi.org/10.3390/fluids3010013
Submission received: 15 December 2017
/
Revised: 25 January 2018
/
Accepted: 4 February 2018
/
Published: 7 February 2018
(This article belongs to the Special Issue Flow and Heat or Mass Transfer in the Chemical Process Industry)
Abstract
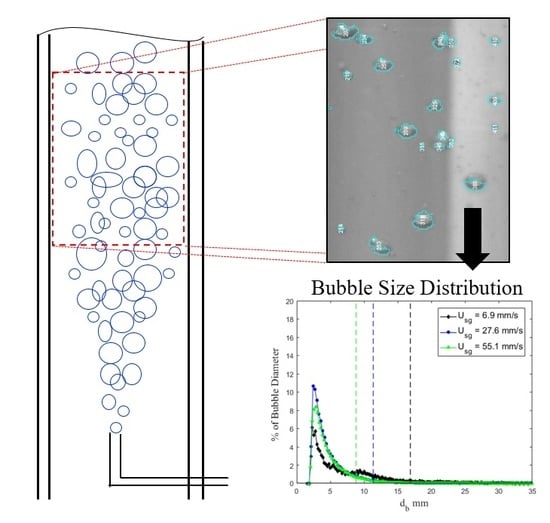
:The current study experimentally examines bubble size distribution (BSD) within a bubble column and the associated characteristic length scales. Air was injected into a column of water via a single injection tube. The column diameter (63–102 mm), injection tube diameter (0.8–1.6 mm) and superficial gas velocity (1.4–55 mm/s) were varied. Large samples (up to 54,000 bubbles) of bubble sizes measured via 2D imaging were used to produce probability density functions (PDFs). The PDFs were used to identify an alternative length scale termed the most frequent bubble size (dmf) and defined as the peak in the PDF. This length scale as well as the traditional Sauter mean diameter were used to assess the sensitivity of the BSD to gas injection rate, injector tube diameter, injection tube angle and column diameter. The dmf was relatively insensitive to most variation, which indicates these bubbles are produced by the turbulent wakes. In addition, the current work examines higher order statistics (standard deviation, skewness and kurtosis) and notes that there is evidence in support of using these statistics to quantify the influence of specific parameters on the flow-field as well as a potential indicator of regime transitions.
1. Introduction
Bubble columns are frequently used as contact reactors in chemical processing, bio-chemical applications and metallurgical applications due to their simplicity (e.g., no moving parts), low operation cost and high efficiency at heat and mass transfer. Design and scale up of a bubble column relies on characterization of transport coefficients, which are sensitive to the bubble size and spatial distribution (local void fraction). Relative velocity between phases coupled with nonhomogeneous distributions has significantly limited the ability to apply laboratory insights to industrial applications. This is due in part to the fact that bubble size is frequently characterized with a single length scale (commonly the Sauter mean diameter, d32), which fails to capture details of the size distribution. Thus, the current work aims to characterize the bubble size distribution (BSD) and its dependence on bubble column conditions via examination of the probability density function (PDF) and higher order statistics.
BSDs are heavily dependent on the operating regime, which determines dominant fluid mechanisms active within the multiphase system [1]. The current work does not aim to provide an analysis of characteristic length scales over a range of flow regimes, but rather focuses on relatively low volumetric injection fluxes to assess the sensitivity of the distribution to a range of parameters. However, it is hypothesized that the size distribution characteristics can provide a robust means of identifying regime transitions.
Use of a single length scale would be appropriate for characterizing the bubble size if the bubble size/shape is readily represented with a single length (e.g., spherical bubbles) and the shape of the size distribution was constant. Many researchers implicitly make this assumption without examining the higher order statistics, primarily due to the challenge of generating a sufficiently large sample size to accurately estimate the higher order statistics. Sauter mean diameter (d32) is the most widely used characteristic length in bubble column studies (e.g., [2,3,4,5]). Sauter mean diameter,
is the ratio of the representative bubble volume to the bubble surface area, which is a weighted average. Here ni is the number of bubbles with size di. Sauter mean diameter is frequently used when the sizes are acquired using optical photography techniques. Here the bubble cross sectional area (Aproj) is determined from the projected image. Then assuming that the bubbles are well approximated as ellipsoids (or more specifically an oblate spheroid), an equivalent bubble chord length,
can be computed. Here b is the ratio of the large diameter to the small diameter (i.e., aspect ratio). This equivalent bubble diameter is then used for di in Equation (1).
A common alternative to d32 is a probabilistic approach, which uses the mean of the PDF of the bubble chord length [5,6,7,8,9]. This method is most common when the measurements are acquired with electrical impedance/resistivity [10,11,12], wire mesh [13,14,15] or optical [16] point probes, which can only provide a single length scale but a relatively large sample size. These measurements are sensitive to the bubble size, velocity, shape and orientation as well as the sensor design (e.g., response from optical/impedance probes are unique to the sensor design and fluid properties). Consequently, these measurements are unable to provide details about the shape due to the required ad hoc assumptions to relate the signals to a bubble size. The current work uses bubble imaging of a large bubble population to produce PDFs that are not dependent on the assumption that the bubbles are spherical. These PDFs are then analyzed to identify an alternative length scale based on the peak in the PDF, which is then used along with the Sauter mean diameter to test sensitivity of the scales to operation conditions. In addition, higher order statistics from the PDFs are reported.
2. Experimental Methods
2.1. Test Facility and Air Injection
The bubble columns used in this work were originally designed as part of a vibrating bubble column facility that examined the influence of unsteady loading on bubble dynamics [17,18,19]. The current work utilizes the facility’s bubble columns and a modified compressed air injection setup. Here we provide details of the components used in the current study and the interested reader is directed to Still [17] for additional details on the test facility and its design. The current work used two columns with inner diameters of 63 mm and 102 mm with corresponding lengths of 610 mm and 1220 mm, respectively.
The columns were fabricated from cast acrylic for optical access for bubble imaging. The ends of the columns were capped with flanges, which were used for mounting as well as a pressure seal. Both columns were filled with water and the ratio of the bubble column height (H) to the column diameter (D) was held constant at nine throughout testing. This aspect ratio was selected following the recommendations of Besagni et al. [20] to mitigate the effect of column height on the physical behavior of the system.
Fluid properties are known to affect the size distribution with bubble size decreasing with increasing liquid density [21] and decreasing surface tension [22]. Viscosity plays a more complex role [23] as illustrated with reports of increasing [24] and decreasing [25] bubble size with increasing viscosity. However, fluid properties had minimal variation in the current work with filtered air injected into filtered water at nearly constant temperature. The columns were filled with tap water that was passed through a cartridge filter (W10-BC, American Plumber, Pentair Residential Filtration, LLC, Brookfield, WI, USA) that had 5 μm nominal filtration. Surface tension of the filtered water supply was measured with a force tensiometer (K6, Krüss GmbH, Hamburg, Germany) and platinum ring (RI0111-28438, Krüss GmbH, Hamburg, Germany). The surface tension of the filtered water supply over several days was 72.6 ± 0.4 mN/m, which is comparable to the nominal surface tension of pure water (~72.8 mN/m). The column pressure for all data in the current study was at atmospheric pressure (plus hydrostatic pressure).
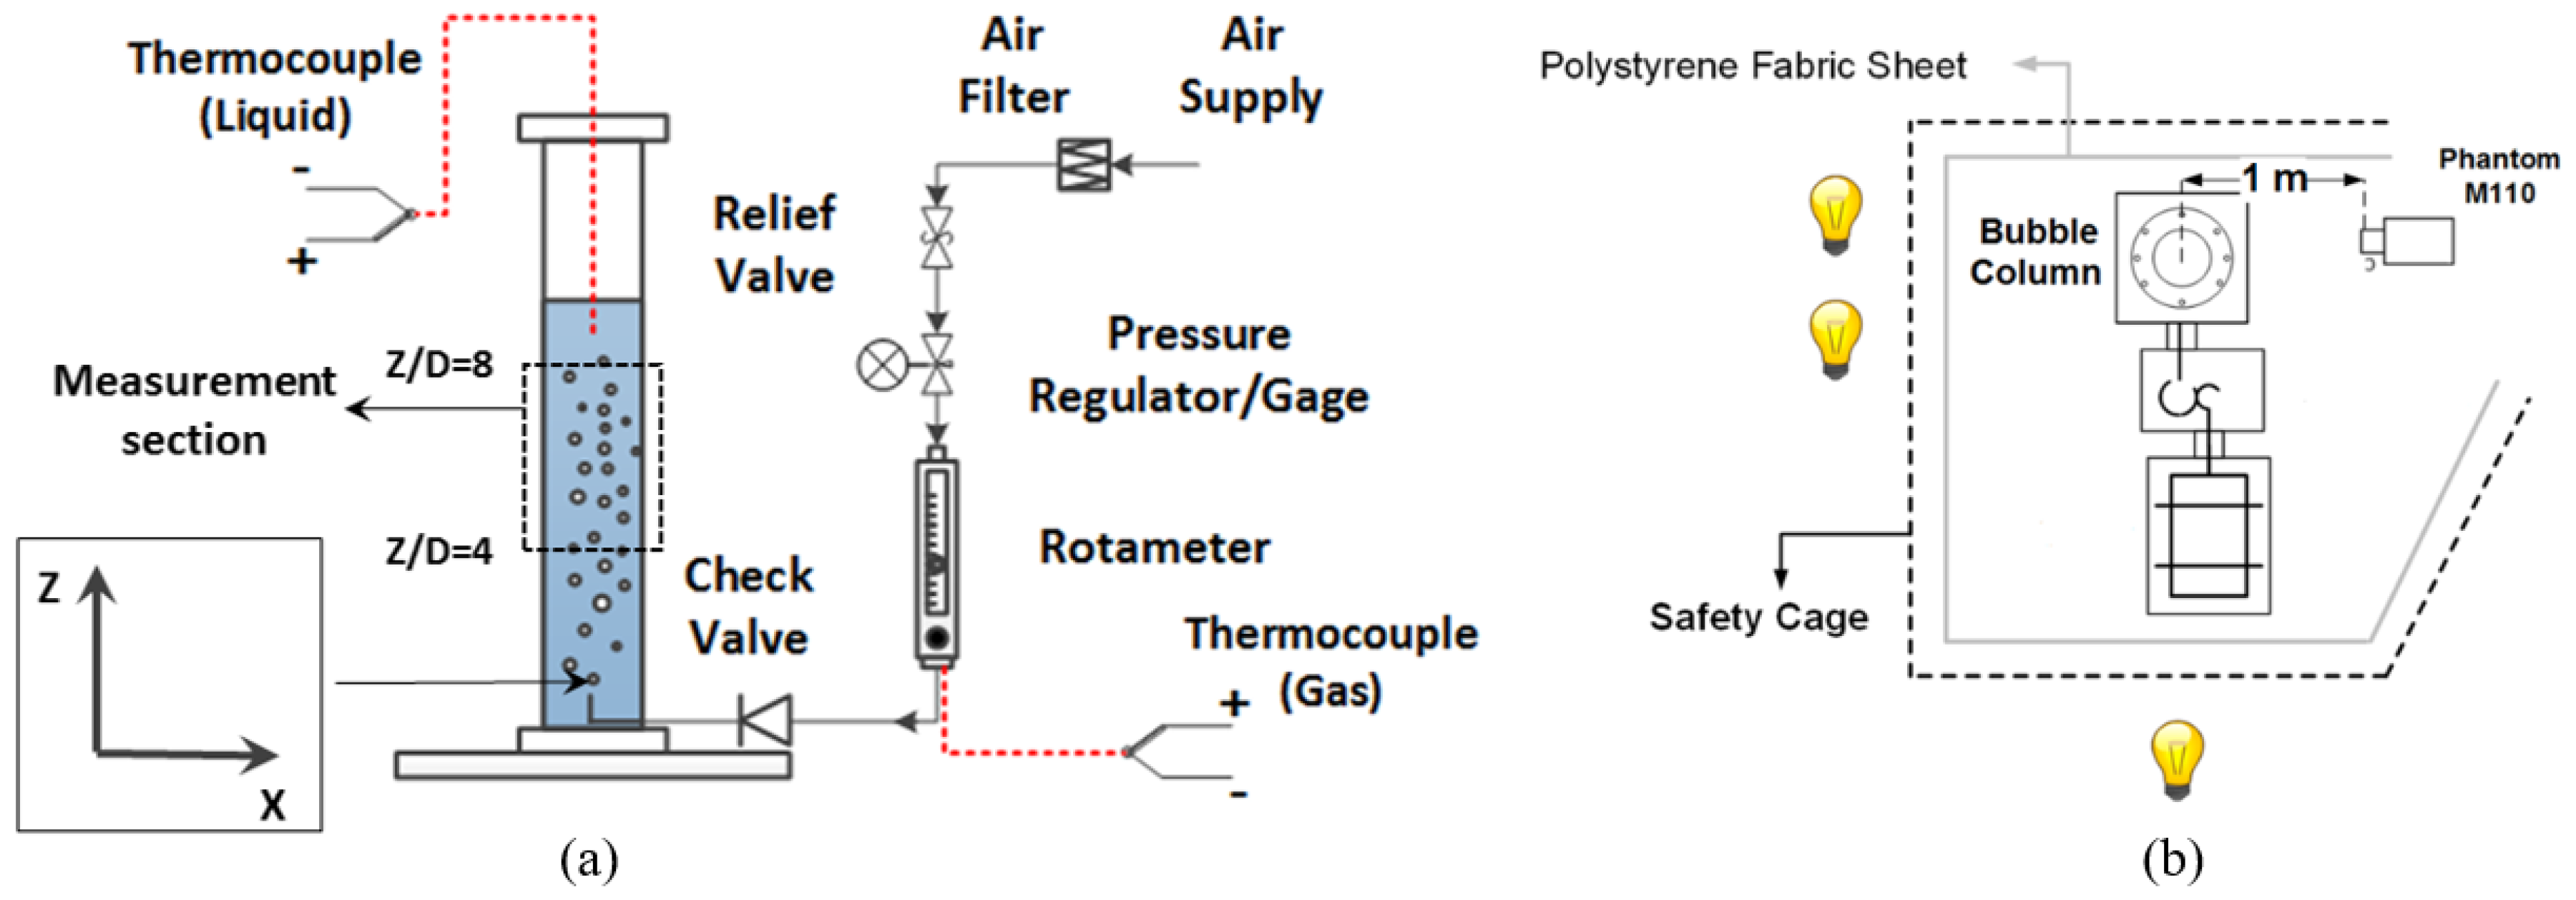
The injection method is known to impact BSDs [26]. The current study injected compressed air into the column via a single gas injector tube mounted near the column base as shown schematically in Figure 1a. After the stainless steel tube passed through the column wall, it was smoothly curved to produce either a 45° or 90° bend. The tube outlet was centered in the cylinder and pointed vertically upward. The injector tube had an inner diameter of 0.8 or 1.6 mm, which, for reference, produce initial bubble sizes of 3.4 and 4.3 mm, respectively, when surface tension dominates detachment [27]. Thus the dimensionless injector (sparger) opening parameter for the 0.8 and 1.6 mm injector tubes are 4.3 and 2.7 [28], respectively. The injection tube was supplied with compressed air from the building that was filtered to 5 μm (SGY-AIR9JH, Kobalt, Lowe's Companies, Inc., Mooresville, NC, USA). Immediately upstream of the injection tube was a check valve to prevent water from back filling the air supply line between test runs.
The mass airflow rate into the bubble column was controlled and monitored with a combination of a rotameter (EW-32461-50, Cole-Parmer, Vernon Hills, IL, USA), thermocouple (5SC-TT-K-40-36, Omega Engineering, Norwalk, CT, USA) and pressure regulator (Spectra Gases, Inc., Stewartsville, NJ, USA). The rotameter had a manufacturer specified accuracy of 2% full scale and a measurement range of 0.4 to 5 liters per minute (lpm). The thermocouple measured the air temperature immediately upstream of the rotameter with an accuracy of ±0.1 °C. The pressure regulator was used to both measure the pressure at the rotameter as well as control the mass injection rate. The ideal gas law was used to convert the volumetric flowrate, air temperature and pressure to a mass airflow rate. Note that the air temperature difference between the regulator and the rotameter was ≤0.3 °C over all test conditions. The mass airflow rate was converted back to a local volumetric flow rate within the bubble column using hydrostatic pressure and the water temperature, which was measured with a separate thermocouple (HSTC-TT-K-20S-120-SMPW-CC, Omega). All tests were conducted with the air temperature between 20 °C and 22 °C, and temperature difference between the air and water was less than ±2 °C.
2.2. Bubble Size Measurement
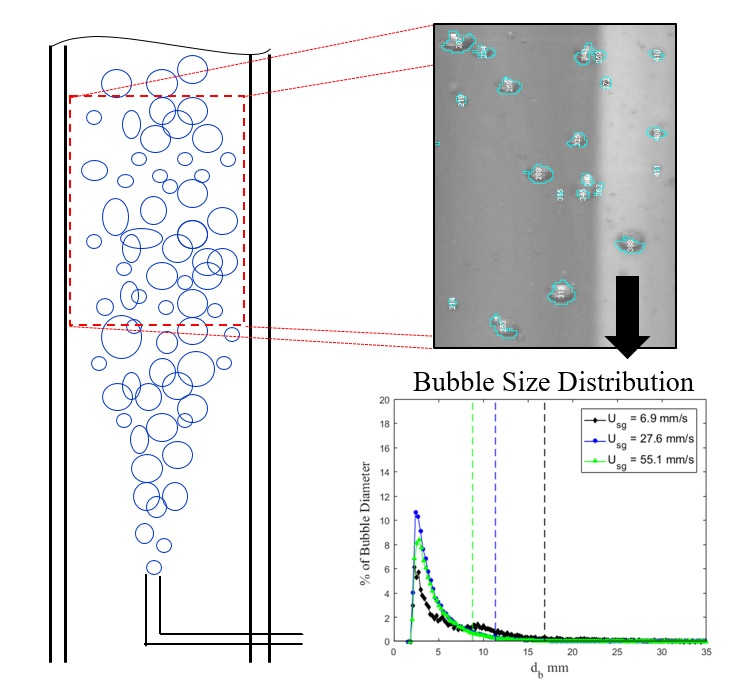
The BSDs were determined from 2D optical imaging with a high-speed complementary metal–oxide–semiconductor (CMOS) camera (Phantom Miro 110, Vision Research, Wayne, NJ, USA), which has a resolution of 1280 × 800 pixels. The camera pixel size was 20 μm × 20 μm with a 12-bit depth. For the current work, the sample rate was 400 Hz with a reduced resolution of 1280 × 400 pixels, which the on-board memory (12 GB) allows ~38 s of recording with these settings. A 60 mm diameter, f/2.8D lens (AF-Micro-NIKKOR, Nikon Corporation, Tokyo, Japan) was used with the camera, which produced a field-of-view of 470 mm × 150 mm. The exposure time was 600 μs to provide maximum illumination without bubble blurring. The column was backlit with four 500 W halogen lights and twelve 45 W fluorescent lights. The light was uniformly diffused using several 2.3 m × 2.6 m solid white microfiber fabric sheets. Consistent and uniform backlighting simplifies image-processing and decreases uncertainty. The final lighting configuration (shown in Figure 1b) produced a homogenous light intensity distribution.
Imaging through a round cylindrical column produces optical distortions, especially near the column edges. A spatial calibration was performed with a particle-image-velocimetry (PIV) calibration target (Type 58-5, LaVision, Göttingen, Germany), which also quantified the impact of these distortions. Figure 2a illustrates use of the target to identify the distortions, and Figure 2b shows the spatial variation of the calibration coefficient for each column. Cropping the images at the lines shown (11 mm and 14 mm from the wall for the 63 and 102 mm columns, respectively) results in a maximum size variation of ±0.4 mm due to the calibration variation, which is below the minimum bubble size (1.6 mm). Since this variation is comparable to the variation associated with out-of-plane motion, an average mid-plane spatial calibration was used for the entire image.
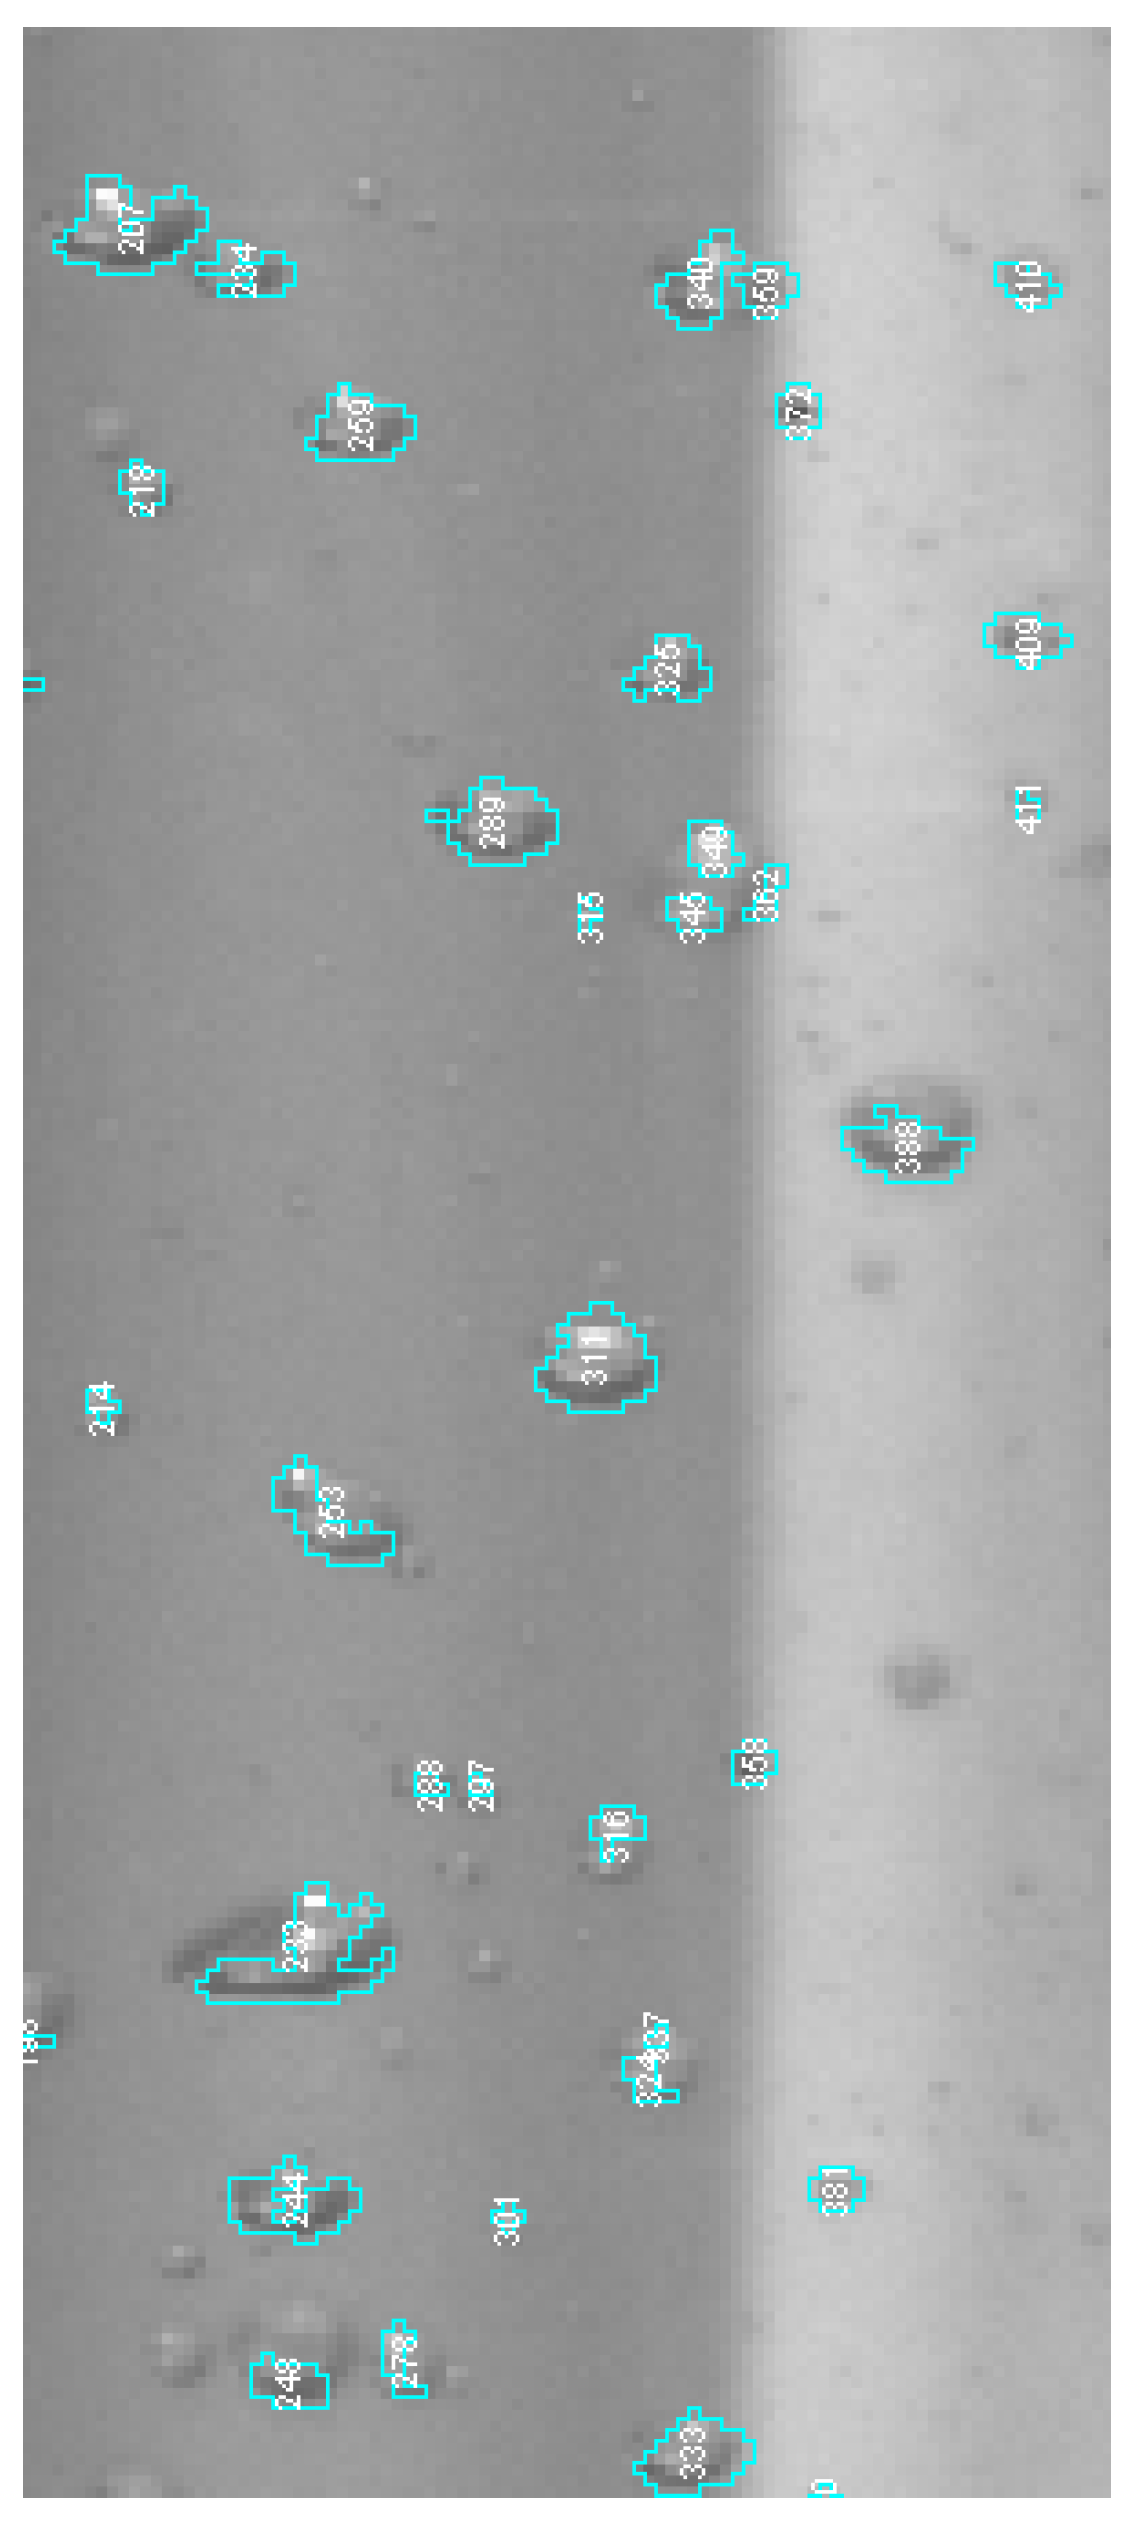
Bubble images were acquired with commercial data acquisition software (2.5.744.0v, Phantom Camera Control, Vision Research, Wayne, NJ, USA) and then post-processed using ImageJ (1.49v, National Institutes of Health (NIH), Bethesda, MD, USA) [29,30,31], a common open access image-processing program. Within ImageJ, an edge detection algorithm was used to sharpen the bubble edges, the background was subtracted and then a grayscale threshold was used to convert the 12-bit images to binary images. A subset of images from each condition were manually processed and then used to determine the appropriate grayscale threshold. Note that a range of acceptable threshold values were explored and had a 2% variation on measured bubble size. Figure 3 provides an example of a raw image with the identified bubbles using the appropriate threshold outlined. This illustrates that the processing algorithm can identify in-focus bubbles and exclude out-of-focus bubbles, which minimizes the impact of out-of-plane bubble locations on the spatial calibration. Note that for the current study in-focus bubbles were limited to ±12 mm of the focal plane. Figure 3 was also selected to show that, even with a proper threshold, overlapping and defective bubbles (e.g., defected bubble outlined at bottom left of Figure 3) can contaminate the size distributions. Consequently, each image was manually inspected for the aforementioned problems and impacted bubbles were removed from the population sample. These manual inspections were also used to confirm that the grayscale threshold was not impacted by changes in void fraction between conditions.
The cross-sectional area, bubble centroid location and the aspect ratio were then calculated for identified bubbles. Note that any deviation in orientation perpendicular to the visualization plane when the aspect ratio is greater than 1 (i.e., bubbles larger than ~2 mm) results in an overestimate of the bubble projected area. A high-pass filter with a cutoff area of Aproj = 2 mm2 was used to remove noise contamination from BSD and consequently the PDFs. Given the cross-sectional area, a nominal bubble size was determined using Equation (2). Note that not every image was processed because the sample rate (400 Hz) did not produce a sufficient duration for a new bubble population in each image. Consequently, the period between processed images was increased such that each processed image contained a new bubble population to ensure statistically independent bubble samples.
2.3. Repeatability
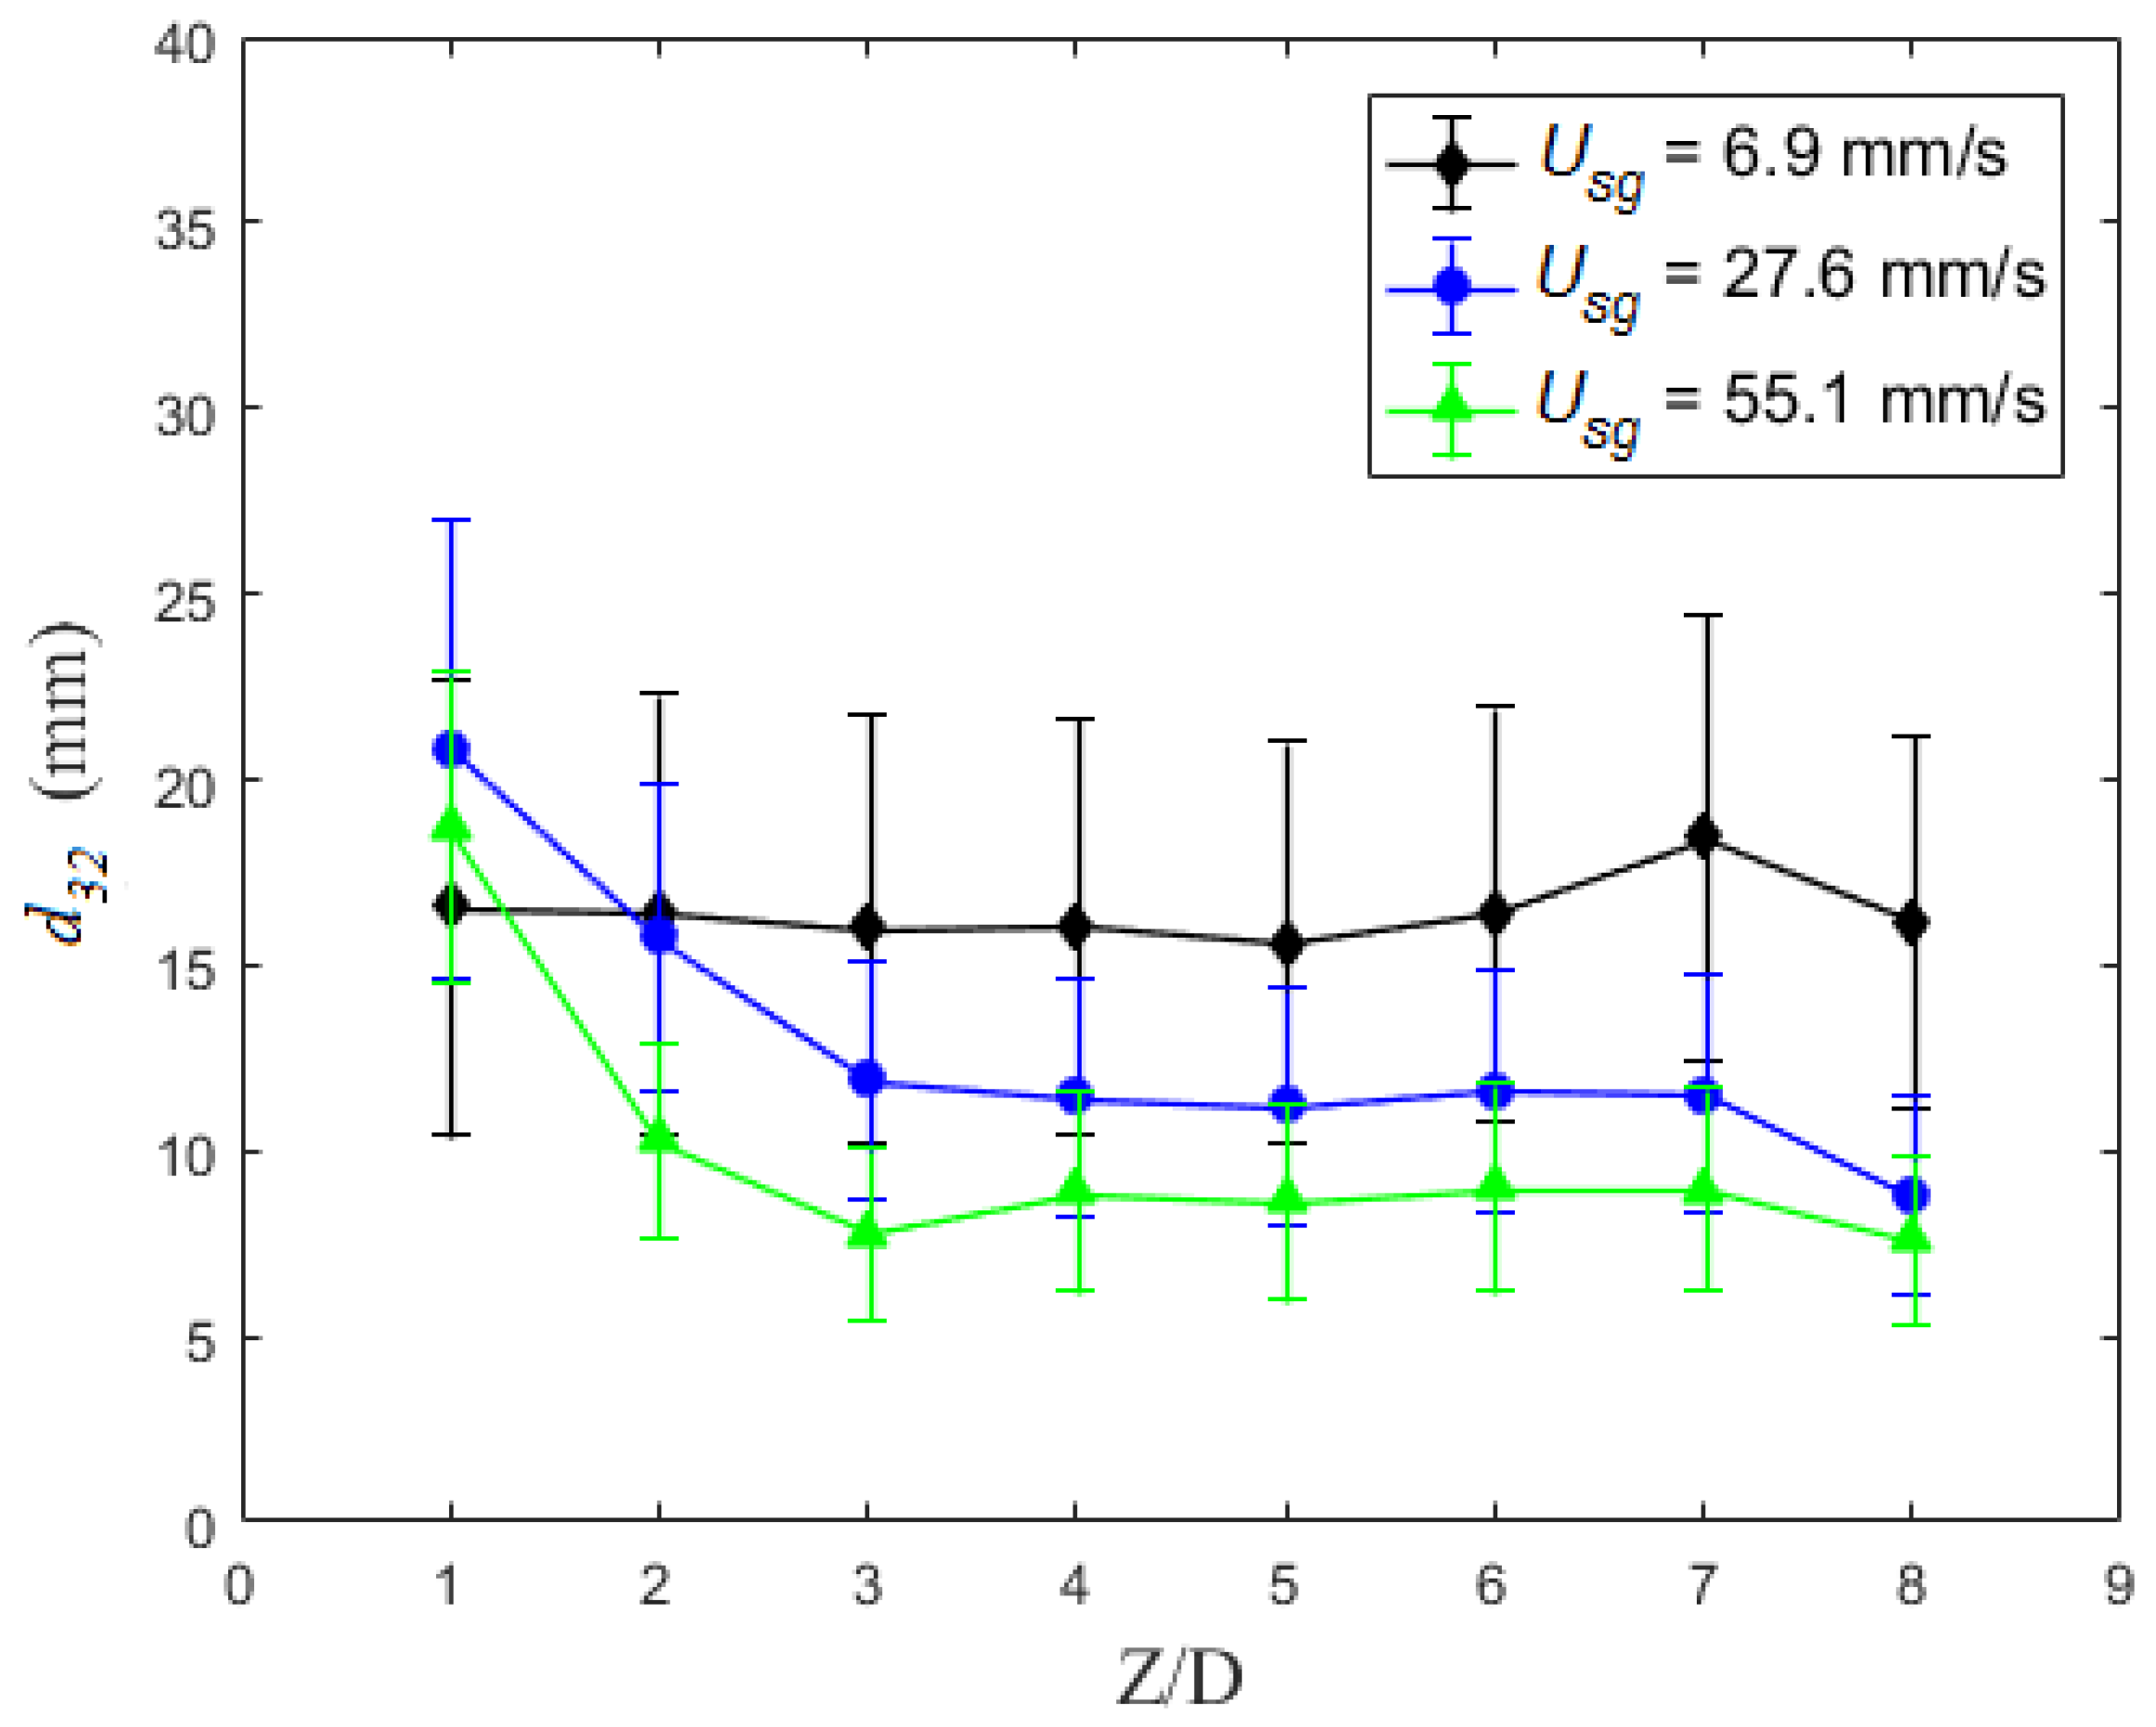
A subset of tests were conducted to evaluate the repeatability of the experiment, which also provided insight into the target measurement location. Three air volumetric flowrates (Qm) were selected that produced superficial gas velocities (volume averaged phase velocity; Usg = Qc/Acs) of 6.9 mm/s, 27.6 mm/s and 55.1 mm/s. Under these conditions, the bubble column was operating within the poly-dispersed homogenous regime [18], which is true throughout the current study. Each condition was repeated at least ten times with a minimum of 3000 bubbles sampled per condition. Results from these tests are shown in Figure 4 with the Sauter mean diameter (d32) plotted versus the vertical distance above the injection location (Z) scaled with the column diameter (D). Error bars represent the standard deviation of the mean for each condition. Similar to Akita and Yoshida [22], these results exhibit a decrease in d32 with increasing gas flux for locations sufficiently far from the injection location. Note that increasing superficial velocity is known to increase or decrease [32,33] bubble size due to its complex role modifying bubble formation processes and liquid circulation. Figure 4 also indicates that beyond Z ~ 4D the bubble size remains constant within the measurement uncertainty. Consequently, the current work focuses on bubble measurements in the range of 4 < Z/D < 6 to minimize the influence of the injection method. It is noteworthy that the minimum height above the injector will be sensitive to the injection condition, which will be discussed subsequently. Furthermore, inspection of the images within the target height range showed minimal influence of bubble breakup and/or coalescence.
3. Bubble Size Length Scales
While Sauter mean diameter (d32) is widely used as the characteristic bubble length scale, bubble size distributions are often poly-dispersed, which makes a single length scale insufficient to characterize the distribution. Consequently, in the current work the PDF was examined to identify a length scale(s) that represents the size distribution. The PDFs generated from counting at least 10,000 bubbles per condition is provided in Figure 5a (PDF of conditions shown in Figure 4, though limited to 4 < Z/D < 6). Here there is a noticeable shift between the PDF peaks and d32. Consequently, the most frequent bubble size (dmf) was defined as the size corresponding to the peak in the PDF (mode). These representative conditions illustrate the different behavior between d32 and dmf, with dmf being significantly smaller than d32 over the range tested. In addition, while there is a noticeable dependence between d32 and the volumetric gas flux, dmf appears to have negligible variation. It is worth mentioning that the high-pass filter forces the left leg of PDFs to be zero when Aproj < 2 mm2. For a spherical bubble (b = 1; aspect ratios are nominally one for smallest bubbles), this minimum area translates into a minimum bubble size of db < 1.6 mm.
The obvious question is what accounts for the difference between d32 and dmf. As seen in Equation (1), d32 is a weighted average that is biased towards the largest bubbles generated due to the diameters being raised to powers before summing. Consequently, the influence of a large quantity of small bubbles has a weaker impact on d32 than a few large bubbles. This can be seen in the cumulative density function (CDF) for these conditions provided in Figure 5b. The lowest flow rate exhibits significantly more large bubbles (e.g., 23% of bubbles are larger than 10 mm) than the highest injection flux (<5% of bubbles are larger than 10 mm), thus illustrating how these three conditions with nearly identical dmf values generate measurable deviations in d32.
A comprehensive examination of the variation between d32 and dmf is provided in Figure 6 with the most frequent bubble size plotted versus Sauter mean diameter for all test conditions. For reference, a dashed line corresponding to dmf = d32 has been included, which shows that for all conditions dmf is smaller than d32. The majority of the data points collapse on a curve that appears to asymptote to dmf ≈ 2 mm. The uniformity of these bubbles and insensitivity to the injection condition suggests that they are being generated by the flow-field, which the most likely mechanism would be the turbulent motions generated by the bubble wakes. This would suggest that dmf is a length scale associated with the velocity fluctuations within the flow-field. This conjecture is supported by the known Reynolds number dependence of bubble wakes. Bubble diameter (dmf) based Reynolds numbers (Re = Vb·dmf/ν, where Vb is the mean bubble rise velocity that is nominally Usg/α, α is the void fraction and ν is the kinematic viscosity) tested ranged between 590 and 11,000. Starting at a Reynolds number of ~500, vortices begin to be shed from bubbles and the flow-field becomes quite unsteady until ~1000. Starting at Re ~ 1000, a boundary layer forms on the bubble with a laminar near-wake region. However, the shear layer spreads resulting in a turbulent far-wake region. This behavior exits until Re ~ 3 × 10⁵, which is beyond the range of bubbles observed in the current study. Of note, a bimodal distribution is observed at lower Reynolds numbers (590 < Re < 2300), which is shown in Figure 7. This is a curious observation given that in this range the bubble wakes are unsteady with periodic shedding of vortex rings. The Strouhal number for Re ~ 1000 is ~0.3 [34], which the shedding from a 2.5 mm diameter bubble (nominal dmf for conditions in Figure 7) would produce an 8.3 mm long wavelength. This is comparable to the size of the second peak in the distribution.
Assuming that the PDF shape changes are related to regime transitions, higher order statistics (i.e., standard deviation, skewness and kurtosis) for a subset of conditions are presented in the conclusions of the parametric study. The use of both dmf and d32 are explored in more detail in the following section with a parametric study to assess the sensitivity to individual control parameters. Of note, over the conditions explored dmf (mode of PDF) is similar to d10 (mean of PDF; defined using Equation (1) with the powers changed from 3.2 to 1.0). Given that the PDFs are skewed to larger bubbles, d10 is generally larger than dmf and smaller than d32. While the behaviors are similar, they carry distinctly different physical information. While not explored in the current study, if the Reynolds number based on bubble diameter decreased below ~500, it is expected that dmf > d10. This is contrary to the current work where dmf < d10 for all conditions.
4. Parametric Studies
4.1. Gas Injection Rate
The volumetric flowrate of gas within the column (Qc) is determined from the mass flowrate into the column (ṁ), column pressure (Pc) and column temperature (Tc). In the current experiment, the column temperature and pressure were held nearly constant at Tc = 21 ± 1 °C and atmospheric pressure (plus hydrostatic pressure), respectively. Consequently, the mass flow rate was the only parameter varied, which was controlled with a combination of meter pressure (Pm) and metered volumetric flow rate (Qm). Figure 8 compares d32 and dmf dependence on the superficial velocity (Usg). Four different meter gauge pressures (Pm = 40, 260, 400 and 600 kPa) were used to achieve 1.4 ≤ Usg ≤ 55 mm/s. Sauter mean diameter shows good collapse over most of the test conditions, but there is some deviation observed with the Pm = 40 kPa condition. Conversely, dmf collapses at lower superficial velocities but show some deviation at higher fluxes with Pm = 600 kPa.
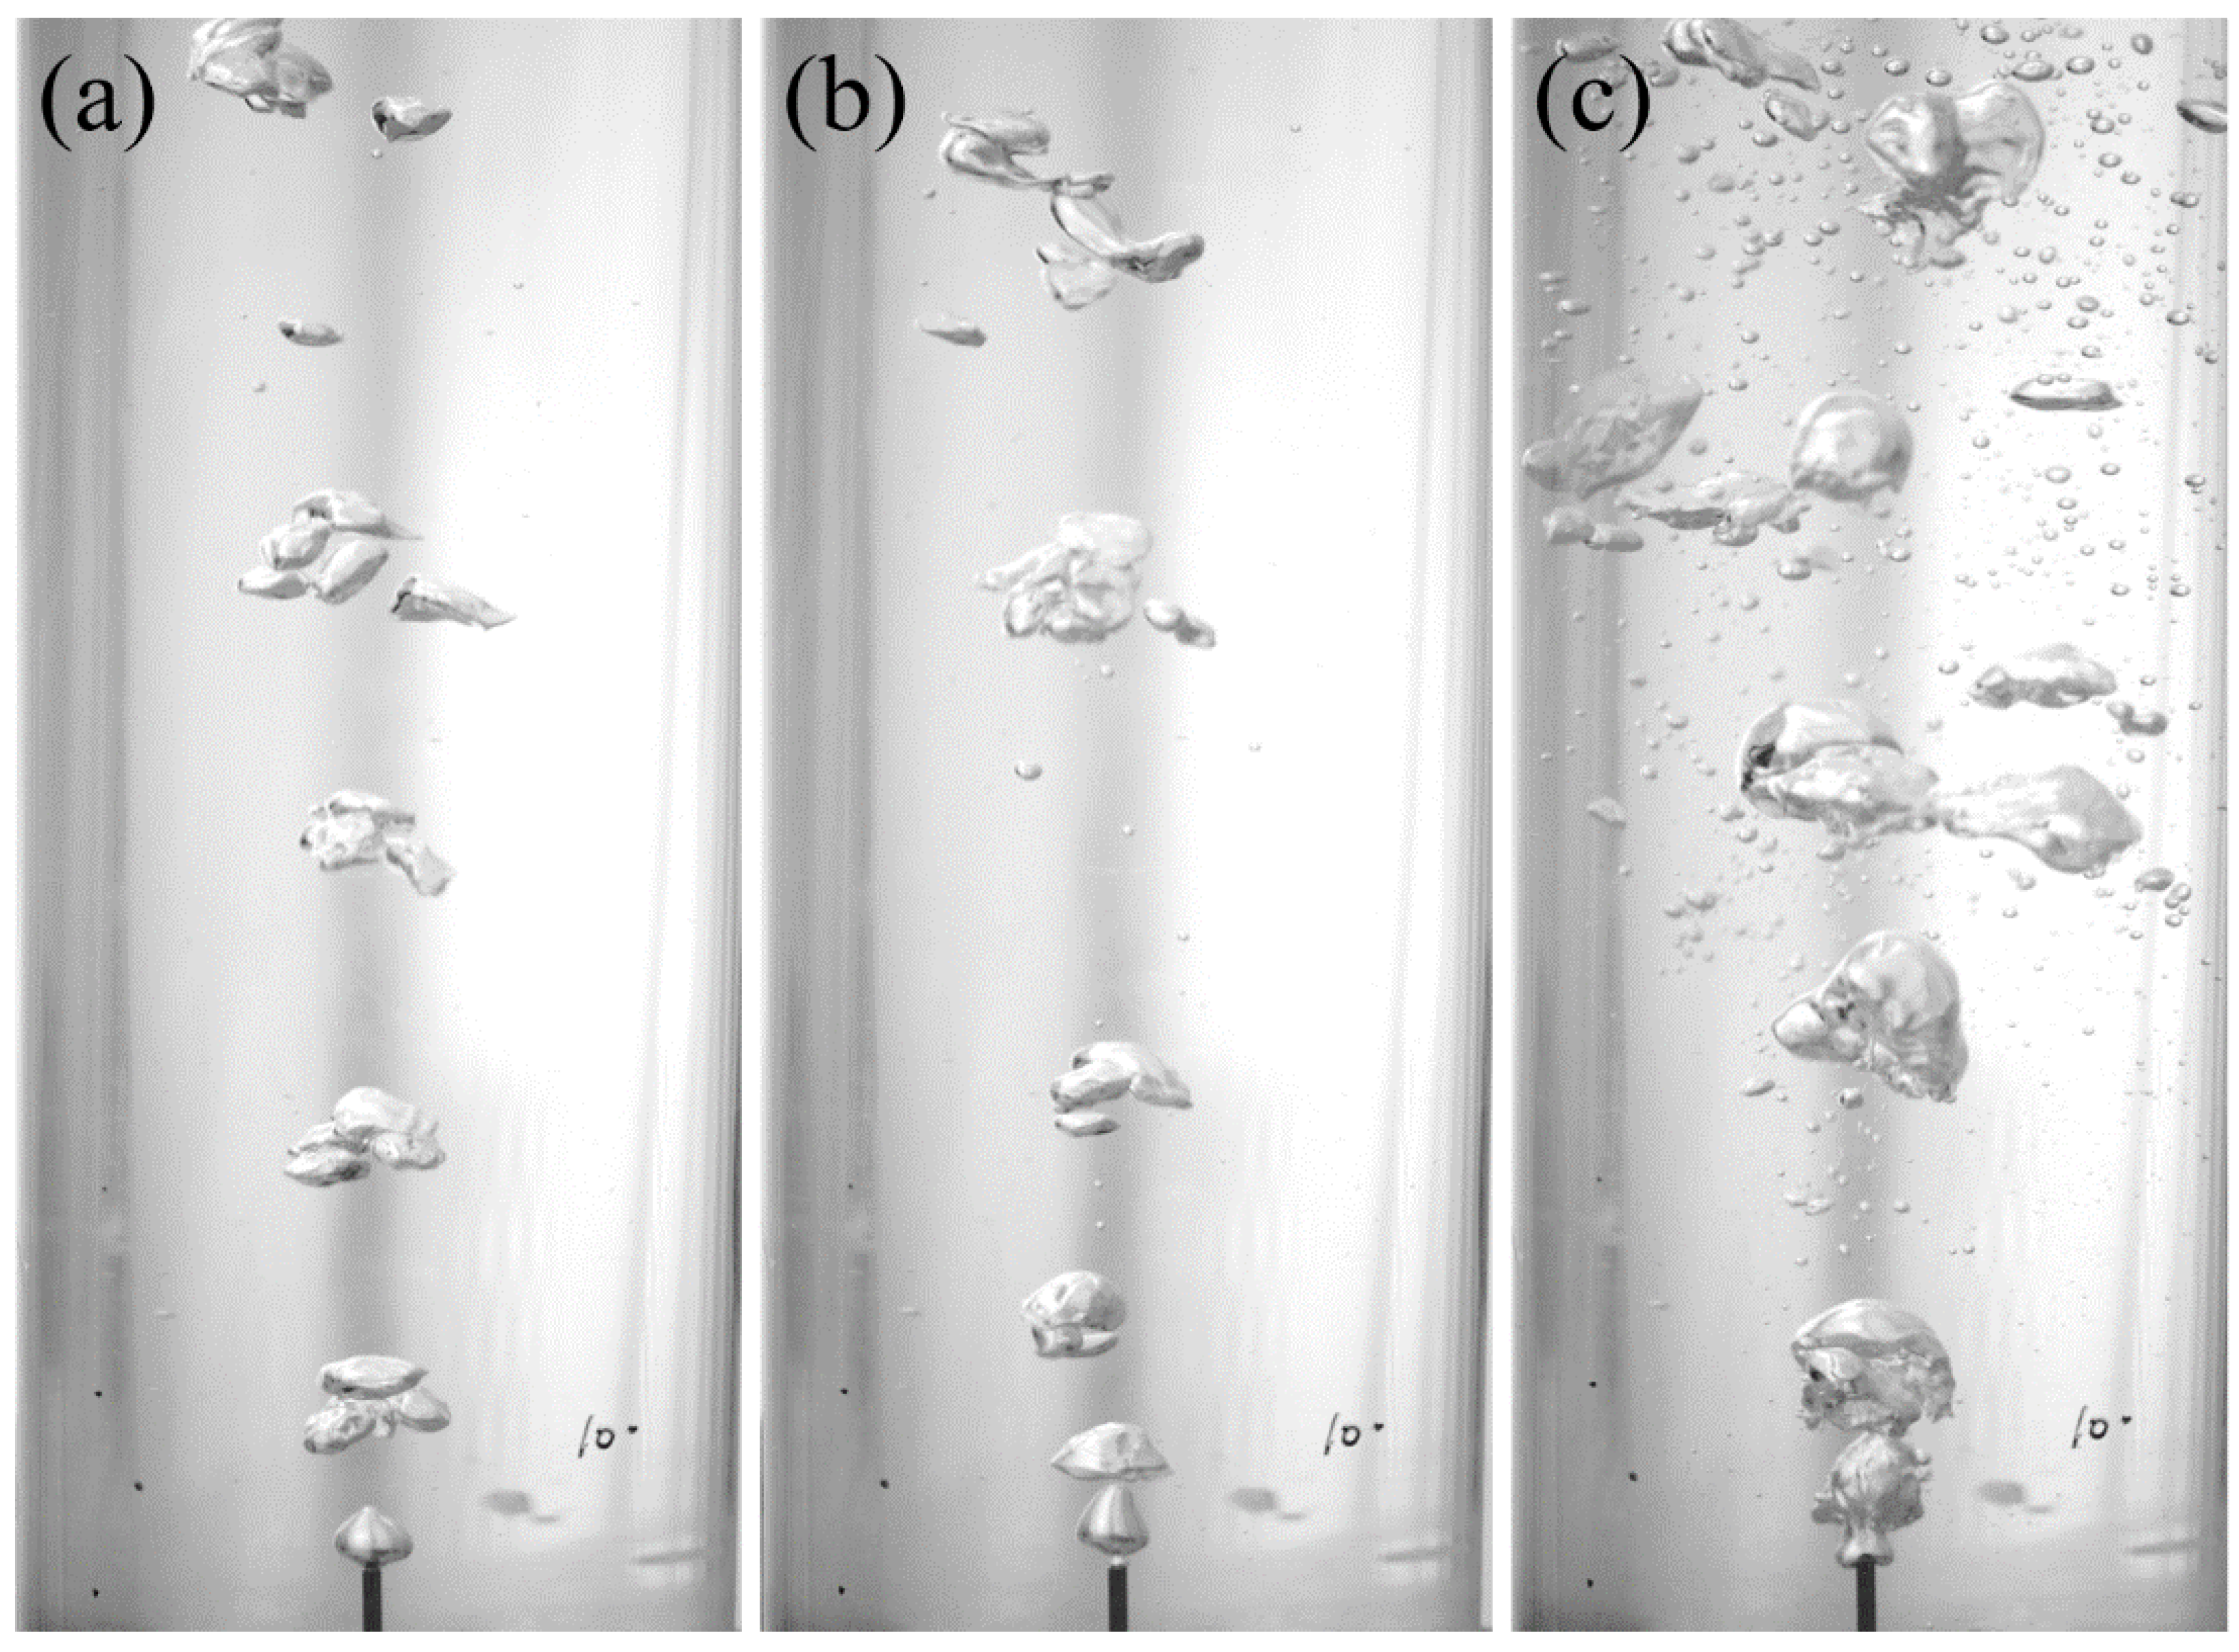
The only significant outlier condition from Figure 8a is the Pm = 40 kPa with Usg = 11.1 mm/s condition. Images at the injection location compare this condition with other low mass flux conditions in Figure 9. Here it is apparent that the initial bubble size distribution is significantly different compared to the other low mass flux conditions. The Reynolds number based on the injector tube diameter for the outlier condition is 4800, which is at the transition between laminar and turbulent flow in a pipe. This makes the airflow at this superficial gas velocity transitional, which transitional flows are extremely sensitive to the operating condition. The data suggests that the lower metering pressure makes the initial bubble formation more sensitive to the inlet airflow condition. The metering pressure could impact bubble detachment from the injection tube since the upstream pressure could modify the bubble shape during expansion (especially with transitional flow). In addition, the initial bubble size distribution as well as breakup and coalescence behaviors are sensitive to the density of the gas [35].
4.2. Injector Tube Angle
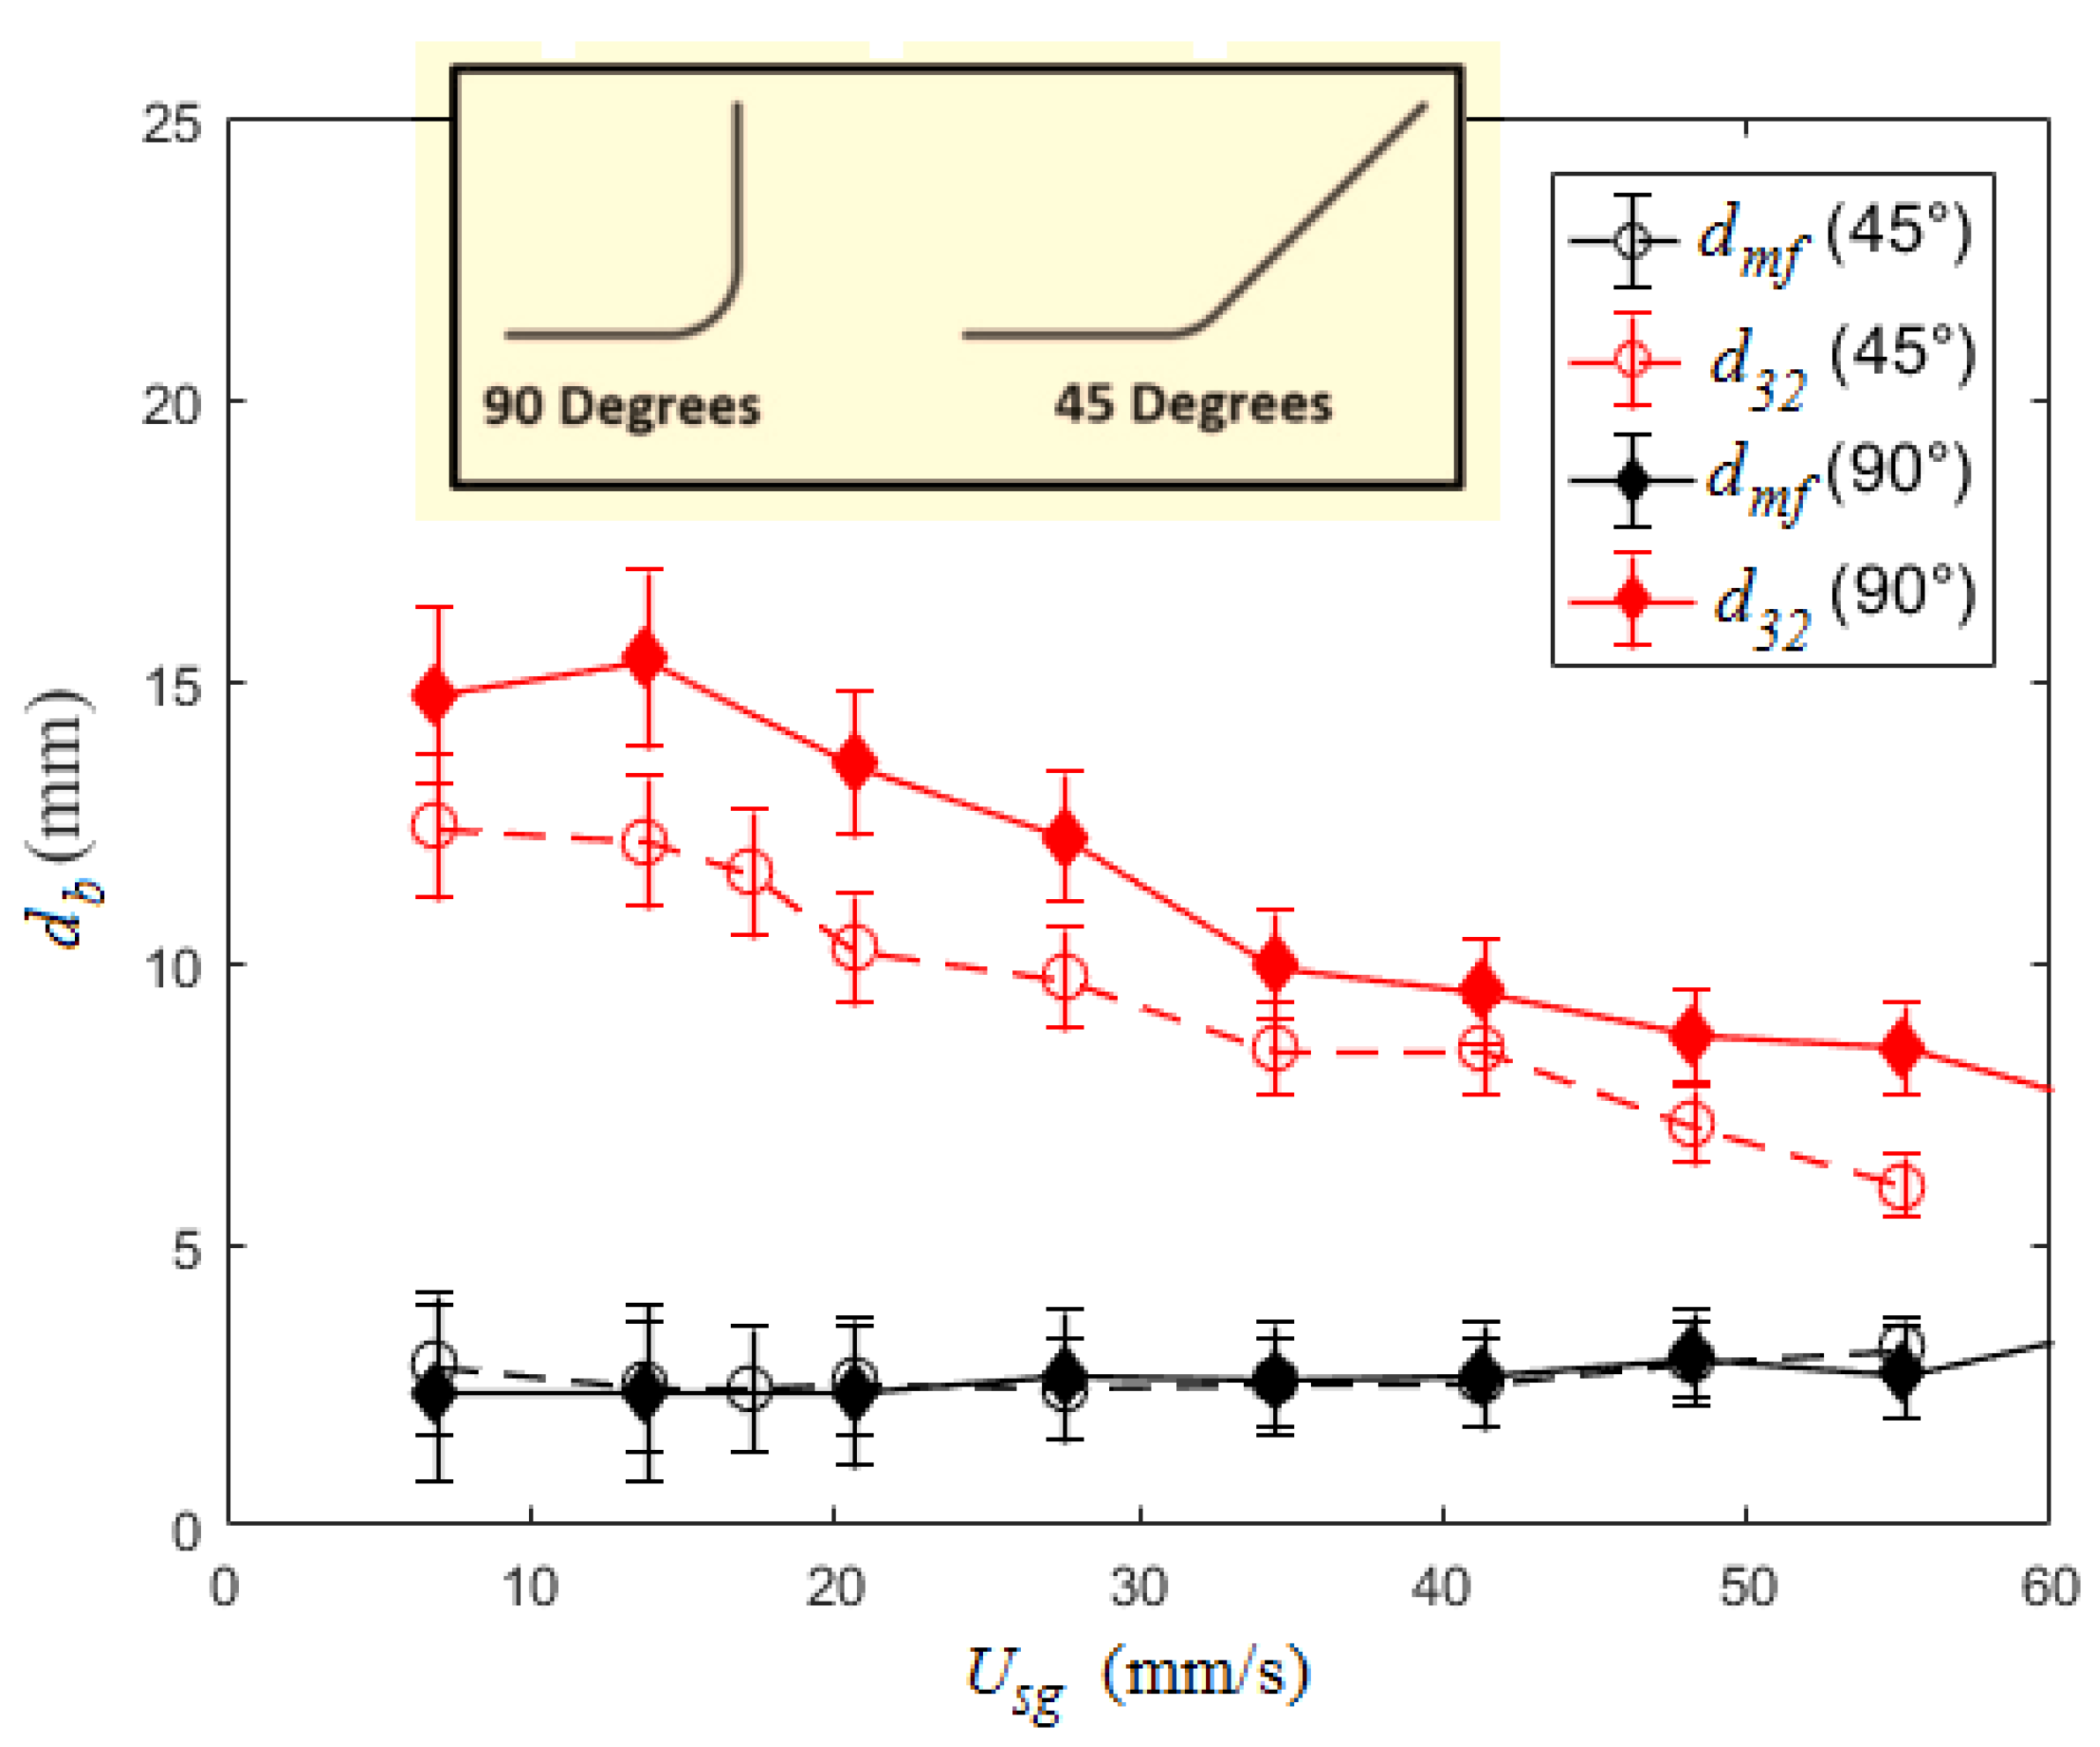
The experimental setup had the injector tube positioned such that it was pointed upward and aligned with gravity. However, the setup made fine adjustments to the injector tube orientation difficult once installed. Thus, testing was performed to assess the sensitivity of the BSD to injector orientation. Here, two different injector orientations were tested, 45° and 90° (vertical, design condition) measured from horizontal with D = 102 mm and dinj = 0.8 mm. Results for both dmf and d32 are provided in Figure 10 at each injector tube angle. These results show that dmf has negligible variation even with the significant misalignment. Conversely, d32 has a measurable decrease at 45° relative to the 90° condition. There are two potential mechanisms responsible for this deviation; (i) the misalignment between gravity (buoyancy force) and the bubble wake where the turbulent production is located and/or (ii) increased influence of wall effects as the initial bubbles were directed into the column wall where the stress distribution will deviate from the core of the column. The wall effects are mostly likely for the current work since the decrease in bubble size suggests a higher shear stress.
4.3. Injection Tube Diameter
The injection tube diameter is one of the key parameters that modifies the BSD, especially in the homogenous regime by effecting the bubble formation process. It is commonly accepted that bubble chord (vertical length from tube to top of bubble) at detachment is on the same order of magnitude as the injector tube diameter [36], which is supported with observations that decreasing orifice diameter decreases the bubble size [37]. This is because at the time of detachment the surface tension forces are balanced with hydrostatic pressure and buoyancy forces, where the outer diameter of the injector sets the contact angle [38]. Thus, the injector size has a significant impact on the initial bubble size, which is known to affect the flow pattern [39] and consequently the flow regime as discussed above.
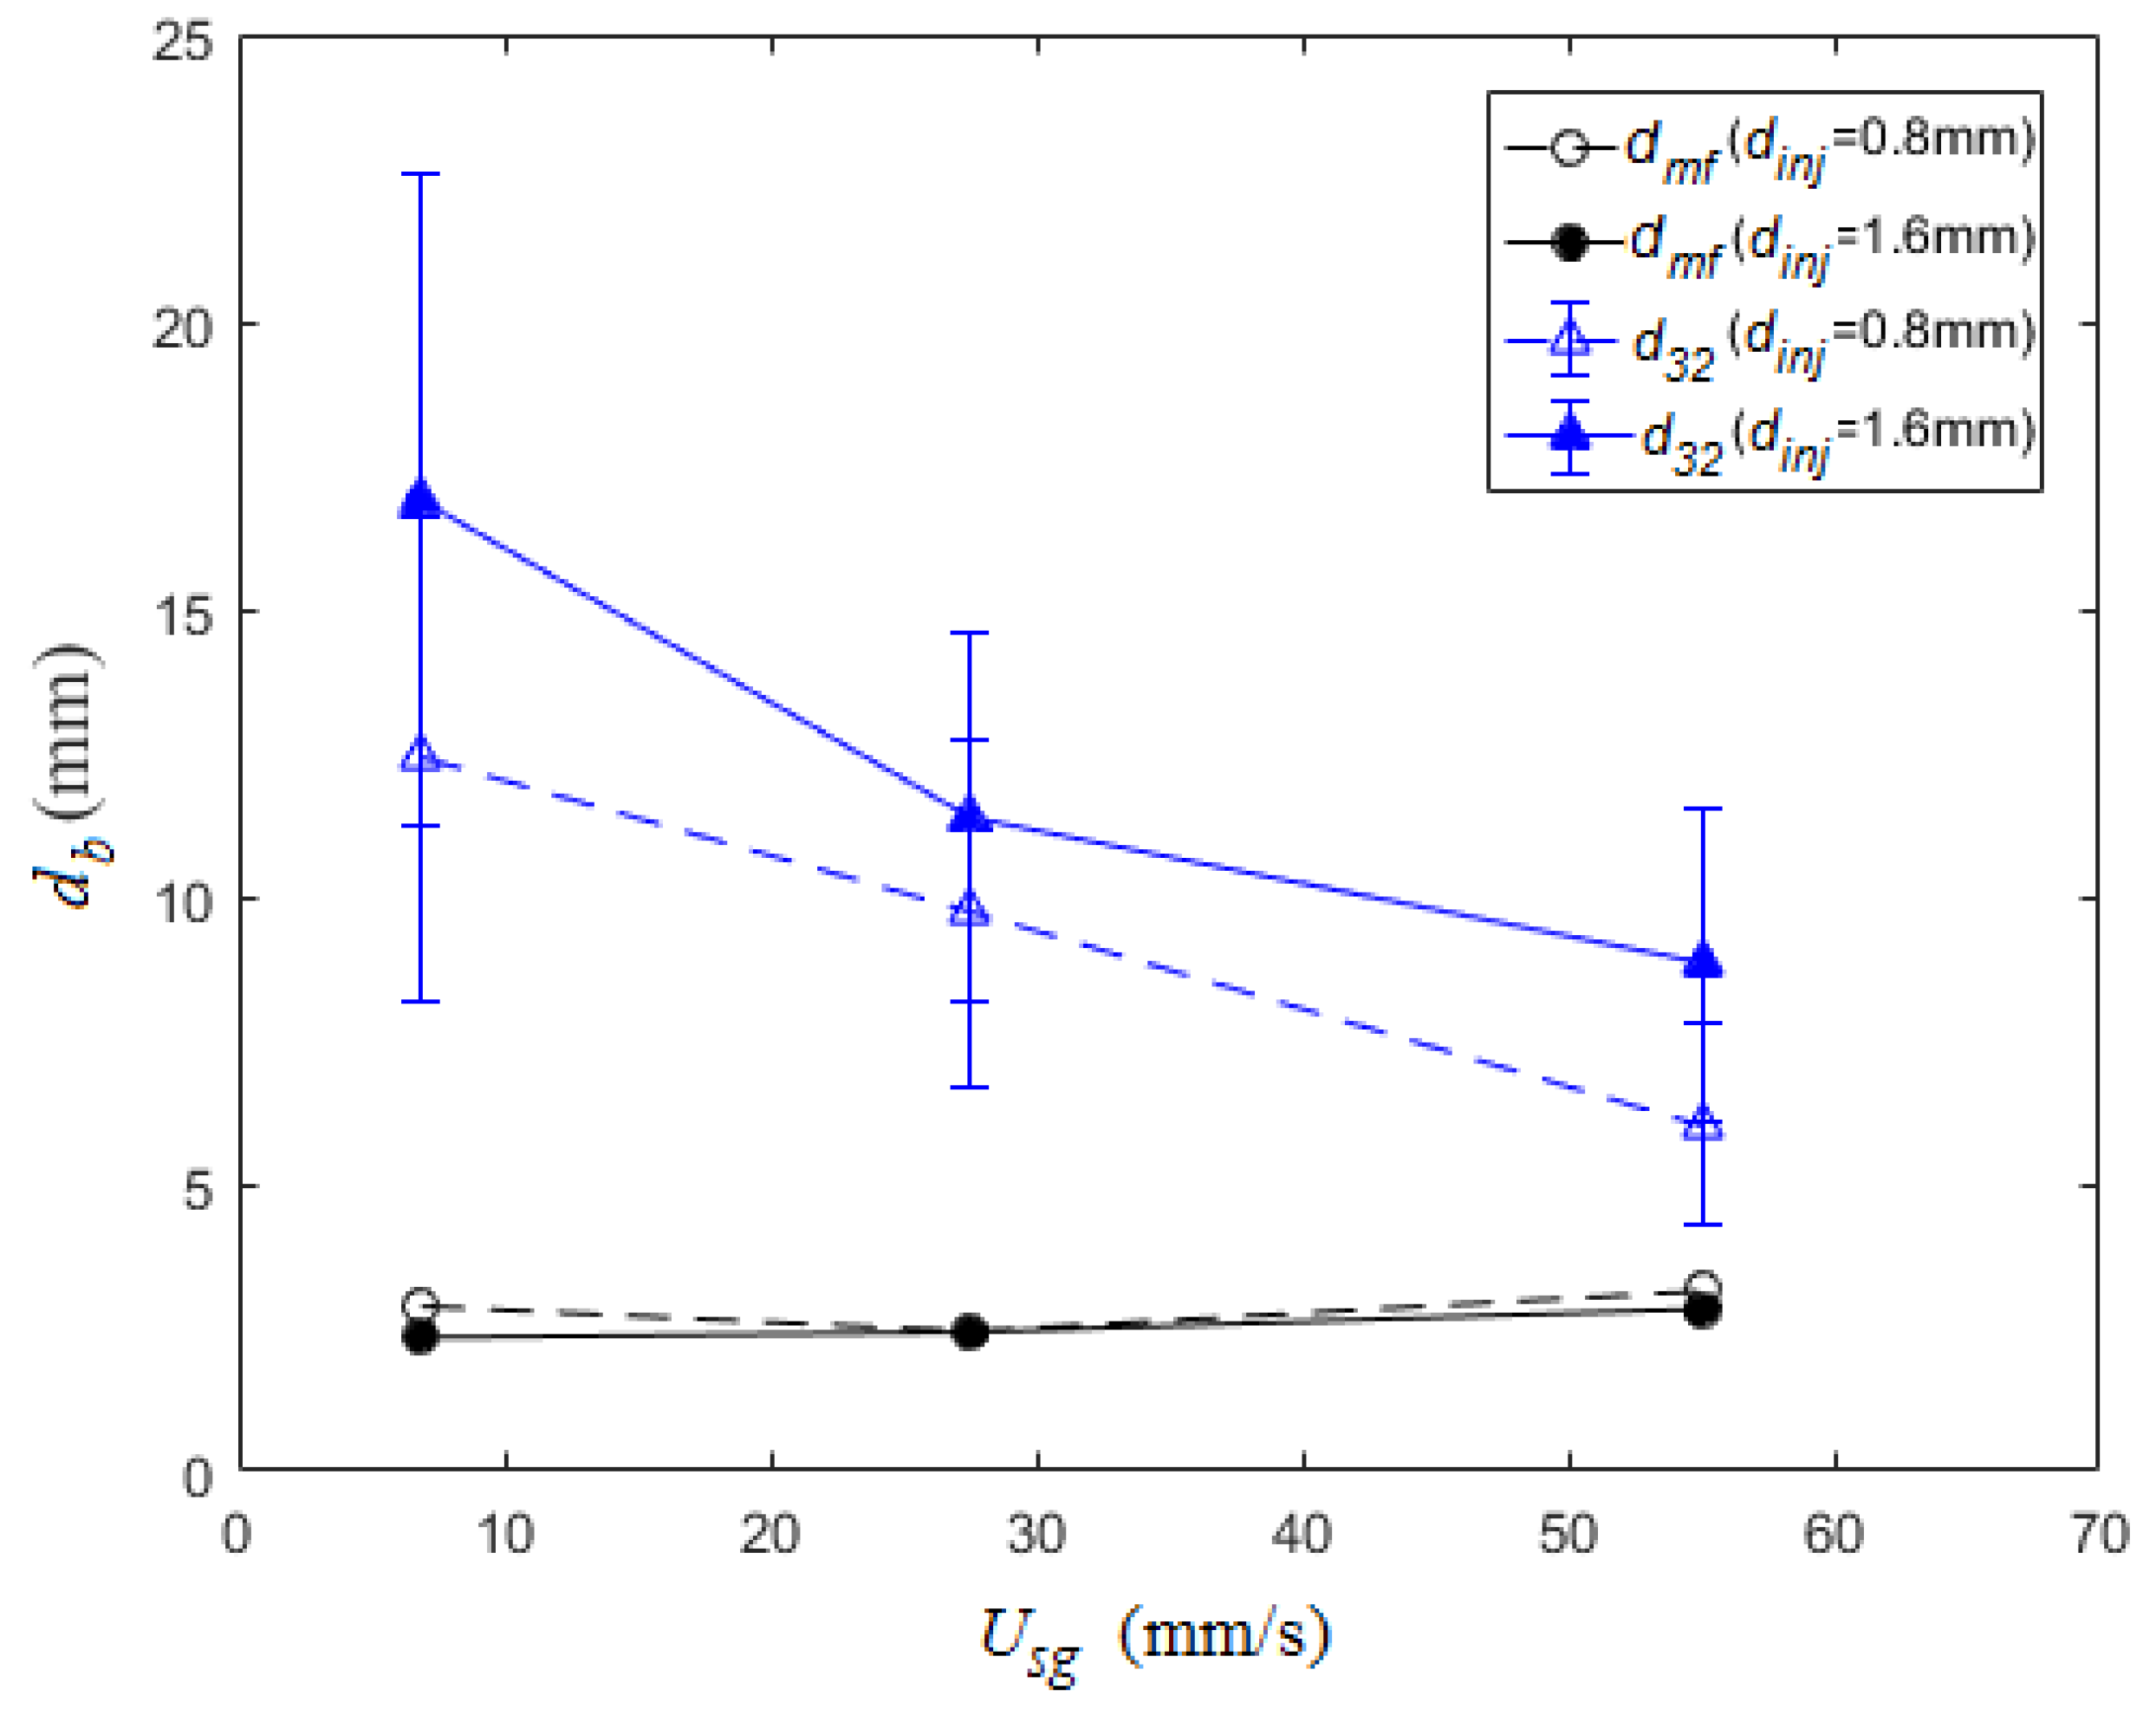
Given the above observations, the current study examined the effect injector diameter has on the BSD with two injector sizes (dinj = 0.8 and 1.6 mm). Based on past observations [40], it is expected that increasing the injector tube diameter will increase the bubble size. Results for both dmf and d32 are provided in Figure 11. The most frequent bubble size shows negligible variation between the injector tube diameters. This is consistent with the turbulent scales within the wakes setting dmf. The Sauter mean diameter trend is nearly identical between tube diameters, but the curve for the smaller tube is shifted downward slightly. This supports previous observations since it exhibits a dependence on the tube diameter, but the tube diameter was not varied by an order of magnitude resulting in the bubble size having a relatively small variation.
It is instructive to examine the PDFs from these conditions to determine how the tube diameter is modifying the BSD.
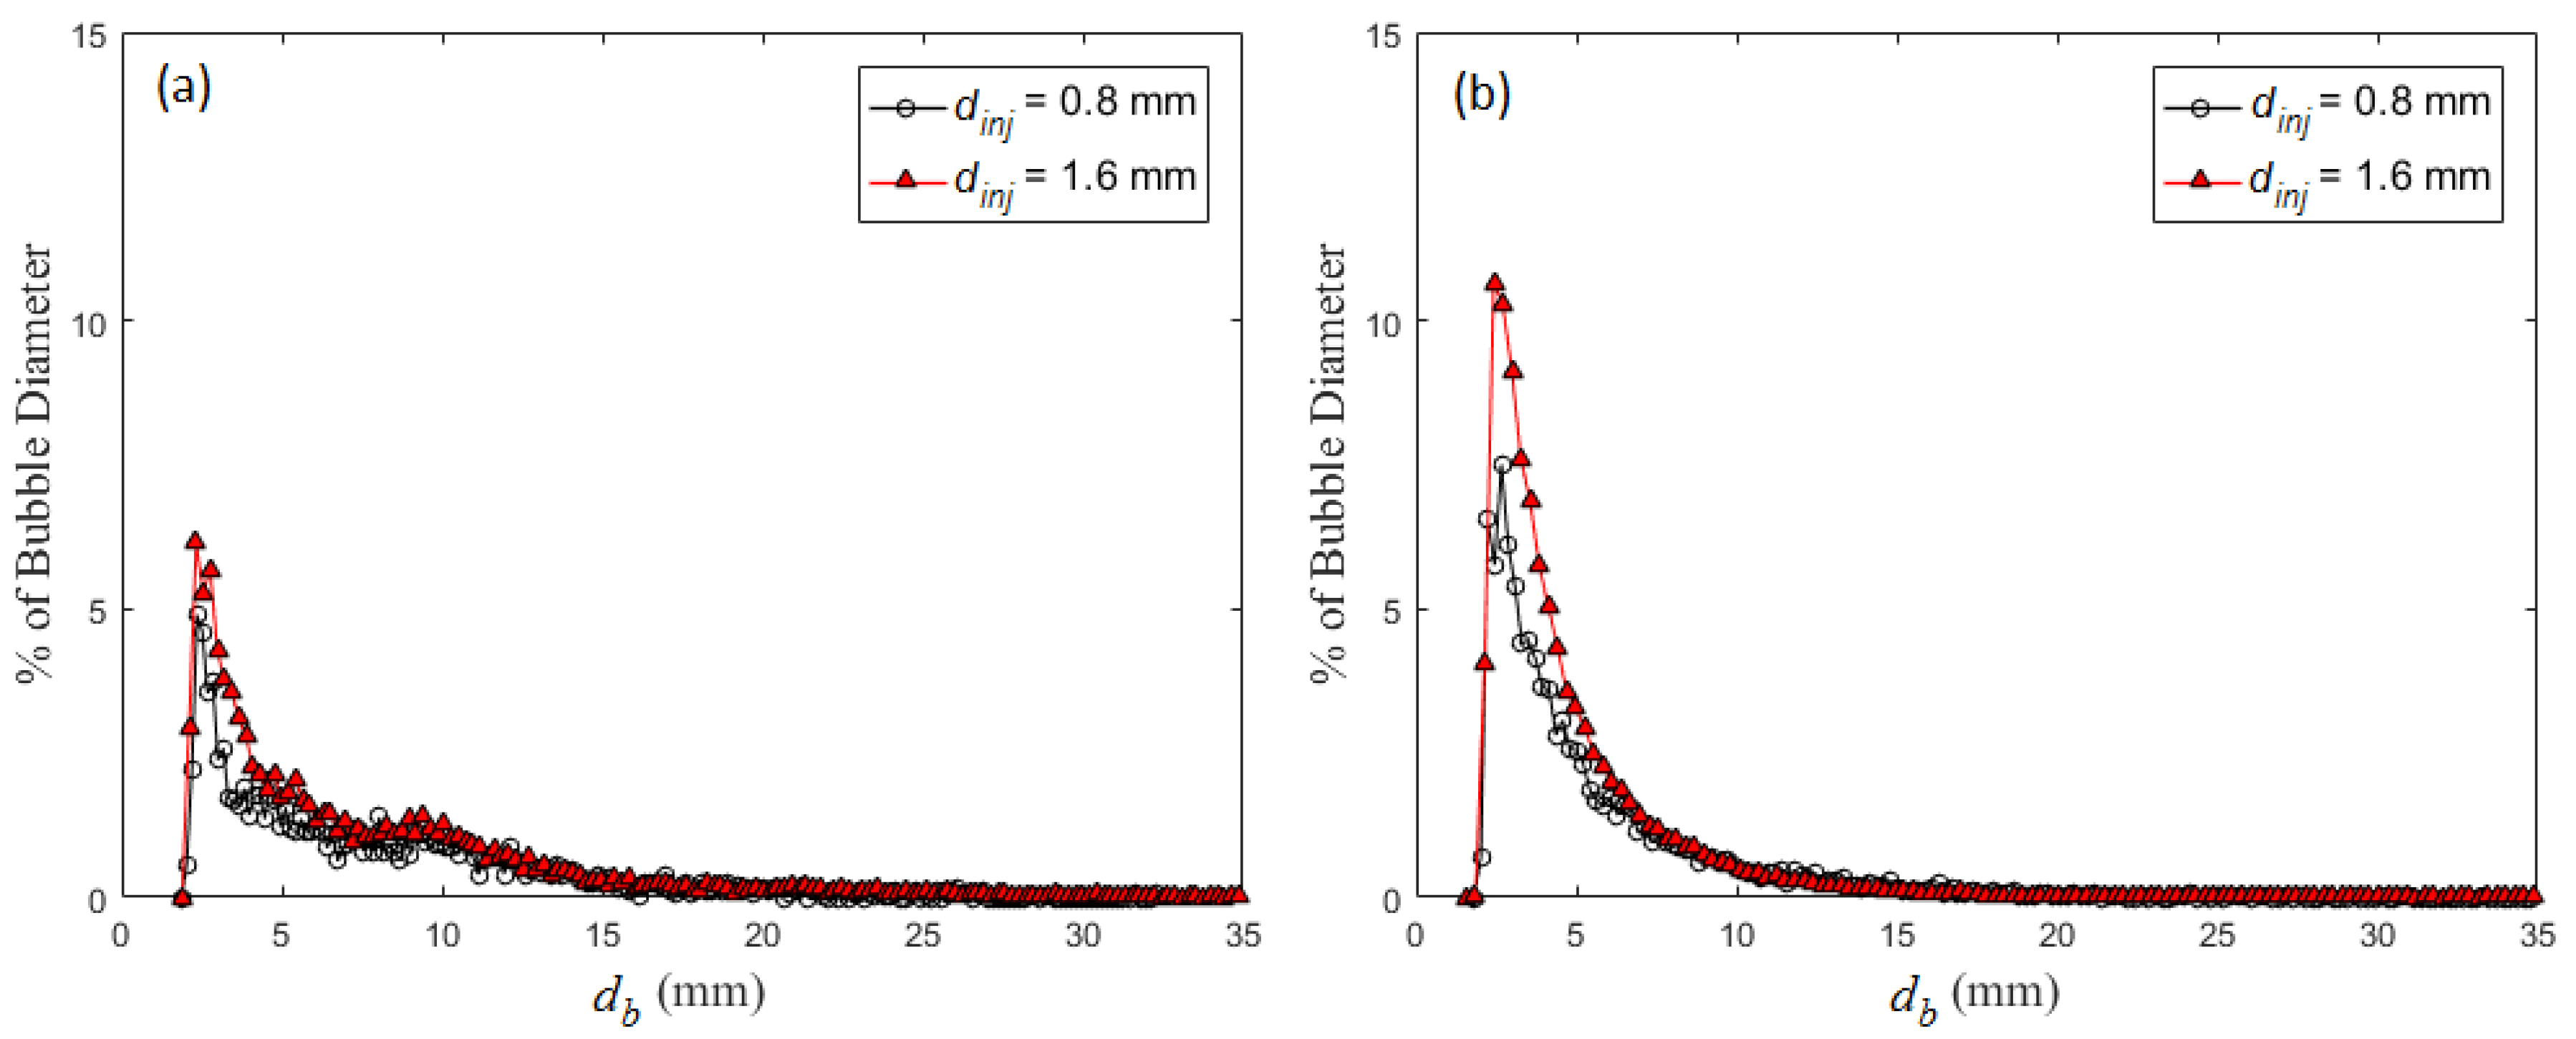
Figure 12 provides the PDF for two of the volumetric flow rates tested with each of the injector tube diameters. These two representative conditions (Usg = 6.9 mm/s produced PDFs with and without an apparent second peak) demonstrate that the PDFs are nearly identical between the two injectors. This explains why dmf is nearly identical between the two injector diameters, but not the shift in d32. The difference between the PDFs is that the larger injector tube diameters produced larger maximum sized bubbles (i.e., larger tube diameter produces a longer tail in the PDFs). Maximum measured bubble sizes (dmax) for Usg = 6.9, 27.6 and 55.1 mm/s are provided in Table 1. This shows that the smaller bubble tube diameter produces significantly smaller dmax (up to 40% smaller than the large tube). This supports the comments that both length scales are important since while dmf is insensitive to these changes, d32 is modified because of these larger bubbles. While d32 is sensitive to these variations, higher order statistics (particularly skewness, a measure the asymmetry of a distribution) should be more sensitive to these variations.
4.4. Column Diameter
Wall effects play a significant role when the column diameter is below 0.15 m [40]. This explains the contradictory trends between bubble size and column diameter in the literature [41,42,43]. These contradictory observations are the product of operation within different flow regimes or transitioning between regimes. In particular, there are a number of studies [44,45,46] that indicate column diameter has an impact on the transition superficial gas velocity, but currently there is no comprehensive understanding of the influence of column diameter. The current study does not aim to assess the overall impact of column diameter, but does examine variation of the BSD with two different column diameters (D = 63 and 102 mm). Results in Figure 13 show no significant deviation for either bubble size measurements between the two column diameters.
5. Higher Order Statistics
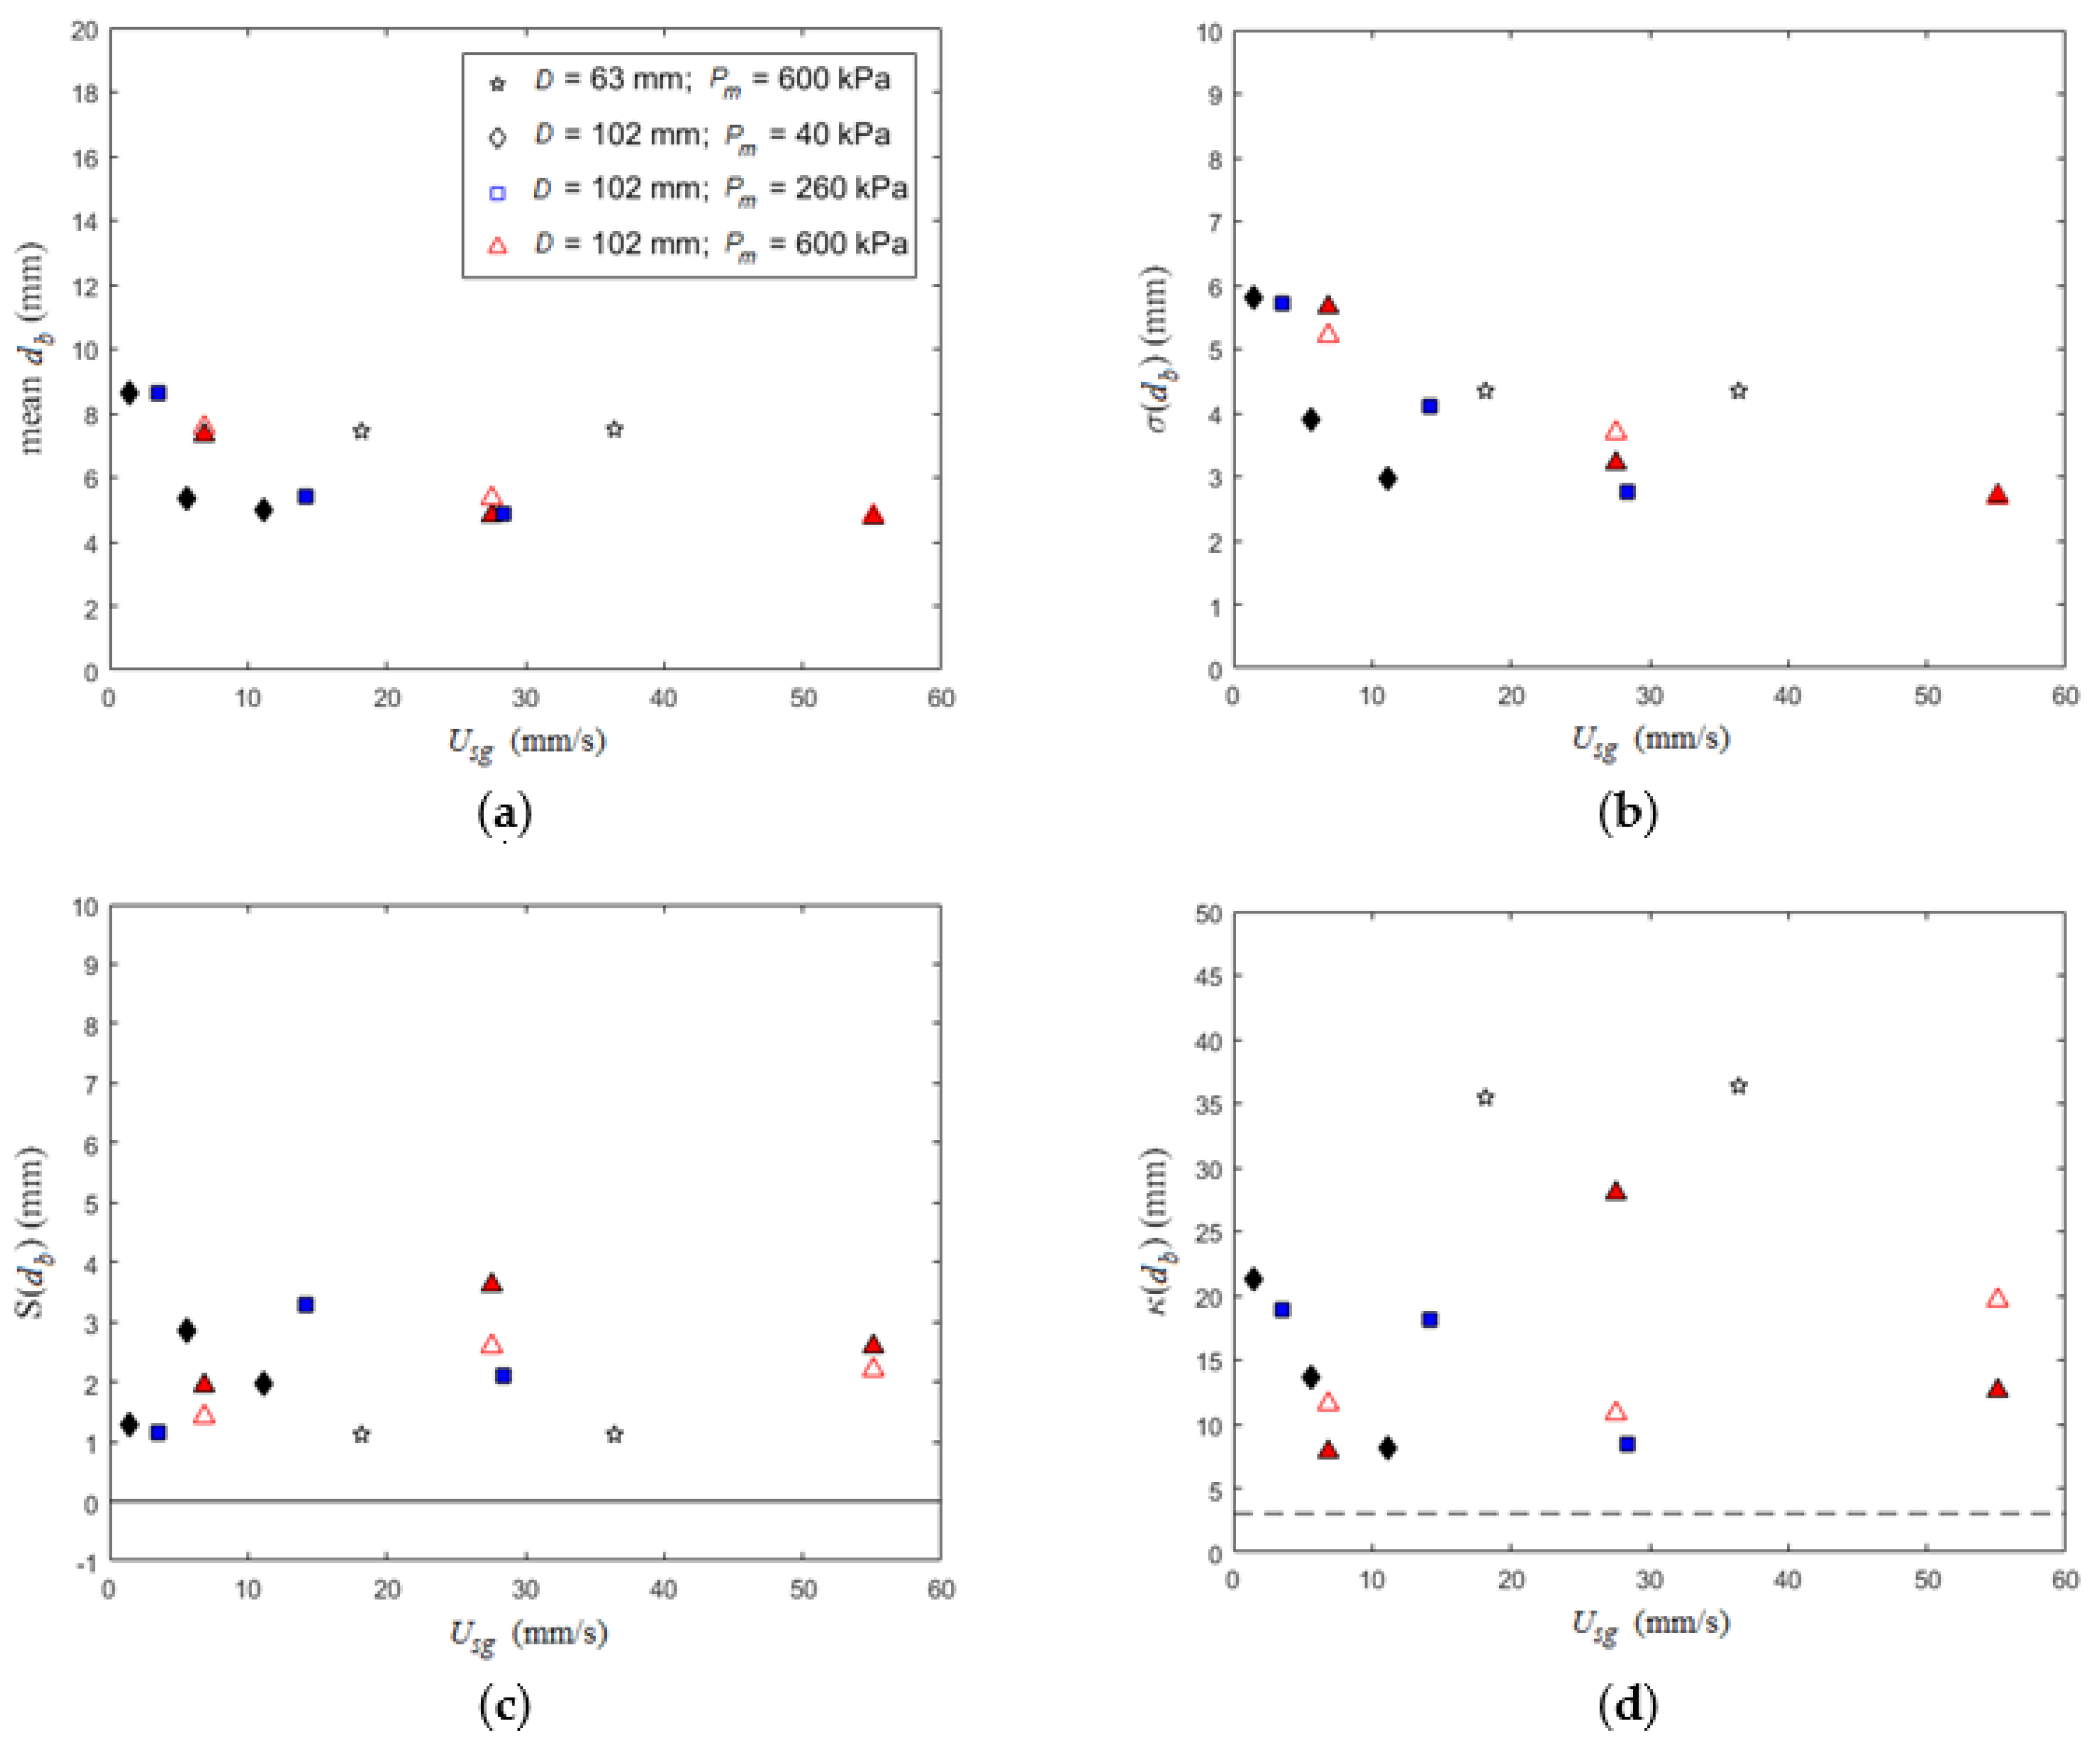
While the parameter space of the current study is insufficient to provide a detailed analysis of higher order statistics (i.e., standard deviation σ, skewness S and kurtosis κ), the available results are provided in Figure 14 given the dearth of available data in the literature. Based on the previous observations/discussion, there are a few expected trends in the higher order statistics. In particular, increasing the injector diameter is expected to increase the skewness given that larger injection tubes generate larger maximum bubbles, which will result in a longer tail in the PDF. This is observed in Figure 14c, noting that the open symbols are dinj = 0.8 mm and the closed symbols are dinj = 1.6 mm. Thus focusing on the large column (D = 102 mm) and Pm = 600 kPa, the smaller injector tube diameter results in a smaller skewness at a given Usg. The kurtosis (a measure of “tailedness” of a distribution) is provided in Figure 14d, which for all conditions the kurtosis is greater than that of a normal distribution (κ = 3). The relatively high kurtosis values indicate the presence of infrequent excessive deviations from the mean. Furthermore, use of the skewness and kurtosis can provide a quantitative measure of the bimodality of the distribution (e.g., Sarle’s bimodality coefficient). There is a peak in this bimodality coefficient at a Reynolds number based on the dmf at ~1000. This supports the previous observations that the bimodality could be the product of the transition from the unsteady flow-field between 500 < Re < 1000 and the turbulent far-wake with Strouhal shedding above 1000. Thus, the higher order statistics are a potential means for identifying regime transitions within the column.
6. Conclusions
The current study analyzed the BSD within a bubble column using high-speed imaging of a large population of bubbles. The gas phase (air) was injected into the liquid phase (water) near the base of the column via a single injection tube. The column diameter (D = 63 or 102 mm), injection tube diameter (dinj = 0.8 or 1.6 mm) and the superficial gas flux (1.4 < Usg < 55 mm/s) were varied during testing. The range of superficial gas fluxes was controlled via a combination of pressure and volumetric flux measured/controlled upstream of the injection tube. However, the temperature both at the metering location as well as within the column were held nearly constant throughout testing. The large sampling of bubbles were used to generate PDFs for each test condition. The maximum peak in the PDFs was used to identify a new bubble length scale, which was termed the most frequent bubble size (dmf). This bubble length scale was compared with the traditional Sauter mean diameter (d32), which is a weighted average. Both were applied to a parametric study to determine the information that each length scale provides. In general, Sauter mean diameter is more sensitive to the largest bubbles within the flow while dmf is related to the turbulent structures created in the bubble wakes. Consequently, the difference between d32 and dmf is a nominal range of bubble sizes expected within a given flow.
The parametric study examined the dependence of each of the bubble length scales on the gas injection rate, injector tube diameter, injection tube angle and column diameter. These individual studies are not meant to be an exhaustive assessment of these dependences, but rather a case study to assess how these length scales can be utilized to characterize multiphase flow behavior. The Sauter mean diameter was sensitive to the tube angle and injection tube diameter, but was relatively insensitive to the gas injection rate (except when the flow within the injection tube was transitional) and column diameter. Sauter mean diameter did exhibit a sensitivity to tube angle with misalignment between the tube and gravity resulting in a ~25% decrease in bubble size. The two most likely mechanisms for the sensitivity are the buoyancy force not aligning with the initial bubble wakes (i.e., turbulent regions) and the gas being directed towards the walls where the shear stress distribution is higher. Since the Sauter mean diameter decreased, the increase in shear stress at the wall is the likely cause for the sensitivity since the misalignment would decrease the turbulence level the bubbles experience at low void fractions. Conversely, doubling the injector tube diameter produced a ~33% increase in the Sauter mean diameter. This dependence is expected based on previous work that noted that the detachment bubble size is of the same order of magnitude as the injector tube, and the detachment bubble size is directly related to the largest bubbles. Since d32 is biased towards the largest bubbles within the flow, it is expected that there would be a dependence of d32 on injector tube diameter.
Conversely, the most frequent bubble size was relatively insensitive to gas injection rate, injection tube diameter, tube angle and column diameter. The insensitivity to most parameters is due to the minimum bubble diameter based Reynolds number tested being greater than 500 and most bubbles greater than 1000. In this range, coherent structures shed from the bubbles produce turbulent far-wakes. It is known that turbulent flow-fields produce relatively uniform bubble distributions, which is consistent with the observations of dmf.
Higher order statistics (standard deviation, skewness and kurtosis) were also reported for the test conditions. While the range of test conditions limited the insights from these results, they were reported due to dearth of available data in the literature. The limited data were consistent with some expected behavior given conclusions drawn from the parametric study assessing the behavior of the Sauter mean diameter and the most frequent bubble diameter. These conclusions are (i) skewness increases with increasing injection tube diameter due to the longer tail in the PDF, (ii) high kurtosis values indicate the presence of infrequent excessive deviations from the mean and (iii) higher order statistics could be used as an indicator for a regime change since a bimodal coefficient peaked at Re ~ 1000. The overall evaluation is that the combination of Sauter mean diameter and most frequent bubble diameter provides a more comprehensive assessment of the flow behavior.
Acknowledgments
The authors would like to thank Afshin Ghajar for the use of his vibrating bubble column facility as well as Adam Still’s assistance with familiarizing our team with the use of the facility. We would also like to thank Trevor Wilson, Bret Valenzuela and Tyler Hinds for their assistance counting bubbles and execution of the experiment as well as Amir Erfani for his assistance with surface tension measurement. This research did not receive any specific grant from funding agencies in the public, commercial, or not-for-profit sectors.
Author Contributions
Shahrouz Mohagheghian and Brian R. Elbing conceived and designed the experiments; Shahrouz Mohagheghian performed the experiments; Shahrouz Mohagheghian and Brian R. Elbing analyzed the data; Shahrouz Mohagheghian and Brian R. Elbing wrote the paper.
Conflicts of Interest
The authors declare no conflict of interest.
References
- Kantarci, N.; Borak, F.; Ulgen, K.O. Bubble column reactors. Process Biochem. 2005, 40, 2263–2283. [Google Scholar] [CrossRef]
- Krishna, R.; Ellenberger, J.; Urseanu, M.I.; Keil, F.J. Utilisation of bubble resonance phenomena to improve gas-liquid contact. Naturwissenschaften 2000, 87, 455–459. [Google Scholar] [CrossRef] [PubMed]
- Oliveira, M.S.N.; Ni, X. Gas hold-up and bubble diameters in a gassed oscillatory baffled column. Chem. Eng. Sci. 2001, 56, 6143–6148. [Google Scholar] [CrossRef]
- Waghmare, Y.G.; Rice, R.G.; Knopf, F.C. Mass transfer in a viscous bubble column with forced oscillations. Ind. Eng. Chem. Res. 2008, 47, 5386–5394. [Google Scholar] [CrossRef]
- Hur, Y.G.; Yang, J.H.; Jung, H.; Park, S.B. Origin of regime transition to turbulent flow in bubble column: Orifice- and column-induced transitions. Int. J. Multiph. Flow 2013, 50, 89–97. [Google Scholar] [CrossRef]
- Clark, N.N.; Turton, R. Chord length distributions related to bubble size distributions in multiphase flows. Int. J. Multiph. Flow 1988, 14, 413–424. [Google Scholar] [CrossRef]
- Wu, C.; Suddard, K.; Al-Dahhan, M.H. Bubble dynamics investigation in a slurry bubble column. AIChE J. 2008, 54, 1203–1212. [Google Scholar] [CrossRef]
- Xue, J.; Al-Dahhan, M.; Dudukovic, M.P.; Mudde, R.F. Four-point optical probe for measurement of bubble dynamics: Validation of the technique. Flow Meas. Instrum. 2008, 19, 293–300. [Google Scholar] [CrossRef]
- Xue, J.; Al-Dahhan, M.; Dudukovic, M.P.; Mudde, R.F. Bubble velocity, size, and interfacial area measurements in a bubble column by four-point optical probe. AIChE J. 2008, 54, 350–363. [Google Scholar] [CrossRef]
- Van Der Welle, R. Void fraction, bubble velocity and bubble size in two-phase flow. Int. J. Multiph. Flow 1985, 11, 317–345. [Google Scholar] [CrossRef]
- George, D.L.; Torczynski, J.R.; Shollenberger, K.A.; O’Hern, T.J.; Ceccio, S.L. Validation of electrical-impedance tomography for measurements of material distribution in two-phase flows. Int. J. Multiph. Flow 2000, 26, 549–581. [Google Scholar] [CrossRef]
- Mäkiharju, S.; Elbing, B.R.; Wiggins, A.; Schinasi, S.; Vanden-Broeck, J.M.; Perlin, M.; Dowling, D.R.; Ceccio, S.L. On the scaling of air entrainment from a ventilated partial cavity. J. Fluid Mech. 2013, 732, 47–76. [Google Scholar] [CrossRef]
- Manera, A.; Prasser, H.M.; Lucas, D.; van der Hagen, T.H.J.J. Three-dimensional flow pattern visualization and bubble size distributions in stationary and transient upward flashing flow. Int. J. Multiph. Flow 2006, 32, 996–1016. [Google Scholar] [CrossRef]
- Manera, A.; Prasser, H.M.; Lucas, D. Experimental investigation on bubble turbulent diffusion in a vertical large-diameter pipe by wire-mesh sensors and correlation techniques. Nuclear Technol. 2007, 158, 275–290. [Google Scholar] [CrossRef]
- Omebere-Iyari, N.K.; Azzopardi, B.J.; Lucas, D.; Beyer, M.; Prasser, H.-M. The characteristics of gas/liquid flow in large risers at high pressures. Int. J. Multiph. Flow 2008, 34, 461–476. [Google Scholar] [CrossRef]
- Youssef, A.A.; Al-Dahhan, M.H. Impact of internals on the gas holdup and bubble properties of a bubble column. Ind. Eng. Chem. Res. 2009, 48, 8007–8013. [Google Scholar] [CrossRef]
- Still, A.L. Multiphase Phenomena in a Vibrating Bubble Column Reactor. Master’s Thesis, Mechanical & Aerospace Engineering, Oklahoma State University, Stillwater, OK, USA, 2012. [Google Scholar]
- Still, A.L.; Ghajar, A.J.; O’Hern, T.J. Effect of amplitude on mass transport, void fraction and bubble size in a vertically vibrating liquid-gas bubble column reactor. In Proceedings of the ASME Fluids Engineering Summer Meeting-FEDSM2013-16116, Incline Village, NV, USA, 7–11 July 2013. [Google Scholar]
- Mohagheghian, S.; Elbing, B.R. Study of bubble size and velocity in a vibrating bubble column. In Proceedings of the ASME 2016 14th International Conference on Nanochannels, Microchannels, and Minichannels collocated with the ASME 2016 Heat Transfer Summer Conference and the ASME 2016 Fluids Engineering Division Summer Meeting, FEDSM2016-1056, V01BT33A012, Washington, DC, USA, 10–14 July 2016. [Google Scholar]
- Besagni, G.; Pasquali, A.D.; Gallazzini, L.; Gottardi, E.; Colombo, L.P.M.; Inzoli, F. The effect of aspect ratio in counter-current gas-liquid bubble columns: Experimental results and gas holdup correlations. Int. J. Multiph. Flow 2017, 94, 53–78. [Google Scholar] [CrossRef]
- Luo, X.; Lee, D.J.; Lau, R.; Yang, G.; Fan, L.-S. Maximum stable bubble size and gas holdup in high-pressure slurry bubble columns. AIChE J. 1999, 45, 665–680. [Google Scholar] [CrossRef]
- Akita, K.; Yoshida, F. Bubble size, interfacial area, and liquid-phase mass-transfer coefficient in bubble columns. Ind. Eng. Chem. Process Des. Dev. 1974, 13, 84–91. [Google Scholar] [CrossRef]
- Besagni, G.; Inzoli, F.; De Guido, G.; Pellegrini, L.A. The dual effect of viscosity on bubble column hydrodynamics. Chem. Eng. Sci. 2017, 158, 509–538. [Google Scholar] [CrossRef]
- Li, H.; Prakash, A. Heat transfer and hydrodynamics in a three-phase slurry bubble column. Ind. Eng. Chem. Res. 1997, 36, 4688–4694. [Google Scholar] [CrossRef]
- Schafer, R.; Merten, C.; Eigenberger, G. Bubble size distributions in a bubble column reactor under industrial conditions. Exp. Therm. Fluid Sci. 2002, 26, 595–604. [Google Scholar] [CrossRef]
- Ohnuki, A.; Akimoto, H. An experimental study on developing air-water two-phase flow along a large vertical pipe: Effect of air injection method. Int. J. Multiph. Flow 1996, 22, 1143–1154. [Google Scholar] [CrossRef]
- Gaddis, E.S.; Vogelpohl, A. Bubble formation in quiescent liquids under constant flow conditions. Chem. Eng. Sci. 1986, 41, 97–105. [Google Scholar] [CrossRef]
- Besagni, G.; Inzoli, F. Novel gas holdup and regime transition correlation for two-phase bubble columns. In Journal of Physics: Conference Series; IOP Publishing: Bristol, UK, 2017. [Google Scholar]
- Abràmoff, M.D.; Magalhães, P.J.; Ram, S.J. Image processing with ImageJ. Biophotonics Int. 2004, 11, 36–42. [Google Scholar]
- Schneider, C.A.; Rasband, W.S.; Eliceiri, K.W. NIH Image to ImageJ: 25 years of image analysis. Nat. Methods 2012, 9, 671–675. [Google Scholar] [CrossRef] [PubMed]
- Rasband, W.S. ImageJ. U.S. National Institutes of Health, Bethesda, MD, USA, 1997–2016. Available online: http://imagej.nih.gov/ij (accessed on 16 April 2013).
- Fukuma, M.; Muroyama, K.; Yasunishi, A. Properties of bubble swarm in a slurry bubble column. J. Chem. Eng. Jpn. 1987, 20, 28–33. [Google Scholar] [CrossRef]
- Saxena, S.C.; Rao, N.S.; Saxena, A.C. Heat-transfer and gas-holdup studies in a bubble column: Air-water-glass bead system. Chem. Eng. Commun. 1990, 96, 31–55. [Google Scholar] [CrossRef]
- Brennen, C.E. Fundamental of Multiphase Flow, 1st ed.; Cambridge University Press: New York, NY, USA, 2005; pp. 60–66. ISBN 0521139988. [Google Scholar]
- Hecht, K.; Bey, O.; Ettmüller, J.; Graefen, P.; Friehmelt, R.; Nilles, M. Effect of gas density on gas holdup in bubble columns. Chem. Ing. Tech. 2015, 87, 762–772. [Google Scholar] [CrossRef]
- Kulkarni, A.A.; Joshi, J.B. Bubble formation and bubble rise velocity in gas-liquid systems: A review. Ind. Eng. Chem. Res. 2005, 44, 5873–5931. [Google Scholar] [CrossRef]
- Basha, O.M.; Sehabiague, L.; Abdel-Wahab, A.; Morsi, B.I. Fischer-Tropsch synthesis in slurry bubble column reactors: Experimental investigations and modeling—A review. Int. J. Chem. React. Eng. 2015, 13, 201–288. [Google Scholar] [CrossRef]
- Liow, J.-L. Quasi-equilibrium bubble formation during top-submerged gas injection. Chem. Eng. Sci. 2000, 55, 4515–4524. [Google Scholar] [CrossRef]
- Cheng, H.; Hills, J.H.; Azzopardi, B.J. Effects of initial bubble size on flow pattern transition in a 28.9 mm diameter column. Int. J. Multiph. Flow 2002, 28, 1047–1062. [Google Scholar] [CrossRef]
- Wilkinson, P.M.; Spek, A.P.; van Dierendonck, L.L. Design parameters estimation for scale-up of high-pressure bubble columns. AIChE J. 1992, 38, 544–554. [Google Scholar] [CrossRef]
- Daly, J.G.; Patel, S.A.; Bukur, D.B. Measurement of gas holdups and Sauter mean bubble diameters in bubble column reactors by dynamic gas disengagement method. Chem. Eng. Sci. 1992, 47, 3647–3654. [Google Scholar] [CrossRef]
- Koide, K.; Morooka, S.; Ueyama, K.; Matsuura, A.; Yamashita, F.; Iwamoto, S.; Kato, Y.; Inoue, H.; Shigeta, M.; Suzuki, S.; et al. Behavior of bubbles in large-scale bubble column. J. Chem. Eng. Jpn. 1979, 12, 98–104. [Google Scholar] [CrossRef]
- Sasaki, S.; Uchida, K.; Hayashi, K.; Tomiyama, A. Effects of column diameter and liquid height on gas holdup in air-water bubble columns. Exp. Therm. Fluid Sci. 2017, 82, 359–366. [Google Scholar] [CrossRef]
- Zahradnik, J.; Fialová, M.; Ruzicka, M.; Drahos, J.; Kastanek, F.; Thomas, N.H. Duality of the gas-liquid flow regimes in bubble column reactors. Chem. Eng. Sci. 1997, 52, 3811–3826. [Google Scholar] [CrossRef]
- Sarrafi, A.; Müller-Steinhagen, H.; Smith, J.M.; Jamialahmadi, M. Gas holdup in homogeneous and heterogeneous gas—liquid bubble column reactors. Can. J. Chem. Eng. 1999, 77, 11–21. [Google Scholar] [CrossRef]
- Ruzicka, M.C.; Drahos, J.; Fialova, M.; Thomas, N.H. Effect of bubble column dimensions on flow regime transition. Chem. Eng. Sci. 2001, 56, 6117–6124. [Google Scholar] [CrossRef]
Figure 1.
(a) Schematic of the experimental setup including the bubble column, gas injection system and instrumentation to monitor and control flowrates. (b) Top view of the column showing the camera and lighting configuration for bubble imaging.
Figure 1.
(a) Schematic of the experimental setup including the bubble column, gas injection system and instrumentation to monitor and control flowrates. (b) Top view of the column showing the camera and lighting configuration for bubble imaging.

Figure 2.
(a) Effect of column curvature on spatial calibration, ΔX = 5 mm, D = 102 mm. (b) Spatial variation of the calibration coefficient across the column mid-plane.
Figure 2.
(a) Effect of column curvature on spatial calibration, ΔX = 5 mm, D = 102 mm. (b) Spatial variation of the calibration coefficient across the column mid-plane.
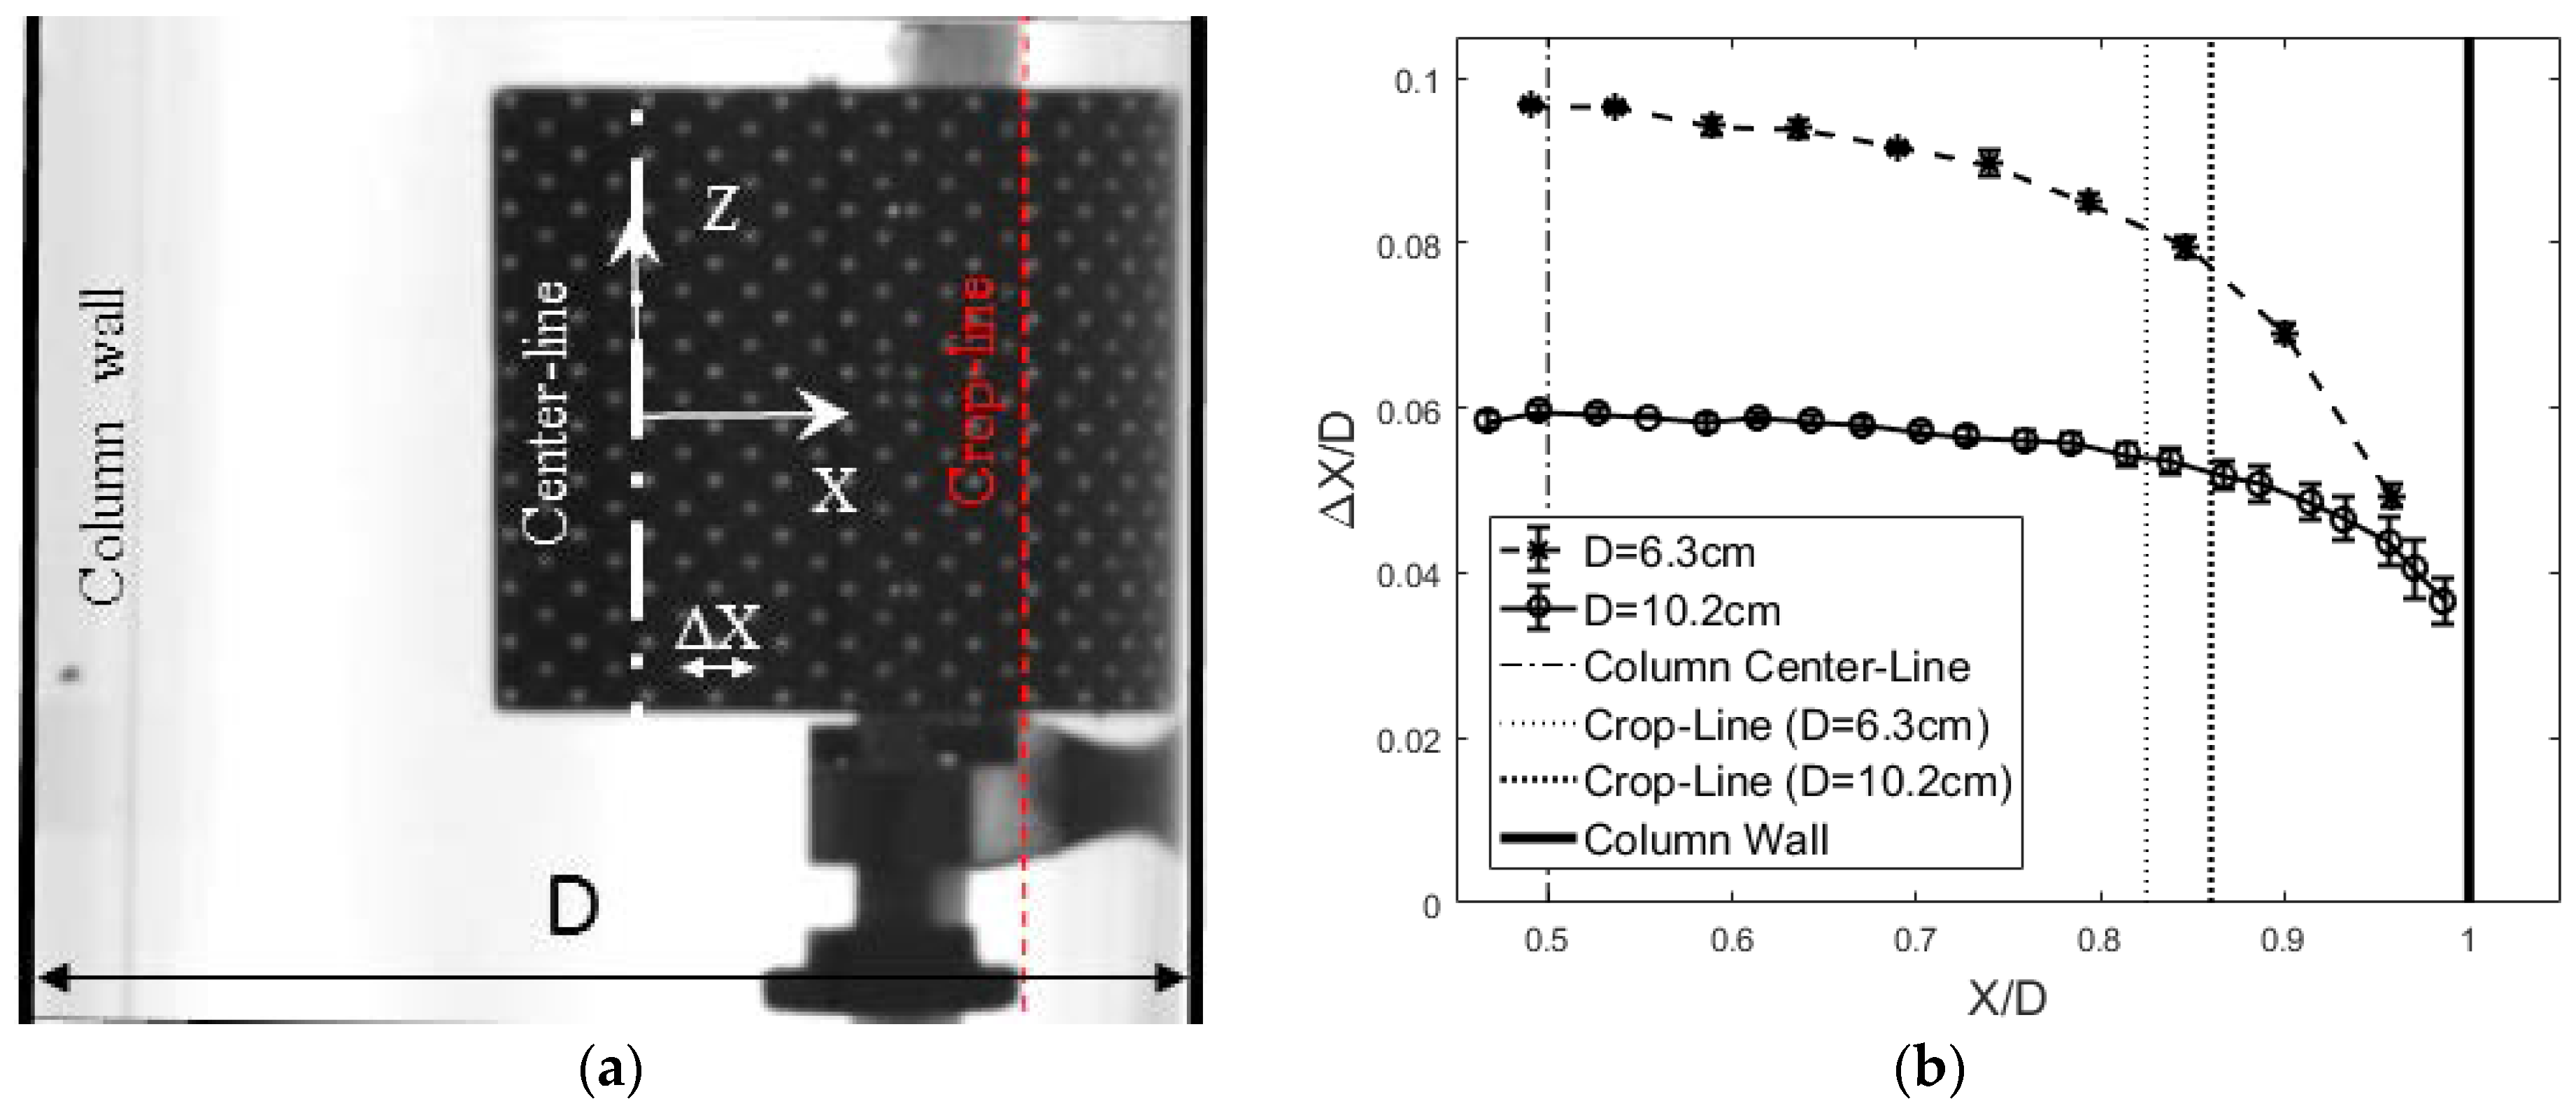
Figure 3.
Example image of bubble identification (identified bubbles are outlined). Note that out-of-focus bubbles are not identified due to the blurred edges.
Figure 3.
Example image of bubble identification (identified bubbles are outlined). Note that out-of-focus bubbles are not identified due to the blurred edges.

Figure 4.
Sauter mean diameter (d32) plotted versus the scaled vertical distance above the injection location. Each data point is the average of 10 repetitions, and the error bars are the standard deviation of the mean (Pm = 600 kPa, Tc = 21 ± 1 °C, D = 102 mm, dinj = 1.6 mm).
Figure 4.
Sauter mean diameter (d32) plotted versus the scaled vertical distance above the injection location. Each data point is the average of 10 repetitions, and the error bars are the standard deviation of the mean (Pm = 600 kPa, Tc = 21 ± 1 °C, D = 102 mm, dinj = 1.6 mm).

Figure 5.
(a) Probability density functions (PDF) and (b) cumulative density function (CDF) of bubble size (db) for the same conditions shown in Figure 4. The PDF/CDF for each Usg was determined from counting at least 10,000 bubbles. Dashed lines in (a) correspond to the d32 values for each condition (Pm = 600 kPa, Tc = 21 ± 1 °C, D = 102 mm, dinj = 1.6 mm).
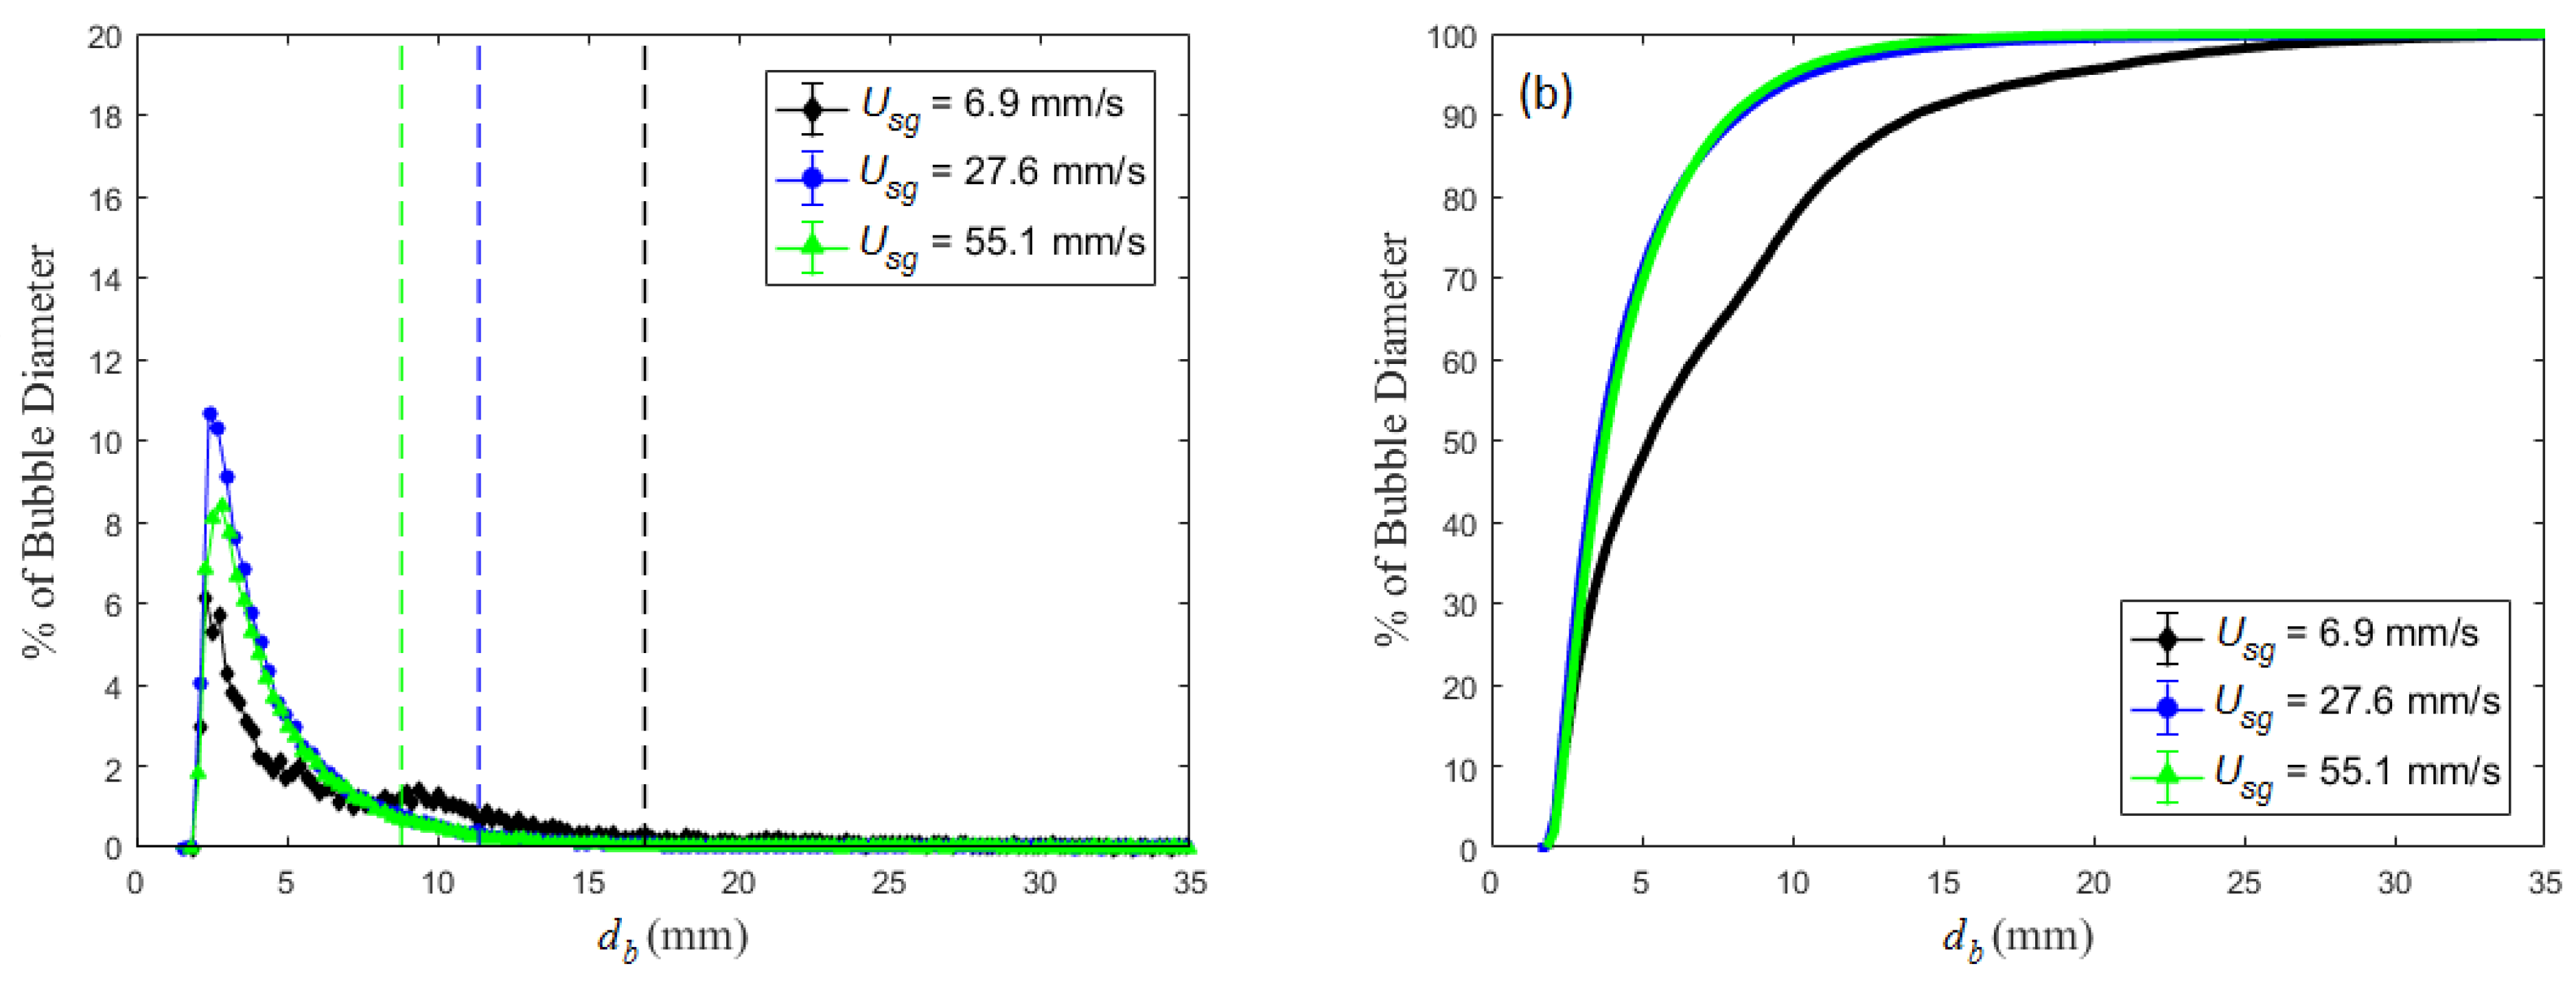
Figure 6.
Comparison between the most frequent bubble size (dmf) and the Sauter mean diameter (d32). The dashed line corresponds to dmf = d32. Open and closed symbols correspond dinj = 0.8 and 1.6 mm, respectively.
Figure 6.
Comparison between the most frequent bubble size (dmf) and the Sauter mean diameter (d32). The dashed line corresponds to dmf = d32. Open and closed symbols correspond dinj = 0.8 and 1.6 mm, respectively.
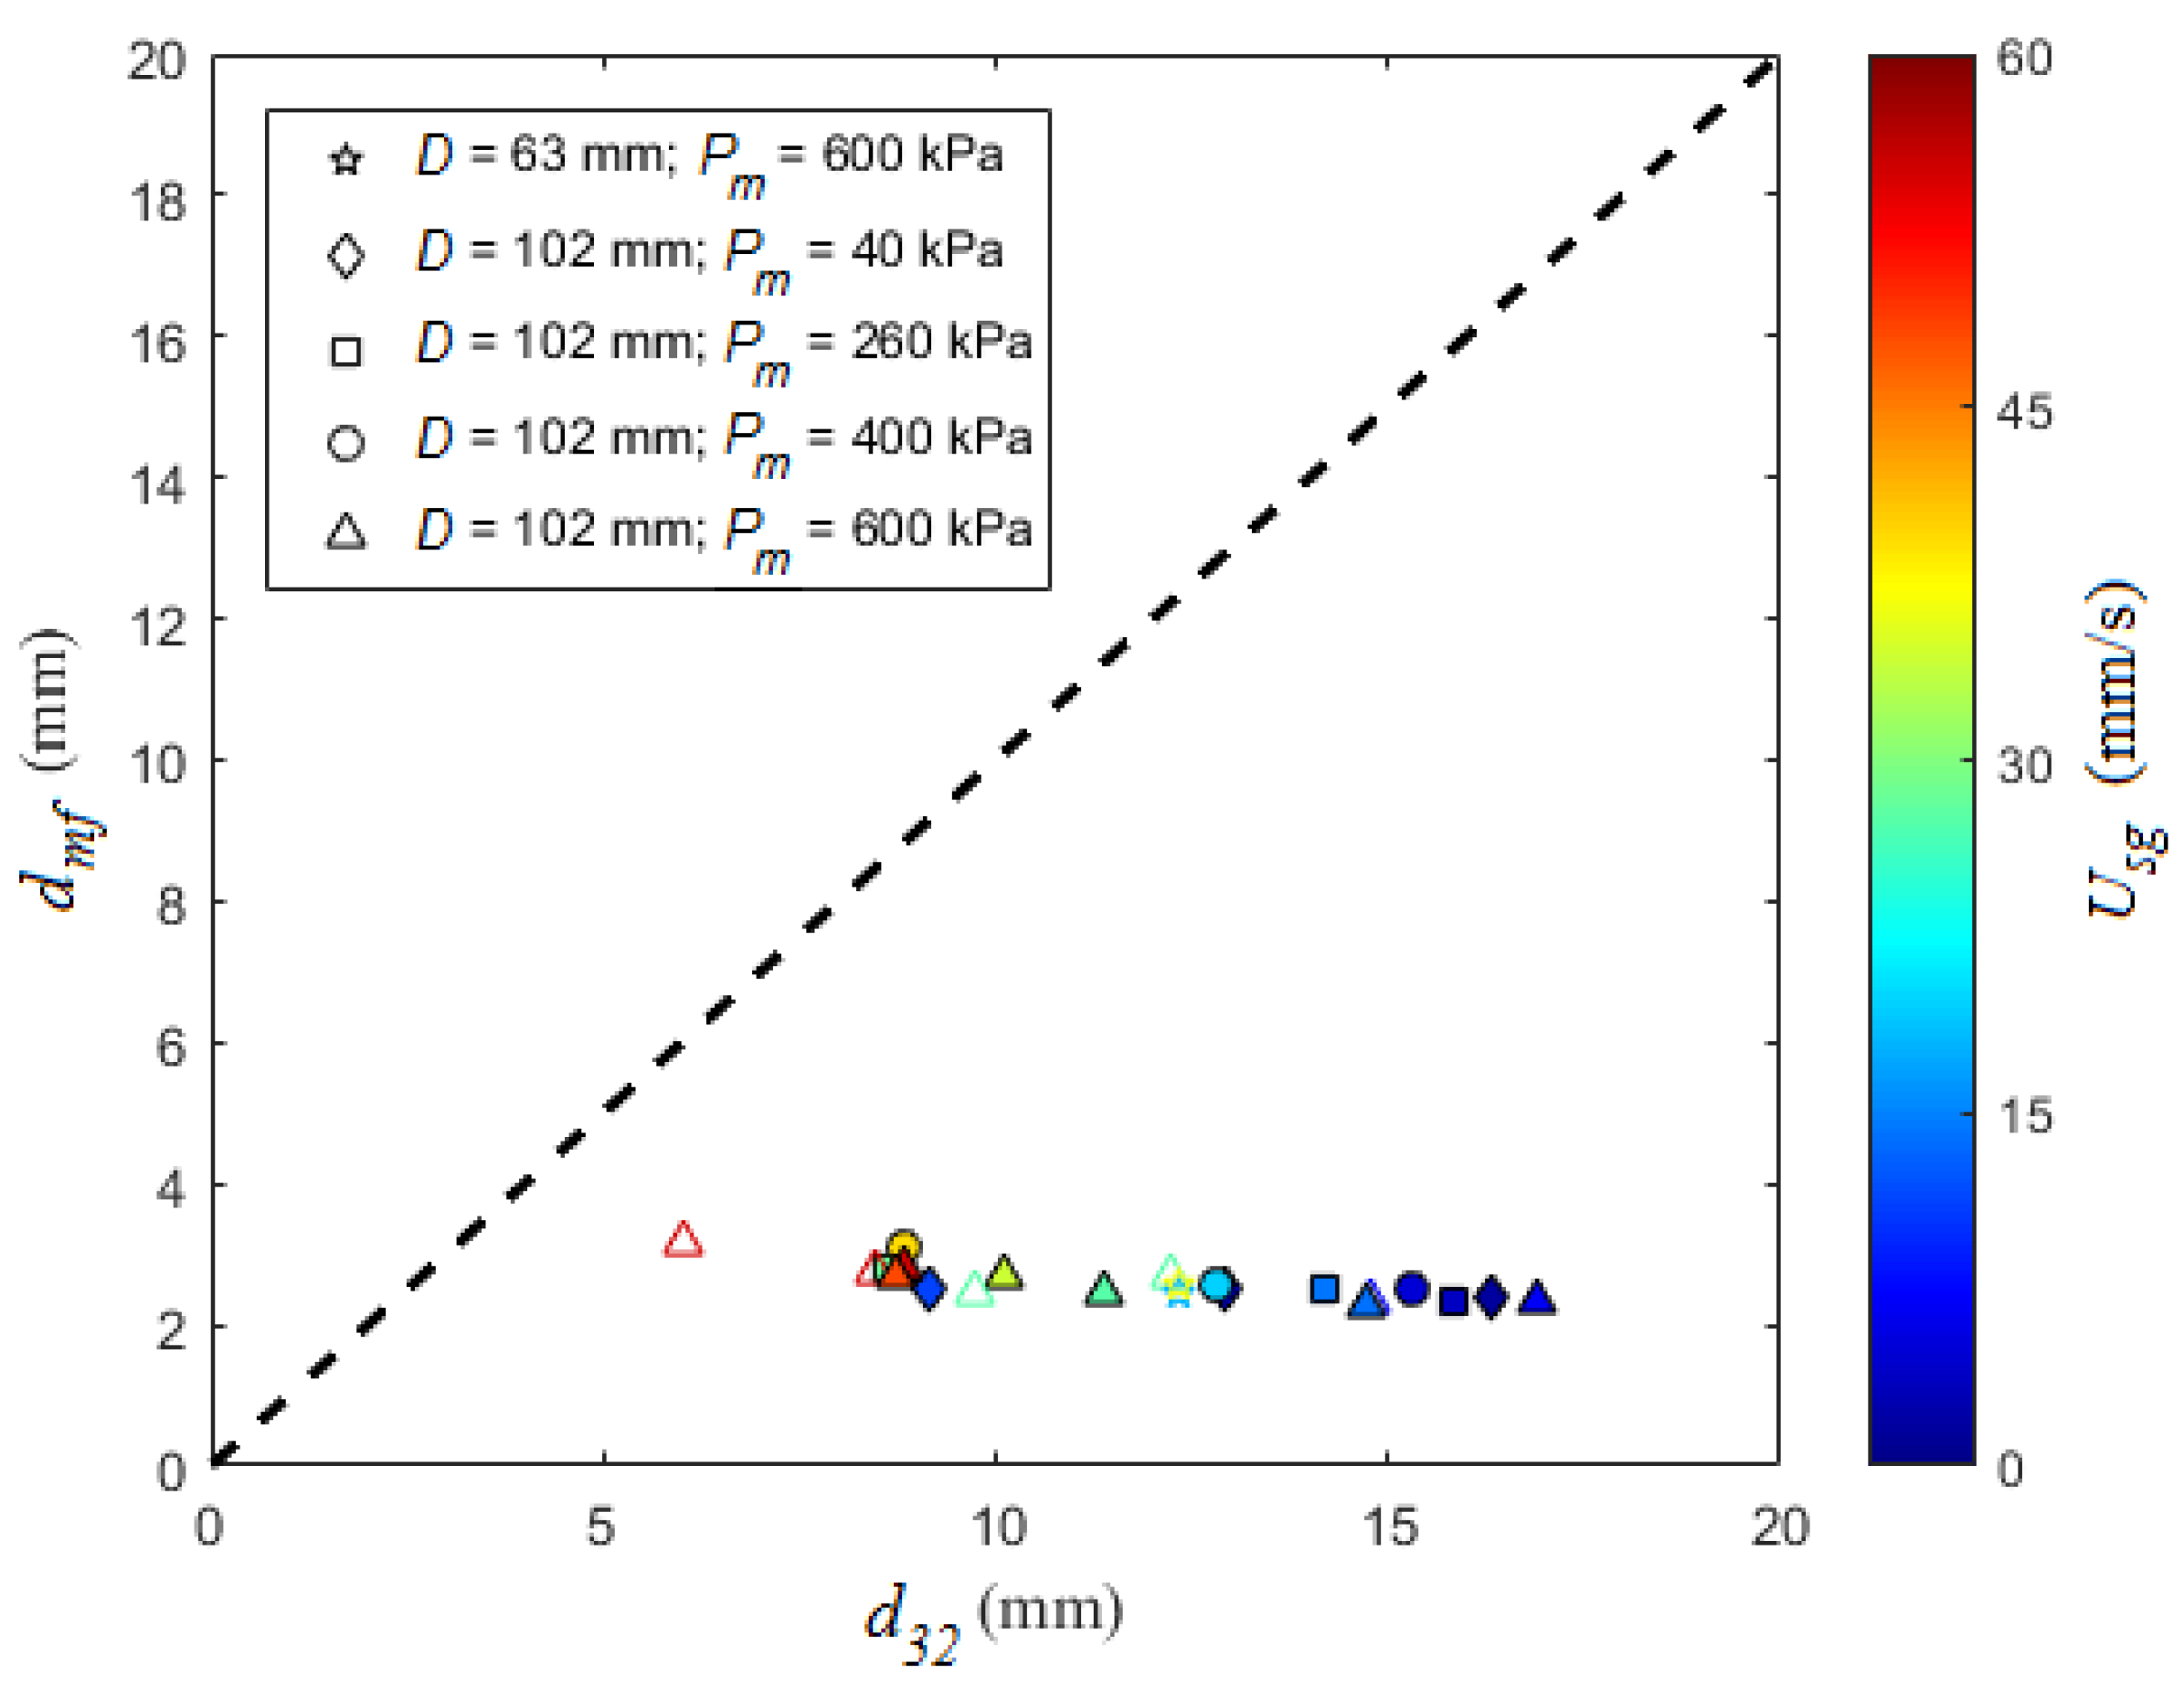
Figure 7.
PDFs from bimodal conditions (Usg = 1.4, 3.5, 4.9 and 6.9 mm/s). While the dmf is still determined from the smaller bubbles, there is a second weaker peak near 10 mm (D = 102 mm; dinj = 1.6 mm).
Figure 7.
PDFs from bimodal conditions (Usg = 1.4, 3.5, 4.9 and 6.9 mm/s). While the dmf is still determined from the smaller bubbles, there is a second weaker peak near 10 mm (D = 102 mm; dinj = 1.6 mm).
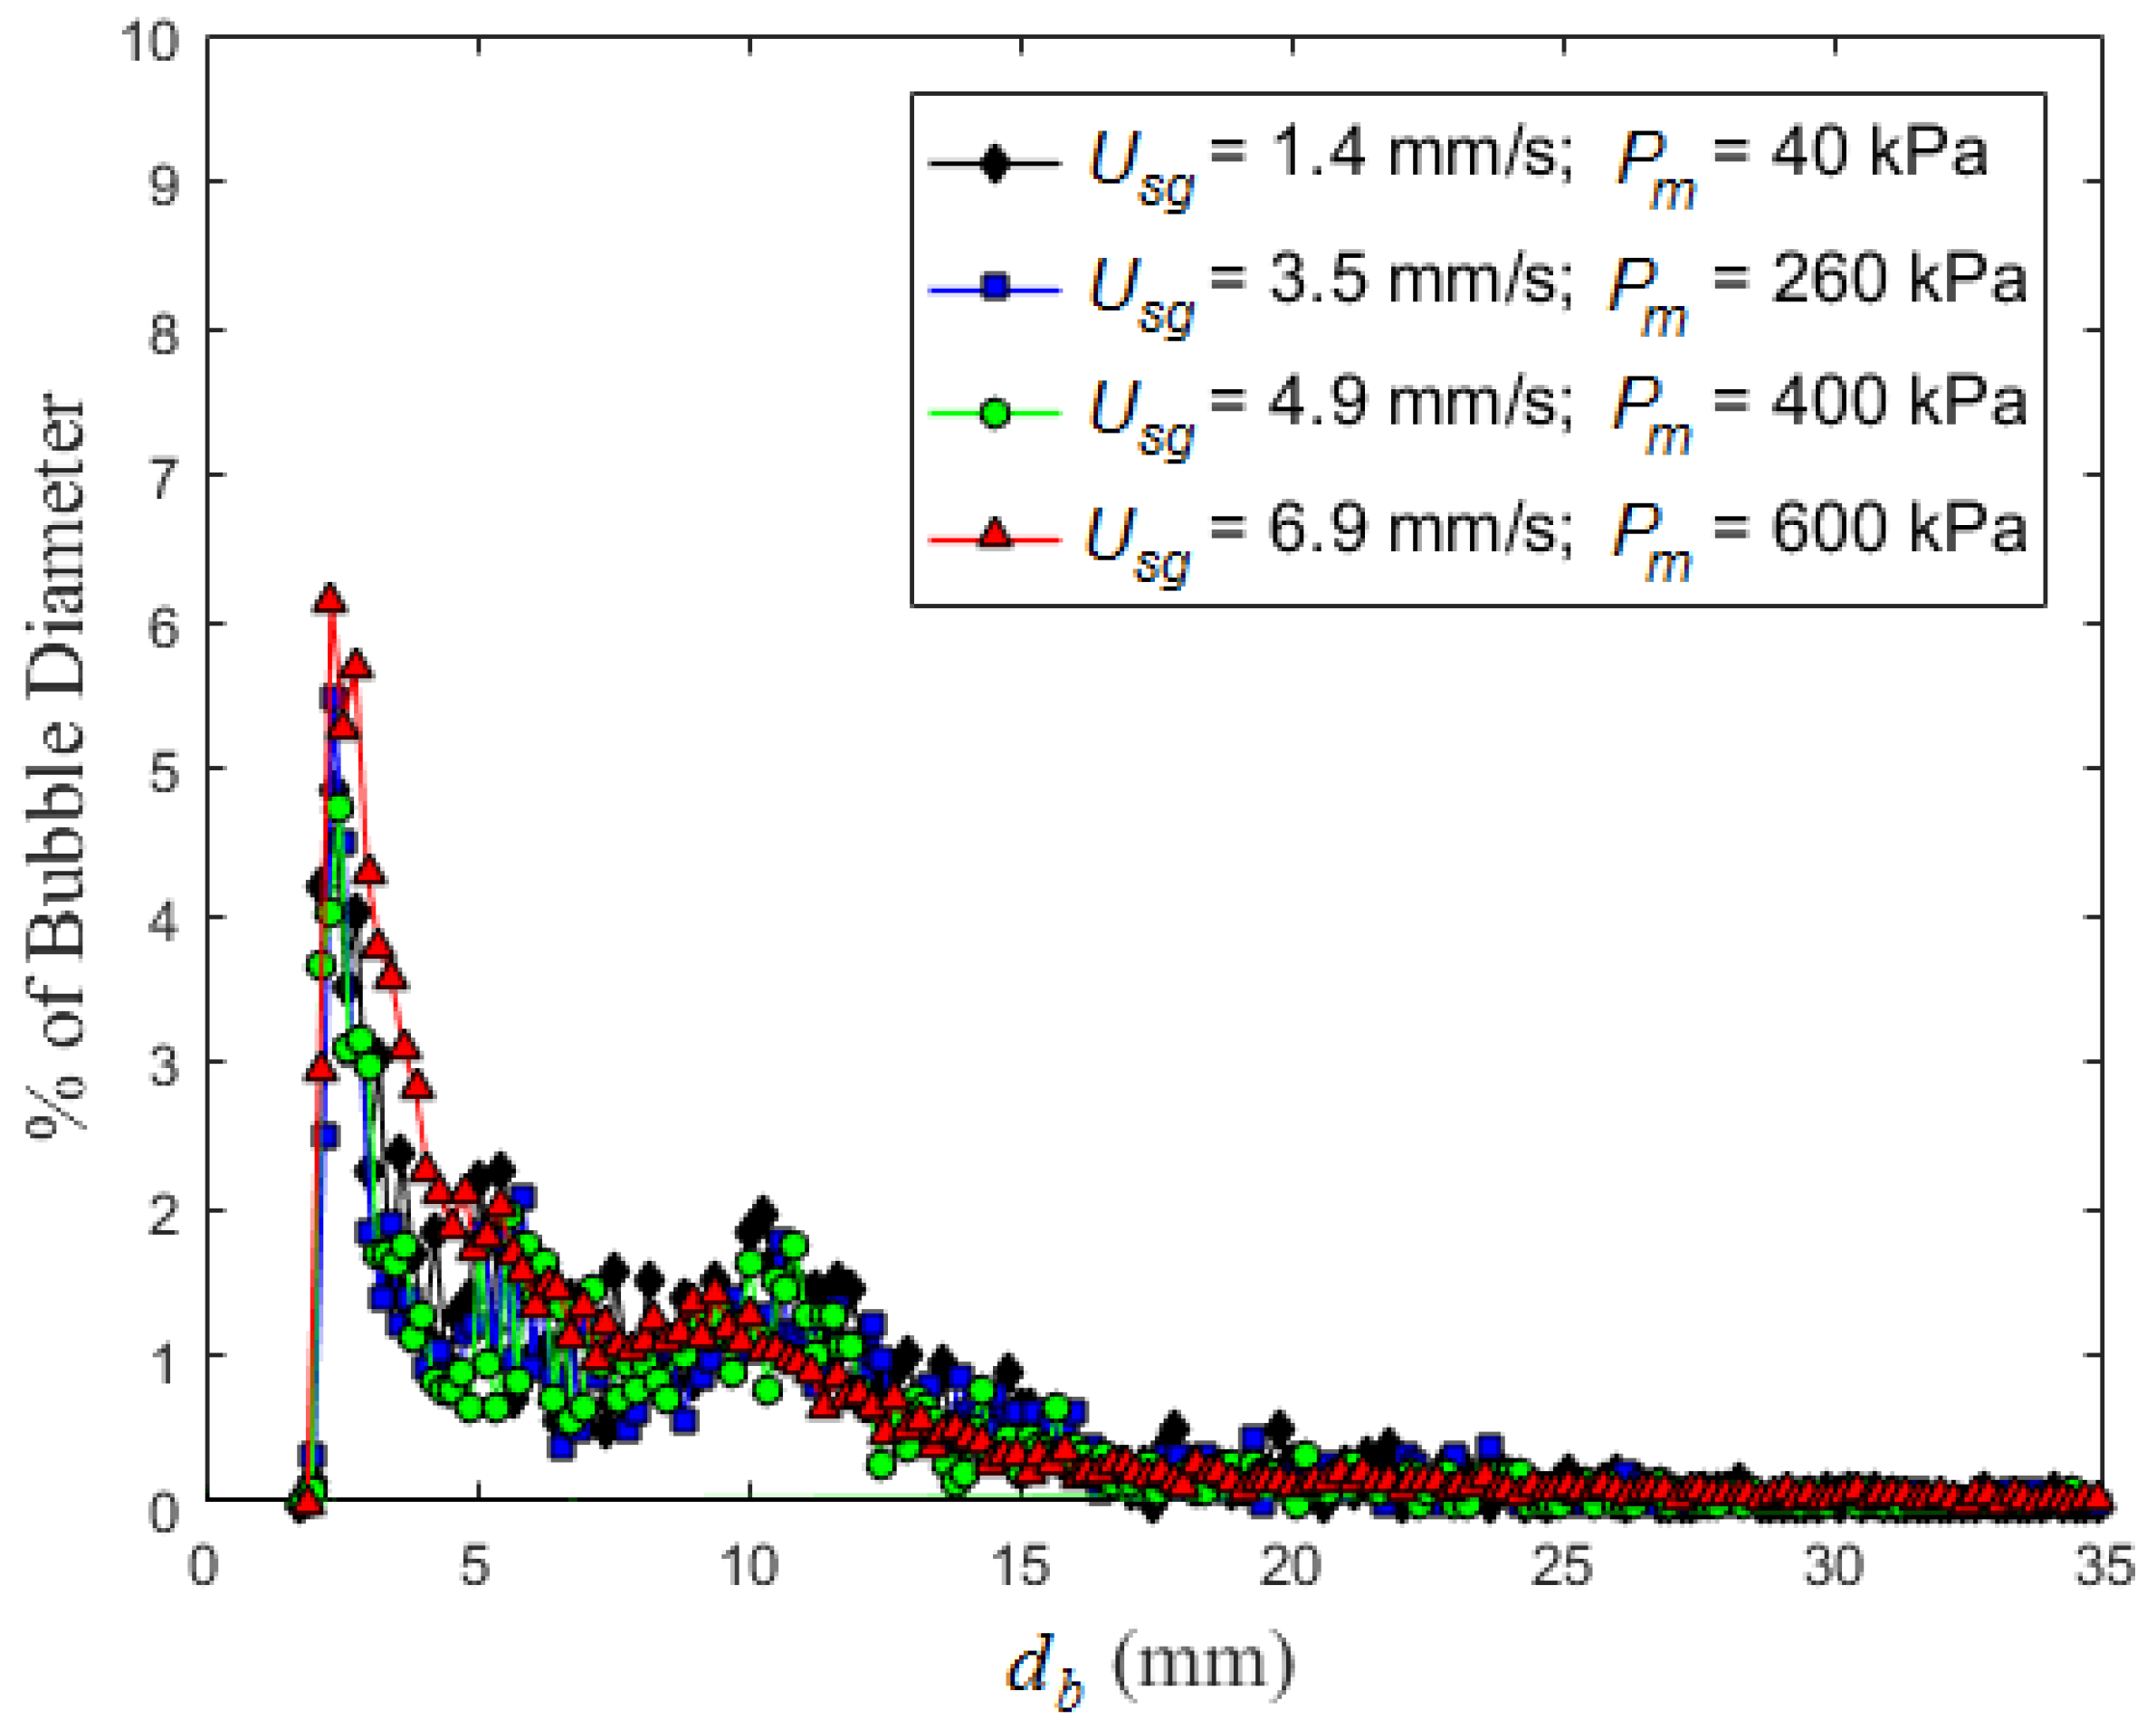
Figure 8.
(a) Sauter mean diameter and (b) most frequent bubble size plotted versus the superficial gas velocity. Error bars represent the standard deviation for the given condition (D = 102 mm; dinj = 1.6 mm; Tc = 21 ± 1 °C).
Figure 8.
(a) Sauter mean diameter and (b) most frequent bubble size plotted versus the superficial gas velocity. Error bars represent the standard deviation for the given condition (D = 102 mm; dinj = 1.6 mm; Tc = 21 ± 1 °C).
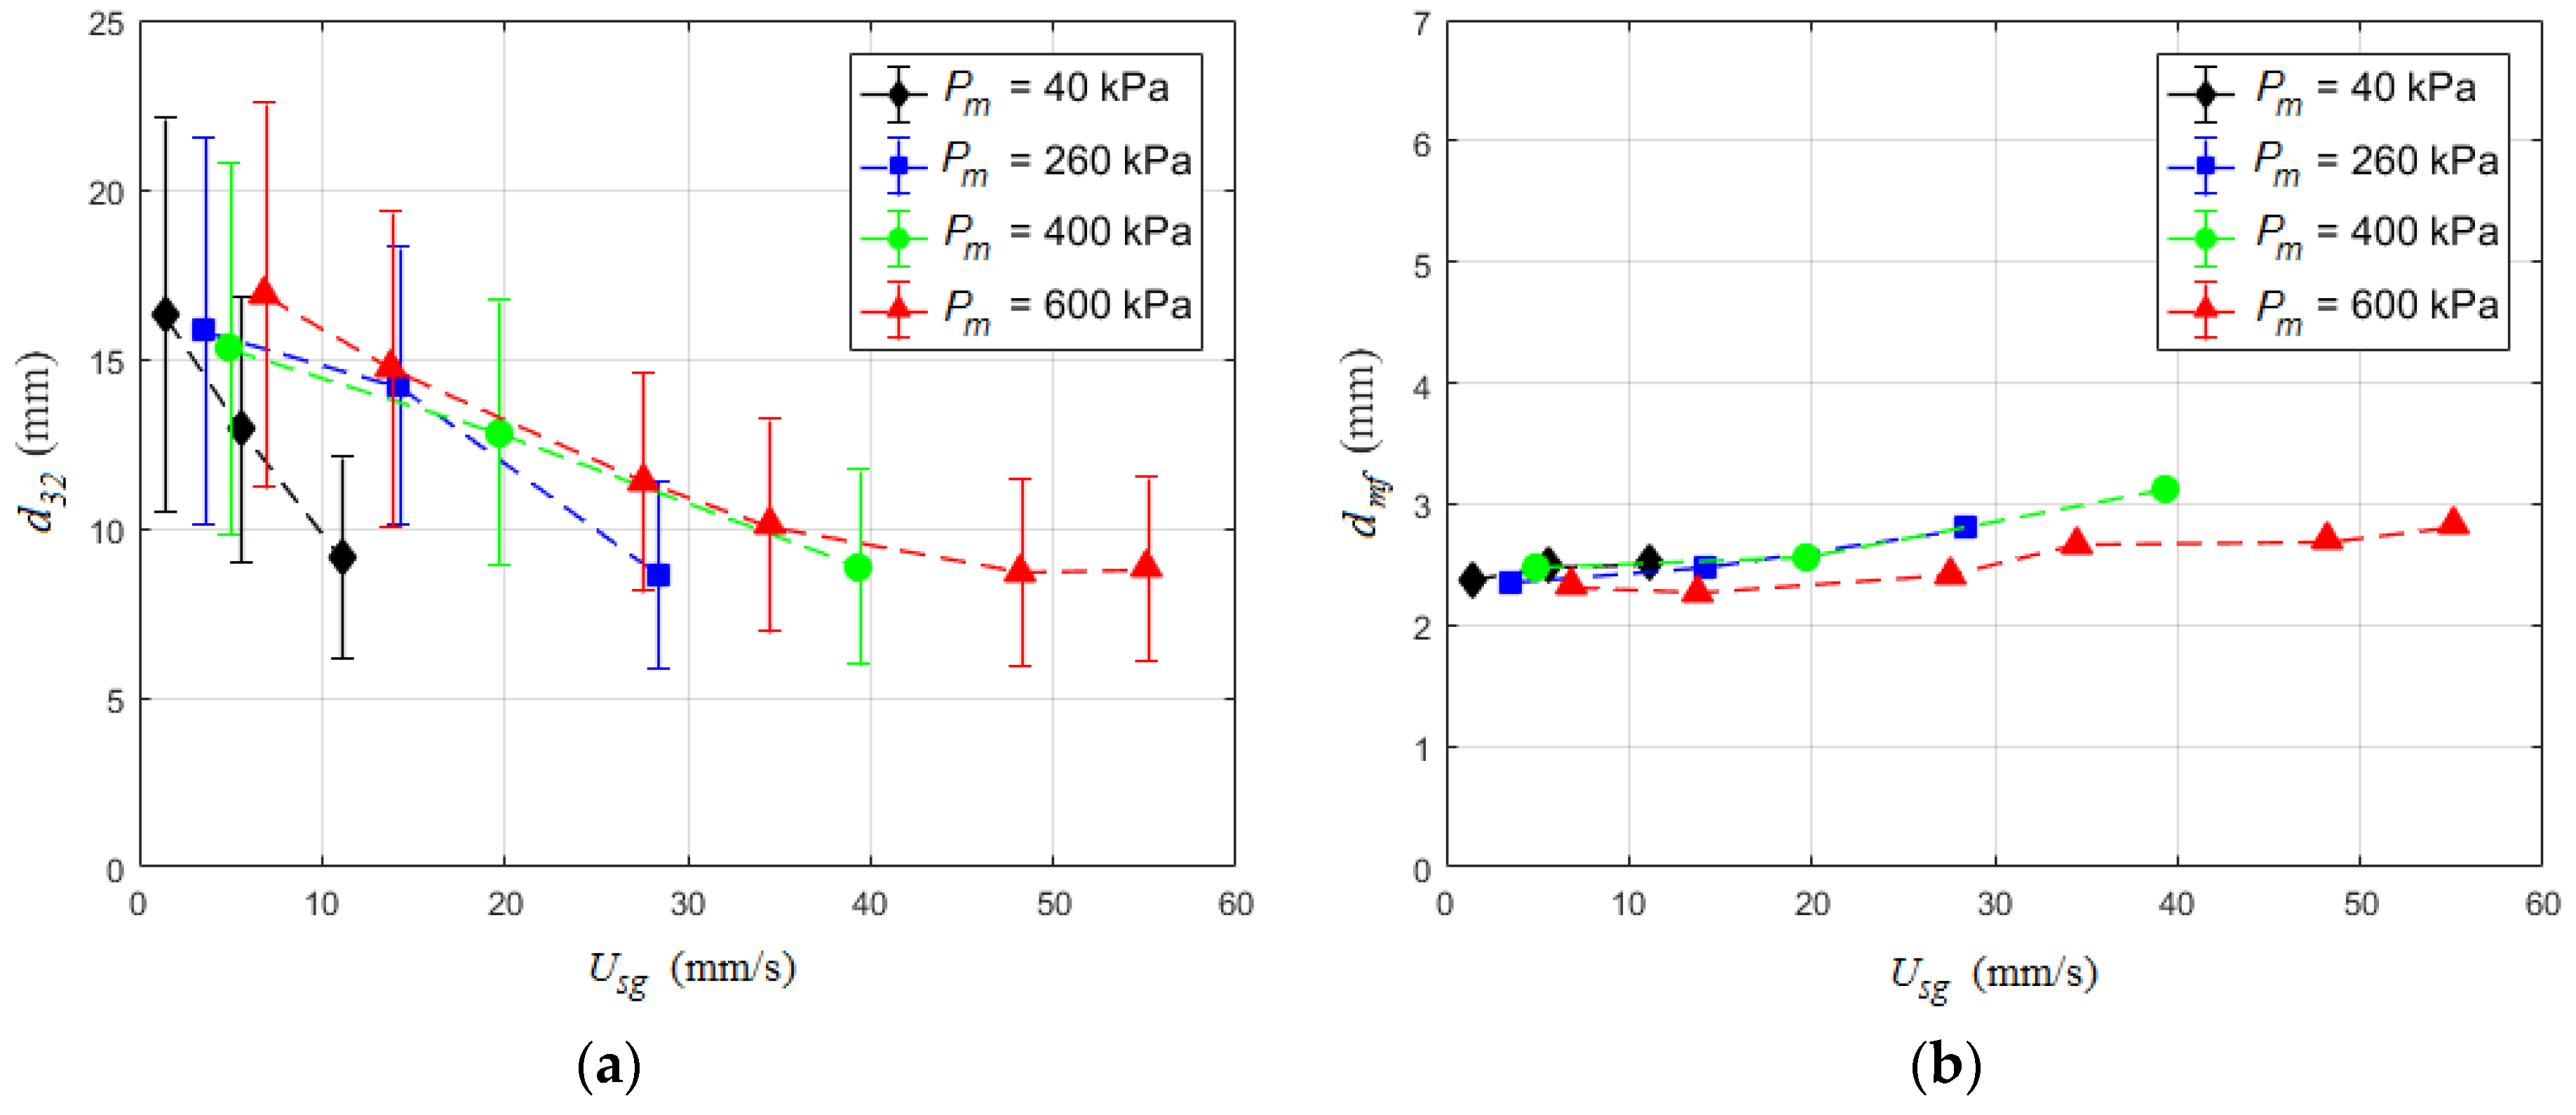
Figure 9.
Still frames in the D = 102 mm column with dinj = 1.6 mm with an injection condition of (a) Pm = 260 kPa, Usg = 3.5 mm/s; (b) Pm = 600 kPa, Usg = 6.9 mm/s and (c) Pm = 40 kPa, Usg = 11.1 mm/s.
Figure 9.
Still frames in the D = 102 mm column with dinj = 1.6 mm with an injection condition of (a) Pm = 260 kPa, Usg = 3.5 mm/s; (b) Pm = 600 kPa, Usg = 6.9 mm/s and (c) Pm = 40 kPa, Usg = 11.1 mm/s.

Figure 10.
Bubble sizes (dmf and d32) plotted versus the superficial gas velocity with the injector tube angle either 45° or 90° from horizontal (see insert sketch) (D = 102 mm; dinj = 0.8 mm; Pm = 600 kPa).
Figure 10.
Bubble sizes (dmf and d32) plotted versus the superficial gas velocity with the injector tube angle either 45° or 90° from horizontal (see insert sketch) (D = 102 mm; dinj = 0.8 mm; Pm = 600 kPa).

Figure 11.
Bubble sizes (dmf and d32) plotted versus the superficial gas velocity varying the injector tube diameter (D = 102 mm; Pm = 600 kPa).
Figure 11.
Bubble sizes (dmf and d32) plotted versus the superficial gas velocity varying the injector tube diameter (D = 102 mm; Pm = 600 kPa).

Figure 12.
Bubble size PDF for the two injector tube diameters (dinj = 0.8 or 1.6 mm) tested at (a) Usg = 6.9 mm/s and (b) Usg = 27.6 mm/s (D = 102 mm; Pm = 600 kPa; Tc = 21 ± 1 °C).
Figure 12.
Bubble size PDF for the two injector tube diameters (dinj = 0.8 or 1.6 mm) tested at (a) Usg = 6.9 mm/s and (b) Usg = 27.6 mm/s (D = 102 mm; Pm = 600 kPa; Tc = 21 ± 1 °C).

Figure 13.
Bubble sizes (dmf and d32) plotted versus the superficial gas velocity with different column diameters (dinj = 0.8 mm; Pm = 600 kPa).
Figure 13.
Bubble sizes (dmf and d32) plotted versus the superficial gas velocity with different column diameters (dinj = 0.8 mm; Pm = 600 kPa).

Figure 14.
Higher order statistics from the PDFs including (a) unweighted mean, (b) standard deviation σ, (c) skewness S and (d) kurtosis κ of the bubble diameter. Dashed line on the kurtosis plot at κ(db) = 3 corresponds to the kurtosis value of a normal distribution. The same legend is used for all plots. Open and closed symbols correspond to dinj = 0.8 and 1.6 mm, respectively.

Table 1.
The maximum measured bubbles size (dmax) spanning the flow rates tested with both injector tube diameters.
Table 1.
The maximum measured bubbles size (dmax) spanning the flow rates tested with both injector tube diameters.
| Usg (mm/s) | Maximum Measured Bubble Size (mm) | |
|---|---|---|
| dinj = 0.8 mm | dinj = 1.6 mm | |
| 6.9 | 10.2 | 11.7 |
| 27.6 | 9.9 | 16.7 |
| 55.1 | 9.4 | 15.8 |
© 2018 by the authors. Licensee MDPI, Basel, Switzerland. This article is an open access article distributed under the terms and conditions of the Creative Commons Attribution (CC BY) license (http://creativecommons.org/licenses/by/4.0/).
Share and Cite
MDPI and ACS Style
Mohagheghian, S.; Elbing, B.R. Characterization of Bubble Size Distributions within a Bubble Column. Fluids 2018, 3, 13. https://doi.org/10.3390/fluids3010013
AMA Style
Mohagheghian S, Elbing BR. Characterization of Bubble Size Distributions within a Bubble Column. Fluids. 2018; 3(1):13. https://doi.org/10.3390/fluids3010013
Chicago/Turabian StyleMohagheghian, Shahrouz, and Brian R. Elbing. 2018. "Characterization of Bubble Size Distributions within a Bubble Column" Fluids 3, no. 1: 13. https://doi.org/10.3390/fluids3010013