Development of an Expression Vector to Overexpress or Downregulate Genes in Curvularia protuberata


The Department of Biological and Environmental Sciences, University of West Alabama, Livingston, AL 35470, USA
*
Author to whom correspondence should be addressed.
J. Fungi 2018, 4(2), 54; https://doi.org/10.3390/jof4020054
Submission received: 12 April 2018
/
Revised: 3 May 2018
/
Accepted: 3 May 2018
/
Published: 5 May 2018
Abstract
:Curvularia protuberata, an endophytic fungus in the Ascomycota, provides plants with thermotolerance only when it carries a mycovirus known as Curvularia thermotolerance virus (CThTV), and forms a three-way symbiotic relationship among these organisms. Under heat stress, several genes are expressed differently between virus-free C. protuberata (VF) and C. protuberata carrying CThTV (AN). We developed an expression vector, pM2Z-fun, carrying a zeocin resistance gene driven by the ToxA promoter, to study gene functions in C. protuberata to better understand this three-way symbiosis. Using this new 3.7-kb vector, five genes that are differentially expressed in C. protuberata—including genes involved in the trehalose, melanin, and catalase biosynthesis pathways—were successfully overexpressed or downregulated in VF or AN C. protuberata strains, respectively. The VF overexpression lines showed higher metabolite and enzyme activity than in the control VF strain. Furthermore, downregulation of expression of the same genes in the AN strain resulted in lower metabolite and enzyme activity than in the control AN strain. The newly generated expression vector, pM2Z-fun, has been successfully used to express target genes in C. protuberata and will be useful in further functional expression studies in other Ascomycota fungi.
1. Introduction
The endophytic fungus Curvularia protuberata carrying the mycovirus Curvularia thermotolerance virus (CThTV) can participate in a three-way symbiosis with plants that leads to extreme thermotolerance [1]. C. protuberata confers plant thermotolerance only when the CThTV is present, but neither the virus-free fungus (VF) nor plant can survive extremely high soil temperature (65 °C) independently. The C. protuberata AN strain, which was produced by hyphal anastomosis of VF and wild-type C. protuberata, regains the ability to confer thermotolerance [1]. This virus–fungus–plant three-way symbiosis has been discovered in monocot (Dichanthelium lanuginosum) and was confirmed in dicot (Solanum lycopersicon) plants also, which suggests a conserved thermotolerance mechanism [1,2]. In order to make the best use of this three-way symbiosis to improve crop thermotolerance, it is necessary to understand the molecular mechanisms that govern this system. Therefore, in order to study the C. protuberata gene functions and their roles in acquired thermotolerance, we constructed an expression vector, pM2Z-fun, using the ToxA gene promotor and zeocin resistance gene as a selective marker.
The promoter of the ToxA gene, a necrosis-inducing host-selective toxin gene from Pyrenophora tritici-repentis [3], was used to drive expression in the vector pCT74 [4]. This vector has been used to express a reporter gene encoding green fluorescent protein, which causes bright cytoplasmic fluorescence in eight ascomycete fungal genera [4]. The ToxA promoter has also been used successfully to drive expression of other fluorescent proteins in several related fungi [3,4,5].
We are using a vector that carries the 370-bp Sh ble gene, which confers resistance to zeocin [6,7], an antibiotic that causes cell death by cleaving DNA that has been widely used as selective marker for transformation of fungi, algae, and mammalian cells [8,9,10,11]. In some cases, selection using zeocin results in higher transformation efficiencies than selection using other antibiotics [12,13].
Because several C. protuberata genes are differently expressed between AN and VF strains under heat stress, we hypothesize that these genes are involved in the thermotolerance mechanism that results from this three-way symbiosis [2]. Five of these genes were chosen to test the new expression vector. These target genes included genes in the melanin synthesis pathway: 1,3,6,8-tetrahydroxynaphthalene reductase (T4HN) and scytalone dehydratase (SCD); genes in the trehalose synthesis pathway: trehalose-6-phosphate synthase (TPS1) and trehalose-6-phosphate phosphatase (TPS2); and a catalase/peroxidase gene (CAT) [2].
Melanin is a pigment formed by polymerization of phenolic compounds that protects organisms from ultraviolet radiation and environmental stressors [14,15,16,17]. The two dominant types of melanin in fungi are dihydroxynaphthalene (DHN)-melanin and dihydroxyphenylalanine (DOPA)-melanin [18]. Expression of the DHN-melanin biosynthesis genes in Metarhizium anisopliae enhances stress tolerance and virulence [19]. T4HN and SCD are other key genes involved in the DHN-melanin biosynthesis pathway [20,21]. Interestingly, expression of both T4HN and SCD transcripts in Bipolaris oryzae is enhanced by near-ultraviolet irradiation [22].
Trehalose, a non-reducing disaccharide present in bacteria, fungi, plants, and invertebrates [23,24], serves as a carbohydrate storage molecule, developmental regulator, and abiotic stress protectant [25,26,27,28]. Trehalose is synthesized in two steps: first, trehalose phosphate synthase (TPS1) catalyzes the synthesis of trehalose-6-phosphase from gluose-6-phosphate and uridine diphosphate-glucose; second, trehalose-6-phosphate phosphatase (TPS2) catalyzes the dephosphorylation of trehalose-6-phosphate to trehalose [24,29]. A mutation in the TPS1 gene of Botrytis cinerea prevents trehalose synthesis and leads to increased heat sensitivity of the mutant compared to the wild type [30].
Hydrogen peroxide (H2O2) is a reactive oxygen species that can cause severe cellular damage. It can be degraded and catalyzed into water (H2O) and oxygen (O2) by the enzyme catalase/peroxidase, which is present in all aerobic organisms [31,32]. Catalase is also used to protect cells from oxidative damages associated with a variety of stresses [33,34,35,36]. In addition, overexpression of catalase in fungi improves their spore germination and mycelial growth rate [36,37].
In this article, we demonstrate the differences in metabolite and enzyme activity between overexpressed and downregulated targeted genes in C. protuberata VF and AN stains, respectively, using the newly developed expression vector pM2Z-fun, to further the understanding of the molecular mechanisms that drive this plant, fungus, and virus three-way symbiotic relationship.
2. Materials and Methods
2.1. Fungal Culture
All fungal strains of C. protuberata (VF, AN, and their transformants) were cultured on 0.1× potato dextrose agar (PDA) plates (pH 5.8) or in 1× potato dextrose (PD) liquid medium (pH 5.8) supplemented with ampicillin (100 µg/mL), kanamycin (50 µg/mL), and streptomycin (100 µg/mL). Different concentrations (described below) of zeocin were added for selection of fungal transformants.
2.2. Vector Construction
To generate the fungal expression vector pM2Z-fun, a multiple cloning site (MCS) cassette containing EcoRI, KpnI, PstI, BamHI, SpeI, HindIII, and XbaI, terminator NOS (Genebank ID: KY031321.1), the ToxA promoter (Genebank ID: DQ423483.1), zeocin cassette containing pTEF1 promoter, Sh ble gene (Genebank ID: KY793908.1), and terminator CYC1 (Genebank ID: KM035419.1) was synthesized by Invitrogen (Invitrogen, Waltham, MA, USA) and inserted into pMZ vector. The newly synthesized vector was used as the backbone for both overexpression and RNAi vectors for the target genes. The vector described in this paper is available to share by contacting the corresponding author.
2.3. Overexpression and RNAi Constructs
Total RNA was extracted from 3 mg of lyophilized AN strain mycelia using a PureLink® RNA Mini Kit (Thermo Fisher Scientific, Waltham, MA, USA). First-strand cDNA was synthesized from 1 µg RNA using Oligo-dT primers and Moloney murine leukemia virus reverse transcriptase (Promega, Madison, WI, USA). To clone genes of interest for overexpression, primers containing specific restriction site sequences were designed according to our EST data (Table 1). Each gene of interest was amplified by PCR using Phusion® High-Fidelity DNA polymerase (New England Biolabs, Ipswich, MA, USA), then PCR products purified, cleaved with the appropriate restriction enzyme, and cloned into the pM2Z-fun vector. All clones were sequenced to confirm the presence of expected genes in the correct sequence.
For the RNAi vectors, the sense fragment (A) and anti-sense fragment (B) of each target gene was amplified separately, and then inserted into the pM2Z-fun vector sequentially (primers and restriction enzyme sites are listed in Table 1). For each specific gene, the forward primer of the sense fragment and the reverse primer of the antisense fragment were the same. The 5′ end of the anti-sense fragment was about 100-bp (±10-bp, varied according to specific gene) shorter than the sense fragment to allow hairpin formation. The vectors were digested with EcoRI to confirm the insertion.
2.4. Protoplast Isolation
Fungal protoplasts were isolated using the method described by Young [38] with modifications. Five-day-old mycelia cultures were harvested for protoplast preparation. One gram of wet mycelia was resuspended in 30 mL of enzyme buffer (1.2 M MgSO4, 10 mM K2HPO4, pH 5.8) containing 1.2% lysing enzyme (Sigma, St. Louis, MO, USA) and shaken at 50 rpm in the dark for 4 h with gradually increased temperatures: 26 °C for 30 min, 30 °C for 30 min, 33 °C for 30 min, 35 °C for 2 h, and finally 37 °C for 30 min. The protoplasts were harvested and washed 3× using STC buffer (1 M sorbitol, 50 mM Tris, pH 5.8, 50 mM CaCl2). The protoplasts were resuspended in STC buffer at a final concentration of 1 × 10⁸ cells/mL.
2.5. Transformation and Screening
Protoplast transformation was carried out as described by Itoh [39] with modifications. Transformants were selected on HM media (138.5 g mannitol, 1 g casamino acids, 1 g yeast extract, 4 g sucrose and 20 g agar per 1 L) plates containing 50 µg/mL zeocin. The resulting transformants were subsequently maintained on PDA containing 20 µg/mL zeocin.
Potential fungal transformants were screened for the presence of inserted genes by PCR with forward primers for ToxA and reverse primers targeting each specific target gene (Table 1).
2.6. Semi-Quantitative Reverse Transcription-PCR
Seven-day-old liquid fungus cultures were vacuum filtered and washed with sterile H2O. The collected mycelia were then freeze-dried overnight. Total RNA extraction and synthesis of first-strand cDNA were performed as described above. To quantify the expression of specific genes, 1 µL of first-strand cDNA was used with GoTaq (Promega, Madison, WI, USA) and 5× green GoTaq Reaction Buffer in each 20 µL PCR reaction for 25–27 amplification cycles at 57–60 °C for annealing temperature depending on the specific gene (primers are listed in Table 1). The glyceradehyde-3-phosphate dehydrogenase (GPD) gene was used as an internal control.
2.7. Melanin Extraction and Quantification
Melanin extraction and analysis were performed as described by Fernandes [40] with minor modifications. Briefly, 1 M NaOH was added to 20 mg of freeze-dried mycelia (1 mL/10 mg) and the pigment was extracted by autoclaving at 121 °C for 60 min. Samples were centrifuged and the collected supernatant was used to spectrophotometrically quantify melanin content by absorbance at 405 nm. Three independent samples were analyzed.
2.8. Trehalose Assay
Fungal trehalose was extracted from five-day-old liquid cultures as described previously with modifications [41]. Fungal culture was vacuum filtered and washed with distilled H2O. Two volumes of distilled H2O were added to the washed mycelia and the samples were boiled for 20 min to inactivate enzymes and release soluble sugars. The supernatant was collected by centrifugation at 12,000 rpm for 5 min. Free D-glucose was removed from the supernatant, and then a trehalose assay was performed using a Trehalose Assay Kit (Megazyme, Chicago, IL, USA) following the manufacturer’s recommendations. Three independent samples were analyzed.
2.9. Catalase Assay
The analysis of catalase activity was performed as described by Iwase [42] with modifications. Five-day-old liquid fungal culture was homogenized before harvesting. A 30-mg sample of washed fungal mycelia was weighed and added to the bottom of a 20 mL glass tube. Five milliliters of 3% H2O2 containing 1% Triton-100 was slowly added into the tube. The foam formed by the reaction between catalase and H2O2 was measured after 5 min. Catalase activity was determined as the depth of the foam measured in centimeters.
3. Results
3.1. Vector Construction
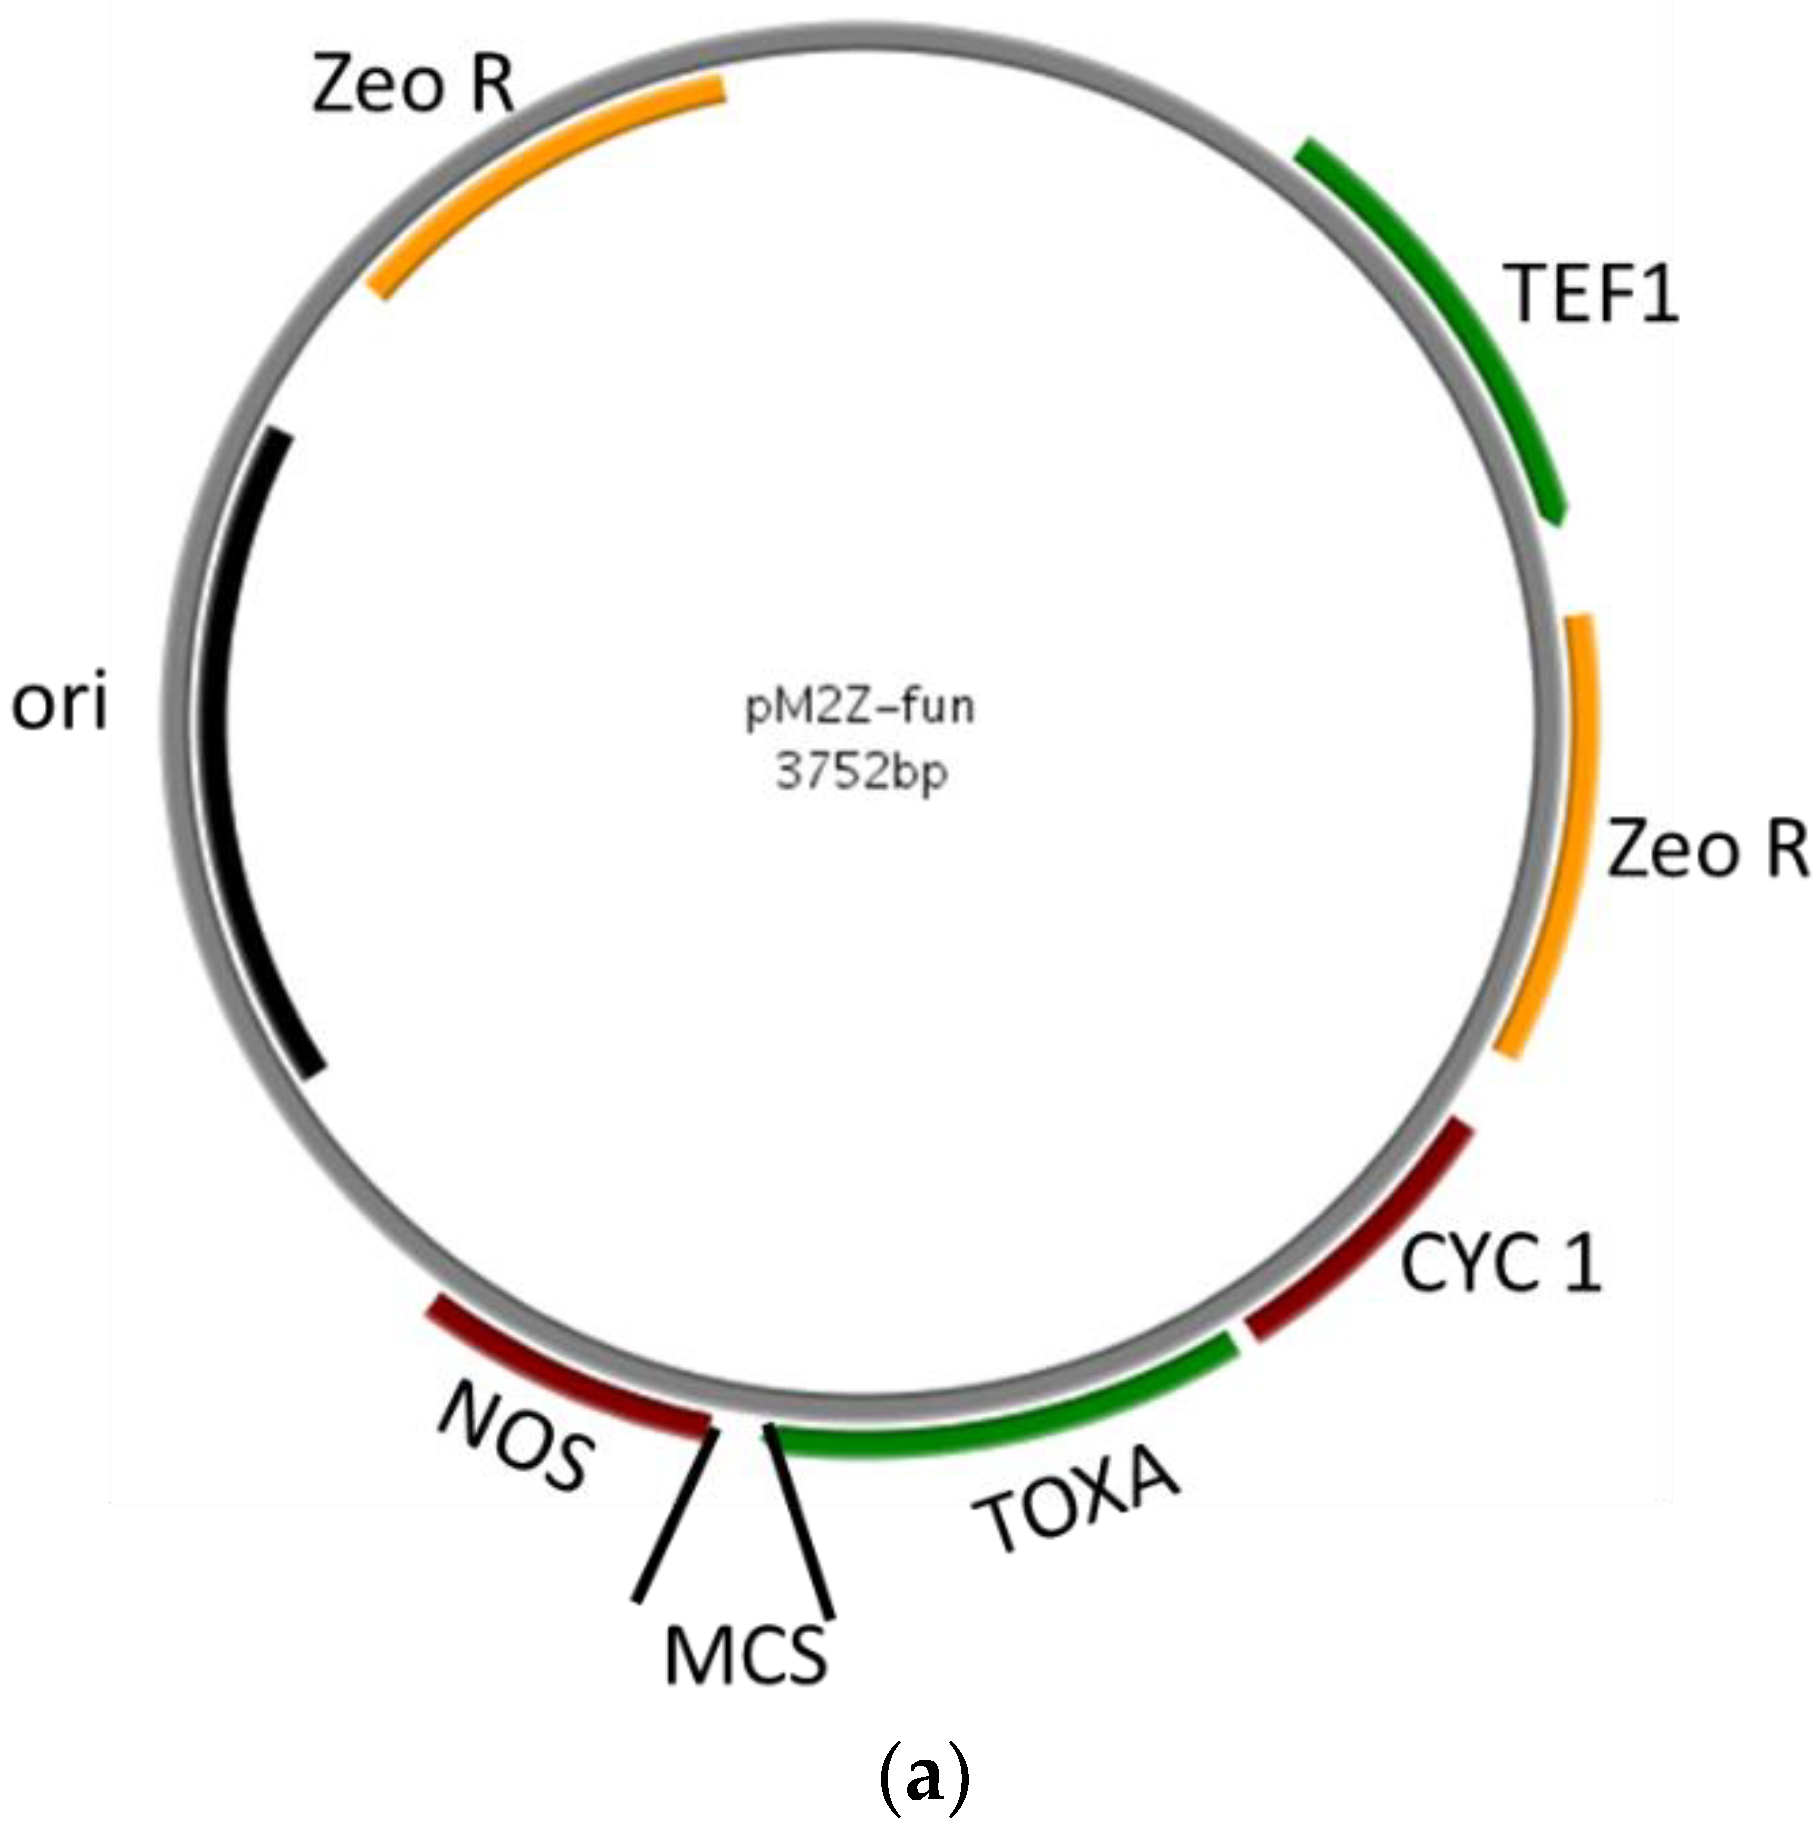
The MCS and zeocin cassettes (synthesized and confirmed by sequencing) were cloned into the pMZ vector to construct the pM2Z-fun vector for expression driven by the ToxA promoter. The final construct is about 3.7-kb including the ToxA promoter, MCS, NOS terminator, and zeocin resistance gene (Figure 1a).
To test the efficiency of the new vector, five target genes from C. protuberata were overexpressed in the VF strain or silenced in the AN strain. Using our previous EST data, primers with specific restriction enzyme sites were designed to amplify full-length genes (Table 1). Full-length genes were amplified and inserted into pM2Z-fun vector to generate the overexpression vectors pM2Z-fun/target gene (target genes included T4HN, SCD, TPS1, TPS2, and CAT). All of the insertions were confirmed by sequencing.
To construct the RNAi vectors, both sense and anti-sense fragments of genes of interest were inserted into pM2Z-fun to obtain pM2Z-fun vectors expressing target genes or antisense target genes including T4HN, SCD, TPS1, TPS2, or CAT. Digestion of each vector with EcoRI produced two fragments: a larger 3.7-kb vector fragment and a shorter 600–1100-bp sense and antisense target gene fragment (Figure 1b). These digested fragments confirmed correct insertion.
3.2. Molecular Analysis of Transformants
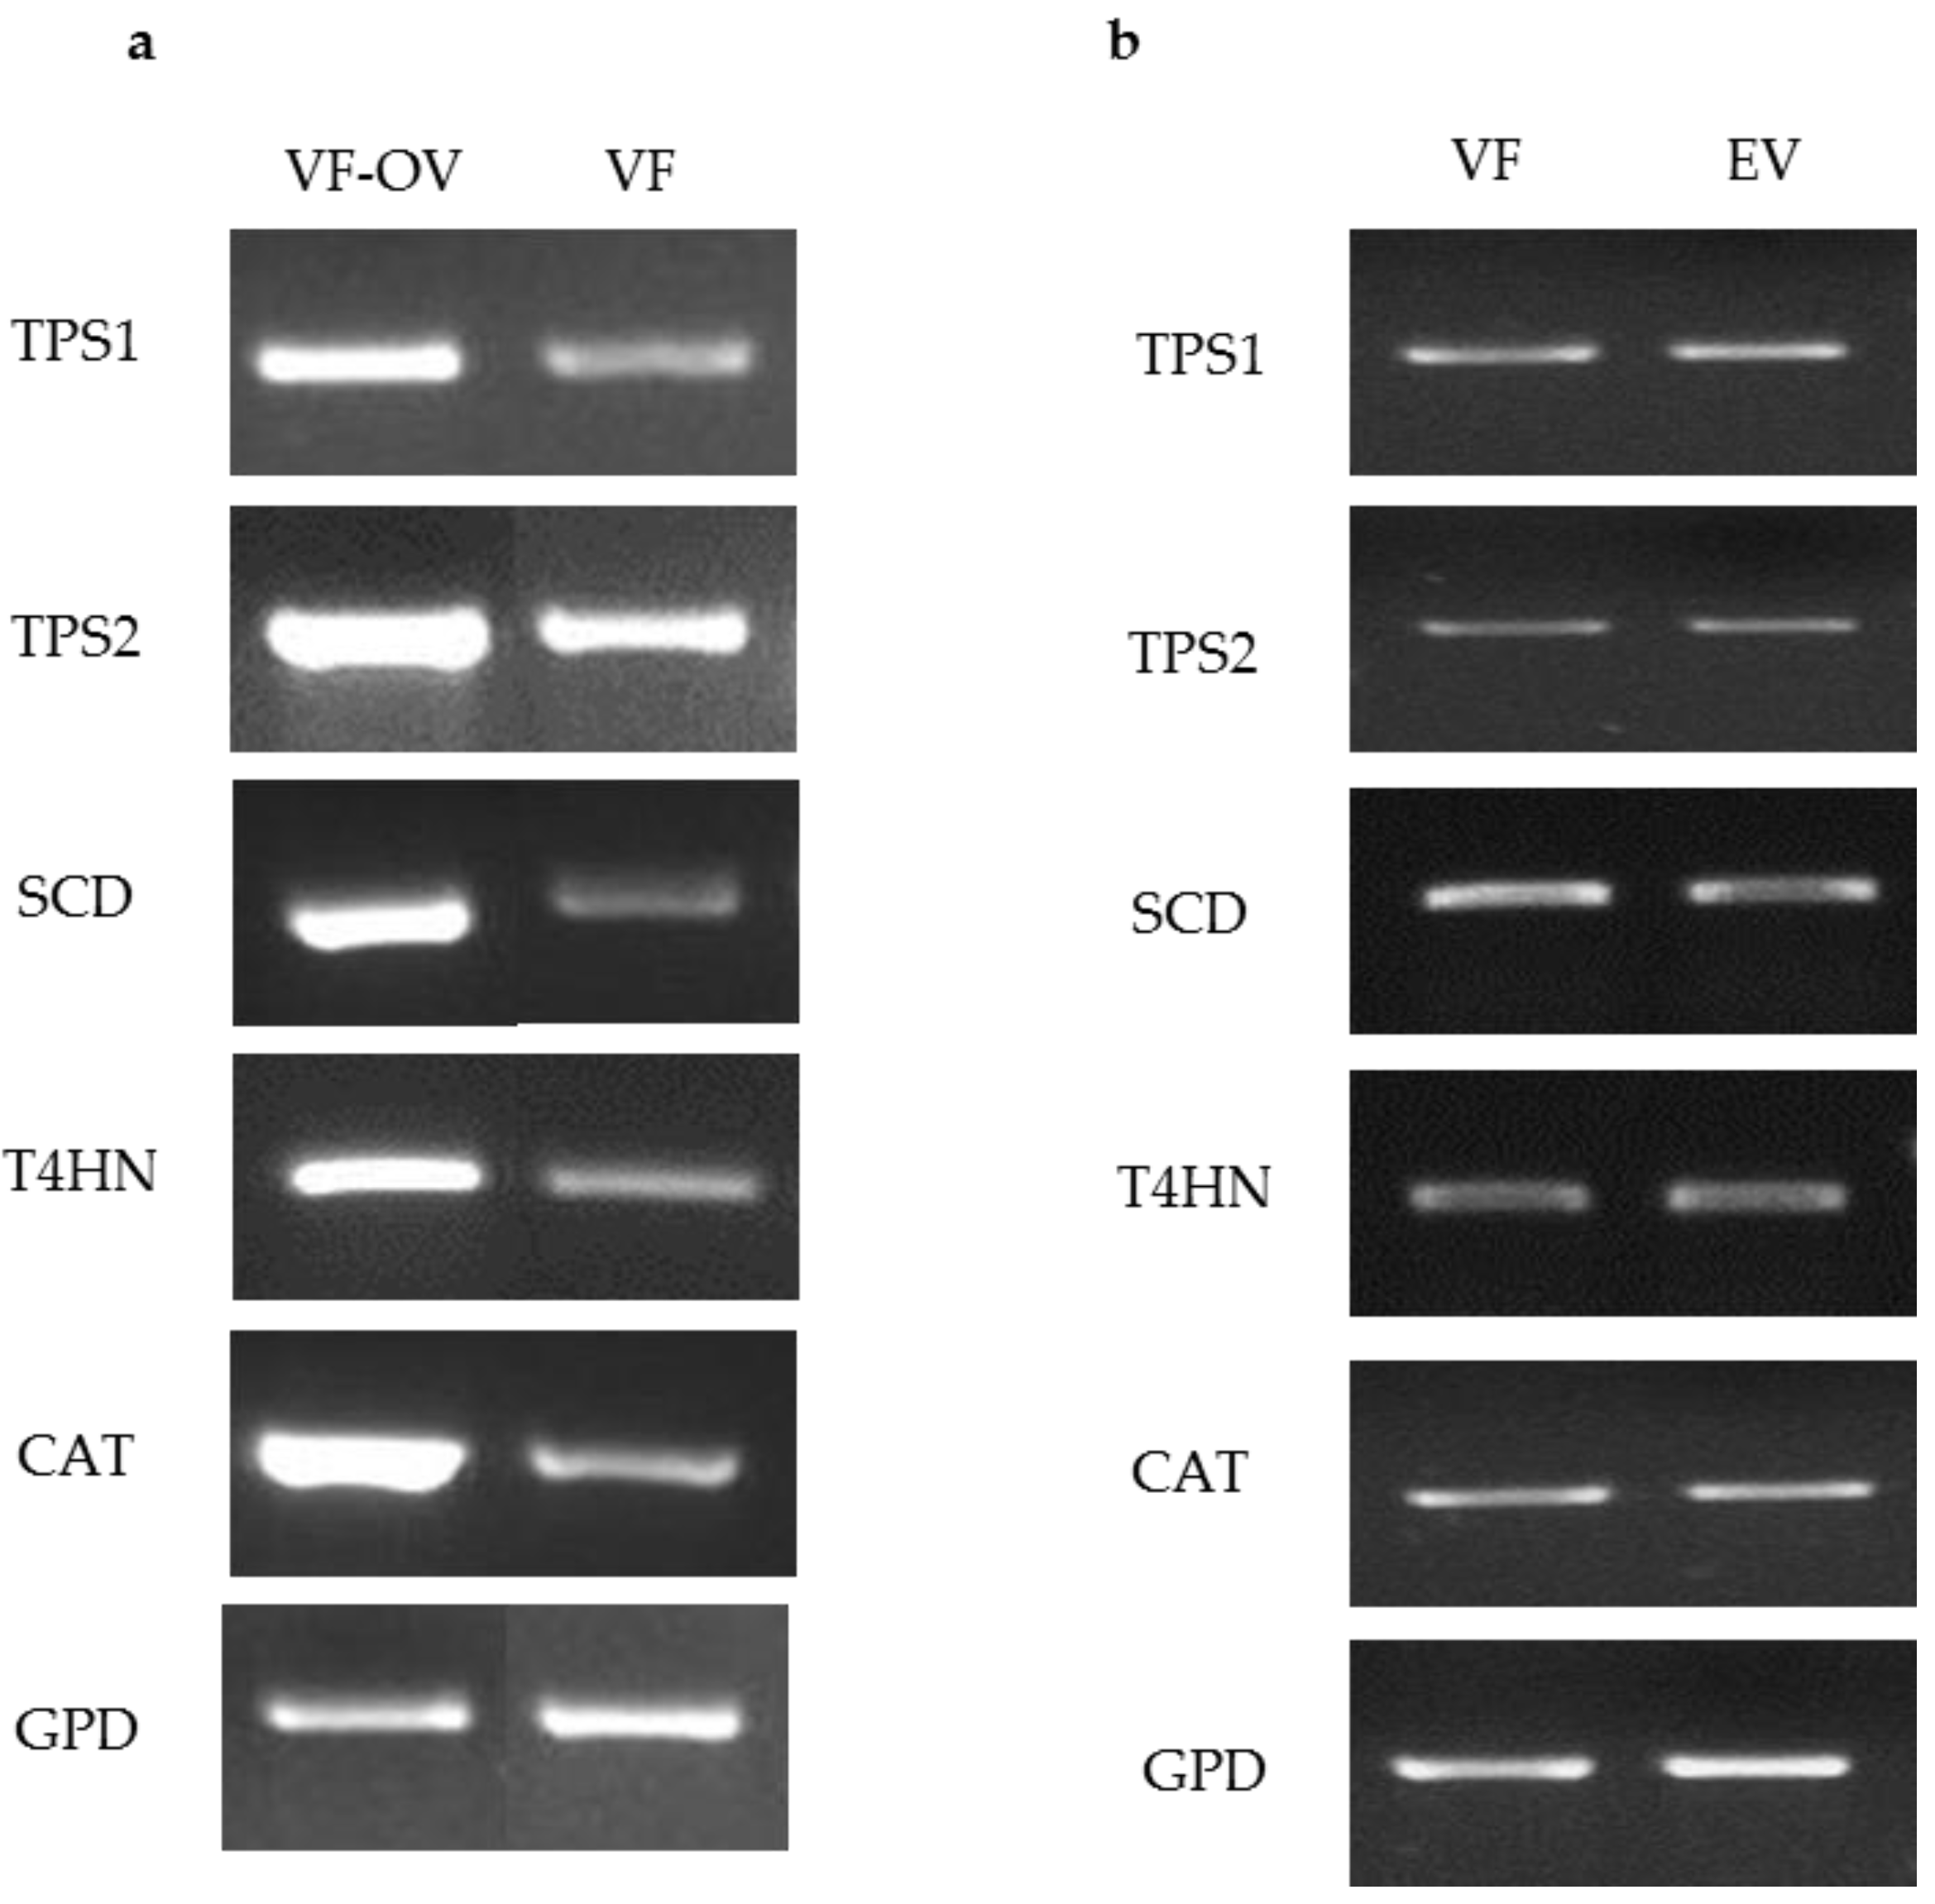
To test the ability of the ToxA promoter to drive expression of target genes, pM2Z-fun carrying T4HN, SCD, TPS1, TPS2, or CAT was independently introduced into the VF strain, and the transformants were designated as VF-T4HN, VF-SCD, VF-TPS1, VF-TPS2, or VF-CAT, respectively. Similarly, the respective RNAi vectors were individually introduced into the AN strain to generate transformants AN-T4HN, AN-SCD, AN-TPS1, AN-TPS2, or AN-CAT. To screen for the presence of transgenes in the transformants, 20 zeocin-resistant colonies were randomly picked to PCR for amplification with the ToxA forward primer and the appropriate gene-specific reverse primer. More than 80% of these zeocin-resistant colonies showed amplification products consistent with the insertion of the respective vector (data not shown). Semi-quantitative RT-PCR of target genes overexpression in virus-free C. protuberata (VF transformants) showed higher expression of the target genes compared to the control VF strain (Figure 2a). In addition, transformation of the VF strain with empty pM2Z-fun showed no changes in the expression of target genes (Figure 2b). The GPD gene that was used as an internal control showed no changes in gene expression between transformed and non-transformed strains (Figure 2a,b). On the other hand, introduction of each of the RNAi vectors into the AN strain resulted in lower expression of each of the target genes compared to expression in the wild-type AN strain (Figure 3a). Higher expression of target genes in the VF transformants was due to the ability of the ToxA promoter to successfully drive the expression of these heterologous genes in VF C. protuberata. The downregulation of each specific target gene in AN occurred due to suppression of expression by the RNAi vector. Similarly, transformation of the AN strain with empty pM2Z-fun showed no changes in the expression of target genes (Figure 3b).
3.3. Melanin Analysis
After 14 days of incubation at 26 °C, the PDA plates containing VF-SCD (overexpression) were darker than the control VF and VF-T4HN (overexpression) plates (Figure 4a), which suggests higher levels of melanin were synthesized by VF-SCD than other strain/vector combinations. Similarly, the five-day-old liquid culture of VF-SCD was also darker than that of VF and VF-T4HN. Quantitative measurements of the melanin contents of the three strains matched the observed phenotypes: melanin content in VF-SCD was significantly (five-fold) higher than in the VF strain (Figure 4c). Unlike overexpression of SCD, overexpression of T4HN has no significant effect on melanin content (Figure 4c). Both AN-SCD and AN-T4HN produced yellow-brown mycelia on PDA plates and in liquid culture, while the AN strain produced dark brown mycelia (Figure 4b). The melanin concentration of the AN strain was significantly higher than those of both the AN-T4HN and AN-SCD strains (Figure 4d). Similar to overexpression data, downregulation of T4HN had little effect on melanin biosynthesis in C. protuberata.
3.4. Trehalose Assay
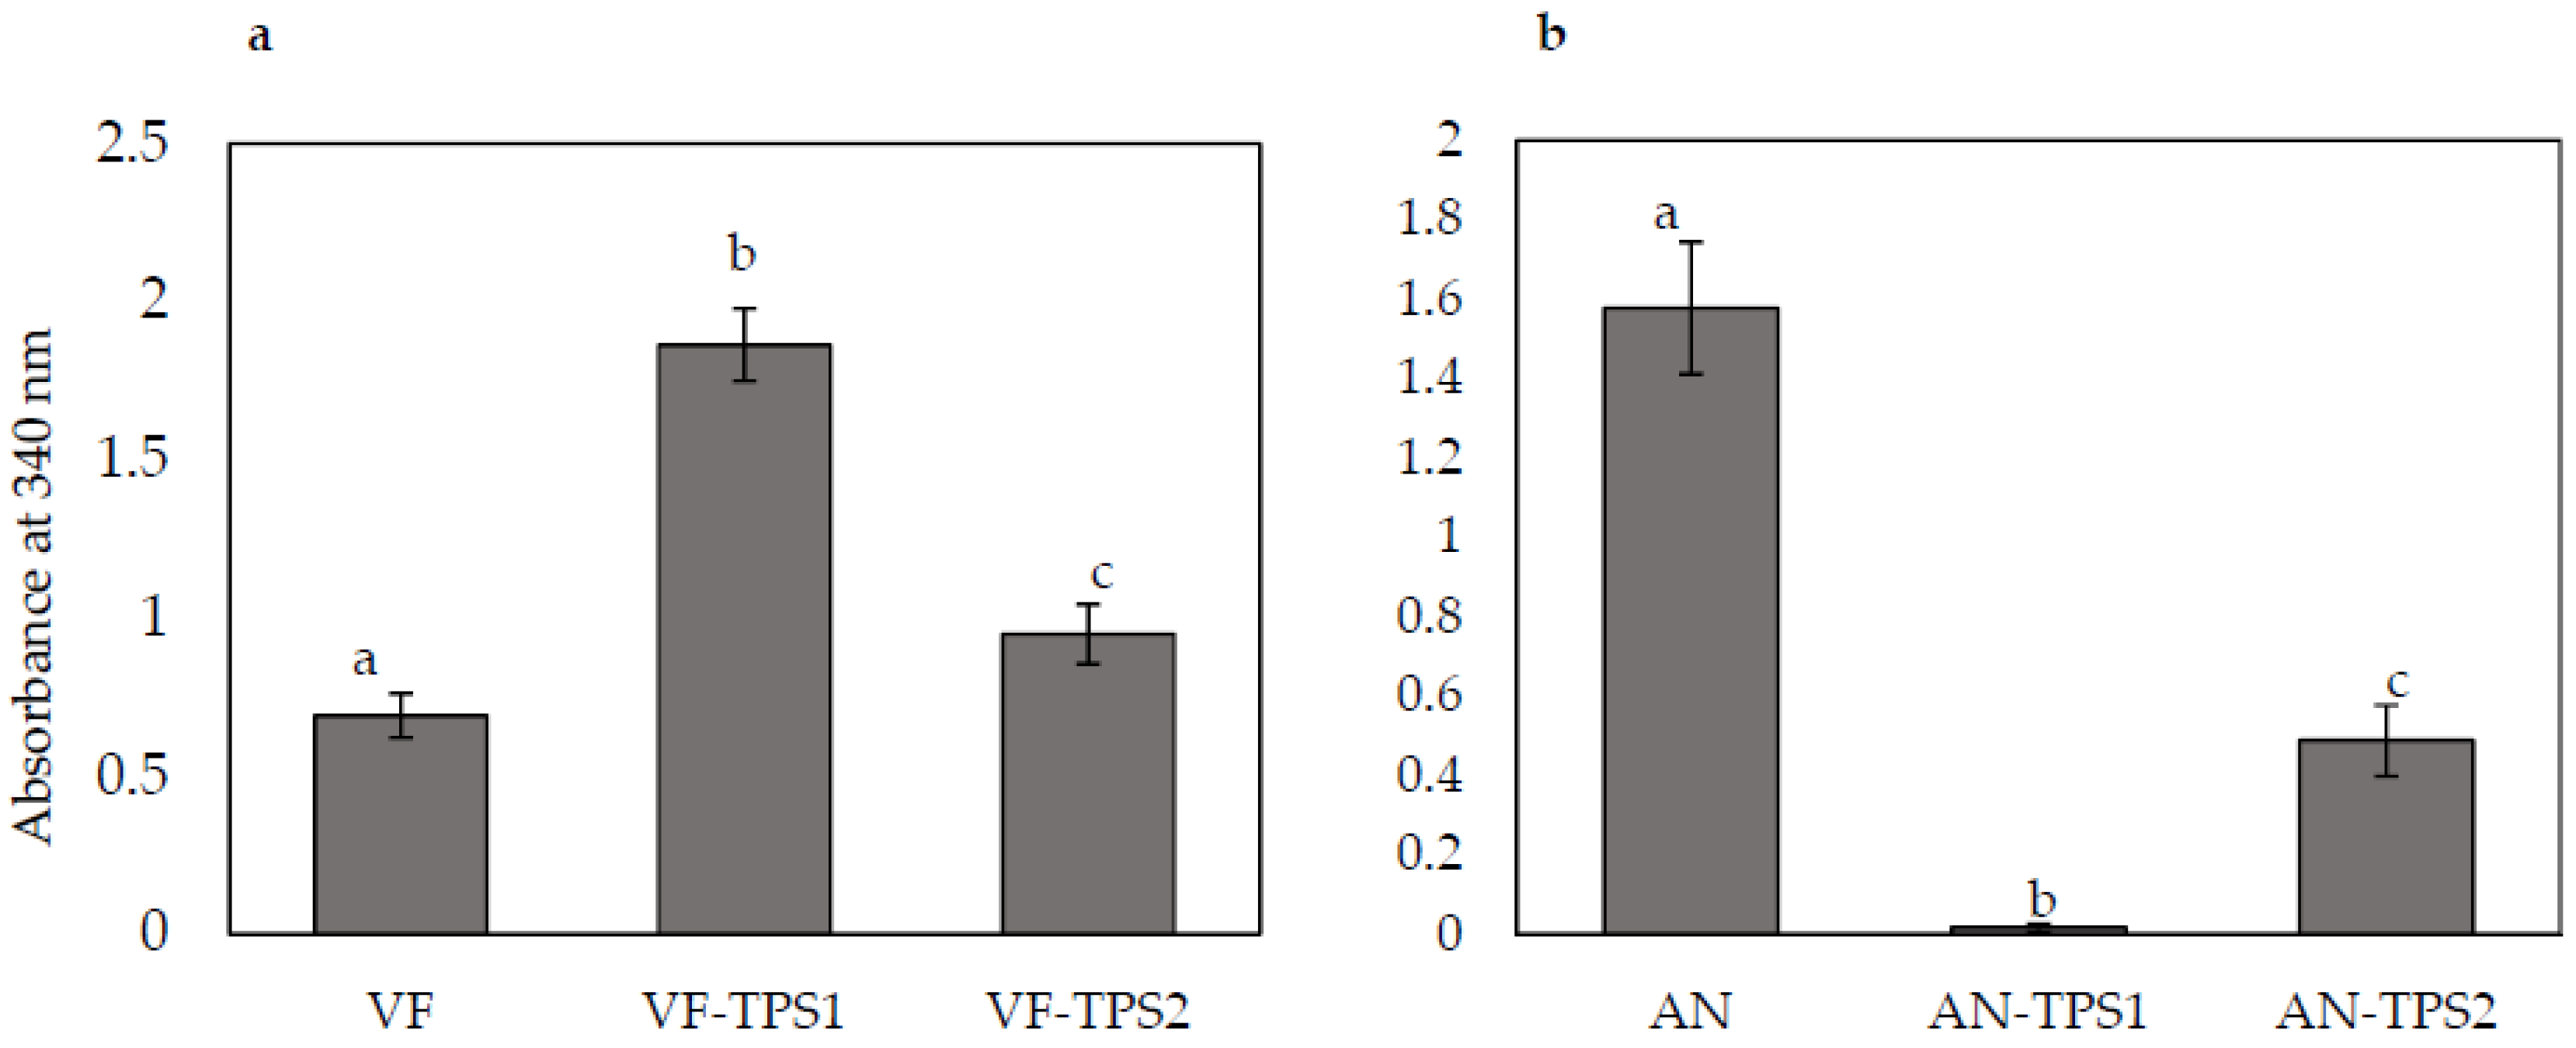
To investigate whether TPS1 and TPS2 overexpression and downregulation strains were associated with any changes in trehalose content, we assayed control and transformed strains for trehalose content. Nicotinamide-adenine dinucleotide phosphate (NADPH), a product of trehalose breakdown, can be measured as an increase in absorbance at 340 nm. Overexpression of the TPS1 and TPS2 genes in the VF strain significantly increased trehalose accumulation. TPS1 overexpression doubled trehalose content and TPS2 overexpression increased trehalose accumulation by 30% compared to the control VF strain (Figure 5a). AN strains with downregulated expression of TPS1 and TPS2 showed significantly decreased trehalose accumulation compared to the control AN strain (Figure 5b). Downregulation of TPS1 expression had a greater effect on trehalose accumulation than did TPS2 downregulation.
3.5. Catalase Assay
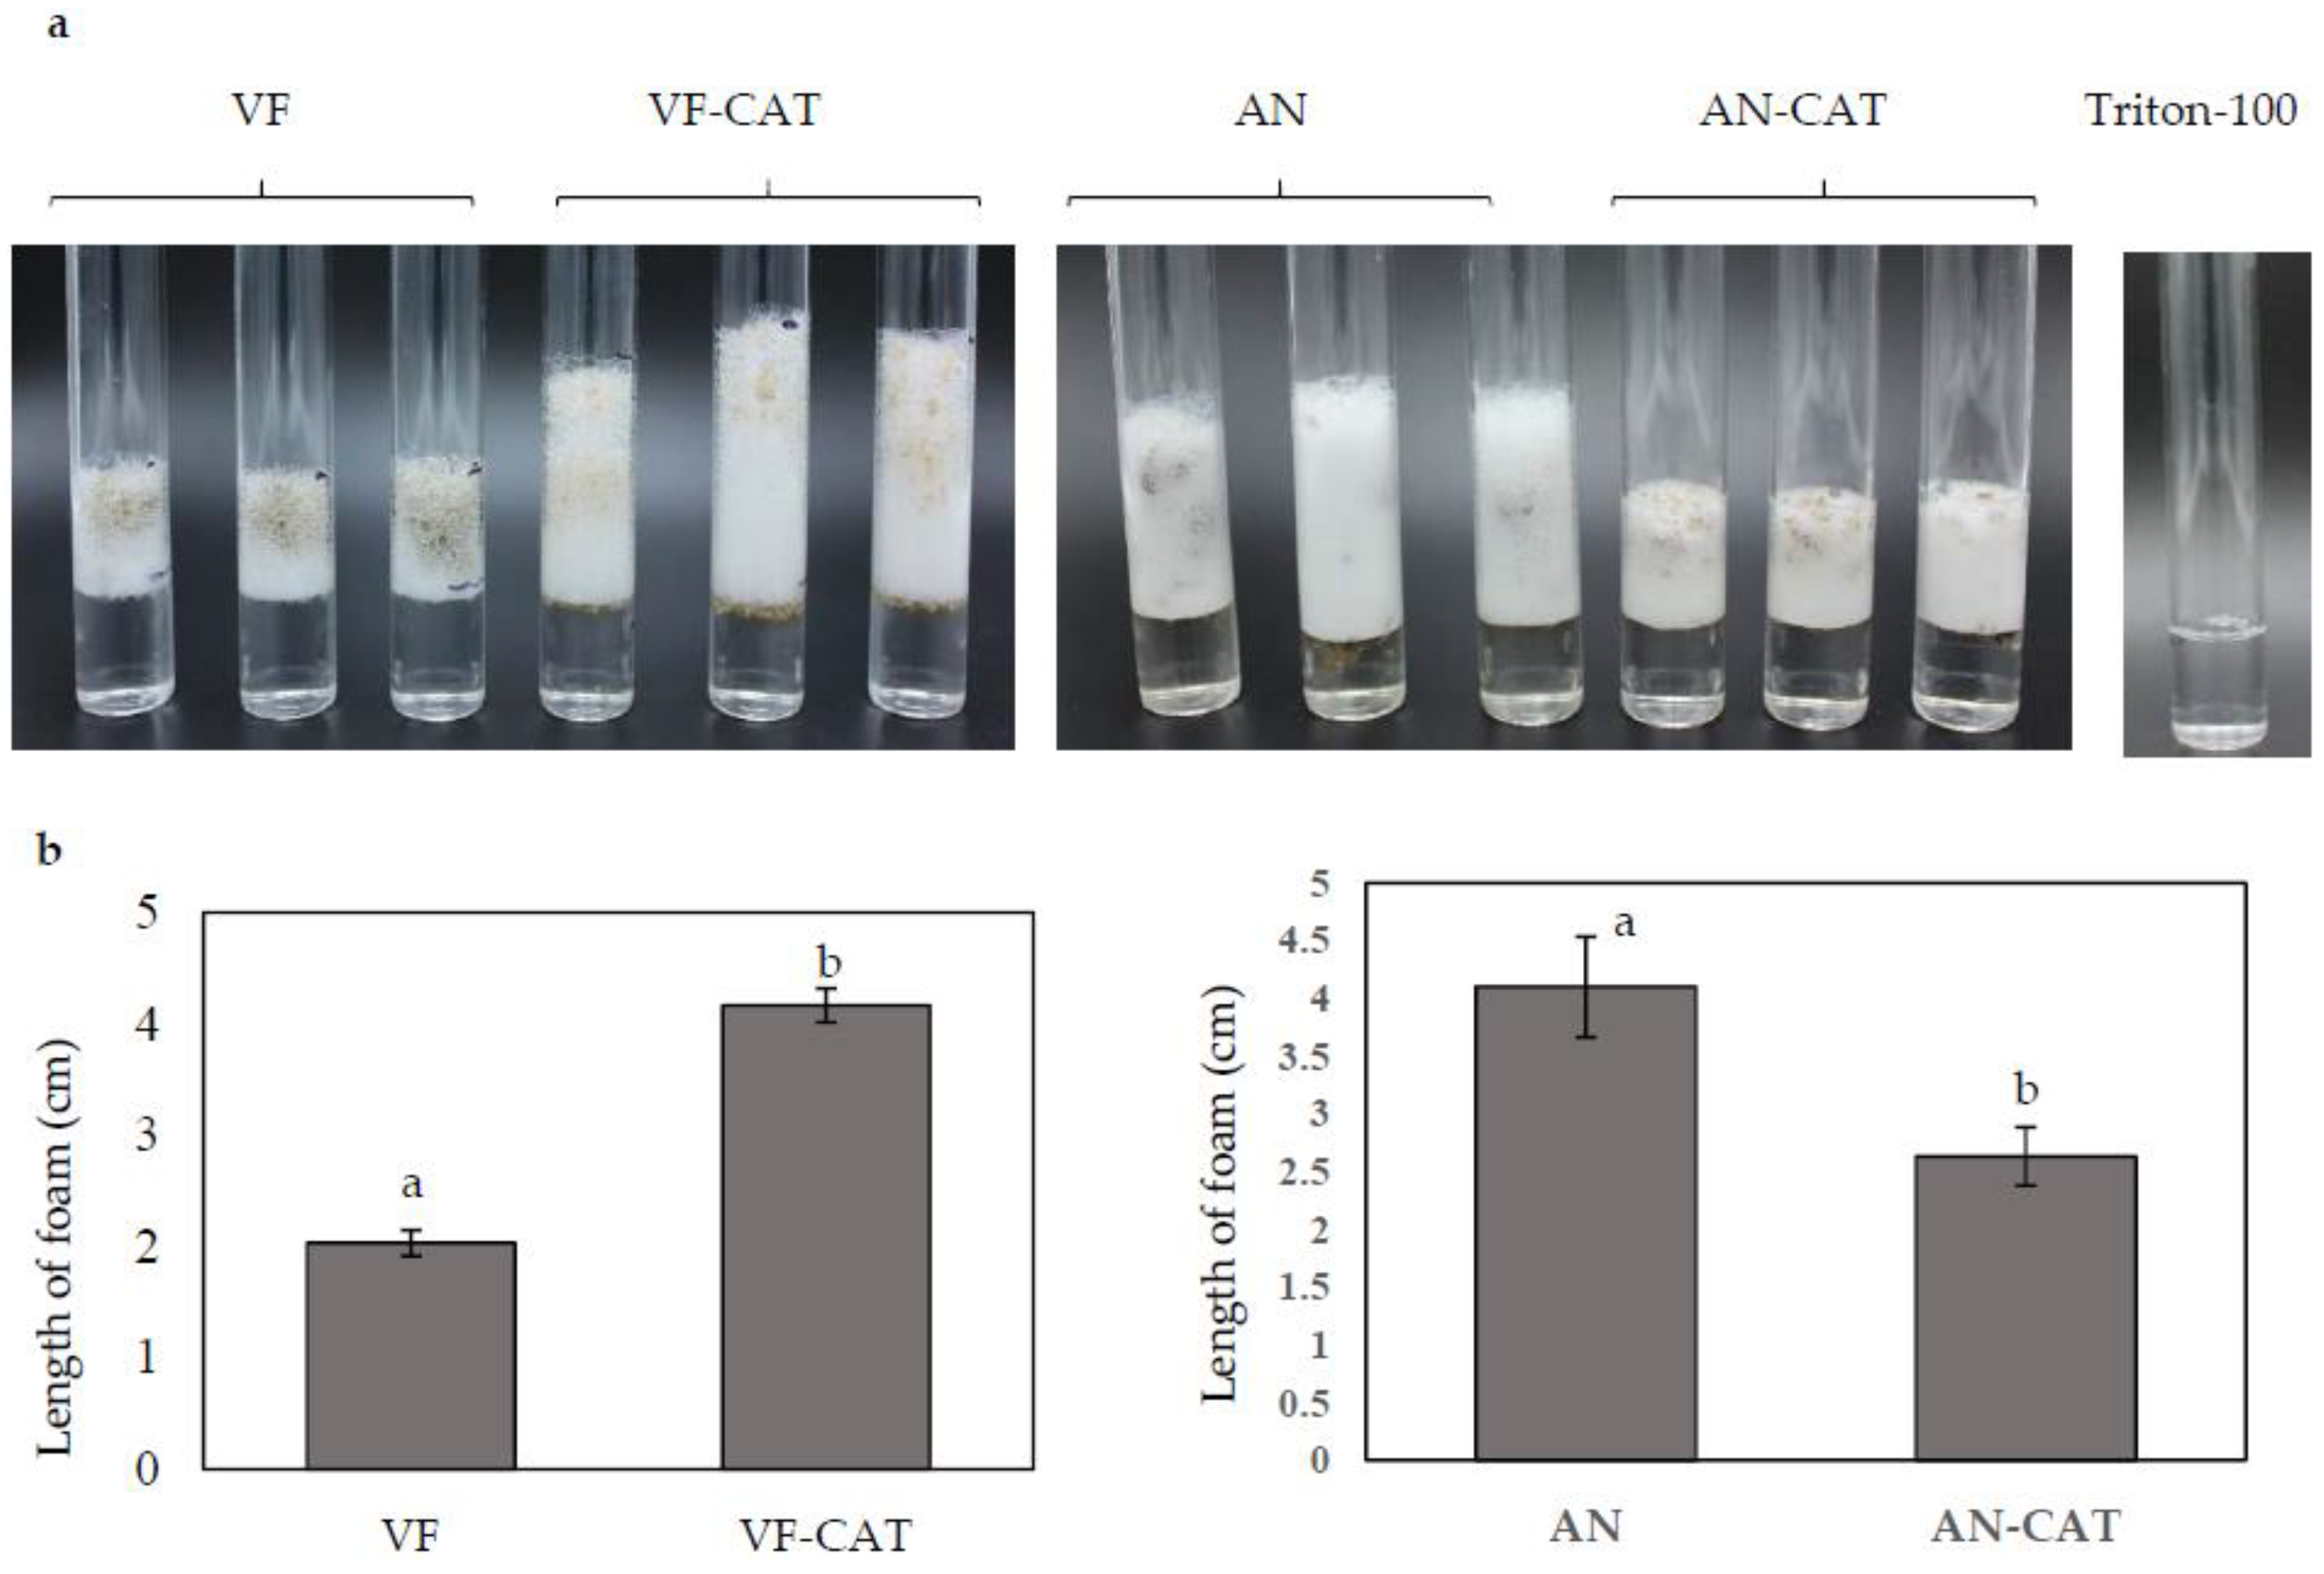
Catalase activity was assayed in the overexpression and downregulation strains carrying the CAT gene by measuring the trapped O2 generated upon reaction of catalase with H2O2. Stable trapped oxygen was measured as the depth of bubbles formed 5 min after starting the reaction. The VF-CAT strain formed an average of 4.2 cm O2 foam compared to an average of 2 cm foam in the VF strain (Figure 6a,b). The Tritron-100 with H2O2 control without catalase showed no O2 production. This data suggested that overexpression of CAT directly increased catalase activity in C. protuberata. When the H2O2 plus Triton-100 was added to the AN or AN-CAT strains, the AN-CAT strains generated about 35% less O2 gas than did the AN strain (Figure 6a,b). These results indicate that catalase/peroxidase activity in AN-CAT was lower than that in the AN strain. Downregulation of CAT decreased catalase/peroxidase activity in C. protuberata.
4. Discussion
A new fungal expression vector (pM2Z-fun) was generated for the expression of genes of interest under control of the ToxA promoter with zeocin resistance as a selectable marker for transformed fungi. This simple expression vector successfully expressed targeted genes in C. protuberata. The pM2Z-fun vector functions well in both overexpression and RNAi lines. Semi-quantitative RT-PCR confirmed that the targeted genes were expressed at higher levels in all of the overexpression VF strains than in the control VF strain. In most fungal gene studies, knockouts are the main method that is used to analyze gene function [43,44]. Instead of knocking out the target genes, we used RNAi technology to downregulate the expression of specific target genes. Semi-quantitative RT-PCR results showed that the expression of the targeted genes was indeed reduced by introducing the RNAi vector carrying TPS1, TPS2, SCD, T4HN, or CAT into AN strain. Some metabolites in C. protuberata—such as melanin, trehalose, and catalase—may have important functions in fungal thermotolerance [2]. The biosynthesis of these compounds was affected by changing the expression of target genes affecting their synthesis in C. protuberata.
The overexpression of the SCD gene in VF-SCD and the T4HN gene in VF-T4HN was higher than in VF. Unlike the expression of SCD, which yielded a significant increase in melanin synthesis, the overexpression of T4HN resulted in slightly reduced synthesis of melanin. However, downregulation of either SCD or T4HN caused significant decreases in melanin accumulation. In the melanin synthesis pathway, 1,3,6,8-tetrahydroxynaphthalene reductase reduces 1,3,6,8-tetrahydroxynaphthalene to scytalone, and SCD catalyzes the dehydration of scytalone to 1,3,8-trihydroxynaphthalene (T3HN) and vermelone to dihydroxynaphthalene (D2HN) [45,46,47]. However, T4HN can also be oxidized to flaviolin [46]. In AN-T4HN, melanin concentration was low because of the lack of T4HN reductase, which could result in accumulation of flaviolin instead of scytalone. It seems that overexpression of the T4HN reductase gene had a negative effect on melanin synthesis in C. protuberata. Extra T4HN reductase might result in accumulation of scytalone, which would require increased SCD dehydratase activity to dehydrate scytalone to T3HN. Limitation of the SCD dehydratase activity in fungus would mean that less vermelone could be dehydrated to D2HN, which would then be oxidized to melanin. In VF-T4HN, lower accumulation of melanin might be caused by a lack of SCD scytalone dehydratase to produce sufficient D2HN.
Fungal trehalose biosynthesis is catalyzed by TPS1 and TPS2, two main enzymes in the trehalose synthase complex [48]. The TPS1 subunit catalyzes the formation of trehalose 6-phosphate (T6P), which is then dephosphorylated to trehalose by the TPS2 subunit [49]. We found that overexpression of TPS1 and TPS2 resulted in increased accumulation of trehalose in C. protuberata, while downregulation of TPS1 and TPS2 expression diminished trehalose accumulation. Similar results have been reported in yeast and other fungi [30,50,51]. Furthermore, T6P mediates TPS1 to regulate sugar influx which can relate to trehalose synthesis. Up- or downregulation of the TPS1 gene might directly cause increases or decreases of the abundance of T6P as a substrate for TPS2 to synthesize trehalose. However, downregulation of expression of the TPS2 gene leads to the accumulation of T6P instead of trehalose.
H2O2 generated within cells could be detoxified by CAT or other enzymes. H2O2 can permeate cells directly; therefore, a reaction between H2O2 and catalase can be observed immediately upon addition of H2O2 to fungus. In the catalase assay, the depth of O2 foam indicated the relative activity of catalase in each fungal strain/CAT combination. Overexpression of the CAT gene in the VF strain resulted in twice the catalase activity of the wild-type VF fungus. On the other hand, downregulation of CAT gene expression in the AN strain leads to lower catalase activity. Similar results have been observed in Magnaporthe oryzae, where disruption of the CAT gene (CPXB in M. oryzae) significantly diminishes catalase activity [52], which is subject to transcriptional control.
In summary, we have generated a simple expression vector, pM2Z-fun, from which expression of a cloned gene is driven by the ToxA promoter. We showed that this newly synthesized expression vector could be used to overexpress or downregulate five C. protuberata genes that might be involved in the control of the plant, fungus, and virus three-way symbiosis. pM2Z-fun could also be useful for molecular genetic studies in other Ascomycota fungi.
Author Contributions
C.L. designed and conducted the experiments and wrote the text of the manuscript. B.C. conducted some of the experiments and edited the text. M.M. helped with experimental design and finalized the manuscript.
Acknowledgments
This project was supported by a grant from the National Science Foundation IOS program (NSF-1354050).
Conflicts of Interest
The authors declare no conflict of interest.
References
- Márquez, L.M.; Redman, R.S.; Rodriguez, R.J.; Roossinck, M.J. A virus in a fungus in a plant: Three-way symbiosis required for thermal tolerance. Science 2007, 315, 513–515. [Google Scholar] [CrossRef] [PubMed]
- Morsy, M.R.; Oswald, J.; He, J.; Tang, Y.; Roossinck, M.J. Teasing apart a three-way symbiosis: Transcriptome analyses of Curvularia protuberata in response to viral infection and heat stress. Biochem. Biophys. Res. Commun. 2010, 401, 225–230. [Google Scholar] [CrossRef] [PubMed]
- Andrie, R.M.; Martinez, J.P.; Ciuffetti, L.M. Development of ToxA and ToxB promoter-driven fluorescent protein expression vectors for use in filamentous ascomycetes. Mycologia 2005, 97, 1152–1161. [Google Scholar] [CrossRef] [PubMed]
- Lorang, J.M.; Tuori, R.P.; Martinez, J.P.; Sawyer, T.L.; Redman, R.S.; Rollins, J.A.; Wolpert, T.J.; Johnson, K.B.; Rodriguez, R.J.; Dickman, M.B.; et al. Green fluorescent protein is lighting up fungal biology. Appl. Environ. Microbiol. 2001, 67, 1987–1994. [Google Scholar] [PubMed]
- De Silva, A.P.; Bolton, M.D.; Nelson, B.D. Transformation of Sclerotinia sclerotiorum with the green fluorescent protein gene and fluorescence of hyphae in four inoculated hosts. Plant Pathol. 2009, 58, 487–496. [Google Scholar] [CrossRef]
- Bennett, R.P.; Cox, C.A.; Hoeffler, J.P. Fusion of green fluorescent protein with the Zeocin™-resistance marker allows visual screening and drug selection of transfected eukaryotic Cells. BioTechniques 1998, 24, 478–482. [Google Scholar] [PubMed]
- Pfeifera, T.A.; Hegedusa, D.D.; Grigliattia, T.A.; Theilmannab, D.A. Baculovirus immediate-early promoter-mediated expression of the Zeocin™ resistance gene for use as a dominant selectable marker in Dipteran and Lepidopteran insect cell lines. Gene 1997, 188, 183–190. [Google Scholar] [CrossRef]
- Rasala, B.A.; Chao, S.; Pier, M.; Barrera, D.J.; Mayfield, S.P. Enhanced genetic tools for engineering multigene traits into green algae. PLoS ONE 2014, 9, e94028. [Google Scholar]
- Wilber, A.; Linehan, J.L.; Tian, X.; Woll, P.S.; Morris, J.K.; Belur, L.R.; McIvor, R.S.; Kaufman, D.S. Efficient and stable transgene expression in human embryonic stem cells using transposon-mediated gene transfer. Stem Cells 2007, 25, 2919–2927. [Google Scholar] [PubMed]
- Alderton, A.J.; Burr, I.; Mühlschlegel, F.A.; Tuite, M.F. Zeocin resistance as a dominant selective marker for transformation and targeted gene deletions in Candida glabrata. Mycoses 2006, 49, 445–451. [Google Scholar] [CrossRef] [PubMed]
- Stubbe, J.; Kozarich, J.W. Mechanisms of bleomycin-induced DNA degradation. Chem. Rev. 1987, 87, 1107–1136. [Google Scholar] [CrossRef]
- Van Peer, A.F.; de Bekker, C.; Vinck, A.; Wosten, H.A.; Lugones, L.G. Phleomycin increases transformation efficiency and promotes single integrations in Schizophyllum commune. Appl. Environ. Microbiol. 2009, 75, 1243–1247. [Google Scholar] [PubMed]
- Lanza, A.M.; Kim, D.S.; Alper, H.S. Evaluating the influence of selection markers on obtaining selected pools and stable cell lines in human cells. Biotechnol. J. 2013, 8, 811–821. [Google Scholar] [PubMed]
- Fernandez, C.W.; Koide, R.T. The function of melanin in the ectomycorrhizal fungus Cenococcum geophilum under water stress. Fungal Ecol. 2013, 6, 479–486. [Google Scholar] [CrossRef]
- Gómez, B.L.; Nosanchuk, J.D. Melanin and fungi. Curr. Opin. Infect. Dis. 2003, 16, 91–96. [Google Scholar] [CrossRef] [PubMed]
- Nosanchuk, J.D.; Casadevall, A. Impact of melanin on microbial virulence and clinical resistance to antimicrobial compounds. Antimicrob. Agents Chemother. 2006, 50, 3519–3528. [Google Scholar] [CrossRef] [PubMed]
- Singaravelan, N.; Grishkan, I.; Beharav, A.; Wakamatsu, K.; Ito, S.; Nevo, E. Adaptive melanin response of the soil fungus Aspergillus niger to UV radiation stress at ‘‘Evolution Canyon’’, Mount Carmel, Israel. PLoS ONE 2008, 3, e2993. [Google Scholar]
- Eisenman, H.C.; Casadevall, A. Synthesis and assembly of fungal melanin. Appl. Microbiol. Biotechnol. 2012, 93, 931–940. [Google Scholar] [PubMed]
- Tseng, M.N.; Chung, P.C.; Tzean, S.S. Enhancing the stress tolerance and virulence of an entomopathogen by metabolic engineering of dihydroxynaphthalene melanin biosynthesis genes. Appl. Environ. Microbiol. 2011, 77, 4508–4519. [Google Scholar] [CrossRef] [PubMed]
- Langfelder, K.; Streibel, M.; Jahn, B.; Haase, G.; Brakhage, A.A. Biosynthesis of fungal melanins and their importance for human pathogenic fungi. Fungal Genet. Biol. 2003, 38, 143–158. [Google Scholar] [CrossRef]
- Thompson, J.E.; Fahnestock, S.; Farrall, L.; Liao, D.I.; Valent, B.; Jordan, D.B. The second naphthol reductase of fungal melanin biosynthesis in Magnaporthe grisea: Tetrahydroxynaphthalene reductase. J. Biol. Chem. 2000, 275, 34867–34872. [Google Scholar] [PubMed]
- Tanaka, N.; Haruki, Y.; Ueno, M.; Arase, S.; Kihara, J. Expression of T4HR1, a 1,3,6,8-tetrahydroxynaphthalene reductase gene involved in melanin biosynthesis, is enhanced by near-ultraviolet irradiation in Bipolaris oryzae. Adv. Microbiol. 2015, 5, 166–176. [Google Scholar]
- Elbein, A.D.; Pan, Y.T.; Pastuszak, I.; Carroll, D. New insights on trehalose a multifunctional molecule. Glycobiology 2003, 13, 17R–27R. [Google Scholar] [PubMed]
- Iordachescu, M.; Imai, R. Trehalose biosynthesis in response to abiotic stresses. J. Integr. Plant Biol. 2008, 50, 1223–1229. [Google Scholar] [PubMed]
- Argüelles, J.C. Physiological roles of trehalose in bacteria and yeasts: A comparative analysis. Arch. Microbiol. 2000, 174, 217–224. [Google Scholar] [PubMed]
- Lunn, J.E.; Delorge, I.; Figueroa, C.M.; Van Dijck, P.; Stitt, M. Trehalose metabolism in plants. Plant J. 2014, 79, 544–567. [Google Scholar] [PubMed]
- Nunes, C.; Schluepmann, H.; Delatte, T.L.; Wingler, A.; Silva, A.B.; Fevereiro, P.S.; Jansen, M.; Fiorani, F.; Wiese-Klinkenberg, A.; Paul, M. Regulation of growth by the trehalose pathway: Relationship to temperature and sucrose. Plant Signal. Behav. 2013, 8, e26626. [Google Scholar] [PubMed]
- Paul, M.J.; Primavesi, L.F.; Jhurreea, D.; Zhang, Y. Trehalose metabolism and signaling. Annu. Rev. Plant Biol. 2008, 59, 417–441. [Google Scholar] [CrossRef] [PubMed]
- Avonce, N.; Mendoza-Vargas, A.; Morett, E.; Iturriaga, G. Insights on the evolution of trehalose biosynthesis. BMC Evol. Biol. 2006, 6, 109. [Google Scholar] [CrossRef] [PubMed]
- Doehlemann, G.; Berndt, P.; Hahn, M. Trehalose metabolism is important for heat stress tolerance and spore germination of Botrytis cinerea. Microbiology 2006, 152, 2625–2634. [Google Scholar] [CrossRef] [PubMed]
- Kirkman, H.N.; Gaetani, G.F. Mammalian catalase: A venerable enzyme with new mysteries. TIBS 2007, 32, 44–50. [Google Scholar] [CrossRef] [PubMed]
- Mhamdi, A.; Noctor, G.; Baker, A. Plant catalases: Peroxisomal redox guardians. Arch. Biochem. Biophys. 2012, 525, 181–194. [Google Scholar] [CrossRef] [PubMed]
- Chakravarty, D.; Banerjee, M.; Bihani, S.C.; Ballal, A. A salt-Inducible Mn-catalase (KatB) protects cyanobacterium from oxidative stress. Plant Physiol. 2016, 170, 761–773. [Google Scholar] [CrossRef] [PubMed]
- Singhal, A.; Morris, V.B.; Labhasetwar, V.; Ghorpade, A. Nanoparticle-mediated catalase delivery protects human neurons from oxidative stress. Cell Death Dis. 2013, 4, e903. [Google Scholar] [PubMed]
- Vighi, I.L.; Benitez, L.C.; do Amaral, M.N.; Auler, P.A.; Moraes, G.P.; Rodrigues, G.S.; da Maia, L.C.; Pinto, L.S.; Braga, E.J. Changes in gene expression and catalase activity in Oryza sativa L. under abiotic stress. Genet. Mol. Res. 2016, 15, 1–15. [Google Scholar]
- Huang, Z.; Ali, S.; Ren, S. Catalase production influences germination, stress tolerance and virulence of Lecanicillium muscarium conidia. Biocontrol Sci. Technol. 2012, 22, 249–260. [Google Scholar]
- Hernandez, C.E.M.; Guerrero, I.E.P.; Hernandez, G.A.G. Catalase overexpression reduces the germination time and increases the pathogenicity of the fungus Metarhizium anisopliae. Appl. Microbiol. Biotechnol. 2010, 87, 1033–1044. [Google Scholar]
- Young, C.; Itoh, Y.; Johnson, R.; Garthwaite, I.; Miles, C.O.; Munday-Finch, S.C.; Scott, B. Paxilline-negative mutants of Penicillium paxilli generated by heterologous and homologous plasmid integration. Curr. Genet. 1998, 33, 368–377. [Google Scholar] [CrossRef] [PubMed]
- Itoh, Y.; Johnson, R.; Scott, B. Integrative transformation of the mycotoxin-producing fungus, Penicillium paxilli. Curr. Genet. 1994, 25, 508–513. [Google Scholar] [PubMed]
- Fernandes, C.; Prados-Rosales, R.; Silva, B.M.; Nakouzi-Naranjo, A.; Zuzarte, M.; Chatterjee, S.; Stark, R.E.; Casadevall, A.; Goncalves, T. Activation of melanin synthesis in Alternaria infectoria by antifungal drugs. Antimicrob. Agents Chemother. 2016, 60, 1646–1655. [Google Scholar]
- Benaroudj, N.; Lee, D.H.; Goldberg, A.L. Trehalose accumulation during cellular stress protects cells and cellular proteins from damage by oxygen radicals. J. Biol. Chem. 2001, 276, 24261–24267. [Google Scholar] [PubMed]
- Iwase, T.; Tajima, A.; Sugimoto, S.; Okuda, K.; Hironaka, I.; Kamata, Y.; Takada, K.; Mizunoe, Y. A simple assay for measuring catalase activity: A visual approach. Sci. Rep. 2013, 3, 3081. [Google Scholar] [CrossRef] [PubMed]
- Lu, S.; Shen, X.; Chen, B. Development of an efficient vector system for gene knock-out and near in-cis gene complementation in the sugarcane smut fungus. Sci. Rep. 2017, 7, 3113. [Google Scholar] [PubMed]
- Saitoh, K.-I.; Nishimura, M.; Kubo, Y.; Hayashi, N.; Minami, E.; Nishizawa, Y. Construction of a binary vector for knockout and expression analysis of Rice Blast Fungus genes. Biosci. Biotechnol. Biochem. 2008, 72, 1380–1383. [Google Scholar] [CrossRef] [PubMed]
- Fetzner, R.; Seither, K.; Wenderoth, M.; Herr, A.; Fischer, R. Alternaria alternata transcription factor CmrA controls melanization and spore development. Microbiology 2014, 160, 1845–1854. [Google Scholar] [PubMed]
- Wheeler, M.H.; Abramczyk, D.; Puckhaber, L.S.; Naruse, M.; Ebizuka, Y.; Fujii, I.; Szaniszlo, P.J. New biosynthetic step in the melanin pathway of Wangiella (Exophiala) dermatitidis: Evidence for 2-acetyl-1,3,6,8-Tetrahydroxynaphthalene as a novel precursor. Eukaryot. Cell 2008, 7, 1699–1711. [Google Scholar] [CrossRef] [PubMed]
- Eliahu, N.; Igbaria, A.; Rose, M.S.; Horwitz, B.A.; Lev, S. Melanin biosynthesis in the maize pathogen Cochliobolus heterostrophus depends on two mitogen-activated protein kinases, Chk1 and Mps1, and the transcription factor Cmr1. Eukaryot. Cell 2007, 6, 421–429. [Google Scholar] [CrossRef] [PubMed]
- Gancedo, C.; Flores, C. The importance of a functional trehalose biosynthetic pathway for the life of yeasts and fungi. FEMS Yeast Res. 2004, 4, 351–359. [Google Scholar] [PubMed]
- Van Vaeck, C.; Wear, S.; Van Dijck, P.; Thevelein, M. Analysis and modification of trehalose 6-phosphate levels in the yeast Saccharomyces cerevisiae with the use of Bacillus subtilis phosphotrehalase. Biochem. J. 2001, 353, 157–162. [Google Scholar] [CrossRef] [PubMed]
- Mahmud, S.A.; Nagahisa, K.; Hirasawa, T.; Yoshikawa, K.; Ashitani, K.; Shimizu, H. Effect of trehalose accumulation on response to saline stress in Saccharomyces cerevisiae. Yeast 2009, 26, 17–30. [Google Scholar] [CrossRef] [PubMed] [Green Version]
- De Virgilio, C.; Bürckert, N.; Bell, W.; Jenö, P.; Boller, T.; Wiemken, A. Disruption of TPS2, the gene encoding the 100-kDa subunit of the trehalose-6-phosphate synthase/phosphatase complex in Saccharomyces cerevisiae, causes accumulation of trehalose-6-phosphate and loss of trehalose-6-phosphate phosphatase activity. Eur. J. Biochem. 1993, 212, 315–323. [Google Scholar] [CrossRef] [PubMed]
- Tanabe, S.; Ishii-Minami, N.; Saitoh, K.; Otake, Y.; Kaku, H.; Shibuya, N.; Nishizawa, Y.; Minami, E. The role of catalase-peroxidase secreted by Magnaporthe oryzae during early infection of rice Cells. Mol. Plant Microbe Interact. 2011, 24, 163–171. [Google Scholar] [CrossRef] [PubMed]
Figure 1.
Construction of fungal vector. (a) Map of pM2Z-fun with zeocin resistance gene and ToxA promoter to express fungal genes of interest; (b) Restriction digestions using EcoRI to confirm the presence of RNAi constructs insertion. M = 1-kb DNA ladder.
Figure 1.
Construction of fungal vector. (a) Map of pM2Z-fun with zeocin resistance gene and ToxA promoter to express fungal genes of interest; (b) Restriction digestions using EcoRI to confirm the presence of RNAi constructs insertion. M = 1-kb DNA ladder.

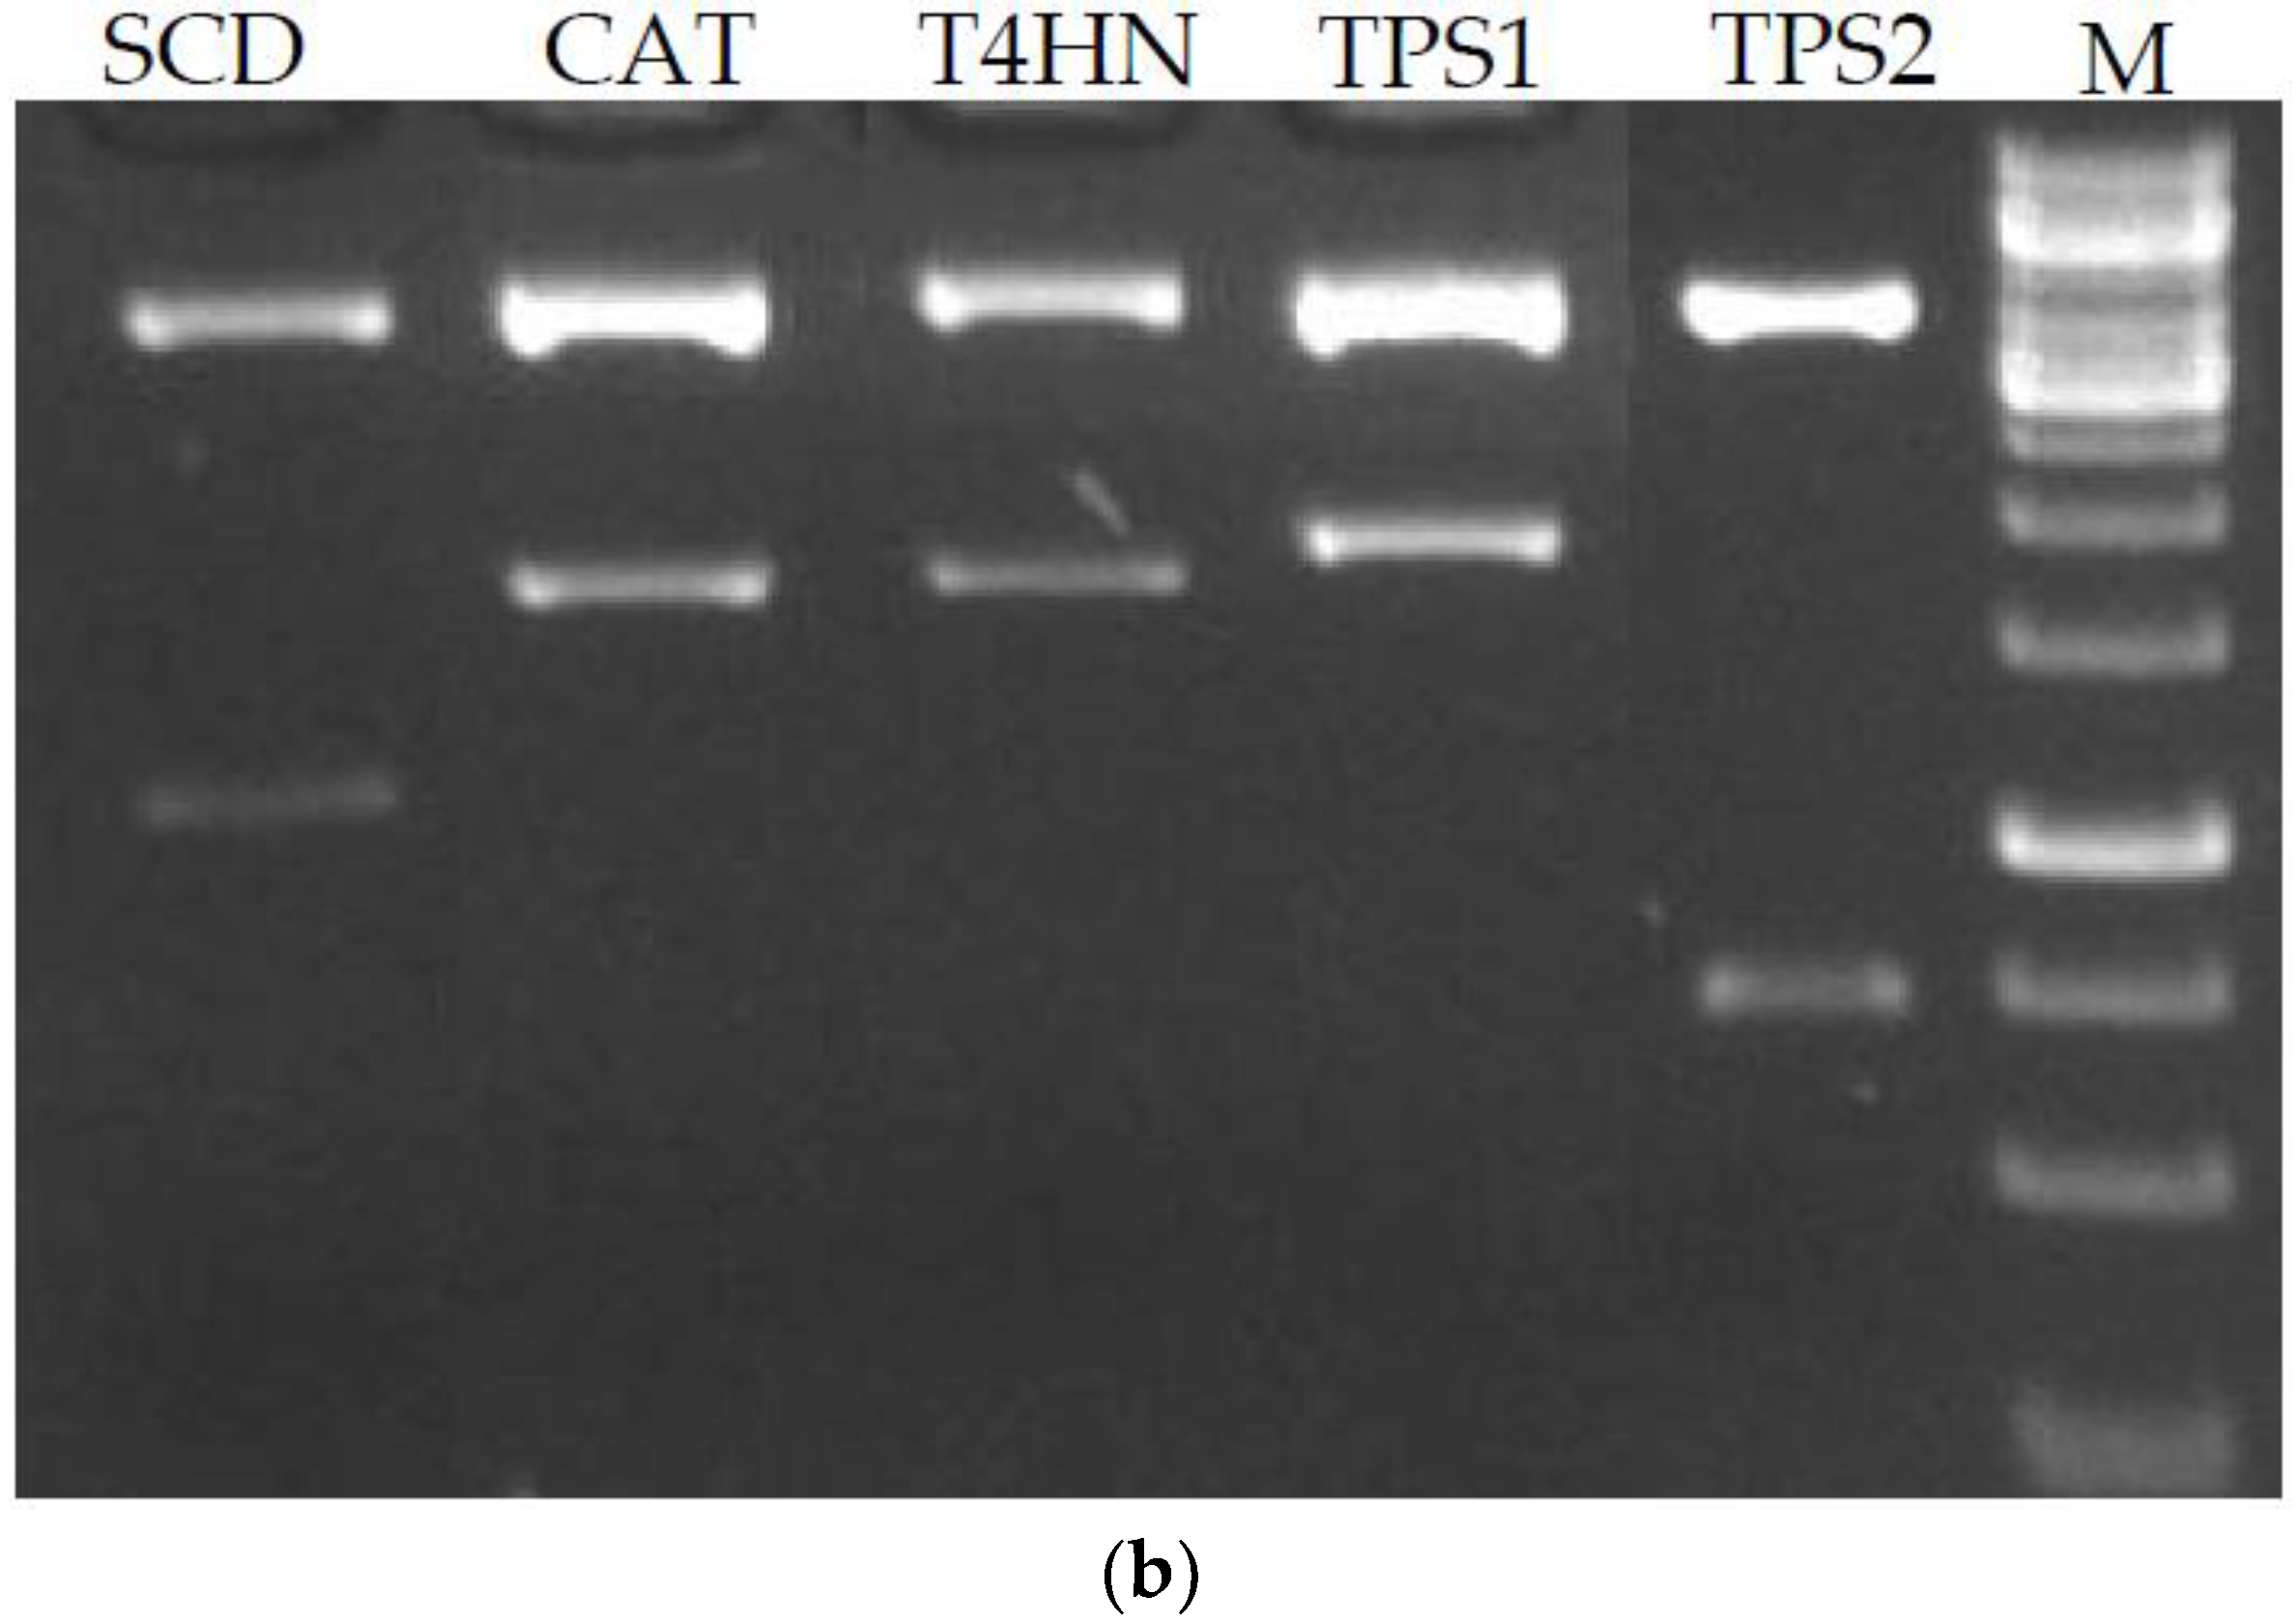
Figure 2.
Semi quantitative RT-PCR of target genes overexpression in virus free Curvularia protuberata (VF transformants), VF strain and VF transformed with the empty vector. (a) The expression levels of target genes were higher in VF (VF-OV) than the control untransformed VF. Showing a representative RT-PCR of gyceradehyde-3-phosphate dehydrogenase (GPD) that was used as an internal control; (b) Generally, there were no changes in the expression of target genes when the VF strain was transformed with the empty vector (EV), GPD was also used as internal control.

Figure 3.
Semi-quantitative RT-PCR of target genes downregulation in C. protuberata AN strain (AN-KO), AN strain control and AN strain transformed with empty vector. (a) The expression levels of target genes in AN downregulation were lower than the control untransformed AN strain. Showing a representative RT-PCR of gyceradehyde-3-phosphate dehydrogenase (GPD) that was used as an internal control; (b) There were no changes in the expression of target genes when the AN strain was transformed with the empty vector (EV), GPD, again, was used as an internal control.
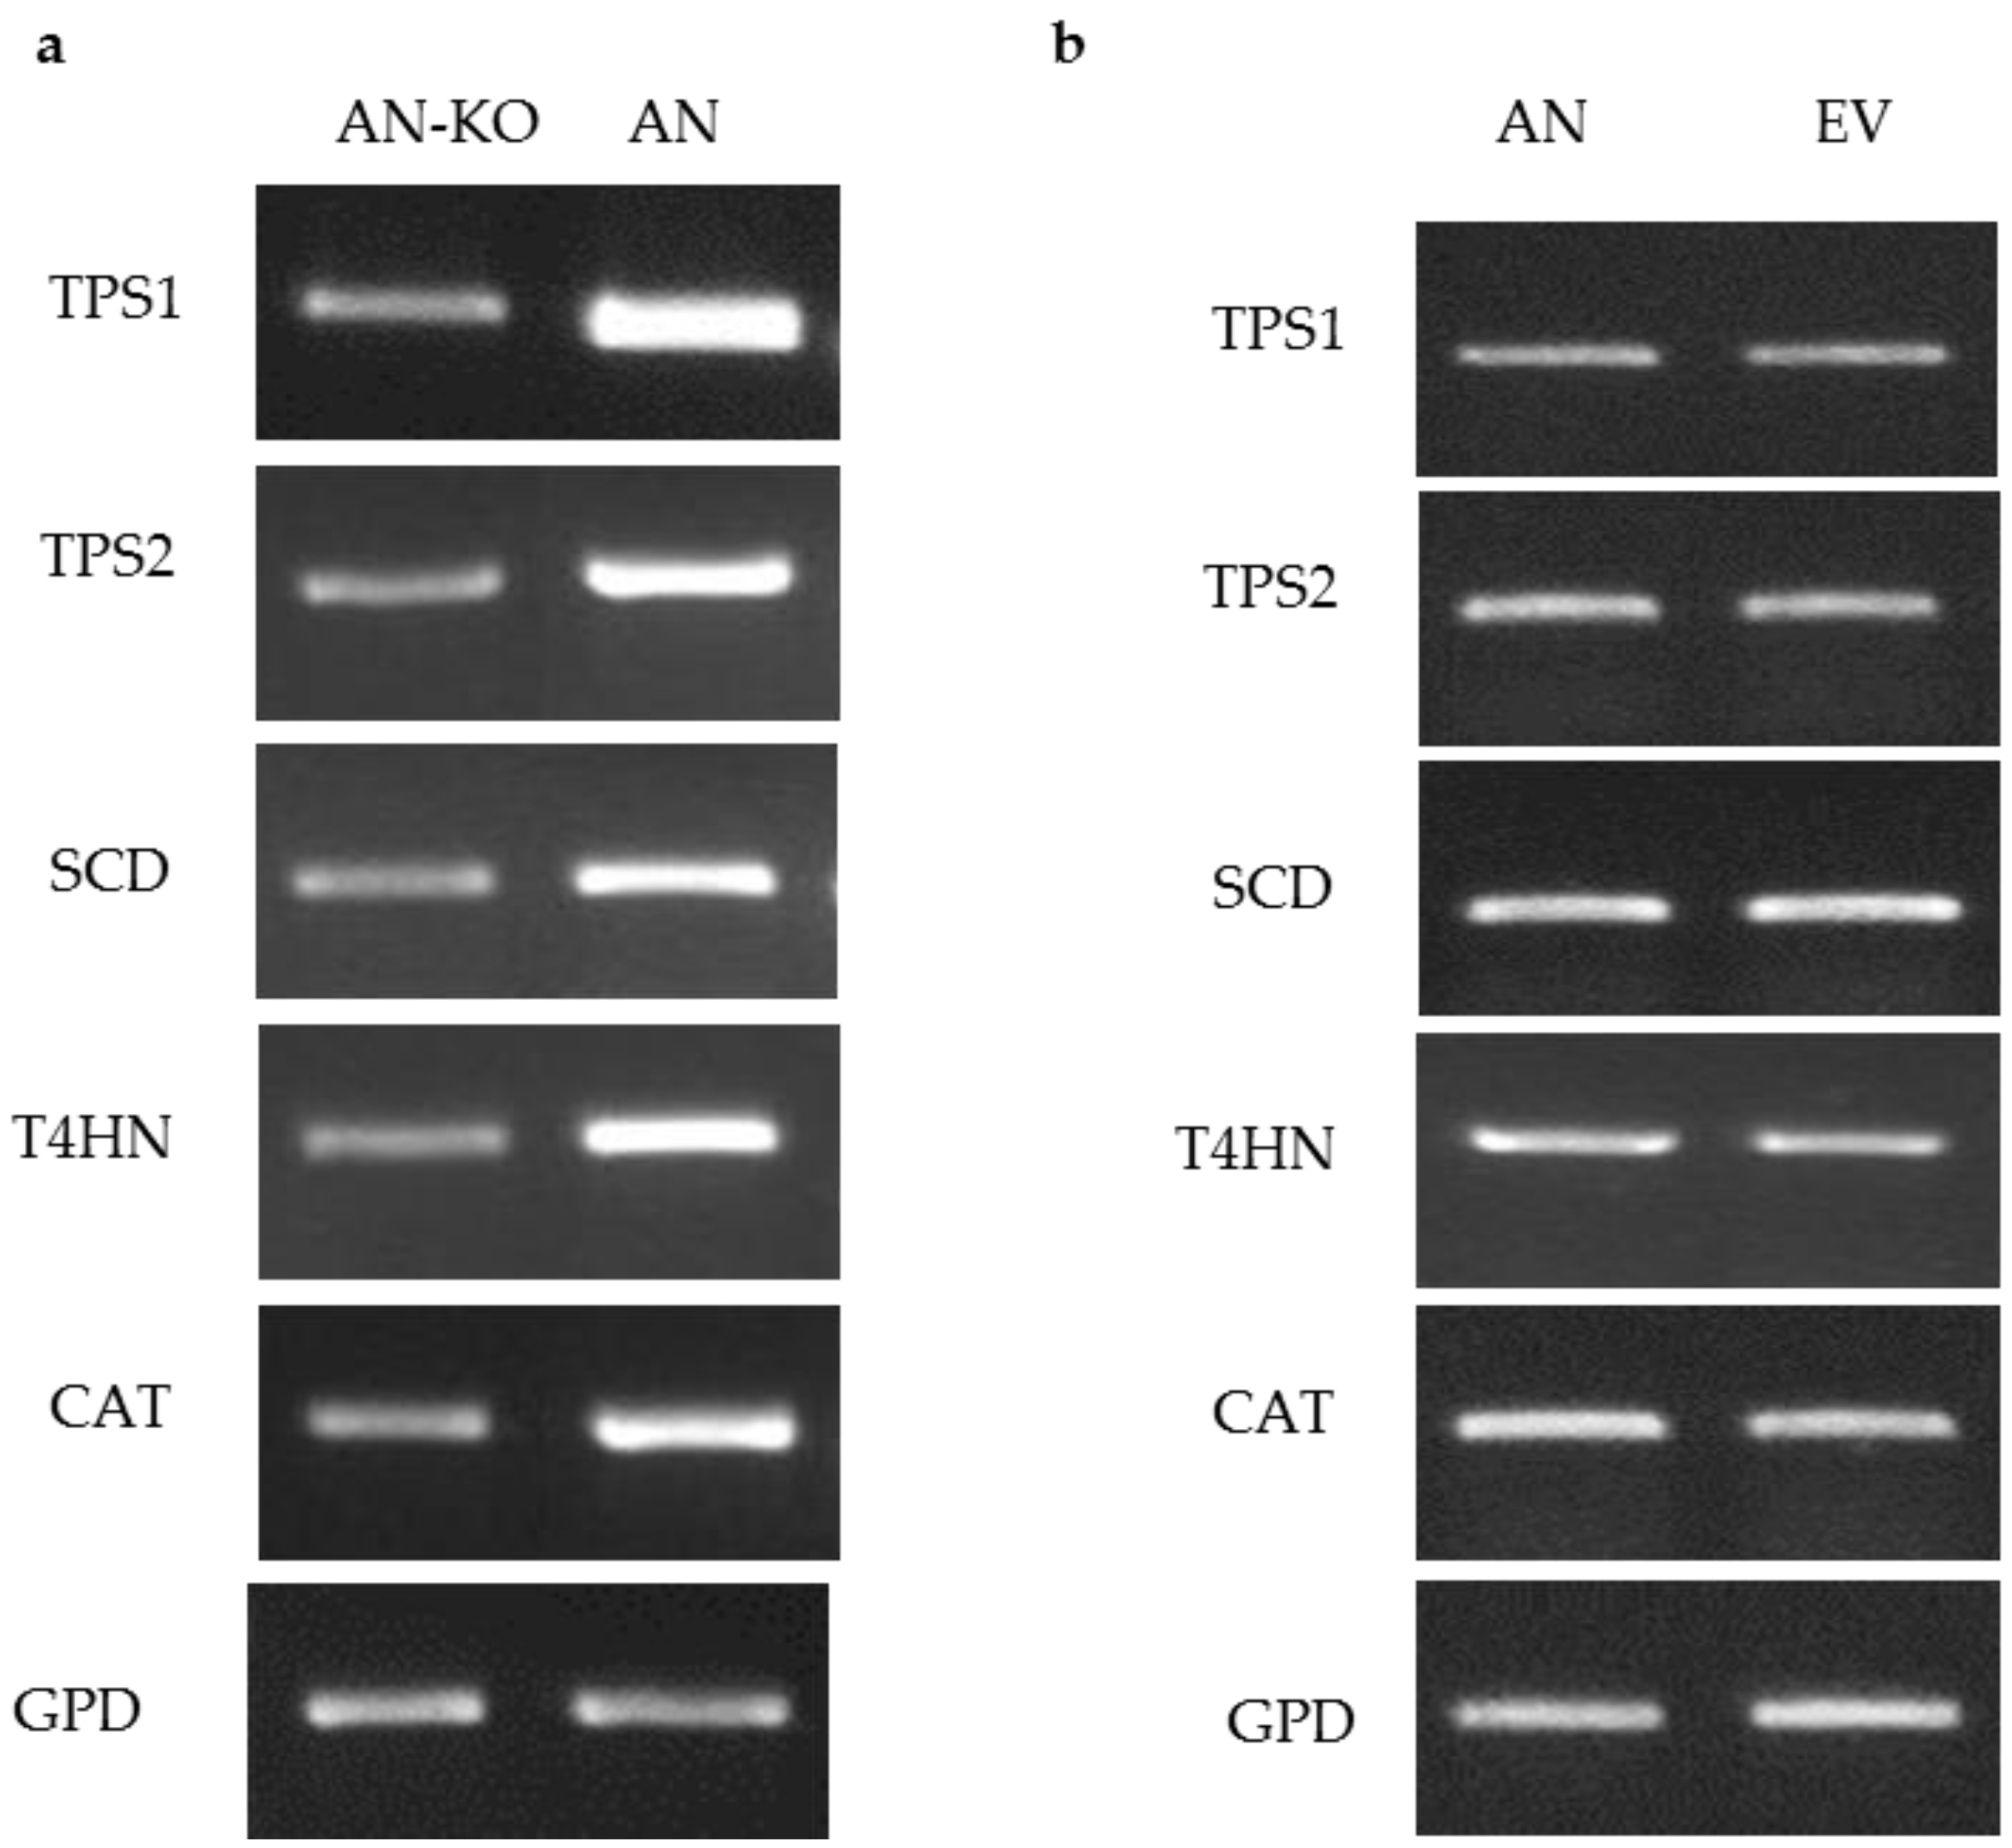
Figure 4.
Phenotypic changes in response to melanin overexpression and downregulation and quantitative melanin analysis. (a,b) Potato Dextrose Agar plates, back (top row) and front (middle row), and liquid culture (bottom row); (c,d) Quantitative measurement of the melanin in control and altered strains of VF and AN. Bars represent the ±SD of three independent replications. Data were analyzed by Student’s t-test using Excel. Different letters above the bars indicate significance between treatments (p < 0.05).
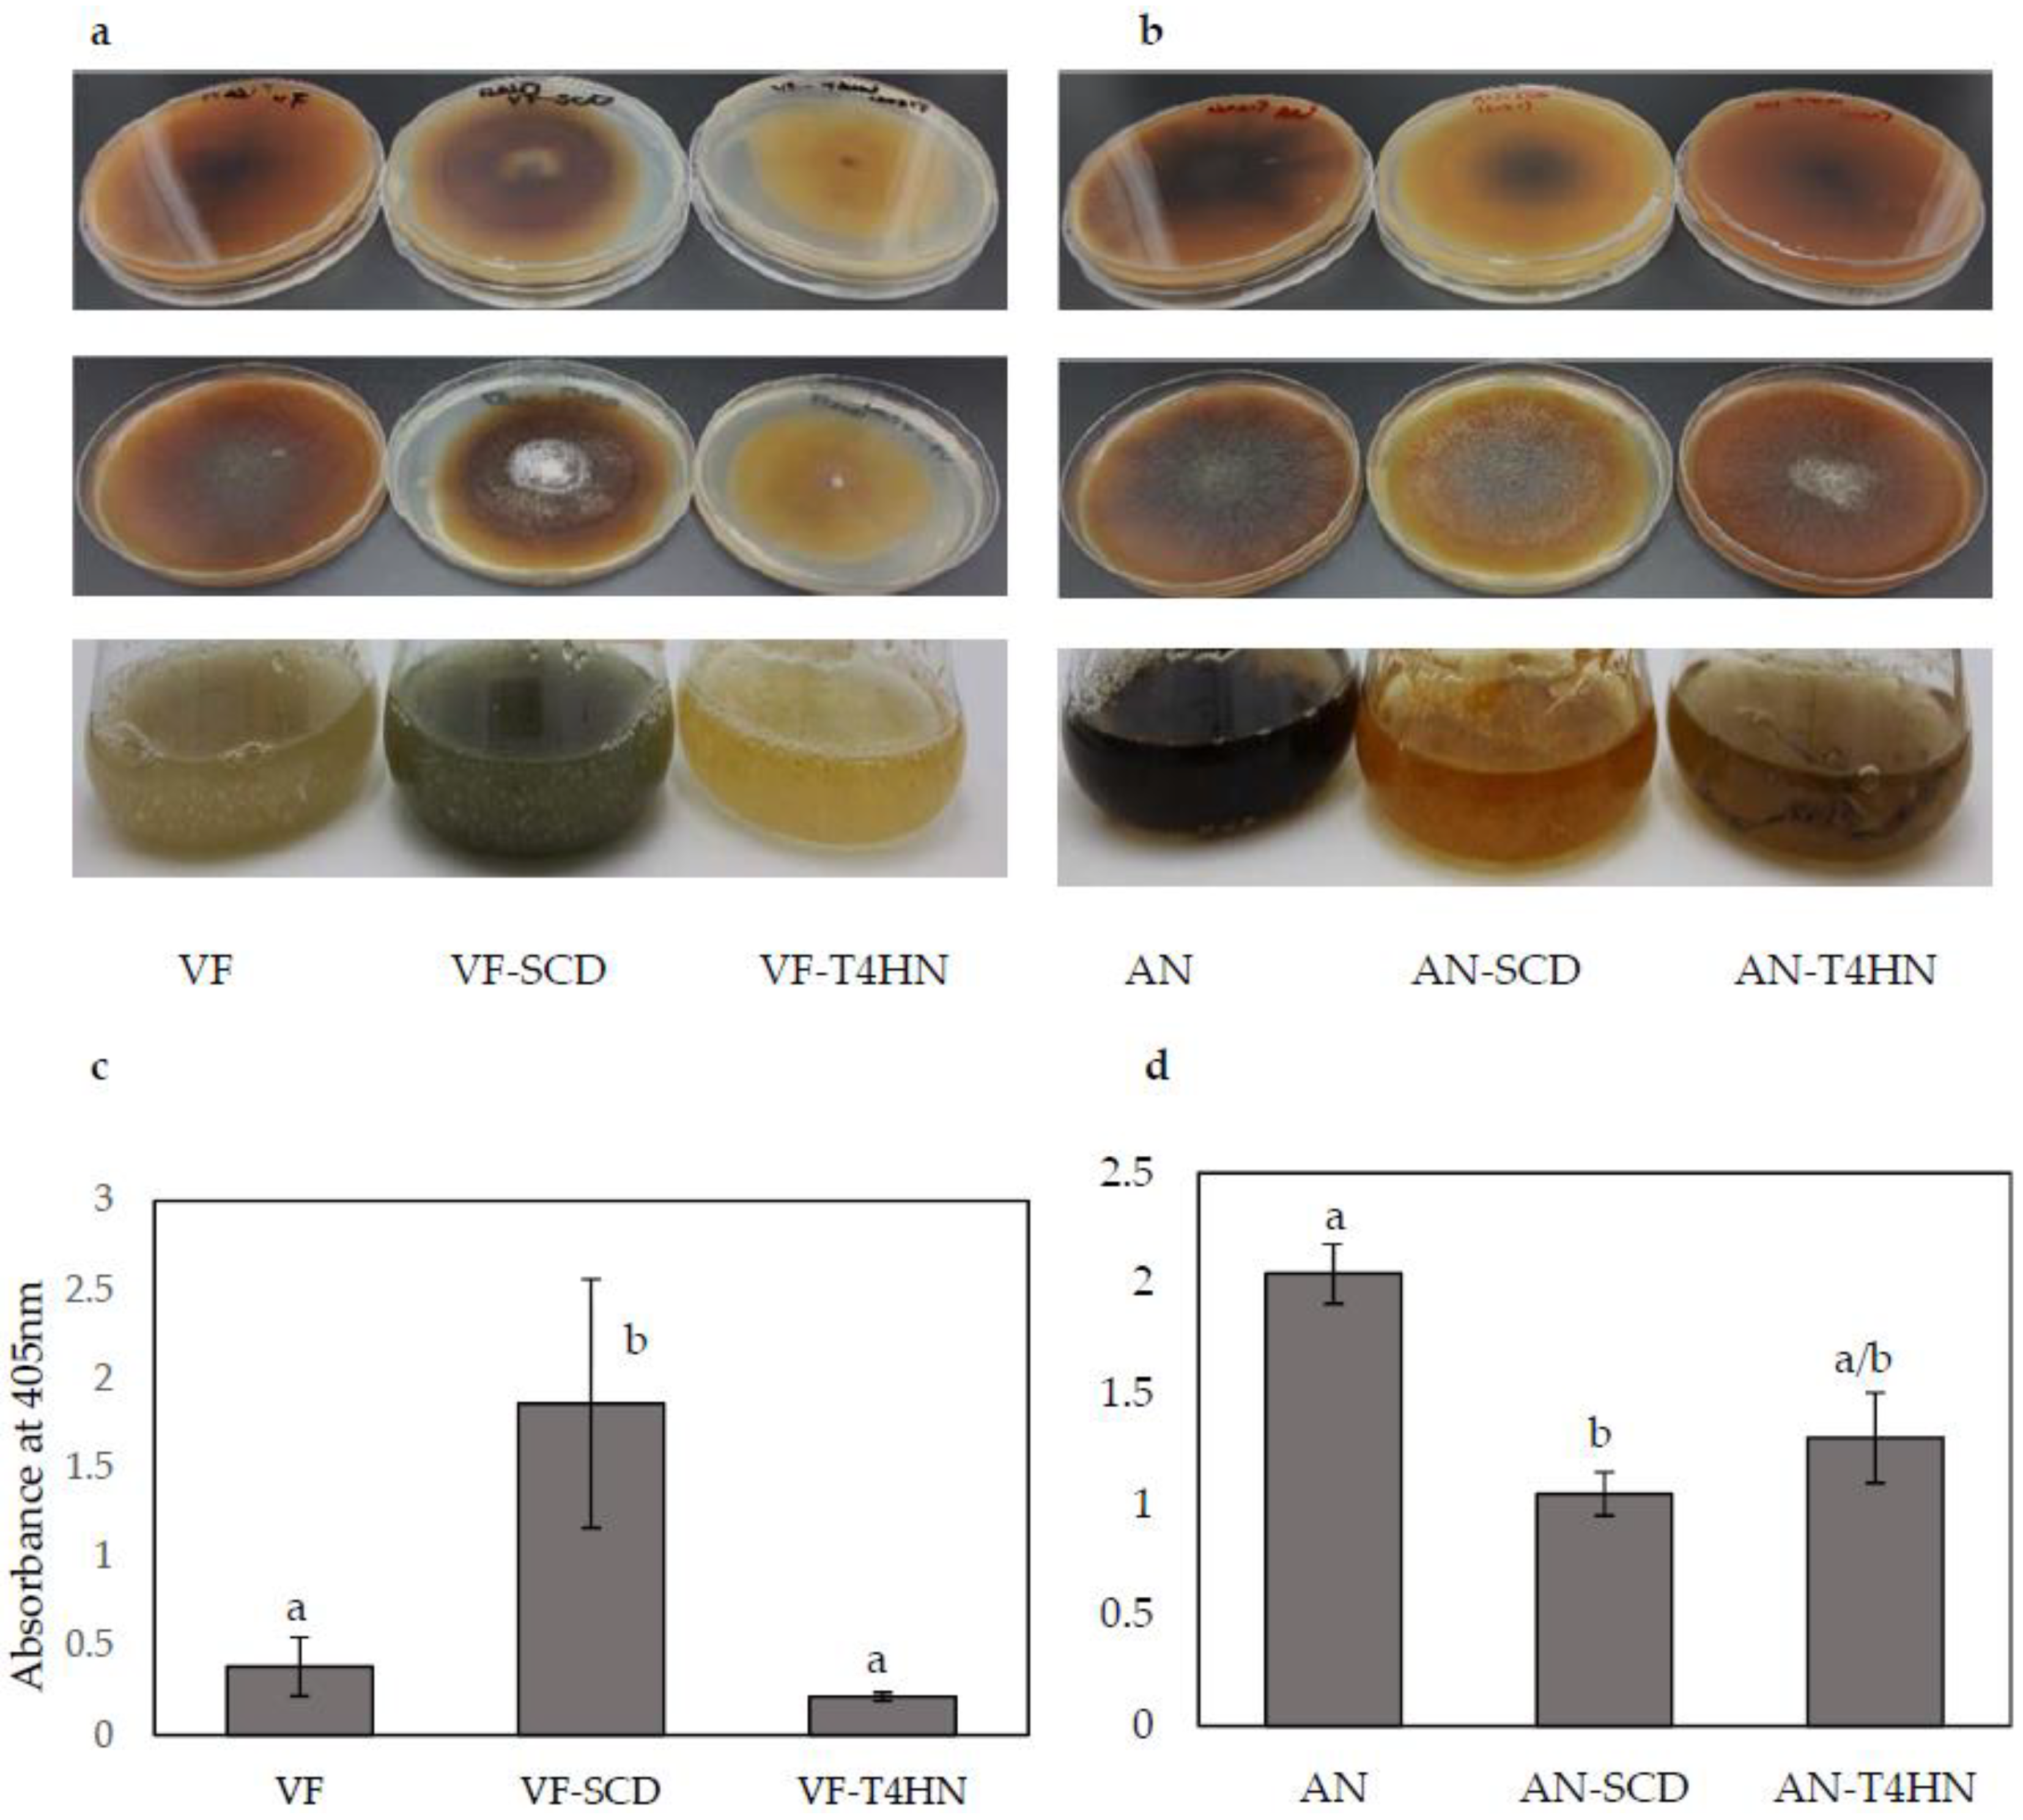
Figure 5.
Changes in trehalose content in response to overexpression or knockdown of TPS1 or TPS2 expression. (a) VF, virus-free Curvularia protuberata; VF-TPS1, VF overexpressing TPS1, which encodes trehalose-6-phosphate synthase; VF-TPS2, VF overexpressing TPS2, which encodes trehalose-6-phosphate phosphatase; (b) AN, C. protuberata carrying the Curvularia thermotolerance virus; AN-TPS1, TPS1 expression knockdown in AN; AN-TPS2, TPS2 expression knockdown in AN. Bars represent the ±SD of three independent replications. Data were analyzed by Student’s t-test using Excel. Different letters above the bars indicate significance between treatments (p < 0.05).

Figure 6.
Catalase activity in C. protuberata with CAT gene overexpression in the VF strain or CAT downregulation in the AN strain. (a) The catalase activity of each fungal strain/vector combination was determined as the depth of the column of O2 bubbles formed; (b) The average column depth for three replications is presented. No bubbles formed in the control with only H2O2 and Triton-100. Bars represent the ±SD of three independent replications. Data were analyzed by Student’s t-test using Excel. Different letters above the bars indicate significance between treatments (p < 0.05).


Table 1.
Primer sequences used to clone target genes for overexpression and downregulation, and for semi-quantitative RT-PCR. Underlined sequence showing the restriction enzyme sites.
Table 1.
Primer sequences used to clone target genes for overexpression and downregulation, and for semi-quantitative RT-PCR. Underlined sequence showing the restriction enzyme sites.
| Gene | Primers | Sequence 5′→3′ | Restriction Enzyme |
|---|---|---|---|
| Overexpression | |||
| TPS1 | Forward | TCGAATTCATGCCTGACGAACCCACAAGAC | EcoR1 |
| Reverse | GAGGATCCTCATTGGGCATTGGCAGGAGCAG | BamH1 | |
| TPS2 | Forward | GTGAATTCATGAGTGCCCCTACCGATGACAAG | EcoR1 |
| Reverse | TGCAGTCTAGACTATGGCACCGCCCGAGACTCAG | XbaI | |
| SCD | Forward | CAGAATTCATGTTTGAGAAGAACAAACTCC | EcoRI |
| Reverse | CACTGCAGTTACATGGCCAGCCCTGGCGCCTTC | PstI | |
| T4HN | Forward | TTGAATTCATGGTCATCAACGTTCCCAC | EcoRI |
| Reverse | TCGGATCCCTACTGGGATGATCCACCAGAG | BamHI | |
| CAT | Forward | CAGAATTCATGTCCAAAGGCGAGTGTCC | EcoRI |
| Reverse | CTGGATCCTCAAGTCGACTTGTTCTTGAC | BamHI | |
| Downregulation | |||
| TPS1 | Forward Sense | CAGCAAGCTTGAATTCGCTCCGAGATCTACCGAATC | EcoRI/HindIII |
| Reverse Sense | CAAACGGATCCGTGGAAGAAACAAGGCAGACG | BamHI | |
| Forward Anti-sense | TCCACGGATCCAAACTTACCATTGATGCGGCC | BamHI | |
| TPS2 | Forward Sense | CACCAAGCTTGAATTCACCTATCCCCGTTGATCCCA | EcoRI/HindIII |
| Reverse Sense | ACGTGGATCCACAATGTCGCCTGGCTTGTA | BamHI | |
| Forward Anti-sense | TTGTGGATCCTCCGTCGGCAGGCTCATTTTG | BamHI | |
| SCD | Forward Sense | CACCAAGCTTGAATTCAGCTACGACAGCAAGGACTG | EcoR1/HindIII |
| Reverse Sense | GCTACTGCAGTCCACTCGCCGTCAATCTTC | PstI | |
| Forward Anti-sense | GCACCTGCAGACGCATCCGTGTATCGCTG | PstI | |
| T4HN | Forward Sense | GACTAAGCTTGAATTCAGCCAACGAAGTGTGCGAC | EcoRI/HindIII |
| Reverse Sense | TCAAGGATCCTGGCTCGCCATAAGCGACTCG | BamHI | |
| Forward Anti-sense | AGCCAGGATCCTTGATGCCACCGGGGGCGAC | BamHI | |
| CAT | Forward Sense | CTTCTCTAGAGAATTCGCGCTTTGCTCCTCTCAATG | EcoRI/XbaI |
| Reverse Sense | GGAAAGGATCCTGGCAAGGTCCTCTGAGTTG | BamHI | |
| Forward Anti-sense | GCCAGGATCCTTTCCATATCGTTCATAGCC | BamHI | |
| Semi-quantitative RT-PCR | |||
| TPS1 | Forward | TGACGAACCCACAAGACTGG | |
| Reverse | CTCCTCCCGCAGCATAGAAG | ||
| TPS2 | Forward | GACATTGGCCTCATTACCAG | |
| Reverse | CTTCGTTTTGCCAGCTCAT | ||
| SCD | Forward | AACTCCAGCCTACCTTTGAGG | |
| Reverse | ACTCGTACCACCGAATGTCC | ||
| T4HN | Forward | CACCATGGTCATCAACGTTCCCA | |
| Reverse | TACTTCTCCTCGCTAATCTCC | ||
| CAT | Forward | GTGCCTGGTTCAAGCTTCTC | |
| Reverse | TGAACGTCAGTCTGCTCCTG | ||
| GPD | Forward | GCAACAACCTGACCGTCAAC | |
| Reverse | CCCACTCGTTGTCGTACCAA | ||
© 2018 by the authors. Licensee MDPI, Basel, Switzerland. This article is an open access article distributed under the terms and conditions of the Creative Commons Attribution (CC BY) license (http://creativecommons.org/licenses/by/4.0/).
Share and Cite
MDPI and ACS Style
Liu, C.; Cleckler, B.; Morsy, M. Development of an Expression Vector to Overexpress or Downregulate Genes in Curvularia protuberata. J. Fungi 2018, 4, 54. https://doi.org/10.3390/jof4020054
AMA Style
Liu C, Cleckler B, Morsy M. Development of an Expression Vector to Overexpress or Downregulate Genes in Curvularia protuberata. Journal of Fungi. 2018; 4(2):54. https://doi.org/10.3390/jof4020054
Chicago/Turabian StyleLiu, Chengke, Blake Cleckler, and Mustafa Morsy. 2018. "Development of an Expression Vector to Overexpress or Downregulate Genes in Curvularia protuberata" Journal of Fungi 4, no. 2: 54. https://doi.org/10.3390/jof4020054
Note that from the first issue of 2016, this journal uses article numbers instead of page numbers. See further details here.