Evolutionary Path of Factors Influencing Life Satisfaction among Chinese Elderly: A Perspective of Data Visualization


1
School of Information Management, Wuhan University, Wuhan 430000, China
2
College of Information, University of North Texas, Denton, TX 76207, USA
*
Author to whom correspondence should be addressed.
Data 2018, 3(3), 35; https://doi.org/10.3390/data3030035
Submission received: 31 July 2018
/
Revised: 24 August 2018
/
Accepted: 6 September 2018
/
Published: 11 September 2018
(This article belongs to the Special Issue Curative Power of Medical Data)
Abstract
:China has the largest aging population of all countries and faces severe aging issues. As an important indicator to measure the quality of life, the life satisfaction of elderly Chinese people has received increasing attention. Based on the cross-sectional survey data collected from 2002 to 2014, which were provided by the CLHLS (Chinese Longitudinal Healthy Longevity Survey) project as open datasets, this study investigated how the influence and importance of factors associated with life satisfaction in the elderly have changed during these years. In view of previous research and questionnaire data, demographic, physiological, psychological, economic and social characteristics were selected as potential influencing factors of life satisfaction. With the R programming language, we used IV (information value) as the indicator to measure the influence of associated factors and determined the importance of each factor by establishing a random forest model for each year. Data visualization was used to demonstrate change in each factor with the Microsofot PowerPoint 2016. The results show that, for most factors, their influence has fluctuated. Since 2002, the most significant factors have always been self-rated health, self-evaluation of economic level, economic self-sufficiency and bright personality.
1. Introduction
According to data released by the National Working Committee on Ageing in February 2018, China’s elderly population (aged 60 and above) reached 241 million at the end of 2017, with an increase of 36 million from 194 million at the end of 2012. The proportion of elderly rose from 14.3% to 17.3% of the population in 13 years [1]. On the whole, the number and proportion of the elderly population are on the rise each year. It is predicted that by 2020, the national population aged over 60 will increase to about 255 million, which will increase the proportion of the total population to about 17.8%. In order to eliminate the negative effects of the aging issue, promote comprehensive, balanced and sustainable development of old-age programs, and improve the pension system, the State Council has formulated the “13th Five-Year Plan for the Development of Old-Aged Program and the Construction of the Pension System” [2]. It can be seen that with the intensification of the aging trend, the living conditions of the elderly have attracted much attention.
Life satisfaction, an important indicator to measure the living standards of the elderly, has become an indispensable item in the academic community when studying life quality and living conditions of the elderly. Analyzing factors that affect life satisfaction of the elderly and taking corresponding measures to improve their life satisfaction make a great difference in promoting “healthy aging”. In addition, with the rise of the open data wave, more and more open health datasets with highly valuable information are being publicly released. Effective use of these open health datasets can help us discover the laws of elderly people’s health. In this context, we used the open datasets provided by Chinese Longitudinal Healthy Longevity Survey (CLHLS), to explore factors affecting elderly people’s life satisfaction.
2. Literature Review
Life satisfaction (LS) not only refers to the absence of disease or disability, but also includes the satisfaction of social and psychological needs [3]. Life satisfaction is defined as the subjective assessment of life quality, based on criteria set by the individual [4]. Life satisfaction is an integral part of the broader concept of subjective well-being. Unlike emotional components, it reflects the way people assess their own lives cognitively [5,6].
Studies on the life satisfaction of the elderly have reported a number of research findings and can be divided into three main categories.
The first category studies the factors that affect the life satisfaction of specific groups. Xiao [7] analyzed the factors affecting the life satisfaction of the elderly in Xiamen in China. Based on a health survey of Chinese in Hong Kong aged 70 and above, Ho et al. [8] emphasized that social factors play a role equivalent to health factors in promoting life satisfaction. Health, sufficient income to satisfy living costs, and family care are important factors. Watson et al. studied factors affecting the life satisfaction of elderly fathers [9].
The second category focuses on the relationship between specific factors and life satisfaction. Zhang et al. [10] studied the relationship between social participation, subjective well-being and life satisfaction of retirees, and concluded that social participation is an important factor in maintaining the subjective well-being and life satisfaction of retirees. Gaymu et al. [11] studied the impact of objective living conditions on the life satisfaction of the elderly living alone.
Another category of research focuses on multiple influencing factors of life satisfaction and identifies the relationships between the influencing factors and life satisfaction. Enkvist et al. [12] studied the relationships between life satisfaction and age, education, marital status, socioeconomic status, and other factors, and found that the factors affecting life satisfaction were number of diseases, self-control, depression, marital status, and age. Liu [13] used national baseline data from the China Health and Retirement Longitudinal Study (CHARLS) in 2011 and concluded that demographic characteristics and health conditions had the greatest impact on life satisfaction of the elderly.
In general, many scholars have conducted in-depth studies on the factors affecting the life satisfaction of the elderly, but most studies have collected data for specific groups of elderly people, or were based on survey data for a single year. Only a few studies have combined survey data from different years for analysis. For example, Jin [14] used tracking data from 2003 and 2008 on the life satisfaction of elderly people in Shanghai to conduct a comparative analysis of the factors affecting elderly life satisfaction. However, the time span between the two years is relatively large, and it is difficult to derive any meaningful patterns of the influencing factors over time.
This paper uses large-scale survey data from five years in a recent twelve-year period, to analyze the factors influencing elderly people’s life satisfaction. We expected to discover the evolution law of the influencing factors over time, which would provide insights to life satisfaction issues for the elderly, and aid national and local governments to better assist elderly people in their countries.
3. Materials and Methods
3.1. Source of Data
The data for this study were derived from surveys in the CLHLS project, which were obtained from the Peking University Open Research Data platform. The Peking University Open Research Data includes high-quality scientific research data from domestic and foreign, academic and non-academic related organizations. This platform collects research data from scholars or scientific institutions (mainly based on survey data) as well as encouraging researchers to submit their own data. The Chinese Longitudinal Healthy Longevity Survey (CLHLS) data we used were originally provided by the Peking University Health Ageing and Development Research Center.
We used five cross-sectional surveys from the years 20021, 20052, 20083, 20114, and 20145 in the CLHLS project for analysis. The CLHLS project aims to explore the factors influencing the health of the elderly and to strengthen scientific research and policy analysis in the area of healthy aging [15]. Since 1998, this survey has been conducted in 23 provinces across China, including Beijing, Tianjin, Hebei, Shanxi, Liaoning, Jilin, Heilongjiang, Shanghai, Jiangsu, Zhejiang, Anhui, Fujian, Jiangxi, Shandong, Henan, Hubei, Hunan, Guangdong, Guangxi, Chongqing, Sichuan, Shanxi and Hainan. The total population of the areas covered was 985 million at the 1998 baseline survey, and 1156 billion in 2010, accounting for about 85% of the total national population. About half of the cities and counties in each survey province were randomly selected as survey sites for investigation.
In order to investigate enough elderly people who need care the most, the project adopted a multi-stage non-equal random sampling method in the selected survey areas. 8959 citizens aged 80 and above were interviewed at their home in 1998, and 11,161 elderly people aged 80 and above were investigated in 2000. Since 2002, the project has expanded the samples to include people over 65 years old. In the surveys of 2002, 2005, 2008–2009, and 2011–2012, the numbers of interviewees, aged 35–110 years, were 20,428, 18,549, 20,366, and 10,191, respectively. The range of respondents was extensive.
Each respondent was asked to fill out a CLHLS questionnaire. At the beginning of the questionnaire is a declaration of confidentiality of the personal information of the respondent. Before participating in the survey, respondents were instructed to sign the informed consent if they wished. The questionnaire includes four major types of factors that may determine health status including, lifestyle, social environment, genetics, and medical conditions. It contains questions regarding personal characteristics, self-care ability, physical function, cognitive function, psychological characteristics, social support and other issues of the elderly. Taking personal characteristics as an example, there are seven items which are represented by seven questions coded from B2-1 to B2-7, as shown in Table 1.
3.2. Data Coding
Life satisfaction is the dependent variable in this paper. It is measured by the question on “self-reported quality of life” in the questionnaire. Responses are divided into five levels: “very good”; “good”; “so, so”; “bad”; and, “very bad”. Since there are few “bad” and “very bad” responses in the annual data, this study merges the first two levels into one category representing “satisfied with life” and merges the last three levels into one category representing “not satisfied with life.”
Based on previous studies on the factors that affect the life satisfaction of the elderly, and questionnaire data, this study selected the potential influence factors of life satisfaction from five dimensions including the, demographic, physiological, psychological, economic, and social dimensions. The independent variables are listed in Table 2, and include: residence; marital status; education attainment; way of living; self-rated health; cognitive ability; personal activities of daily living (PADL); instrumental activities of daily living (IADL); bright personality; anxiety; loneliness; self-recognition; leisure activities; social participation; medical accessibility; economic self-sufficiency; main source of life; and self-evaluation of economic level. Since age and gender can not be changed at any time, these two variables are not discussed in the study. We explain some of the variables below.
Personal activities of daily living (PADL), and instrumental activities of daily living (IADL), are used to evaluate the relatively objective health status of the elderly. In the questionnaire, the ability of the elderly to take care of themselves in daily life is surveyed from six aspects: bathing; dressing; indoor activities; going to the toilet; eating; and bowel and bladder control. These six items are combined into one variable, PADL. The ability to perform activities such as going to their neighbors, shopping, cooking, washing, and other indicators are integrated into the IADL variable. The variable “leisure activities” is measured by three questionnaire items: (1) “Do you do garden work”; (2) “Do you read newspapers/books at present?”; and (3) “Do you watch TV or listen to the radio at present?”. Engaging in at least one type of leisure activity is defined as having leisure activities, otherwise it is defined as having no leisure activities. The variable “social participation” is measured according to the following questions; “Do you play cards/mah-jong at present?” or “Do you take part in some social activities?”. All questions representing research variables in each year’s questionnaire are consistent. There are both numeric and categorical variables among the independent variables. The categorical variables contain multiple classifications. Considering that for the same variable, the amount of data in some categories is small, there may be sparse data effects. Therefore, the variable’s values are merged according to the meaning of the variable and the specific value distribution. All independent variable codes are also shown in Table 2.
3.3. Data Analysis Method
The surveys conducted in 1998 and 2000 only contain respondents aged 80 and over. From 2002 on, the CLHLS extended the age range of the sampled elderly to include participants aged below 80. As the subject of this study is the elderly aged 60 and above, we excluded survey data for the years 1998 and 2000, and only retained survey data for the years 2002, 2005, 2008, 2011 and 2014.
In order to ensure the reliability of the data, observations involving missing values or fuzzy answers were excluded from the final sample. The number of observations before and after exclusions is shown in Table 3.
A quantitative data analysis method was used. The influence of each factor on life satisfaction was measured using IV (information value). A random forest model was established to analyze the importance of influencing factors in each year. All operations were completed in R.
3.3.1. Information Value
Information value (IV) is closely related to concepts from information theory where one of the goals is to understand the uncertainty involved in predicting the outcome of random events given varying degrees of knowledge of other variables [16].
When we have a binary dependent variable Y and a set of predictive variables X1, …, Xp, IV measures how well the predictive variable Xj helps us separate cases when Y = 1 from cases when Y = 0. This is done through the information value (IV) which is defined like this:
IV enables one to consider each variable’s independent contribution to the outcome. In addition, it can be used to seamlessly compare the strength of continuous and categorical variables without creating dummy variables and seamlessly handle missing values without imputation [17].
The IV is a good measure of the influence of the independent variable on the target variable. There is a general rule about the correspondence between the IV value and influence level, as shown in Table 4.
3.3.2. Random Forest
Random forest is a machine learning algorithm based on decision trees. It operates by constructing a multitude of decision trees at training time and outputting the class that is the mode of the classes (classification) or mean prediction (regression) of the individual trees.
At present, random forest is more satisfactory, regarding both operation and results, than various other machine learning models [19]. Compared with other models such as logistic regression, random forest does not require independence between variables or data structures that conform to the normal distribution. There are far fewer limitations for random forest. It has a rapid learning process and thus can be completed quickly when dealing with large amounts of data. Thousands of independent variables can be processed and random forest can evaluate the important values of all variables regardless of relevance issues [20].
As this study investigates change in the importance of factors associated with life satisfaction, it is appropriate to establish a random forest model. The random forest model calculates the importance score of each independent variable according to two different criteria. The first criterion is the mean decrease in accuracy, and the second is mean decrease in Gini. As far as the two criteria are concerned, the larger the importance score is, the more important the variable is. Since categorical variables and continuous variables exist simultaneously, the estimated value based on Gini in this case is not accurate enough [21]. Therefore, the importance of each factor is measured by the importance score calculated according to the mean decrease in accuracy.
3.4. Visualization of Results
Data visualization can optimize information organization and improve the efficiency of information acquisition. With suitable visualization tools, the information contained in data can be better displayed for analysis. In the study, we used Microsofot PowerPoint 2016 to visualize data and to help find useful results.
4. Results
This section reports the results of our analysis. Specifically, we report the life satisfaction measure over each of the years, the evolution law of factors influencing life satisfaction among elderly Chinese based on their information values, and changes in the importance of these factors to life satisfaction in different years. Most of the results are presented visually.
4.1. Life Satisfaction over Years
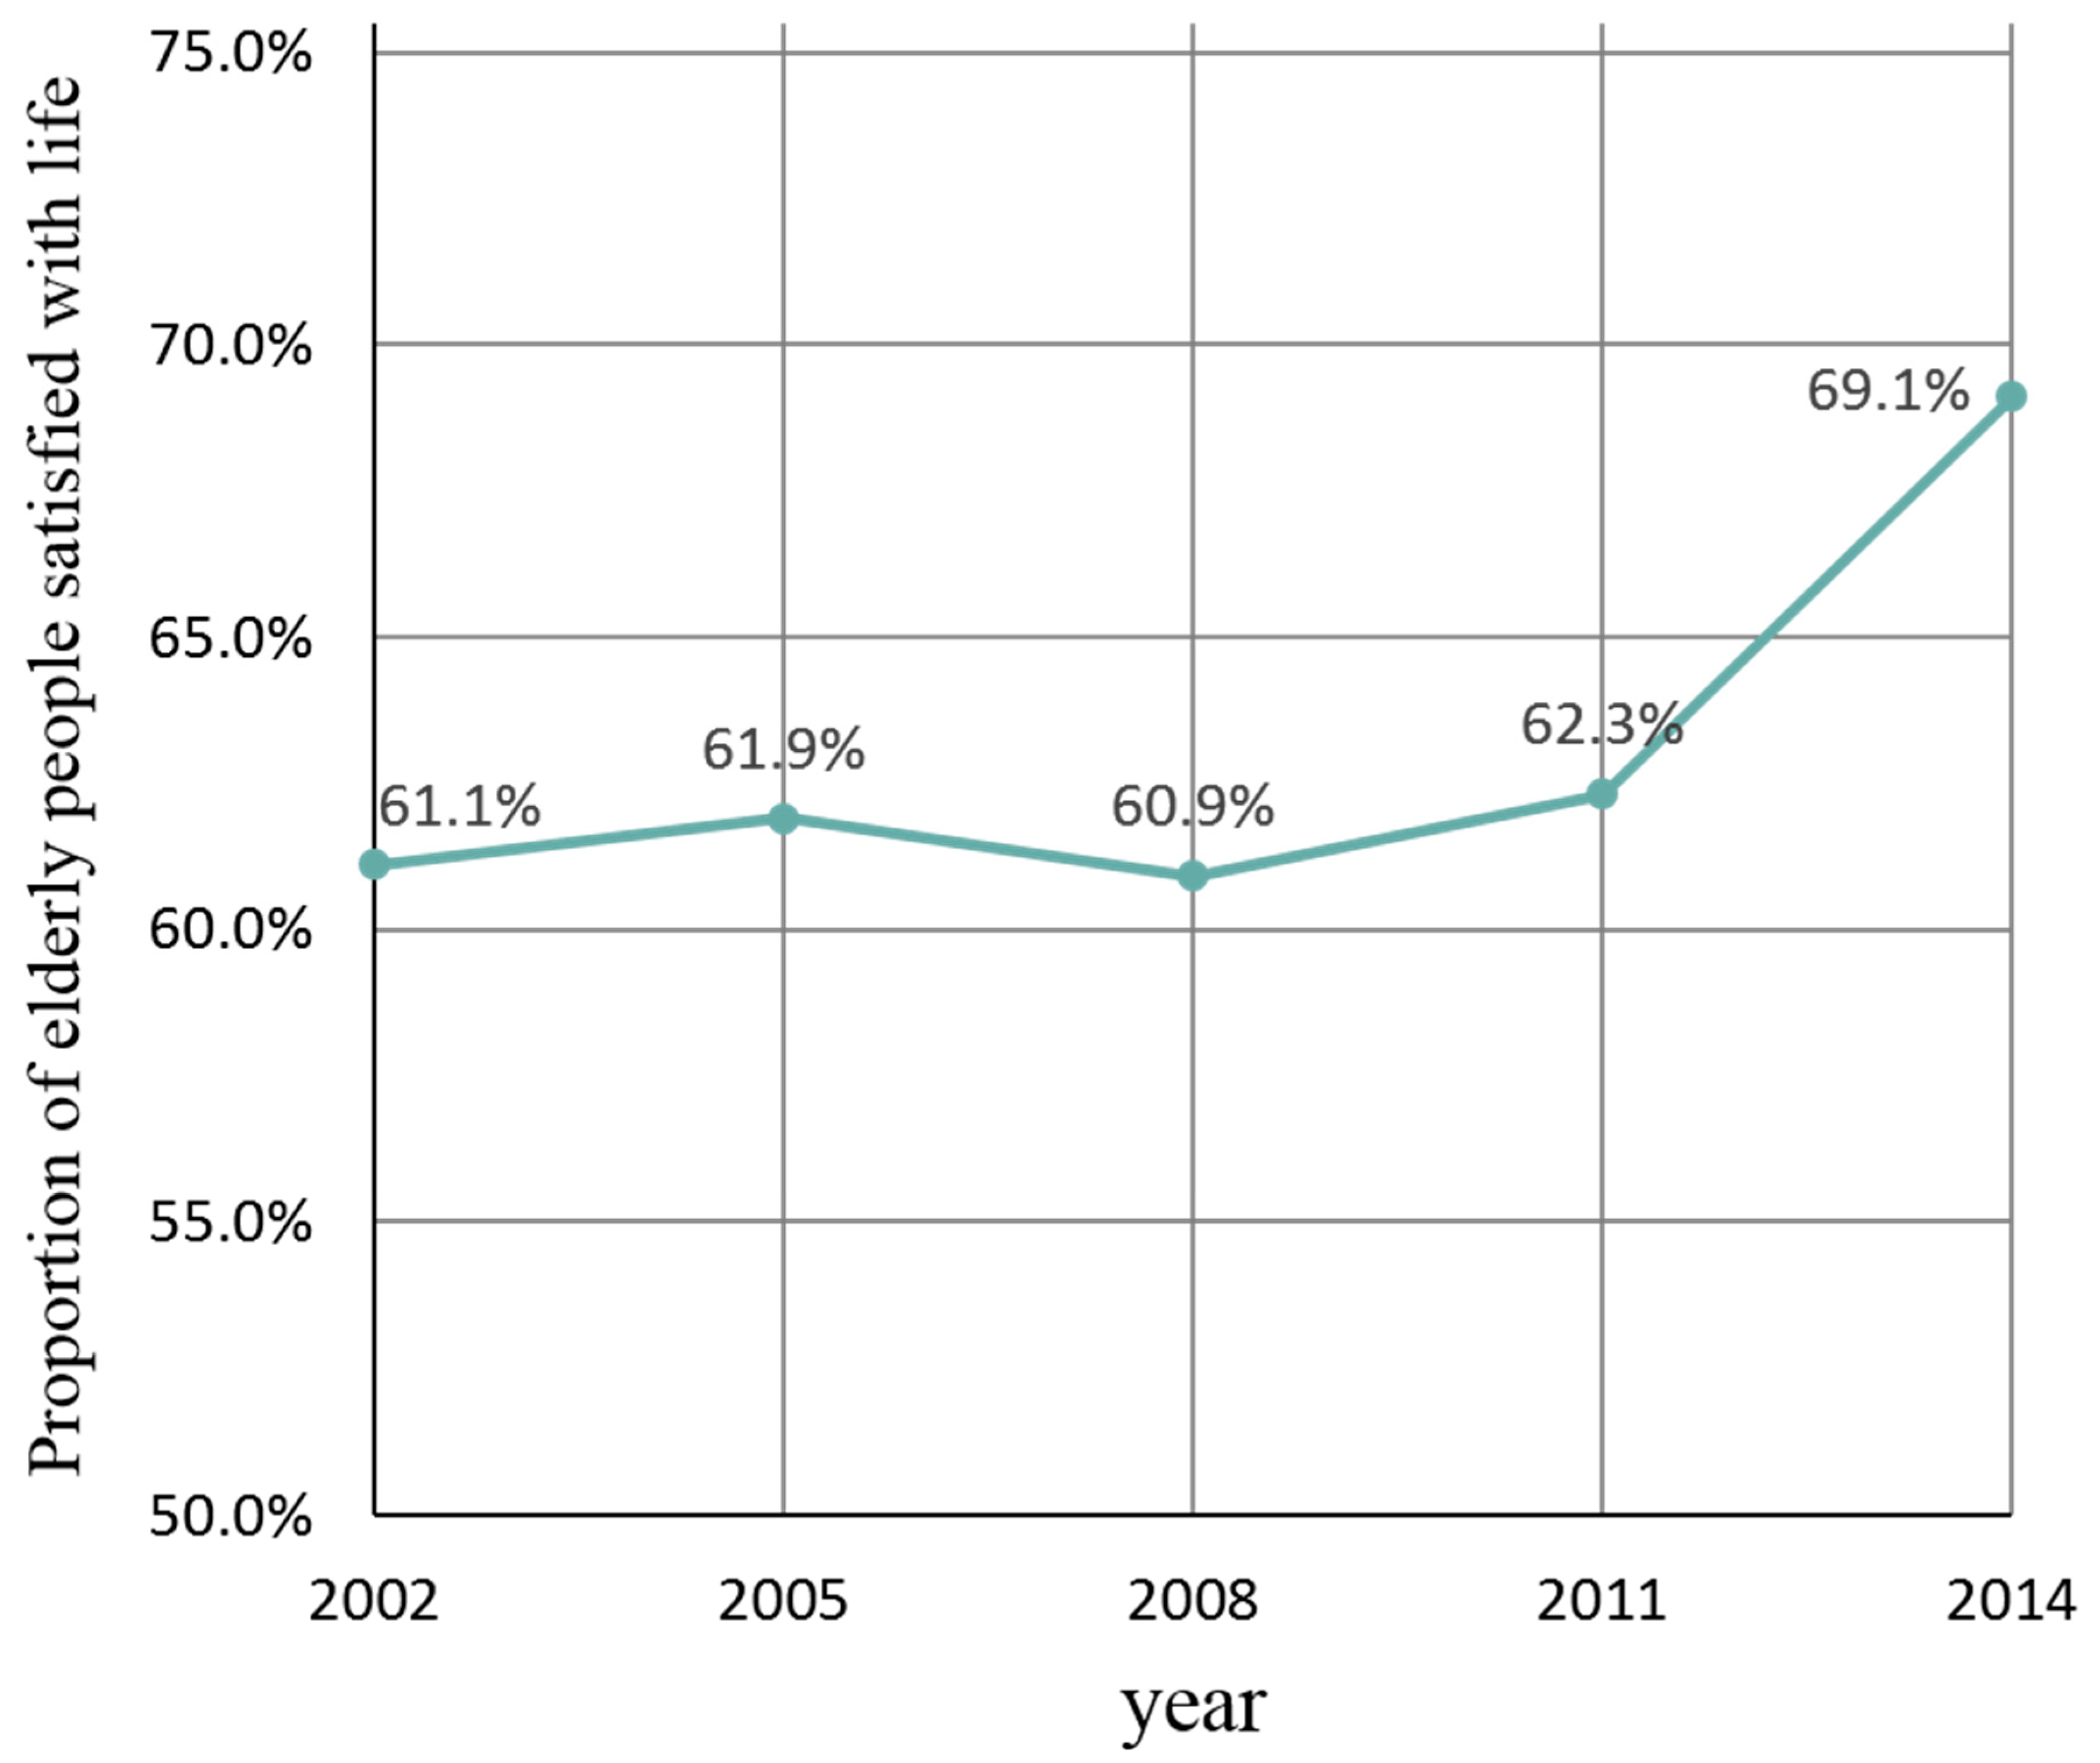
Figure 1 shows the proportion of elderly people satisfied with life for each of the five years. In 2002, 61.1% of the elderly were satisfied with life. From 2002 to 2008, the proportion changed slightly. From 2008 to 2014, it continued to rise and reached 69.1% in 2014, indicating that life satisfaction of the elderly had improved during this recent decade.
Figure 2 shows the proportion of male/female elderly people satisfied with life from 2002 to 2014. For both male and female elderly people, this proportion was 61.1% in 2002 with slight changes between 2002 and 2008, and a significant rising trend after 2008. In general, men and women had little difference in their life satisfaction ratings.
From Figure 3, we can see that for all three age groups (60–69, 70–79, 80 and above), the proportion of elderly people satisfied with life has changed during the decade, with an upward trend from 2011 to 2014. In general, from 2002 to 2008, the proportion of elderly people satisfied with life among those aged 80 and above was significantly higher than among those aged below 80. From 2008 to 2014, the proportion of elderly people aged between 70 and 79 who were satisfied with life was lower than for the other two age groups. It is clear that between 2002 to 2014 there has always been a relatively high proportion of people satisfied with life among those aged 80 and above.
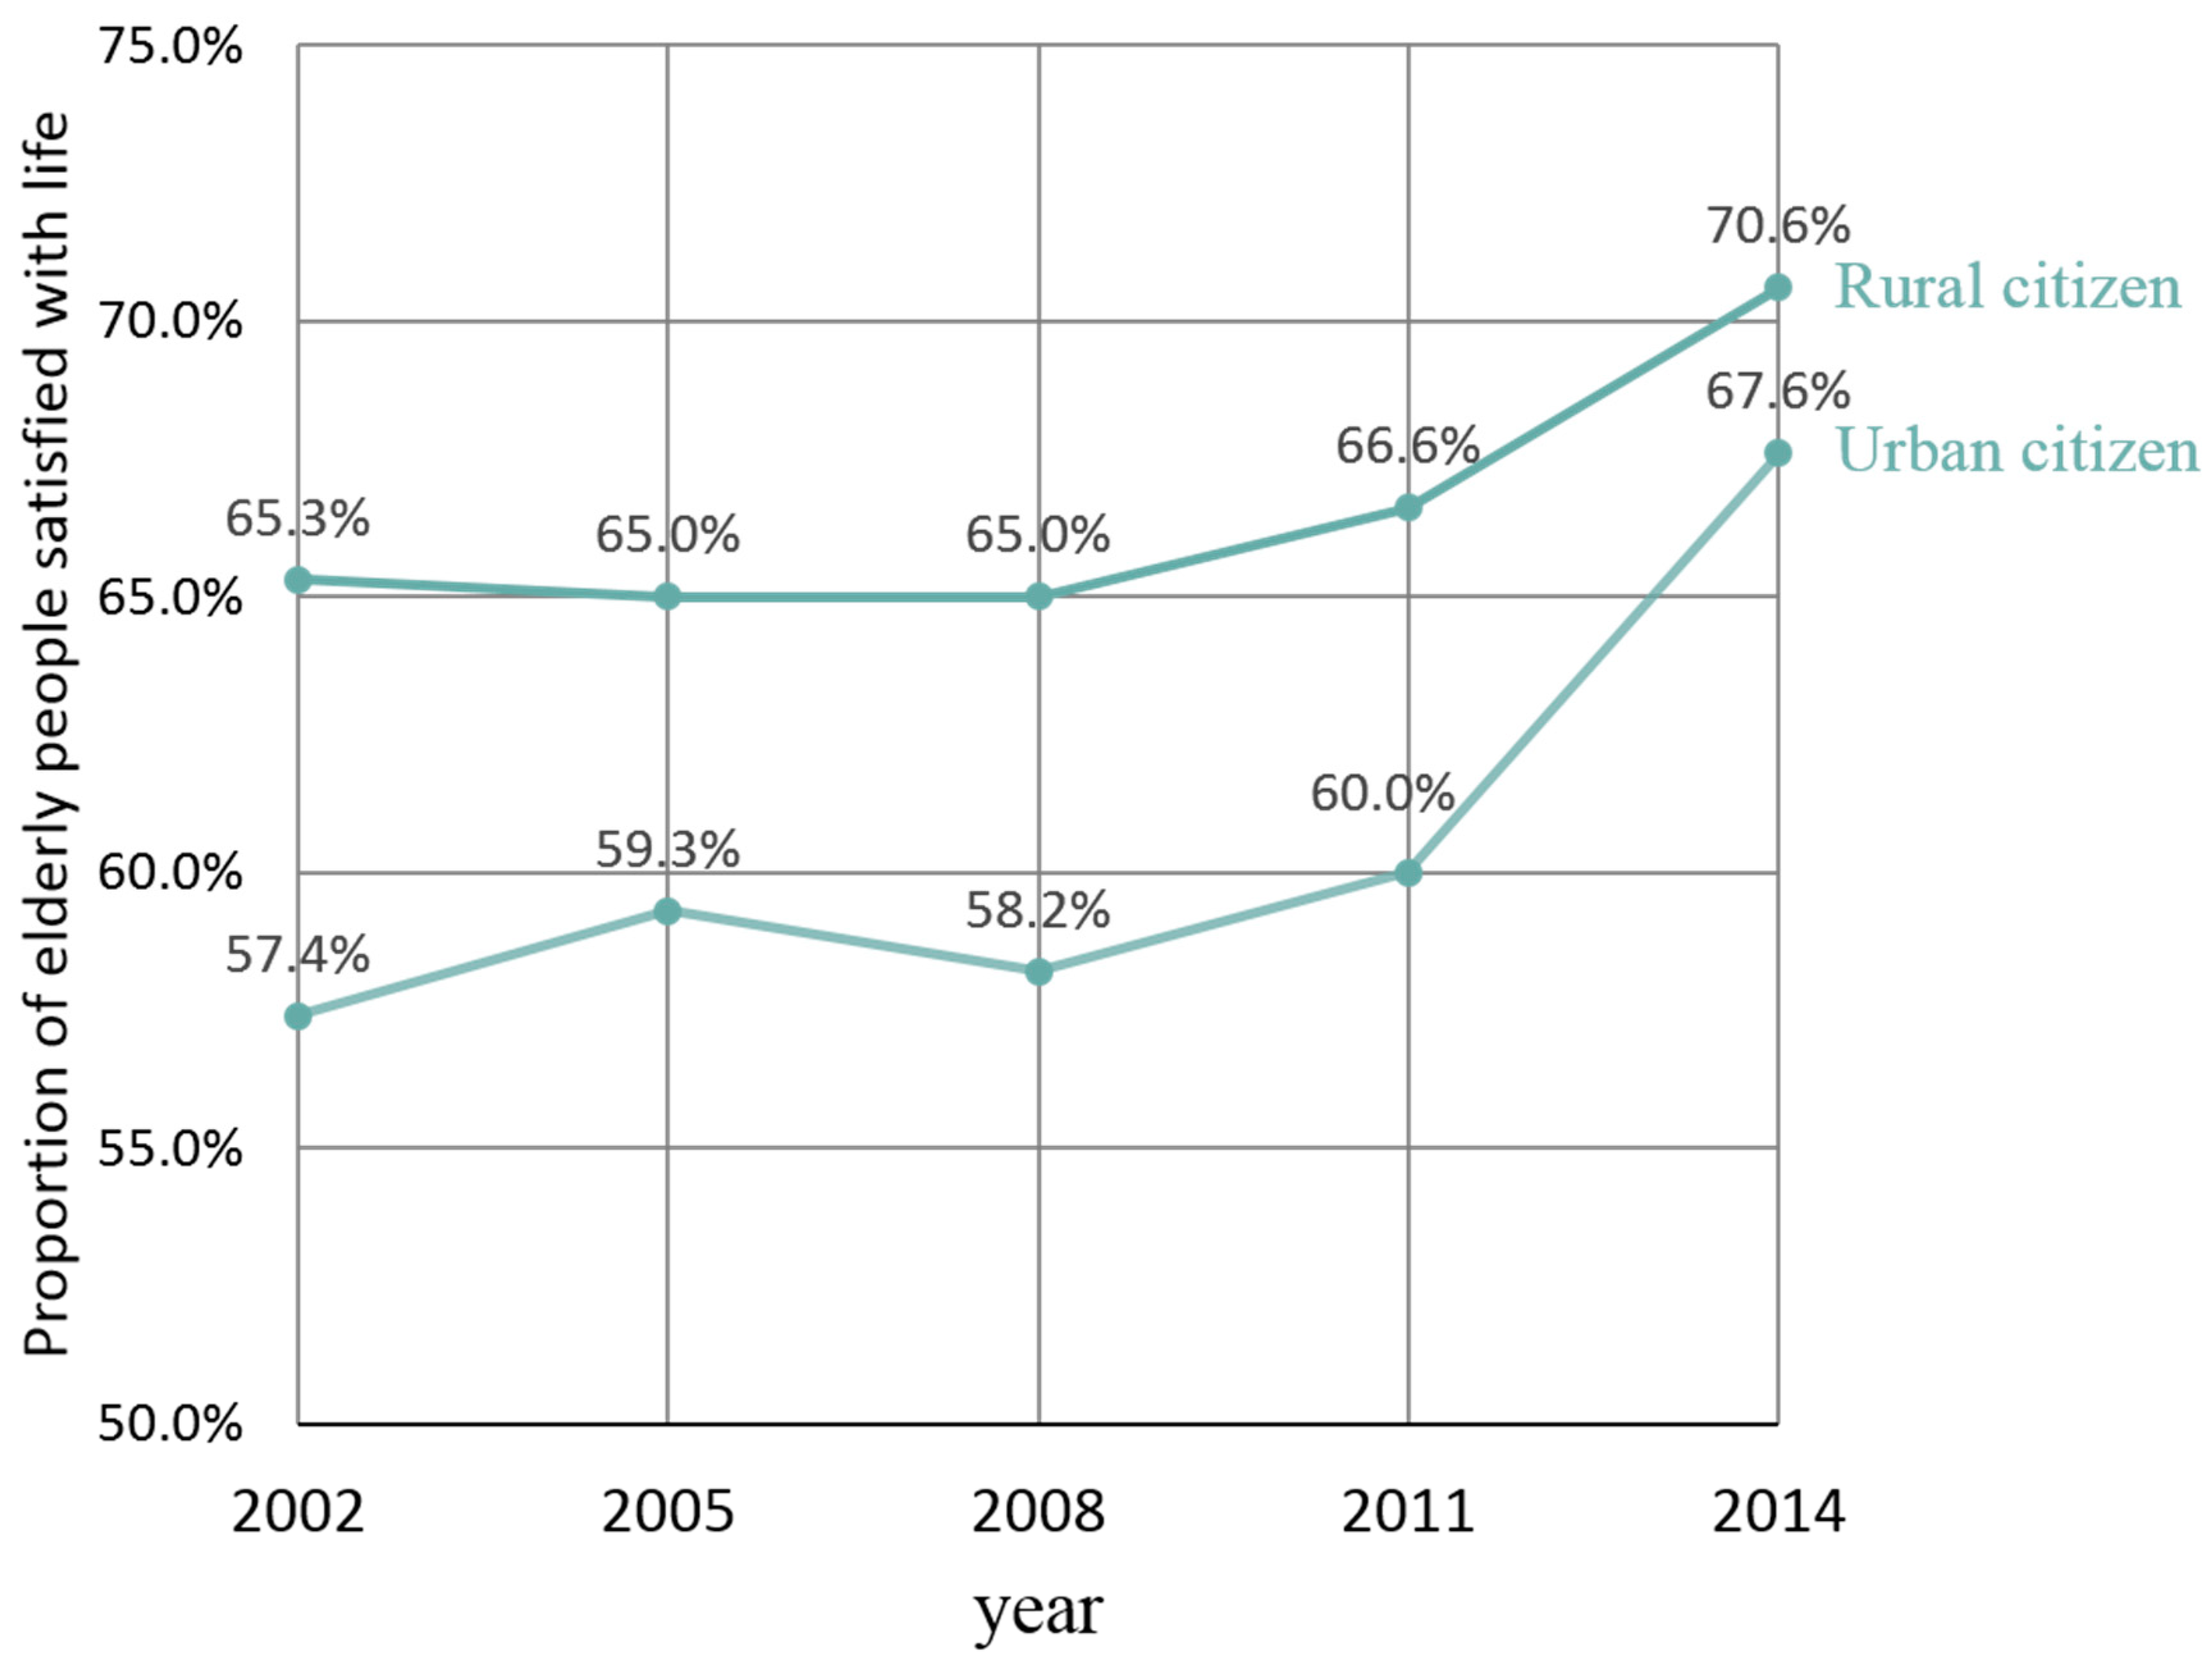
As shown in Figure 4, for both urban citizens and rural citizens, the proportion of elderly people satisfied with life has increased since 2008. It is evident that the proportion of people living in the city who were satisfied with life has always been lower than those living in rural areas from 2002 to 2014, which suggests that rural citizens are more inclined to be satisfied with life.
4.2. Evolution Law of Factors Influencing Life Satisfaction among Elderly Chinese
4.2.1. The Influence of Factors in Different Years
Using the R programming language, the information value (IV) of each variable was calculated for each of the five years to measure the influence of the independent variables on the life satisfaction of the elderly. Since variables with an IV of less than 0.02 are considered to have no influence on the dependent variable, variables for which the IV was always less than 0.02 were not considered. Therefore, marital status and main source of life were excluded, leaving 16 variables. The variables and their IV scores for the five years are presented in Table A1 in Appendix A. In the following graphs, variables belonging to one dimension are represented with the same color: demographic variables are in blue; physiological variables are in gray; psychological variables are in green; economic variables are in red; and, social variables are in purple.
(1) Demographic dimension
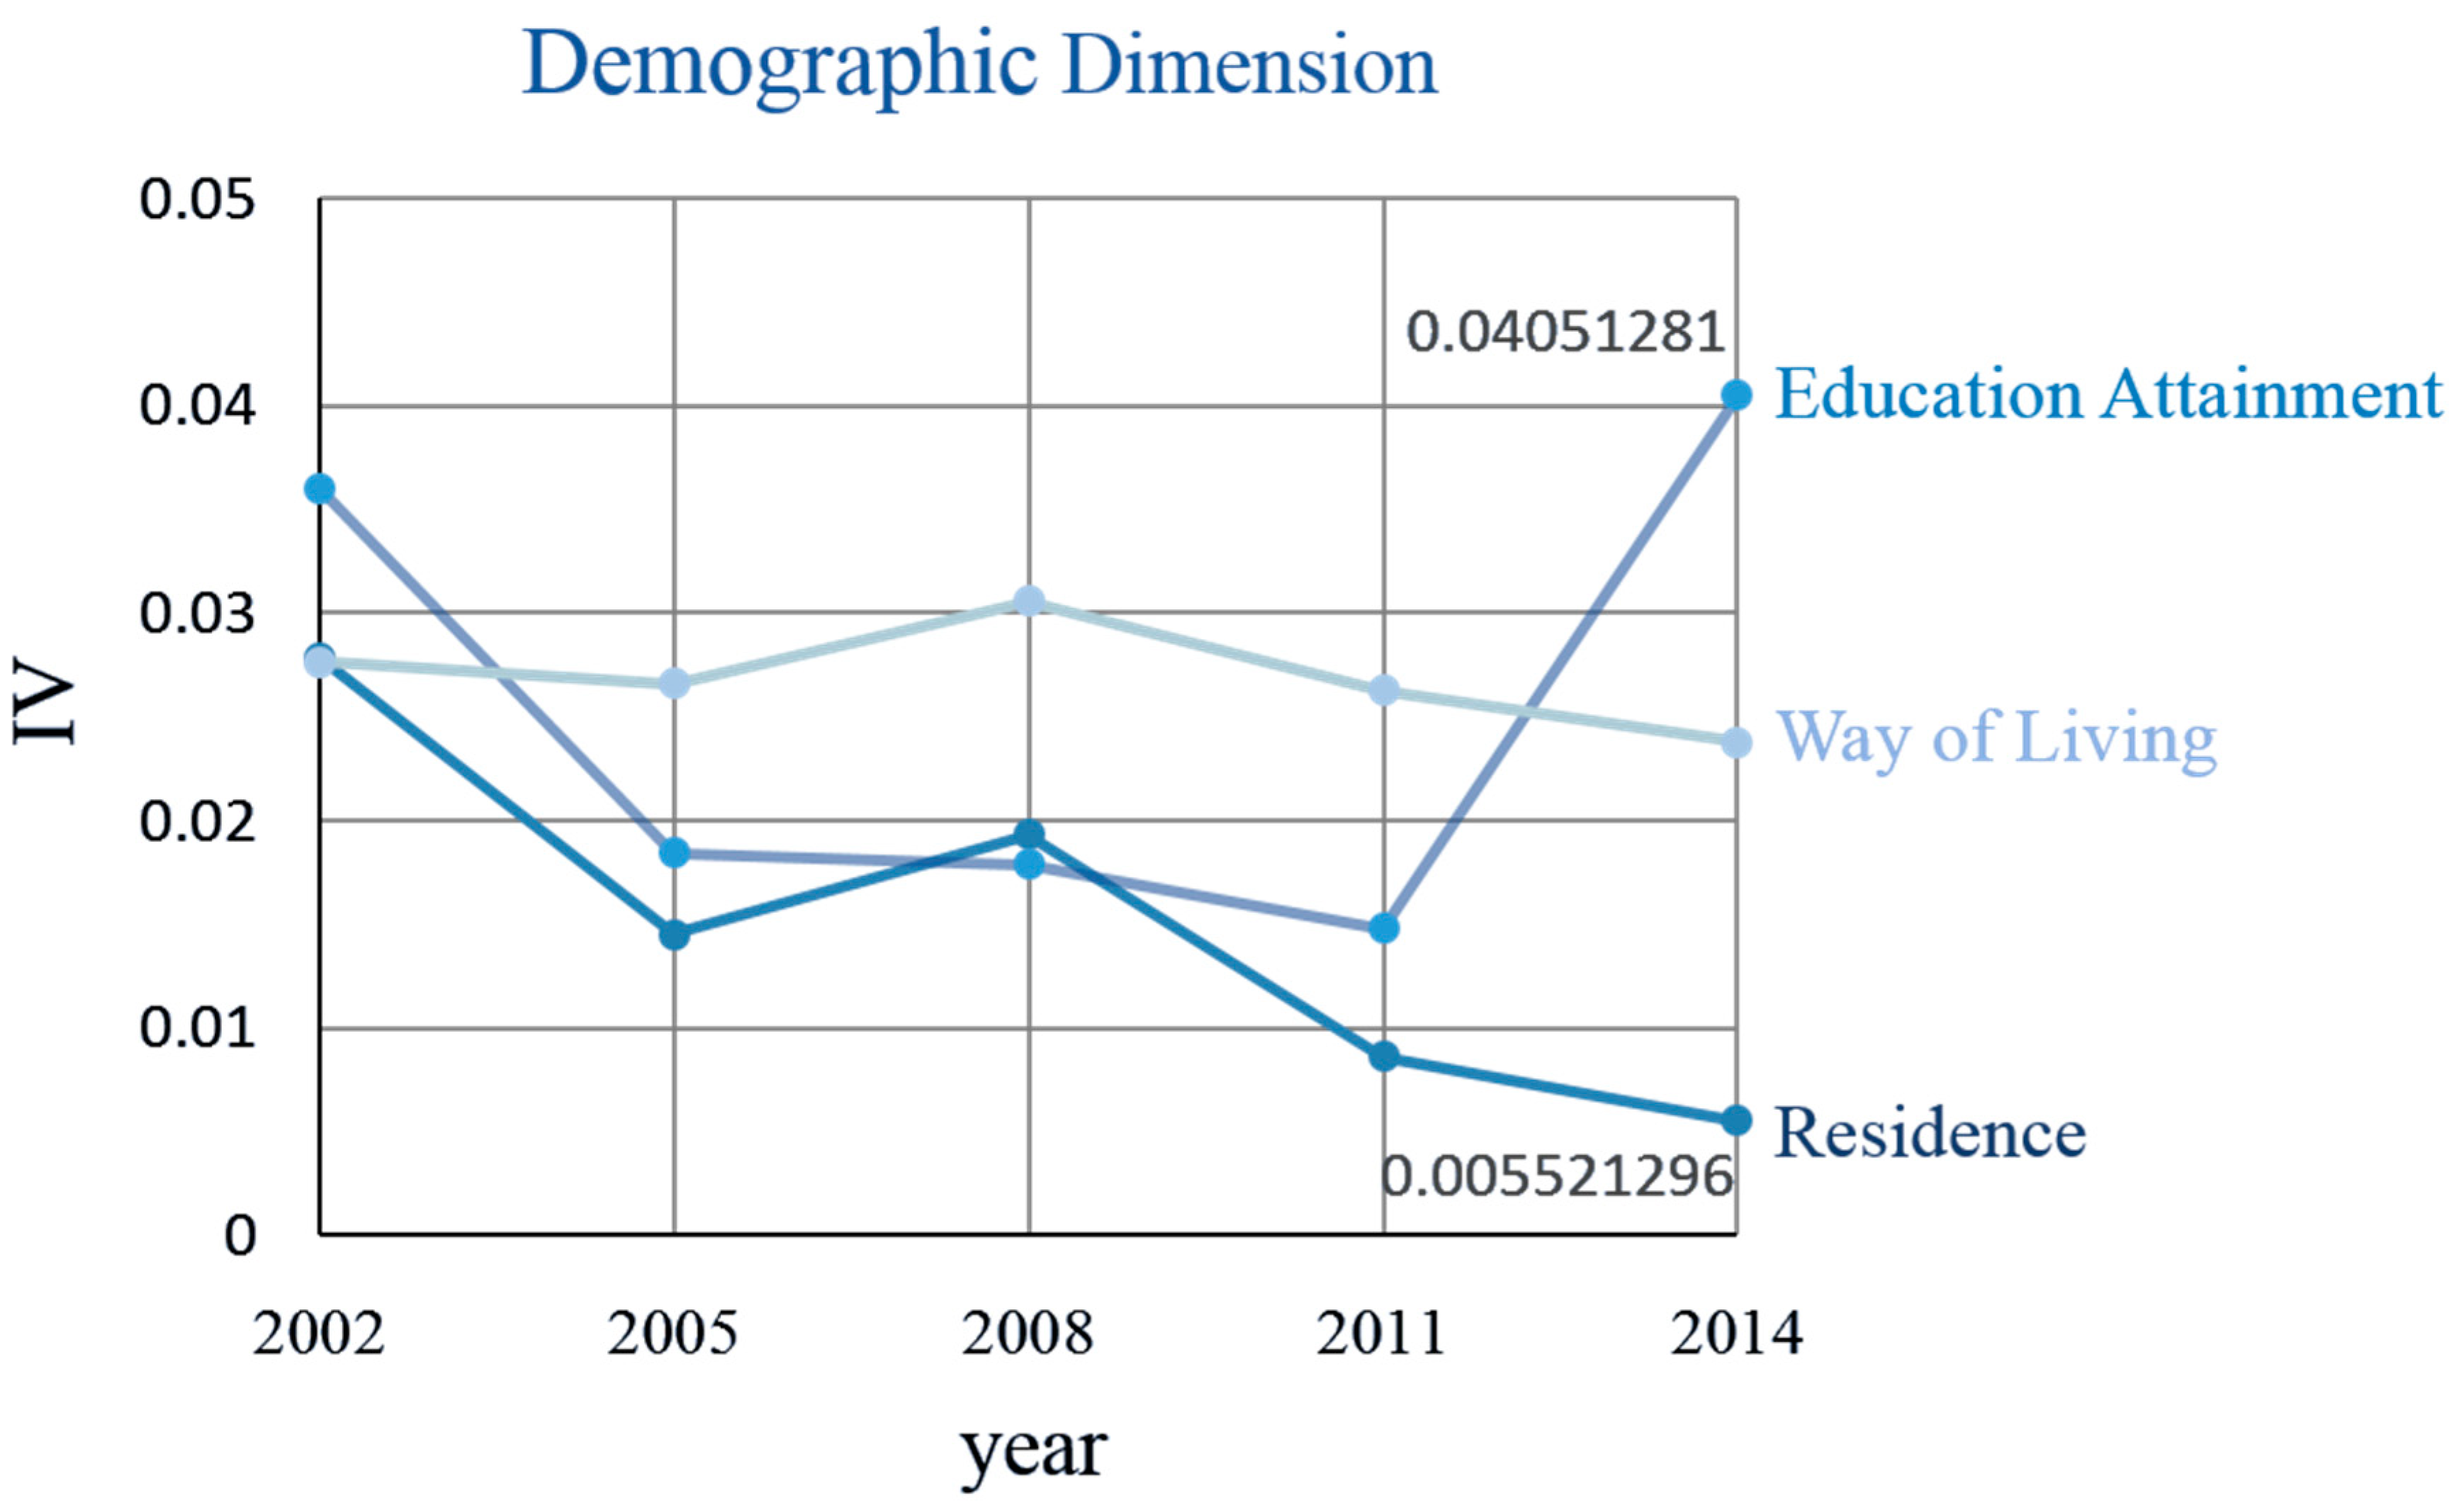
Figure 5 shows change in the influence of demographic variables. The interval range of the IVs for these variables is 0.00552–0.04051.
The IV for residence was higher than 0.02 only in 2002. That is, whether one lives in a rural area or an urban area had a weak influence on the life satisfaction of the elderly in 2002, and lost its influence from 2005 to 2014.
In 2002, education attainment had a slight impact on life satisfaction. During 2005 and 2011, the impact disappeared. In 2014, it again had a weak influence on life satisfaction. It is clear that the influence of education attainment has been changing over time.
From 2002 to 2014, way of living always had a slight effect on life satisfaction. Its influence has changed little in the past decade.
To conclude, the influence of residence and education attainment has fluctuated, while way of living has maintained a stable influence.
(2) Physiological Dimension
Figure 6 shows change in the influence of physiological variables. The interval range of the IVs for these variables is 0.0079–0.7691.
The IV of self-rated health was higher than 0.6, reflecting the strong influence that self-rated health has maintained on life satisfaction. From 2002 to 2008, the influence of self-rated health changed little, then increased from 2008 to 2011 and decreased after 2011.
Cognitive ability had a marginal effect on life satisfaction from 2002 to 2014. Its influence remained stable from 2002 to 2005, then declined from 2005 to 2008, and increased from 2008 to 2014.
PADL reflects the ability of the elderly to take care of themselves, while IADL reflects advanced skills that people need to live independently. During the period from 2002 to 2014, these variables had weak, or even no influence on life satisfaction. It is evident that the two variables have similar IVs and their influence shows an increasing trend from 2008 to 2014.
In general, the influence of self-rated health on life satisfaction has been significantly higher than for other variables, with slight changes. The influences of the other three variables are similar to each other and show an increasing trend from 2008.
(3) Psychological dimension
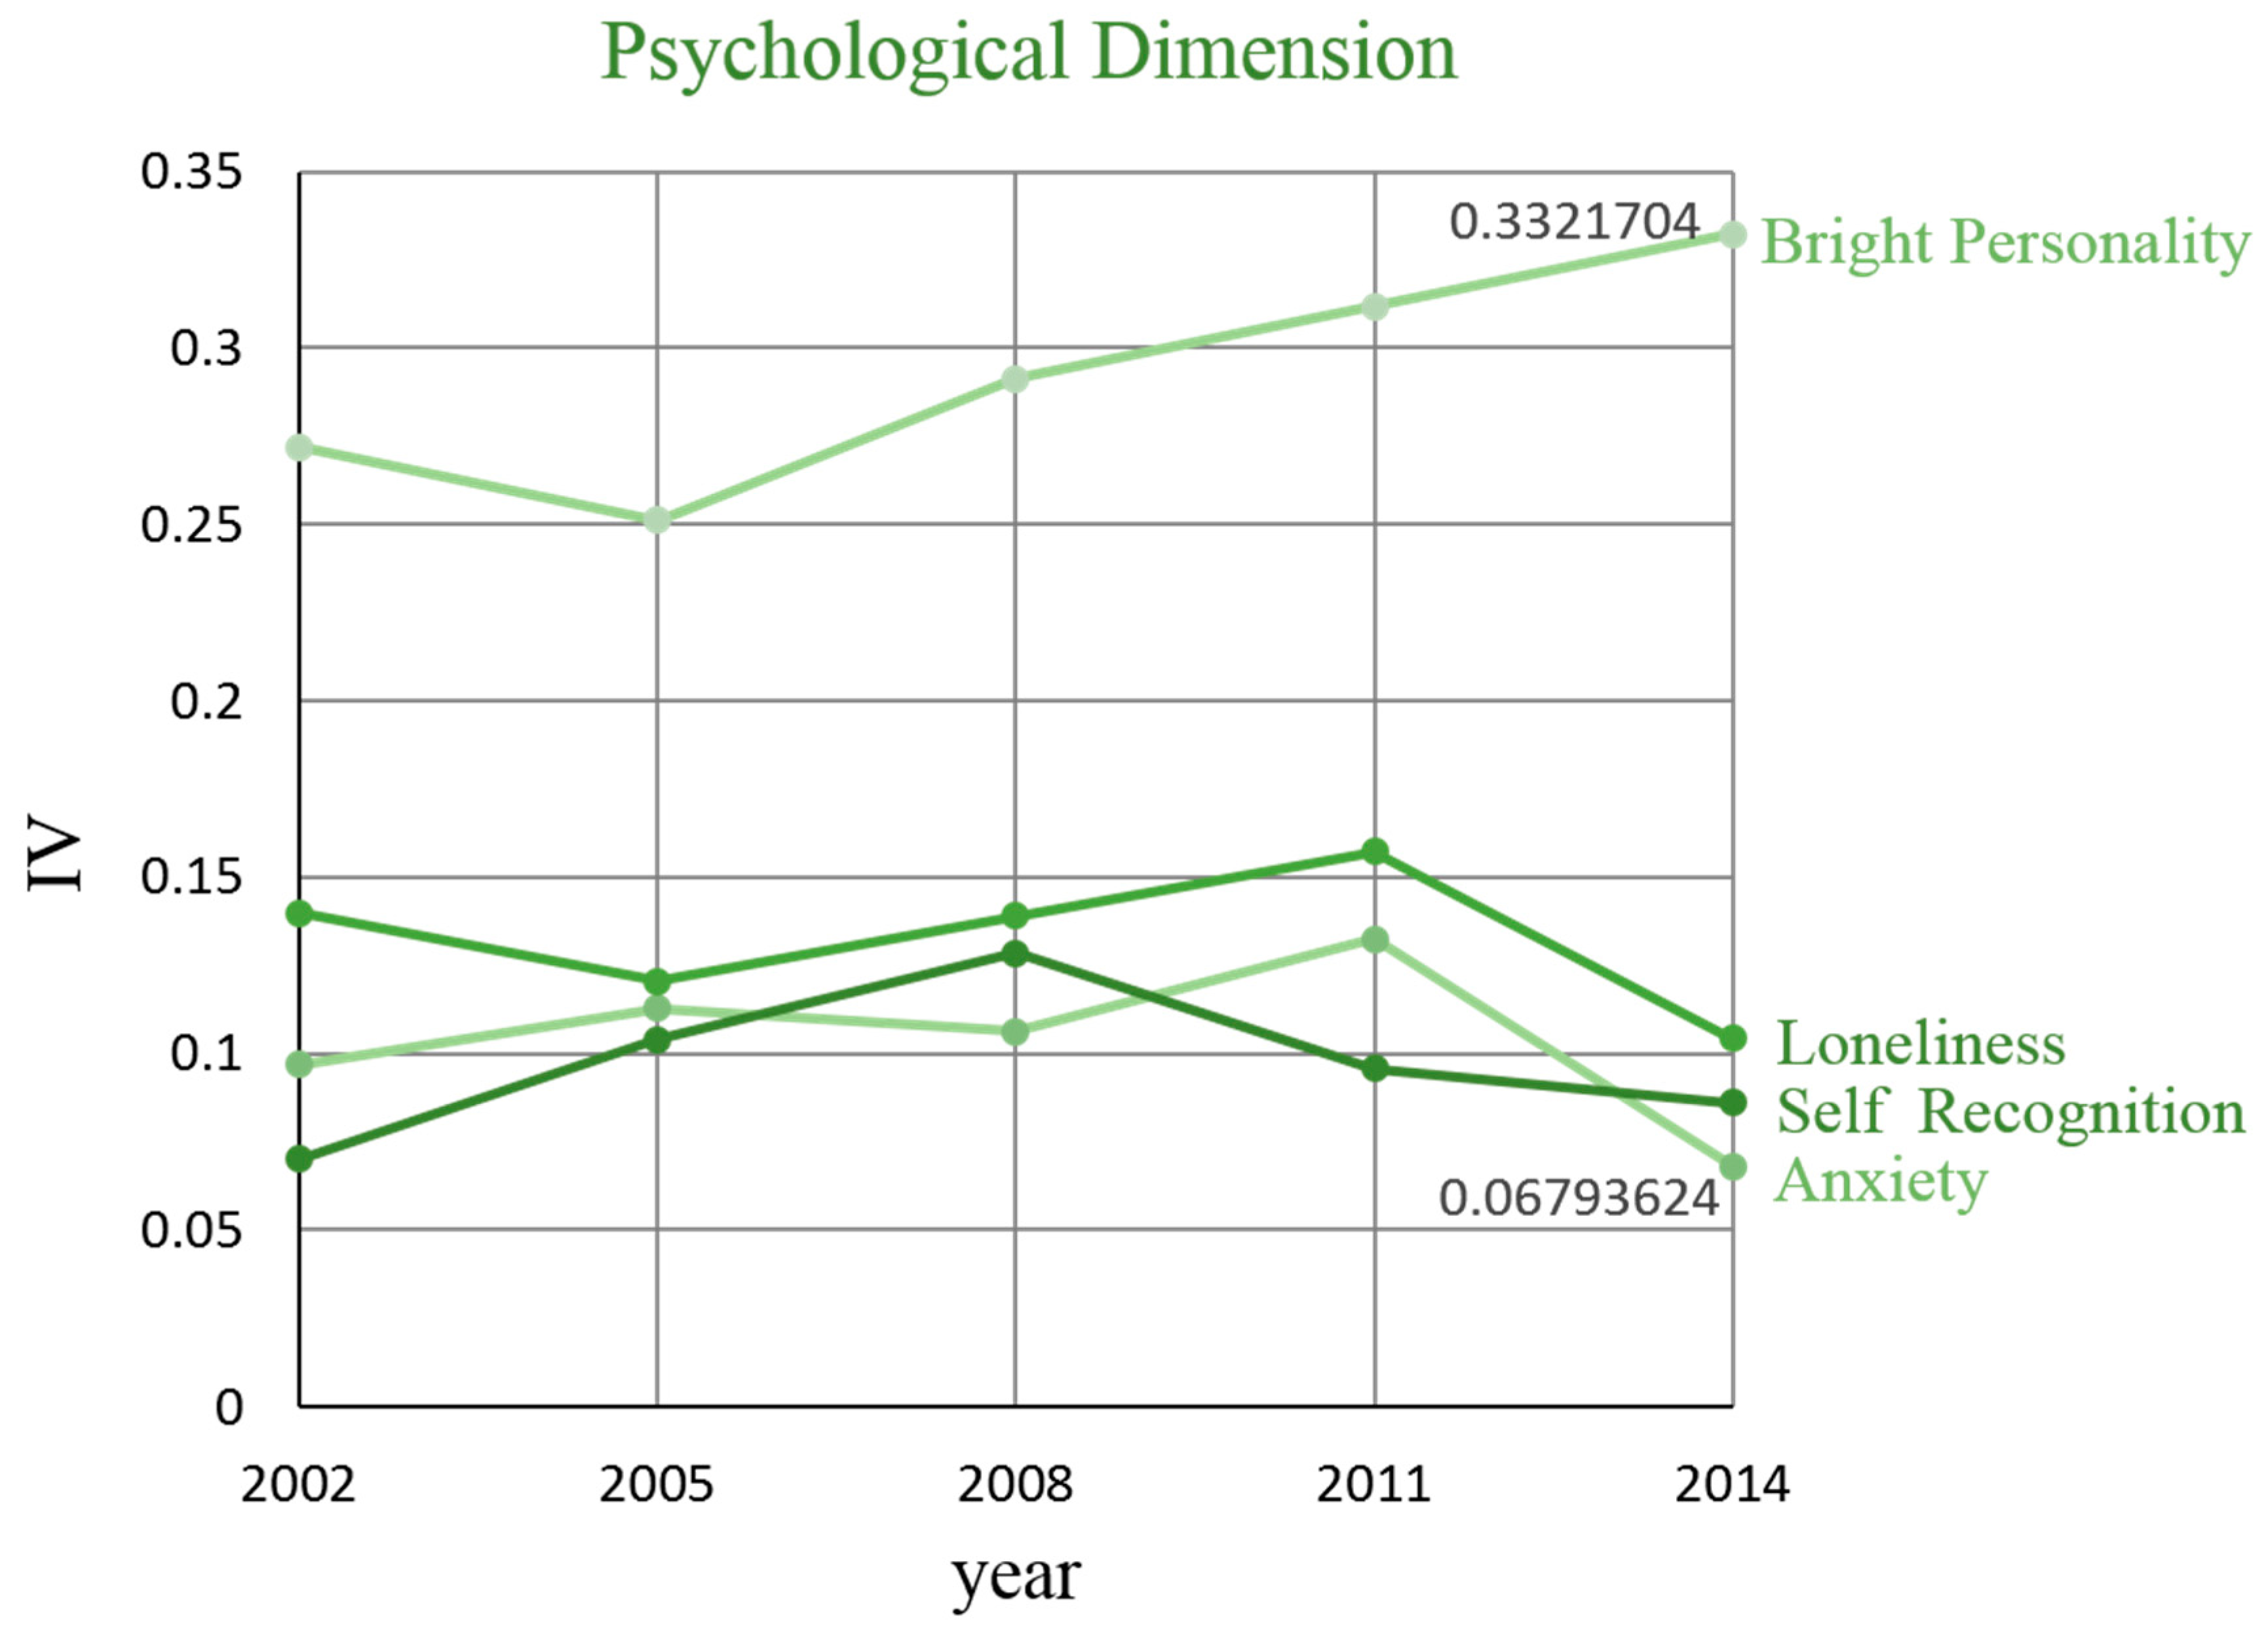
Figure 7 shows change in the influence of psychological variables. The interval range of the IVs for these variables is 0.0679–0.3322.
The influence of a bright personality is notably higher than that of other psychological variables. Since 2005, its influence has increased with each year, suggesting that the elderly are paying more attention to their inner feelings.
Loneliness is the second most influential factor among the psychological variables. From 2002 to 2005, the influence of loneliness decreased, from 2005 to 2011 it continued to increase, and from 2011 to 2014 it decreased one more time.
From 2002 to 2008, the influence of anxiety remained stable, from 2008 to 2011 it increased, and from 2011 to 2014 it decreased sharply.
Self-recognition in the elderly represents their attitude to themselves. Its influence showed a rising trend from 2002 to 2008, and it was on the decline from 2008 to 2014.
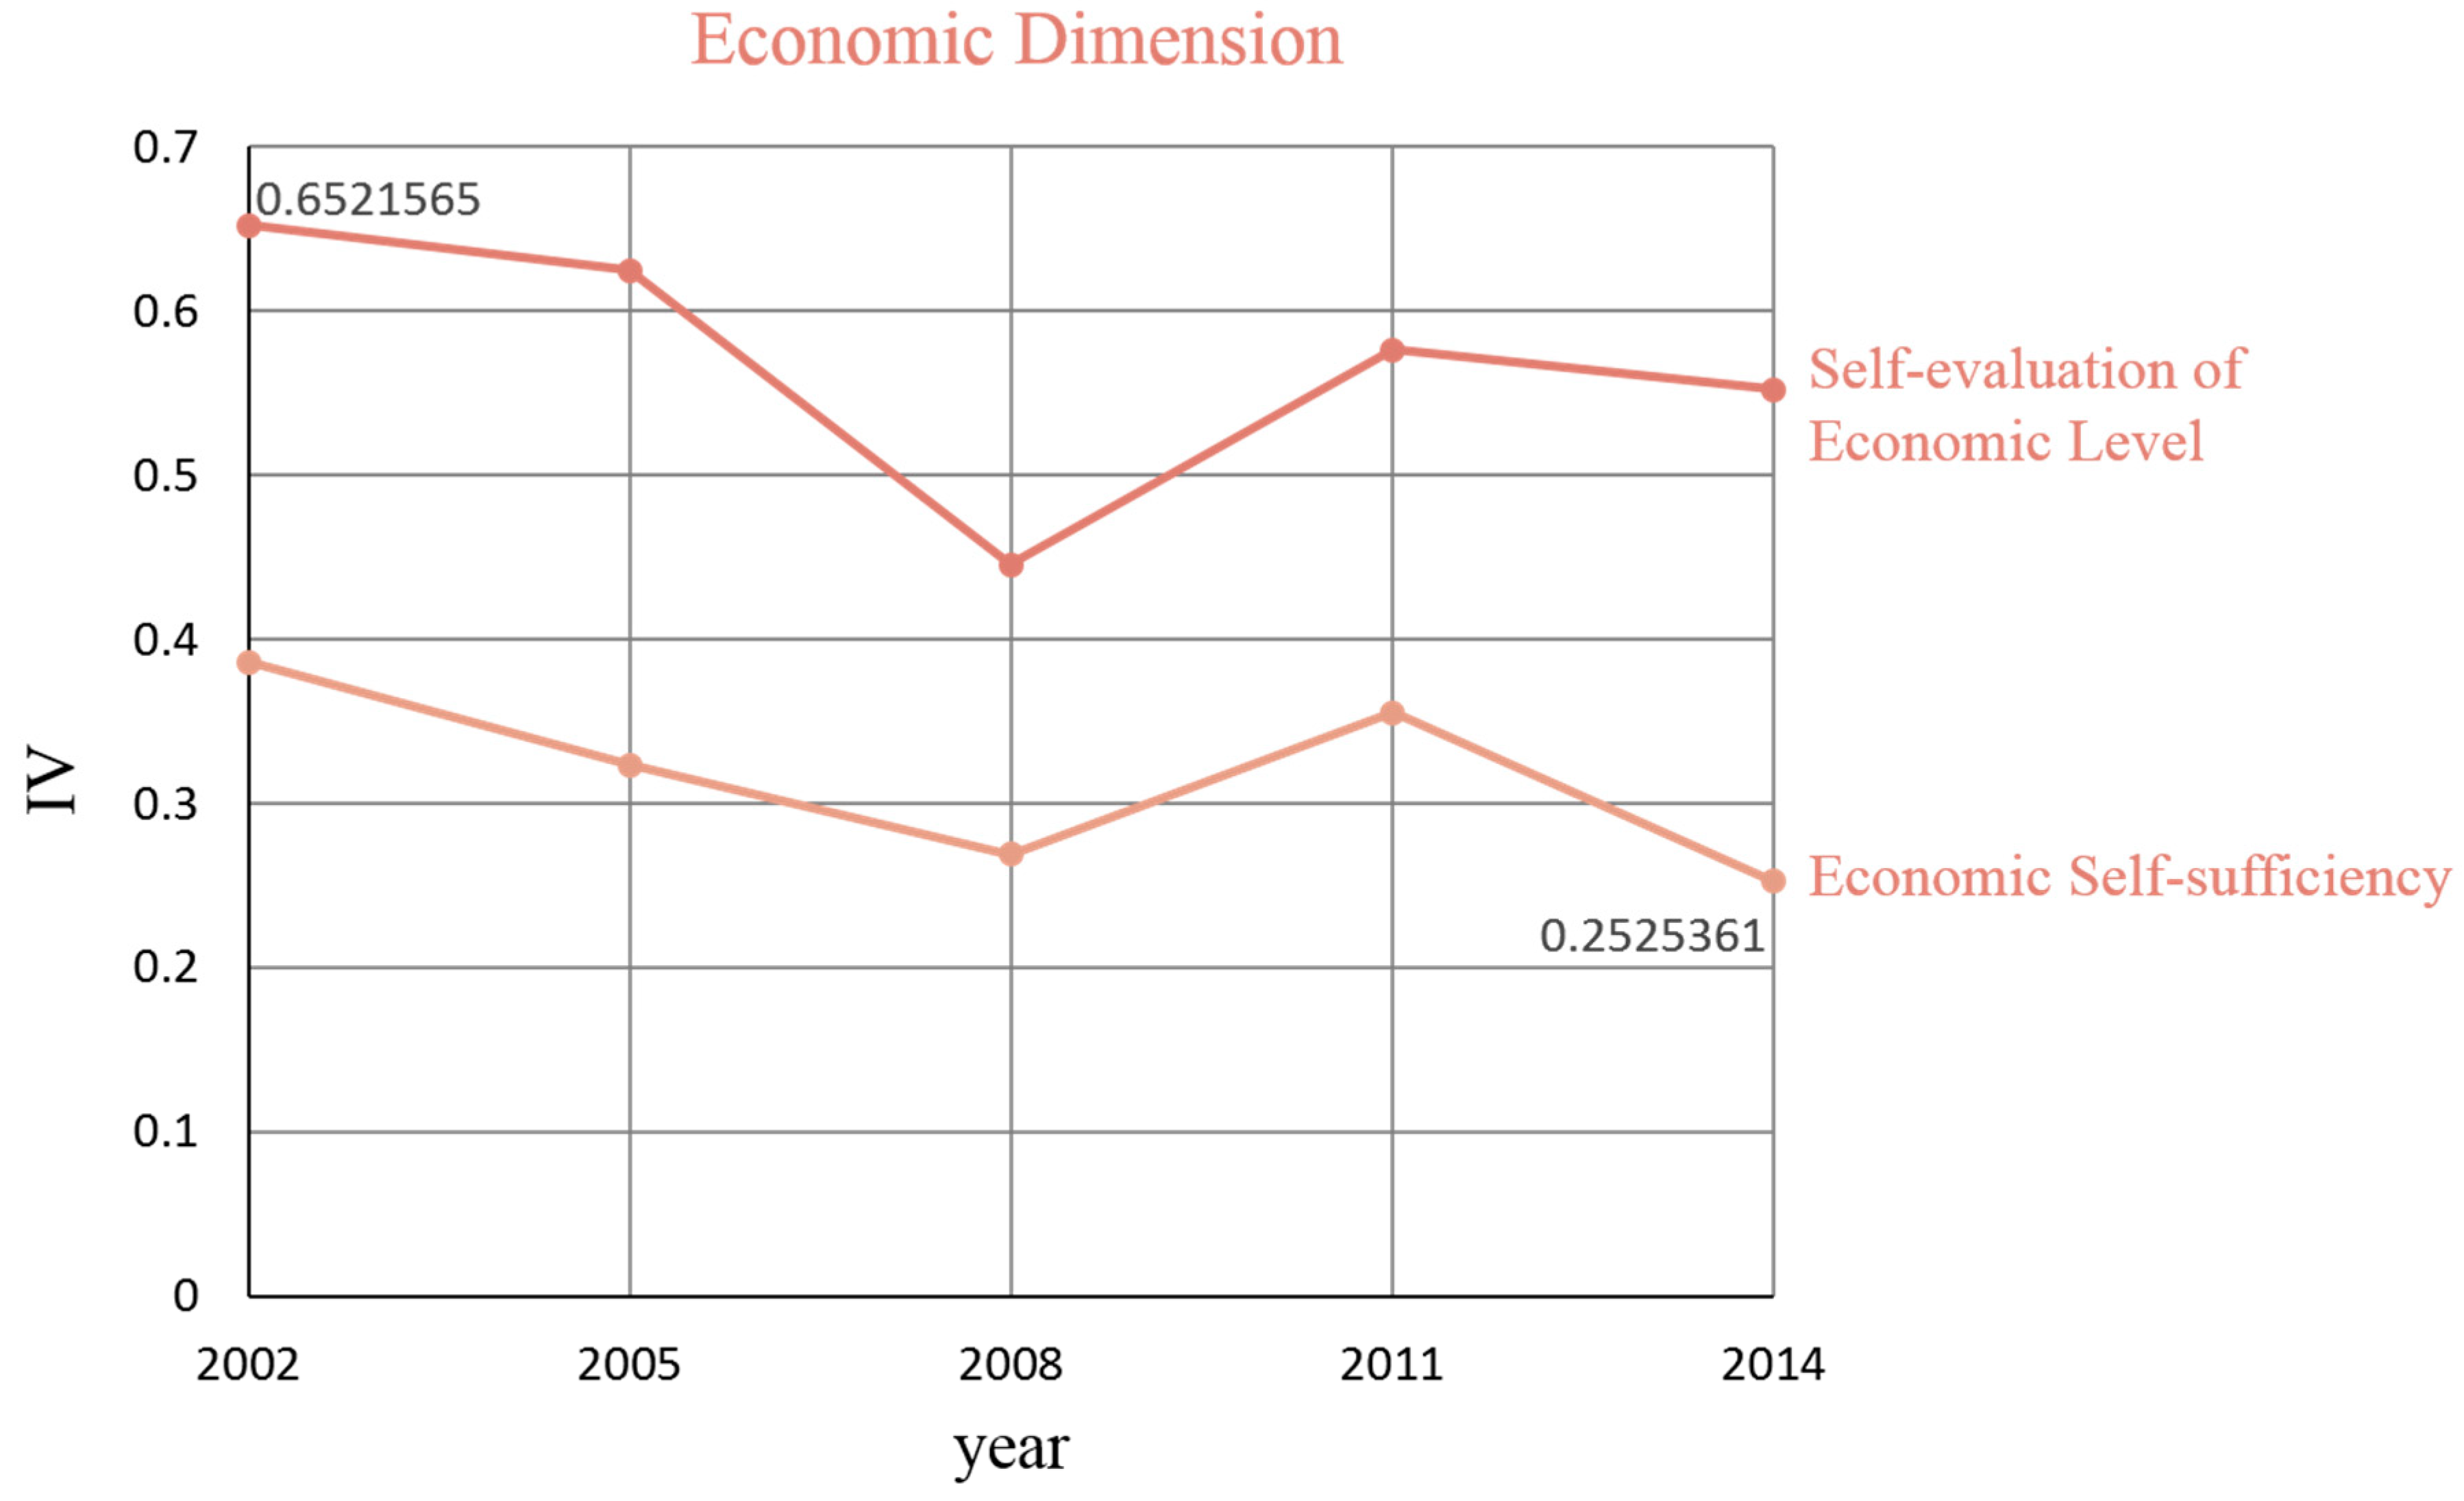
(4) Economic dimension
Figure 8 shows the change of influence of economic variables. The interval range of the IVs for these variables is 0.2525–0.6522.
The self-evaluation of economic level is a type of subjective judgement about people’s own economic conditions. Its IV was higher than 0.4 from 2002 to 2014, indicating that it is a strong influence on the life satisfaction of the elderly. In terms of the change in its influence, from 2002 to 2008 it decreased and, from 2008 to 2014, it first increased sharply and then leveled off.
In 2002, 2005 and 2011, economic self-sufficiency had a great influence on the life satisfaction of the elderly. In 2008 and 2014, it was at the general level. We can see that its influence decreased from 2002 to 2008, increased from 2008 to 2011, and then declined again after 2011.
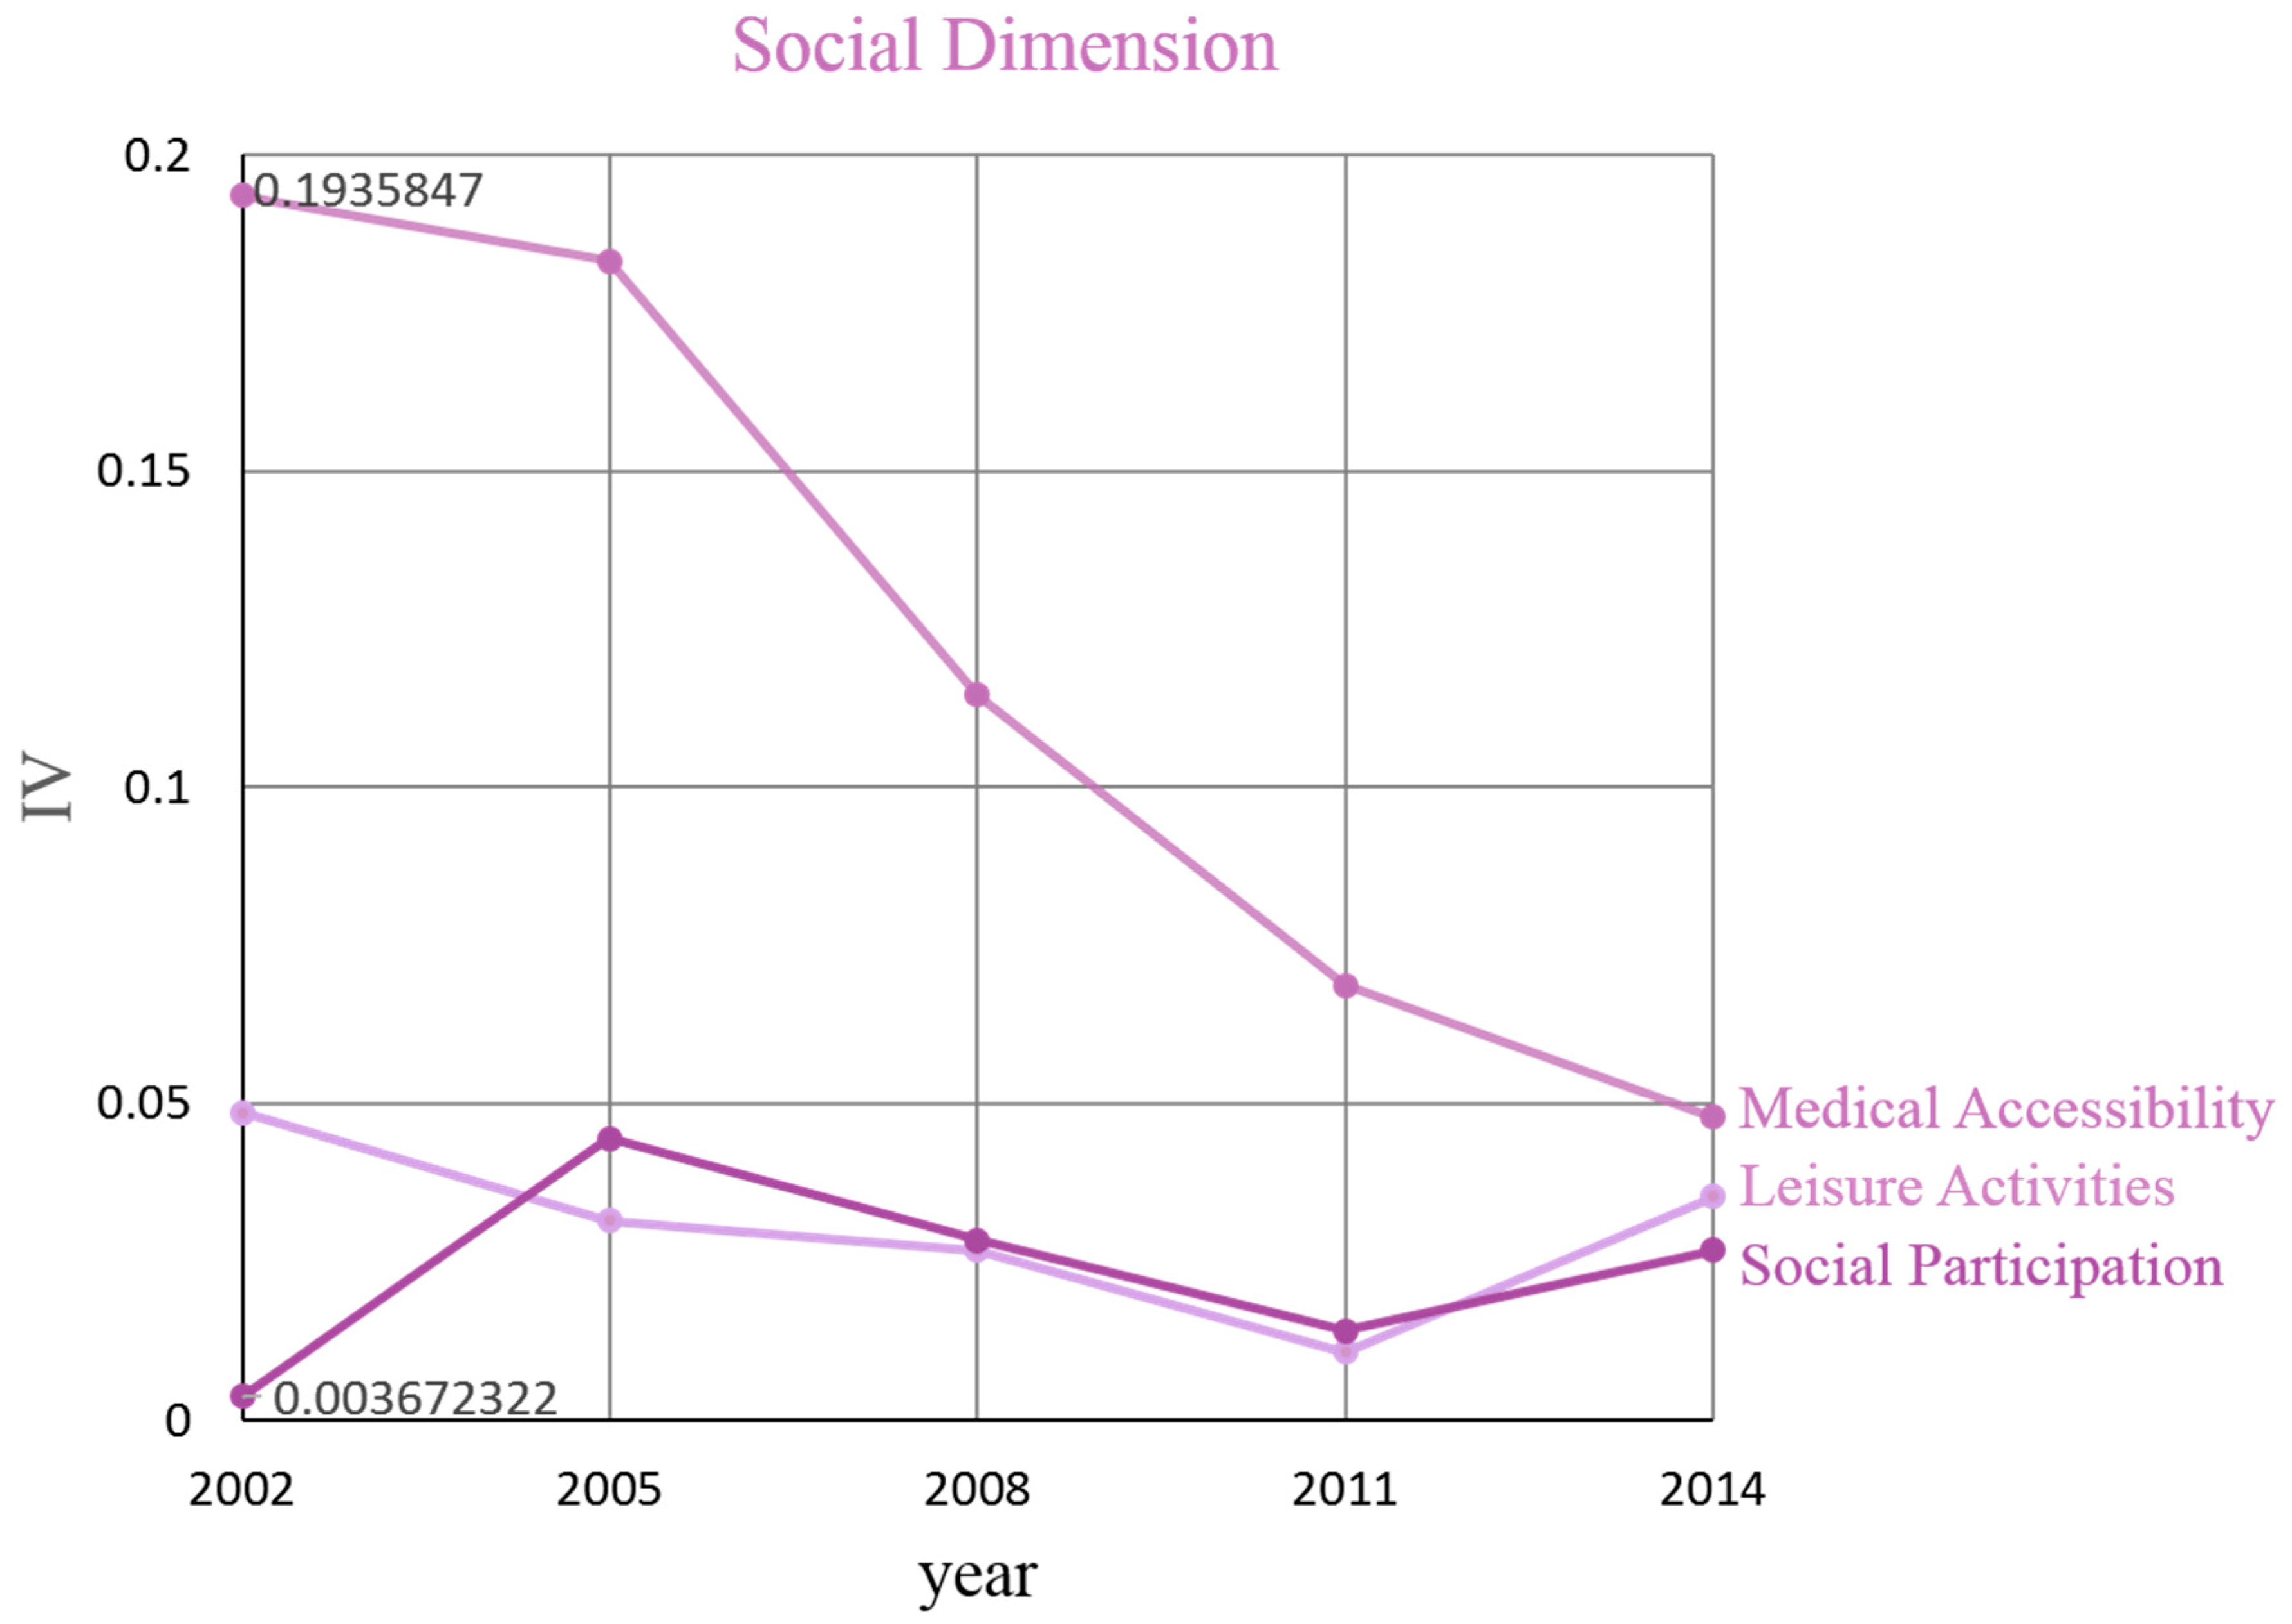
(5) Social dimension
Figure 9 shows change in the influence of social variables. The interval range of the IVs for these variables is 0.0037–0.1936.
Medical accessibility has always been the most influential variable in the social dimension. Medical accessibility was at the general level of influence from 2002 to 2008, and was of weak influence in 2011 and 2014. It can be seen that the influence of medical accessibility has been decreasing over the decade.
In 2002 and 2014, leisure activities and social participation had weak or even no influence. We can see that from 2005 to 2014, the change in influence of these two variables shared a common trend, declining from 2005 to 2011, and increasing from 2011 to 2014.
4.2.2. The Importance of Associated Factors in Different Years
We calculated the importance of the 16 factors to life satisfaction over the five years using the random forest model provided in R. The results are presented in Table A2 in Appendix A. During the years 2002 to 2014, the importance of these 16 factors associated with life satisfaction has changed. The importance, measured by the IV ranking, reflects the relative degree of importance in terms of the influence of these factors. Based on the results of the random forest model, changes in the importance of each associated factor can be analyzed.
We assume for each year that a variable ranking in the top one-third is considered to be a variable of strong importance, a variable ranking in the middle third is of general importance, and a variable ranking in the bottom third is of weak importance. Since the study concerns data for five years spanning more than a decade, in order to clearly present the important variables and show the change for all variables, we divided the 16 variables into three categories for visual analysis. We selected variables that had been ranked in the top five in at least one of the five years for visualization. These are the first-category variables and their ranking changes are presented in Figure 10. Among the remaining variables, those which have entered the top 10 at least once are the second-category variables and are shown in Figure 11. Lastly, variables which have always ranked in the bottom third are the third-category variables and are shown in Figure 12.
As shown in Figure 10, we found that there were seven first-category variables, covering the physiological, psychological, economic and social dimensions and including, self-rated health, cognitive ability, IADL, economic self-sufficiency, self-evaluation of economic level, bright personality, and medical accessibility. Among these first-category variables, the ranking of self-rated health in physical dimension is very stable and has always ranked first in each of the five years, meaning that self-rated health has always been the most important factor. The ranking of self-rated economic level in the economic dimension has also been stable in second place, and is an important variable second only to self-rated health. Economic self-sufficiency in the economic dimension has ranked third or fourth in each of the five years. The rankings of bright personality in the psychological dimension are close to those of economic self-sufficiency, with both remaining stable in either third or fourth place. However, the ranking changes for medical accessibility, cognitive ability and IADL are large. Medical accessibility in the social dimension remained stable in fifth place from 2002 to 2008 but continued to drop after 2008, showing that the importance of medical accessibility remained unchanged from 2002 to 2008 and declined after 2008. IADL entered the top five only in 2011. Its importance changed slightly from 2002 to 2011, but dropped sharply in 2014. Cognitive ability entered the top five only in 2014. Its importance decreased from 2002 to 2005 and increased after 2008.
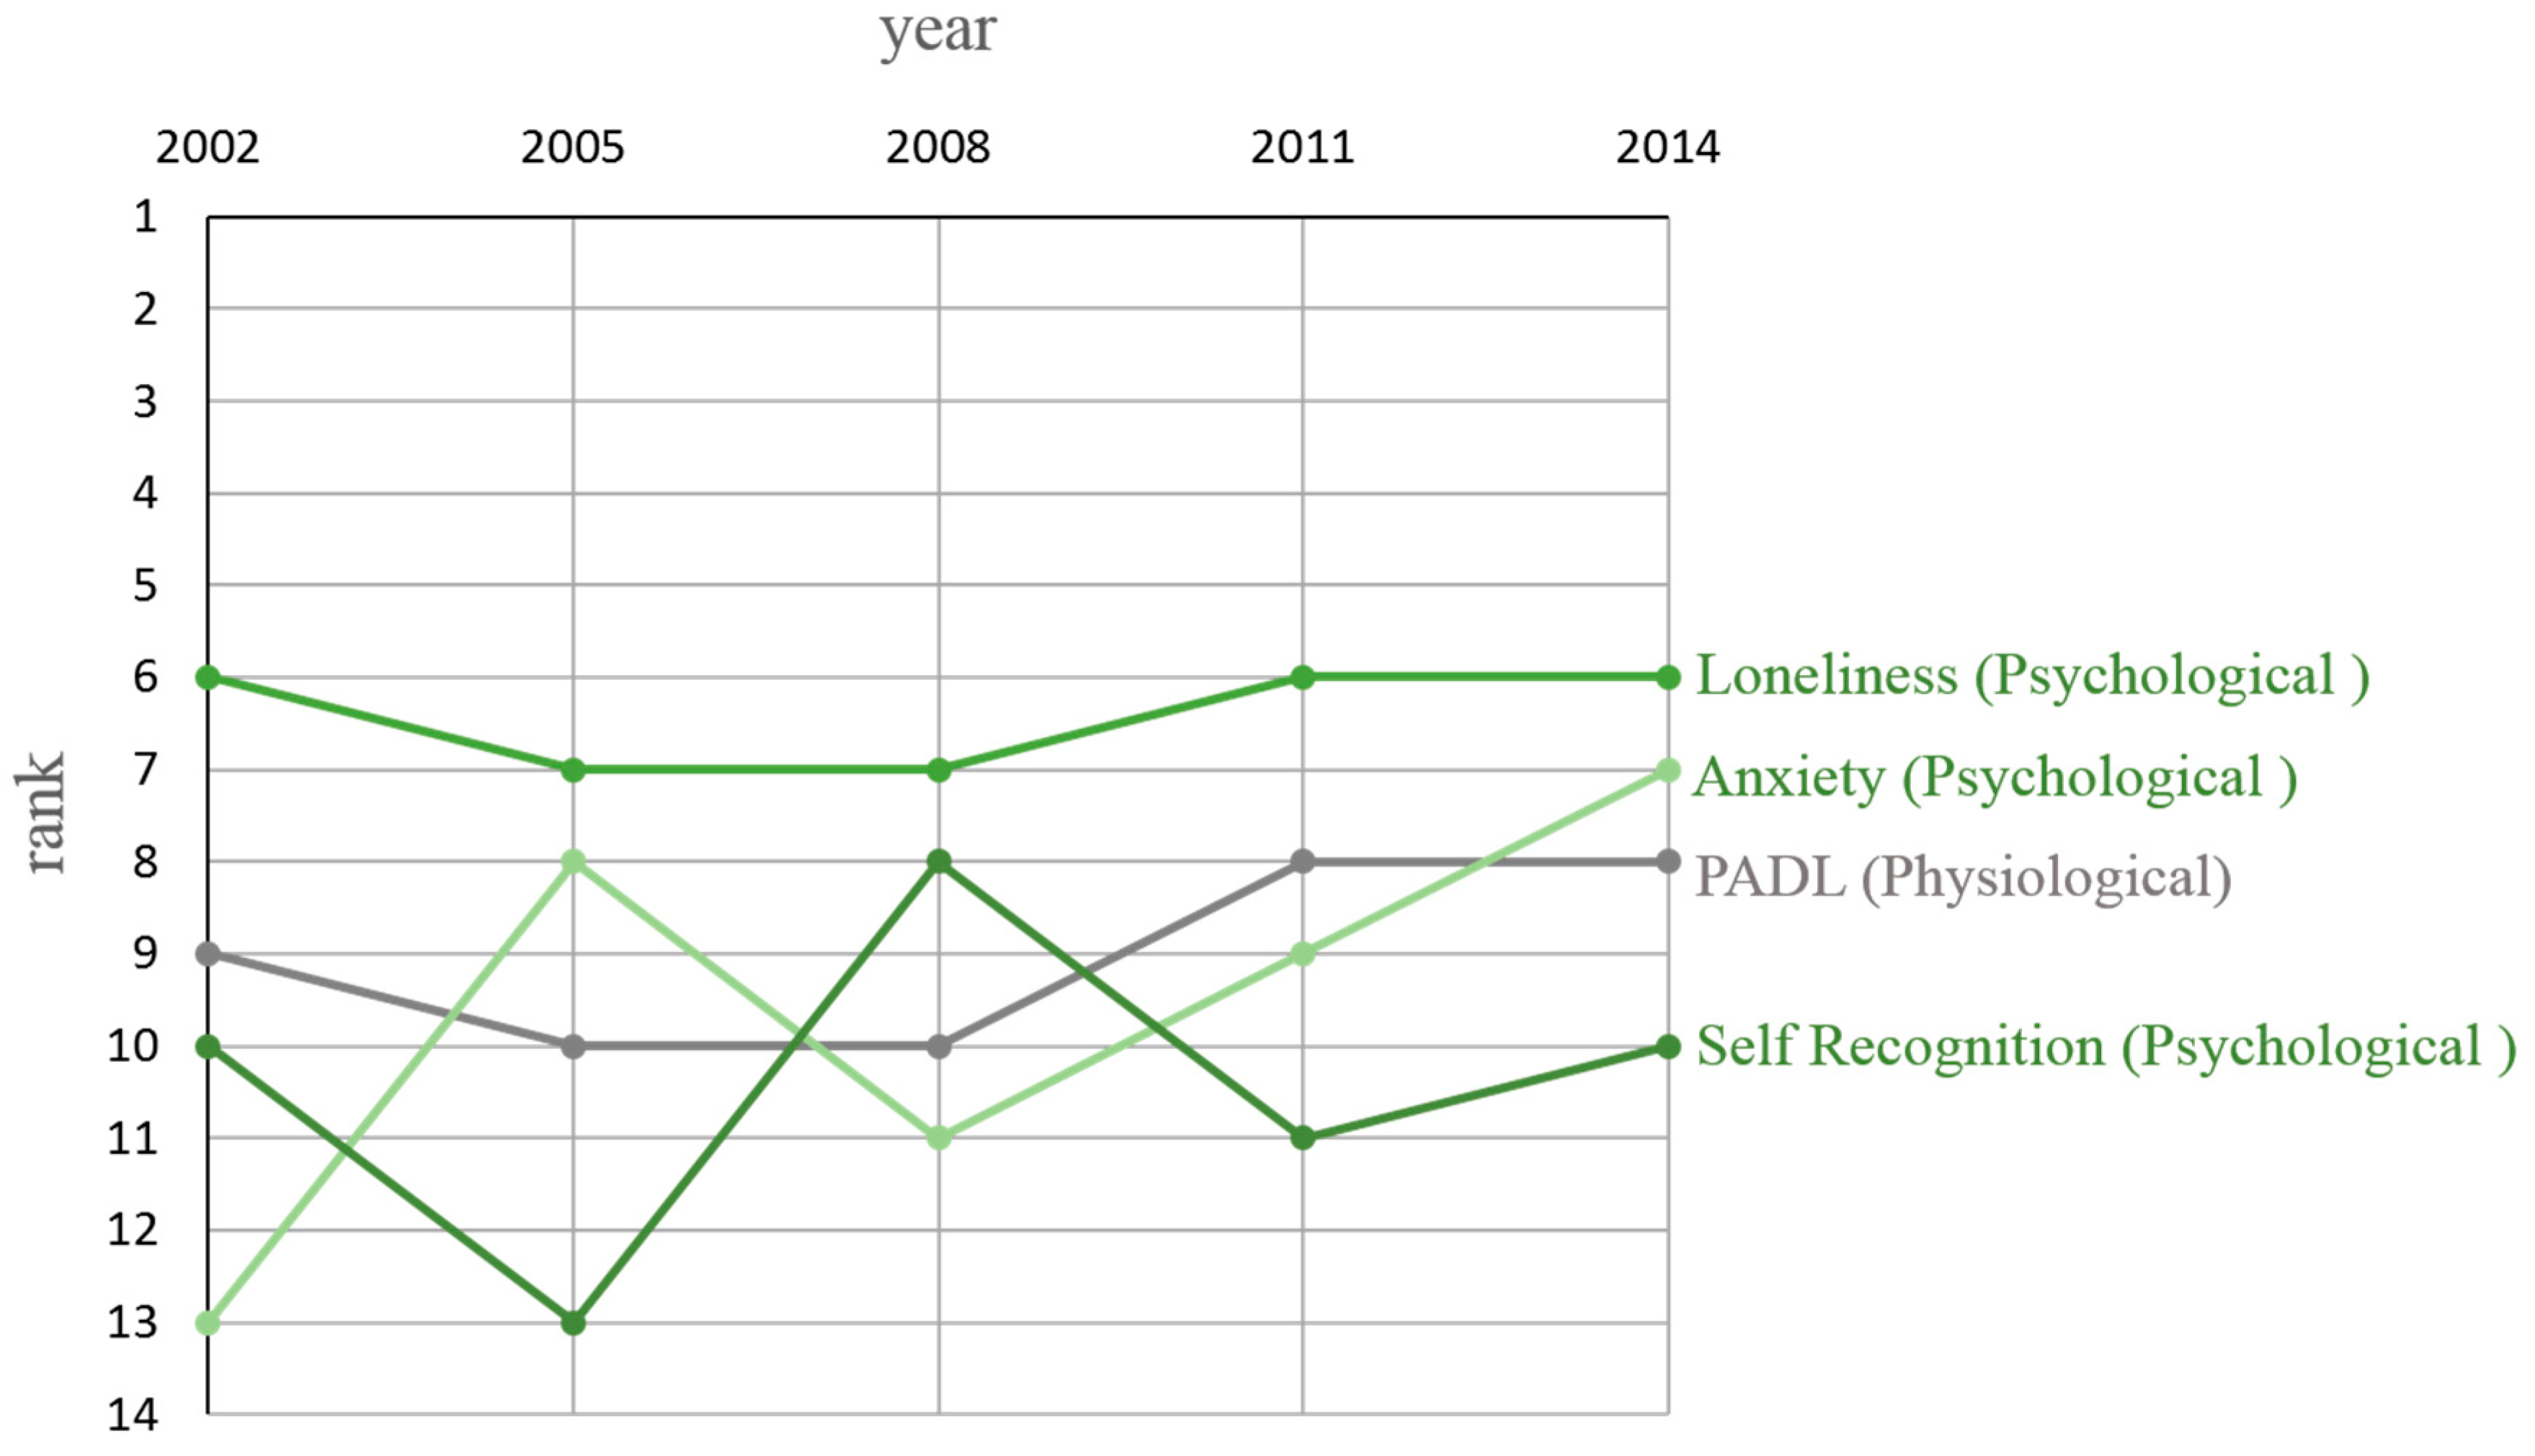
Figure 11 shows the change in importance of second-category variables during the twelve years. The second-category variables are loneliness, PADL, anxiety and self-recognition, and are mainly composed of variables in the psychological dimension. Loneliness ranked stably at sixth or seventh place, and is the most important variable among the second-category variables. From 2002 to 2008, the importance of PADL was relatively stable. It increased from 2008 to 2011, and remained unchanged after 2011. The ranking for anxiety fluctuates greatly. Its importance first rose and then dropped, and finally rose again. The importance of self-recognition has also changed greatly.
The change in importance of third-category variables from 2002 to 2014 is shown in Figure 12. The third-category variables are mainly composed of social and demographic variables and include, leisure activities, social participation, education attainment, way of living and residence. The importance of leisure activities decreased strikingly from 2002 to 2005, rebounded in 2008, and remained unchanged after 2008. As for social participation, the importance increased significantly from 2002 to 2005, decreased significantly in 2008, and changed slightly after 2008. For education attainment, its importance dropped from 2002 to 2008, and increased sharply from 2011 to 2014. The importance of way of living increased from 2002 to 2005, and decreased from 2005 to 2014. Residence ranked either fifteenth or sixteenth from 2002 to 2011 and rose after 2011. The overall importance of residence has been low in general.
5. Discussion
This study investigated factors affecting the life satisfaction of elderly Chinese, and changes in the influence and importance of these factors. Based on multiple years of survey data from the CLHLS project, our analysis examined 18 factors in five dimensions—demographic, physiological, psychological, economic and social. We found that the economic self-sufficiency and self-evaluation of economic level variables in the economic dimension have a strong influence on life satisfaction. Though their degree of influence kept changing, their importance has remained among the top four factors. In the physiological dimension, only self-rated health had a strong influence on life satisfaction. Similar to economic self-sufficiency and self-evaluation of economic level, its influence fluctuated notably, although it has always been the most important variable. Other physiological variables such as cognitive ability, PADL and IADL were of weak influence over the decade with their importance changing greatly. Demographic variables were of weak influence or were not influential at some times, and their importance rankings have been at the bottom, indicating their low influence and importance. In the psychological dimension, bright personality is the most influential variable. Its influence has been among the top four factors and has been on the rise during the recent decade. Loneliness is the second important psychological variable and its importance has remained stable. The influence of other psychological variables was relatively weak. These variables belong to the second-category variables. After 2011, the importance of all psychological variables increased. Medical accessibility is the most influential variable among all social dimension variables, but its influence has been declining over the decade. Its importance was stable at first and then declined. The other two social variables belonging to the third-category variables were of very weak influence and have been of low importance over the twelve years.
This study made several contributions. Firstly, it affirmed some of the influencing factors identified from the life satisfaction literature. Our results showed that self-rated health, economic self-sufficiency, economic level and bright personality have always been the most important variables, which is consistent with findings from previous studies. Liu [13] found that health status is an important factor affecting the life satisfaction of the elderly. A comparative study on the factors associated with the life satisfaction of elderly people based on surveys in 2003 and 2008 noted that economic status and health status are important components of the quality of life of the elderly. Self-evaluation of economic condition and self-rated health have become an important factor [14]. Ho et al. [8] also found that health and adequate income to meet living expenses were rated as the most important factors. As found in this study, psychological characteristics have an impact on life satisfaction, with personality being a particularly strong influence. Cai’s study suggested that psychological factors have a great influence on the self-rated life satisfaction of elderly women [22]. Foreign studies reported that, as expected, depressive symptoms demonstrated a significant association with life satisfaction in both women and men [23]. Loneliness has a significant impact on older people’s life satisfaction [24]. Consistent with the findings of some scholars, demographic factors have little or no effect on the life satisfaction of elderly people. For example, Mao [25] reported that the elderly’s life satisfaction was not closely related to their academic qualifications or household composition. However, some studies have drawn different conclusions [26,27]. A study based on the Shanghai elderly survey also found that the richness of individuals’ engagement in spiritual and cultural activities was particularly important for the elderly to rate their life satisfaction as high [14]. One explanation of the difference in results might be the difference in samples. Based on this study, a model of life satisfaction of elderly Chinese could be designed and tested, which may be a worthwhile exploration.
Our study also discovered some interesting sociological phenomena and effects of social change. For example, the bright personality variable reflects a positive attitude towards life, and it has an increasingly great impact on elderly people’s life satisfaction. According to Diener’s study [28], personality affects social comparison direction. People with a bright personality tend to pay more attention to people who are worse-off than themselves. Such people can enjoy more positive emotions. It is suggested that the elderly are paying more attention to gaining positive emotions now. With the formation of a medical insurance system with Chinese characteristics, elderly people can access medical services more easily. According to the five years of data analyzed, the proportion of people choosing medical accessibility has kept increasing, reaching 97% in 2014. Medical accessibility’s influence is not as important as it was and its influence has kept declining. To conclude, Health and economic status are still important components of quality of life for the elderly. Promoting healthy aging and enhancing their economic conditions become the keys to improving their life satisfaction.
Next, our conclusions were drawn from the large-scale data of elderly Chinese people, with a representative sample. This study visualized the data to obtain useful findings, based on which we can make suggestions for improving the life satisfaction of elderly Chinese people. Healthy aging should be promoted to assist older individuals. Community services should be improved, such as organizing regular medical examinations and spreading knowledge to raise elderly people’s awareness of health. Active aging should also be advocated to deal with the aging problem. Elderly people should be encouraged to participate in social and economic activities so as to help them maintain a positive mind and increase their life satisfaction. Besides which, elderly people’s psychological state cannot be ignored. Communities should provide mental health services and counseling to help elderly people adapt to their life in old age.
The fourth contribution of this study is the research methodology and our data analysis approach. To achieve the objective of study, we used multi-year, open datasets from a well-known survey project, along with sophisticated data transformation so that data could be processed using the most appropriate measure and machine learning model. The use of information value as a measure of each independent variable’s contribution to the dependent variable is innovative for the study of elderly Chinese. This study provides an example of conducting empirical analysis based on open datasets. Faced with the worldwide trend of open data, more and more open health data will be published. In the era of big data, the development of smart health ecology must rely on data. Integrating and utilizing open health data can provide solutions for public health issues. This study has confirmed the value of an open dataset for the field of smart health.
6. Conclusions
This study conducted a visual analysis of open datasets provided by the CLHLS project to explore the evolution of the influence and importance of factors affecting elderly Chinese people’s life satisfaction from 2002 to 2014. It was found that even though influencing factors belong to the same dimension, they can differ greatly in their influence and importance ranking. In addition, the findings revealed that the influence of most factors has undergone changes over the past ten years. In particular, the influence of a bright personality has been increasing since 2005, while the influence of medical accessibility has been declining. Self-rated health, and self-evaluation of economic level, economic self-sufficiency and bright personality were the most important factors during these ten years. Except for these four factors and loneliness, the factor rankings of importance have been changing. Third-category variables, including residence, education attainment, way of living, leisure activities and social participation, have been ranking the lowest and have remained unimportant. It can be concluded that the most important factors are four factors belonging to the physiological, economic and psychological dimensions, while the most unimportant factors belong to the demographic and social dimensions.
Based on the results of the empirical analysis, this study provides suggestions for healthy aging and active aging strategies. In addition, this study revealed the huge value contained in open health data.
A potential weakness in the present study is the sample. The sample only involves data for five years as the survey was conducted discontinuously in the years 2002, 2005, 2008, 2011 and 2014, which may reduce the representativeness of our findings. Another limitation is that we only explored the influence and importance of these factors without studying their influencing mechanism.
In the future, more and more open health data will be utilized. The trend is to integrate and connect open health data to create more value. Driven by data, more innovations will be achieved. It is believed that the overall exploitation of open health data will promote the development of smart health ecology.
Author Contributions
Conceptualization, D.W.; methodology, D.W. and H.Z.; software, H.Z.; validation, H.Z.; formal analysis, H.Z. and Y.W.; investigation, H.Z. and Y.W.; resources, D.W.; data curation, H.Z.; writing-original draft preparation, H.Z.; visualization, Y.W.; editing and revision, J.C.; supervision, D.W. and J.C.; project administration, D.W. and J.C.; funding acquisition, D.W.
Funding
This research was funded by the Wuhan University independent research project (Humanities and Social Sciences) “Human-Computer Interaction and Collaboration Team” (Whu2016020) supported by “the Fundamental Research Funds for the Central Universities”.
Acknowledgments
The authors thank Peking University Health Ageing and Development Research Center who provided the Chinese Longitudinal Healthy Longevity Survey data.
Conflicts of Interest
The authors declare no conflict of interest.
Appendix A

Table A1.
IV scores of each variable for each year.
| Dimension | Variable | IV(2002) | IV(2005) | IV(2008) | IV(2011) | IV(2014) |
|---|---|---|---|---|---|---|
| Demographic | residence (Res) | 0.0278374 | 0.01452419 | 0.01930601 | 0.008580484 | 0.005521296 |
| education attainment (EA) | 0.03603958 | 0.01840902 | 0.01786522 | 0.01476984 | 0.04051281 | |
| way of living (WOL) | 0.02764898 | 0.02660099 | 0.03054632 | 0.02624152 | 0.02379758 | |
| Physiological | self-rated health (SH) | 0.6511311 | 0.6938869 | 0.6455845 | 0.7691134 | 0.6860869 |
| cognitive ability (CA) | 0.03939868 | 0.04071812 | 0.02321586 | 0.04352855 | 0.05212943 | |
| personal activities of daily living (PADL) | 0.0216289 | 0.01242052 | 0.01440098 | 0.02388708 | 0.02874398 | |
| instrumental activities of daily living (IADL) | 0.007904876 | 0.009404295 | 0.00888504 | 0.02327563 | 0.03020037 | |
| Psychological | bright personality (BP) | 0.2718822 | 0.251137 | 0.2913605 | 0.3117068 | 0.3321704 |
| anxiety (Anx) | 0.09667799 | 0.112602 | 0.1060422 | 0.1324252 | 0.06793624 | |
| loneliness (Lon) | 0.1396295 | 0.1202805 | 0.1388325 | 0.1571898 | 0.1040174 | |
| self-recognition (SR) | 0.06994882 | 0.1039182 | 0.1284644 | 0.09550338 | 0.08578342 | |
| Social | leisure activities (LA) | 0.04847356 | 0.0314009 | 0.02669421 | 0.01073159 | 0.03518244 |
| social participation (SP) | 0.003672322 | 0.04438107 | 0.02840223 | 0.01404288 | 0.02676133 | |
| medical accessibility (MA) | 0.1935847 | 0.1832193 | 0.1144704 | 0.0685712 | 0.04771324 | |
| Economic | economic self-sufficiency (ES) | 0.3858552 | 0.3233415 | 0.2686431 | 0.3555146 | 0.2525361 |
| self-evaluation of economic level (SOEL) | 0.6521565 | 0.6246003 | 0.4456184 | 0.5761855 | 0.5520301 |
Table A2.
Influence ranking of each variable for each year.
| Influence Ranking | 2002 | 2005 | 2008 | 2011 | 2014 |
|---|---|---|---|---|---|
| 1 | self-rated health (SH) | self-rated health (SH) | self-rated health (SH) | self-rated health (SH) | self-rated health (SH) |
| 2 | self-evaluation of economic level (SOEL) | self-evaluation of economic level (SOEL) | self-evaluation of economic level (SOEL) | self-evaluation of economic level (SOEL) | self-evaluation of economic level (SOEL) |
| 3 | economic self-sufficiency (ES) | economic self-sufficiency (ES) | bright personality (BP) | economic self-sufficiency (ES) | bright personality (BP) |
| 4 | bright personality (BP) | bright personality (BP) | economic self-sufficiency (ES) | bright personality (BP) | economic self-sufficiency (ES) |
| 5 | medical accessibility (MA) | medical accessibility (MA) | medical accessibility (MA) | instrumental activities of daily living (IADL) | cognitive ability (CA) |
| 6 | loneliness (Lon) | instrumental activities of daily living (IADL) | instrumental activities of daily living (IADL) | loneliness (Lon) | loneliness (Lon) |
| 7 | instrumental activities of daily living (IADL) | loneliness (Lon) | loneliness (Lon) | cognitive ability (CA) | anxiety (Anx) |
| 8 | cognitive ability (CA) | anxiety (Anx) | self-recognition (SR) | personal activities of daily living (PADL) | personal activities of daily living (PADL) |
| 9 | personal activities of daily living (PADL) | cognitive ability (CA) | cognitive ability (CA) | anxiety (Anx) | instrumental activities of daily living (IADL) |
| 10 | self-recognition (SR) | personal activities of daily living (PADL) | personal activities of daily living (PADL) | medical accessibility (MA) | self-recognition (SR) |
| 11 | leisure activities (LA) | social participation (SP) | anxiety (Anx) | self-recognition (SR) | education attainment (EA) |
| 12 | education attainment (EA) | way of living (WOL) | leisure activities (LA) | leisure activities (LA) | leisure activities (LA) |
| 13 | anxiety (Anx) | self-recognition (SR) | way of living (WOL) | social participation (SP) | residence (Res) |
| 14 | way of living (WOL) | leisure activities (LA) | social participation (SP) | way of living (WOL) | social participation (SP) |
| 15 | social participation (SP) | education attainment (EA) | residence (Res) | residence (Res) | medical accessibility (MA) |
| 16 | residence (Res) | residence (Res) | education attainment (EA) | education attainment (EA) | way of living (WOL) |
References
- ReferencesXinhuanet. Available online: http://m.xinhuanet.com/health/2018-02/27/c_1122457257.htm (accessed on 28 March 2018).
- Chinese Government Website. Available online: http://www.cncaprc.gov.cn/contents/2/179240.html (accessed on 28 March 2018).
- Neugarten, B.L.; Havighurst, R.J.; Tobin, S.S. The measurement of life satisfaction. J. Gerontol. 1961, 16, 134–143. [Google Scholar] [CrossRef] [PubMed]
- Shin, D.C.; Johnson, D.M. Avowed happiness as an overall assessment of the quality of life. Soc. Indic. Res. 1978, 5, 475–492. [Google Scholar] [CrossRef]
- Diener, E. Subjective well-being. Psychol. Bull. 1984, 95, 542–575. [Google Scholar] [CrossRef] [PubMed]
- Diener, E.; Suh, E.M.; Lucas, R.E.; Smith, H.L. Subjective well-being: Three decades of progress. Psychol. Bull. 1999, 125, 276–302. [Google Scholar] [CrossRef]
- Xiao, R. An analysis of life satisfaction and its influencing factors in Xiamen. Northwest Popul. 2010, 31, 86–90. [Google Scholar]
- Ho, S.C.; Woo, J.; Lau, J.; Chan, S.G.; Yuen, Y.K.; Chan, Y.K.; Chi, I. Life satisfaction and associated factors in older Hong Kong Chinese. J. Am. Geriatr. Soc. 1995, 43, 252–255. [Google Scholar] [CrossRef] [PubMed]
- Watson, J.A.; Kivett, V.R. Influences on the life satisfaction of older fathers. Fam. Coord. 1976, 25, 482–488. [Google Scholar] [CrossRef]
- Zhan, Z.; Zhang, J.; Sun, J.; Xue, C. Relationships of social participation, subjective well-being and life satisfaction among the retirees. Chin. J. Clin. Psychol. 2012, 20, 865–867. [Google Scholar]
- Gaymu, J.; Springer, S. Living conditions and life satisfaction of older Europeans living alone: A gender and cross-country analysis. Ageing Soc. 2010, 30, 1153–1175. [Google Scholar] [CrossRef]
- Enkvist, A.; Ekström, H.; Elmståhl, S. What factors affect life satisfaction (ls) among the oldest-old? Arch. Gerontol. Geriatr. 2012, 54, 140–145. [Google Scholar] [CrossRef] [PubMed]
- Liu, J. Research on the elderly’s life satisfaction and the influence factors—Analysis based on national baseline data of china health and retirement longitudinal study (CHARLS). Sci. Res. Aging 2015, 3, 69–78. [Google Scholar]
- Jin, L. The influence factors of life satisfaction for elderly and their comparative analysis. Popul. Econ. 2011, 32, 85–91. [Google Scholar]
- Zeng, Y. Chinese longitudinal healthy longevity survey (1998–2012) and related policy research review. Sci. Res. Aging 2013, 1, 65–72. [Google Scholar]
- Shannon, C.E. A mathematical theory of communication. Bell Syst. Tech. J. 1948, 27, 379–423. [Google Scholar] [CrossRef]
- R Language Official Website. Available online: https://cran.r-project.org/web/packages/Information/vignettes/Information-vignette.html (accessed on 5 April 2018).
- Lin, A.Z. Variable reduction in SAS by using weight of evidence and information value. In Proceedings of the SAS Global Forum 2013 Proceedings, San Francisco, CA, USA, 28 April 2013. [Google Scholar]
- Kampichler, C.; Wieland, R.; Calmé, S.; Weissenberger, H.; Arriaga-Weiss, S. Classification in conservation biology: A comparison of five machine-learning methods. Ecol. Inform. 2010, 5, 441–450. [Google Scholar] [CrossRef]
- Cutler, D.R.; Edwards, T.C., Jr.; Beard, K.H.; Cutler, A.; Hess, K.T. Random forests for classification in ecology. Ecology 2007, 88, 2783–2792. [Google Scholar] [CrossRef] [PubMed]
- Strobl, C.; Boulesteix, A.; Zeileis, A.; Hothorn, T. Bias in random forest variable importance measures: Illustrations, sources and a solution. BMC Bioinform. 2007, 8, 25. [Google Scholar] [CrossRef] [PubMed] [Green Version]
- Cai, T. Associated factors with self-rated life satisfaction of elderly women living alone. Popul. Sci. China 2004, 18, 2555–2559. [Google Scholar]
- Berg, A.I.; Hassing, L.B.; McClearn, G.E.; Johansson, B. What matters for life satisfaction in the oldest-old? Aging Ment. Health 2006, 10, 257–264. [Google Scholar] [CrossRef] [PubMed]
- Borg, C.; Hallberg, I.R.; Blomqvist, K. Life satisfaction among older people (65+) with reduced self-care capacity: The relationship to social, health and financial aspects. J. Clin. Nurs. 2006, 15, 607–618. [Google Scholar] [CrossRef] [PubMed]
- Mao, F.; Li, Z.; Hao, J.; Song, Z. Interrelated factors of Chinese old folks’l ife satisfaction rating. J. Tianjin Med. Univ. 2000, 6, 413–416. [Google Scholar]
- Jang, Y.; Mortimer, J.A.; Haley, W.E.; Graves, A.R.B. The role of social engagement in life satisfaction: Its significance among older individuals with disease and disability. J. Appl. Gerontol. 2004, 23, 266–278. [Google Scholar] [CrossRef]
- Sun, J.; Tang, P.; Wang, J. Investigating the extent of happiness of 150 retired. Chin. Med. Ethics 1997, 10, 58–60. [Google Scholar]
- Diener, E. Subjective well-being and personality. In Advanced Personality; Barone, D.F., Hersen, M., Van Hasselt, V.B., Eds.; Springer: Boston, MA, USA, 1998; pp. 154–196. [Google Scholar]
| 1 | |
| 2 | |
| 3 | |
| 4 | |
| 5 |
Figure 1.
Change in the proportion of elderly people satisfied with life.

Figure 2.
Change in the proportion of male/female elderly people satisfied with life.
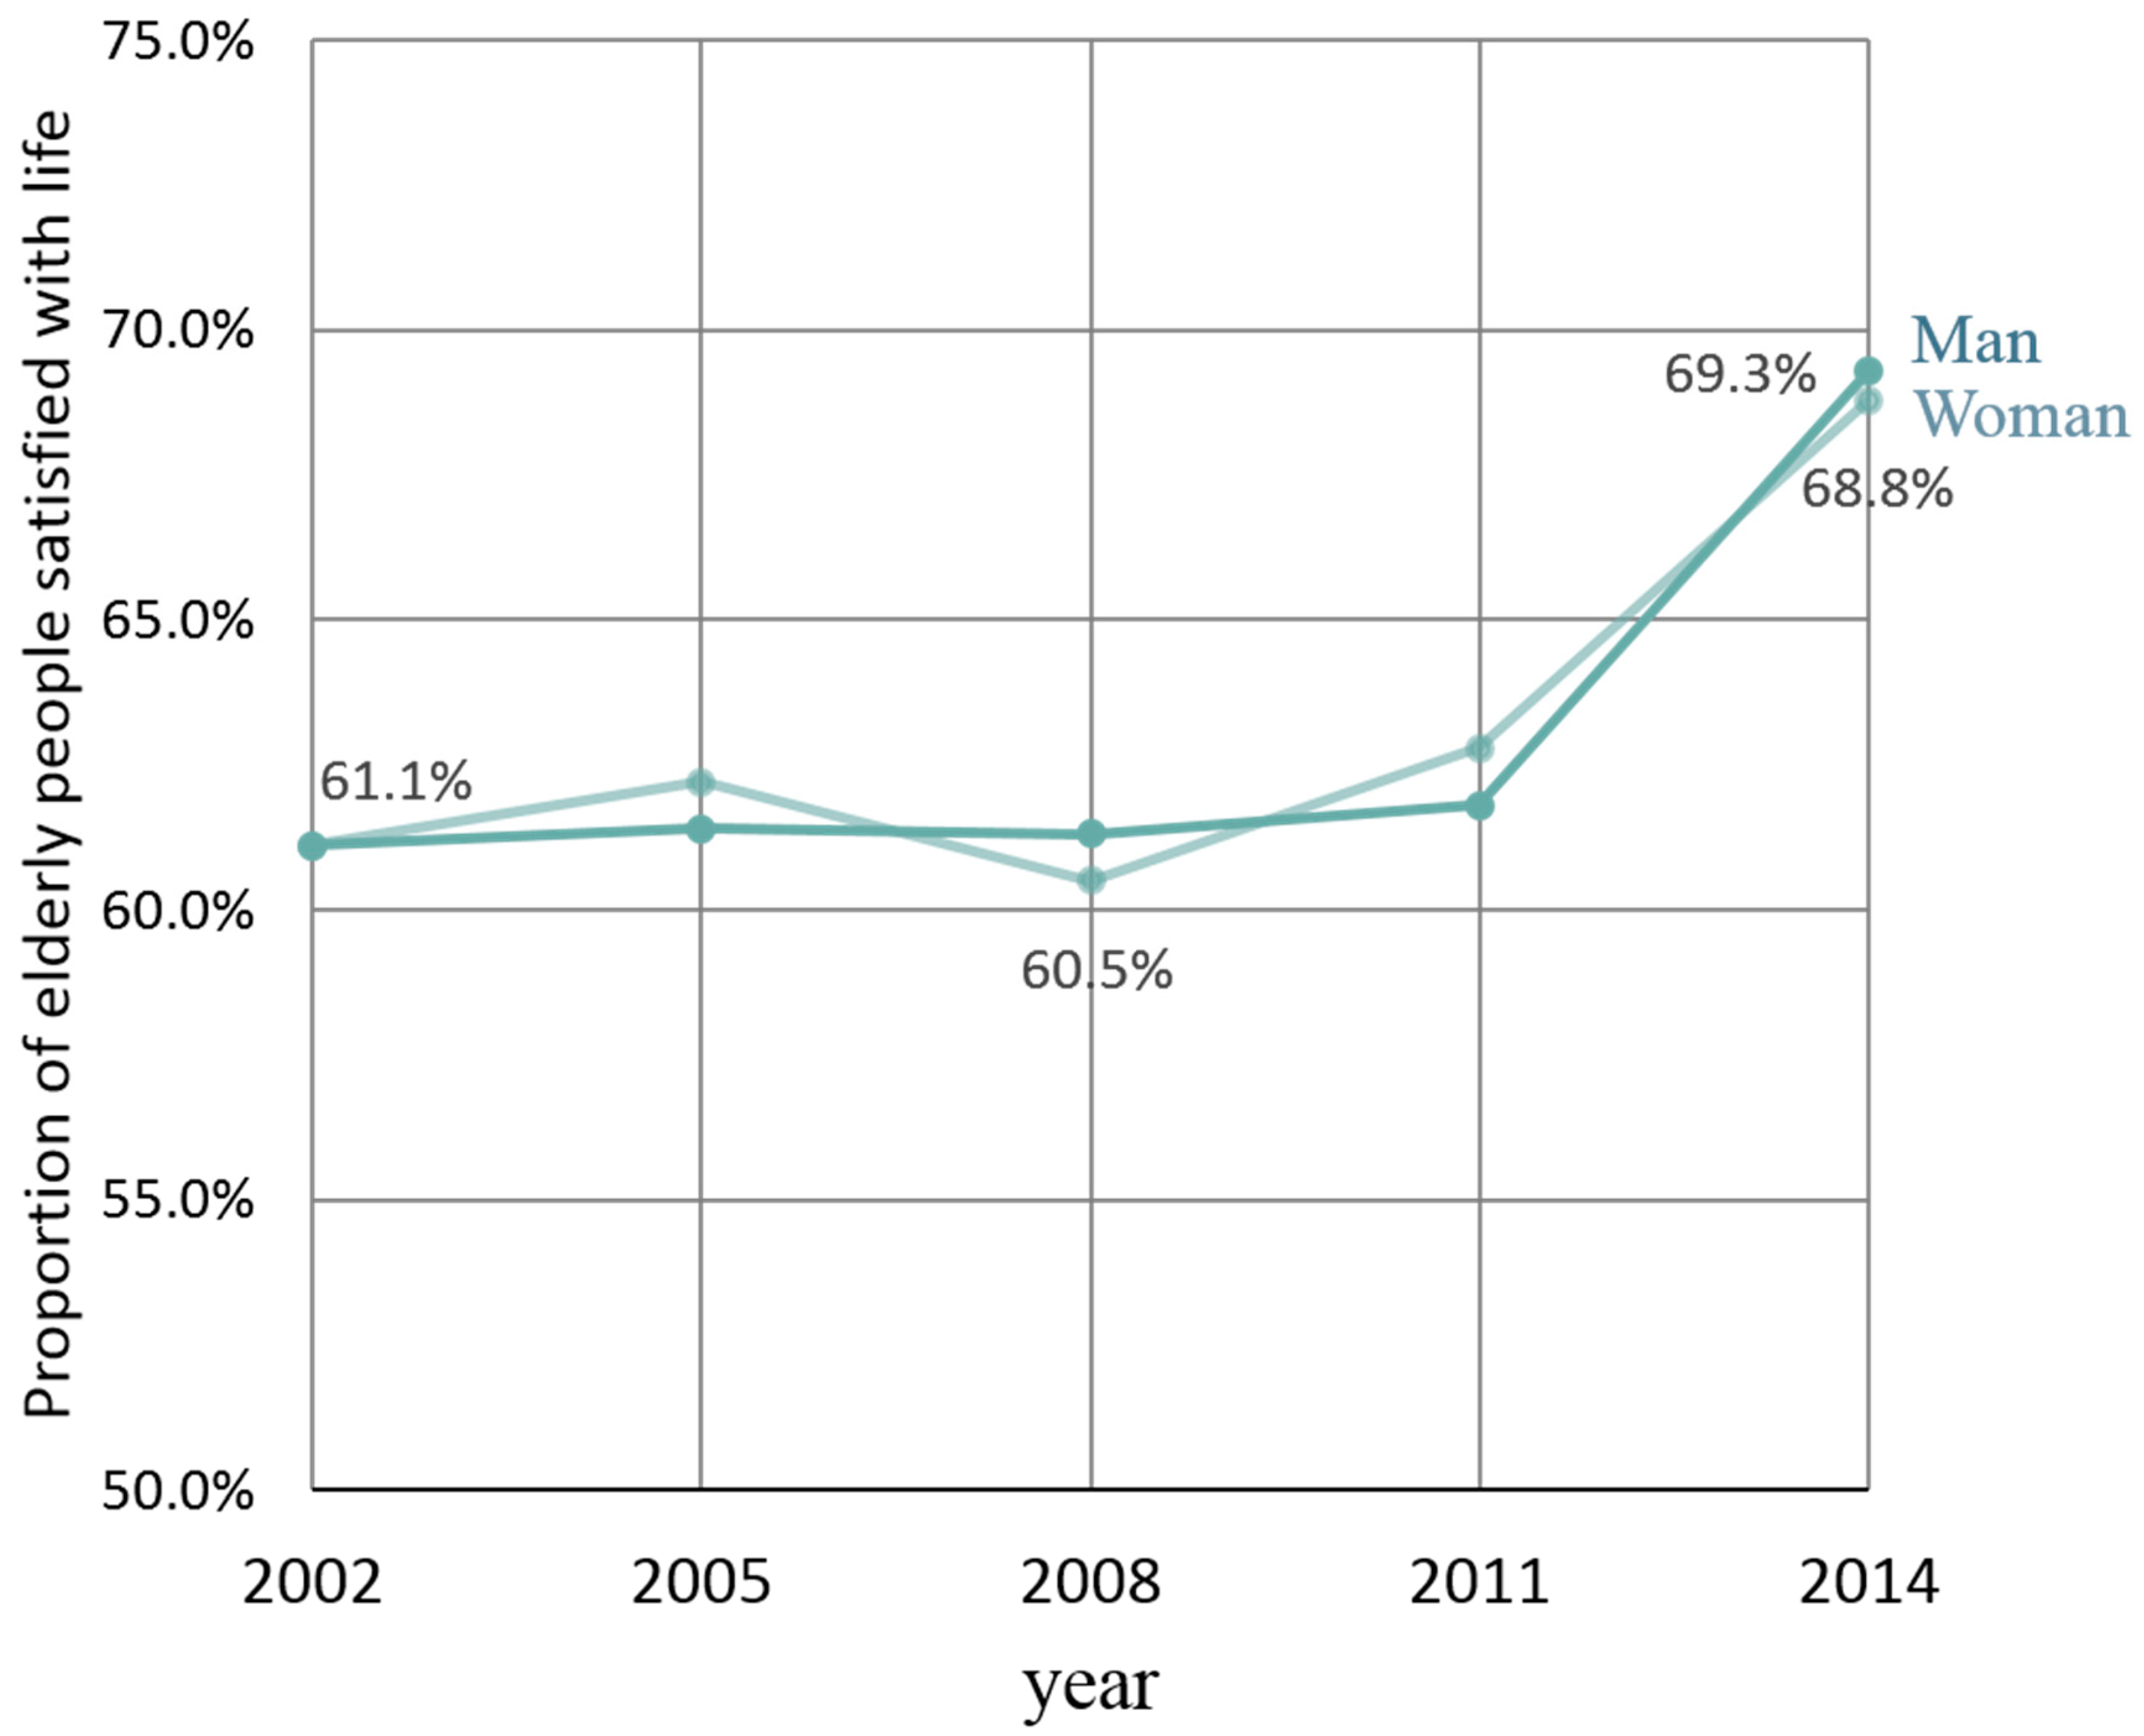
Figure 3.
Change in the proportion of elderly people satisfied with life by different age groups.
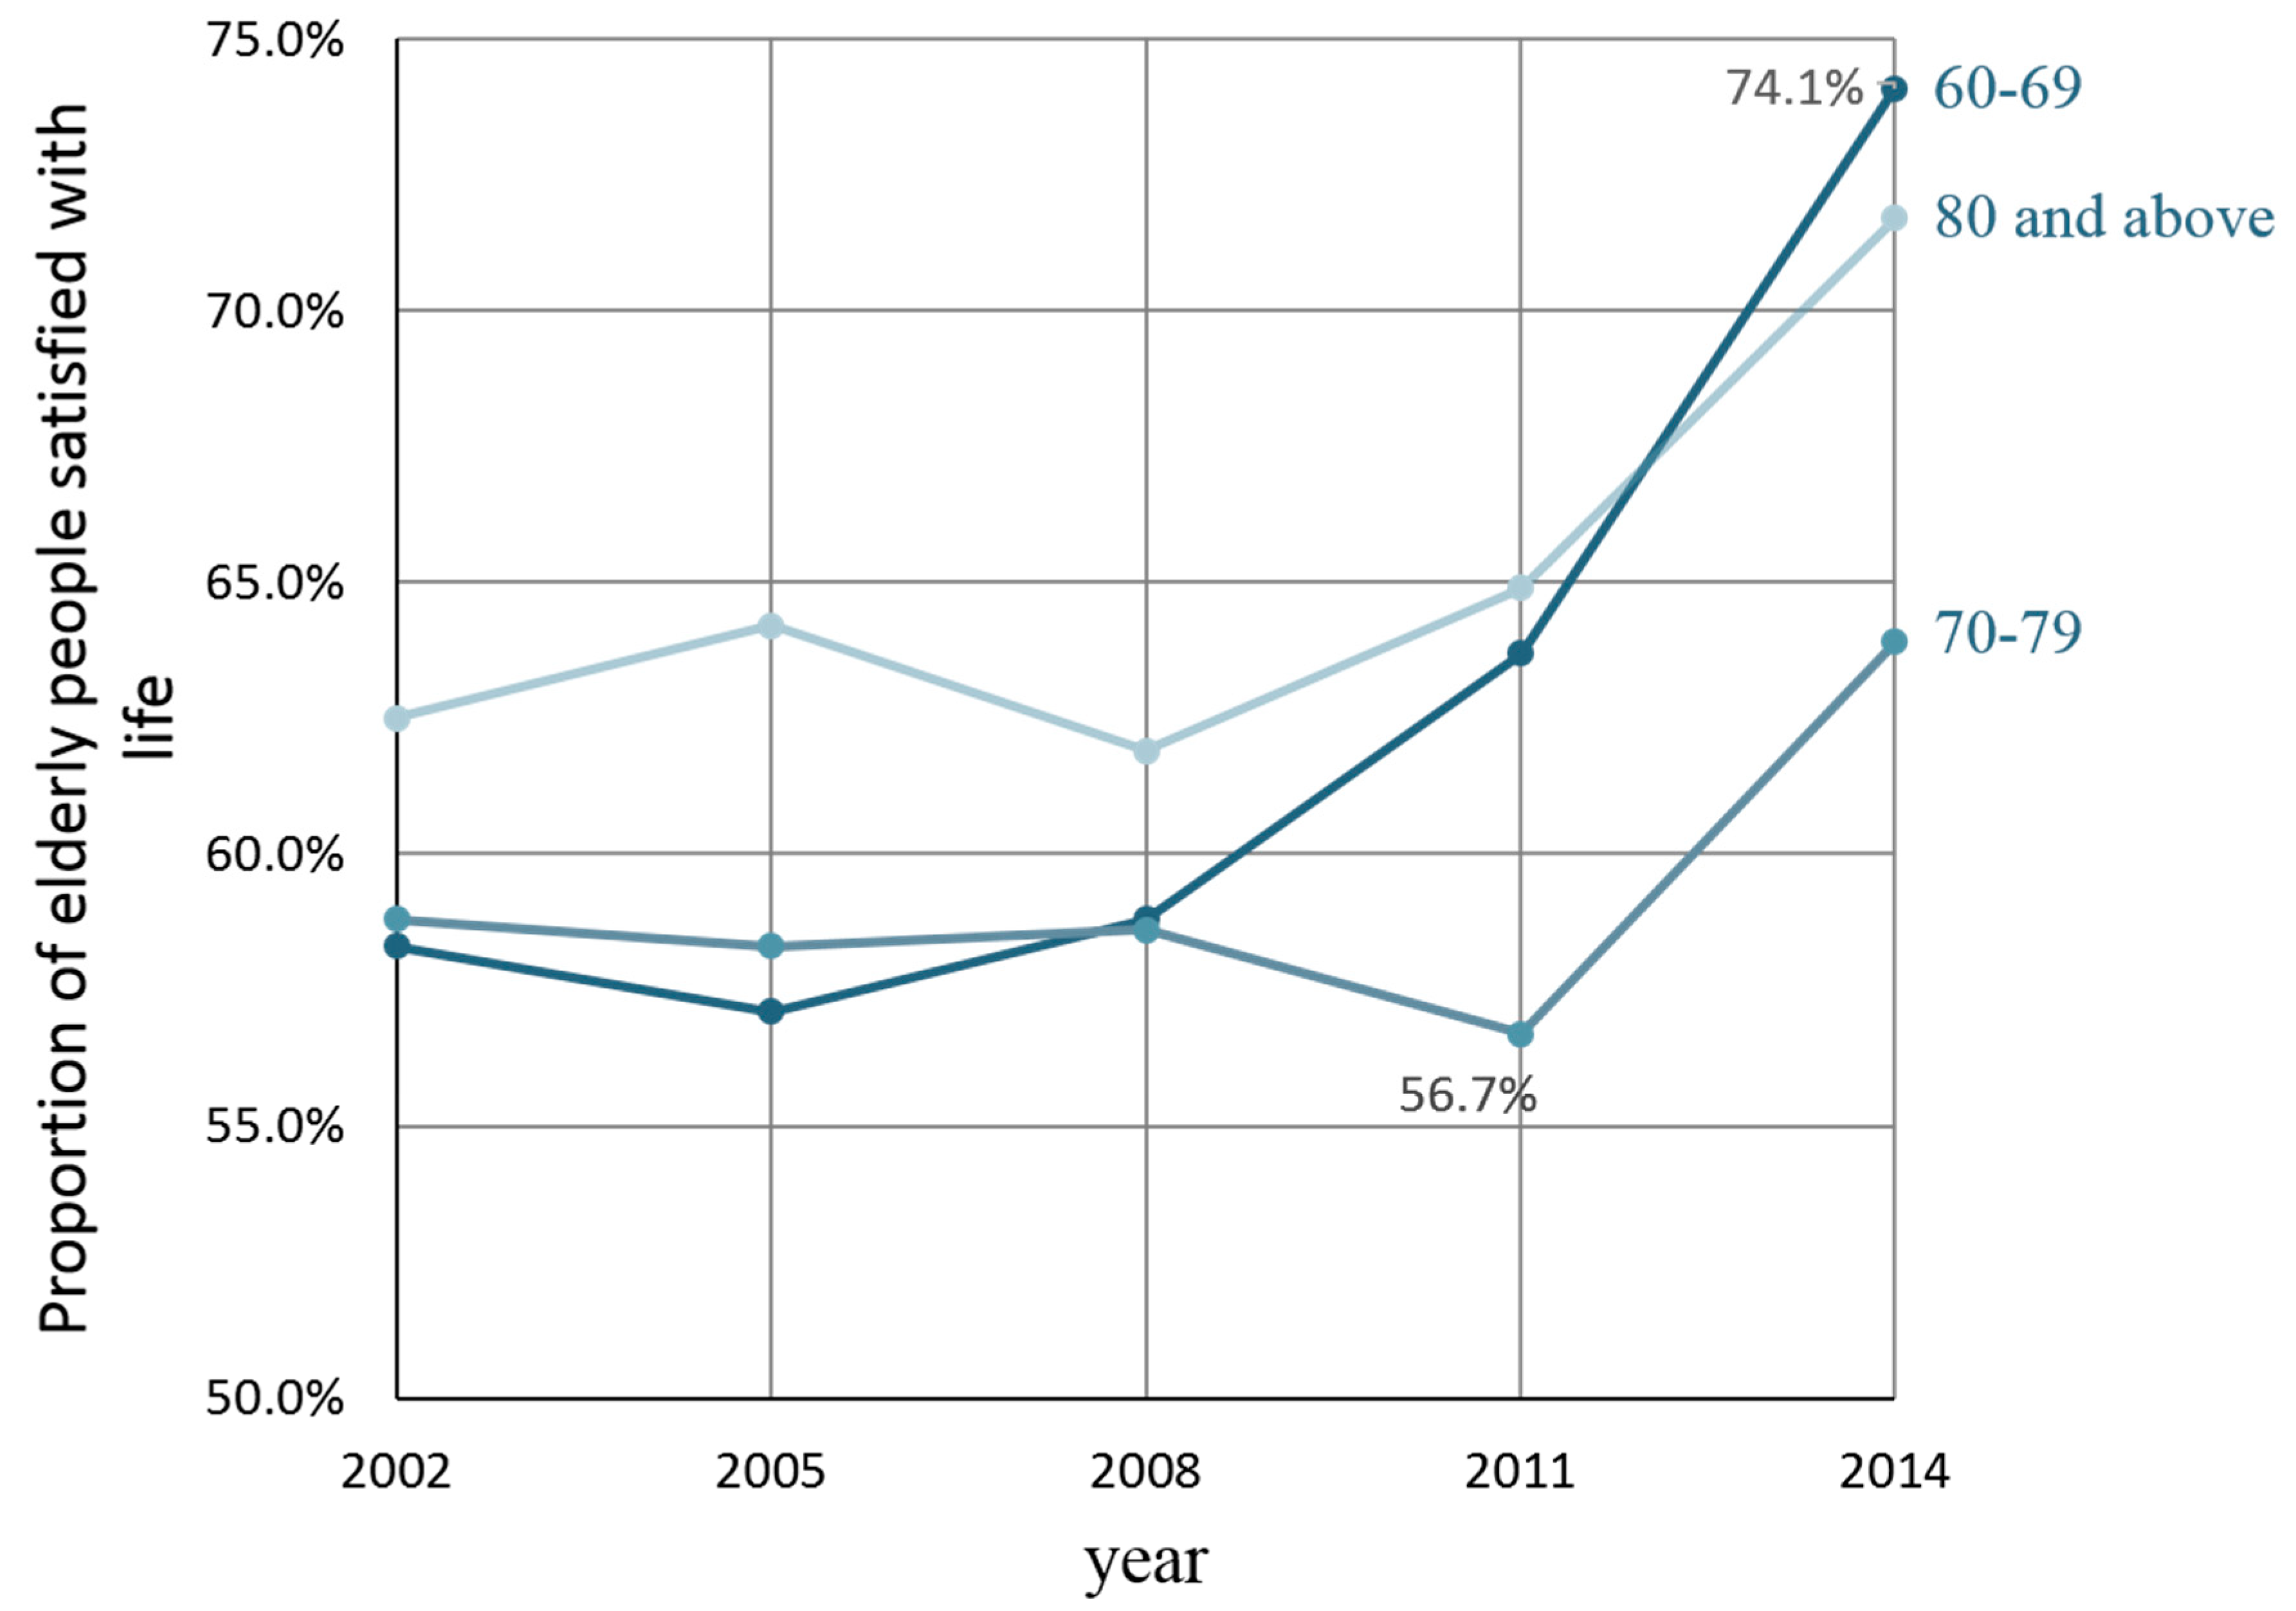
Figure 4.
Change in the proportion of elderly people satisfied with life in different areas (rural vs. urban).
Figure 4.
Change in the proportion of elderly people satisfied with life in different areas (rural vs. urban).

Figure 5.
Change in the influence of demographic variables.

Figure 6.
Change in the influence of physiological variables.
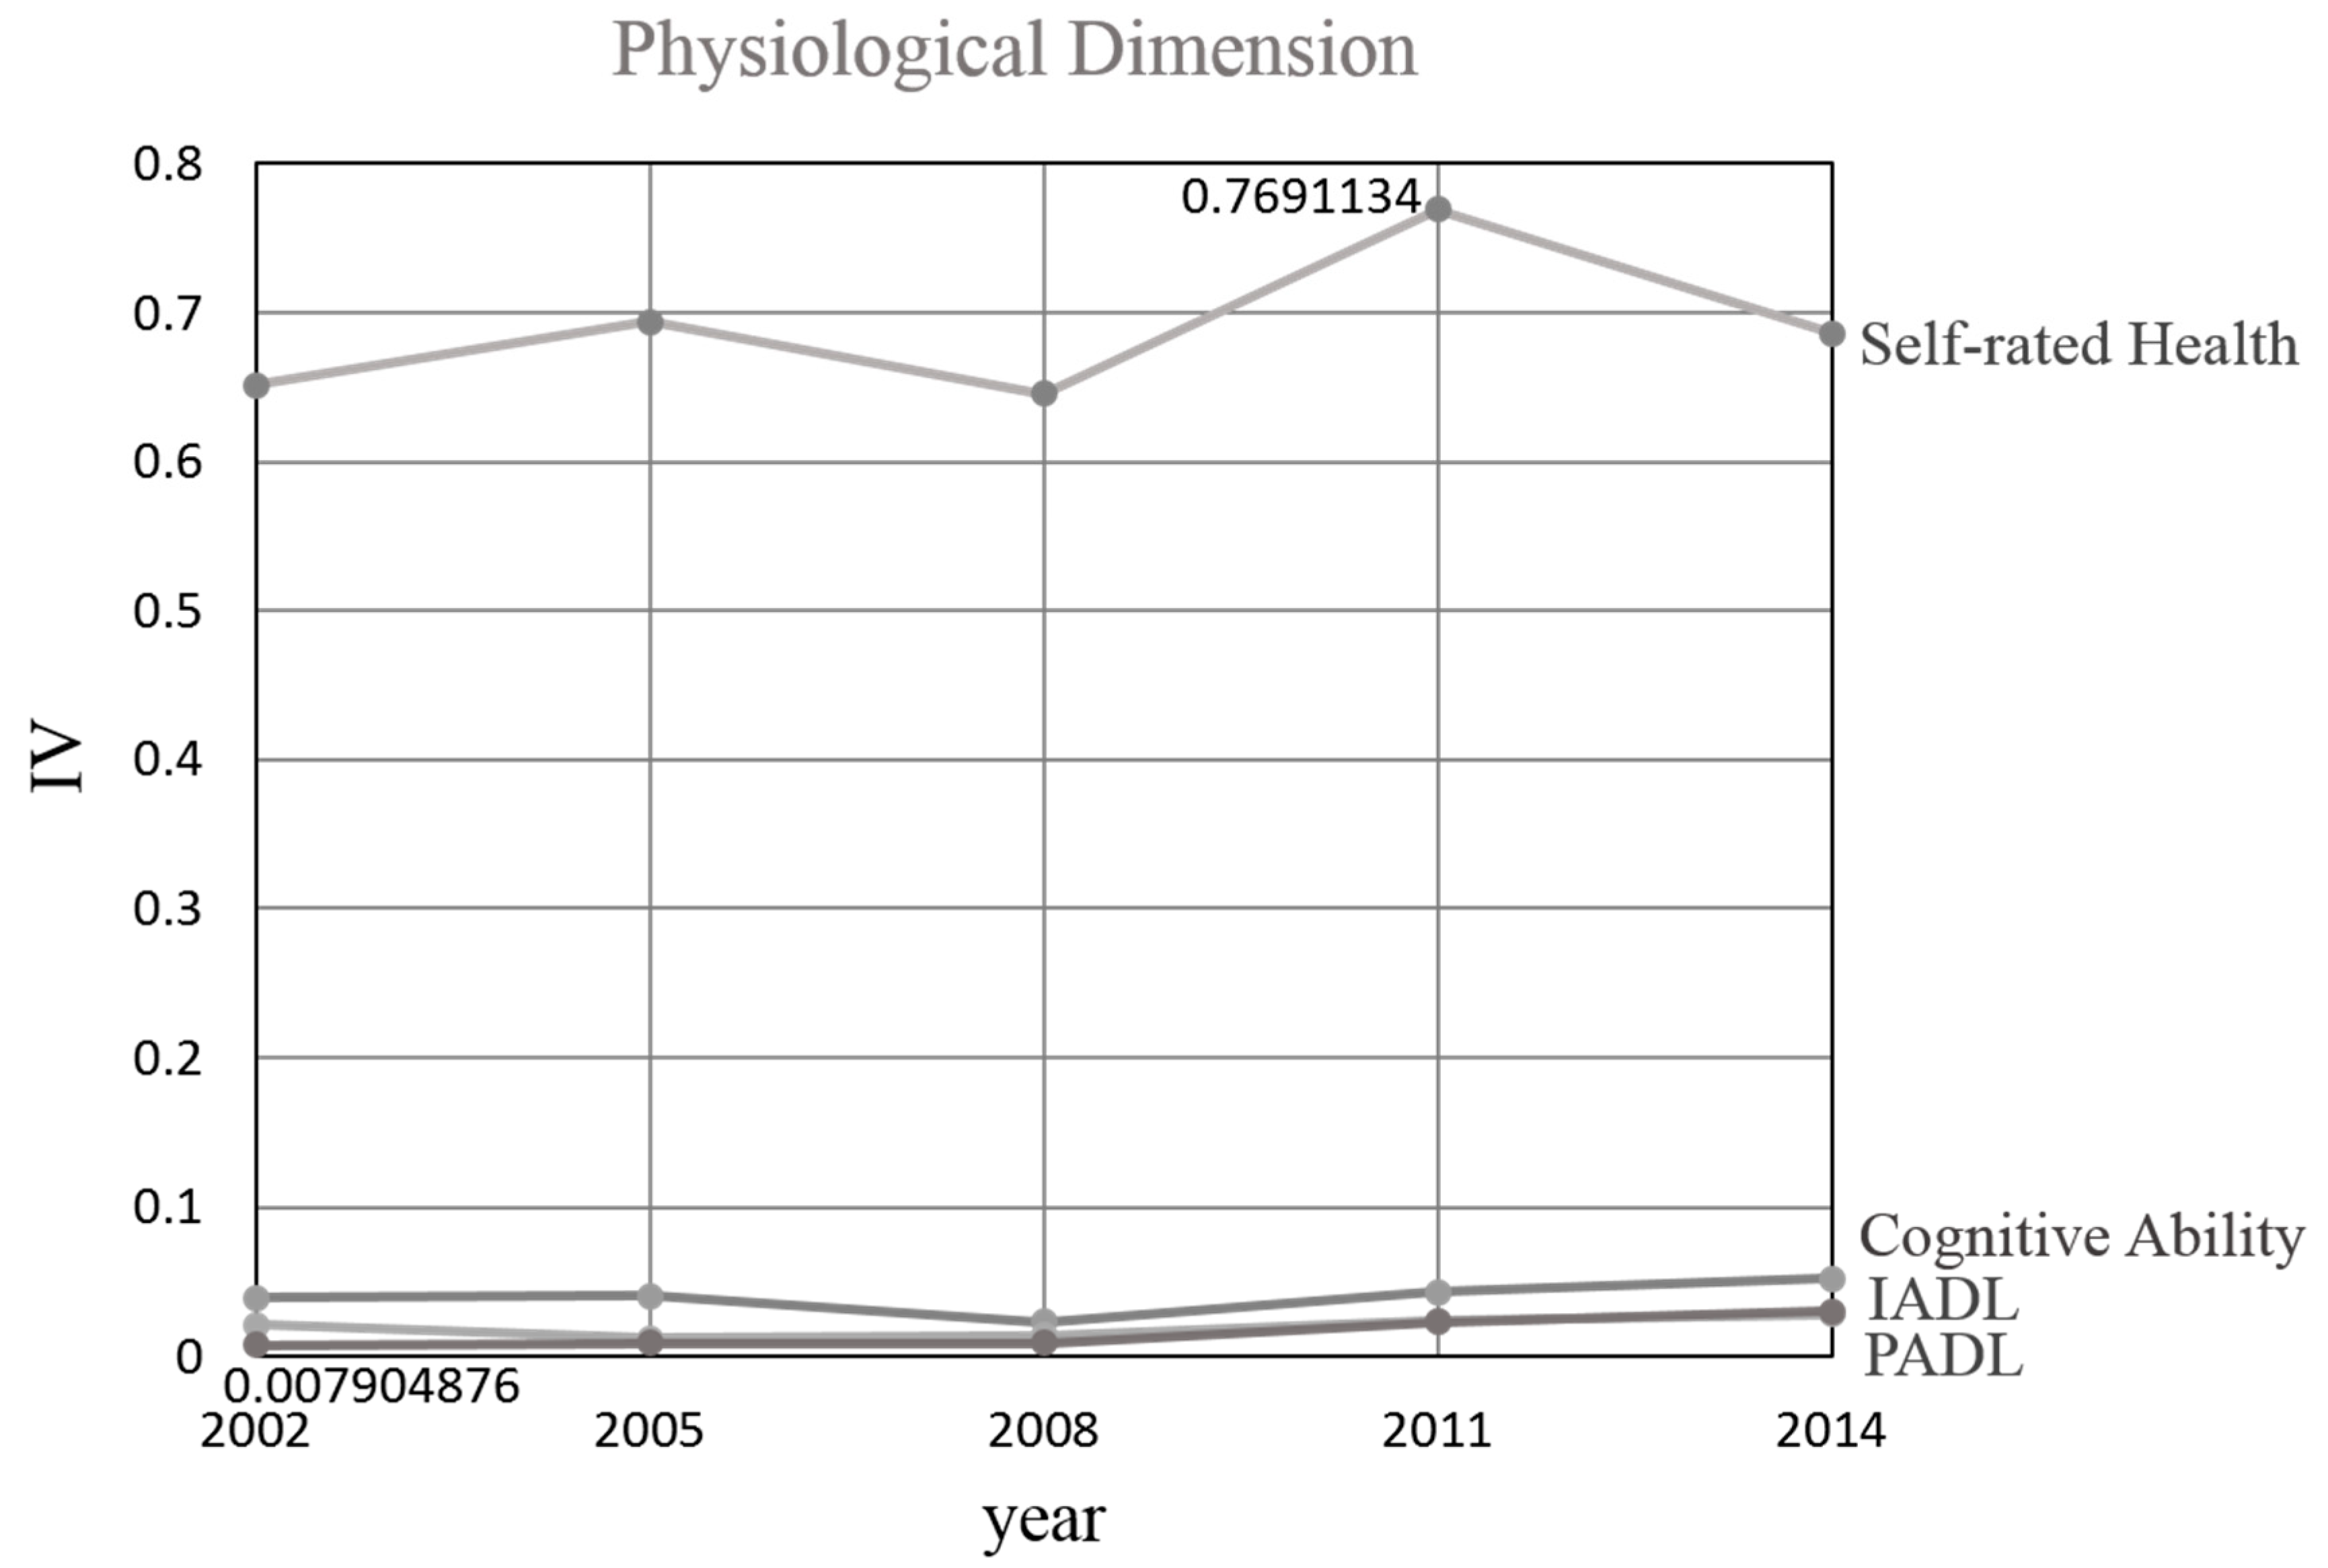
Figure 7.
Change in the influence of psychological variables.

Figure 8.
Change in the influence of economic variables.

Figure 9.
Change in the influence of social variables.

Figure 10.
Ranking change of the first-category factors.
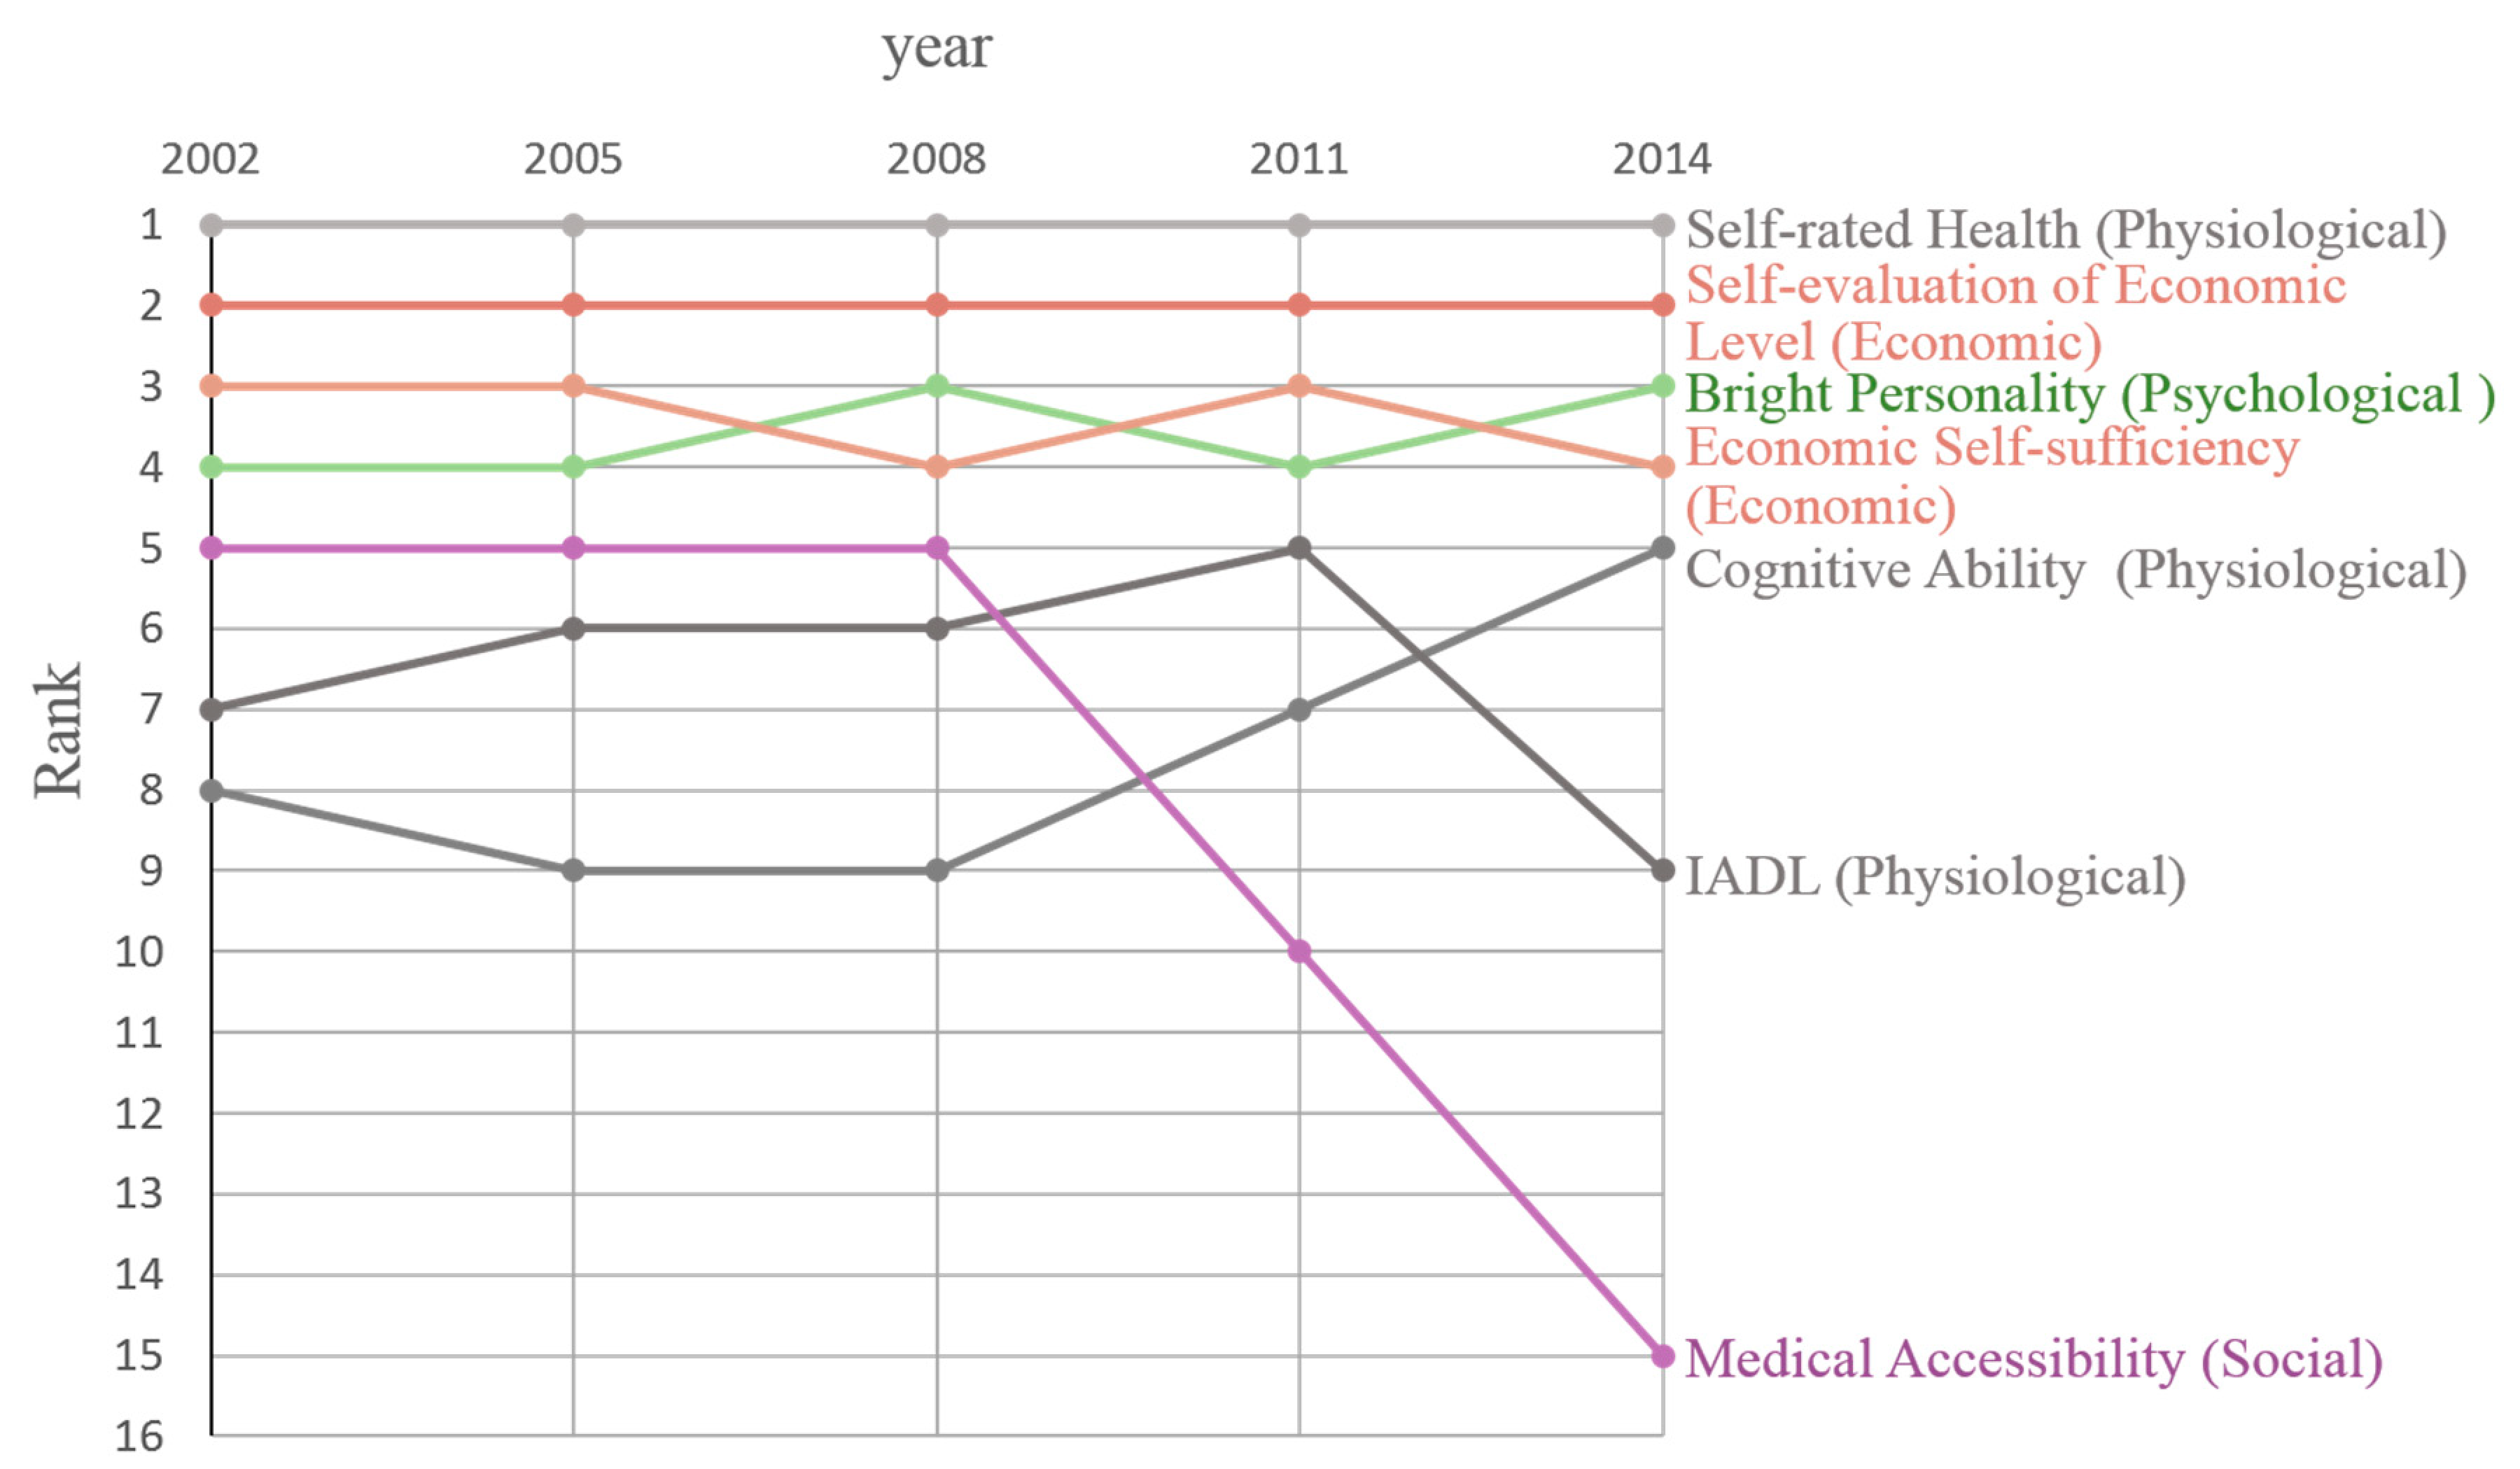
Figure 11.
Ranking change of the second-category factors.

Figure 12.
Ranking change of the third-category factors.
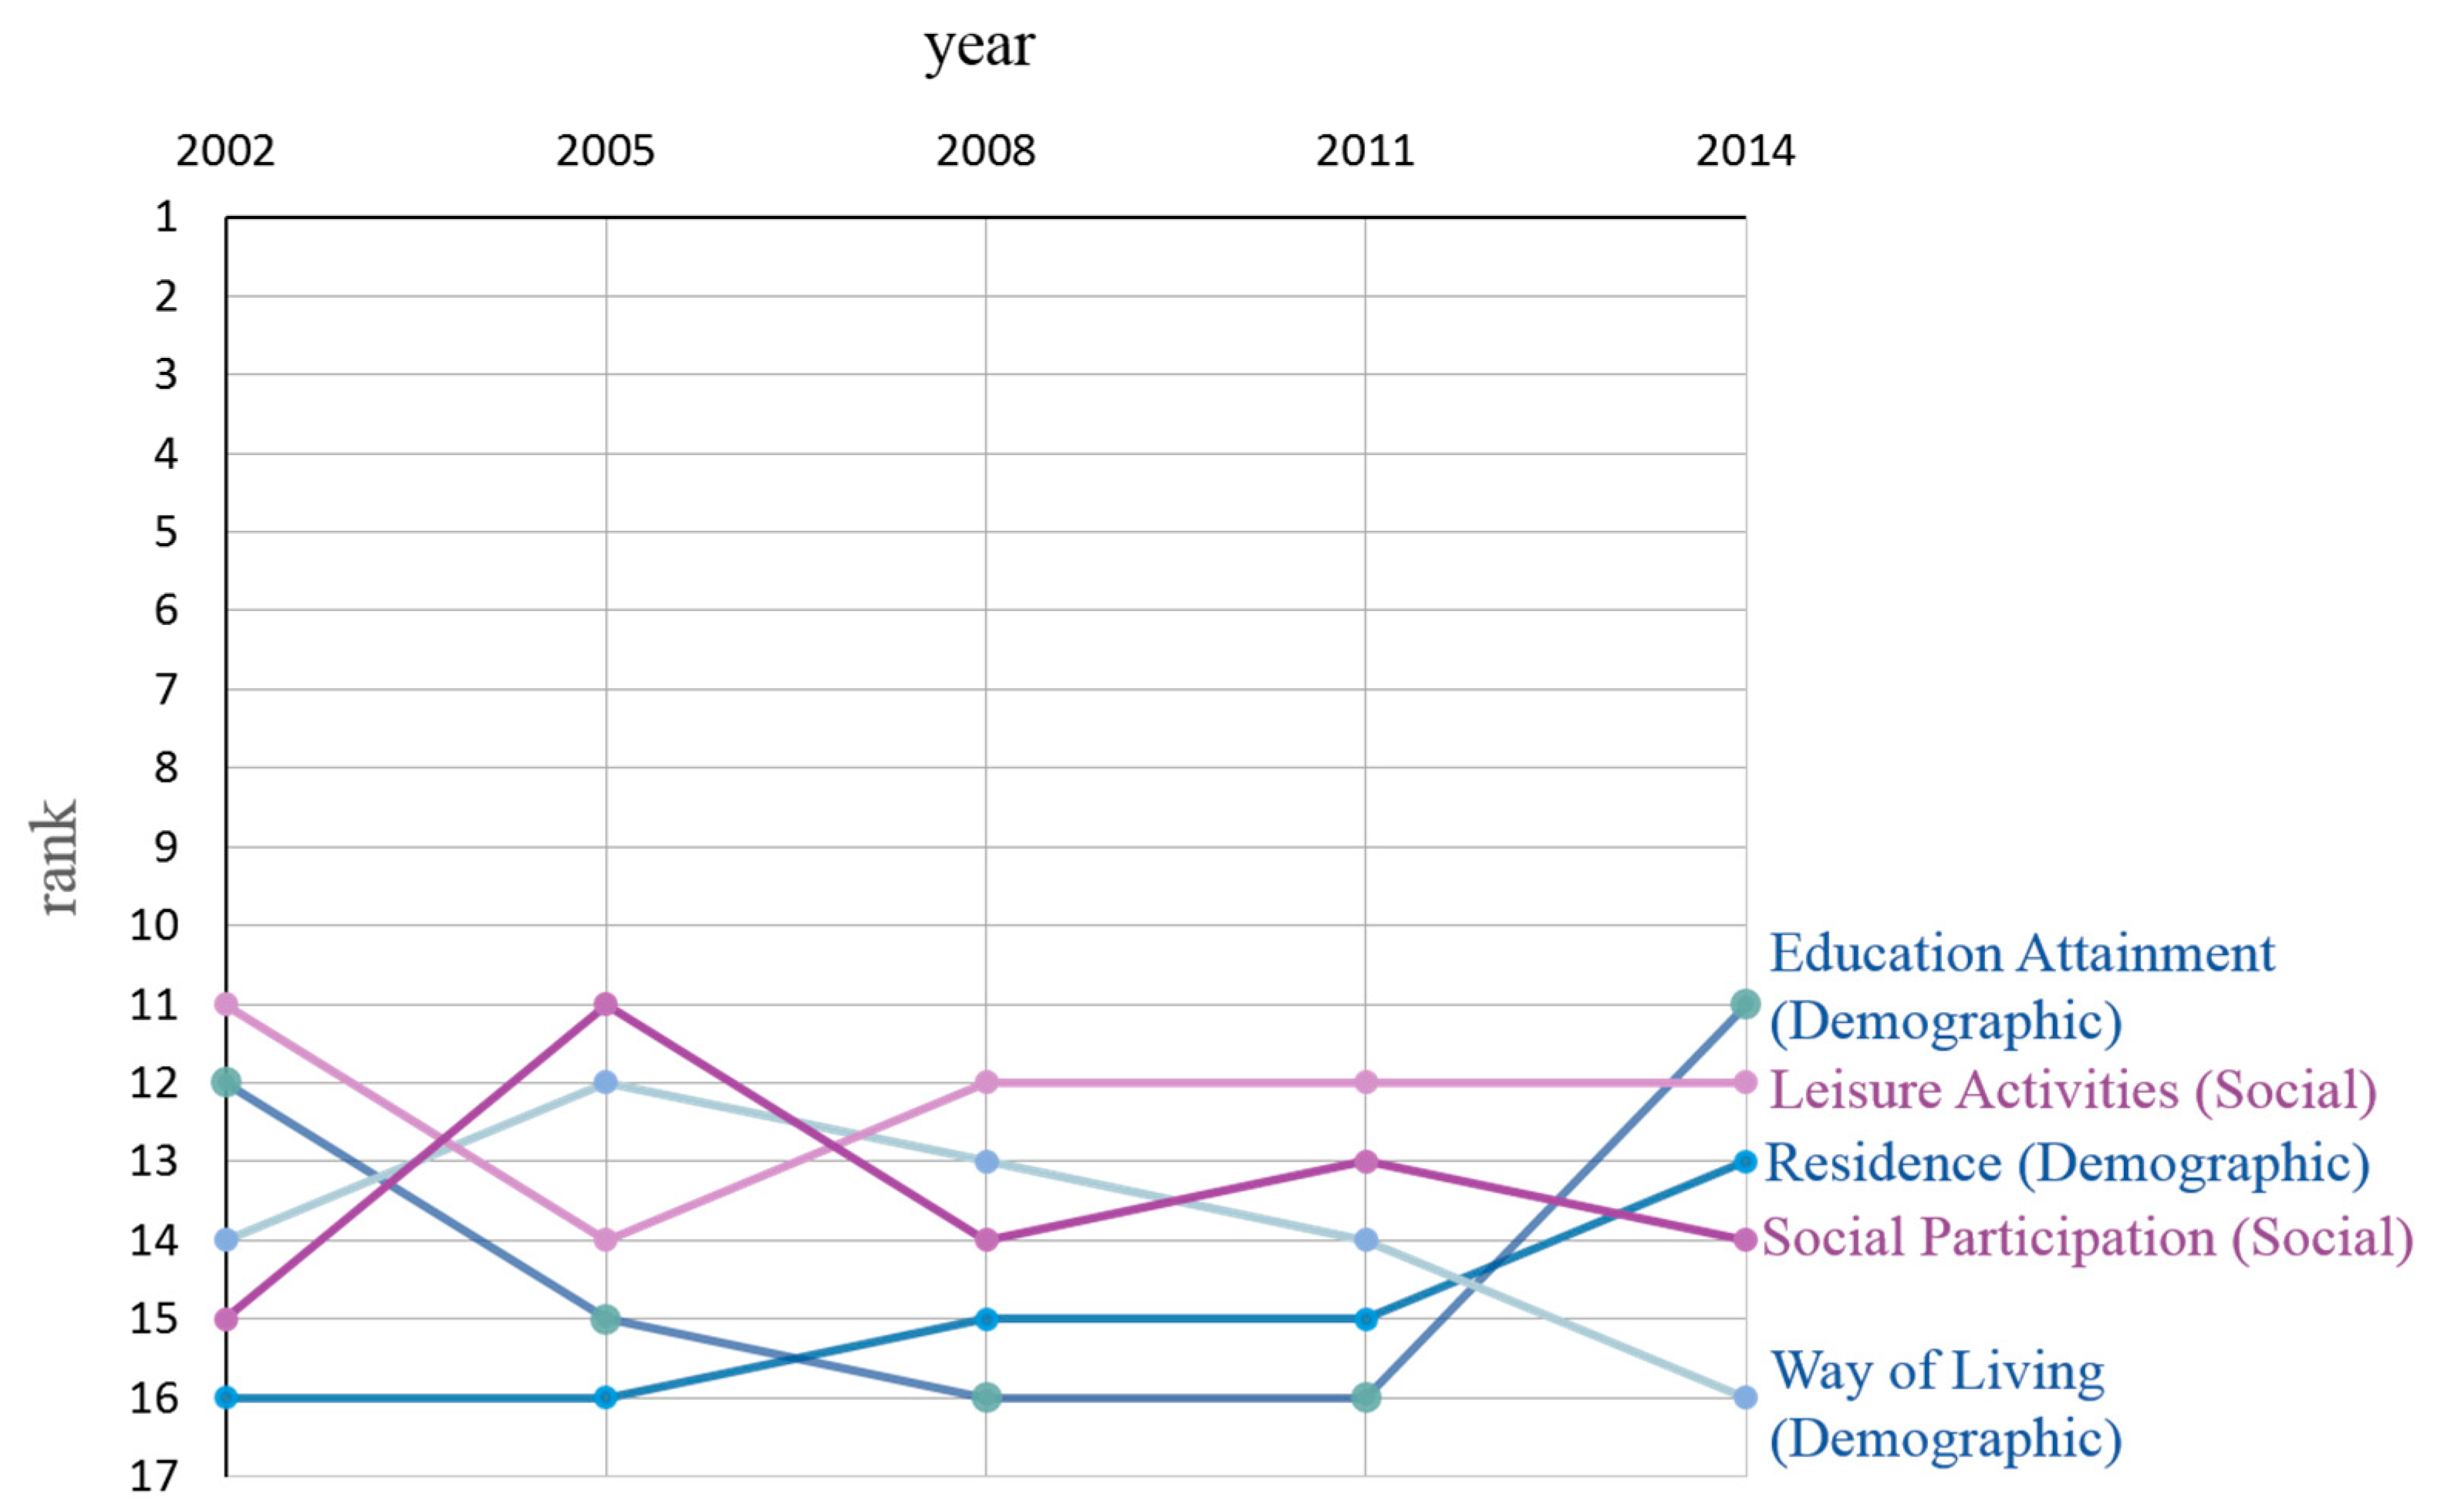
Table 1.
Items of B2 personal characteristics.
| Items under B2 Personal Characteristics | Options |
|---|---|
| B2-1 look on the bright side of things | 1. always 2. often 3. sometimes |
| 4. seldom 5. never 8. not able to answer | |
| B2-2 keep my belongings neat and clean | 1. always 2. often 3. sometimes |
| 4. seldom 5. never 8. not able to answer | |
| B2-3 feel fearful or anxious | 1. always 2. often 3. sometimes |
| 4. seldom 5. never 8. not able to answer | |
| B2-4 feel lonely and isolated | 1. always 2. often 3. sometimes |
| 4. seldom 5. never 8. not able to answer | |
| B2-5 make own decision | 1. always 2. often 3. sometimes |
| 4. seldom 5. never 8. not able to answer | |
| B2-6 feel useless with age | 1. always 2. often 3. sometimes |
| 4. seldom 5. never 8. not able to answer | |
| B2-7 be happy as younger | 1. always 2. often 3. sometimes |
| 4. seldom 5. never 8. not able to answer |
Table 2.
Independent variables and their codes.
| Dimension | Variable | Code |
|---|---|---|
| Demographic | residence (Res) | city or town|rural area |
| marital status (MS) | couple|not couple | |
| education attainment (EA) | continuous variable | |
| way of living (WOL) | live with family|live without family | |
| Physiological | self-rated health (SH) | good|ordinary|bad |
| cognitive ability (CA) | continuous variable | |
| personal activities of daily living (PADL) | continuous variable | |
| instrumental activities of daily living (IADL) | continuous variable | |
| Psychological | bright personality (BP) | yes|no |
| anxiety (Anx) | yes|no | |
| loneliness (Lon) | yes|no | |
| self-recognition (SR) | active|not active | |
| Social | leisure activities (LA) | yes|no |
| social participation (SP) | yes|no | |
| medical accessibility (MA) | yes|no | |
| Economic | economic self-sufficiency (ES) | yes|no |
| main source of life (MSOL) | self|others | |
| self-evaluation of economic level (SOEL) | rich|ordinary|poor |
Table 3.
The sample numbers in each year.
| Year | 2002 | 2005 | 2008 | 2011 | 2014 | |
|---|---|---|---|---|---|---|
| Number | ||||||
| Original number of observations | 16,064 | 15,638 | 16,540 | 9765 | 7192 | |
| Number of observations after exclusions | 12,806 | 11,378 | 12,033 | 5449 | 3865 | |
Table 4.
Rule of thumb for information value [18].
Table 4.
Rule of thumb for information value [18].
| Information Value | Predictive Power or Influence |
|---|---|
| <0.02 | No predictive power, or no/slight influence |
| 0.02–0.1 | Weak predictive power, or weak influence |
| 0.1–0.3 | General predictive power, or some influence |
| >0.3 | Strong predictive power, or strong influence |
© 2018 by the authors. Licensee MDPI, Basel, Switzerland. This article is an open access article distributed under the terms and conditions of the Creative Commons Attribution (CC BY) license (http://creativecommons.org/licenses/by/4.0/).
Share and Cite
MDPI and ACS Style
Zhang, H.; Wang, Y.; Wu, D.; Chen, J. Evolutionary Path of Factors Influencing Life Satisfaction among Chinese Elderly: A Perspective of Data Visualization. Data 2018, 3, 35. https://doi.org/10.3390/data3030035
AMA Style
Zhang H, Wang Y, Wu D, Chen J. Evolutionary Path of Factors Influencing Life Satisfaction among Chinese Elderly: A Perspective of Data Visualization. Data. 2018; 3(3):35. https://doi.org/10.3390/data3030035
Chicago/Turabian StyleZhang, Hui, Yongyi Wang, Dan Wu, and Jiangping Chen. 2018. "Evolutionary Path of Factors Influencing Life Satisfaction among Chinese Elderly: A Perspective of Data Visualization" Data 3, no. 3: 35. https://doi.org/10.3390/data3030035