Long-Term WiFi Fingerprinting Dataset for Research on Robust Indoor Positioning
by
 , , , and
Germán Martín Mendoza-Silva
1,*,† ,
,
Philipp Richter
2,† ,
,
Joaquín Torres-Sospedra
1 ,
,
Elena Simona Lohan
2 and
and
Joaquín Huerta
1 1
Institute of New Imaging Technologies, Universitat Jaume I, Av. Vicente Sos Baynat s/n, 12071 Castellón de la Plana, Spain
2
Laboratory of Electronics and Communications Engineering, Tampere University of Technology, Korkeakoulunkatu 3, 33720 Tampere, Finland
*
Author to whom correspondence should be addressed.
†
These authors contributed equally to this work.
Data 2018, 3(1), 3; https://doi.org/10.3390/data3010003
Submission received: 24 November 2017
/
Revised: 22 December 2017
/
Accepted: 9 January 2018
/
Published: 16 January 2018
Abstract
:Abstract
WiFi fingerprinting, one of the most popular methods employed in indoor positioning, currently faces two major problems: lack of robustness to short and long time signal changes and difficult reproducibility of new methods presented in the relevant literature. This paper presents a WiFi RSS (Received Signal Strength) database created to foster and ease research works that address the above-mentioned two problems. A trained professional took several consecutive fingerprints while standing at specific positions and facing specific directions. The consecutive fingerprints may enable the study of short-term signals variations. The data collection spanned over 15 months, and, for each month, one type of training datasets and five types of test datasets were collected. The measurements of a dataset type (training or test) were taken at the same positions and directions every month, in order to enable the analysis of long-term signal variations. The database is provided with supporting materials and software, which give more information about the collection environment and eases the database utilization, respectively. The WiFi measurements and the supporting materials are available at the Zenodo repository under the open-source MIT license.
Dataset
10.5281/zenodo.1066040
Dataset License
MIT License

1. Introduction
The position information has become a key aspect for the services provided in the digital world [1]. Companies and institutions are increasingly aware of the benefits of position information and demanding it, and the research community has answered correspondingly. The research community has devoted much efforts to wireless positioning in indoor environments, as outdoor positioning is already available with mostly good accuracy because of Global Navigation Satellite System (GNSS) receivers. In indoor environments, where GNSS signals degrade too much to be reliable, other technologies have been explored for more than 20 years to get robust and accurate Indoor Positioning Systems (IPS). Some of those efforts succeeded, such as those based on sub-meter Ultra Wide Band (UWB) positioning [2,3], Ultrasound [4] and Visible Light [5], but incurred in costs from additional equipment that narrowed their potential applications.
The research on IPS based on WiFi Received Signal Strength (RSS) values has been the most popular due to the ease of access of RSS information from basically any mobile device. For example, WiFi RSS-based works constituted over of the 2017 Indoor Positioning and Indoor Navigation (IPIN) conference proceedings [6]. WiFi-enabled smartphones are part of the modern life, as well as WiFi network devices providing Internet connectivity. Furthermore, a WiFi-based IPS can provide position estimations that are accurate enough for some applications, such as shop finding, social dating, targeted advertising and users flow analysis.
To the authors’ best knowledge, there is no WiFi-based IPS that have had a clear success in the market, despite many fine WiFi-based methods have been proposed [7]. Reasons behind such contradiction include: (1) reporting the accuracy as mean positioning error distance; (2) testing the IPS in specific (probably controlled) environments; and (3) testing the IPS without considering temporal signals changes. The previous challenges have been addressed, e.g., by: (1) providing other metrics such as 75 percentile instead of the mean [8]; (2) providing databases [9,10]; and (3) periodically updating the IPS training data [11,12,13] or making the positioning method adaptable to signal changes [14,15]. Methods able to cope with temporal signal variation, such as those in Gu et al. [14], Hayashi et al. [15], are tested with measurements that allow the analysis of short-term signal variations occurred at known positions (e.g., seconds or minutes apart, caused by network devices dynamic behavior, network usage, and people movement) and also the analysis of long-term signal variations (e.g., days or months apart, caused by changes in network devices’ configuration or environment’ structure). To the authors’ knowledge, it is common that the WiFi measurements used to test novel WiFi-based positioning methods are not publicly available, which hinders the reproducibility of the results and prevents that others could test new methods that address robustness to signal variations.
To foster reproducibility and comparability in indoor positioning research, several databases have recently been made available to the public [10,16,17,18,19,20]. More specifically, Table 1 presents public databases that we have found available on-line and which can be used to train a WiFi RSS-based IPS. The table presents: (1) a name with which the database is known; (2) when it was made public; (3) where to get more information or download it; (4) the collection time period; and (5) availability of several measurements for the same reference point (RP). Table 1 shows that efforts to provide such databases has increased in recent years. It also shows that the available databases either present small collection efforts (in time and space), collection efforts at large spaces during small period of times, or crowd-sourced collection efforts for which, despite they may span a large period of time and include large environments, it is difficult to find measurements corresponding to the same RP.
For a WiFi RSS database creation, the collaborative/crowd-sourced approaches are recommended for many studies and for gathering IPS’s training data. However, they have a well-known challenge: labels quality [13]. A professional collection approach can provide reliable measurements to discover insights into short- and long-term signals variability that could otherwise be untrustworthy. Therefore, we have created a WiFi RSS database for predefined reference points in the context of a university’s library. For each of these reference points, which belong to two floors, 12 measurements were taken, six consecutive samples with the person who performed the collection facing one direction and another consecutive six facing the opposite direction. The measurements were organized into training and test datasets, and repeated each every month until completing 15 months of collection.
The main goal of this paper is to introduce a set of WiFi RSS with trust-worthy position labels to the research community. The herein described set of fingerprint data was taken across 15 months at the same positions and directions, while each RSS signature consists of several samples. These are unique properties among the publicly available WiFi RSS databases that allow to study long-term and short-term RSS variations and methods to deal with those variations. The paper exemplifies such studies with analyses of the data related to real working deployments like network devices replacement. For example, one finding of our analyses suggests that the first RSS sample of several taken at a position might correspond to a measurement the device took at a previous position, presumably because of buffering. The presented analysis of long-term variations, through the intermittence of access points, disclosed a change of the WiFi network that apparently occurred during the time of the data collection. This paper also presents the usage of six simple WiFi-based positioning methods and illustrates their robustness to network changes across several months. Additionally, we provide supporting materials and software along with the database that ease its use, suggest possible data analyses, and provide additional information on the collection environment.
2. Collection Methodology
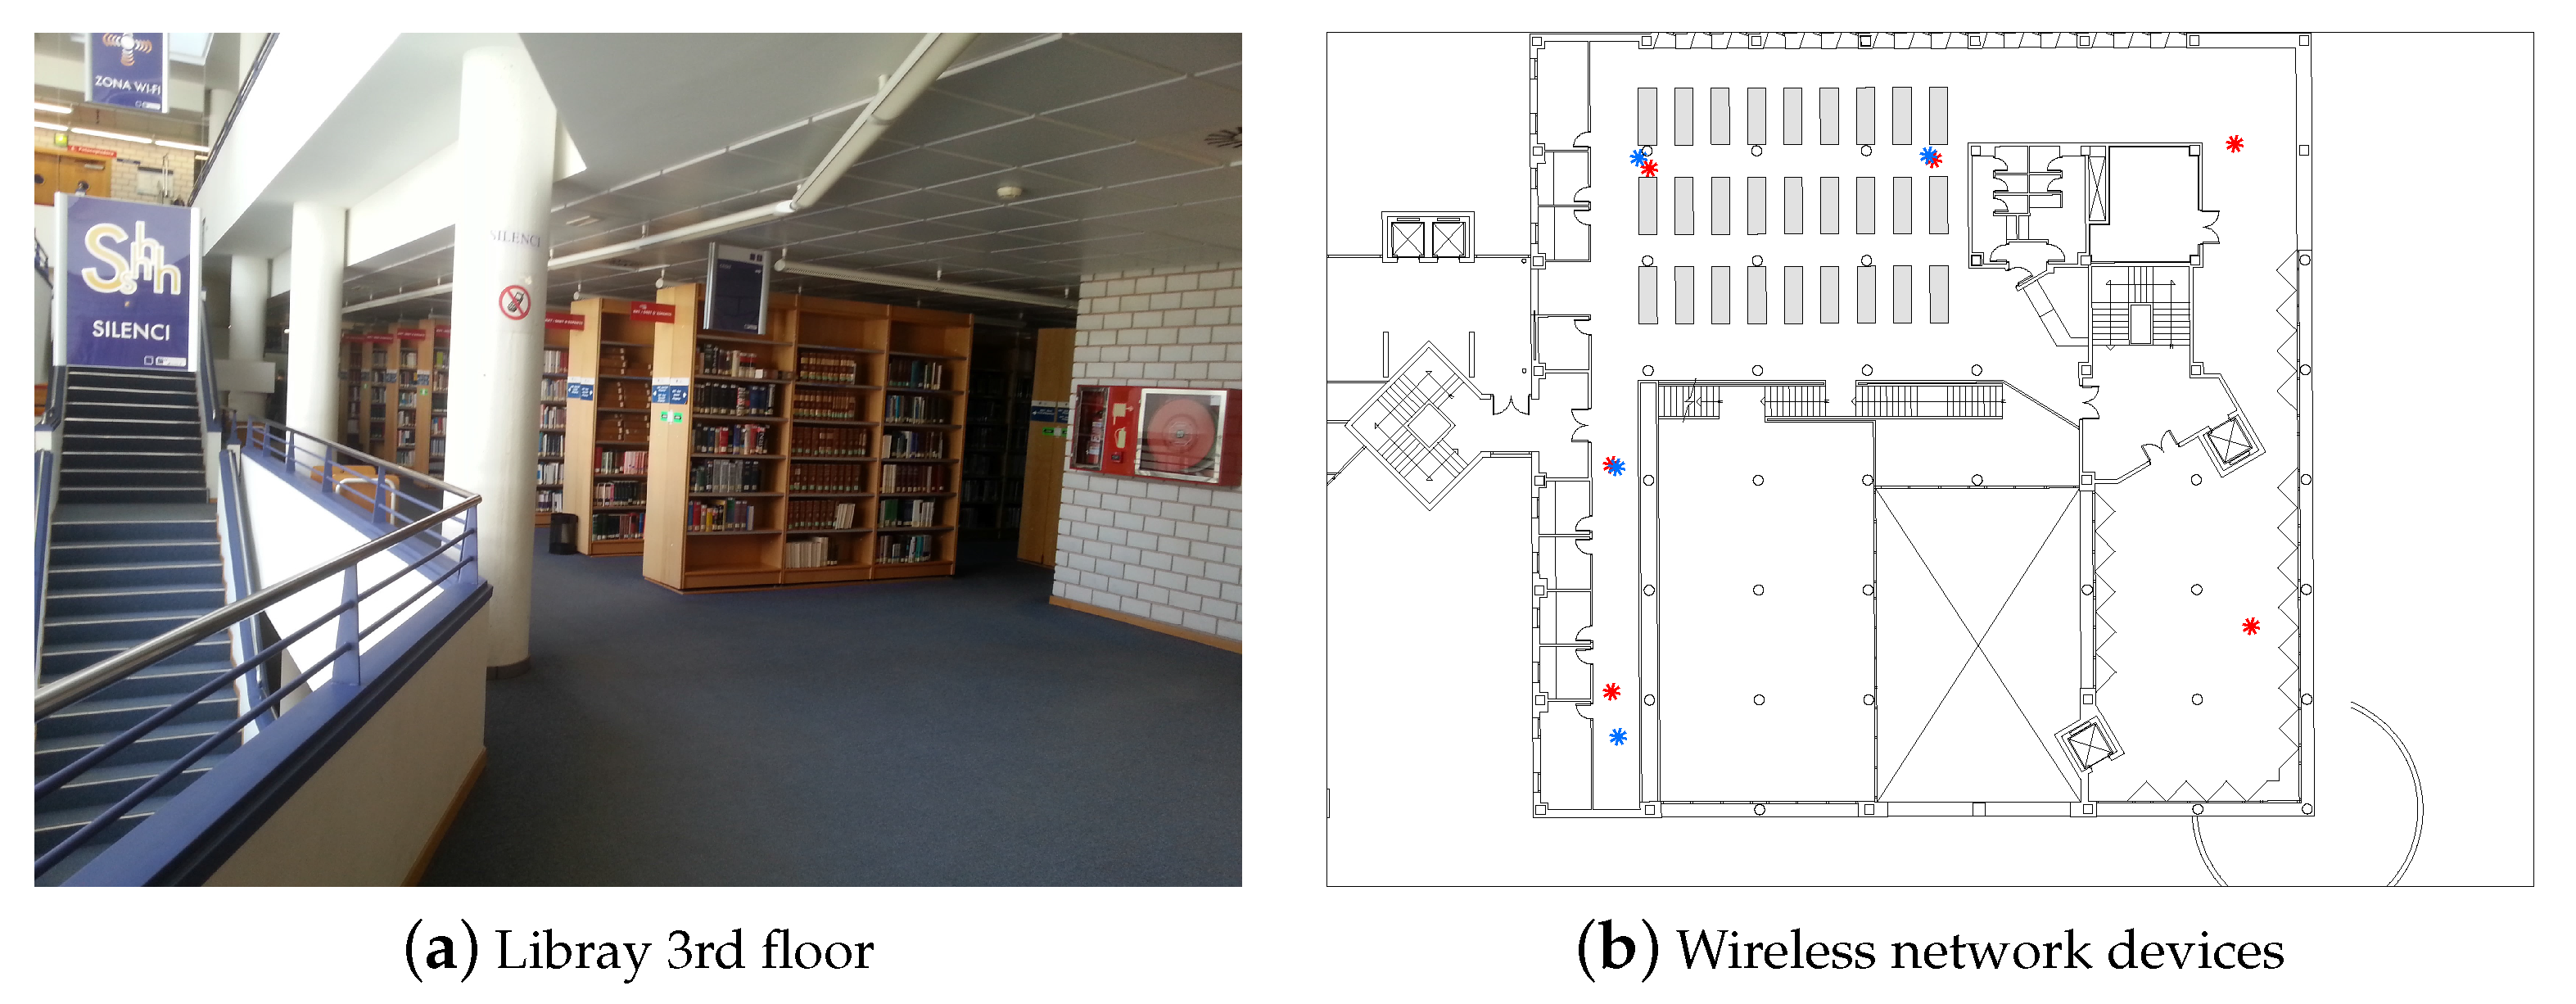
The WiFi measurements were collected in an area among the bookshelves from two floors (3rd and 5th) of a wing of a university’s library building (Figure 1a). The two floors communicate with each other by elevators and stairs, and, despite their numbering values, they are contiguous. The collection area from one floor has no line-of-sight with the wireless network devices from the other floor. The network devices are installed in each floor’s ceiling, which have a relative altitude of about 2.65 m. The supporting materials also include the coordinates of the bookshelves and Figure 1b shows the positions of the wireless network devices located close to the collection area.
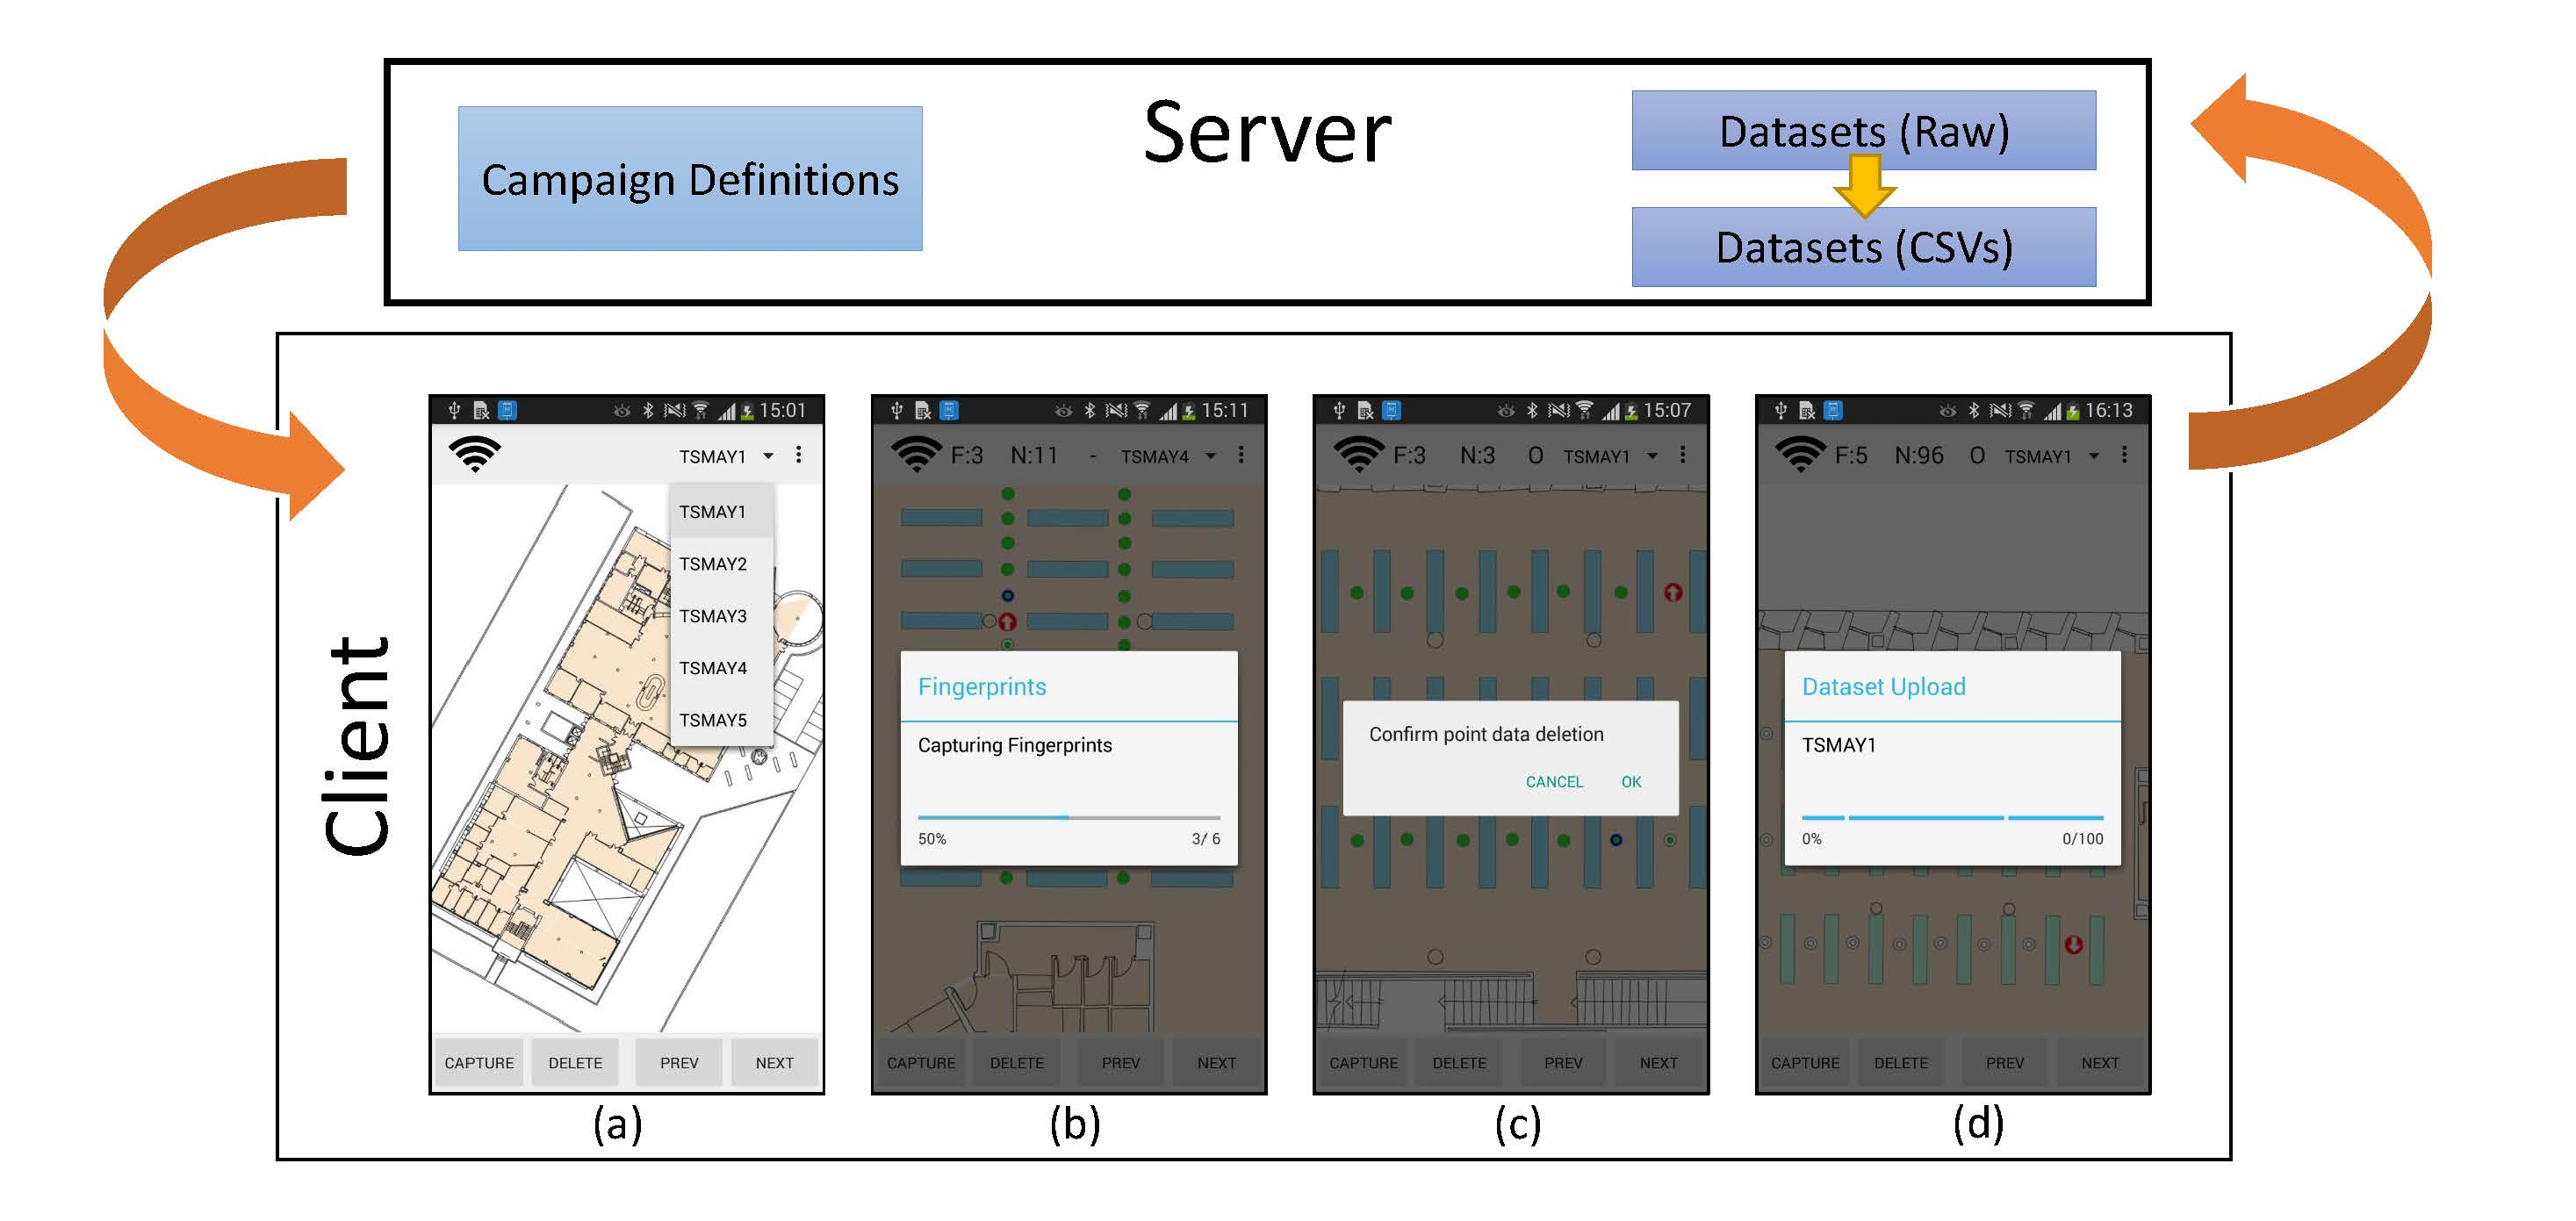
The database collection was performed by a trained person (hereinafter, the subject) that stood at predefined positions, holding the mobile device with the right hand in front of his chest, trying to resemble a person following the instructions shown in a smartphone. The subject used a Samsung Galaxy S3 smartphone and software explicitly developed to ease a strict collection process. The smartphone application avoids that users wrongly indicate their current positions and reduce the likelihood of placing themselves at wrong positions. Figure 2 exemplifies the software usage for WiFi RSS datasets collection: The application downloads the campaign definitions stored in a server. Then, the subject selects the desired campaign and starts the collection (without requiring an Internet connection). The collection proceeds through an ordered list of positions, for which the subject has to face a specific direction and collect six fingerprints (samples). The amount of consecutive collected samples per point was six (instead of five) so that the first sample (which could be a measurement buffered by the phone) could be discarded from the training data used for an IPS. The amount of six samples was preferred over a larger amount to keep an affordable collection effort. Once all required measurements are collected, the subject uploads the measurements to the server, where a new dataset is created.
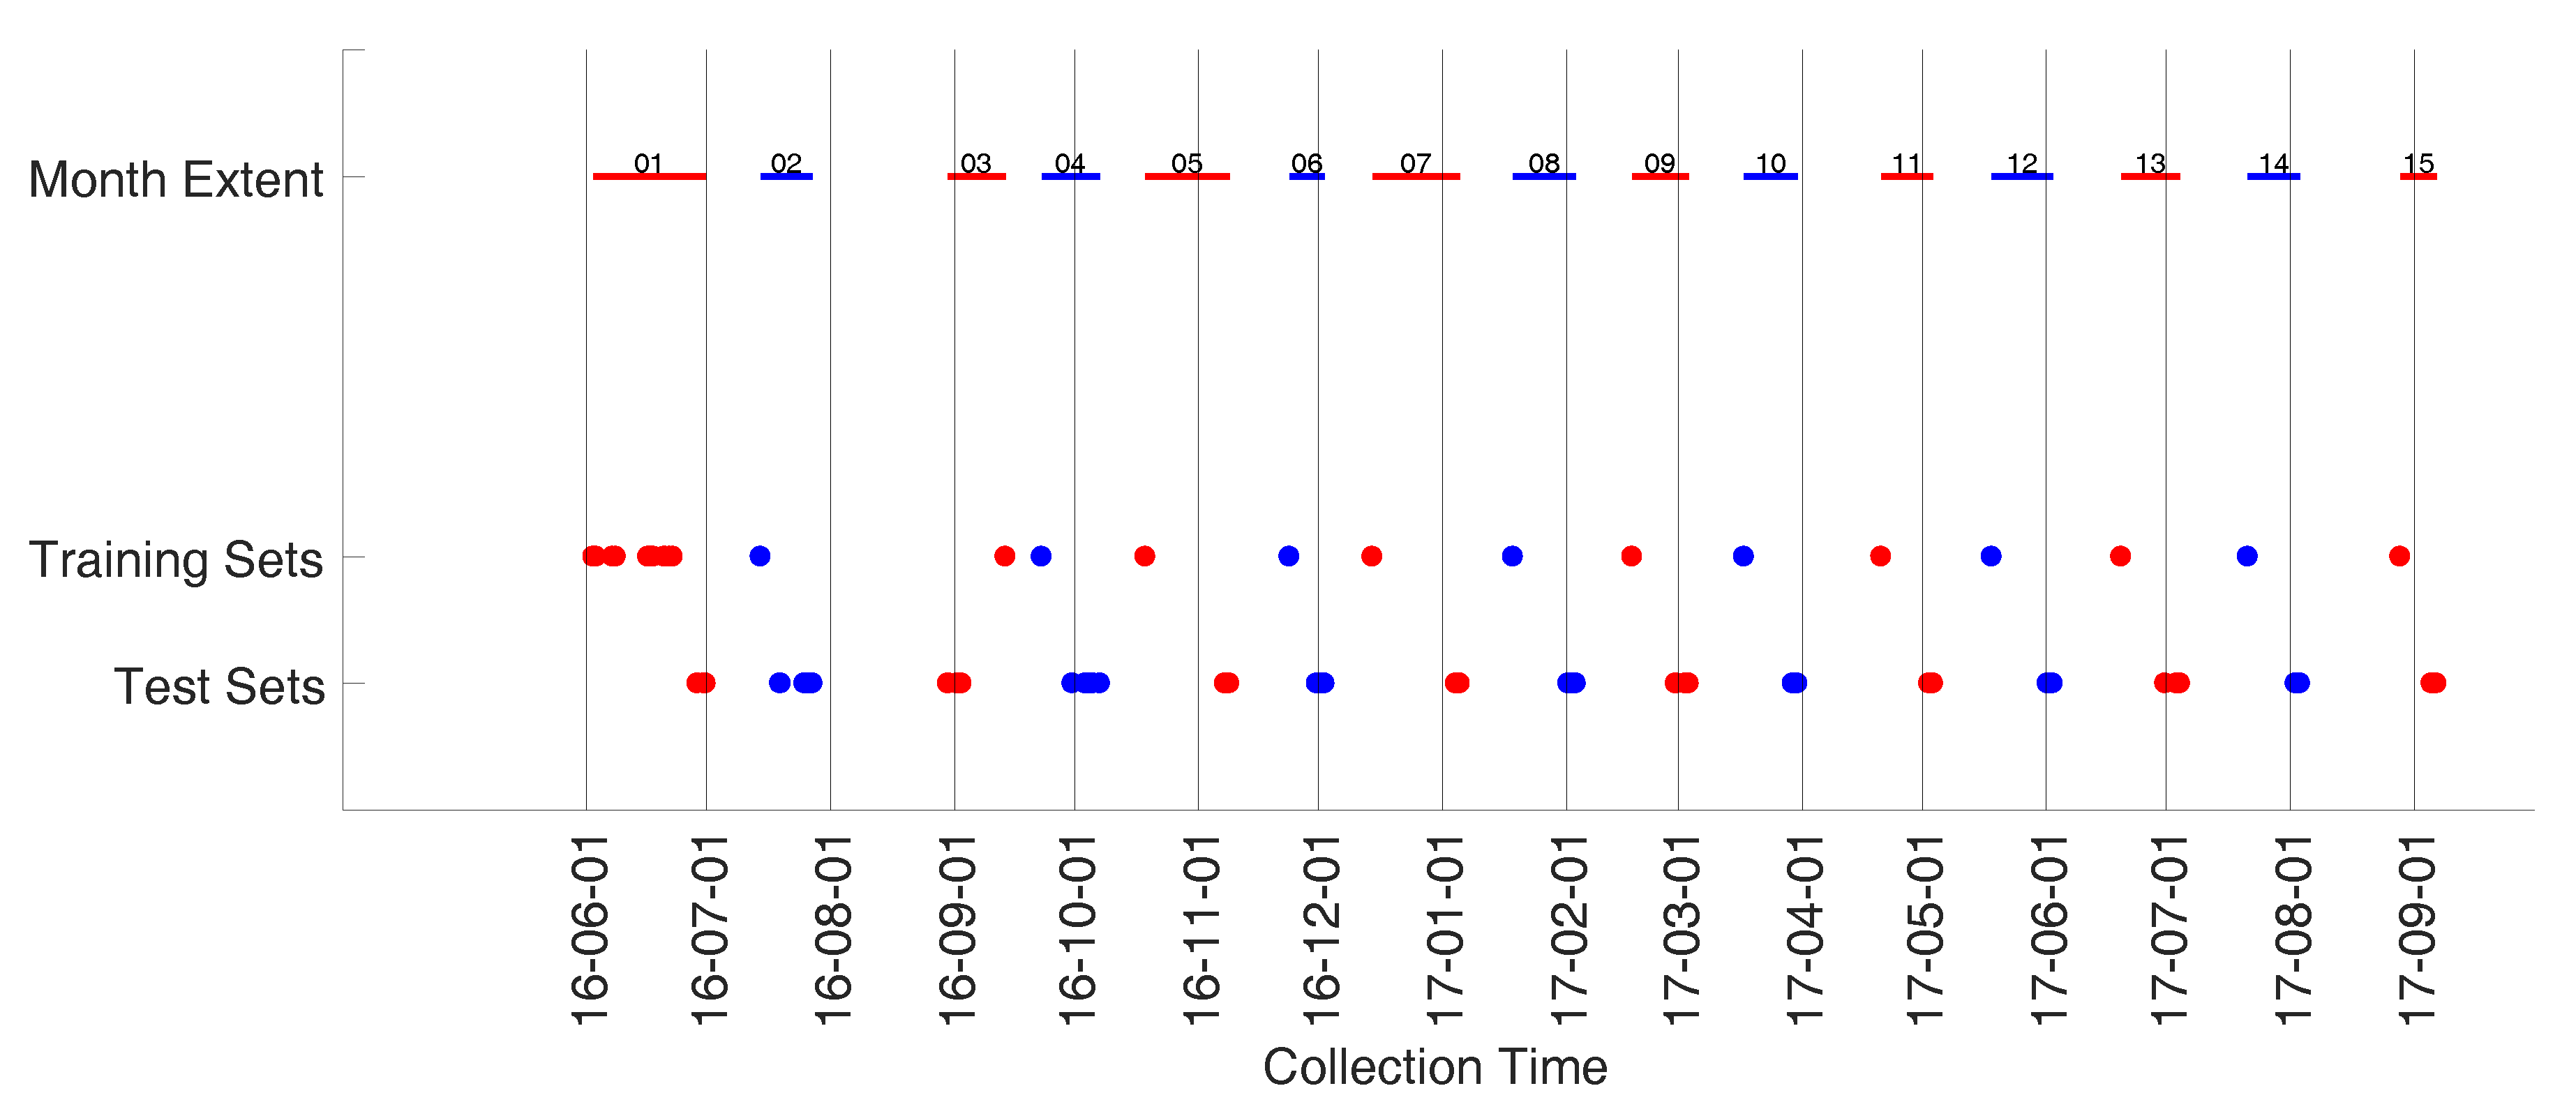
The collected datasets—basically a set of labeled fingerprints consecutively collected at all predefined positions—were organized into test and training datasets. For temporal organization, training and test datasets were grouped into 15 “collection months”. A collection month was a period of about 30 days, and did not necessarily matched a regular year’s month (see Figure 3). In the first month, 15 training and 5 test dataset were collected. For the remaining 14 months, 1 training and 5 test dataset were collected.
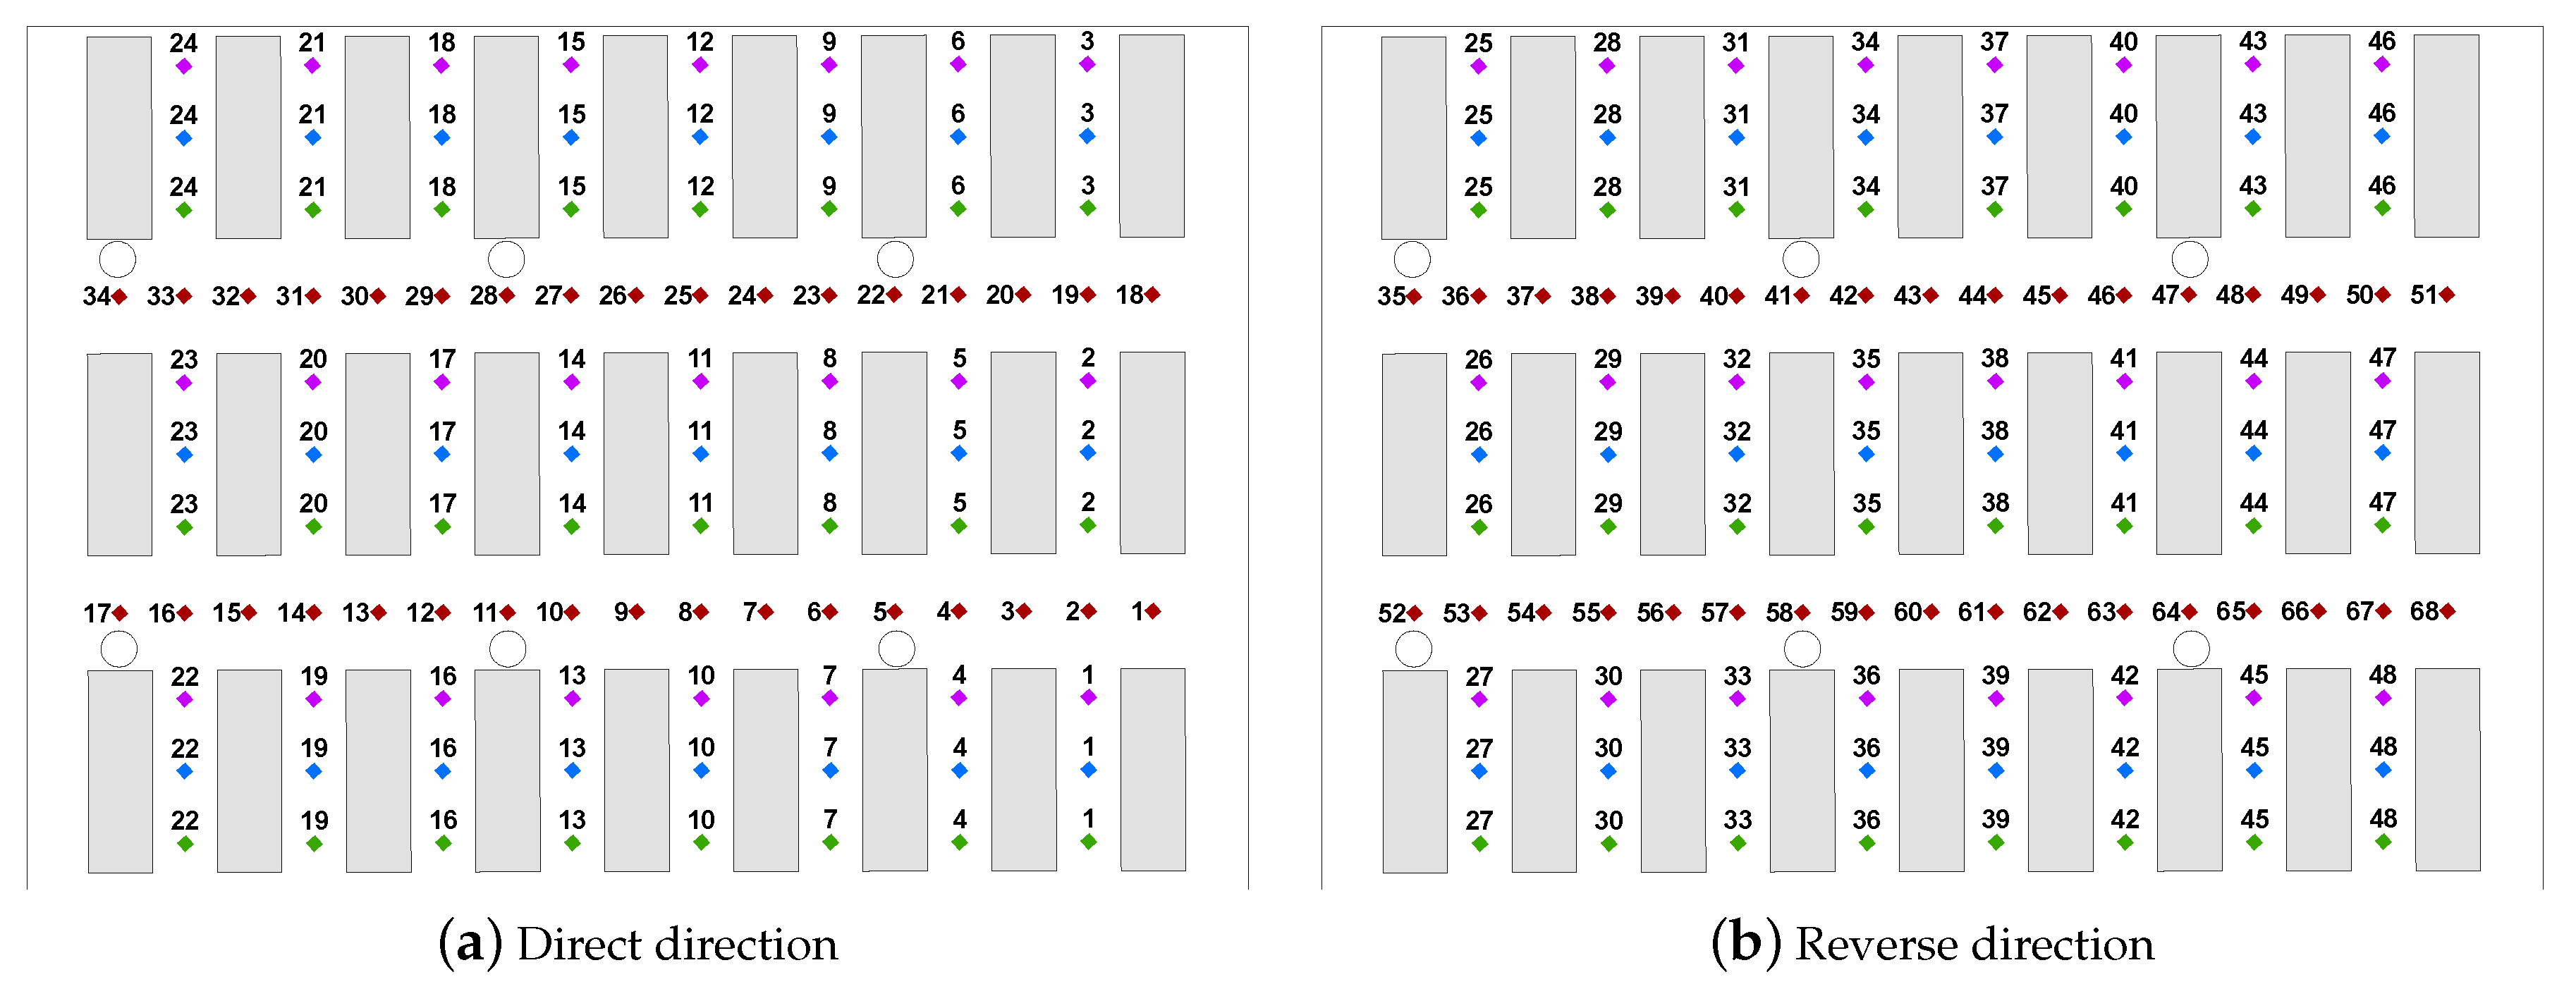
Figure 4a presents the positions where the datasets were collected on the 3rd floor (which match those on the 5th floor). The training datasets and the Test-01, Test-02 and Test-03 datasets were collected facing the “Up” (direct) and “Down” (reverse) directions, while the Test-04 and Test-05 datasets were collected facing the “Left” (direct) and “Right” (reverse) directions. During the collection process, the samples were gathered in the following order: (1) direct direction 3rd floor; (2) reverse direction 3rd floor; (3) direct direction 5th floor; and (4) reverse direction 5th floor. For a month, positions corresponding to training, Test-01 and Test-05 datasets have measurements collected in the four directions. Measurements taken for Test-04 datasets are those collected in the horizontal corridors, and thus their collection directions match the people’s walking directions in those corridors. Only two directions, people’s walking directions between two bookshelves, were considered for positions of Test-02 and Test-03 datasets. Despite considering several collection directions have been shown relevant [36,37,38], the addition of new directions was discarded, again, to have an affordable collection effort, given that a dataset collection was a demanding task taking a mean time of about 1 h. The area covered by the collection positions is m2, considering both floors.
3. Long-Term WiFi Database
The provided WiFi database is composed of 63,504 measurements, organized into datasets that resulted from several collection campaigns. The measurement values in the database represent the measured signal strength (or a non-detection indicator) of 448 access points (APs). In this work, we consider an access point as a detected wireless network which is uniquely identified by its Media Access Control Address (MAC address) and Service Set Identifier (SSID). The database is openly available at Mendoza-Silva et al. [39]. More formally, the database can be defined as:
where is the n-th dataset of kind k taken for collection month m. As seen in Section 2, the month ranges from 1 to 15 and the dataset kind is either training (1) or test (2). The dataset number ranges from 1 to 5 for test datasets. For training datasets, their numbers ranges from 1 to 15 for the first collection month, it is always 1 for the remaining months. Each dataset is defined as four sets: RSS values, positions, times and identifiers sets. The set of RSS values is defined as:
where p represent the amount of points (unique positions, i.e., 2D position, floor, and subject’s facing direction while collecting), s is the amount of samples (six) per unique position, a is the amount of APs detected throughout all measurements in the database, and is the RSS value measured (in dBm) for the i-th fingerprint (row) and the j-th AP (column). If an AP was not detected in a fingerprint, its corresponding value is 100. The operation states for the real numbers product. The value of p depends on the dataset number and kind, and it is 96 for all training datasets and Test-01, Test-02, Test-03 and Test-05 datasets, and 136 for Test-04 datasets. The positions set is defined as:
where , are the (x, y) local coordinates and the floor where the i-th fingerprint was collected. The local coordinates are given with respect to the top-left point of Figure 4b. The coordinates were designed so that 1 unit of distance in local coordinates represents 1 m distance in the environment. The value of is either 3 or 5. The times set is defined as:
where is the time stamp when the i-th fingerprint was collected. The time stamp is stored in a human-readable form considering the local time (UTC+1 and UTC+2, for regular time and daylight saving time, respectively) when the collection took place. For example, the timestamp “201709051700119” indicates that the associated fingerprint was collected on 5 September 2017 at 5:00 p.m., in the 119th millisecond of that minute. The identifiers set is defined as:
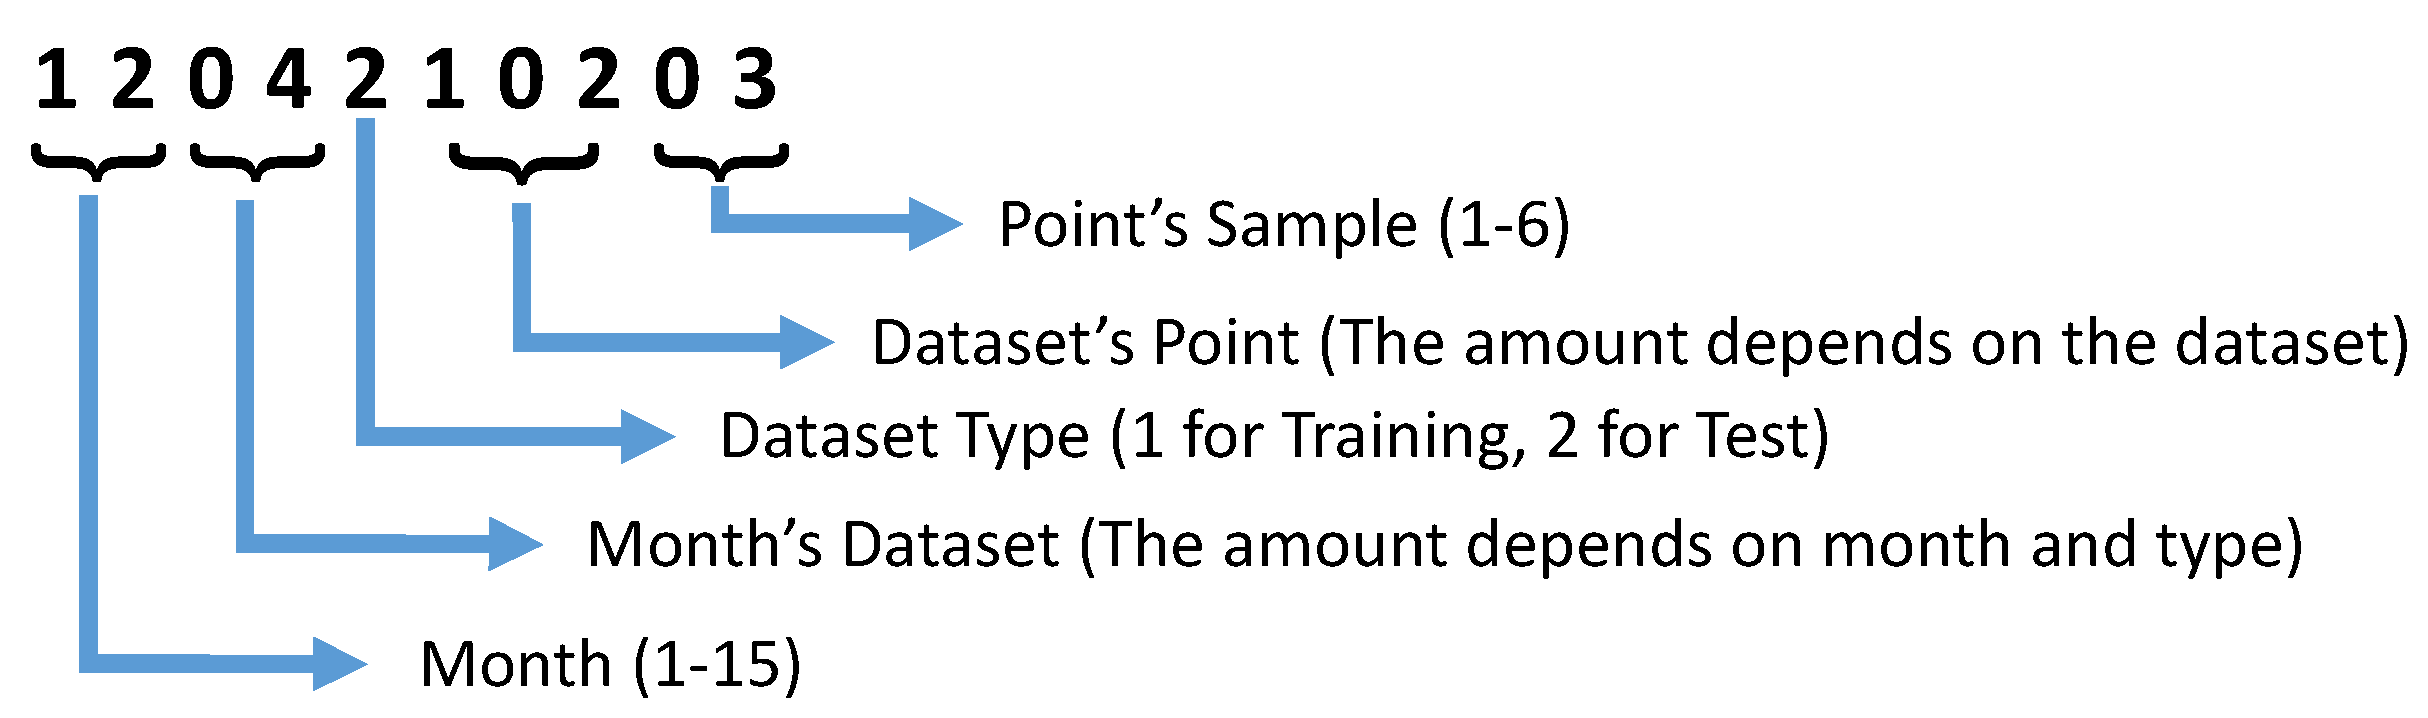
where is the identifier associated to the i-th fingerprint. Identifiers are numbers created to uniquely identify each fingerprint in the database. Figure 5 presents an example on the identifier specification. The supporting scripts provided along with the database allow simple fingerprints selection based on their identifiers.
The database is provided as a collection of files organized in folders. A folder contains the datasets gathered for the collection month that the folder’s name indicates. For each dataset, there are four files that store its RSS values, positions, times and identifiers sets, following a schema similar to that used in Lohan et al. [10]. A file’s name indicates the dataset kind (“trn” for training, “tst” for test), the dataset number, and which dataset’s set represents (“rss”, “crd”, “tms” and “ids” for RSS values, positions, times and identifiers sets, respectively). For example, the file “05/tst04rss.csv” contains the RSS values for the Test-04 dataset from month 5. The supporting scripts provided along with the database allow loading the desired dataset based on filtering criteria.
4. Usage Examples
The main value of the provided material is the WiFi measurements that enable short- and long-term temporal analysis applicable to the design of robust IPS. The database is accompanied by Matlab scripts and other information that ease loading and filtering of the desired data. For example, data for all months and datasets could be loaded at once and then filtered to obtain measurements of specific months, datasets types and numbers. It is also possible, for example, to load data for test datasets of a specific month and then filter out the first sample of each collection point. The measurements processing does not require significant time for experiments run in modern personal computers. For example, the execution time of experiments from Section 4.3 was less than 15 min in an Acer Predator computer with a Intel CoreTM i7-4790 at 3.6 GHz with 12 GB of RAM and a SATA 7200 RPM 1TB hard disk, on Windows 10 using MATLAB R2017a.
The examples presented in this section, most of which were created using the scripts provided along with the database, show suggestions on the studies that our database may enable. The examples explore short-term signal variations using the RSS differences in points’ samples, and visualizing the signal continuity. The long-term signal variations are explored using the detection of network changes and IPS accuracy evolution along several months.
4.1. Signal Intensities
Figure 6 visualizes the mean and standard deviation for AP 7 at each collection point of (Training-01 dataset from month 15), considering the two collection directions. It confirms the notion that the RSS variance is not equal over space, that it is usually larger at positions close to the AP and smaller at positions farther from the AP [40]. High RSS values with low variability, as in the left-most area of the 3rd floor, are nevertheless the more desirable condition for WiFi fingerprinting based positioning. The difference between the RSS values measured in each floor is notable, which should provide a high floor differentiability just considering this AP. The chosen AP was not detected in some samples (mainly, at positions with lower y-coordinate on the 3rd floor and positions on the 5th floor) and those samples were not considered for the visualization. However, the non-detection case of an AP is part of the signals variations.
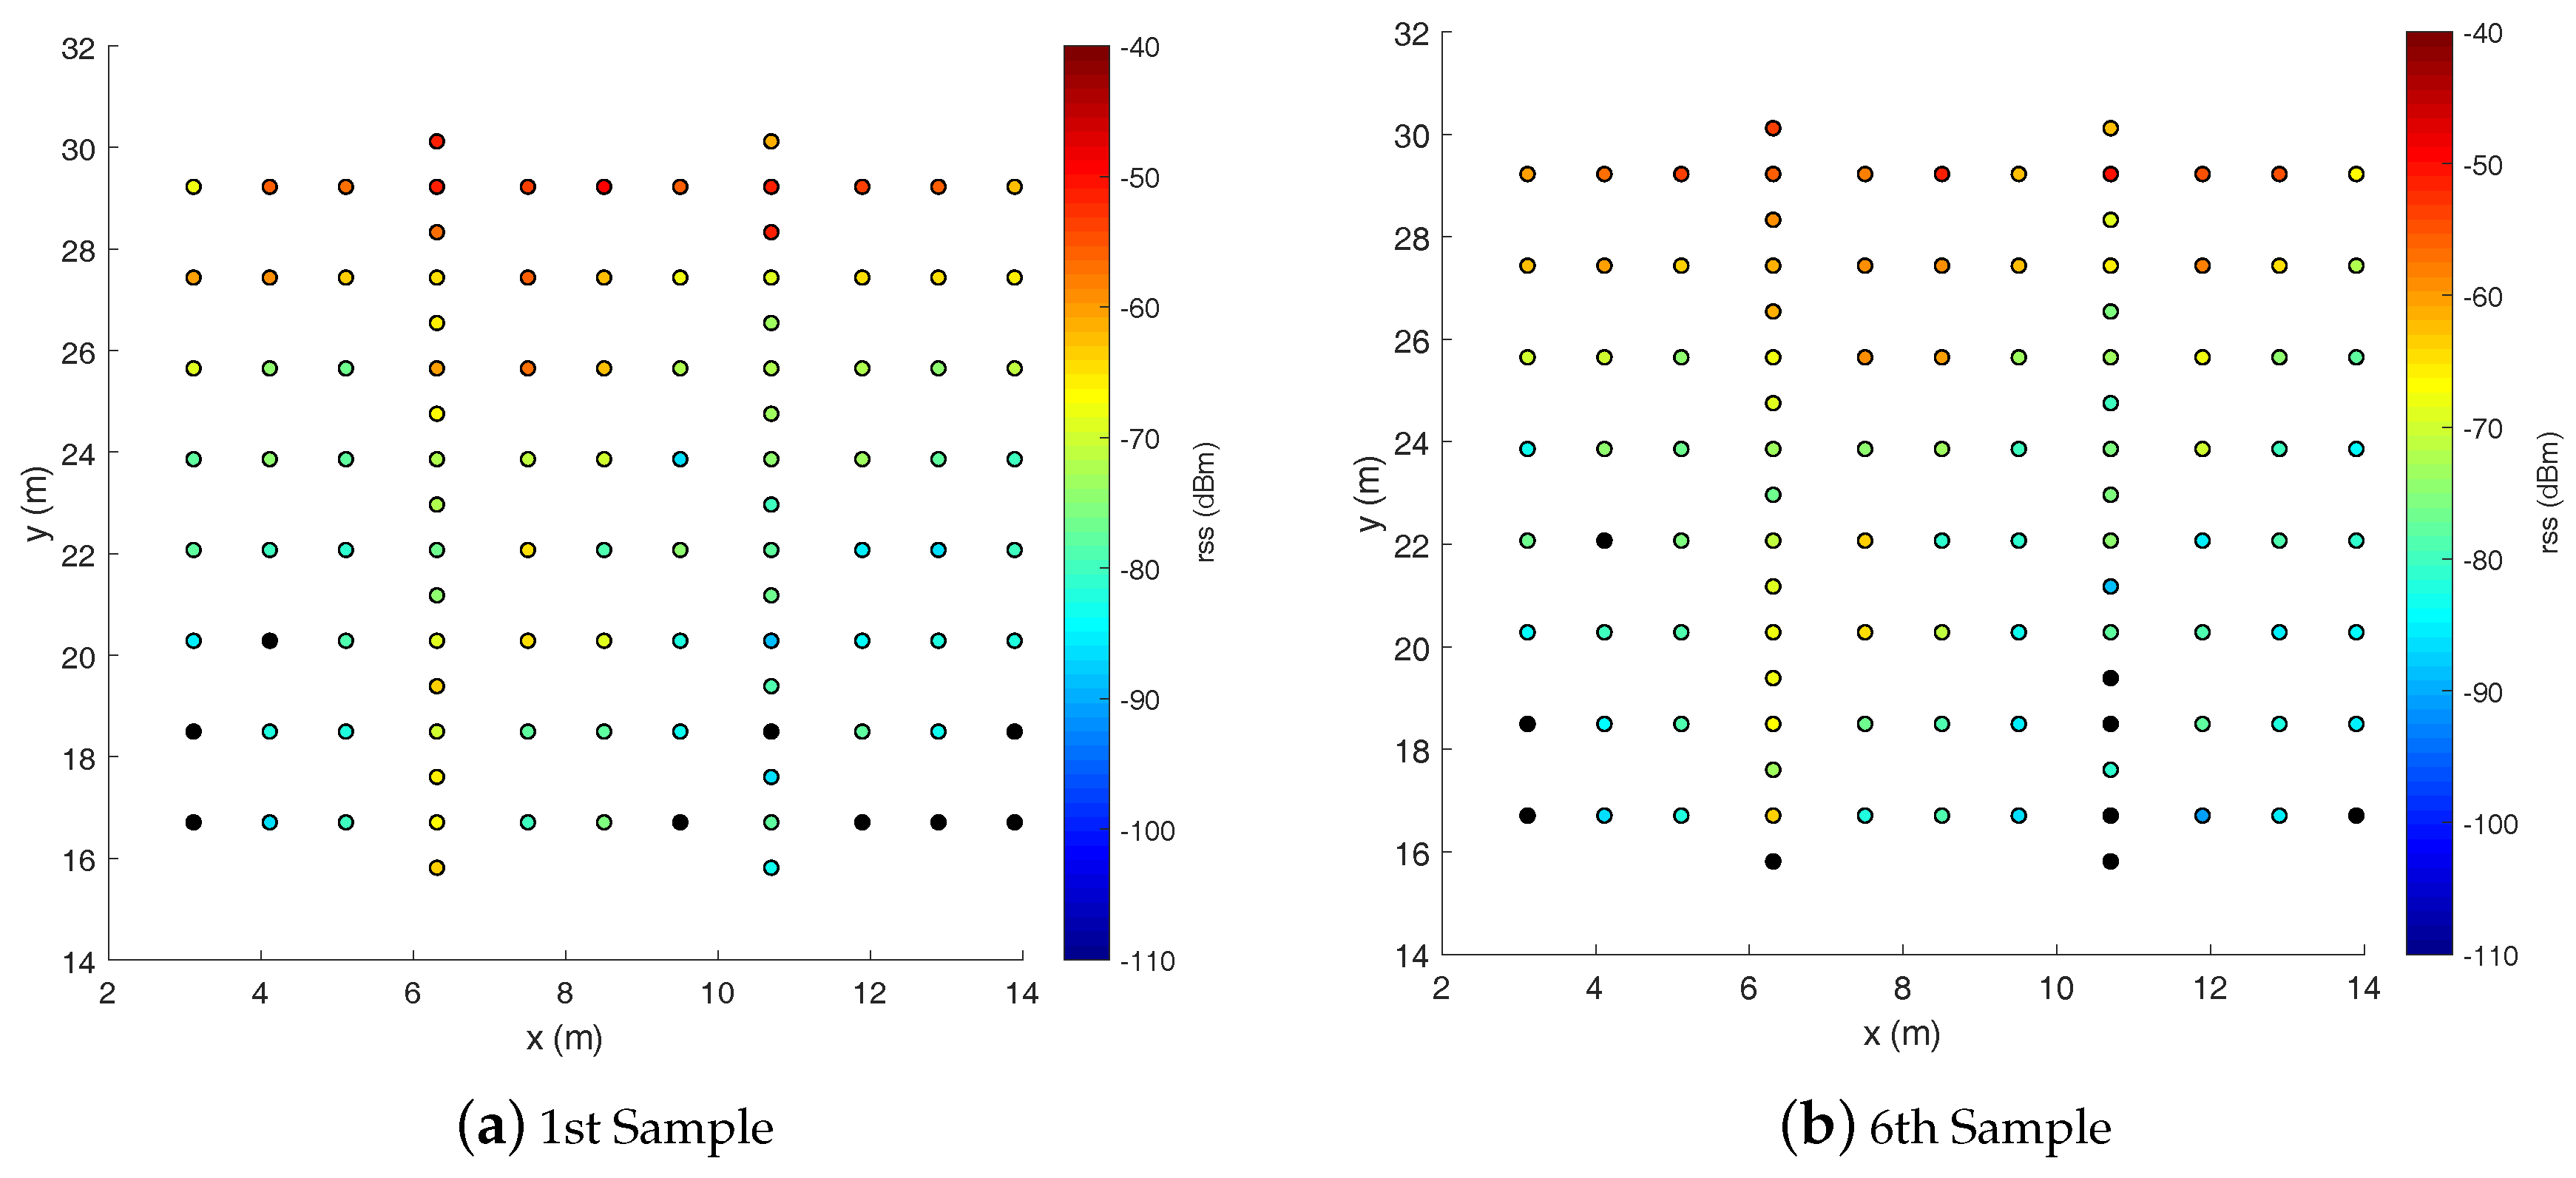
Figure 7 presents the 1st and the 6th sample for points of one collection direction, i.e., the figure shows the first and the last fingerprint collected at the target points. Apart from showing a clear signal continuity in the space, the figure presents how signals for an AP may vary notably at some points, reaching differences over 5 dBm. It is significant that the AP was not detected in the 6th sample for the point closest to the (6, 15) coordinates, while for that point the AP was detected with a RSS value of over −70 dBm for the 1st sample.
Table 2 presents the mean point-wise RSS difference value among pairs of samples taken for each point. The table shows that, in the mean case and for contiguous samples, the difference is not as significant as suggested by Figure 7. The difference is slightly higher than the likely variation of 1 dBm assumed in some studies [41]. The sample pair 1–2 has the largest difference (1 dBm more than the others), which indicates that the first sample may be buffered measurements taken by smartphone’s software before the subject arrived to the collection position. Short term variations in signals are relevant for an IPS because, commonly, only one fingerprint is collected for estimating a user position.
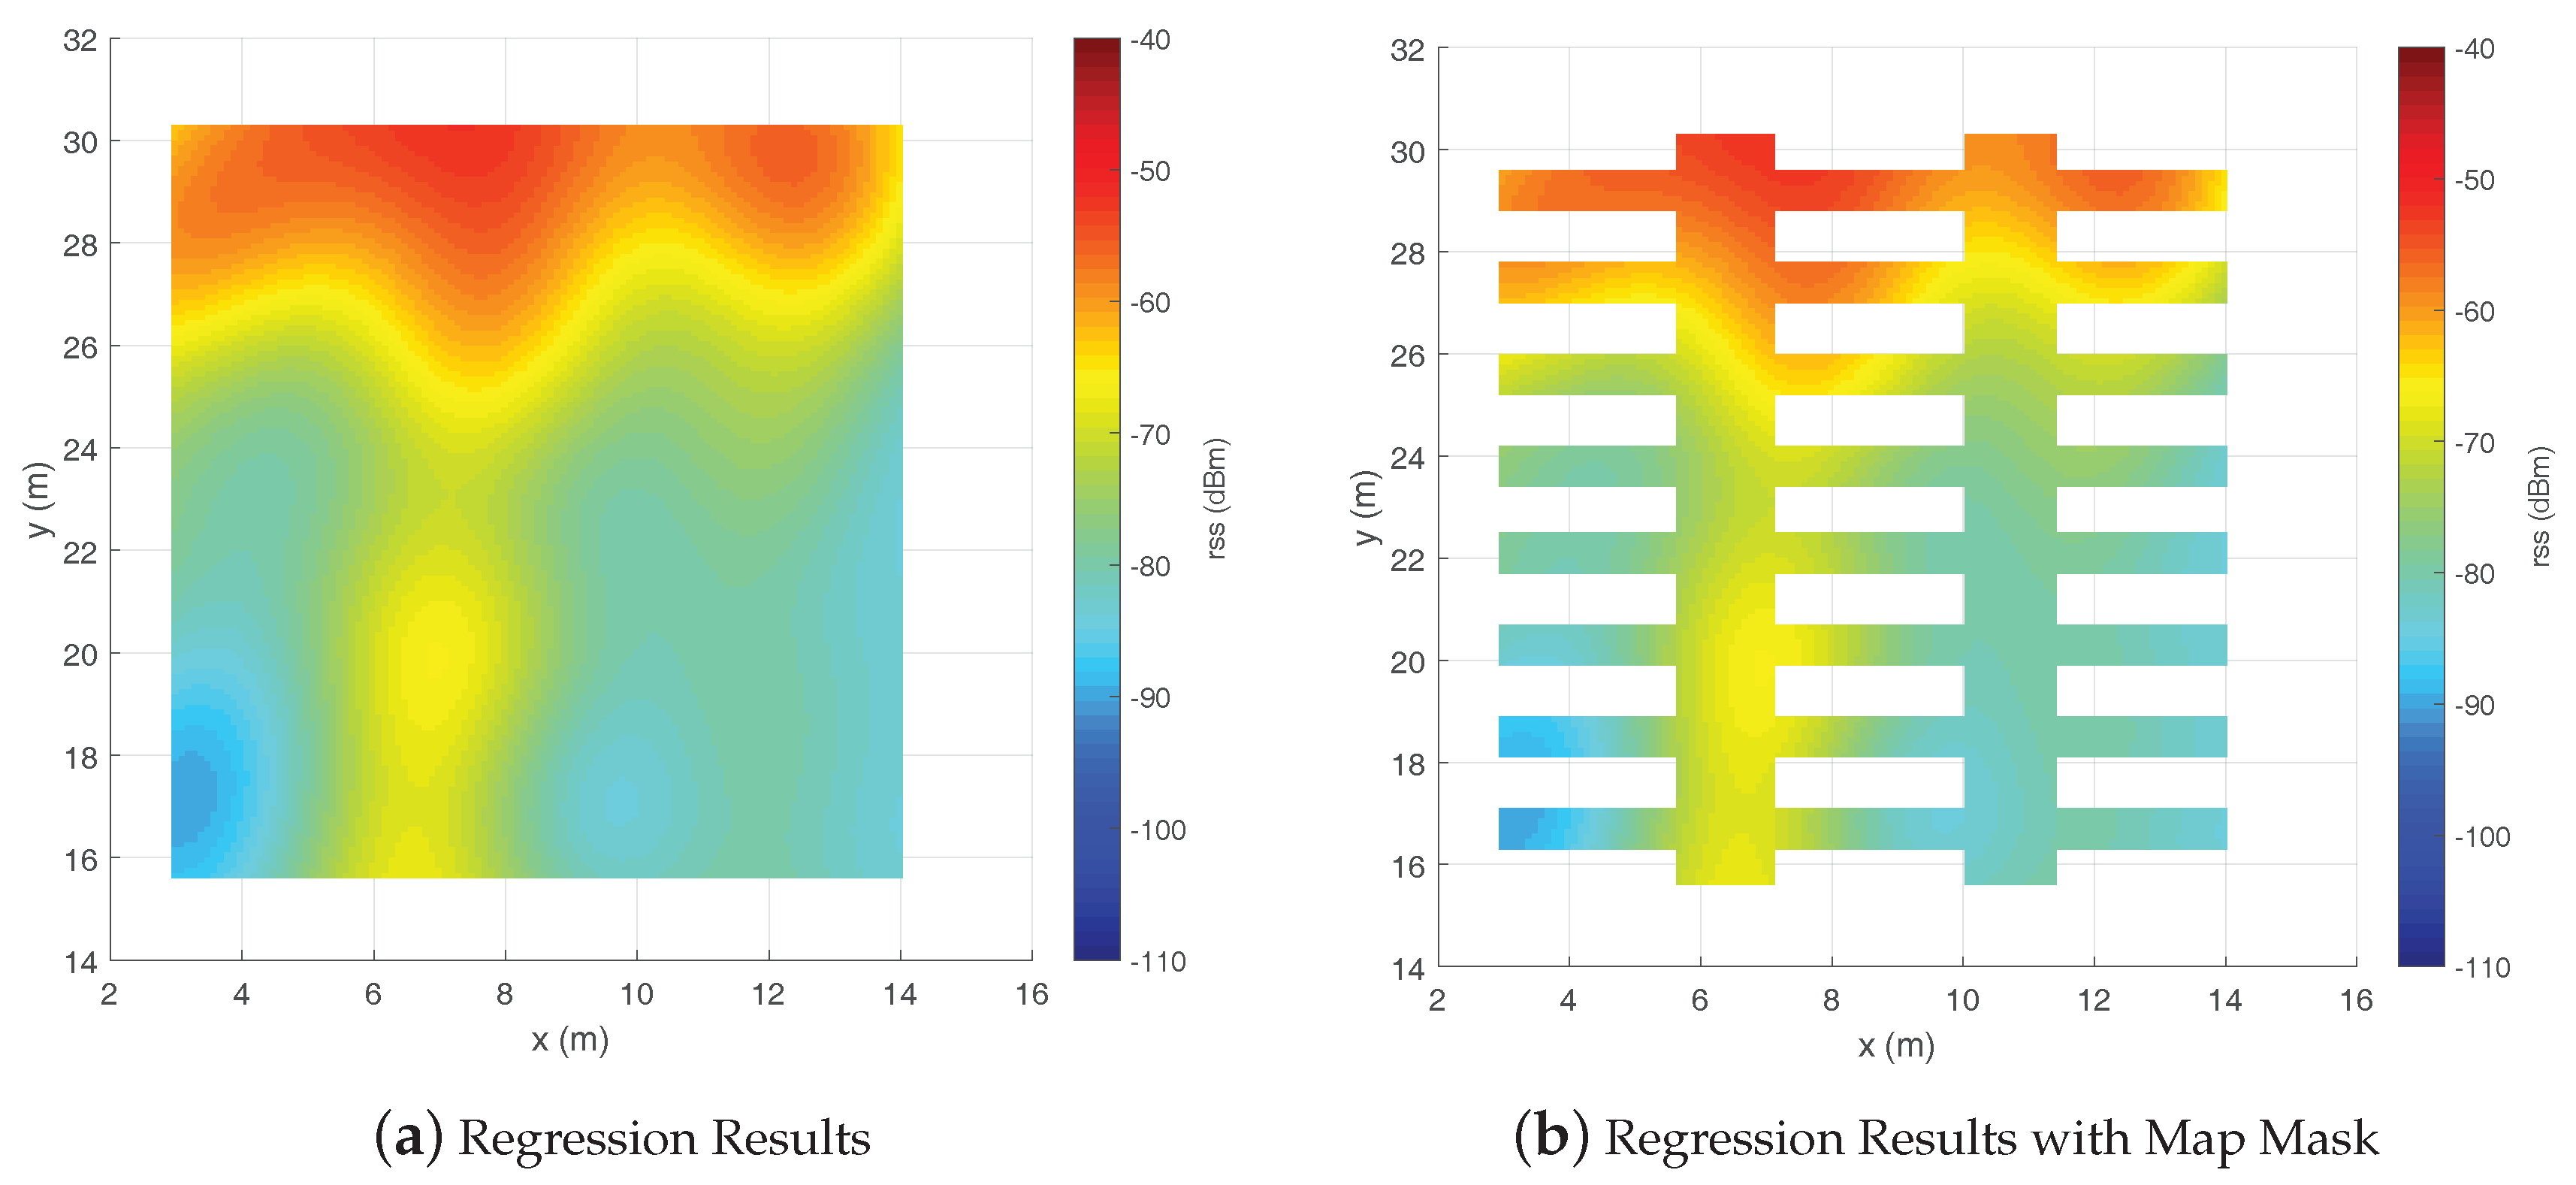
Even though the database was collected at a relatively dense set of positions, there are spaces of more than 1 m2 with no measurements. Regression (interpolation and extrapolation) is usually used to fill the gaps of unmeasured positions. Figure 8a visualizes the results from applying Support Vector Regression (SVR) [42] as provided by [43] to the specified data. Measurements where the AP was not detected were ignored in the regression. The selected AP may correspond to a network emitted by the device located close to the top of the left vertical lane. The WiFi signals of that AP are the strongest in positions close to the device but also in those along the left lane. As the bookshelves’ coordinates are provided in the supporting material, it is possible to discard bookshelves areas when the regression results are used as training data for an IPS. Figure 8b presents the regression results with the bookshelves areas removed.
4.2. AP Ephemerality
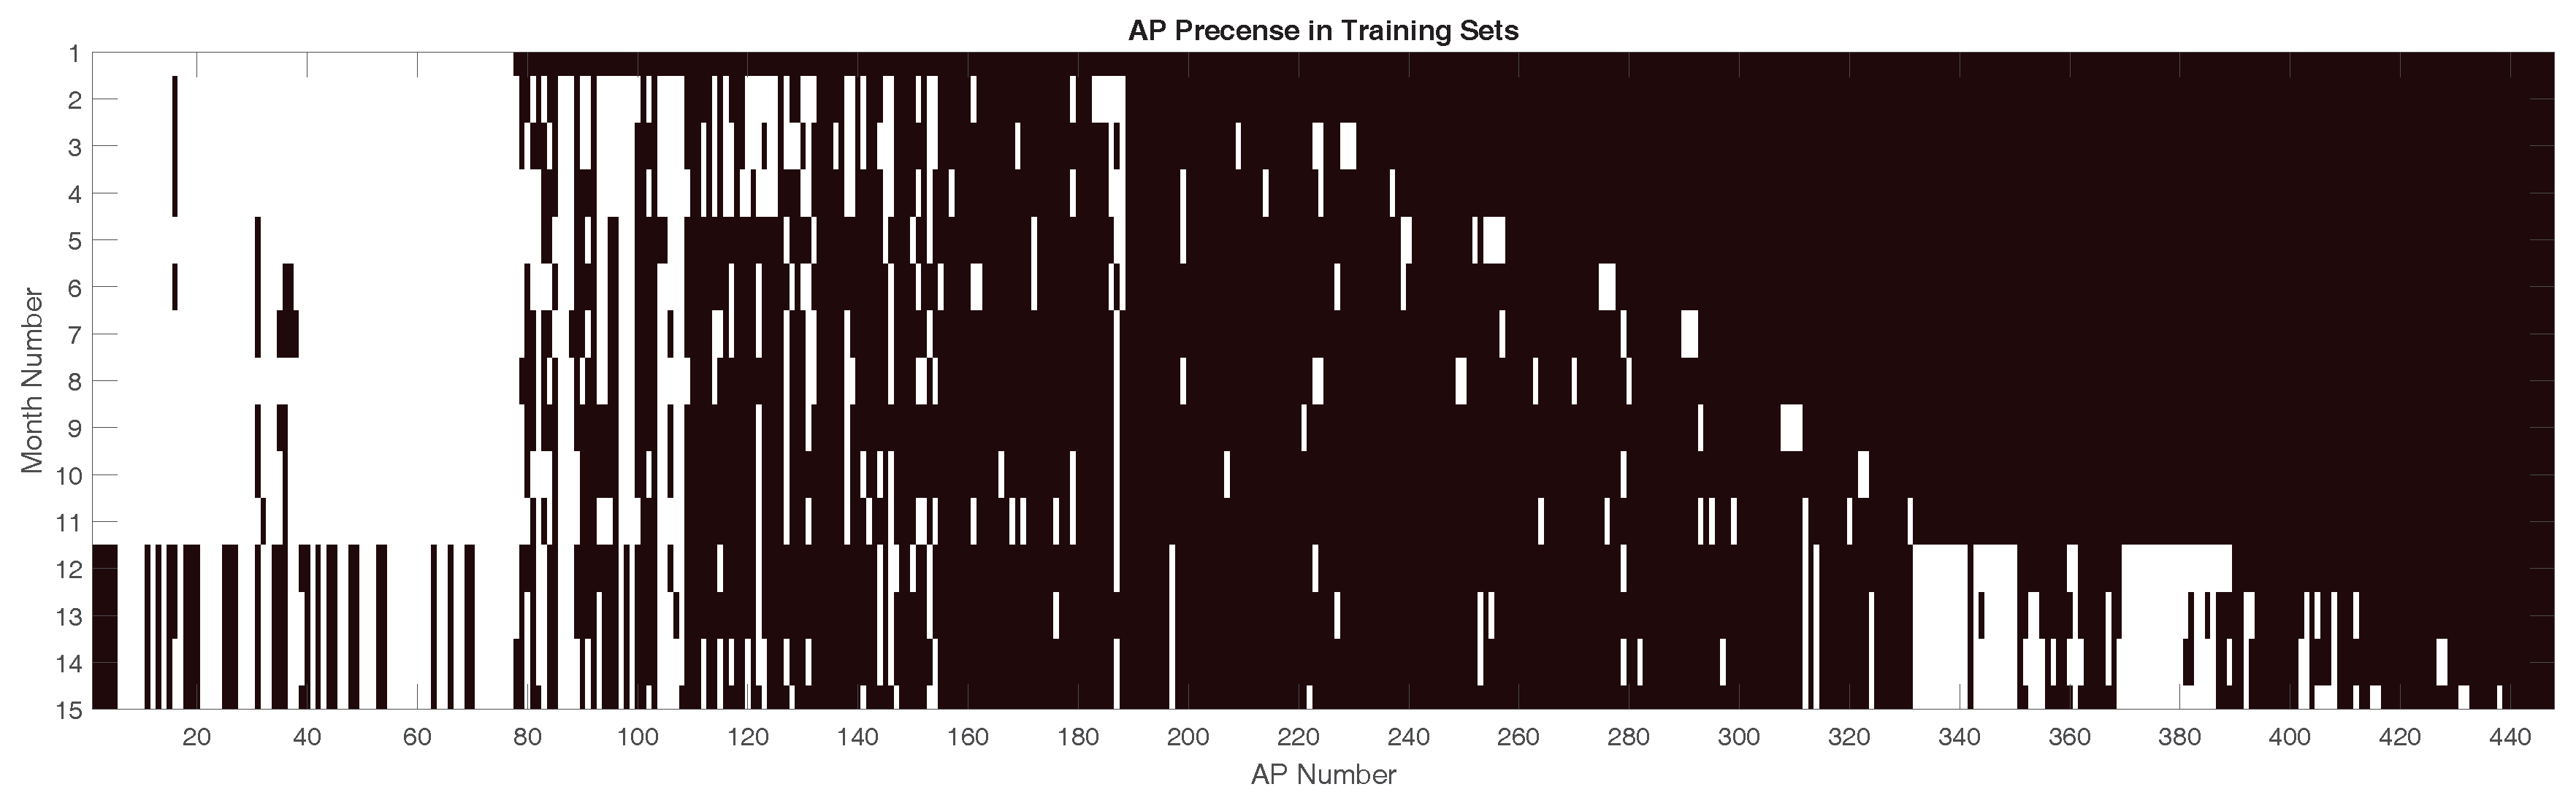
The dynamics of networks changes is explored in Figure 9 and Table 3. Even though the total amount of detected networks across all months and datasets is 448, Table 3 only shows 270 APs, as only Training-01 datasets were considered for the table data. APs located to the left of the chart were detected for most months, while those in the middle are mainly ephemeral. Some APs that were not seen in the first month were later continuously seen in later months. Furthermore, there was a notable change in network configuration in Month 12. Some APs seen in most of previous months were not longer detected, and new APs were continuously observed onwards. Such changes suggest that network parameters of some devices were modified between Months 11 and 12, and they started broadcasting with new MAC or SSID configurations.
Further exploration on the appearance/disappearance is presented in Table 3. The table shows the complex dynamic of the AP presence. Along the months, some APs shows intermittent presence, appearing and disappearing without following a clear rule. Without taking into account the particular cases of Months 01, 02 and 12, the appearance/disappearance of APs is relevant: the amount of APs that are detected for the first time is up to 15, while the amount for those that have disappeared with respect to the previous month is up to 24. Intermittent APs add uncertainty to a WiFi RSS-based IPS, and thus RSS values for such APs are usually filtered out of the training data.
Apart from the abrupt changes detected between Months 11 and 12, it is also notable that many new APs appeared in Month 02. The database includes 15 training datasets for Month 01, which were used in Table 4 to explore APs intermittence along Month 01. Table 4 adds a column (with respect to Table 3) that presents the day difference respect to the first collection day. With only a few days of difference, the amount of previously undetected AP, and the amount of AP no longer seen, is significant, as clearly shown by data for datasets 02 to 04. Along 20 days, 182 different APs were detected, which is quite significant given the size of the collection area.
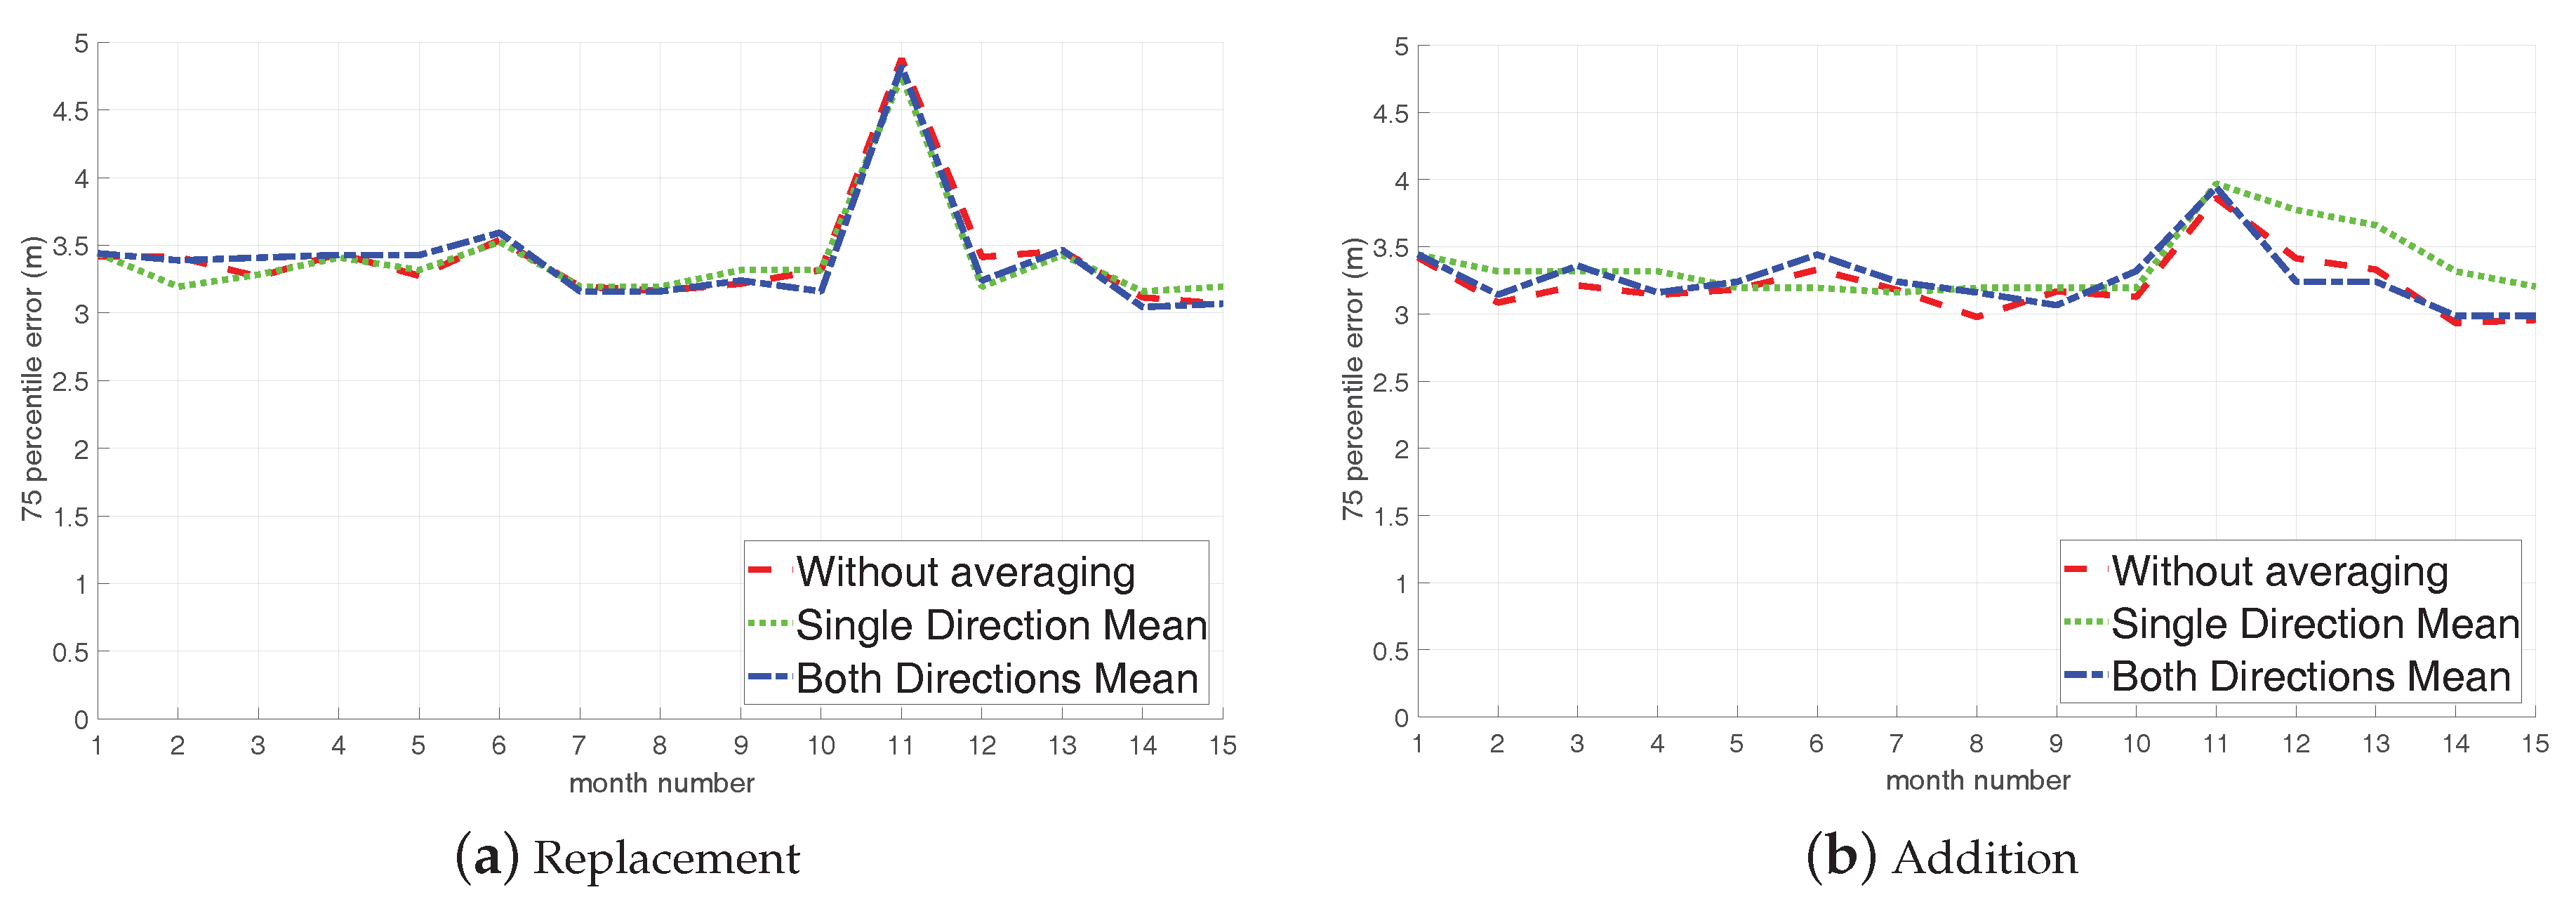
Changes in the environment such those presented before commonly lead to perform periodic updates to the training data for an IPS. Figure 10 shows the positioning result using the k-Nearest Neighbors (kNN) method [36] and two update strategies: (1) replacement, in which all training data from the previous month is replaced with that of the current month; and (2) addition, in which the training data grows by including every month all new training measurements. The training data have also been tried: (1) with no averaging and for kNN; (2) computing the position-wise mean considering both collection directions (“Both Directions Mean”) and ; and (3) computing a position-wise mean per each collection direction (“Single Direction Mean”) and .
The averaging alternative chosen for training data has little impact on the positioning accuracy either for the replacement or the addition strategy. The no-averaging alternative is the best continuously for several months. The addition strategy, mainly when applied without averaging measurements, provides the lower positioning errors, and, more importantly, it is able to better cope with the changes in network configuration occurred between the collection of and . The network changes occurred after the collection of but before the collection of any test dataset of that month. With the replacement strategy, the positioning error metric increases to more than m, while with the addition strategy does not reach m. The computational burden caused by data accumulation with the addition strategy can be reduced if the "Both Directions Mean" alternative is applied, which also provides good positioning accuracy and tolerance to the network changes.
4.3. Positioning with Simple Algorithms
The 15-month-long measurement data in our database can be used to study the robustness of WiFi RSS-based positioning methods to long-term signal variations. This section presents the evaluation of six positioning methods. The methods tested in this section are merely examples of simple IPS found in literature, that were selected because of their popularity or because the authors’ familiarity with them. Their parameters were determined in simple preliminary experiments for each method regarding the method’s accuracy for the first month of data. The methods (some names were chosen by us) are:
- Rand: The method returns a position (x, y, floor) from the training data chosen randomly. The positioning accuracy of this method is provided in order to have a lower expected accuracy measure, but the method’s results are not discussed.
- Prob: It is the known probabilistic method first presented by Youssef and Agrawala [44], which finds the position l (x, y, floor) from the training set that maximizes the probability of , with s being the operational fingerprint and with , where is the RSS value of the ith detected AP. In our settings, we have computed in a similar way as Berkvens et al. [41], specifically:where r refers to a variable in the RSS domain, is the normal distribution with mean and variance ; and are functions of l, the position, and are calculated for each point (position and collection direction).
- kNN: It is the known method first presented by Bahl and Padmanabhan [36], which finds the k closest samples in the fingerprint space to the operational fingerprint. The 2D position is estimated as the centroid of the positions (x, y) associated to the closest samples. In our settings, we use and the Euclidean distance as fingerprint distance. The floor estimation is the mode of the closest samples’ floors.
- Stg: This method perform an initial samples filtering [45], which selects samples whose APs with the s strongest RSS match those of the operational fingerprint. With the selected samples, kNN is applied, as explained before for the kNN method. In our settings, and .
- CSE: It is based on the method proposed in Hernández et al. [46], in which an SVR is applied over the training data for a floor. From the regression results, per each AP and position, the RSS difference with the operational fingerprint is computed. The RSS difference is used to compute a score, so that positions with zero difference get the highest score. The score gets smaller as the difference increases, and it is zero beyond a margin m. The scores of each AP are summed up to obtain a general score for each position. A map mask is applied to discard unfeasible positions. Scores are computed independently for each floor. The position (x, y, floor) with highest general score is used as position estimate. In our settings, . SVR is used as provided by MathWorks® [43], using a Radial Basis Function (RBF) kernel and performing predictor data standardization. As map mask, we used the space of the library bookshelves.
- Gk: This algorithm is based on the parametric modeling of the logarithmic RSS as random process which follows a Normal distribution. Each RSS is considered mean value, whereas the standard deviation is set constant for all observations. It computes the likelihood of the RSS at each fingerprint position and determines the position estimate by averaging the positions that correspond to the highest likelihood value(s). This estimator was used first for WiFi RSS based positioning by Roos et al. [47], in form of a kernel density estimator (KDE). (The Gk method implemented in the Supplementary Materials does not exploit the six RSS samples; it uses only a single Gaussian kernel and therefore corresponds to the normally distributed likelihood [48]).
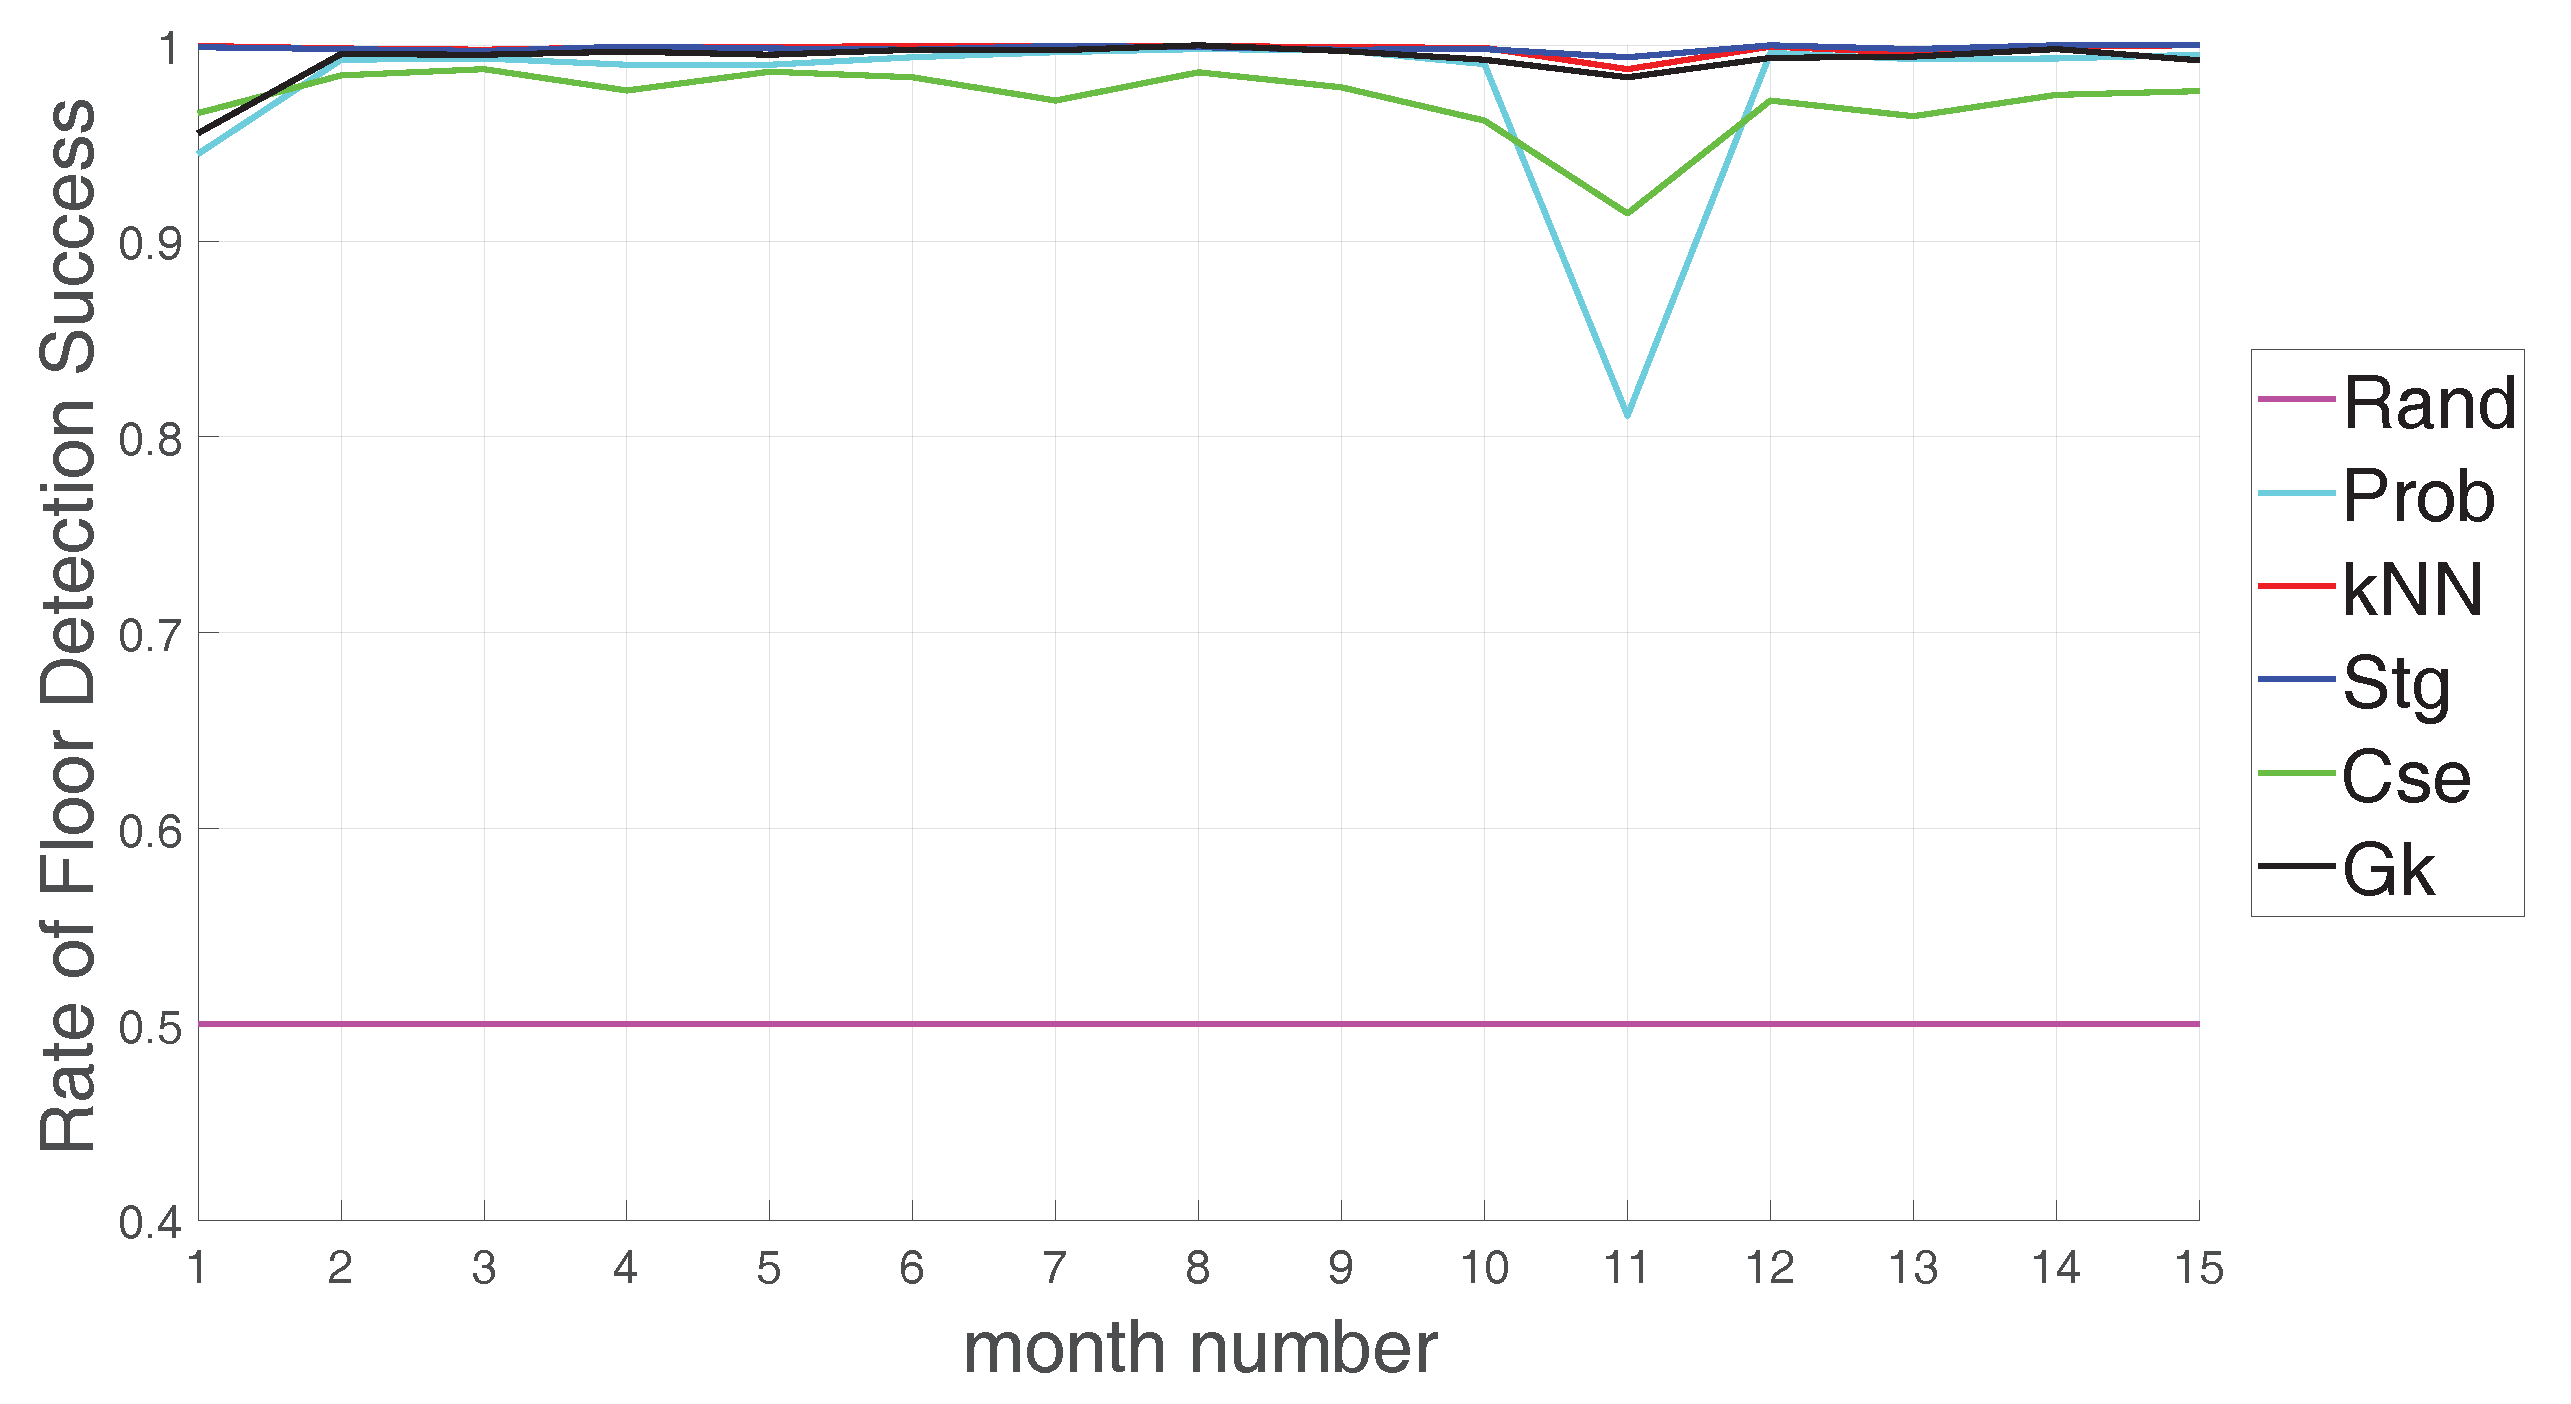
For every month, the Training-01 dataset of that month was used as training data and all test datasets of that month were used as test data. The positioning accuracy was evaluated in terms of the 75 percentile of the positioning error (Euclidean) distance (Figure 11) and in terms of the floor detection success rate (Figure 12). We favored the 75 percentile over the mean as a metric for positioning accuracy, as the latter gives an optimistic view regarding accuracy with respect to the former. The 75 percentile was also adopted as a positioning accuracy metric for the IPIN Track 3 Competitions [6,8]. The examples provided in this section should be understood as such, and not as suggestions of the most robust or accurate IPS methods.
The kNN, Gk and Stg methods provide the best results according to Figure 11 for all months. The Gk method, compared with all other methods, is more stable along the months and it is more robust against the changes of the network configuration that occurred after the collection of . All other methods are affected in a similar way by the changes of the network configuration; their 2D positioning accuracy decreases in Month 11 but recover afterwards using the updated database. The accuracy results of most of the tested methods matches the accuracy that is usually reported (2–5 m) for WiFi-based fingerprinting approaches [7].
Regarding the floor detection success rate, Figure 12 shows that the kNN, Gk and Stg methods are the best ones, achieving very good rates. Furthermore, the changes occurred after the collection of have little effects on the rate of these three methods. The Stg method is the least affected.
5. Discussion and Conclusions
This paper presented a new WiFi RSS database devoted to help study temporal signal variations and the development of fingerprinting positioning methods that are robust to those changes. The database provides several consecutive RSS measurements per position and measurements that correspond to the same positions over a period of 15 months; it allows analyzing the short-term as well as long-term RSS variations and their effect on the IPS. The measurements of each month are organized into training and test datasets to facilitate their use for IPS evaluation. Additionally, we analyzed briefly these RSS variations using the software and the supporting material that come along with the database. These usage examples showed significant signal intensities differences among samples taken very close in time, as well a drastic signal changes between two collection months. The time stamp associated with each measurement permits further studies that, for example, relating the RSS to the collection time of the day may allow conclusion about the amount of people in the area or the network usage.
Generating a thorough and accurate WiFi fingerprint database requires a big effort. For Months 2–15, the trained subject devoted at least 5 h to the collection task. It is an effort that could be recommend for small areas and when labels quality is a primary concern. However, it is prohibitive for larger areas. This illustrates one of the principle challenges of fingerprinting positioning. The main alternative approaches, automatized and crowdsourced/collaborative fingerprint collection are not appropriate to assure the required data quality. In a crowded environment, both approaches would likely fail to repeat the fingerprint collection at the same position. In cases where the labels quality is not a concern, automatized and crowdsourced/collaborative fingerprint collection is certainly recommended.
The collection process for the library environment is still ongoing. We plan to keep adding new measurements as new versions of the database, and not as new folders for the current database because the AP of new measurements may not match those from the current database.
Acknowledgments
G M. Mendoza-Silva gratefully acknowledges funding from grant PREDOC/2016/55 by Universitat Jaume I. E. S. Lohan and P. Richter would like to thank Academy of Finland for funding parts of this work under project 303576, insure-project.org.
Author Contributions
E.S.L. and J.T.-S. designed the collection campaigns and conceived the data formats. G.M.M.-S. performed the data collection. G.M.M.-S. and P.R. wrote the scripts. P.R. and J.H. analyzed experiments results. All authors participated in writing the manuscript.
Conflicts of Interest
The authors declare no conflict of interest. The founding sponsor had no role in the design of the study; in the collection, analyses, or interpretation of data; in the writing of the manuscript, and in the decision to publish the results.
References
- Bakillah, M.; Liang, S.H.; Zipf, A. Location-Based Services. In International Encyclopedia of Geography: People, the Earth, Environment and Technology; Wiley Online Library: Indianapolis, IN, USA, 2016. [Google Scholar]
- Alarifi, A.; Al-Salman, A.; Alsaleh, M.; Alnafessah, A.; Al-Hadhrami, S.; Al-Ammar, M.A.; Al-Khalifa, H.S. Ultra Wideband Indoor Positioning Technologies: Analysis and Recent Advances. Sensors 2016, 16, 707. [Google Scholar] [CrossRef] [PubMed]
- Jimenez, A.; Seco, F. Comparing Ubisense, Bespoon and Decawave UWB location systems: Indoor performance analysis. IEEE Trans. Instrum. Meas. 2017, 66, 2106–2117. [Google Scholar] [CrossRef]
- Seco, F.; Jimenez, A.R.; Zampella, F. Fine-Grained Acoustic Positioning with Compensation of CDMA Interference. In Proceedings of the 2015 IEEE International Conference on Industrial Technology (ICIT), Seville, Spain, 17–19 March 2015; pp. 3418–3423. [Google Scholar]
- Hou, Y.; Xiao, S.; Bi, M.; Xue, Y.; Pan, W.; Hu, W. Single LED Beacon-Based 3-D Indoor Positioning Using Off-the-Shelf Devices. IEEE Photonics J. 2016, 8, 1–11. [Google Scholar] [CrossRef]
- Eighth International Conference on Indoor Positioning and Indoor Navigation. Available online: http://www.ipin2017.org/ (accessed on 11 January 2018).
- He, S.; Chan, S.H.G. Wi-Fi Fingerprint-Based Indoor Positioning: Recent Advances and Comparisons. IEEE Commun. Surv. Tutor. 2016, 18, 466–490. [Google Scholar] [CrossRef]
- Torres-Sospedra, J.; Jiménez, A.R.; Knauth, S.; Moreira, A.; Beer, Y.; Fetzer, T.; Ta, V.C.; Montoliu, R.; Seco, F.; Mendoza-Silva, G.M.; et al. The Smartphone-Based Offline Indoor Location Competition at IPIN 2016: Analysis and Future Work. Sensors 2017, 17, 557. [Google Scholar] [CrossRef] [PubMed]
- Torres-Sospedra, J.; Montoliu, R.; Martínez-Usó, A.; Avariento, J.P.; Arnau, T.J.; Benedito-Bordonau, M.; Huerta, J. UJIIndoorLoc: A new multi-building and multi-floor database for WLAN fingerprint-based indoor localization problems. In Proceedings of the 2014 International Conference on Indoor Positioning and Indoor Navigation (IPIN), Busan, Korea, 27–30 October 2014; pp. 261–270. [Google Scholar]
- Lohan, E.S.; Torres-Sospedra, J.; Leppäkoski, H.; Richter, P.; Peng, Z.; Huerta, J. Wi-Fi Crowdsourced Fingerprinting Dataset for Indoor Positioning. Data 2017, 2, 32. [Google Scholar] [CrossRef]
- Barry, A.; Fisher, B.; Chang, M.L. A Long-Duration Study of User-Trained 802.11 Localization. In Mobile Entity Localization and Tracking in GPS-Less Environnments: Second International Workshop, MELT 2009, Orlando, FL, USA, 30 September 2009; Fuller, R., Koutsoukos, X.D., Eds.; Springer: Berlin/Heidelberg, Germany, 2009; pp. 197–212. [Google Scholar]
- Hossain, A.K.M.M.; Soh, W.S. A survey of calibration-free indoor positioning systems. Comput. Commun. 2015, 66, 1–13. [Google Scholar] [CrossRef]
- Wang, B.; Chen, Q.; Yang, L.T.; Chao, H.C. Indoor smartphone localization via fingerprint crowdsourcing: challenges and approaches. IEEE Wirel. Commun. 2016, 23, 82–89. [Google Scholar] [CrossRef]
- Gu, Y.; Chen, M.; Ren, F.; Li, J. HED: Handling environmental dynamics in indoor WiFi fingerprint localization. In Proceedings of the 2016 IEEE Wireless Communications and Networking Conference, Doha, Qatar, 3–6 April 2016; pp. 1–6. [Google Scholar]
- Hayashi, T.; Taniuchi, D.; Korpela, J.; Maekawa, T. Spatio-temporal adaptive indoor positioning using an ensemble approach. Pervasive Mob. Comput. 2016, 41, 319–332. [Google Scholar] [CrossRef]
- Barsocchi, P.; Crivello, A.; La Rosa, D.; Palumbo, F. A multisource and multivariate dataset for indoor localization methods based on WLAN and geo-magnetic field fingerprinting. In Proceedings of the 2016 International Conference on Indoor Positioning and Indoor Navigation (IPIN), Alcala de Henares, Spain, 4–7 October 2016; pp. 1–8. [Google Scholar]
- Popleteev, A. AmbiLoc: A year-long dataset of FM, TV and GSM fingerprints for ambient indoor localization. In Proceedings of the 2017 International Conference on Indoor Positioning and Indoor Navigation (IPIN), Sapporo, Japan, 18–21 September 2017. [Google Scholar]
- Kasebzadeh, P.; Hendeby, G.; Fritsche, C.; Gunnarsson, F.; Gustafsson, F. IMU Dataset For Motion and Device Mode Classification. In Proceedings of the 2017 International Conference on Indoor Positioning and Indoor Navigation (IPIN), Sapporo, Japan, 18–21 September 2017. [Google Scholar]
- Hanley, D.; Faustino, A.; Zelman, S.; Degenhardt, D.; Bretl, T. MagPIE: A Dataset for Indoor Positioning with Magnetic Anomalies. In Proceedings of the 2017 International Conference on Indoor Positioning and Indoor Navigation (IPIN), Sapporo, Japan, 18–21 September 2017. [Google Scholar]
- Montoliu, R.; Sansano, E.; Torres-Sospedra, J.; Belmonte, O. IndoorLoc Platform: A Public Repository for Comparing and Evaluating Indoor Positioning Systems. In Proceedings of the 2017 International Conference on Indoor Positioning and Indoor Navigation (IPIN), Sapporo, Japan, 18–21 September 2017. [Google Scholar]
- King, T.; Kopf, S.; Haenselmann, T.; Lubberger, C.; Effelsberg, W. COMPASS: A Probabilistic Indoor Positioning System Based on 802.11 and Digital Compasses. In Proceedings of the 1st International Workshop on Wireless Network Testbeds, Experimental Evaluation Characterization, Los Angeles, CA, USA, 29 September 2006; ACM: New York, NY, USA, 2006; pp. 34–40. [Google Scholar]
- King, T.; Kopf, S.; Haenselmann, T.; Lubberger, C.; Effelsberg, W. CRAWDAD Dataset Mannheim/Compass (v. 2008-04-11). Available online: https://crawdad.org/mannheim/compass/20080411/fingerprint (accessed on 11 January 2018).
- Lohan, E.; Talvitie, J. TUT Datasets. Available online: http://www.cs.tut.fi/tlt/pos/MEASUREMENTS_WLAN_FOR_WEB.zip (accessed on 11 January 2018).
- Torres-Sospedra, J.; Montoliu, R.; Martínez-Usó, A.; Avariento, J.P.; Arnau, T.J.; Benedito-Bordonau, M.; Huerta, J. UJIIndoorLoc Database. Available online: https://archive.ics.uci.edu/ml/datasets/ujiindoorloc (accessed on 11 January 2018).
- Bacciu, D.; Barsocchi, P.; Chessa, S.; Gallicchio, C.; Micheli, A. An experimental characterization of reservoir computing in ambient assisted living applications. Neural Comput. Appl. 2014, 24, 1451–1464. [Google Scholar] [CrossRef]
- Bacciu, D.; Barsocchi, P.; Chessa, S.; Gallicchio, C.; Micheli, A. Indoor User Movement Prediction from RSS Data Data Set. Available online: https://archive.ics.uci.edu/ml/datasets/Indoor+User+Movement+Prediction+from+RSS+data (accessed on 11 January 2018).
- Torres-Sospedra, J.; Montoliu, R.; Mendoza-Silva, G.M.; Belmonte, O.; Rambla, D.; Huerta, J. Providing Databases for Different Indoor Positioning Technologies: Pros and Cons of Magnetic Field and Wi-Fi Based Positioning. Mob. Inf. Syst. 2016, 2016, 6092618. [Google Scholar] [CrossRef]
- Torres-Sospedra, J.; Montoliu, R.; Mendoza-Silva, G.M.; Belmonte, O.; Rambla, D.; Huerta, J. Geotec Database. Available online: http://indoorloc.uji.es/databases/geotecDatabaseWGS.zip (accessed on 11 January 2018).
- Torres-Sospedra, J.; Jiménez, A.R.; Knauth, S.; Moreira, A.; Beer, Y.; Fetzer, T.; Ta, V.C.; Montoliu, R.; Seco, F.; Mendoza-Silva, G.M.; et al. IPIN 2016 Competition Database. Available online: http://indoorloc.uji.es/ipin2016track3/ (accessed on 11 January 2018).
- Parasuraman, R.; Caccamo, S.; Baberg, F.; Ogren, P. CRAWDAD Dataset kth/rss (v. 2016-01-05). Available online: https://crawdad.org/kth/rss/20160105 (accessed on 11 January 2018).
- Tóth, Z.; Tamás, J. Miskolc IIS hybrid IPS: Dataset for hybrid indoor positioning. In Proceedings of the 2016 26th International Conference Radioelektronika (RADIOELEKTRONIKA), Kosice, Slovakia, 19–20 April 2016; pp. 408–412. [Google Scholar]
- Tóth, Z.; Tamás, J. Miskolc IIS Hybrid IPS: Dataset for Hybrid Indoor Positioning. Available online: https://archive.ics.uci.edu/ml/datasets/Hybrid+Indoor+Positioning+Dataset+from+WiFi+RSSI%2C+Bluetooth+and+magnetometer (accessed on 11 January 2018).
- Montoliu, R.; Sansano, E.; Torres-Sospedra, J.; Belmonte, O. IndoorLoc Platform Databases. Available online: http://indoorlocplatform.uji.es/ (accessed on 11 January 2018).
- Barsocchi, P.; Crivello, A.; La Rosa, D.; Palumbo, F. Geo-Magnetic Field and WLAN Dataset for Indoor Localisation from Wristband and Smartphone Data Set. Available online: https://archive.ics.uci.edu/ml/datasets/Geo-Magnetic+field+and+WLAN+dataset+for+indoor+localisation+from+wristband+and+smartphone (accessed on 11 January 2018).
- IPIN 2017 Competition Database. Available online: http://indoorloc.uji.es/ipin2017track3// (accessed on 11 January 2018).
- Bahl, P.; Padmanabhan, V.N. RADAR: An in-building RF-based user location and tracking system. In Proceedings of the Nineteenth Annual Joint Conference of the IEEE Computer and Communications Societies, Tel Aviv, Israel, 26–30 March 2000; Volume 2, pp. 775–784. [Google Scholar]
- Qianqian, L.; Yubin, X.; Mu, Z.; Zhi-an, D.; Yao, L. Characteristics of Fingerprint Location Technology in WLAN Environment. In Proceedings of the 2009 International Forum on Information Technology and Applications, Chengdu, China, 15–17 May 2009; Volume 2, pp. 40–43. [Google Scholar]
- Fang, S.H.; Wang, C.H.; Tsao, Y. Compensating for orientation mismatch in robust Wi-Fi localization using histogram equalization. IEEE Trans. Veh. Technol. 2015, 64, 5210–5220. [Google Scholar] [CrossRef]
- Mendoza-Silva, G.M.; Richter, P.; Torres-Sospedra, J.; Lohan, E.S.; Huerta, J. Long-Term Wi-Fi Fingerprinting Dataset and Supporting Material. Available online: https://zenodo.org/record/1066040 (accessed on 11 January 2018).
- Kaemarungsi, K.; Krishnamurthy, P. Analysis of WLAN’s received signal strength indication for indoor location fingerprinting. Pervasive Mob. Comput. 2012, 8, 292–316. [Google Scholar] [CrossRef]
- Berkvens, R.; Peremans, H.; Weyn, M. Conditional Entropy and Location Error in Indoor Localization Using Probabilistic Wi-Fi Fingerprinting. Sensors 2016, 16, 1636. [Google Scholar] [CrossRef] [PubMed]
- Drucker, H.; Burges, C.J.; Kaufman, L.; Smola, A.J.; Vapnik, V. Support vector regression machines. In Advances in Neural Information Processing Systems; MIT Press: Cambridge, MA, USA, 1997; pp. 155–161. [Google Scholar]
- MathWorks. Support Vector Machine Regression. In MATLAB® R2017b and Statistics and Machine Learning ToolboxTM; MathWorks: Natick, MA, USA, 2017. [Google Scholar]
- Youssef, M.; Agrawala, A. The Horus WLAN Location Determination System. In Proceedings of the 3rd International Conference on Mobile Systems, Applications, and Services, Seattle, WA, USA, 6–8 June 2005; ACM: New York, NY, USA, 2005; pp. 205–218. [Google Scholar]
- Marques, N.; Meneses, F.; Moreira, A. Combining similarity functions and majority rules for multi-building, multi-floor, WiFi positioning. In Proceedings of the 2012 International Conference on Indoor Positioning and Indoor Navigation (IPIN), Sydney, Australia, 13–15 November 2012; pp. 1–9. [Google Scholar]
- Hernández, N.; Ocaña, M.; Alonso, J.M.; Kim, E. Continuous Space Estimation: Increasing WiFi-Based Indoor Localization Resolution without Increasing the Site-Survey Effort. Sensors 2017, 17, 147. [Google Scholar] [CrossRef] [PubMed]
- Roos, T.; Myllymäki, P.; Tirri, H.; Misikangas, P.; Sievänen, J. A Probabilistic Approach to WLAN User Location Estimation. Int. J. Wirel. Inf. Netw. 2002, 9, 155–164. [Google Scholar] [CrossRef]
- Honkavirta, V. Location Fingerprinting Methods in Wireless Local Area Networks. Master’s Thesis, Tampere University of Technology, Tampere, Finland, 2008. [Google Scholar]
Figure 1.
Library Environment: (a) a picture of the 3rd floor collection area that shows the bookshelves and the stairs that connect the two floors; and (b)the network devices close to the collection area. The red asterisks represent the 3rd floor’s devices, and blue asterisks represent 5th floor’s devices.

Figure 2.
Software usage for dataset collection: (a) campaign Selection; (b) collection at a point; (c) edition Operations; and (d) uploading.
Figure 2.
Software usage for dataset collection: (a) campaign Selection; (b) collection at a point; (c) edition Operations; and (d) uploading.
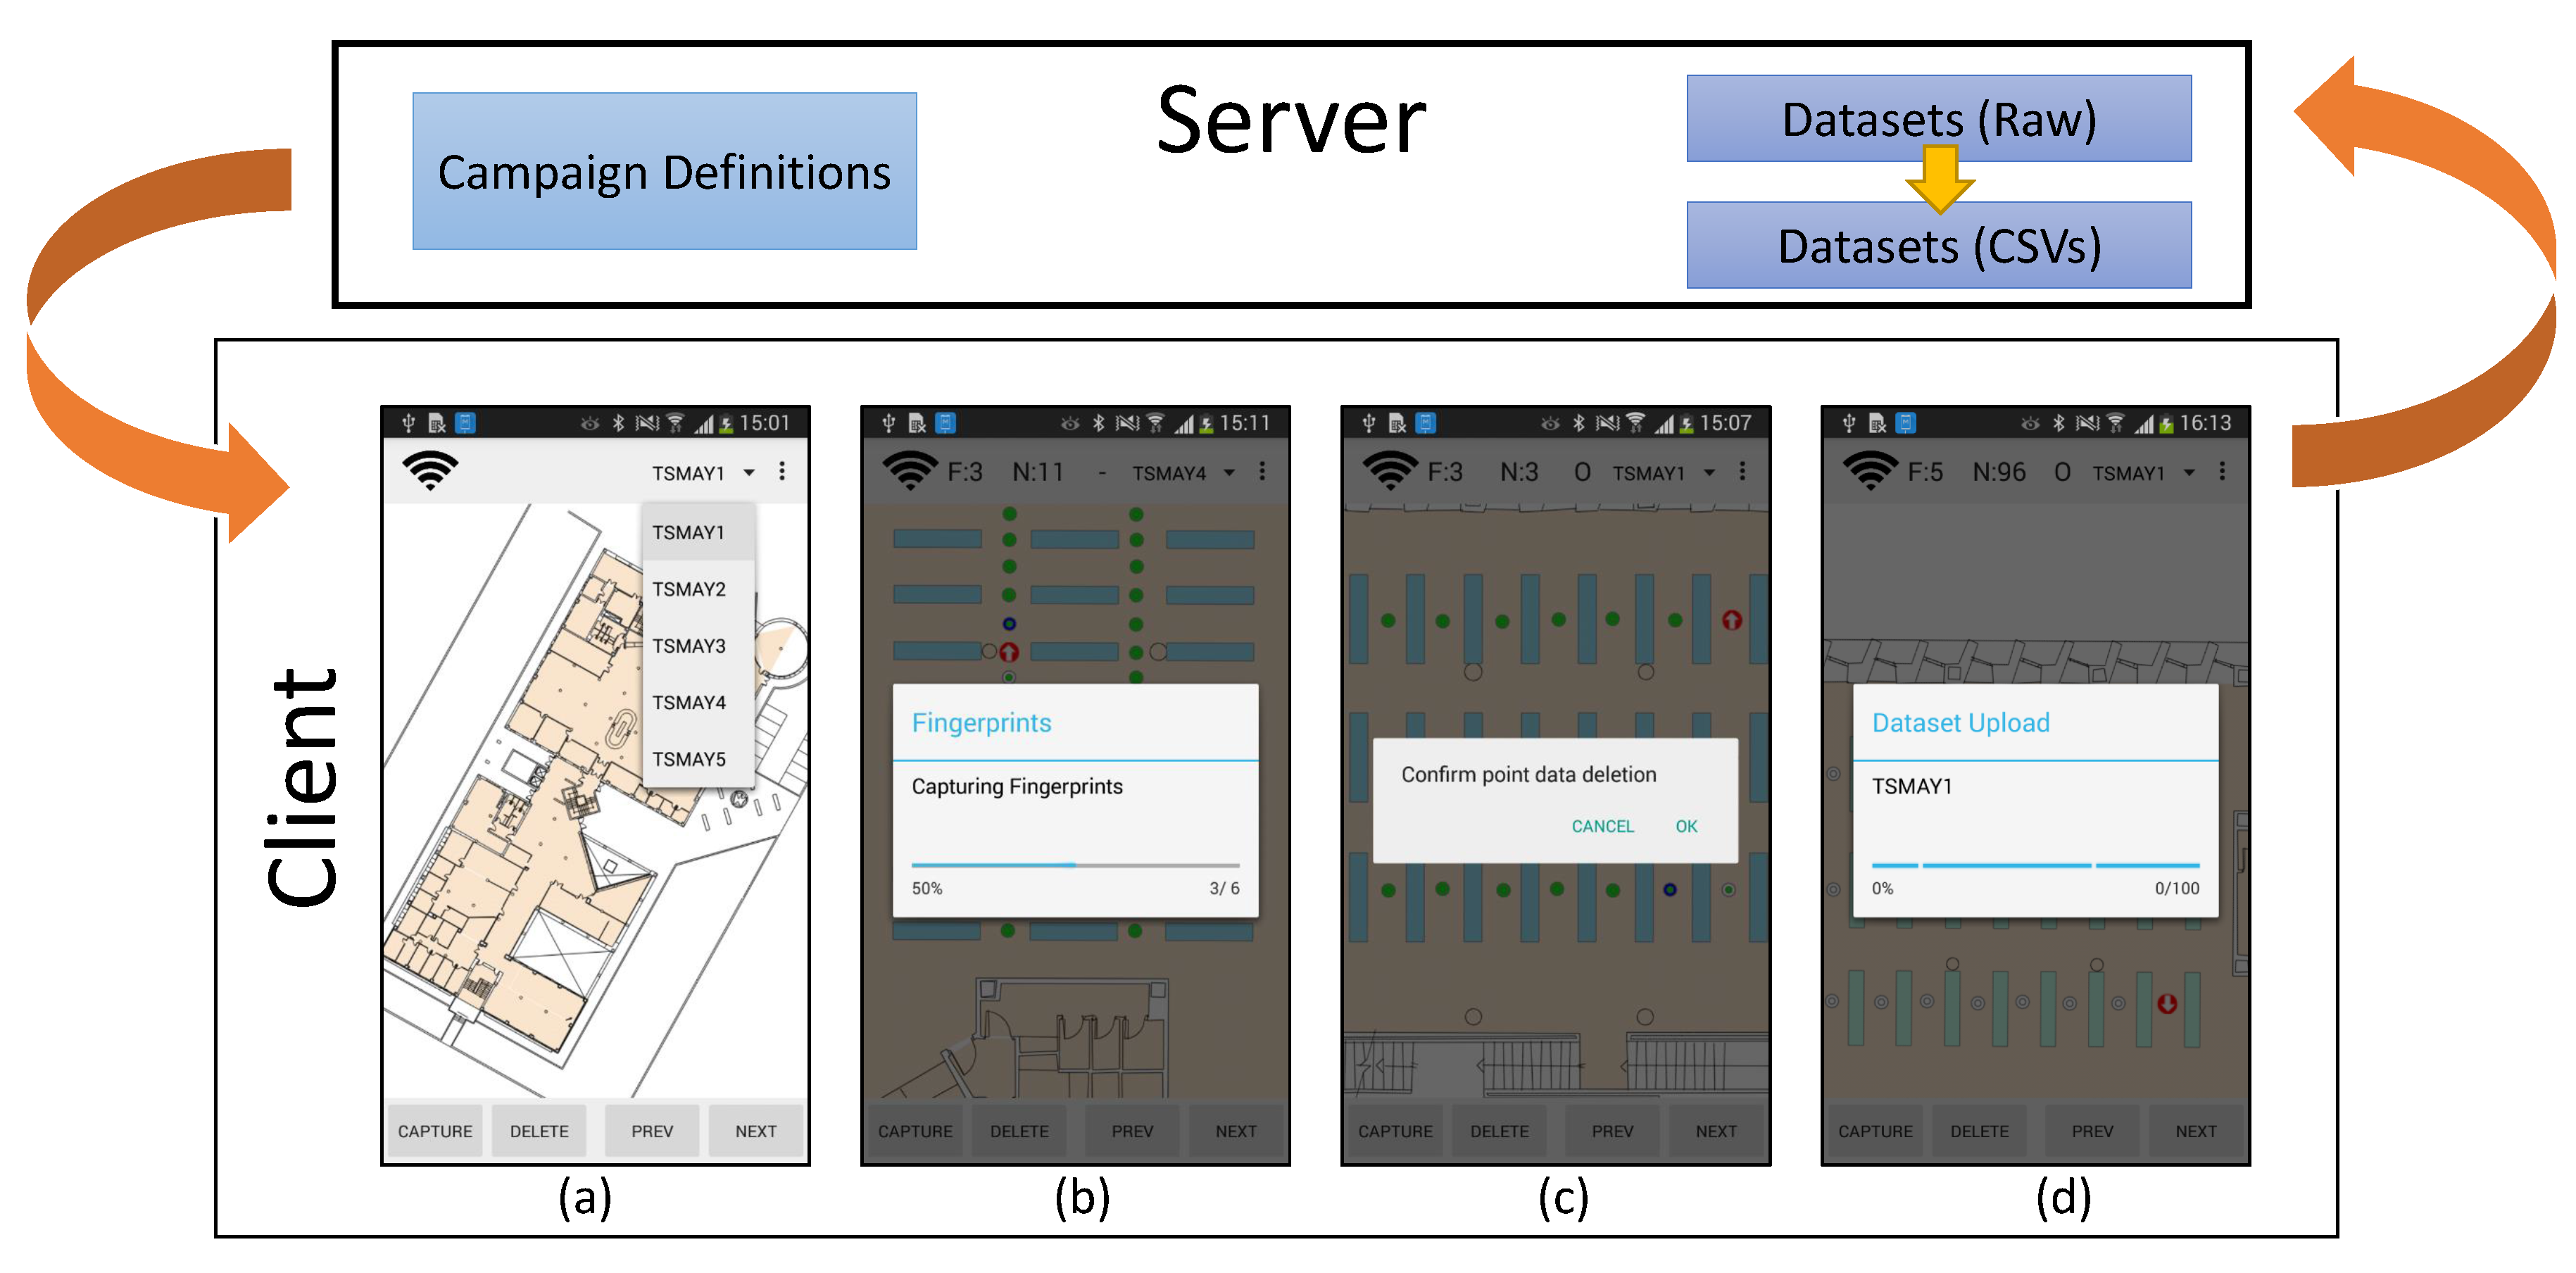
Figure 3.
Temporal organization of the database. Each collection month has training set(s) and test sets, each dataset is represented by a point. The colors alternates to differentiate contiguous months.
Figure 3.
Temporal organization of the database. Each collection month has training set(s) and test sets, each dataset is represented by a point. The colors alternates to differentiate contiguous months.

Figure 4.
Positions in the direct (a) and reverse (b) collection directions in the 3rd floor. Rectangles represent the bookshelves. Blue diamonds represent collection positions for training, Test-01 and Test-05 datasets, while green, pink and red diamonds represents collection positions for Test-02, Test-03 and Test-04 datasets, respectively. The numbers indicate the collection order within each set.

Figure 5.
Identifier specification example. The identifier is associated to the 3rd fingerprint for the 102nd point collected for dataset .
Figure 5.
Identifier specification example. The identifier is associated to the 3rd fingerprint for the 102nd point collected for dataset .

Figure 6.
Mean and standard deviation values visualization for the 3rd (a) and 5th (b) floors. The vertical center of each bar represents the mean value, and the bar’s size is adjusted to the standard deviation value.
Figure 6.
Mean and standard deviation values visualization for the 3rd (a) and 5th (b) floors. The vertical center of each bar represents the mean value, and the bar’s size is adjusted to the standard deviation value.
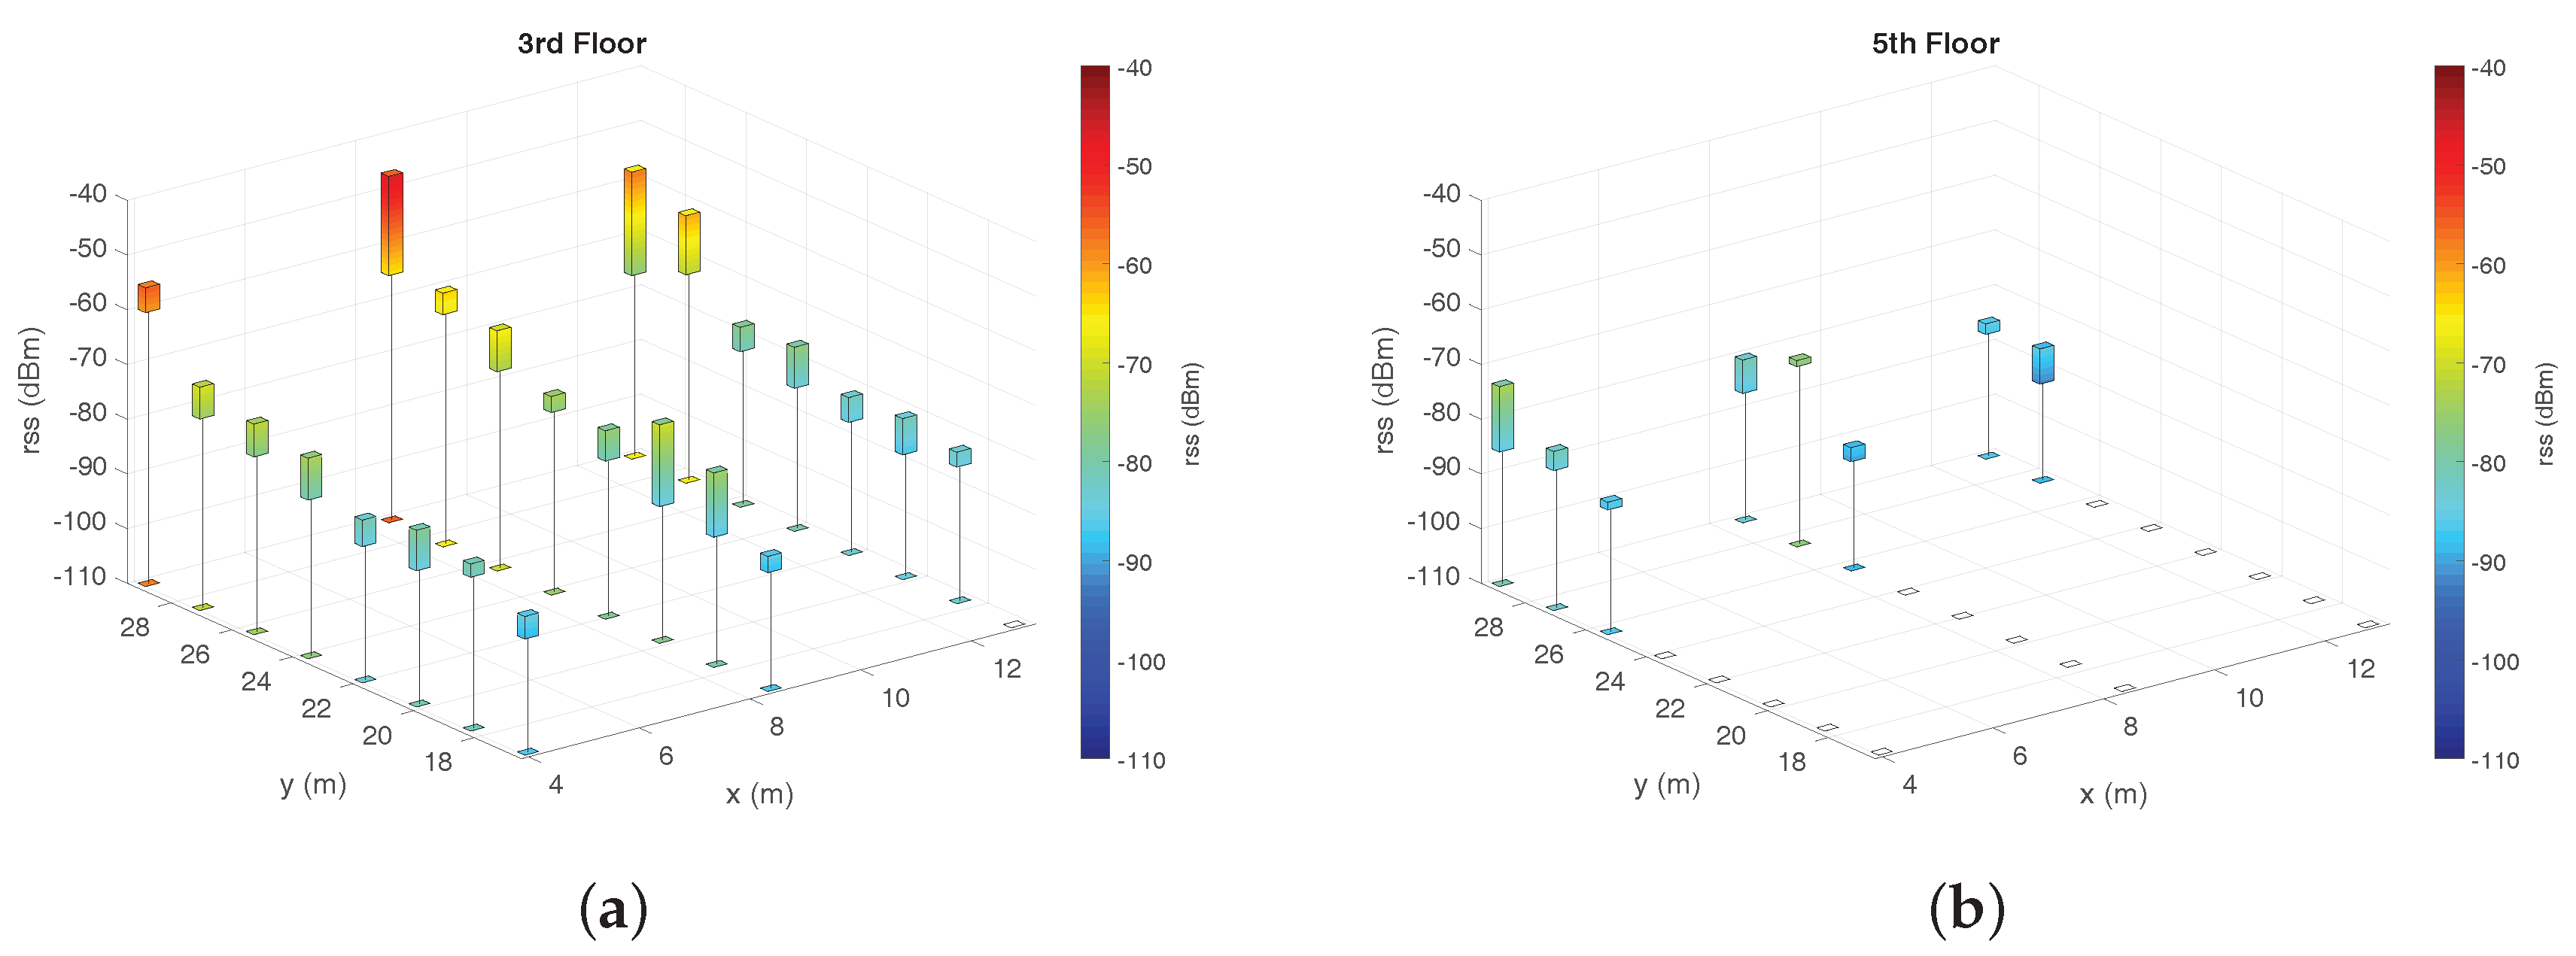
Figure 7.
AP 7 RSS values for the first and last sample at collection. Fingerprints belong to {D(15,2,01), D(15,2,02), D(15,2,03), D(15,2,04)}, taking only samples from the 3rd floor and the “direct” direction. The black filling color indicates that the AP was not detected.
Figure 7.
AP 7 RSS values for the first and last sample at collection. Fingerprints belong to {D(15,2,01), D(15,2,02), D(15,2,03), D(15,2,04)}, taking only samples from the 3rd floor and the “direct” direction. The black filling color indicates that the AP was not detected.

Figure 8.
SVR regression from the same signal measurements used in Figure 7. The mean of the six samples corresponding to each position was used to train the regression.
Figure 8.
SVR regression from the same signal measurements used in Figure 7. The mean of the six samples corresponding to each position was used to train the regression.

Figure 9.
AP ephemerality, using measurements from Training-01 datasets from each month. White narrow rectangles depicts the presence of an AP in a month. The APs with no presence in this figure are those only detected in test datasets.
Figure 9.
AP ephemerality, using measurements from Training-01 datasets from each month. White narrow rectangles depicts the presence of an AP in a month. The APs with no presence in this figure are those only detected in test datasets.

Figure 10.
Training data update strategies effect on the positioning error (Euclidean) distance for a kNN-based IPS. Training data varies depending on the update strategy and whether averaging is applied to samples belonging to the same position and collection direction. The test data of each month are all test datasets from that month.

Figure 11.
2D positioning error metric for the evaluated methods.
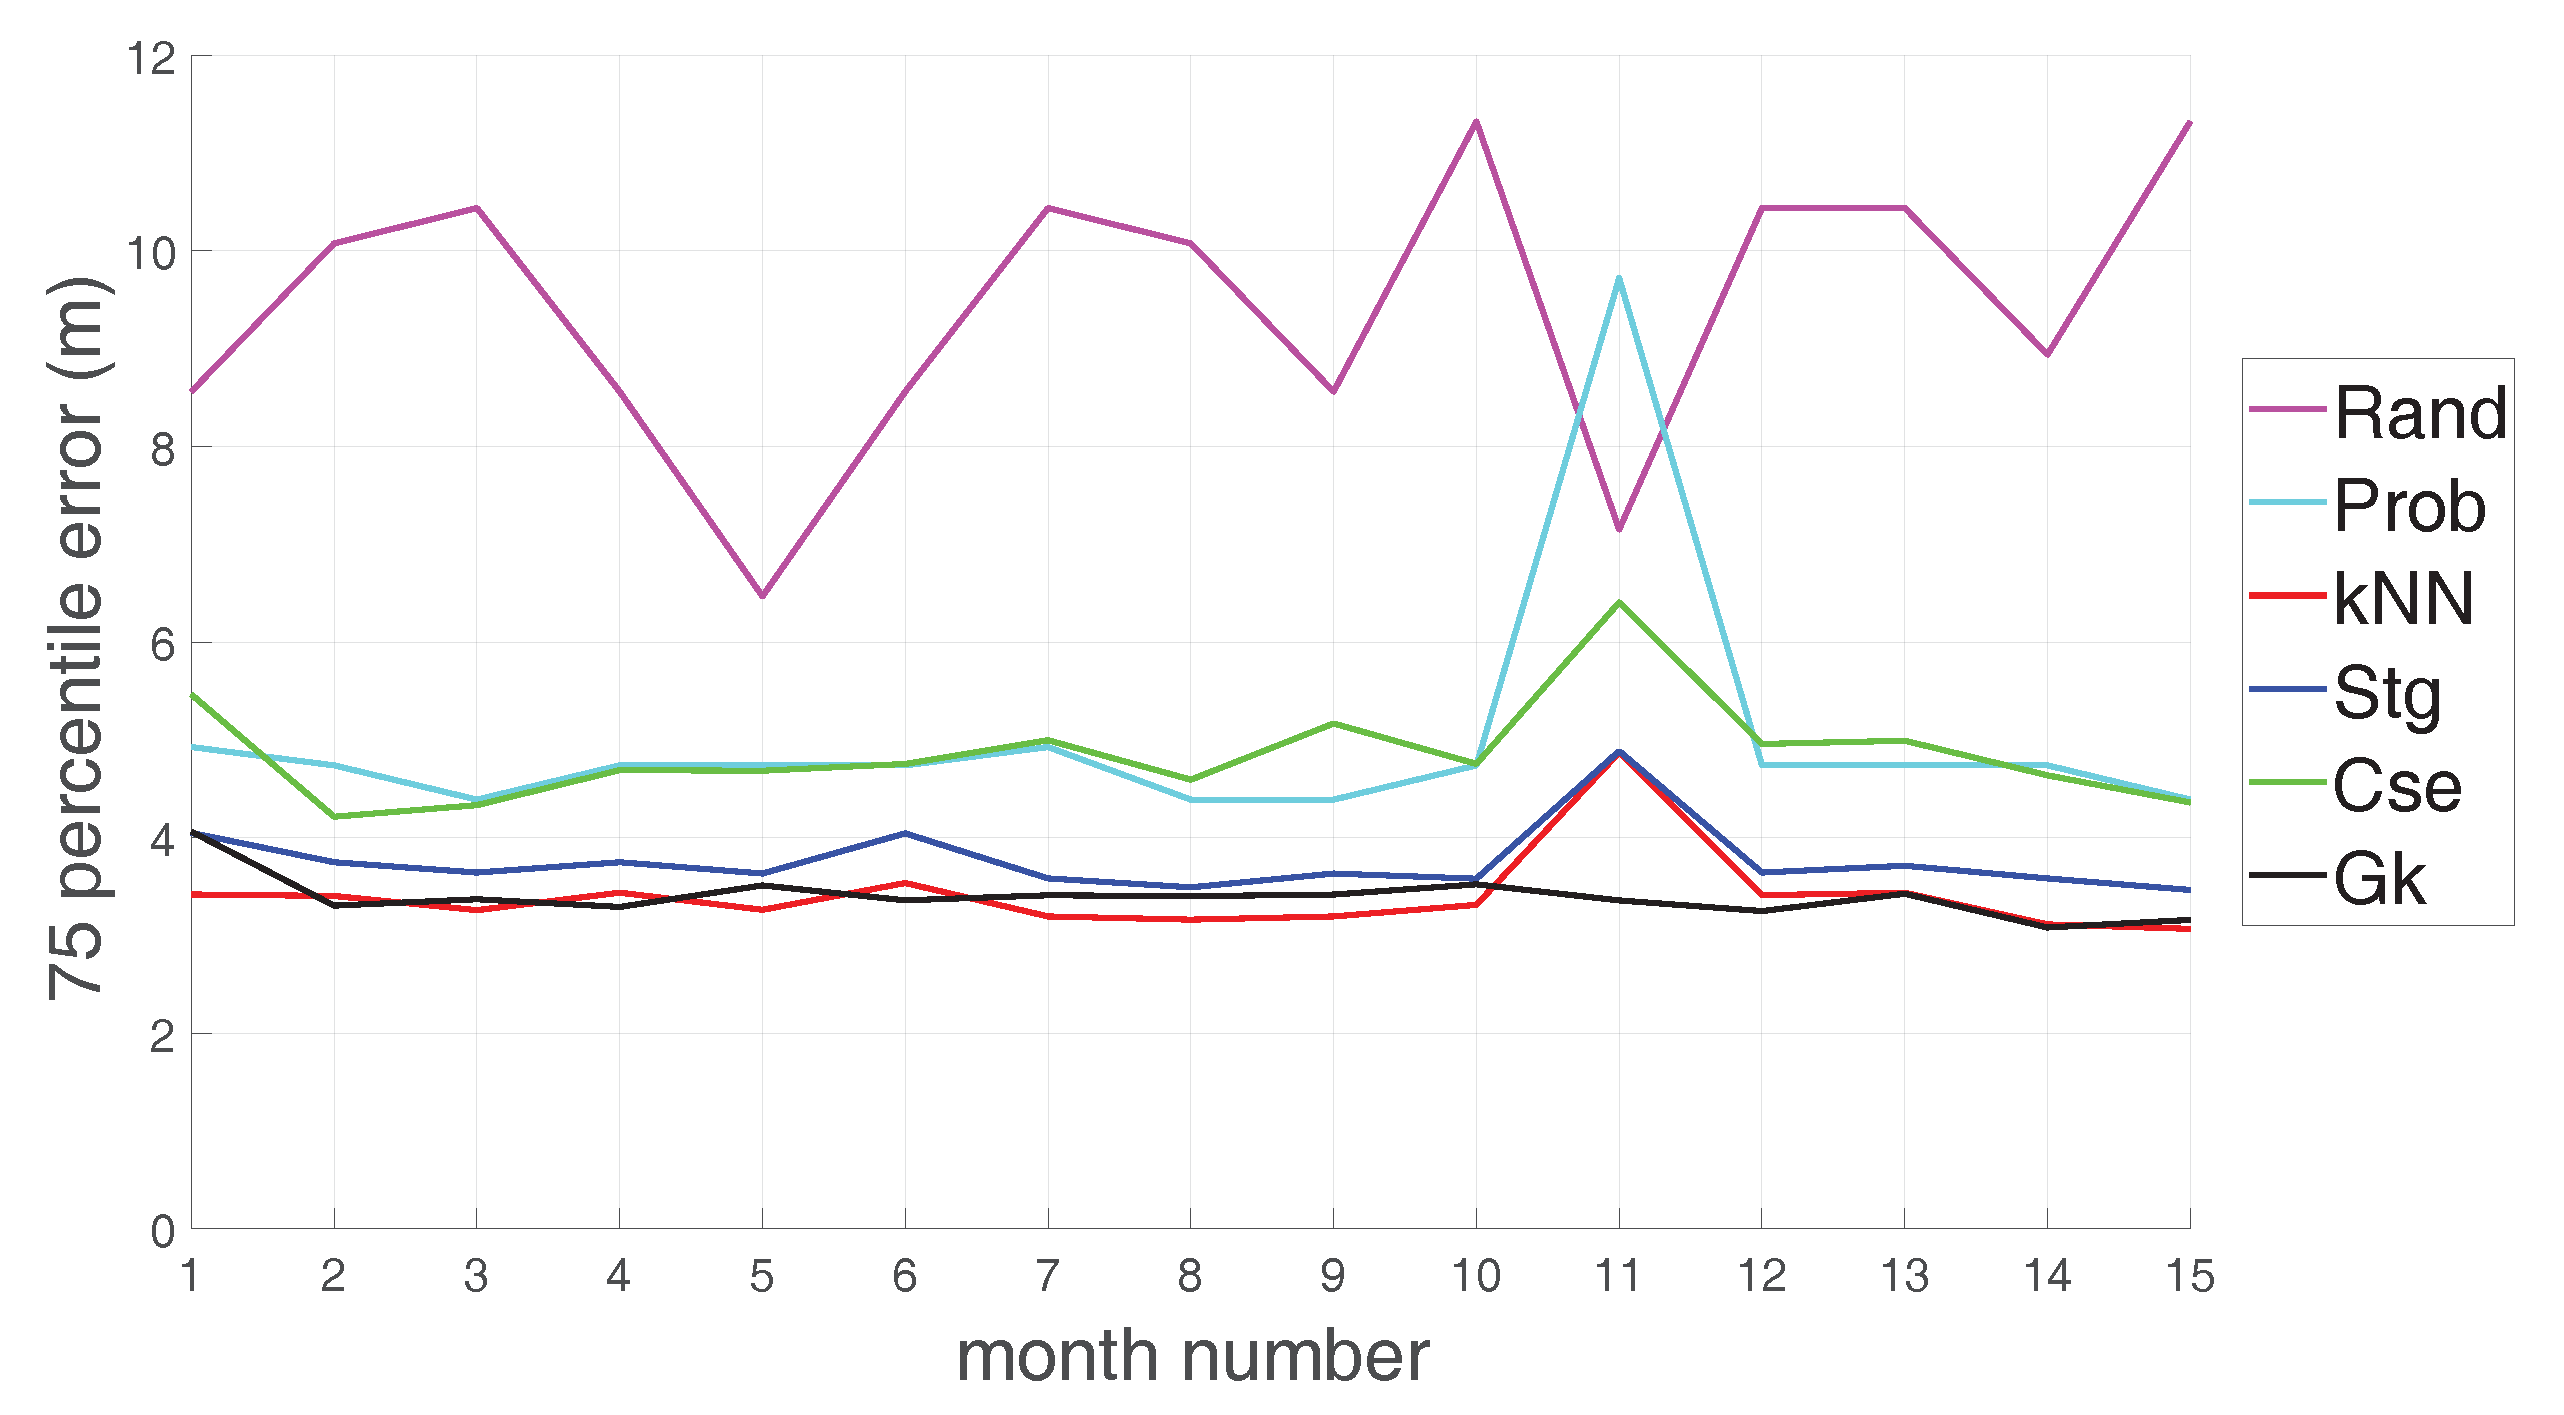
Figure 12.
Floor detection success ratio of each positioning method.

Table 1.
Public WiFi RSS databases.
| Title | Year | Details | Long-Time Potential | Short-Time Potential |
|---|---|---|---|---|
| Fingerprint traceset from mannheim/compass dataset | 2008 | [21,22] | Collected during one day. | 110 samples per Reference Point (RP). |
| Indoor WLAN measurement database | 2014 | [23] | Samples taken in 2011, and again in 2013 for one of the floors. No time-stamp. | One fingerprint per RP. |
| UJIIndoorLoc Database | 2014 | [9,24] | For training data, 73.67% of measurements were collected one day, the rest were collected in 5 days spanning 14 days. For validation data, 63.18% were collected one day, the rest were collected in 8 days spanning 20 days. | Up to 10 consecutive samples per RP for training data, 1 per RP for testing data. |
| Indoor User Movement Prediction from RSSI data Data Set | 2016 | [25,26] | No collection-time information is provided. | Path-based sensor measurements 8 times per second. |
| Geotec Database | 2016 | [27,28] | Collected during 2 days (4 days apart). | 5 samples per RP. |
| IPIN 2016 Competition Database | 2016 | [8,29] | Collection times vary among buildings. For the same building, max. collection days is 3 (14 days apart). | Path-based. Samples every 4–6 s. Paths taken once per direction. |
| kth/rss dataset | 2016 | [30] | Collected during one day. | The amount of samples per RP is not uniform. |
| WiFi RSSI, Bluetooth and magnetometer DataSet | 2016 | [31,32] | Collected during one day. | One sample per RP. |
| Alcalá Tutorial Database | 2017 | [20,33] | No timestamp provided. Collected during one day. | 10 samples per RP. |
| Crowdsourced WiFi fingerprinting database | 2017 | [10] | Crowdsourced during 8 months. | Usually one sample per RP. |
| Geo-Magnetic field and WLAN dataset Data Set | 2017 | [16,34] | Collected during two days (5 days apart). | One sample per RP. |
| IPIN 2016 Tutorial Database | 2017 | [20] | Collected during one day. | 3 samples per RP. |
| IPIN 2017 Competition Database | 2017 | [35] | Similar to IPIN 2016 Competition. For the same building, max. collection days is 3 (6 days apart). | Similar to IPIN 2016 Competition. Samples every 4 s. |
Table 2.
Point-wise mean RSS difference between pairs of samples, using the same measurements as in Figure 7.
Table 2.
Point-wise mean RSS difference between pairs of samples, using the same measurements as in Figure 7.
| Sample Pair | 1–2 | 2–3 | 3–4 | 4–5 | 5–6 |
| Mean Difference (dBm) | 3.19 | 2.06 | 1.82 | 1.74 | 1.95 |
Table 3.
Statistics of presence of APs, using measurements from Training-01 datasets from each month.
Table 3.
Statistics of presence of APs, using measurements from Training-01 datasets from each month.
| Month | Total | New | Gone | Returned | Re-gone | Seen |
|---|---|---|---|---|---|---|
| 01 | 77 | 77 | 0 | 0 | 0 | 77 |
| 02 | 126 | 50 | 1 | 0 | 0 | 127 |
| 03 | 127 | 15 | 14 | 0 | 0 | 142 |
| 04 | 125 | 8 | 17 | 7 | 0 | 150 |
| 05 | 110 | 10 | 24 | 4 | 5 | 160 |
| 06 | 110 | 6 | 14 | 13 | 5 | 166 |
| 07 | 104 | 5 | 13 | 10 | 8 | 171 |
| 08 | 114 | 6 | 6 | 16 | 6 | 177 |
| 09 | 98 | 6 | 8 | 2 | 16 | 183 |
| 10 | 106 | 5 | 6 | 10 | 1 | 188 |
| 11 | 119 | 10 | 5 | 14 | 6 | 198 |
| 12 | 110 | 43 | 39 | 8 | 21 | 241 |
| 13 | 114 | 11 | 9 | 7 | 5 | 252 |
| 14 | 133 | 10 | 5 | 18 | 4 | 262 |
| 15 | 129 | 8 | 11 | 9 | 10 | 270 |
Table 4.
Statistics of presence of APs, using measurements from the 15 training datasets for Month 1.
Table 4.
Statistics of presence of APs, using measurements from the 15 training datasets for Month 1.
| Number | Total | New | Gone | Returned | Re-Gone | Seen | Since 1st Day |
|---|---|---|---|---|---|---|---|
| 01 | 77 | 77 | 0 | 0 | 0 | 77 | 0 |
| 02 | 97 | 22 | 2 | 0 | 0 | 99 | 1 |
| 03 | 118 | 23 | 4 | 2 | 0 | 122 | 5 |
| 04 | 106 | 9 | 23 | 2 | 0 | 131 | 6 |
| 05 | 127 | 19 | 12 | 15 | 1 | 150 | 14 |
| 06 | 119 | 4 | 14 | 8 | 6 | 154 | 14 |
| 07 | 126 | 5 | 4 | 9 | 3 | 159 | 15 |
| 08 | 120 | 3 | 6 | 6 | 9 | 162 | 15 |
| 09 | 112 | 4 | 6 | 8 | 14 | 166 | 18 |
| 10 | 125 | 6 | 4 | 15 | 4 | 172 | 18 |
| 11 | 119 | 4 | 7 | 6 | 9 | 176 | 18 |
| 12 | 115 | 1 | 8 | 16 | 13 | 177 | 18 |
| 13 | 127 | 4 | 1 | 15 | 6 | 181 | 19 |
| 14 | 124 | 0 | 4 | 15 | 14 | 181 | 20 |
| 15 | 119 | 1 | 2 | 9 | 13 | 182 | 20 |
© 2018 by the authors. Licensee MDPI, Basel, Switzerland. This article is an open access article distributed under the terms and conditions of the Creative Commons Attribution (CC BY) license (http://creativecommons.org/licenses/by/4.0/).
Share and Cite
MDPI and ACS Style
Mendoza-Silva, G.M.; Richter, P.; Torres-Sospedra, J.; Lohan, E.S.; Huerta, J. Long-Term WiFi Fingerprinting Dataset for Research on Robust Indoor Positioning. Data 2018, 3, 3. https://doi.org/10.3390/data3010003
AMA Style
Mendoza-Silva GM, Richter P, Torres-Sospedra J, Lohan ES, Huerta J. Long-Term WiFi Fingerprinting Dataset for Research on Robust Indoor Positioning. Data. 2018; 3(1):3. https://doi.org/10.3390/data3010003
Chicago/Turabian StyleMendoza-Silva, Germán Martín, Philipp Richter, Joaquín Torres-Sospedra, Elena Simona Lohan, and Joaquín Huerta. 2018. "Long-Term WiFi Fingerprinting Dataset for Research on Robust Indoor Positioning" Data 3, no. 1: 3. https://doi.org/10.3390/data3010003