Data Descriptor

MODIS-Based Monthly LST Products over Amazonia under Different Cloud Mask Schemes

by
José Gomis-Cebolla
,
Juan C. Jiménez-Muñoz
* and
José A. Sobrino
Global Change Unit, Image Processing Laboratory, University of Valencia, Paterna, Valencia 46010, Spain
*
Author to whom correspondence should be addressed.
Submission received: 1 June 2016 / Revised: 28 June 2016 / Accepted: 29 June 2016 / Published: 4 July 2016
(This article belongs to the Special Issue Temperature of the Earth)

Abstract

:
One of the major problems in the monitoring of tropical rainforests using satellite imagery is their persistent cloud coverage. The use of daily observations derived from high temporal resolution sensors, such as Moderate Resolution Imaging Spectroradiometer (MODIS), could potentially help to mitigate this issue, increasing the number of clear-sky observations. However, the cloud contamination effect should be removed from these results in order to provide a reliable description of these forests. In this study the available MODIS Land Surface Temperature (LST) products have been reprocessed over the Amazon Basin (10 N–20 S, 80 W–45 W) by introducing different cloud masking schemes. The monthly LST datasets can be used for the monitoring of thermal anomalies over the Amazon forests and the analysis of spatial patterns of warming events at higher spatial resolutions than other climatic datasets.
Data Set License: CC-BY-NC

1. Summary

Amazon rainforests, including more than the 50% of the world’s tropical rainforests, stand out from the rest of the global biomes because of the crucial role they play in the global carbon cycle [1]. Additionally, they serve as regulators of global and regional climate systems [2] and account for 25% of global biodiversity [3]. Due to its scientific and biological importance and considering the current global warming scenario, the monitoring of vegetation changes in this biome is of critical importance.
In this context, vegetation temperature, being linked with plant physiology, is a key variable to take into account. Particularly some studies have investigated the relationship between this variable and the CO2 absorption capacity, showing that an increase in temperature could result in a negative impact on tropical forest CO2 uptake and productivity [4,5]. Additionally, anomalous high values have been proved to be more important than precipitation deficits in causing losses of biomass during drought periods [6].
Due to its great extension, covering approximately five million km2 in 2003 [7], satellite imagery is the best option for monitoring these forests, as they do not suffer from the obstacles that frequently occur in field campaign studies [8]. Nonetheless, there are some issues to be taken into account, and one of the most important is the persistent cloud coverage [8,9]. Using daily observations at a moderate resolution derived from polar orbiting satellites, such as the Moderate Resolution Imaging Spectroradiometer (MODIS), could increase the number of clear-sky observations, thus mitigating this problem. However, these data should be free of any cloud contamination effect in order to provide reliable results. For the particular case of MODIS Land Surface Temperature (LST) data, some cloud leakage could exist in the LST retrieval process [10,11]. This problem becomes crucial when analyzing large temporal series of LST data, as the results could be corrupted by altered LST values.
The Thermal Amazoni@ system [12] is especially devoted to the monitoring of thermal anomalies over the Amazon region using remote sensing data. It aims at providing reference temperature datasets and other derived analyses that could help to provide valuable information about the Amazonian climate and other factors that could induce a widespread degradation such as fires and droughts. In the previous monthly temperature dataset versions, only small corrections were introduced in order to reduce the cloud contamination problem [9,12]. In this study, we present new MODIS-based LST monthly products in which this cloud contamination issue has been properly assessed by introducing different cloud masking (CM) algorithms as a means of discarding cloud-contaminated pixels in the current MODIS LST products. In particular, one of the cloud schemes selected is the Multiangle Implementation of Atmospheric Correction (MAIAC) CM which has shown promising results in comparison with the MODIS collection 5 mask results [13] and specifically for the tropical ecosystems [14]. Additionally, we have benefited from cloud masking algorithms that are able to provide reasonable results without an excessive demand of computational effort, such as Function of mask (FMASK) [15]. The temperature products are available at a 1 km and 5 km resolution. The new 1 km resolution version is aimed at providing spatial information with greater higher detail for the thermal monitoring of the Amazonian rainforests.

2. Data Description

2.1. Data Records: LST Products

The different data records described in this paper are summarized in Table 1. They correspond to daytime monthly averaged temperature values (in K) and the number of days with valid LST values (successfully derived from the retrieval algorithm and not obstructed by clouds/missing data in the cloud mask) in a particular month. LST products are provided using two different spatial resolutions: 0.05° (5 km) and 0.009° (1 km) in geographic lat/lon projection. The different versions presented correspond to the particular MODIS LST product employed (mod11c1v5, mod11a1v5 for Terra, myd11c1v5, myd11a1v5 for Aqua and the combination of Terra and Aqua products for the “mcd” version) and the cloud masking approach implemented (MOD35, MAIAC and FMASK). In order to facilitate their identification, the following nomenclature is used:
v a r 1 _ v a r 2 _ p r o d u c t _ c l o u d m a s k _ y e a r _ m o n t h
where:
  • var1: temperature product (“lstd” for daytime LST).
  • var2: magnitude of interest (“temp” for absolute temperature in K; “absan” for temperature anomalies (K or °C); “stdan” for standardized anomalies (K or °C); “ncsd” for number of clear-sky days).
  • product: MODIS reference product (mod11c1v5, mod11a1v5, myd11c1v5, myd11a1v5, etc.).
  • product: MODIS reference product (mod11c1v5, mod11a1v5, myd11c1v5, myd11a1v5, etc.).
  • cloudmask: cloud mask product used to filter out cloudy pixels (mod35, maiac, fmask).
  • year and month: date of the monthly LST product.
Additionally, mask products with the forest area delimitation at both 0.05° and 0.009° spatial resolutions are also provided. Data records are provided for the Amazon Basin (45 W–80 W, 10 N–20 S). They are delivered as a raw product in GeoTIFF format with “Geographic Lat/Lon” projection and WGS-84 datum. The sizes of the images (sample × columns) are 4068 × 3318 and 700 × 600 for the higher (1 km) and lower (5 km) resolution products, respectively. The monthly daytime LST, number of clear-sky days and forest mask have floating point, integer and byte data types, respectively. The non-data value assigned to the LST products is −999.

2.2. Data Repository

The different LST products, as well as ancillary data and information, are available in the Thermal Amazoni@ system [12]. Thermal Amazoni@ is composed of three modules (Table 2): (i) the website (includes a brief description of Thermal Amazoni@ initiative, and also links to the other modules); (ii) the viewer (allows the visualization of products over a Google Earth© interface); and (iii) the File Transfer Protocol (FTP) site (where the different Thermal Amazoni@ products are available for download).
Thermal Amazoni@ also includes reanalysis products at climatic grids (e.g., 0.75° or 0.125°) covering the Amazon Basin but also the adjacent intertropical ocean regions (products not described in this paper). Because of current limitations of the system or periodic technical maintenance, some of the products may be temporarily not available, but they can be accessed through previous requests to the authors.

3. Methods

The basis of the products described in the paper is the official MODIS daily LST product, in which a cloud mask product is introduced to select the clear-sky pixels within a month to compute the monthly value. The processing scheme followed to generate the final monthly LST product is slightly different depending on the spatial resolution, since products at 1 km are provided in tiles in a sinusoidal projection and require a mosaicking and reprojection to geographic lat/lon. The processing scheme is also dependent on the cloud mask selected to discriminate cloudy pixels. Figure 1 summarizes the processing scheme used to generate the different monthly LST products presented in Table 1. Next sub-sections include details on the different processing scheme steps and cloud mask products, as well as an illustration of sample LST maps extracted from the different datasets.

3.1. MODIS LST Products

The MOD11C1/MYD11C1 and MOD11A1/MYD11A1 LST products were used in this study. They provide per-pixel temperature and emissivity values and are distributed in a 0.05° geographic lat/lon and ~1 km sinusoidal projection, respectively. In particular, the dataset corresponding to the daytime land surface temperature was used. In the retrieval of the LST values, the MODIS cloud mask algorithm (MOD35) is employed. Only pixels having a level of confidence ranging from uncertain to confidently clear, according to some land conditions, are retrieved (see Section 3.2.1). Further information on the LST algorithm retrieval and LST products is available at [11,16].

3.2. Cloud Masks

3.2.1. MOD35

The MOD35 cloud masking approach is the one currently used in the MODIS LST product retrieval [11]. It uses a combination of a variety of spectral threshold tests in order to provide the level of confidence of a pixel being clear [17]. Briefly explaining the processing chain is as follows [17]: a pixel is assigned to a particular domain according to the surface type (water, land, snow, coastline, and desert) and solar illumination (daytime, nighttime). Next, a series of threshold tests are applied, returning each test with a confidence level (from 0 (low) to 1 (high)) that the pixel is clear. The election of the particular tests employed is determined by the former assignation of the pixel to a specific domain. The test results are arranged into five different groups according to their cloud distinction capability. A minimum confidence level of all the tests grouped together is considered representative of each group. Eventually the product of all these minimum values gives the definitive confidence of a pixel being clear. This level is assessed using four different categories: confident clear (>99%), probably clear (>95%), uncertain/probably cloudy (>66%) and cloudy (<66%). For further information on this cloud detection algorithm and its implementation in the LST processing chain please refer to [11,16,17].

3.2.2. FMASK

The FMASK approach was selected as an alternative cloud masking algorithm. It was implemented using MOD09CMG/MYD09CMG features with some minor modifications in order to accommodate the new structural characteristics. In the following paragraphs an overview of the processing steps required and the minor modifications is explained.
This approach uses a two-step chain in order to determine the presence of clouds. It is as follows [11]: first, potential cloud pixels (PCP) and clear-sky pixels are identified using rules based on clouds’ physical properties. Next, a probability mask for clouds over land and water is obtained separately according to some features such as normalized temperature, spectral variability and brightness. Finally, combining the results from the two steps, a binary cloud mask is derived. A complete description of the algorithm can be found at [15,18].
The minor modifications included in the new versions are the following: due to MOD09CMG/MYD09CMG characteristics, the cloud detection tests rely on surface reflectance at ground level contrary to the top of atmosphere (TOA) values for LANDSAT. This issue is addressed, updating the threshold values in order to adapt to this new feature. This was accomplished using a pre-build reference dataset. The new threshold values were selected by maximizing the overall accuracy and kappa statistics. In particular, the original Haze Optimized Transformation (HOT) test was replaced by the normalized difference index using the same blue and red bands. In addition, an extra-thin cirrus test was applied based on the band 31 and 32 brightness temperature difference following [19]. In the case of the FMASK being adapted to Aqua, as there are some existing problems with the 1.6 μm SWIR band (band 6), it was replaced with the 2.1 μm SWIR band (band 7) for the detection of land pixels in land test. This modified algorithm is especially devoted to detecting clouds over land; therefore, the water branch in the original algorithm was removed. This was accomplished using the MODIS water mask available in the MOD44W product which was previously reprojected in order to accommodate the new resolution.
Additionally, the MOD14A1 fire product available at the ~1 km sinusoidal projection was used for screening hotspots. For further information on this fire detection product, please refer to [20].

3.2.3. MAIAC

Finally the results provided by the MAIAC algorithm were used. In particular, the cloud mask, fire information and aerosol optical thickness level (flag indicating if it is greater or less than 0.9) were provided in the MAIACTBRF/MAIACBRF product [21]. This product is available at 1 km sinusoidal projection.
MAIAC is a new land and inland water cloud mask algorithm developed as a part of the multi-angle implementation of the atmospheric correction (MAIAC) algorithm for the MODIS sensor [22]. All the information relative to this new algorithm, including the cloud mask scheme and Aerosol Optical Thickness (AOT) retrieval, can be found at [22]. In contrast with the threshold MOD35 cloud mask, this approach employs a combination of spectral and brightness tests together with some pre-built reference clear images that are used as a target comparison in order to detect clouds [13]. Covariance analysis is used to build the reference images. This algorithm also possesses a dynamic land-water-snow mask which guides the surface and aerosol retrieval in rapid changing conditions, such as fires and floods [13]. The cloud mask is actually updated during these retrievals.

3.3. MODIS Land Cover

MOD12C1 and MOD12Q1 [23] were used in order to delimitate the extension of the Amazonian rainforests provided in the Amazonia_mask layer. This mask was obtained intersecting the pixels classified as “Evergreen Broadleaf Forest-EBF” (class 2) in land cover type 1 (International Geosphere-Biosphere Programme—IGBP global vegetation classification scheme) provided in the MCD12C1 product with a geographical vector covering the area of interest resulting from the inclusion of the surrounding South American provinces (political borders). The last land cover available, from the year 2012, was selected, aiming to avoid thermal anomalies resulting from land cover changes.

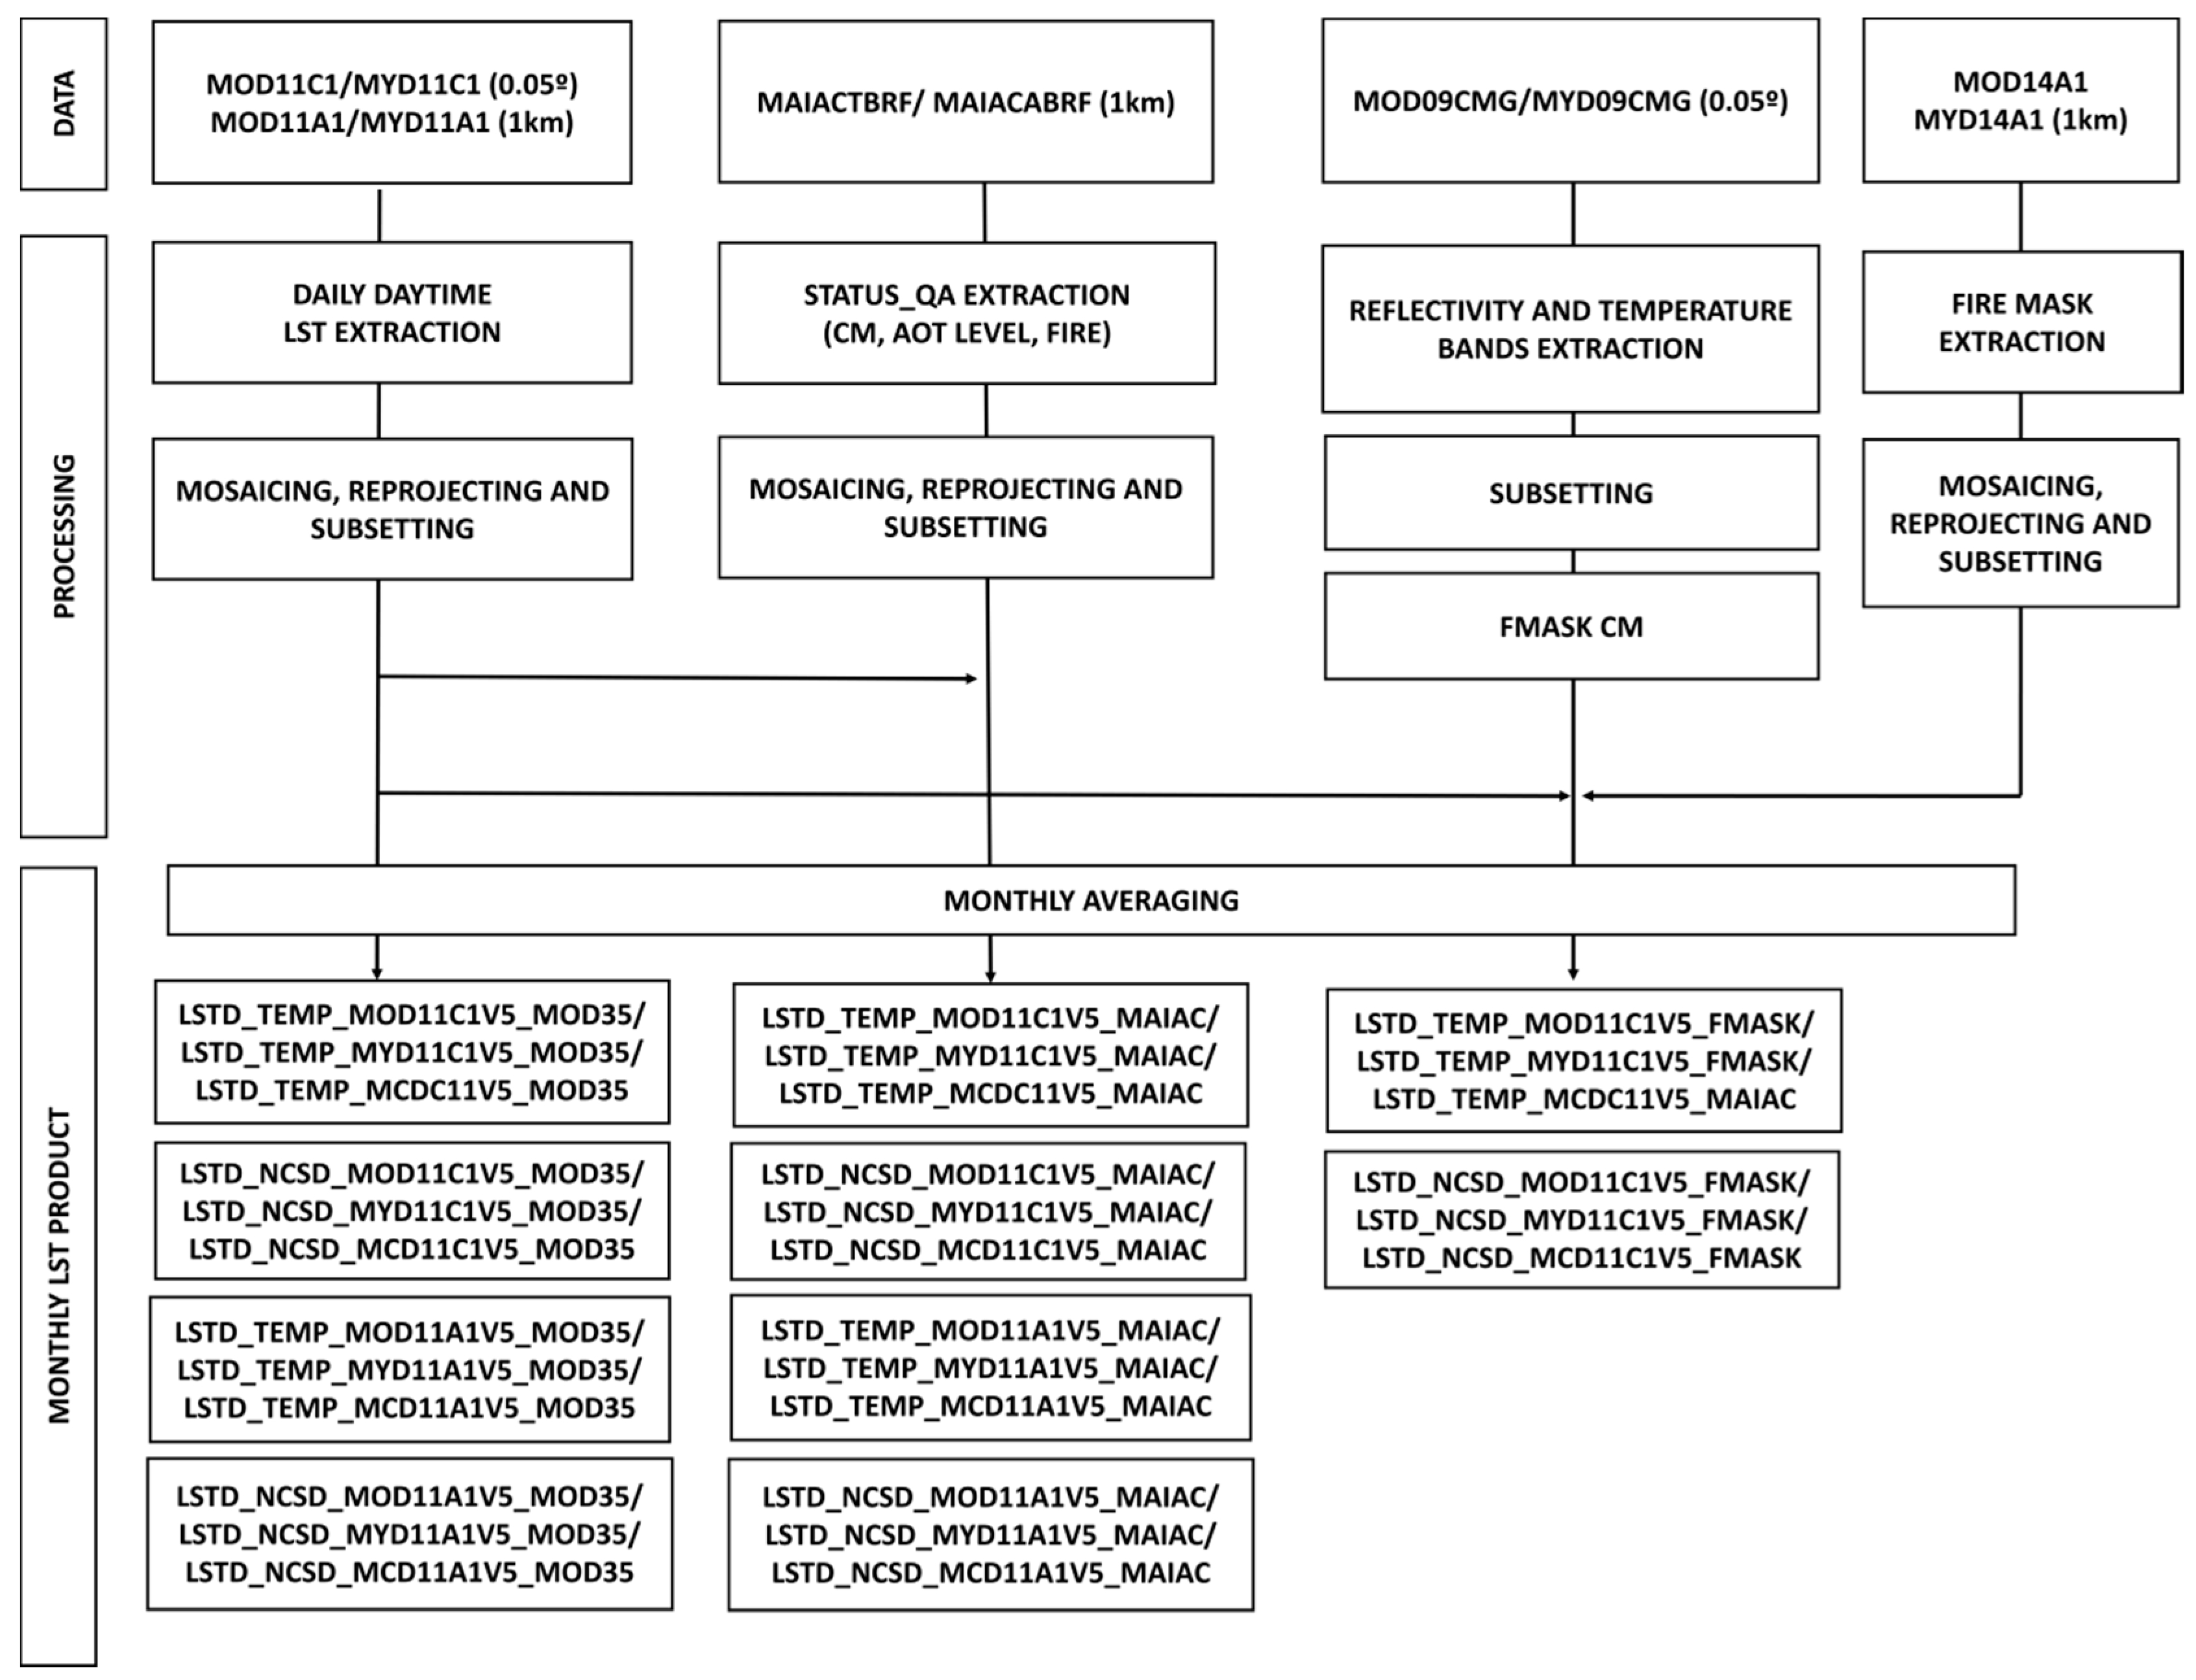
3.4. Producing the Monthly LST Products
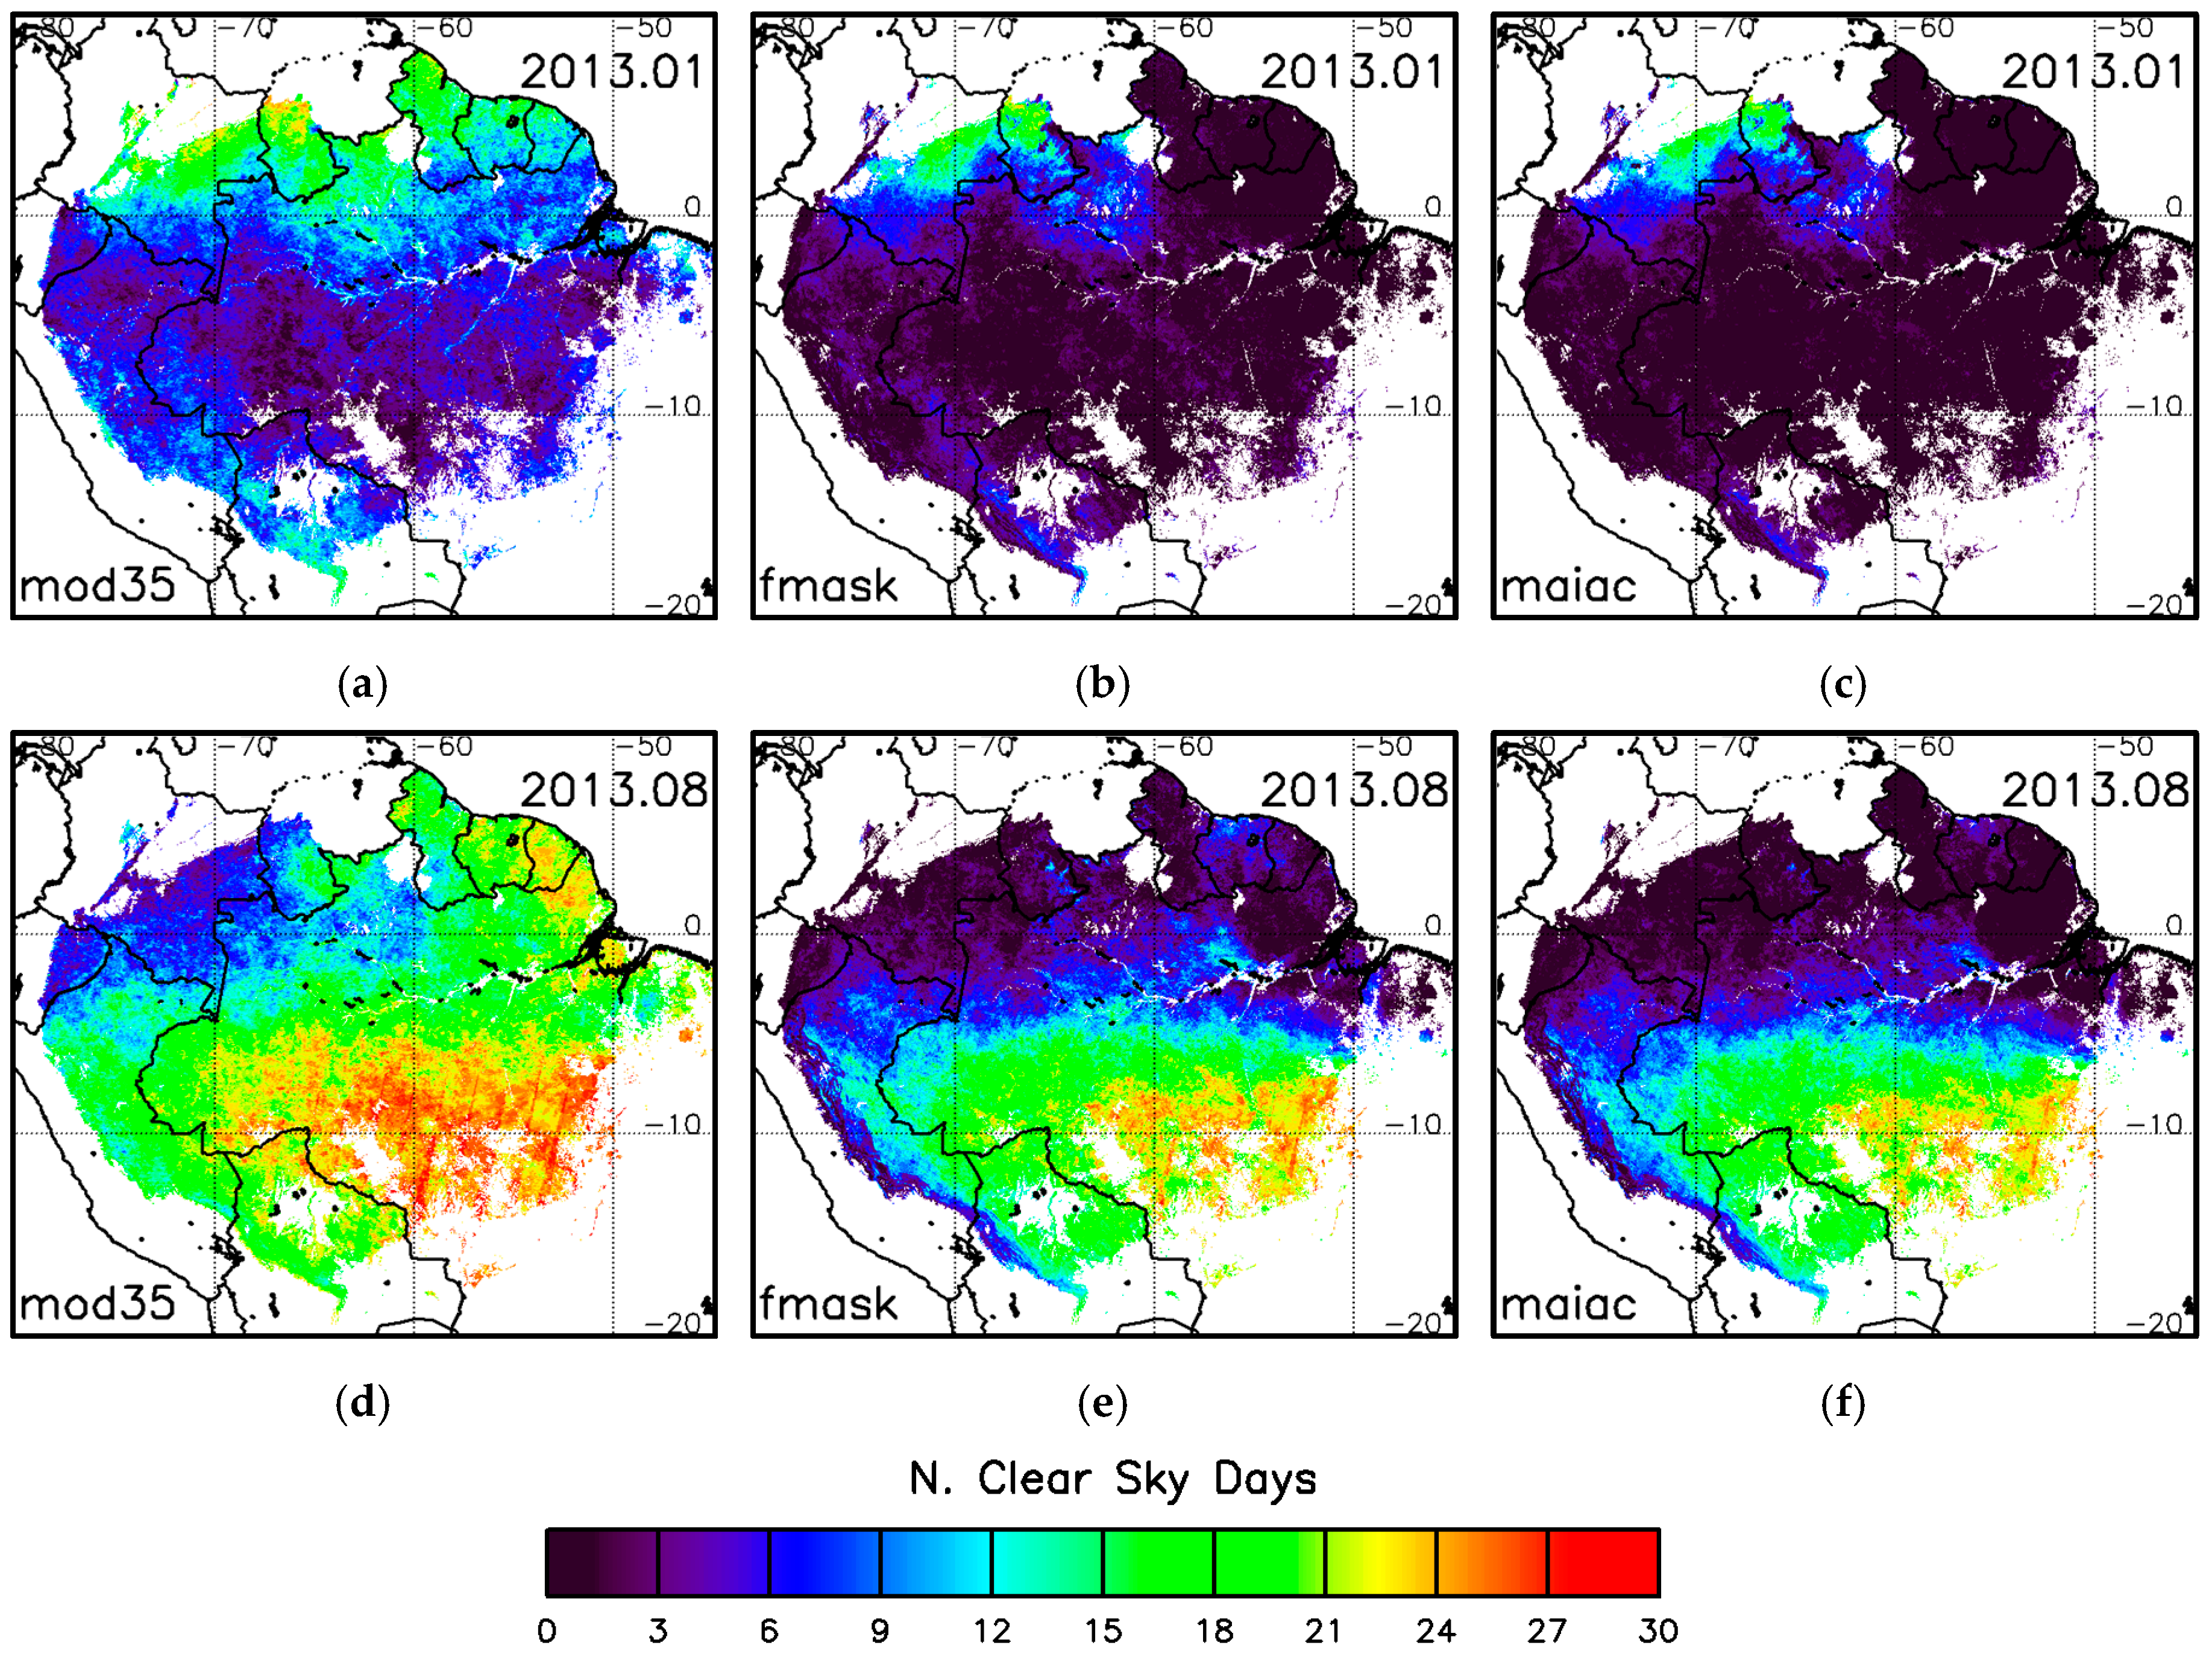
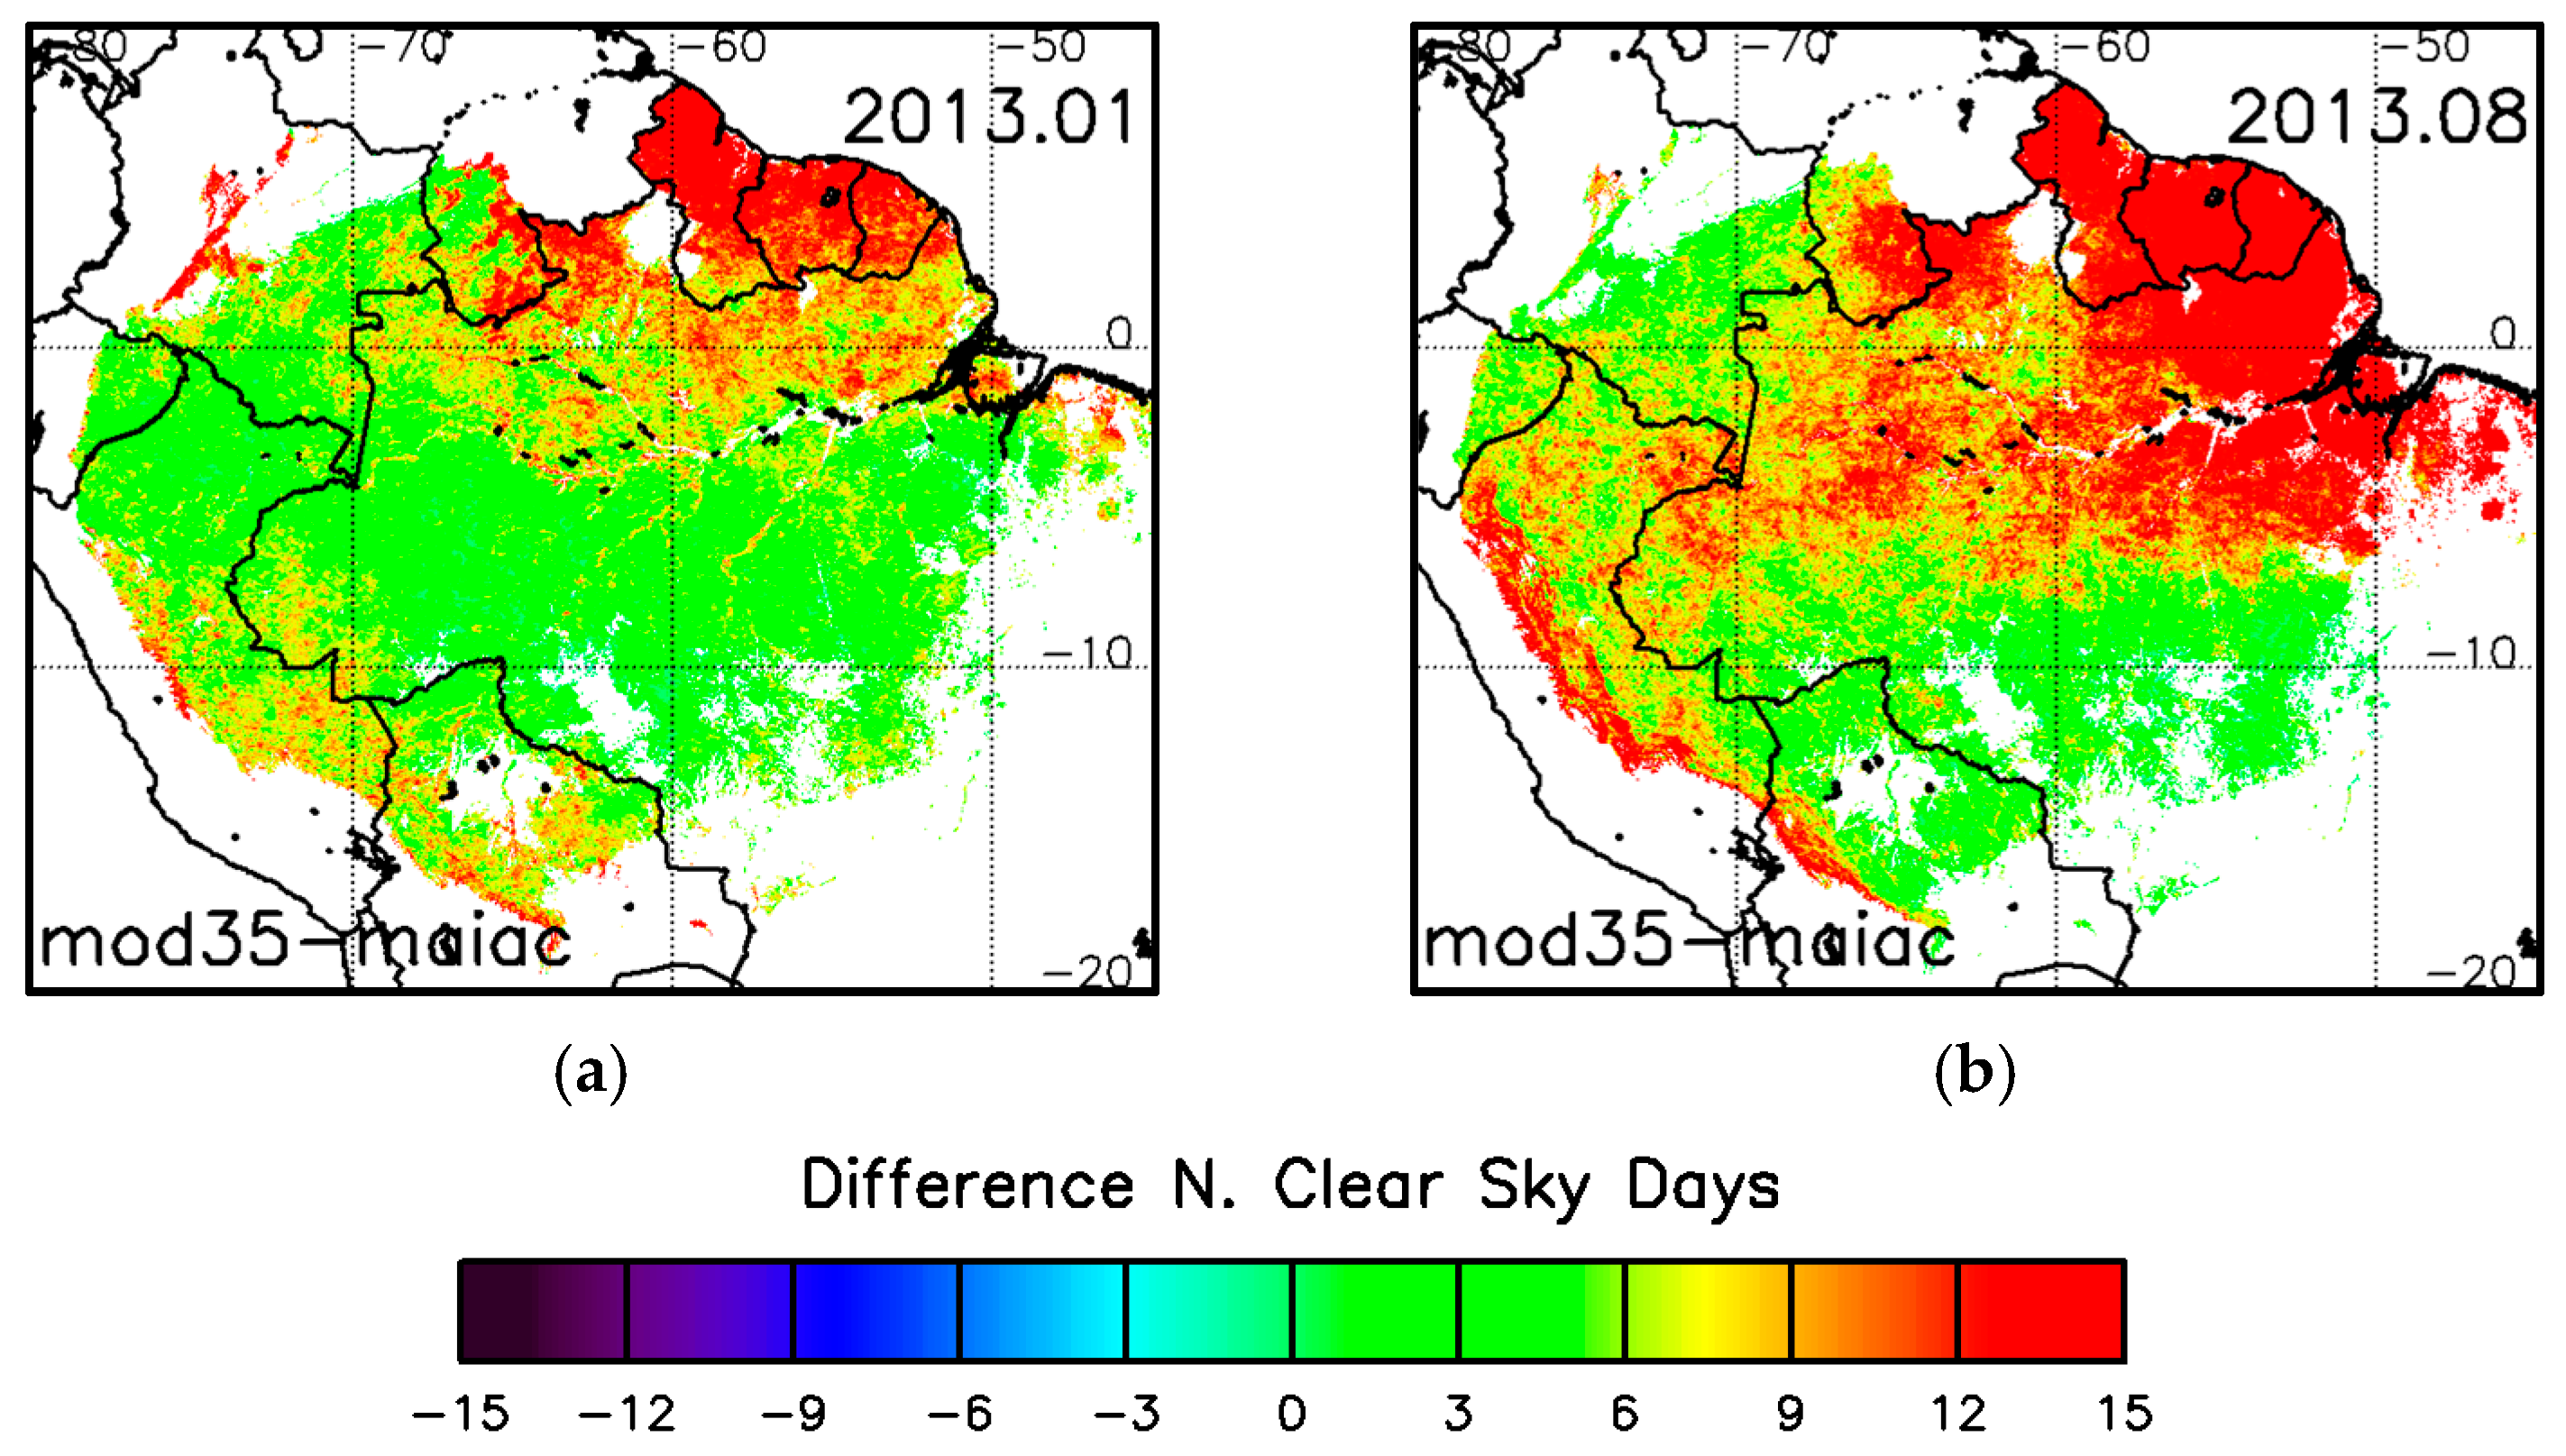
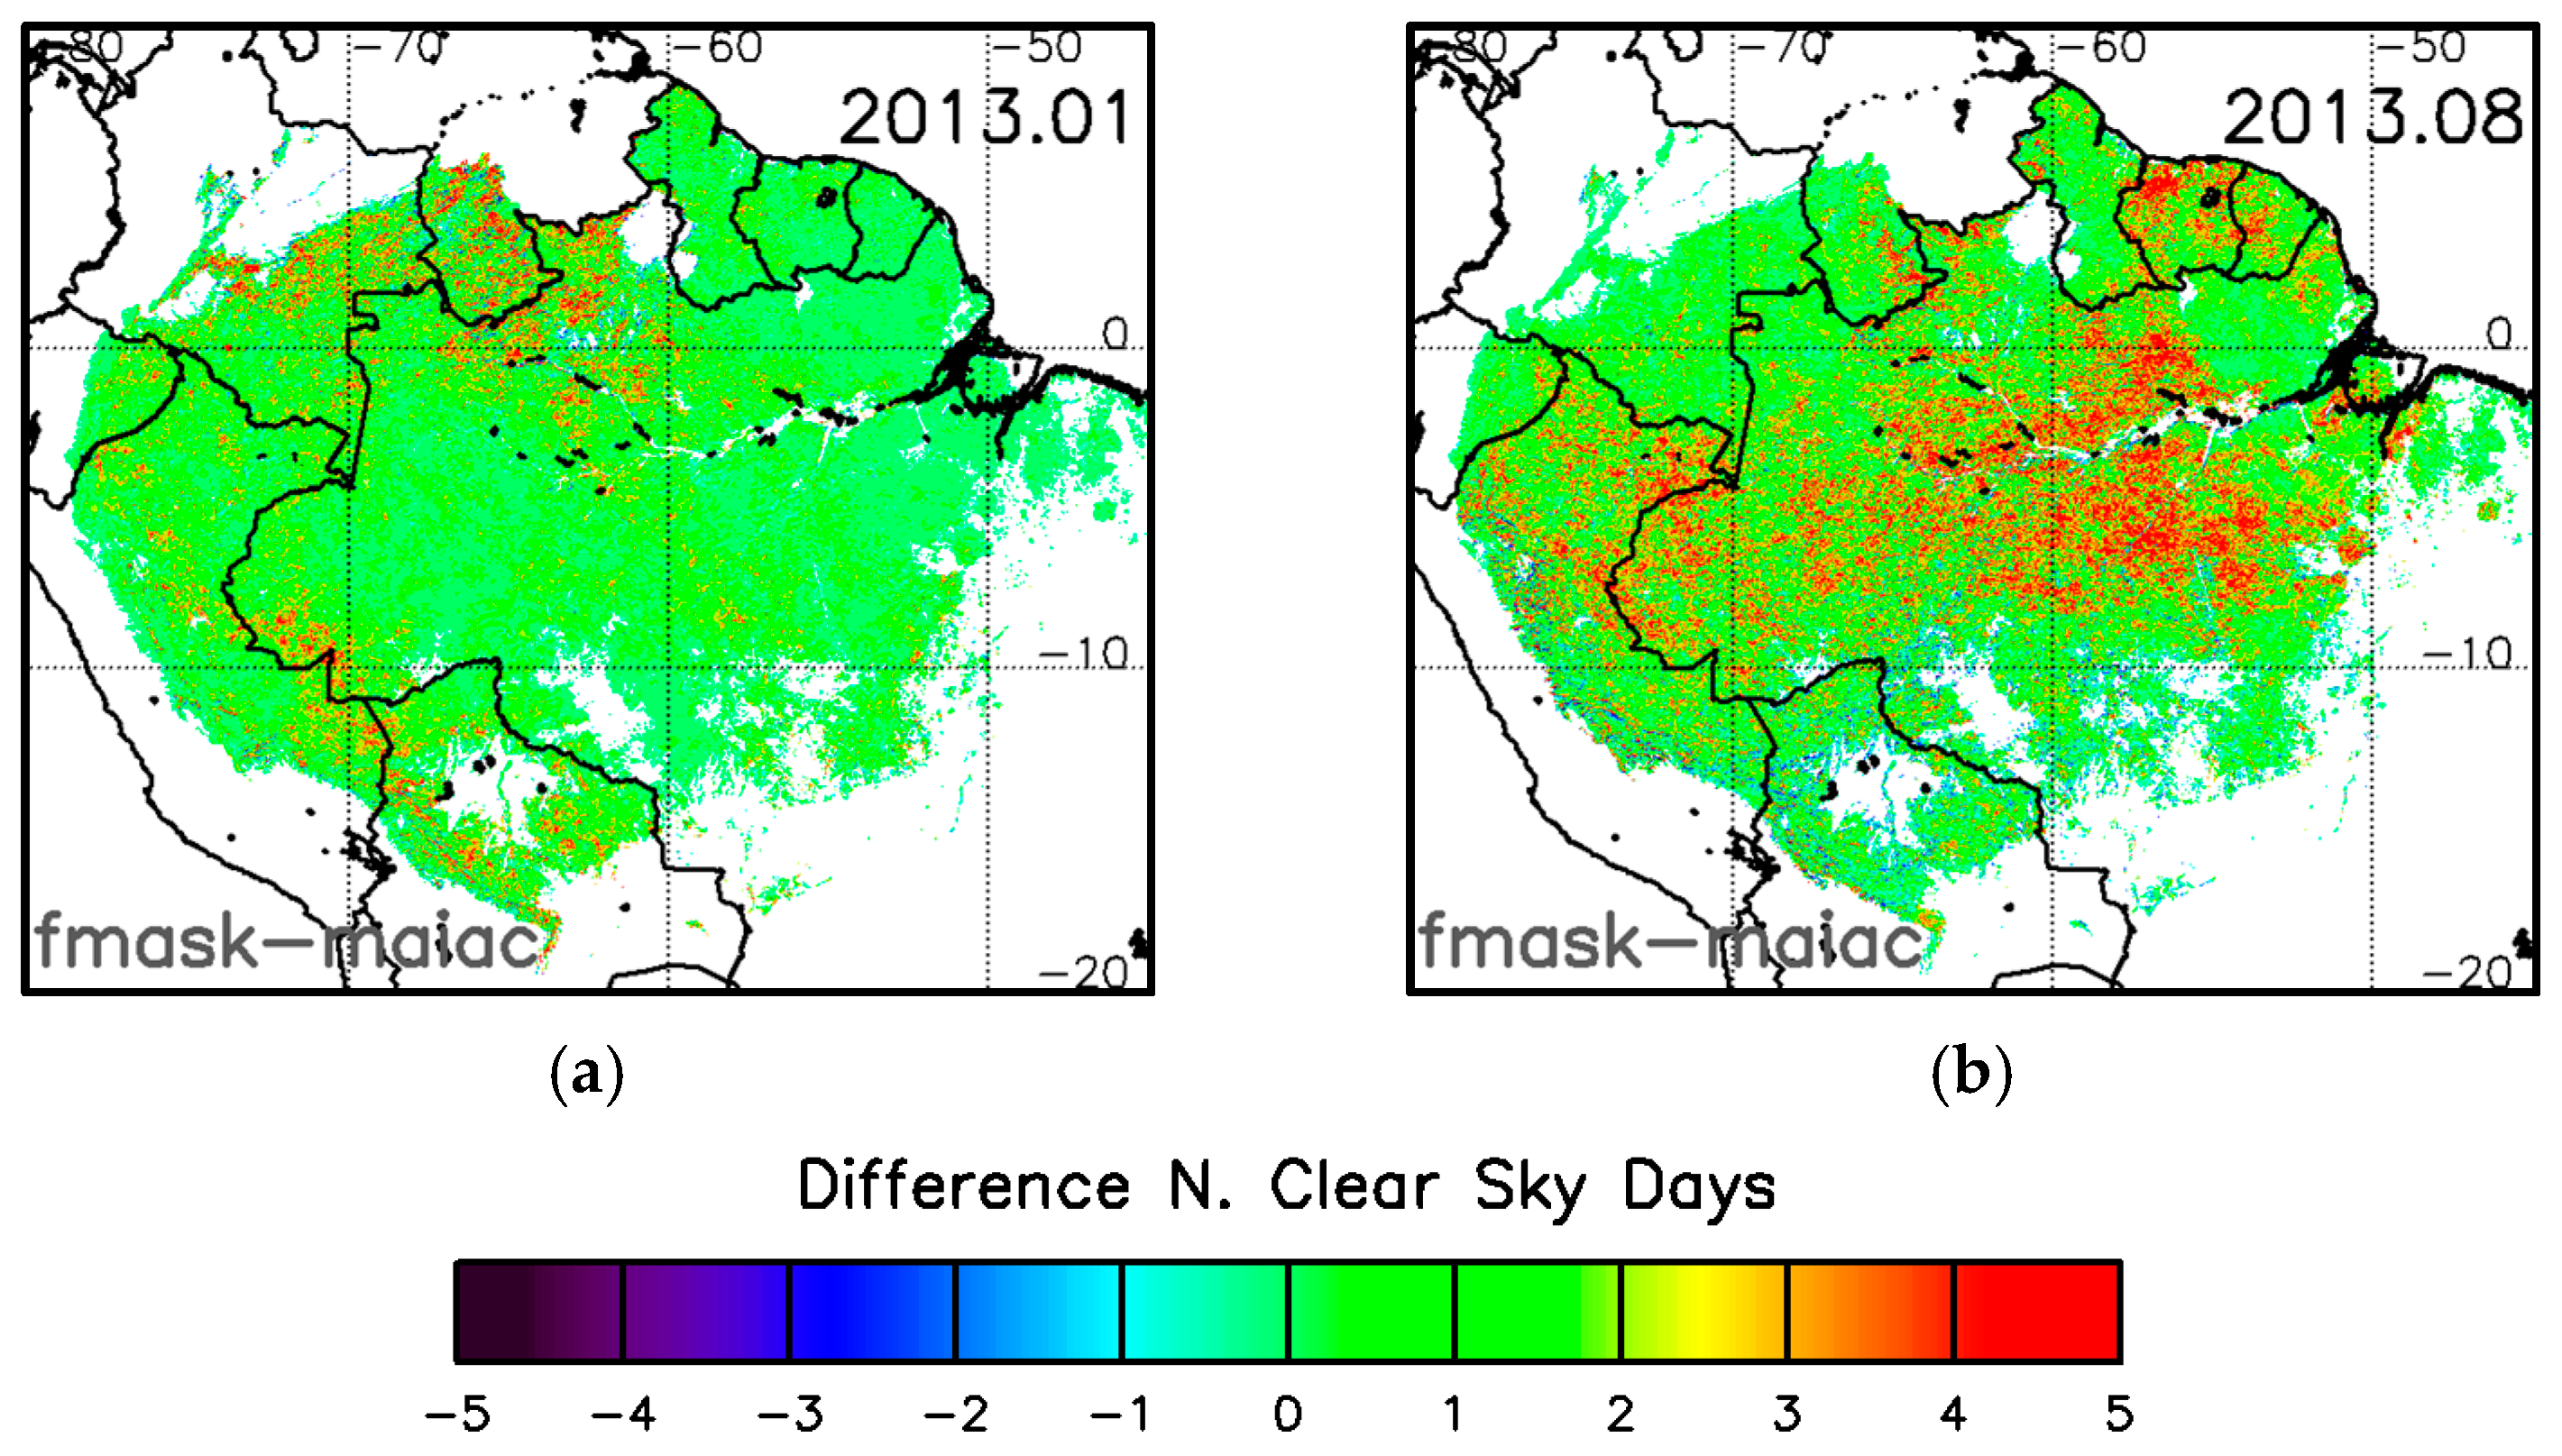
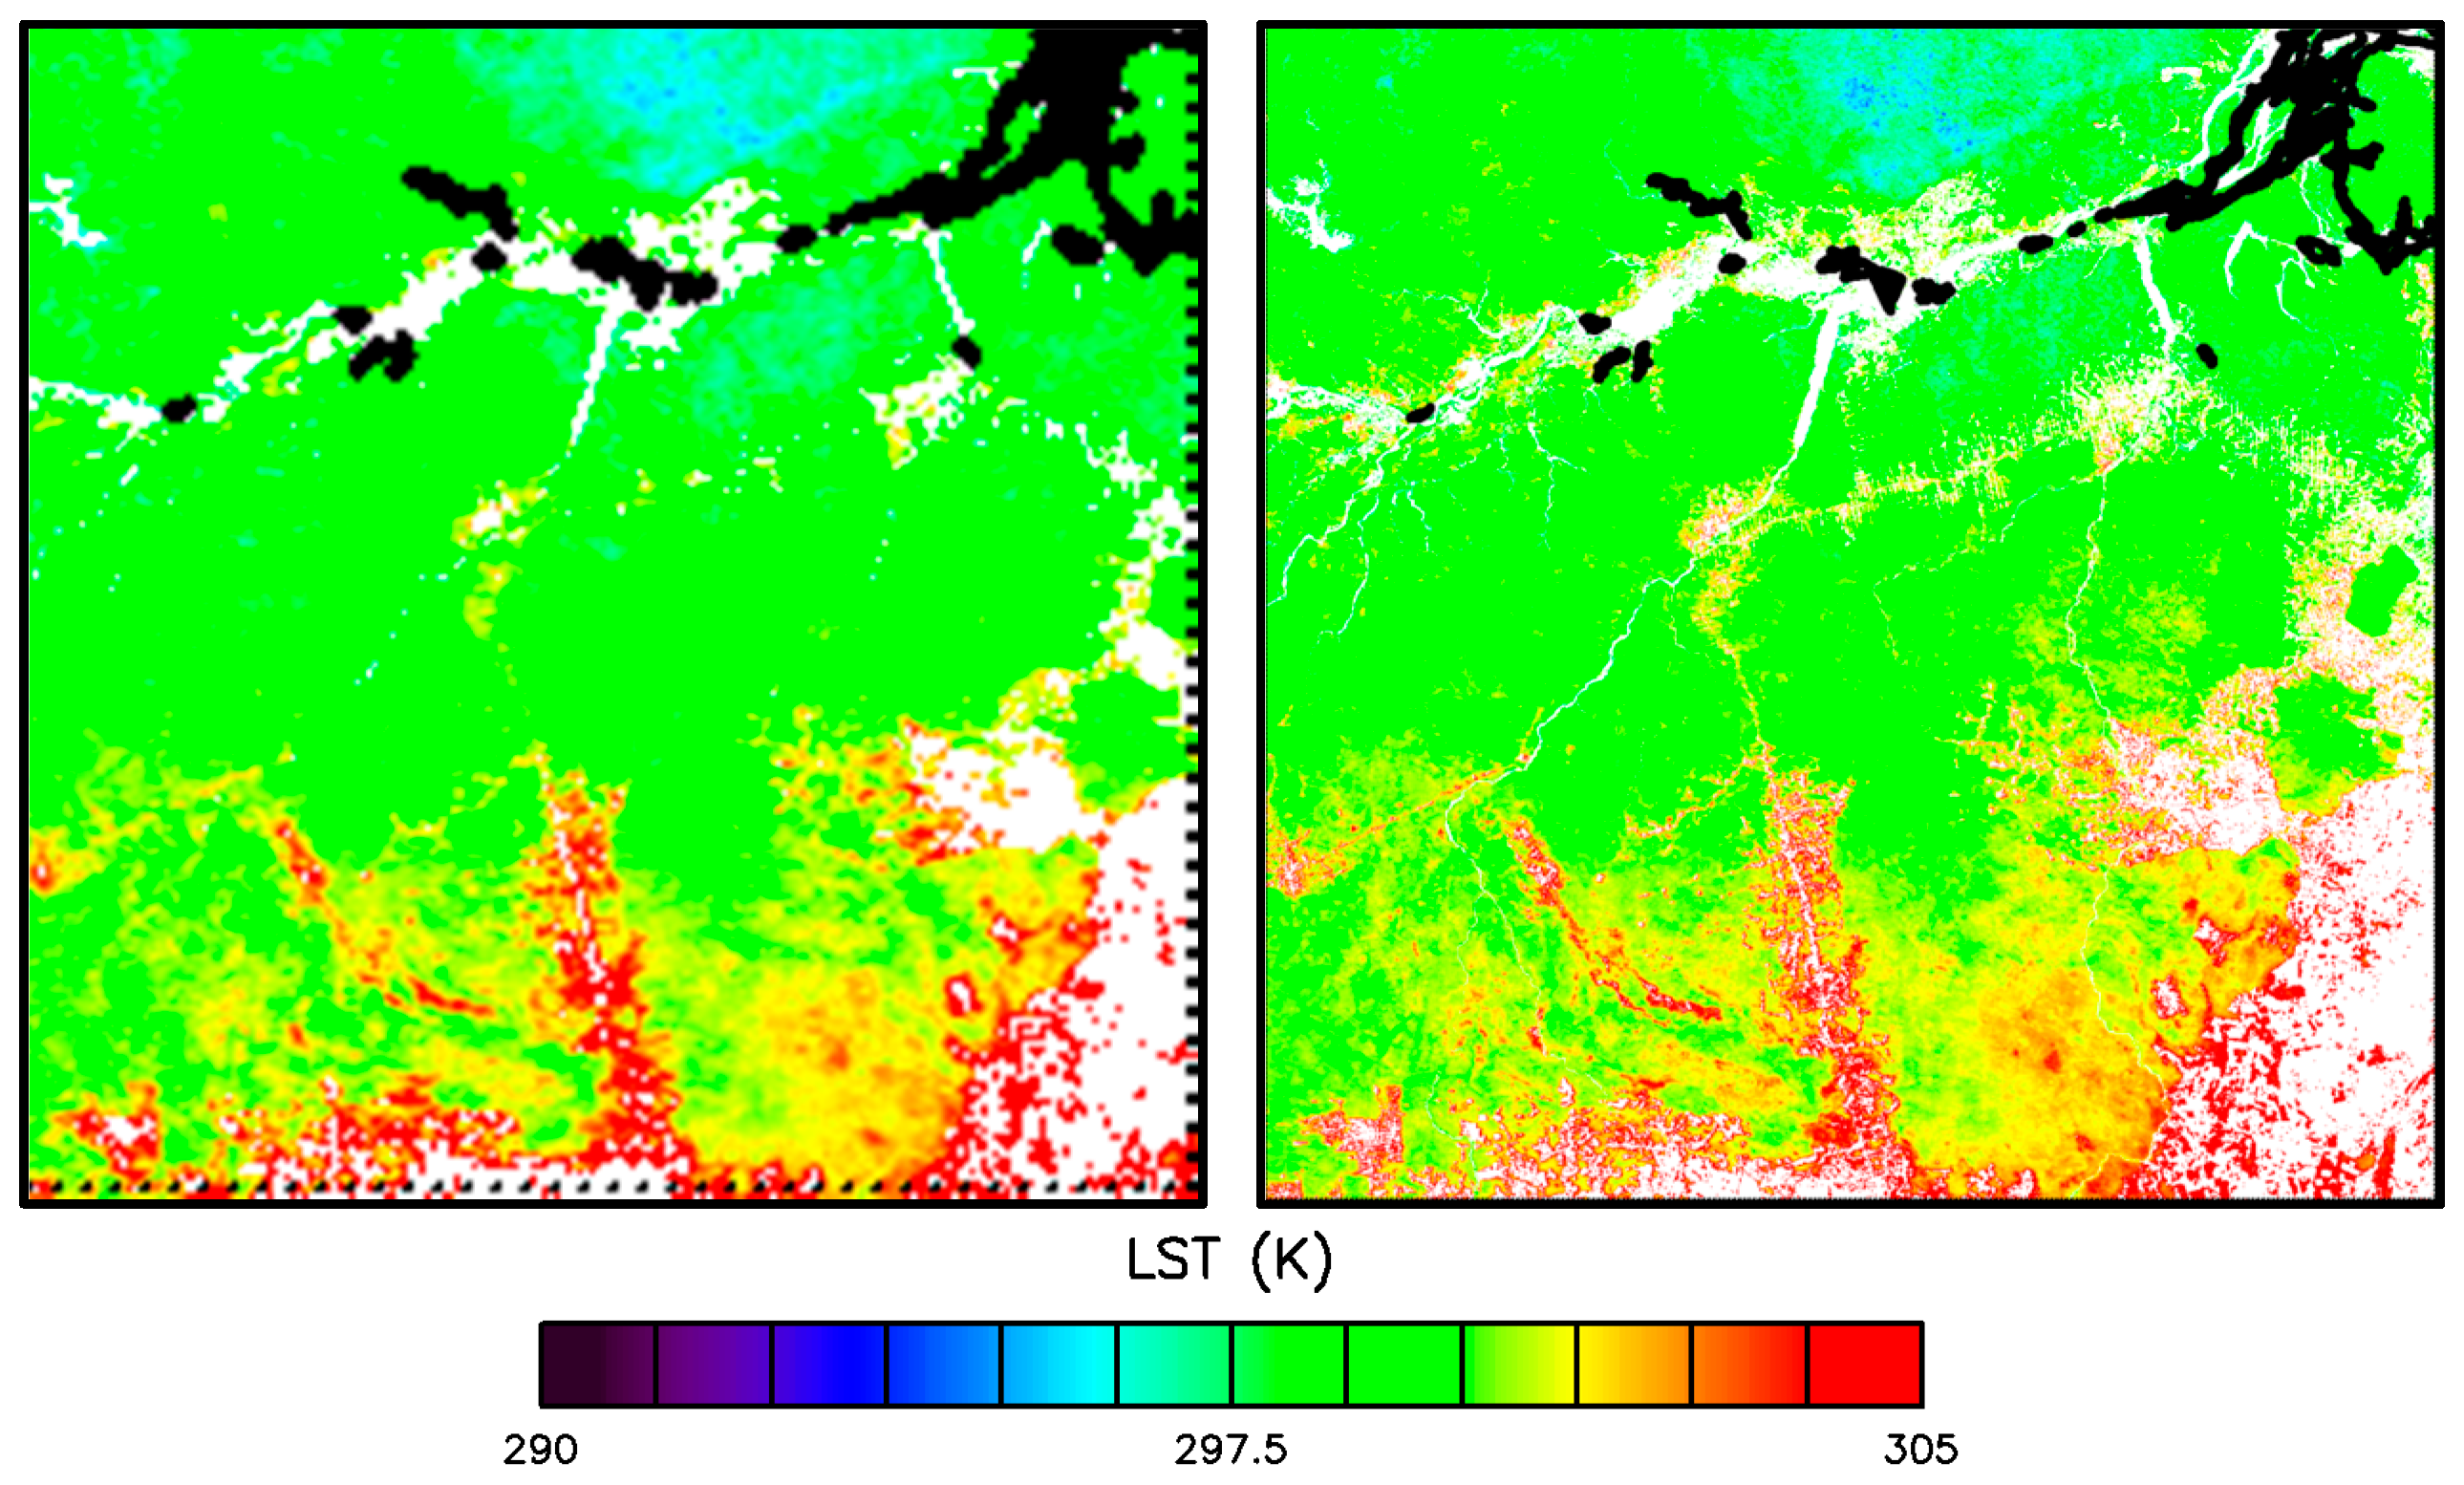
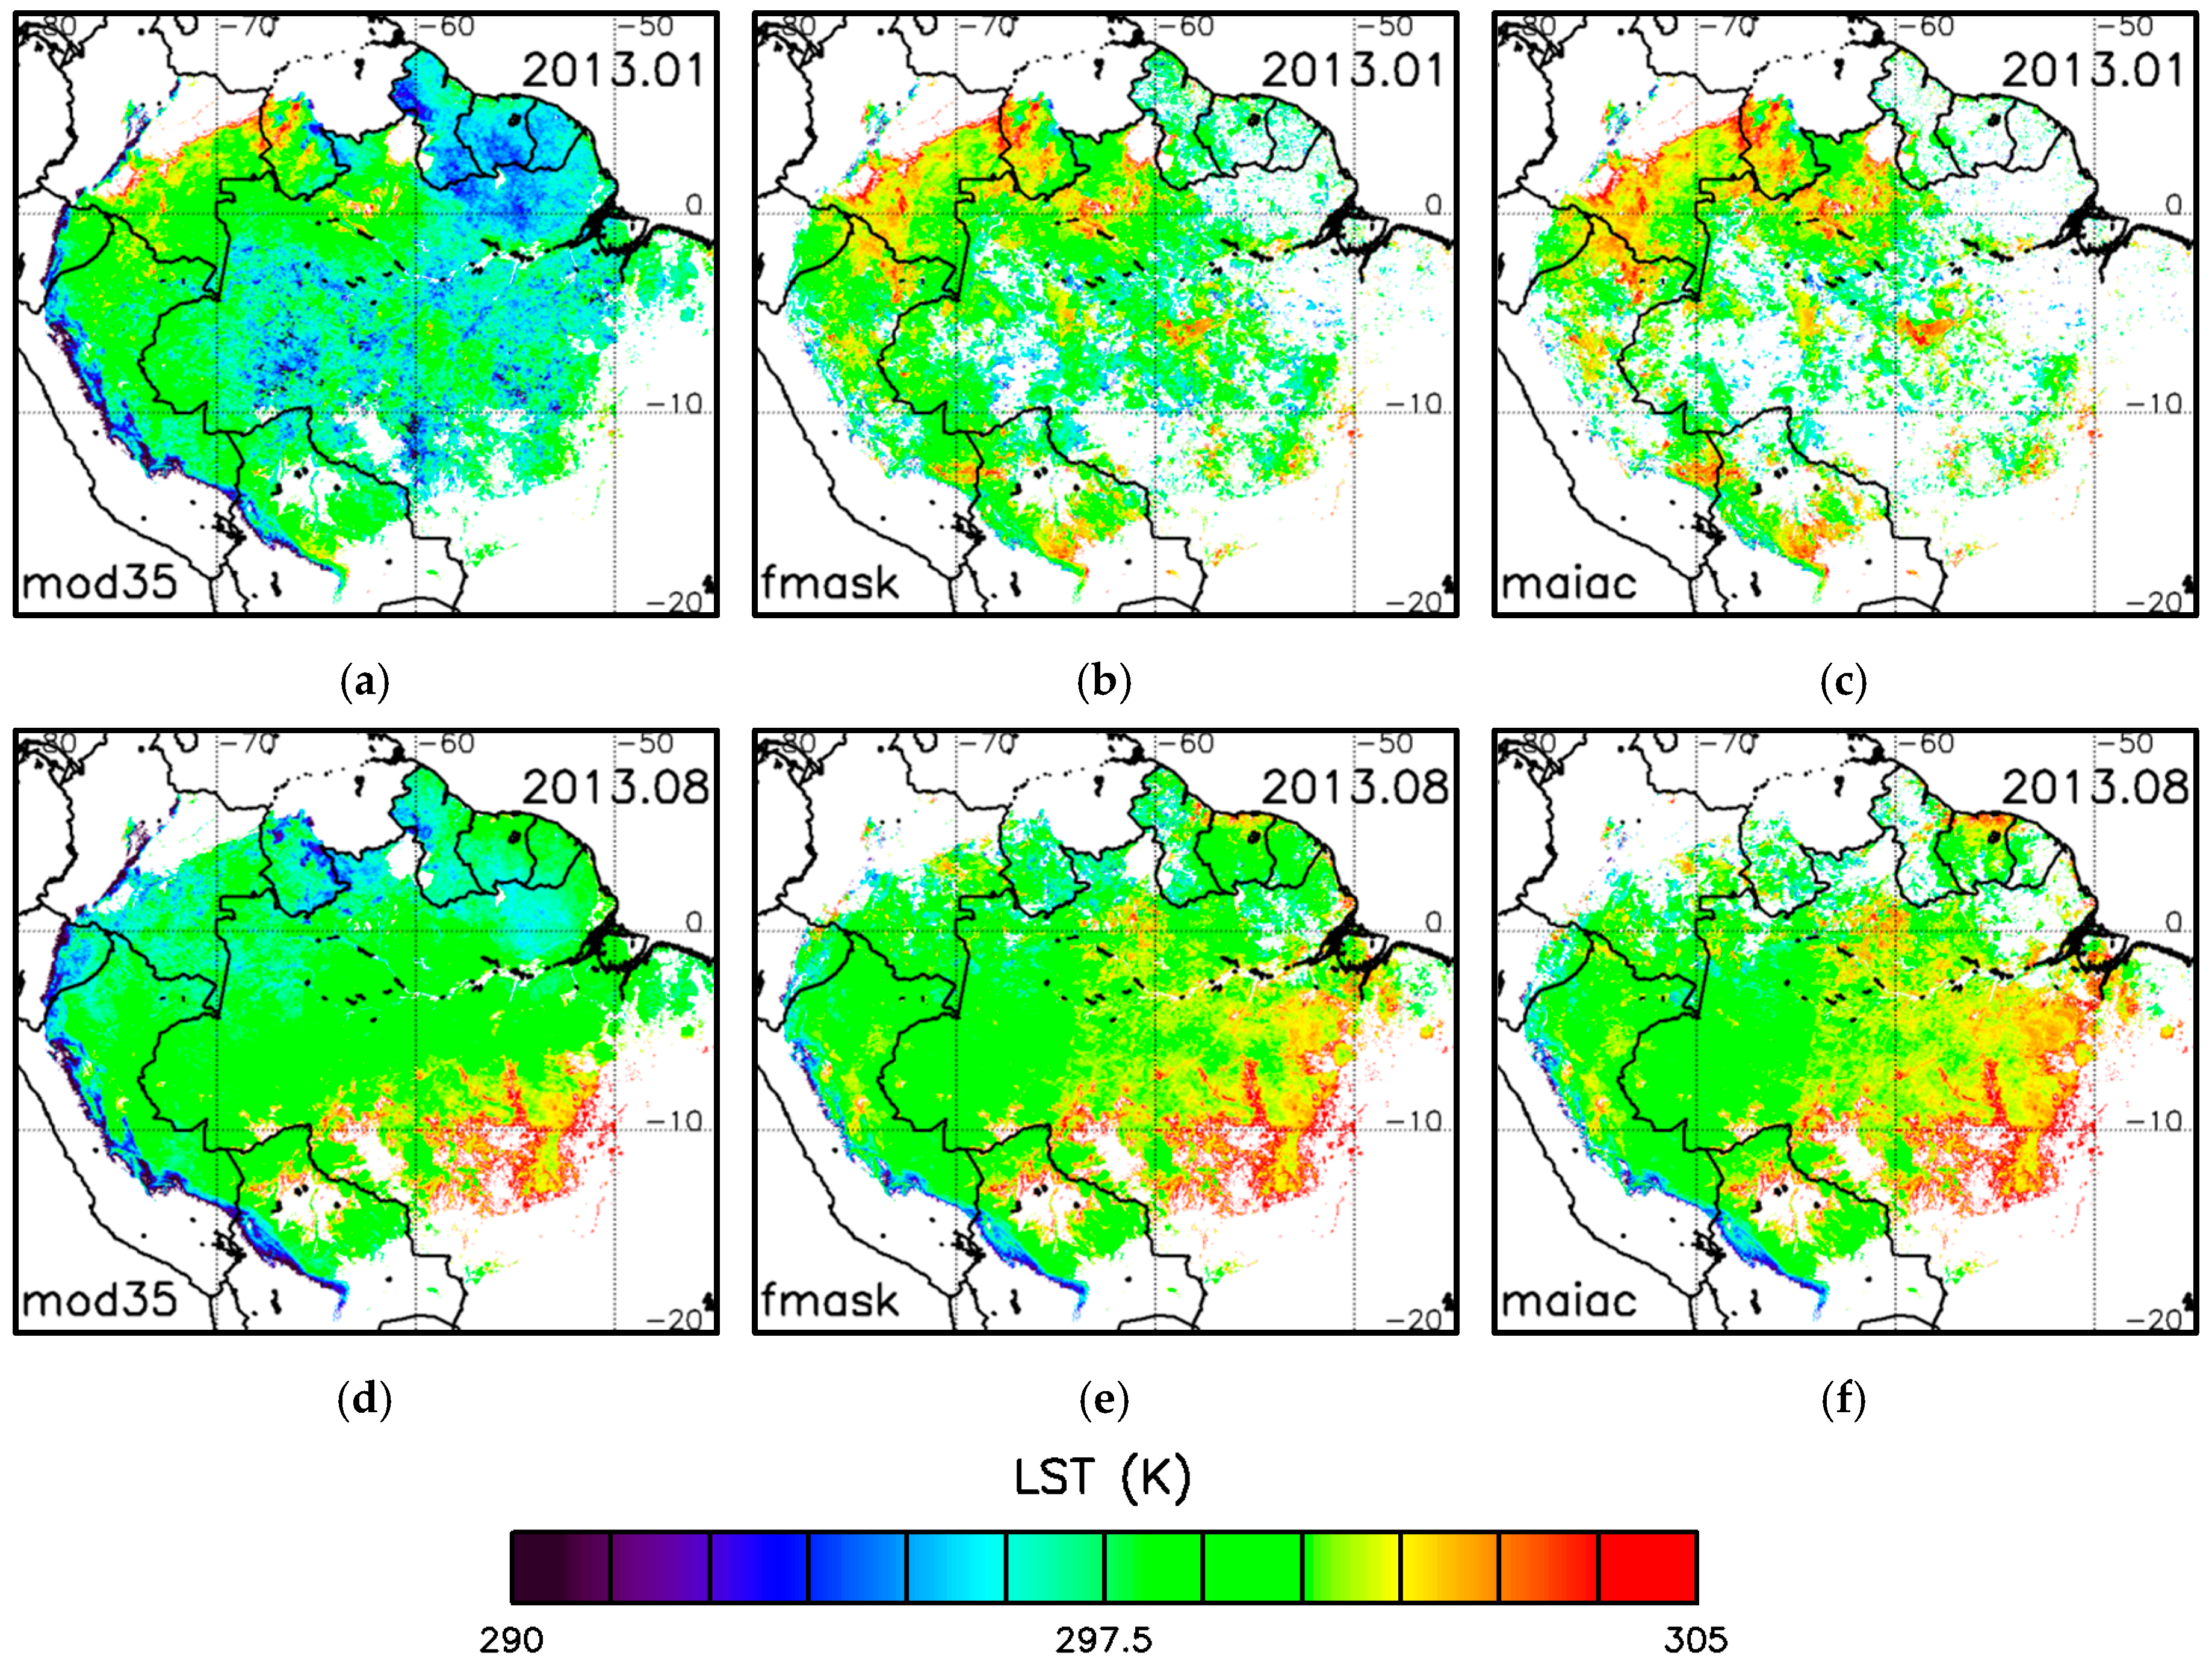
In the processing chain (Figure 1), three different branches can be distinguished according to the cloud masking approach employed: MOD35, MAIAC and FMASK. The MOD35 results account for simply temporally averaging the MODIS LST products in monthly time periods. The results were obtained at 0.05° and at 0.009° (1 km) resolutions. The MAIAC and FMASK approaches include an additional process: the inclusion of the new cloud detection algorithm results and the hot spot data. In the case of MAIAC, this consisted of removing pixels with clouds, a high AOT level (>0.9) and fires. For this case, data were provided at a 1 km resolution. The STATUS_QA was downsized to a 0.05° resolution for the lower resolution version. In this case, a pixel is considered clear if more than 50% of the totality of the 1-km-resolution pixels that belong to the 0.05° pixel were not obstructed by clouds or aerosols or failures in the retrieval process. The fire information was resized to the new resolution using the nearest neighbor approach. For the FMASK approach, the cloud masks were derived from the processing of the MOD09CMG/MYD09CMG product. The hot spot was taken into account using the Fire Mask provided in the MOD14A1/MYD14A1. This product was properly adapted to the new spatial characteristics using the nearest neighbor approach. The results are only available at a 0.05° resolution.
Together with the monthly LST values, the number of valid pixels in a month from which the previous values were obtained is also delivered. This number of clear-sky pixels corresponds to the number of days not obstructed by clouds and without failures in the different LST, CM or AOT retrieval algorithms.
Finally, the products denoted as having the “mcd” particle simply result from averaging the daily LST derived from both platforms. Only valid pixels in both Terra and Aqua are considered in the processing.
Currently, LST uncertainties are not available as a dedicated layer for each product. Details on MODIS LST product uncertainties can be found in [10]. Validation results over the Amazonian forests are also presented in [24].

3.5. Sample Results

We include in this section some sample results extracted from the datasets presented in this paper. Figure 2 shows the number of clear-sky days for two sample months (January and August) in 2013 obtained from the three different cloud mask products. It is clearly observed that FMASK and MAIAC are more conservative than the MOD35 product, thus providing a low number of clear-sky days within a month. It is also observed that the number of clear-sky days is higher for the months of the dry season (e.g., August) than for the months of the wet season (e.g., January), especially over southern Amazonia. In order to analyze in detail the differences between the different cloud masks, Figure 3 and Figure 4 show the difference between the number of clear-sky days obtained from MOD35 and MAIAC (MOD35-MAIAC) and FMASK and MAIAC (FMASK-MAIAC), respectively. The differences between MOD35 and MAIAC can be up to 15 days, especially in northeastern Amazonia (Figure 3), whereas MAIAC tends to be more conservative than FMASK because the differences are mainly positive (Figure 4). However, the differences between FMAKS and MAIAC are almost negligible in January (differences of around one or two days), whereas differences can be greater than five days in August (Figure 4).
Figure 5 shows the monthly daytime LST obtained from the three datasets at 5 km spatial resolution (lstd_temp_mod11c1v5_mod35, lstd_temp_mod11c1v5_fmask, and lstd_temp_mod11c1v5_maiac, following the notation presented in Table 1). LST maps are provided for the two sample months (January and August) in 2013, as is shown in Figure 2. LST products based on FMASK and MAIAC provide a low number of valid LST values, as was concluded in the analysis of Figure 2. Colder LST values are observed also in the case of MOD35, especially in January.
Finally, Figure 6 shows an example of the LST extracted from the 5 km and 1 km products (mod11c1v5 and mod11a1v5, respectively) for a sub-setting of the study area. The deforestation patterns in the case of the 1 km product are clearly observed, and they are hardly observed in the case of the 5 km product.

4. User Notes

The datasets presented in this paper can be used for the monitoring of thermal anomalies over the Amazon forest. Because of the higher spatial resolution of the satellite data compared to other climatic datasets (e.g., reanalysis), the products presented in this paper may be used for detailed analysis of spatial patterns of droughts or warming episodes. In particular, the products at 1 km spatial resolution allow the visualization of spatial features which are hardly observed at coarser resolutions. The monthly LST products described in this paper may offer a more reliable perspective than the current counterpart MODIS products. The dataset is available from the year 2000 to the present, leading to a temporal record of around 17 years. It is worth mentioning that this time period may be still too low for the study of anomalies in a climatologically robust way. Moreover, the removal of cloud-contaminated pixels results in a decrease of the number of clear-sky observations for computing the monthly mean temperature. Robust climatological analysis can be performed using other datasets such as the ERA-Interim reanalysis dataset, available from 1979 to the present, and also included in the Thermal Amazoni@ system. Additional details on data usage can be found in [12].

Acknowledgments

The authors would like to thank the MODIS and MAIAC projects for making their data sets available to users. This study was partly funded by the Ministerio de Ciencia e Innovación (CEOS-Spain2, ESP2014-52955-R). José Gomis-Cebolla was supported by Grant FPU14_06502 of the Ministerio de Educación Cultura y Deporte.

Author Contributions

José Gomis-Cebolla and Juan C. Jiménez-Muñoz conceived the study, performed the processing and wrote the paper. José A. Sobrino contributed to the analysis of results and revised the paper.

Conflicts of Interest

The authors declare no conflict of interest.

References

  1. Malhi, Y.; Wood, D.; Baker, T.R.; Wright, J.; Phillips, O.L.; Cochrane, T.; Meir, P.; Chave, J.; Almeida, S.; Arroyo, L.; et al. The regional variation of aboveground biomass in old-growth Amazonian forests. Glob. Chang. Biol. 2006, 12, 1107–1138. [Google Scholar] [CrossRef]
  2. Gedney, N.; Valdes, P.J. The effect of Amazonian deforestation on the northern hemisphere circulation and climate. Geophys. Res. Lett. 2000, 27, 3053–3056. [Google Scholar] [CrossRef]
  3. Groombridge, B.; Jenkins, M.D. World Atlas of Biodiversity; University of California Press: Berkeley, CA, USA, 2003. [Google Scholar]
  4. Clark, D.A.; Keeling, C.D.; Clark, D.B. Tropical rain forest tree growth and atmospheric carbon dynamics linked to inter-annual temperature variation during 1984–2000. Proc. Natl. Acad. Sci. USA 2003, 100, 5852–5857. [Google Scholar] [CrossRef] [PubMed]
  5. Doughty, C.E.; Goulden, M.L. Are tropical forests near a high temperature threshold? J. Geophys. Res. 2008, 113, G00B07. [Google Scholar] [CrossRef]
  6. Galbraith, D.; Levy, P.E.; Sitch, S.; Huntingford, C.; Cox, P.; Williams, M.; Meir, P. Multiple mechanisms of Amazonian forest biomass losses in three dynamic global vegetation models under climate change. New Phytol. 2010, 187, 647–665. [Google Scholar] [CrossRef] [PubMed]
  7. Soares-Filho, B.S.; Nepstad, D.C.; Curran, L.M.; Cerqueira, G.C.; Garcia, R.A.; Ramos, C.A.; Voll, E.; McDonald, A.; Lefebvre, P.; Schlesinger, P. Modelling conservation in the Amazon basin. Nature 2006, 440, 520–523. [Google Scholar] [CrossRef] [PubMed]
  8. Chambers, J.Q.; Asner, G.P.; Morton, D.C.; Anderson, L.O.; Saatchi, S.S.; Espírito-Santo, F.D.; Palace, M.; Souza, C., Jr. Regional ecosystem structure and function: Ecological insights from remote sensing of tropical forests. Trends Ecol. Evol. 2007, 22, 414–423. [Google Scholar] [CrossRef] [PubMed]
  9. Jiménez-Muñoz, J.C.; Mattar, C.; Sobrino, J.A.; Malhi, Y. Digital thermal monitoring of the Amazon forest: An intercomparison of satellite and reanalysis products. Int. J. Digit. Earth 2016, 9, 477–498. [Google Scholar] [CrossRef]
  10. Wan, Z. New refinements and validation of the MODIS land surface temperature/emissivity products. Remote Sens. Environ. 2008, 112, 59–74. [Google Scholar] [CrossRef]
  11. Wan, Z. Collection-5 MODIS Land Surface Temperature Products Users’ Guide; ICESS, University of California: Santa Barbara, CA, USA, 2007. [Google Scholar]
  12. Jiménez-Muñoz, J.C.; Mattar, C.; Sobrino, J.A.; Malhi, Y. A database for the monitoring of thermal anomalies over the Amazon forest and adjacent intertropical oceans. Sci. Data 2015, 2. [Google Scholar] [CrossRef] [PubMed]
  13. Lyapustin, A.; Wang, Y.; Frey, R. An automatic cloud mask algorithm based on time series of MODIS measurements. J. Geophys. Res. 2008, 113. [Google Scholar] [CrossRef]
  14. Hilker, T.; Lyapustin, A.I.; Tucker, C.J.; Sellers, P.J.; Hall, F.G.; Wang, Y. Remote sensing of tropical ecosystems: Atmospheric correction and cloud masking matter. Remote Sens. Environ. 2012, 127, 370–384. [Google Scholar] [CrossRef]
  15. Zhu, Z.; Woodcock, C.E. Object-based cloud and cloud shadow detection in Landsat imagery. Remote Sens. Environ. 2012, 118, 83–94. [Google Scholar] [CrossRef]
  16. Wan, Z. MODIS Land-Surface Temperature Algorithm Theoretical Basis Document (LST ATBD); Institute for Computational Earth System Science, University of California: Santa Barbara, CA, USA, 1999. [Google Scholar]
  17. Ackerman, S.A.; Strabala, K.I.; Menzel, W.P.; Frey, R.; Moeller, C.; Gumley, L.; Baum, B.; Seeman, S.W.; Zhang, H. Discriminating Clear-Sky from Cloud with MODIS-Algorithm Theoretical Basis Document (MOD35) (ATBD Reference Number: ATBD-MOD-06); Goddard Space Flight Center: Greenbelt, MD, USA, 2002. [Google Scholar]
  18. Zhu, Z.; Wang, S.; Woodcock, C.E. Improvements and expansion of the Fmask algorithm: Cloud, cloud shadow and shadow detection for Landsats, 4–7, 8 and Sentinel 2 images. Remote Sens. Environ. 2015, 159, 269–277. [Google Scholar] [CrossRef]
  19. Wilson, M.J.; Oreopoulos, L. Enhancing a simple MODIS CLOUD mask algorithm for the Landsat data continuity mission. IEEE Trans. Geosci. Remote 2013, 51, 723–731. [Google Scholar] [CrossRef]
  20. Giglio, L. MODIS Collection 5 Active Fire Products Users’ Guide Version 2.5; University of Maryland: College Park, MD, USA, 2013. [Google Scholar]
  21. MAIAC dataset. Available online: ftp://dataportal.nccs.nasa.gov/DataRelease/SouthAmerica (accessed on 24 May 2016).
  22. Lyapustin, A.; Wang, Y. MAIAC: Multi-Angle Implementation of Atmospheric Correction for MODIS (Algorithm Theoretical Basis Document v.1.0); Goddard Earth Science and Technology Center UMBC: Baltimore, MD, USA; NASA GSFC: Greenbelt, MD, USA, 2008. [Google Scholar]
  23. Strahler, A.; Muchoney, D.; Borak, J.; Friedl, M.; Gopal, S.; Lambin, E.; Moody, A. MODIS Land Cover and Land-Cover Change (MODIS Land Cover Product Algorithm Theoretical Basis Document (ATBD) Version 5.0); Boston University: Boston, MA, USA, 1999. [Google Scholar]
  24. Toomey, M.; Roberts, D.A.; Still, C.; Goulden, M.L.; McFadden, J.P. Remotely sensed heat anomalies linked with Amazonian forest biomass declines. Geophys. Res. Lett. 2011, 38. [Google Scholar] [CrossRef]
Figure 1. Scheme of the processing followed for the generation of the monthly LST products presented in this study.
Data 01 00002 g001
Figure 2. Number of clear-sky days within a month for the three cloud mask products: (a) MOD35, January-2013, (b) FMASK, January-2013, (c) MAIAC, January-2013, (d) MOD35, August-2013, (e) FMASK, August-2013, (f) MAIAC, August-2013.
Data 01 00002 g002
Figure 3. Difference between the number of clear-sky days within a month provided by MOD35 and MAIAC cloud masks: (a) January 2013, (b) August 2013.
Data 01 00002 g003
Figure 4. Difference between the number of clear-sky days within a month provided by FMASK and MAIAC cloud masks: (a) January 2013, (b) August 2013.
Data 01 00002 g004
Figure 5. Monthly daytime LST computed from the number of clear-sky days provided by the three different cloud mask products: (a) MOD35, January-2013, (b) FMASK, January-2013, (c) MAIAC, January-2013, (d) MOD35, August-2013, (e) FMASK, August-2013, (f) MAIAC, August-2013.
Data 01 00002 g005
Figure 6. Comparison between the monthly LST at different spatial resolutions: 5 km (left) and 1 km (right). The study area includes the region (0–10 S, 60 W–50 W; Pará, Brazil), and the monthly LST is for August 2013.
Data 01 00002 g006
Table 1. Description of the Land Surface Temperature (LST) products with the different cloud masks. A number of clear-sky days (ncsd) products is also available for each individual LST product.
LayerAvailabilityResolutionParameter
lstd_temp_mod11c1v5_mod352000–present0.05°Monthly Daytime LST (K)
lstd_temp_mod11a1v5_mod352000–present0.009°Monthly Daytime LST (K)
lstd_temp_mod11c1v5_maiac2000–2014 *0.05°Monthly Daytime LST (K)
lstd_temp_mod11a1v5_maiac2000–2014 *0.009°Monthly Daytime LST (K)
lstd_temp_mod11c1v5_fmask2000–present0.05°Monthly Daytime LST (K)
lstd_temp_myd11c3v5_mod352002–present0.05°Monthly Daytime LST (K)
lstd_temp_myd11a1v5_mod352002–present0.05°Monthly Daytime LST (K)
lstd_temp_myd11c1v5_maiac2002–present0.009°Monthly Daytime LST (K)
lstd_temp_myd11a1v5_maiac2002–2014 *0.05°Monthly Daytime LST (K)
lstd_temp_myd11c1v5_fmask2002–2014 *0.009°Monthly Daytime LST (K)
lstd_temp_mcd11a1v5_mod352002–present0.05°Monthly Daytime LST (K)
lstd_temp_mcd11a1v5_mod352002–present0.009°Monthly Daytime LST (K)
lstd_temp_mcd11c1v5_maiac2002–2014 *0.05°Monthly Daytime LST (K)
lstd_temp_mcd11a1v5_maiac2002–2014 *0.009°Monthly Daytime LST (K)
lstd_temp_mcd11c1v5_fmask2002–present0.05°Monthly Daytime LST (K)
amazonia_mask_mcd12q120120.009°Forests delimitation
amazonia_mask_mcdc12c120120.05°Forests delimitation
(*) Depending on the last MAIAC product available at the MAIAC FTP site.
Table 2. Description of the Thermal Amazoni@ system (data repository).
ModuleLinkDescription
Web sitehttp://ipl.uv.es/thamazon/webPresentation, news, updates, references, ancillary information
Viewerhttp://ipl.uv.es/thamazonVisualization of thermal anomalies using a Google Earth© Interface
FTP siteftp://[email protected]Data repository; Products available for download (free access)

