The Effects of Grout Curtain Parameters on Uplift and Piping Phenomenon; Case Study: Sattarkhan Dam

Department of Civil Engineering, Tabriz Branch, Islamic Azad University, Tabriz 51368, Iran
*
Author to whom correspondence should be addressed.
Hydrology 2019, 6(3), 71; https://doi.org/10.3390/hydrology6030071
Submission received: 31 March 2019
/
Revised: 16 July 2019
/
Accepted: 16 July 2019
/
Published: 17 August 2019
Abstract
:Design of earth dams and their issues during and after construction is very important for residents downstream of the dam because of the potential risks and possible breakdowns. In the design of dams, various forces influence the dam body, including uplift pressure and piping phenomenon which should be considered in order to ensure the safety of the dam. Among the measures taken to prevent the washing away phenomenon, the reduction of the output gradient, and the leakage discharge from beneath the hydraulic structures, construction of the grout curtain and installation of the drainage are applicable. Therefore, in order to investigate the effect of various parameters such as the gradient angle of the grout curtain, length, and distance and the number of grout curtains, as well as the length of the drainage on the pressure and output gradient of the numerical models, were considered in current study. For this purpose, the SEEP/W software was used for modeling on Sattarkhan Dam as a case study. The results of the analysis showed that the use of the Qa’im grout curtain at the upstream of the dam has the highest resistance against the pressure and piping phenomenon. The results also showed that increase in the length of the curtain of the water seal increases safety against uplift and piping phenomenon. The use of further spacing between the two grout curtains under the core of the dam led to increase in overall pressure or reduction in safety against uplift pressure. Increase in the length of the horizontal drainage reduced the effects of uplift pressure and output gradient. Results show that period of 70 to 110 degree is appropriate for curtain angle and setting curtain in upstream of dam core with angle of 70 to 80 degree is optimum and economic. A length of 30 m is optimum for curtain. The number of 2 curtains is also optimum. Studying various scenarios of distance of 2 curtains in dam core indicates that distance of 6 m is optimum and also length of 18 m for horizontal drainage is optimum.
1. Introduction
Following the construction of the dam, a large hydraulic slope is created upstream of the dam with regard to the downstream, which tends to leak and move the water from the upstream to the downstream. The purpose of the construction of the grout curtain and other sealing methods is to prevent or reduce this movement. Water leakage at the downstream can cause moisture increase, soil softness, vegetation cover, flow centralization of water, increase of springs, and rise in groundwater piezometric levels of downstream, and this will lead the dam to become completely unprofitable [1]. Escape of water stored behind dams through the dam, if there is no proper control, can cause serious problems for the dam. The biggest problem is an increase in the outlet gradient of water, which causes float of the soil particles at the heel of the dam and as a result beginning of the movement of them. To control leakage from the dam, methods are used to reduce water leakage. One of these methods is the drilling of a trench after the dam and filling it with plastic concrete aggregates, as well as considering the horizontal drainage.
In recent years, the behavior of different kinds of hydraulic structures is considered to be vital in all disciplines related to maintenance of infrastructures [2,3]. Therefore, various researchers have investigated the effects of water leakage on earth dams, as well as suitable methods for dealing with its adverse effects, which will be followed by some research hereunder.
Zoorasna et al. (1986) conducted a research on the Karkheh reservoir with clay core, in which the amount of leakage with the variable permeability coefficient of the water curtain was calculated, and with the change in the thickness of the drainage valve, the leakage rate is obtained. Zoorasna et al. (2008) investigated mechanical and hydraulic behavior of the water sealing core connection system in earth dams. The results indicated that increasing the hydraulic gradient in the bonding area of the core and the core usually results erosion and water leakage. Also, the difference between the hardness and the clay core and the concrete wall reinforces the concentration of stress and increases the deformation in the joint area [4]. Taormina et al. (2012) used an application of feed forward neural network to simulate hourly groundwater levels in a coastal unconfined aquifer in a Venice lagoon as a case study and could estimate the response of the aquifer under plausible future scenarios [5]. Mansuri and Salmasi (2013) studied the effect of horizontal drainage and water drainage walls on drainage and lifting pressure in a numerical model of an earth dam. They concluded that by increasing the depth of the water sealing wall, the amount of drainage from the body and the dam will decrease. Other results of this study include the insignificant effect of the water sealing wall position on the output flow gradient [6]. Moharrami et al. (2014) investigated the effect of waterproofing walls under hydraulic structures against lifting pressure and the phenomenon of piping. The results of this study showed that the use of sloping wall with angle of 70 and 90 degrees is one of the most economical in terms of increasing the safety of hydraulic structures against piping and uplift pressure [7]. Gholami et al. (2015) used dendrochronology and an artificial neural network (ANN) and tree-ring diameter change to simulate groundwater level fluctuation for a 100-year period in an alluvial aquifer in Iran and could estimate future groundwater level drought evaluation and drought period [8]. Hassan (2017) considered the combination of the genetic algorithm and finite element to obtain the optimum angle of inclination and the position of the grout curtain in a ratio of depth to the length of the curtain. Finally, they compared the results of the SEEP/W model to calculate the load pressure values and the flow output gradient, which had consistent matching results [9]. Nourani et al. (2017), using the SEEP/W model, investigated the optimal location of vertical drainage in weight dams. The results showed that the optimum vertical drainage area was not constant. By increasing the vertical distance between the drainages and decreasing the drainage diameter, the optimum location of the vertical drainage leads to the downstream [10]. Tan et al. (2017) used the combination of the Monte Carlo method and finite difference to calculate the flow rate. Also, the effect of the coefficient of variation and the correlation coefficient of hydraulic parameters on the flow rate has been compared [11]. Sci and Circumiectus (2017) used a two-dimensional HYDRUS numerical model to estimate the amount of flushing. The model is verified with data measured from the dam [12]. Aghajani et al. (2018) have investigated the effect of water sealing walls on the flow rate of earth dams with clay core [13]. Shende and Chau (2019) used an analytic element method (AEM) based on logistic function to optimize the distance of pumping well for effective riverbank filtration [14].
Water resource management and development has usually been considered as a strategic tool. The concept of hydraulic mission confirms this strategic opinion. The hydraulic mission and the related concepts of water management are discursive processes that occur at the domestic and international aspects. Hydraulic mission refers to a paradigm change regarding issues related to the water resource development, management, and ownership. Hydraulic mission means ambitious hydraulic development projects are conducted by the governments not only attend to keep peace and stability at the domestic level, but these are also the strategic tools to increase influence abroad and the task of the political context to think why such initiatives abroad are successful or fail [15].
In this paper, Sattarkhan Dam was chosen as a case study. Sattarkhan Dam is made on Aharchai river. The hydraulic mission of Sattarkhan Dam is agriculture and drinking usage. It is also important because of adjusting the surface flow of Aharchai. Different scenarios of grout curtain and horizontal drainage are studied in order to get closer to optimizing the design of earth dams. Therefore, in this paper, in order to accurate study of effect of various parameters, including the angle of slope of grout curtain, various lengths of curtain, distance, and number of curtains, and the effect of length of drainage on uplift pressure and exit gradient, a numerical model is made by SEEP/W finite element software.
In addition of this scenarios, various scenarios can be studied for optimizing the geometric dimension of earth dam, vertical drainage, and upstream blanket. In order to avoid prolongation of modeling process and decreasing number of models, and because of the importance of grout curtain and horizontal drainage, only these two parameters is studied. So, the effect of various scenarios of curtain and drainage is shown in continuation and the optimum amounts are found.
Numerical modeling can be used for studying earth dam stability, dynamic strength, seepage prediction, determination of output gradient, etc. In this paper, optimization of dam structure is studied because of its importance, and in the results section, the effect of various scenarios is studied and an optimum scenario is extracted for each parameter.
Dam optimization causes economic considerations and decreases extra costs. Optimization can be the best method of designing and execution to access to purposes of dam building. Also, after building and operation of the dam it may causes some problems and it may be needed to make some changes in different parts of the dam such as horizontal drainage. It looks necessary to study and check conditions of the dam and compare various scenarios of different parts of the dam to choose the optimum scenario.
In this paper, it is shown that using curtain and horizontal drainage plays great role in decreasing seepage, uplift pressure, and maximum output gradient. Also, the study of various scenarios for intended parameters caused the optimum method of design and economic execution of dam. Optimum results of this paper causes decreasing building costs of dam and have great economic quality and timing effects on maintenance and repairs in future.
2. Materials and Methods
Modeling water flow in soil can be complicated by using numerical methods. The natural soil is generally heterogeneous and to some extent, boundary conditions change with time and cannot be defined with certainty at the beginning of an analysis. These complexities require the use of numerical methods to analyze the problem of leakage in all cases except for simple problems. A common approach is the use of finite element relationships.
There are various models for various parameters in Geo-studio package, such as dam stability and dynamic strength. In this paper, in order to study the effect of parameters in leakage, the SEEP/W model has been used and various models such as artificial neural network can also be used for optimum design of the dam. The advantage of the SEEP/W model advantage is that it is user friendly. This model gives acceptable results and has been used to study of leakage and other earth dam problems during years.
In this paper, the SEEP/W model of the GeoStudio package is used for modeling. This software, based on the finite element method, is used for the study of leakage and water flow in the soil and, in general, the distribution of pore pressure in porous media such as soil and rock. In this section, the modeling of the flow of water through the soil, the flow calculations for a specific section, and the drawing of flow lines and potentials are considerable. Also, SEEP/W, in addition to the analysis in the lasting conditions, is capable of modeling the rapid drain conditions and creating a quick discharge function of the reservoir in time. It is possible to model reservoir filling conditions, semi-saturated conditions, permeability functions, and volumetric soil moisture functions, and continuous consideration of each other in computing is another important feature of this software.
Study Area
Various dams could be chosen as a case study, but their data were not available or were incomplete. Only Sattarkhan Dam’s data was complete and available. Sattarkhan Dam is very important because of agriculture and drinking usage. So, Sattarkhan Dam was chosen as a case study because of importance and data availability.
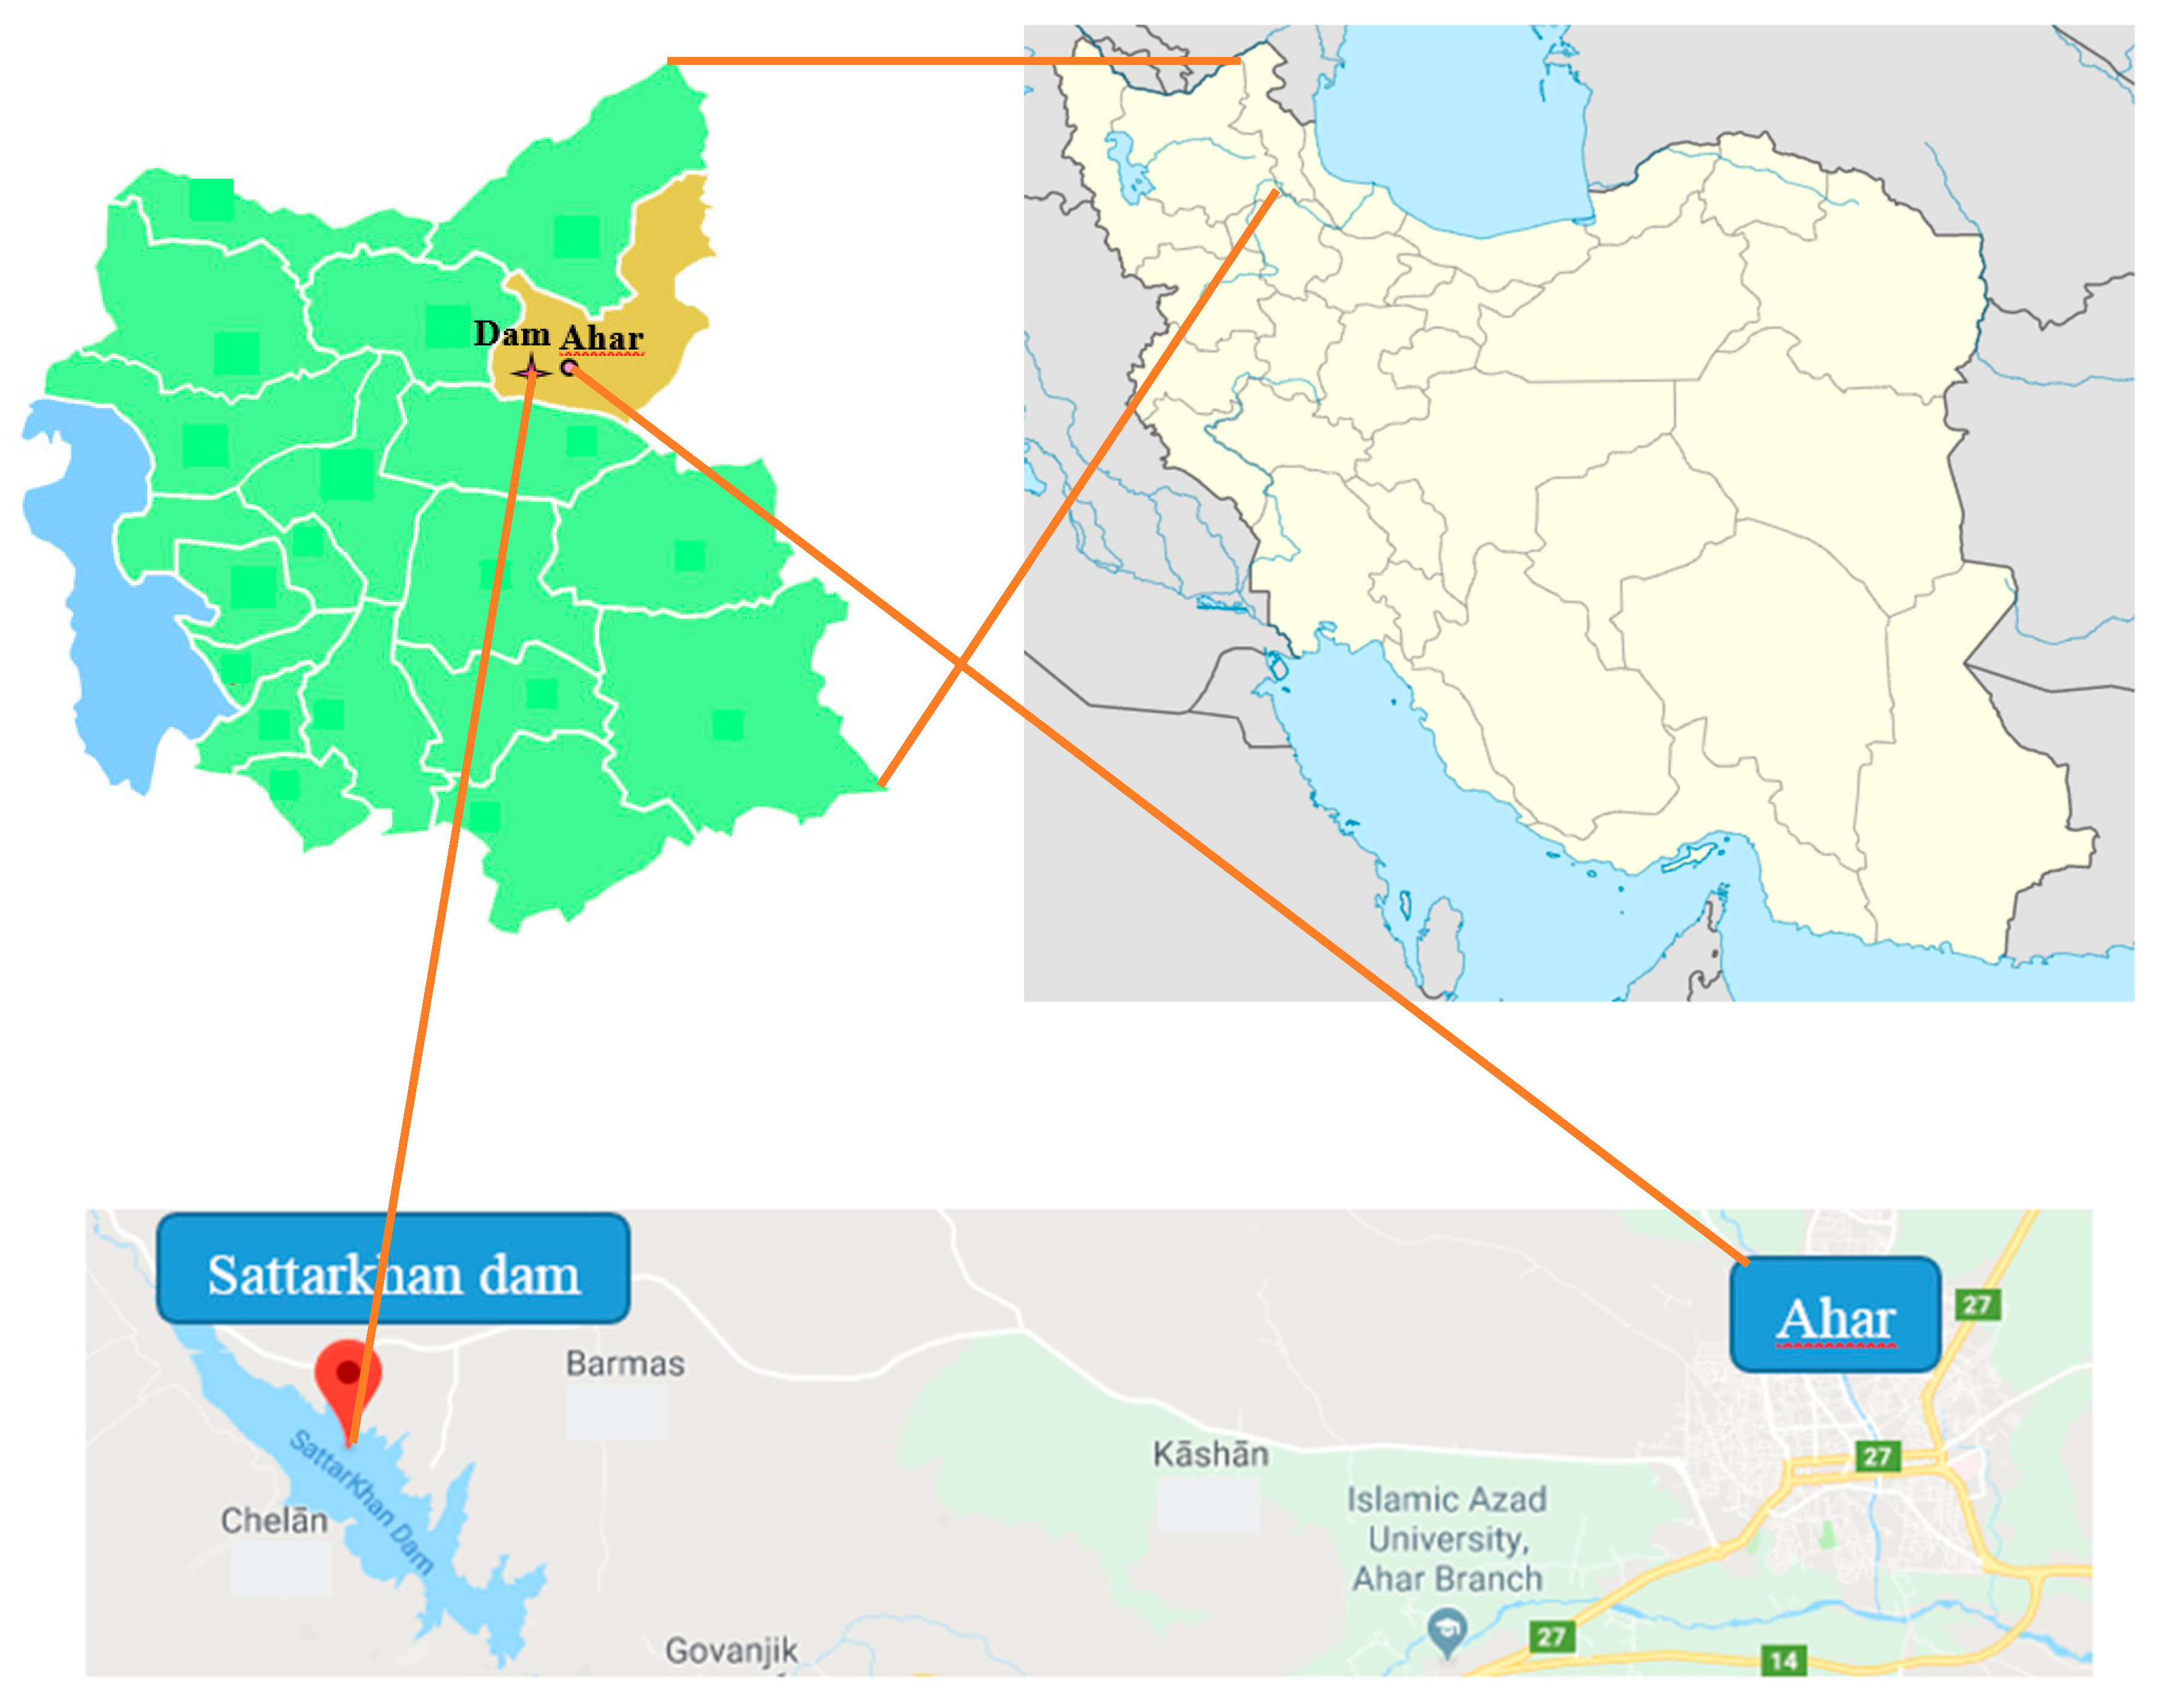
Sattarkhan Dam is located on the Aharchay River in order to control and regulate the Ahar River surface flows and provide required water for some of the lower agricultural land and the water supply of the city of Ahar. In Figure 1, the location of Sattarkhan Dam is shown.
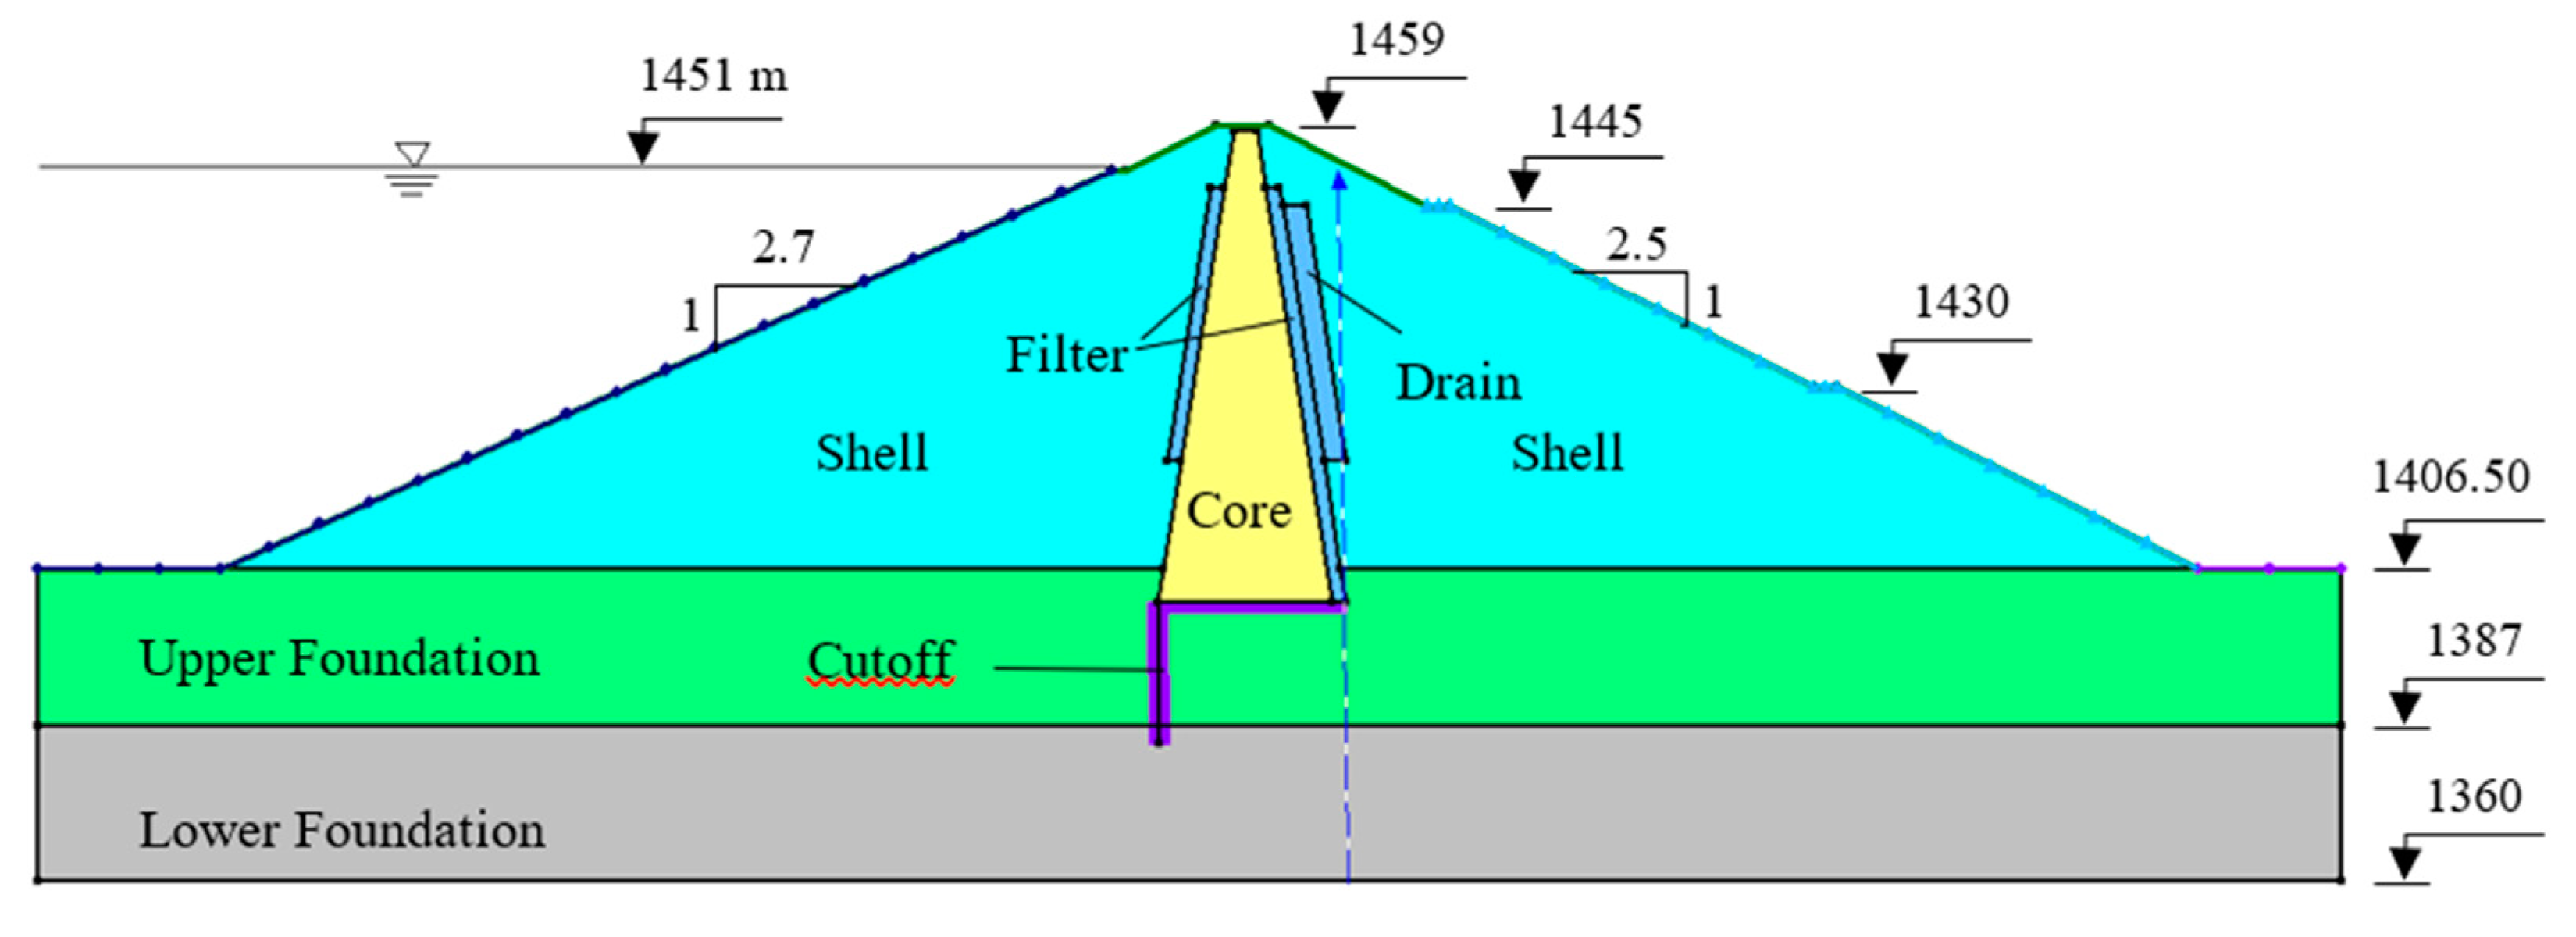
Sattarkhan is an earth dam, and its reservoir volume at normal level of water is 135 million cubic meters and its useful volume is 120 million cubic meters. The length of the lake formed from this dam is 8 km in normal water level and area of 2.7 square kilometer. Sattarkhan Dam has topographical and geological features. The dam is built in a steep slope of the valley. Also, the bedrock and supports have a layered structure that lies along the river and extends throughout the dam, from the dam to the downstream lands of the river and with the potential way for water to escape from the bottom of the reservoir. Also, the existence of three fault zones which were started from inside of the reservoir and extending downwards increases the complexity and risk profile of the dam site. In Figure 2, dam components and the height of components is showed.
3. Results and Discussion
In order to achieve the research objectives, the changes in the uplift, the maximum dam outlet gradient, and also the variation of the discharge velocity of the dam in various states of the change in the length, angle, number, and spacing of the damper were evaluated, and by plotting the corresponding diagrams, the case study has been analyzed. Additionally, changes in horizontal drain position and drainage ratio are investigated in relation to the width of the barrier section and their impact results are presented. To achieve the research objectives, a large number of numerical models of different scenarios have been created and analyzed.
Various permeability can be assumed for grout curtains, which can be located in various places. Also, studies of various scenario numbers, spacing and angle of curtains can be added. However, because of avoiding prolongation of modeling process and decreasing number of models, the mentioned parameters are not studied. Meanwhile, we tried to study the kinds of scenarios that are better executable. By comparing various scenarios, optimum amount for each scenario is provided.
In choice of study parameter sets, we tried to choose the kind of amounts that are better executable. For this reason only, these sets have been studied. The effects of each set on uplift pressure and maximum output gradient are discussed in results section.
In the preparation of the models, the effect of changing the effective parameters on uplift pressure and piping phenomenon from the underneath of the dam is investigated. In each series of models, only one parameter has been changed while keeping of all others constant, and at the end, by comparing the results, suggestions are given regarding the position, angle, and optimal length of the drain and horizontal grout curtain.
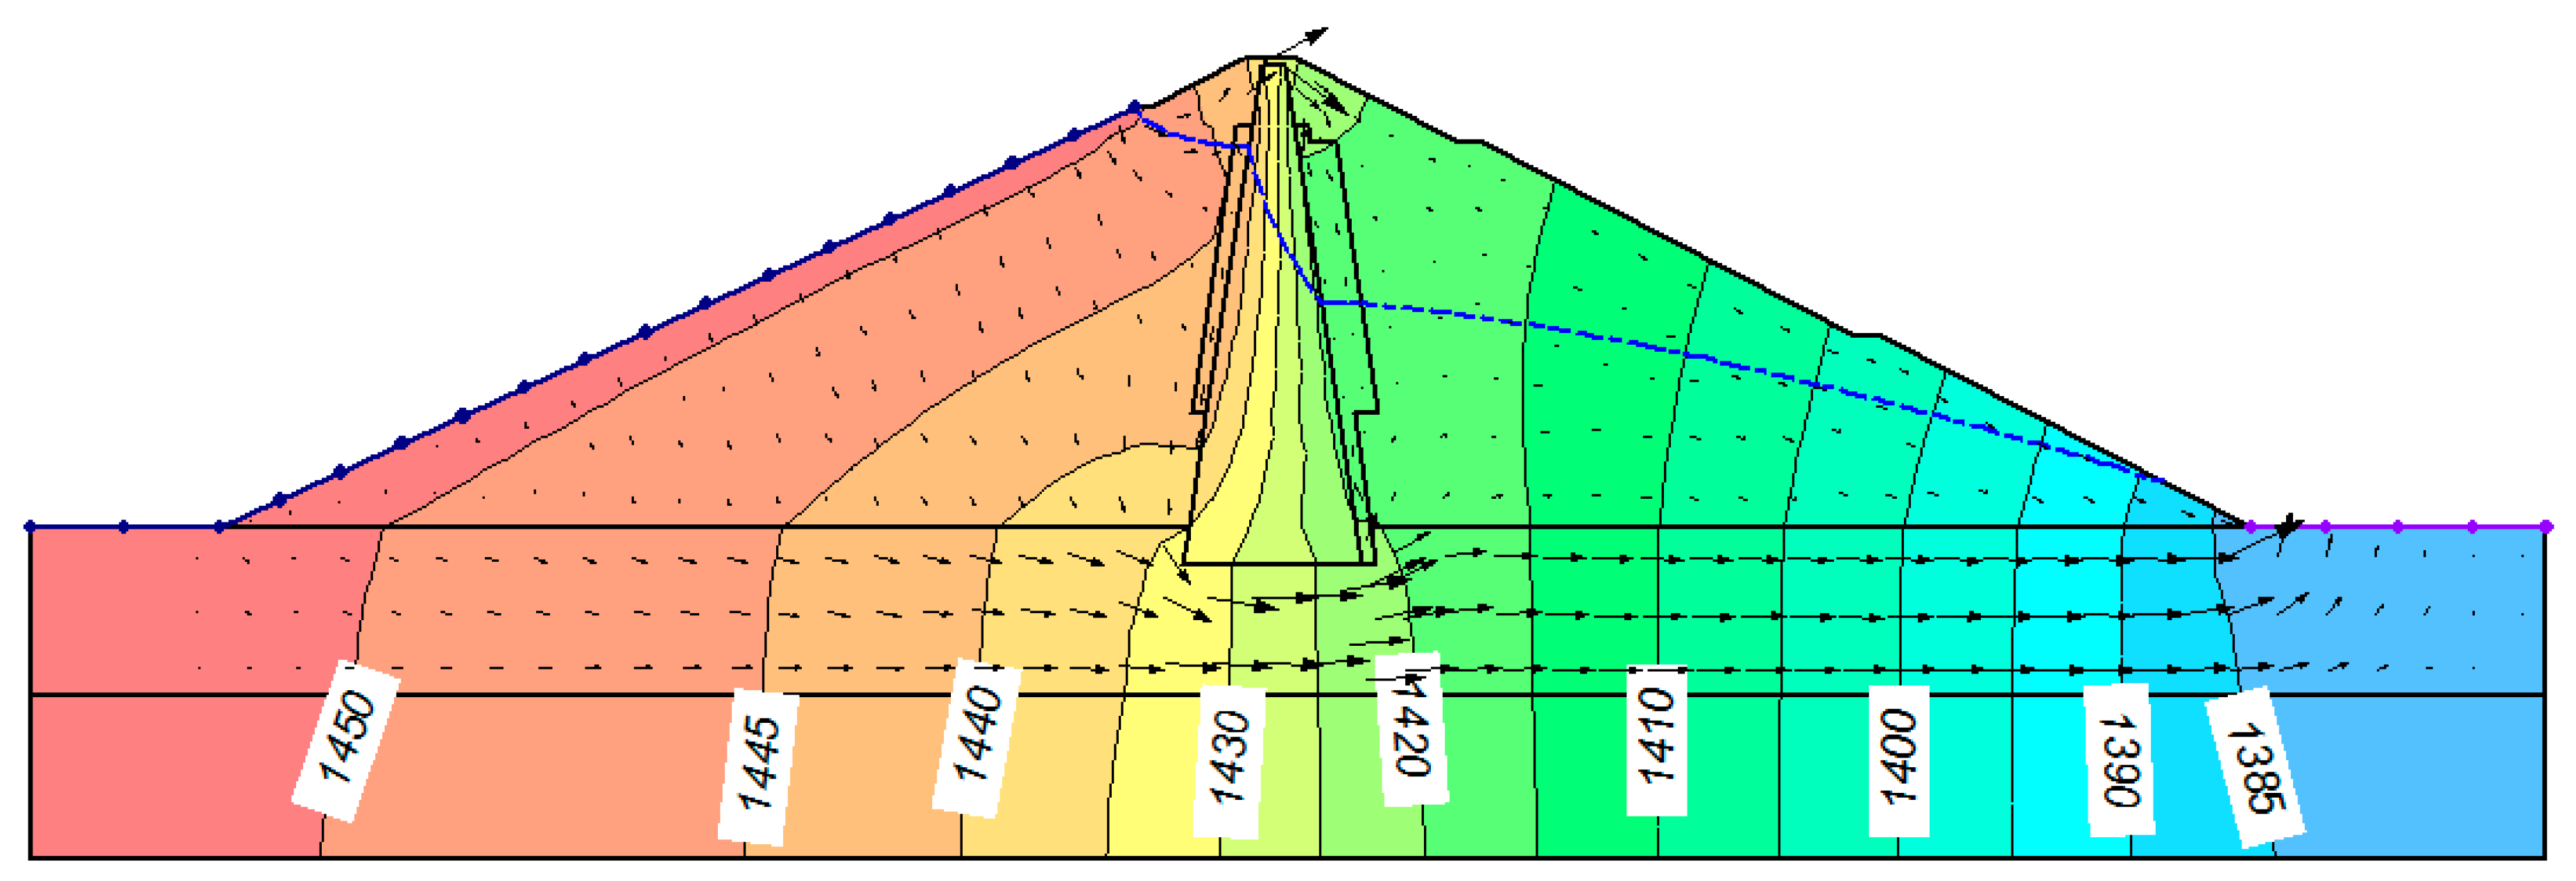
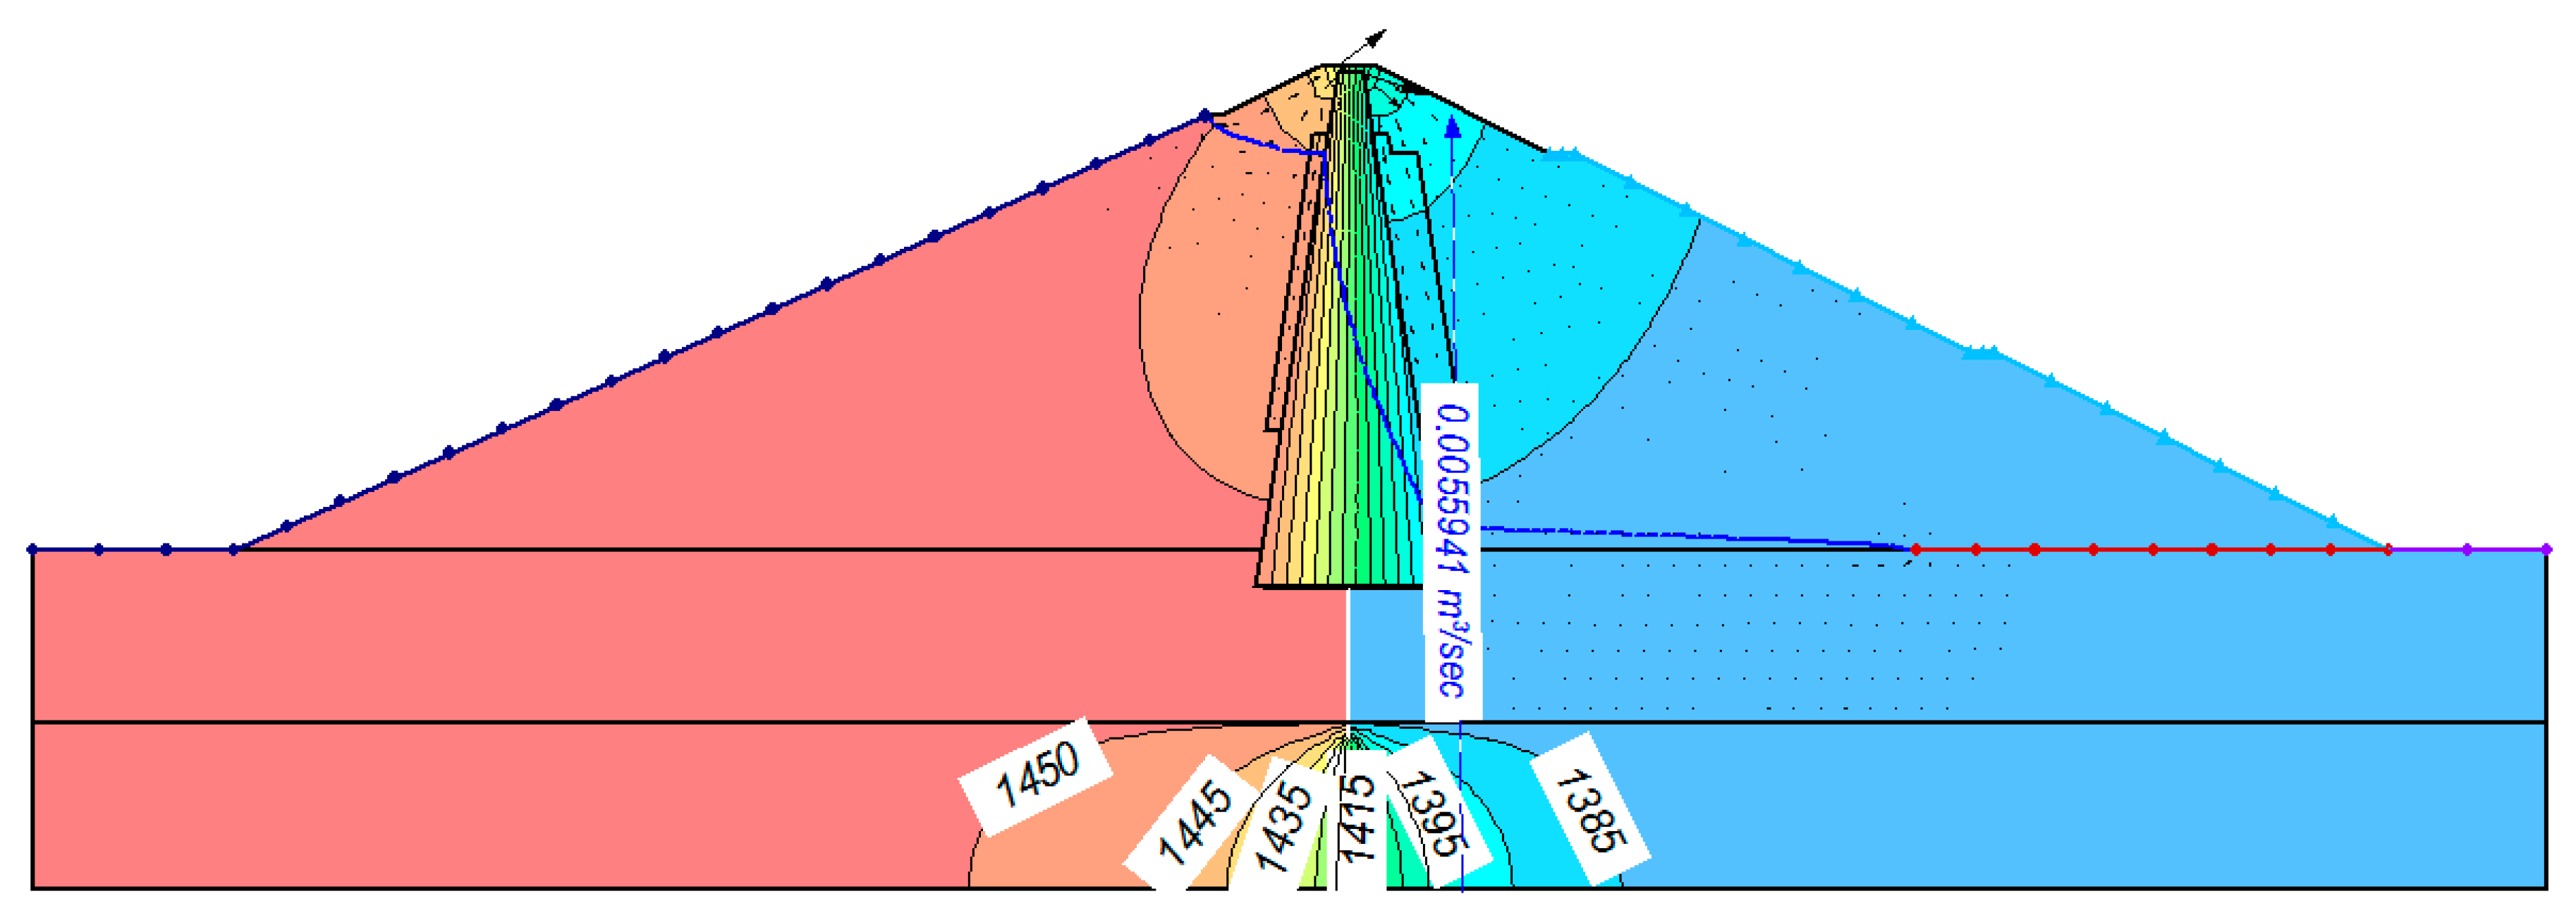
First, the analysis of leakage, water flow analysis, velocity vector, flow lines, and calculation of flow through the dam have been investigated. In the Figure 3 and Figure 4, the flow lines passing through the body and the porosity pressure and flow rates for the Sattarkhan Dam are shown respectively. According to the shape, the flow through the bottom of the dam without damping is 3.38 × 10⁻² .
3.1. Validation
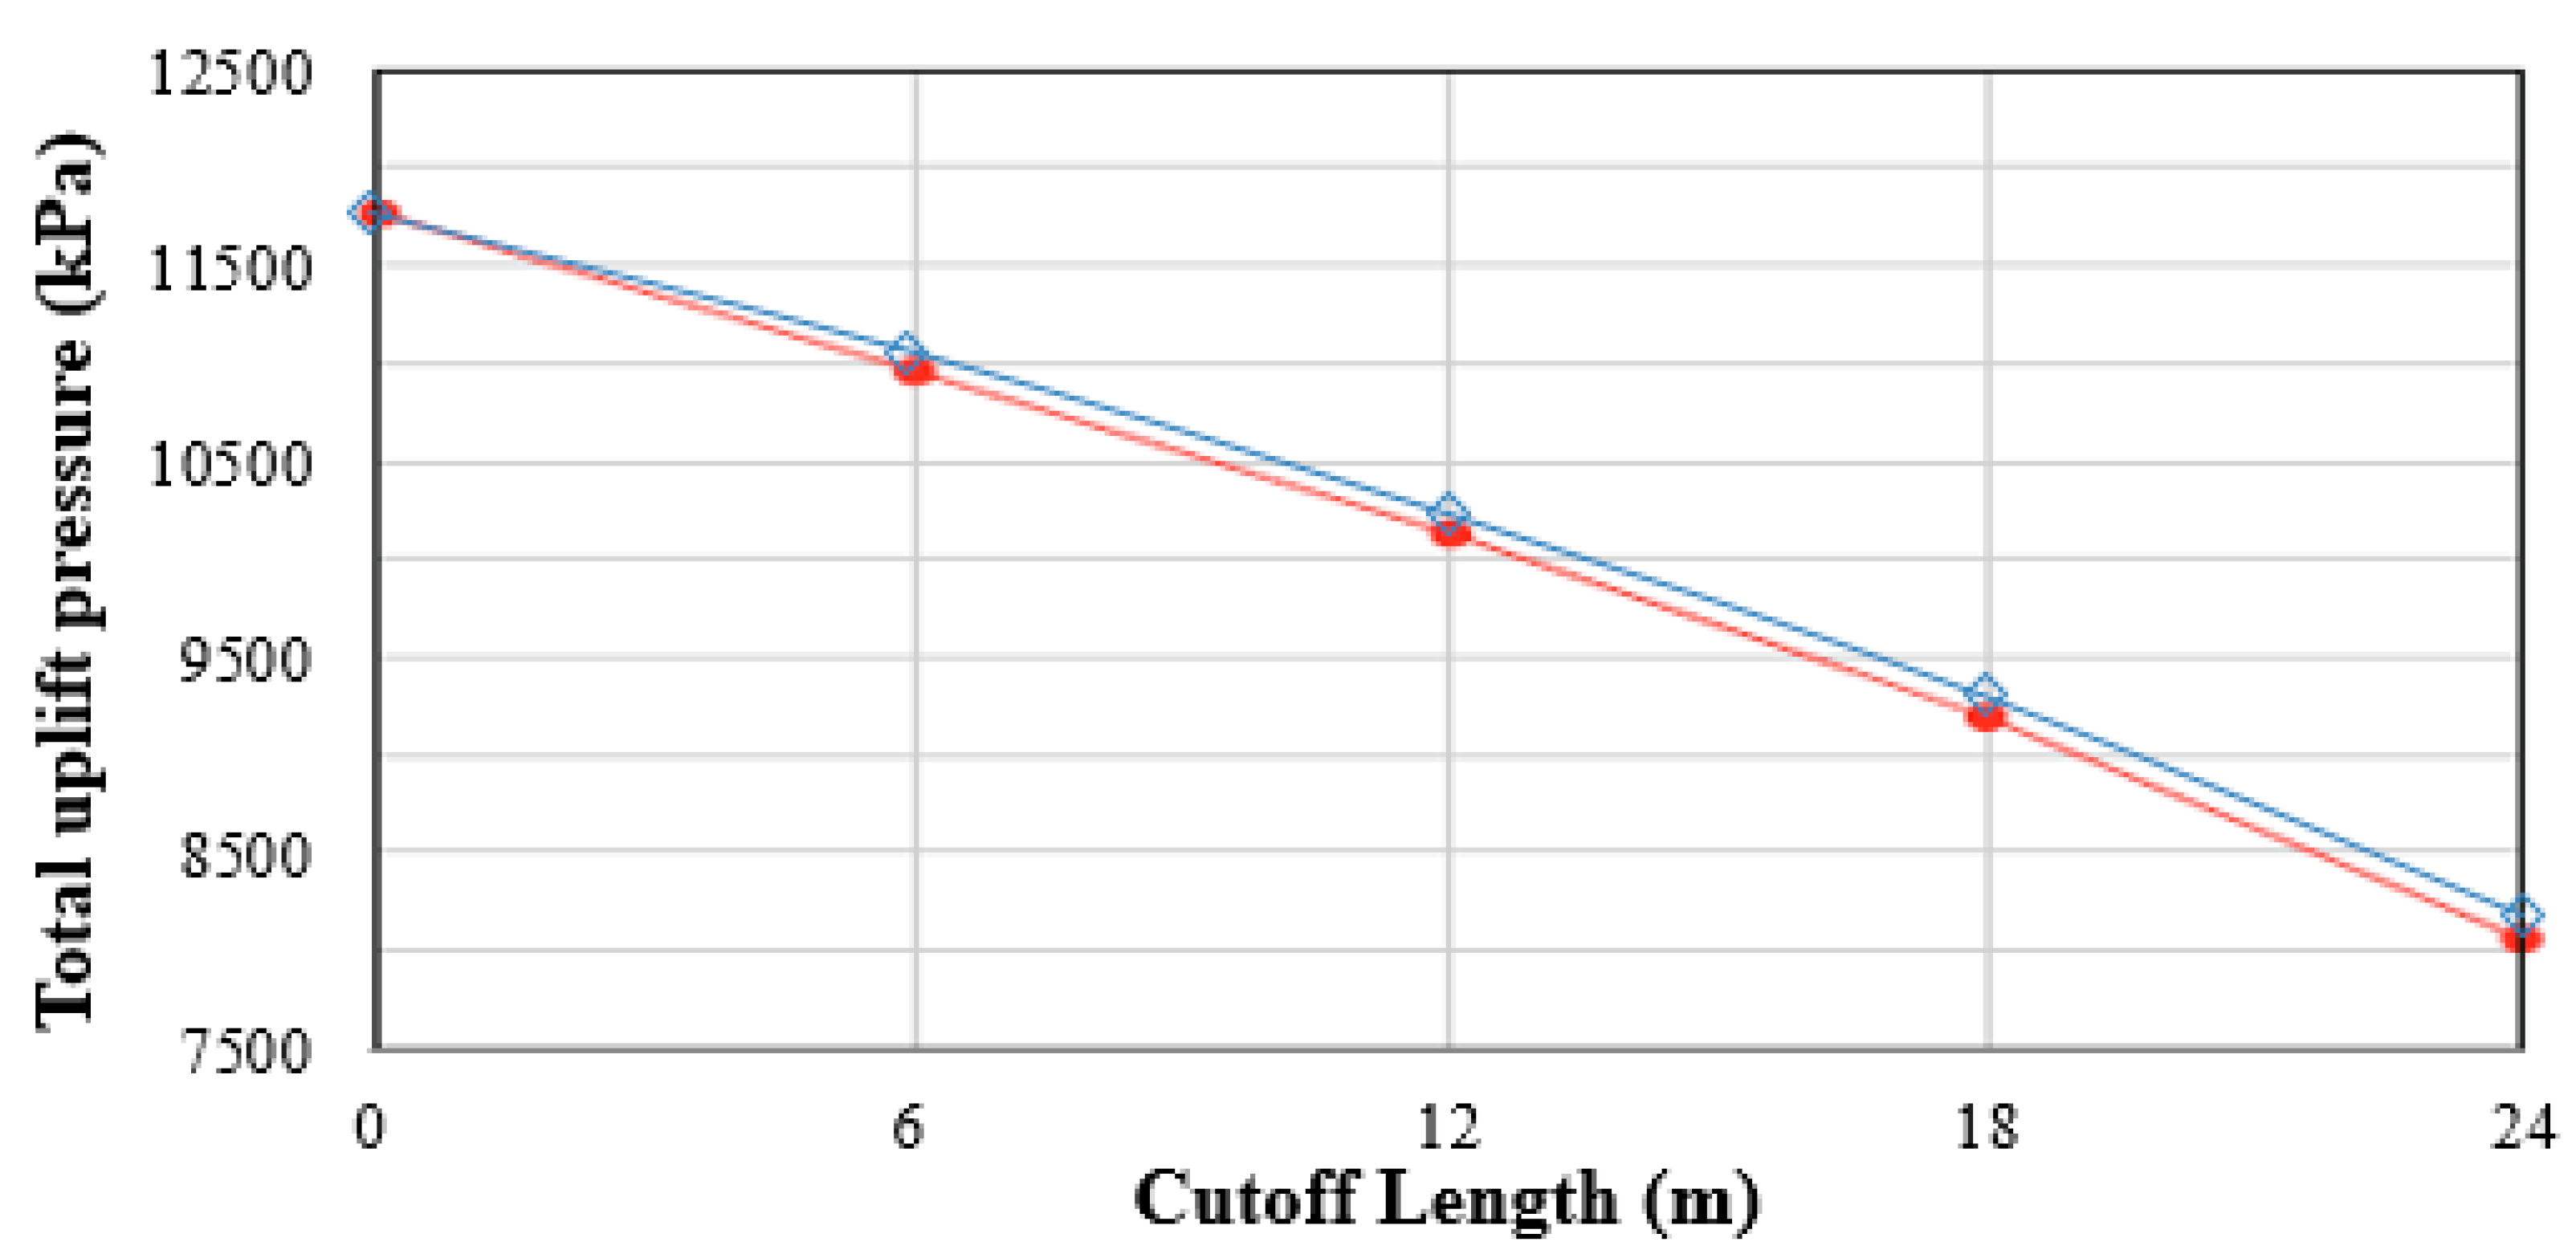
For validation, the model of research of Moharrami et al. [7] is modeled and the results is compared. Moharrami et al. studied the same parameters and scenarios of this paper by using SEEP/W model. By inserting that model’s data in software, the intended model was validated. Then each scenario was studied. The results and charts of various scenarios were a close match to each other. In Figure 5, for example, the chart shows a relationship between uplift pressure and curtain length. The red points and lines show Moharrami’s model and the blue points and lines indicates results of validation model. As can be seen in Figure 5, the results are a good match with each other.
3.2. The Effects of the Angle of Grout Curtain
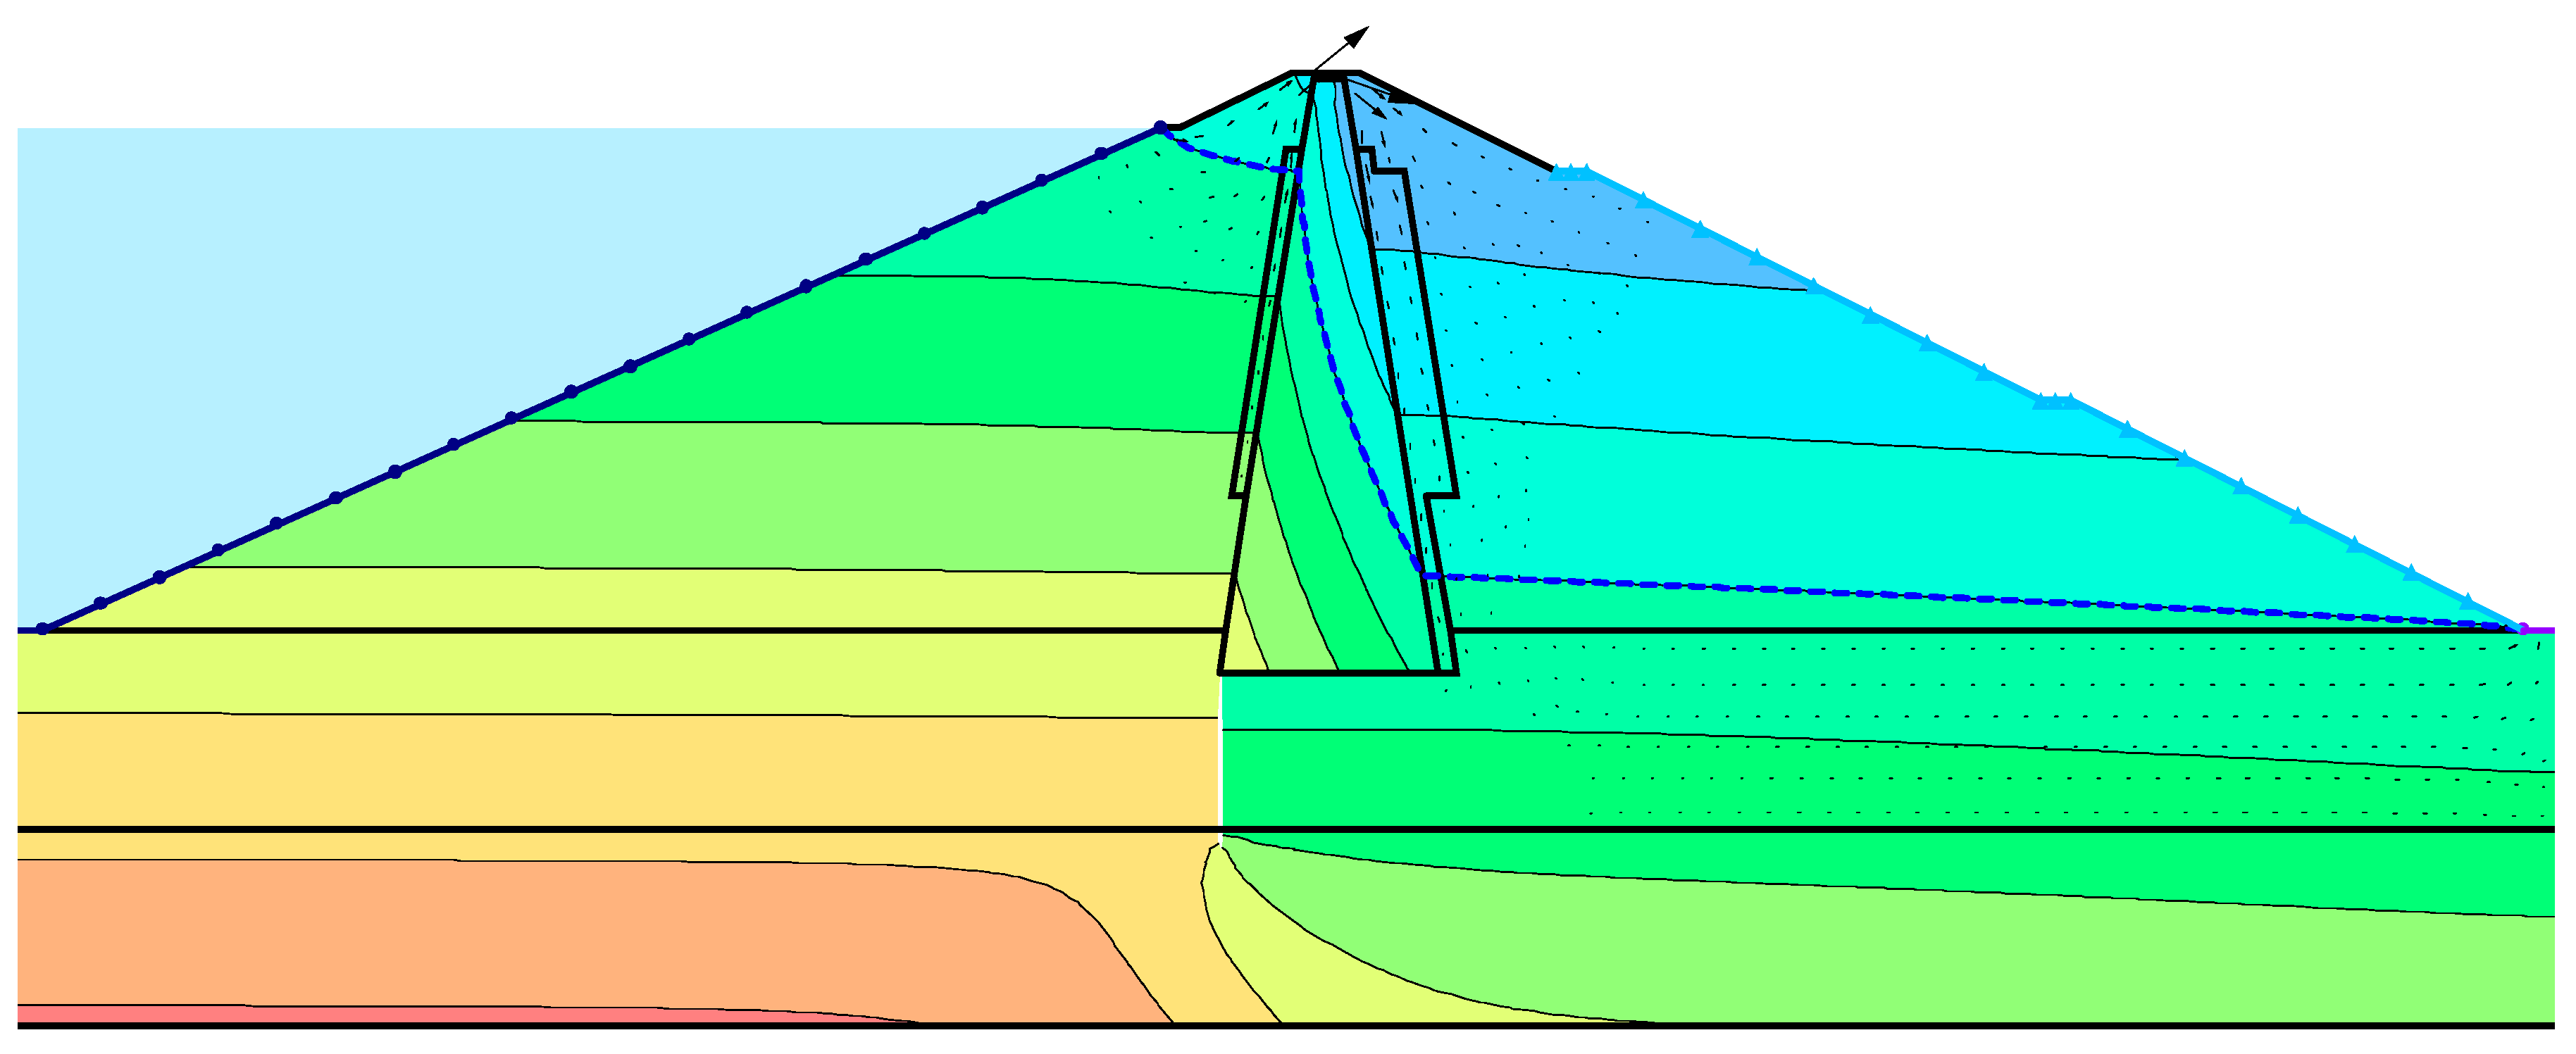
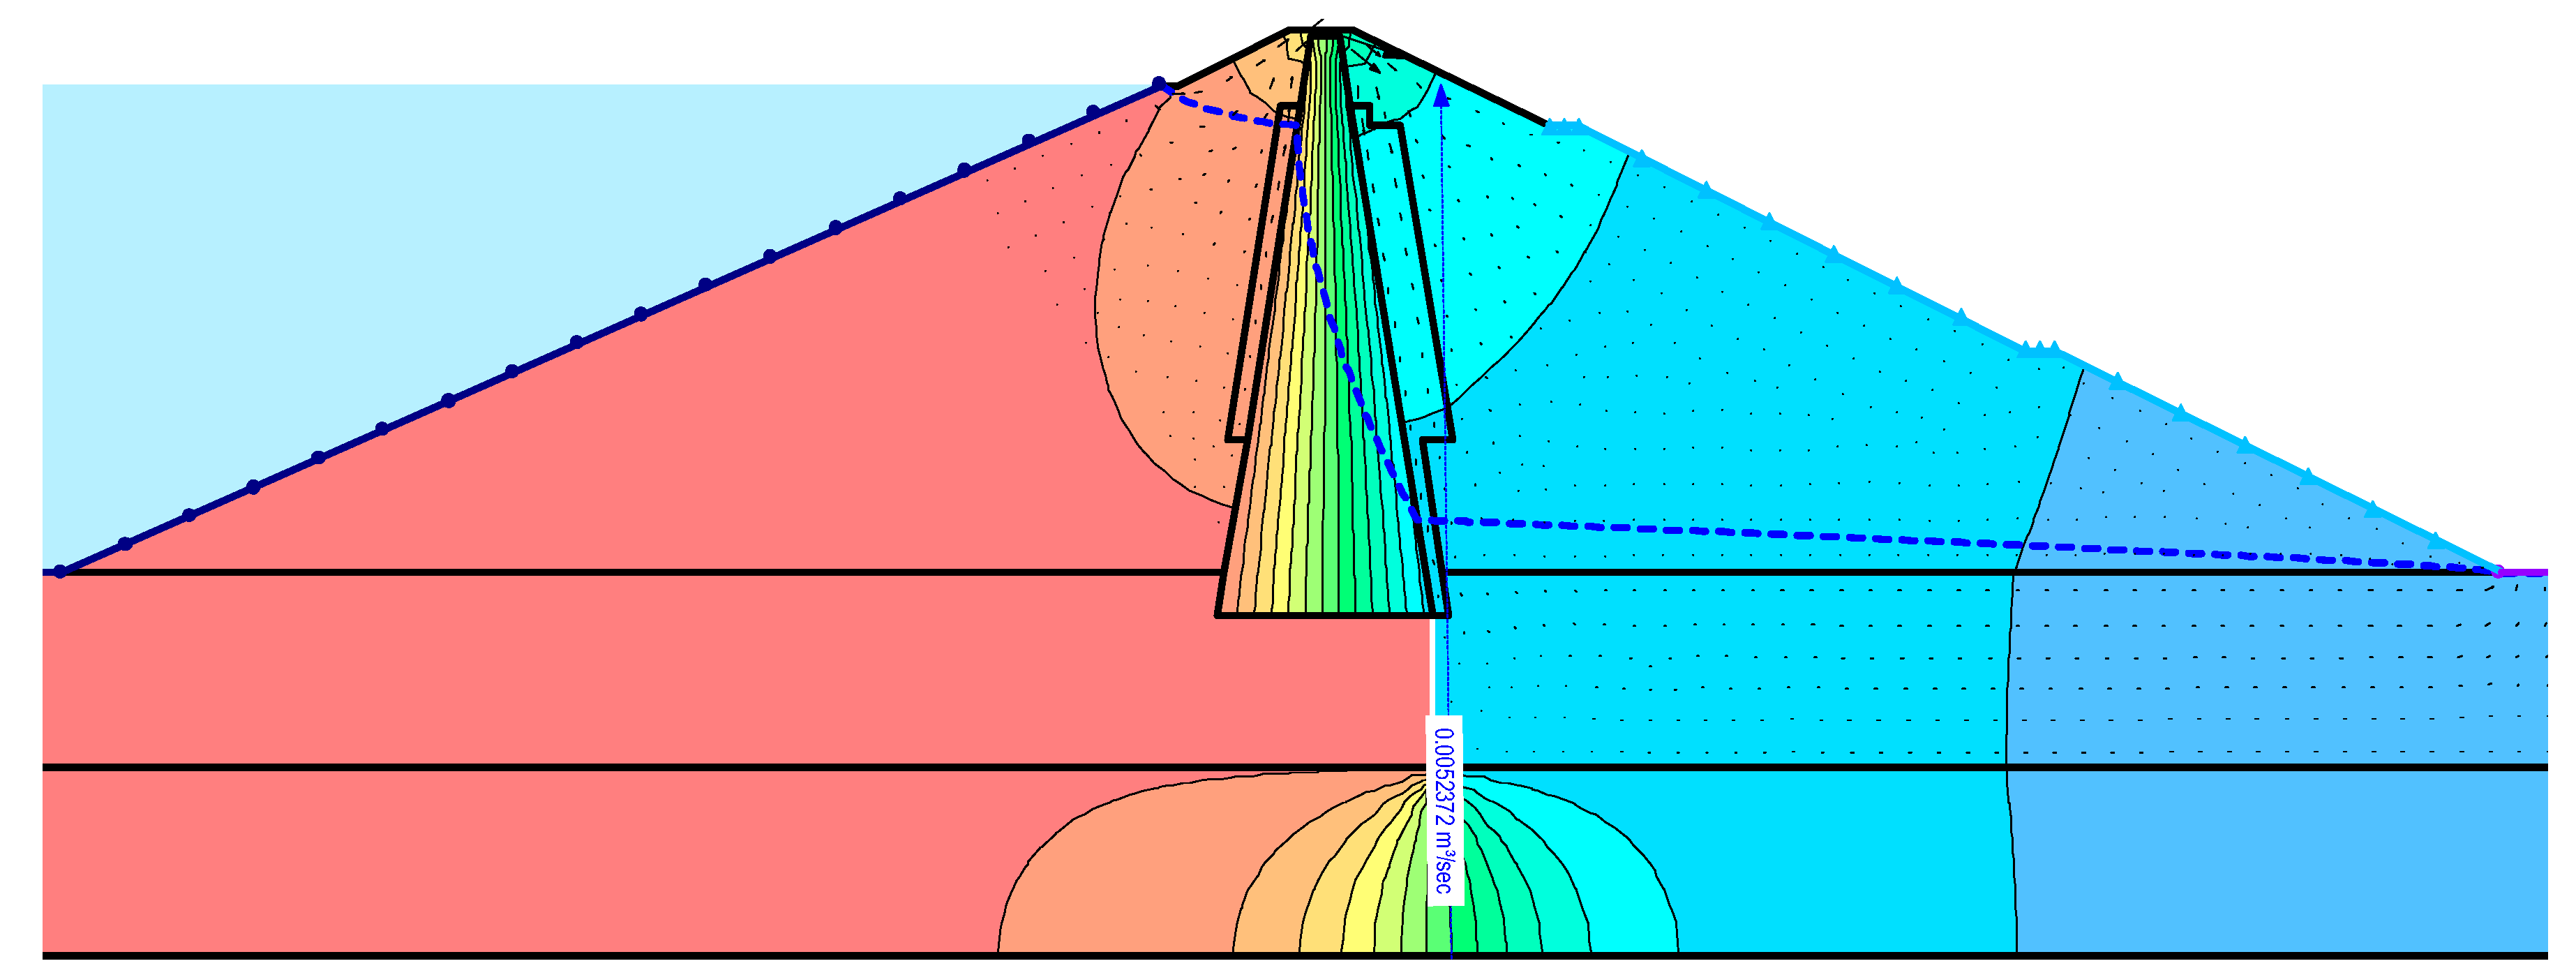
In Figure 6 and Figure 7, the effect of executing the curtain of Ghaem with 25 m length, on the lines of water flow and the flow of water passing through the dam, respectively, are demonstrated for the curtains in the upstream and downstream of the dam, respectively.
In this section, the effect of the angle of the curtain on the total uplift pressure, as well as the flow rate from the bottom of the dam, is investigated for the two cases of the flow from upstream and downstream of the dam. For this purpose, 15 models are considered for each of the curtains on the upstream and downstream, with the angles of 10°, 20°, 30°, 40°, ..., and 150°.
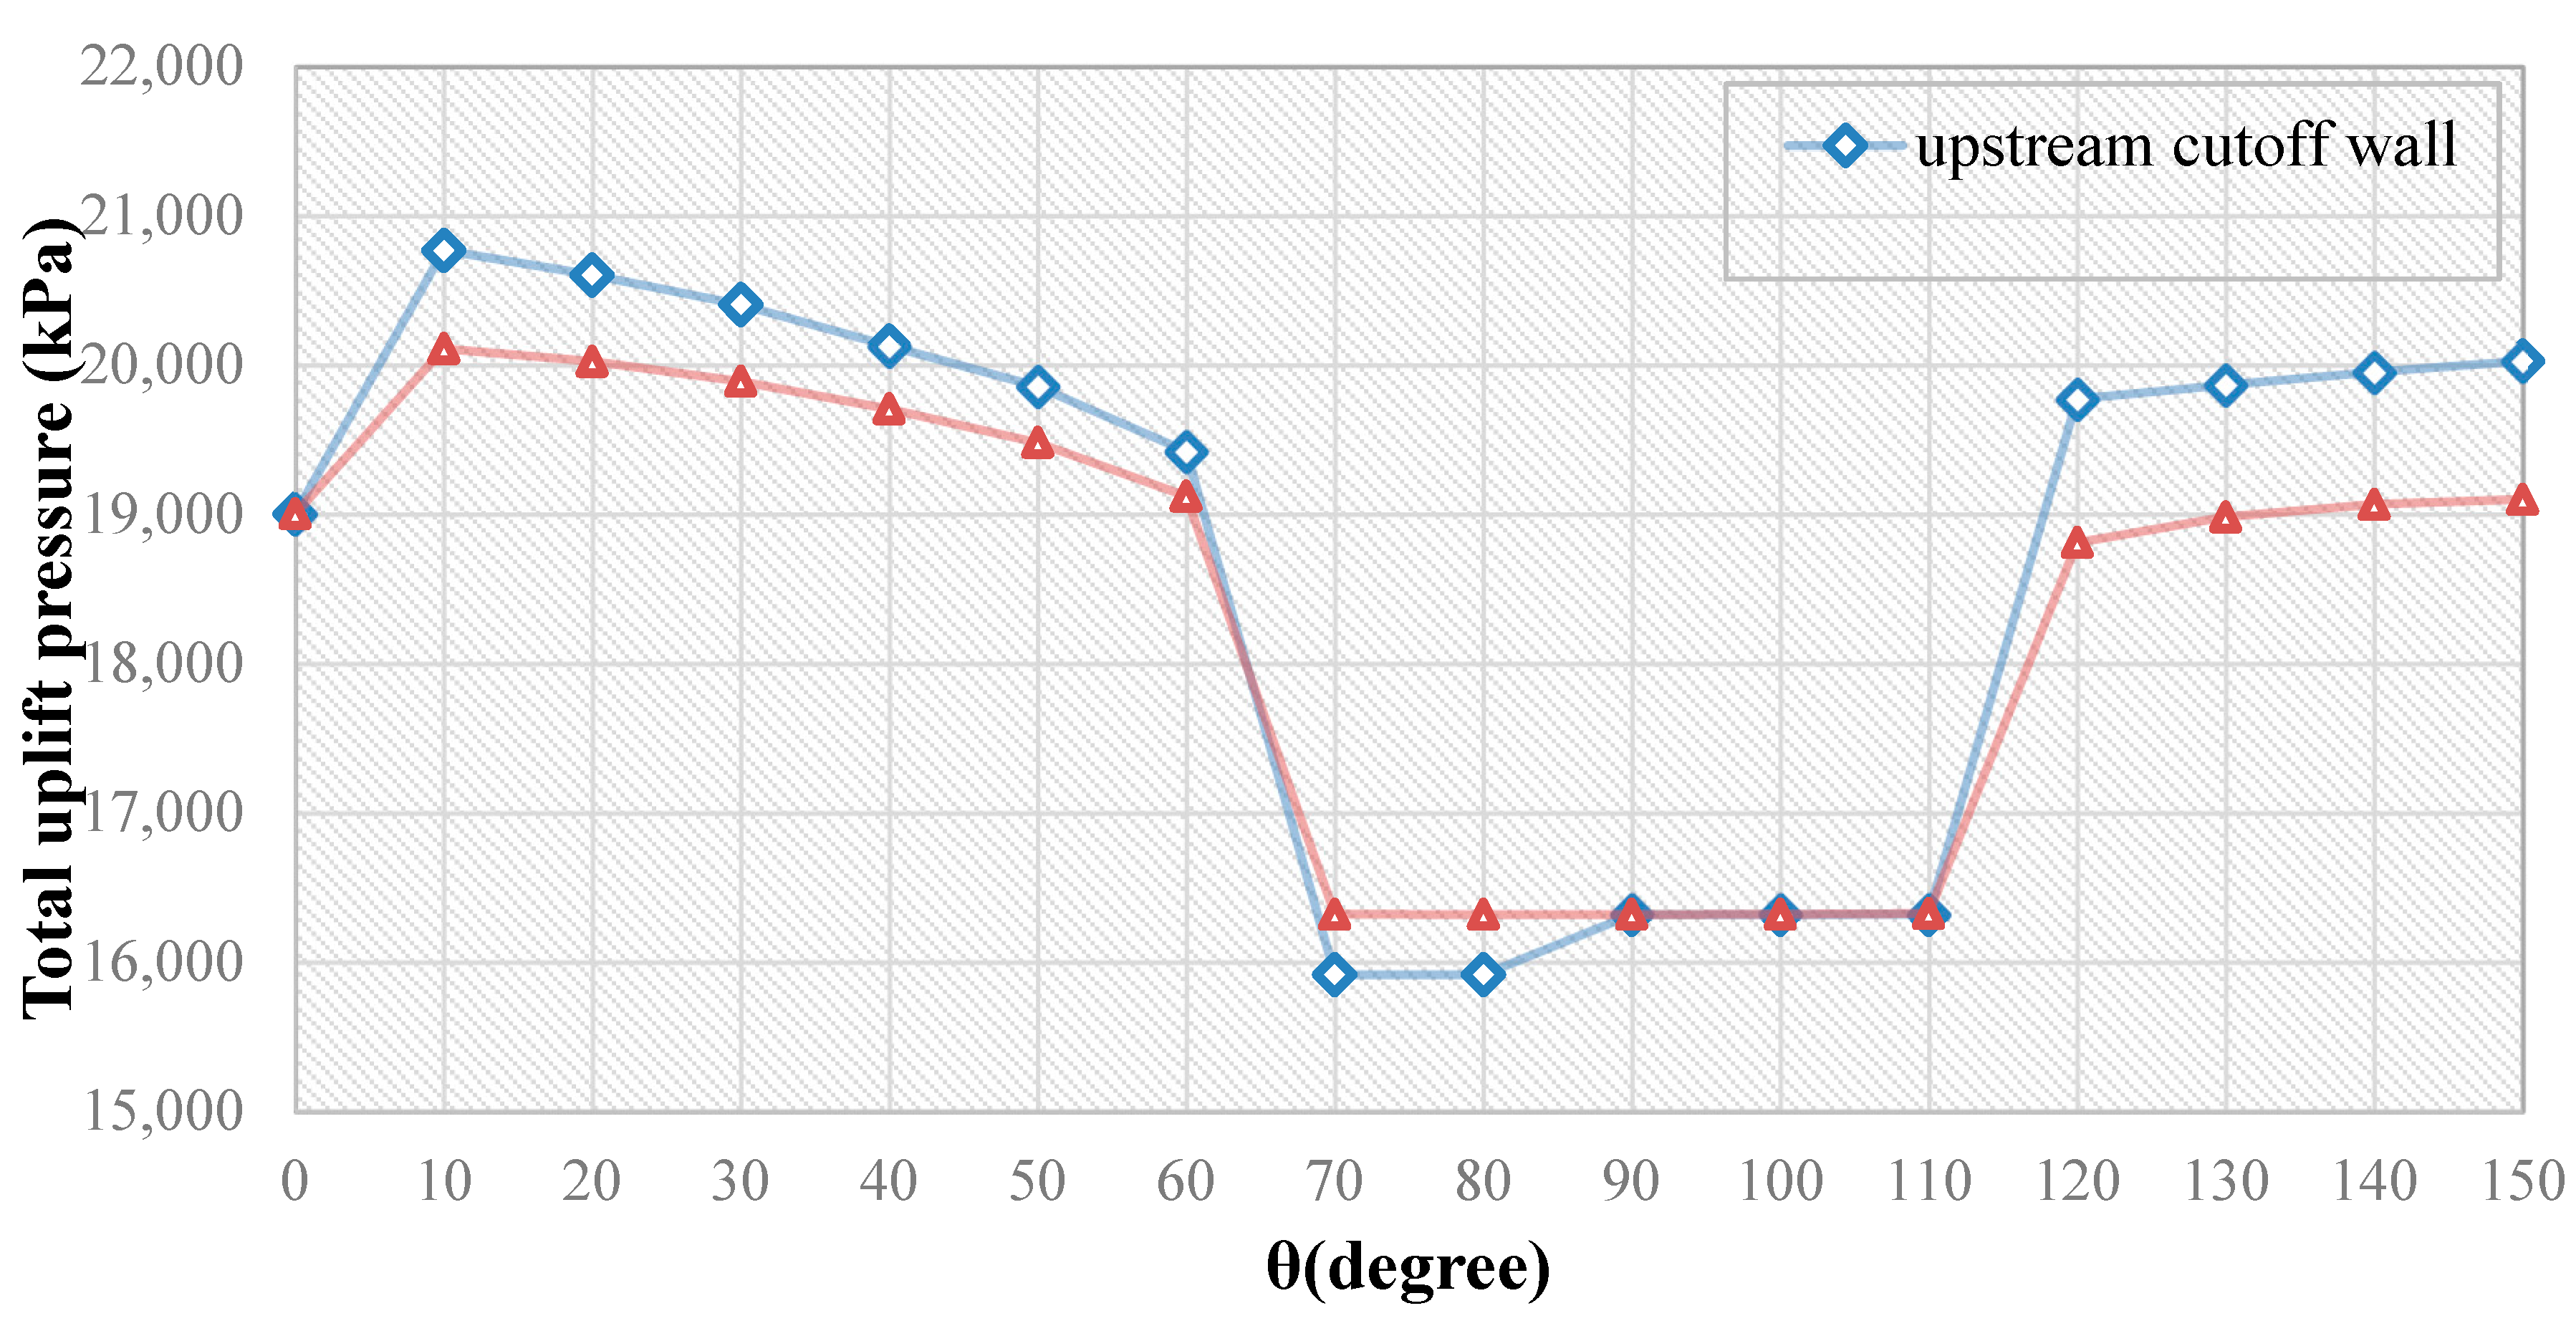
Figure 8 shows the effect of the angle of inclination of a grout curtain on the upstream and downstream of the Sattarkhan Dam on the uplift pressure.
According to Figure 8, increasing the angle of curtain from 0 to10 degrees causes increase of uplift pressure. So, for the angle degree of 10, uplift pressure is the maximum and most inappropriate angle. Then, from 10 to 70 degrees, uplift pressure has the most decreases. In the period of 70 to 110 degrees, uplift pressure is almost constant and has the minimum amount in chart. So, the period of 70 to 110 degrees is appropriate and economic. From 110 to 120 degrees, a high increase is shown in uplift pressure. From 120 to 150 degrees, uplift pressure increases, too. For 2 types of study of setting curtains upstream and downstream of the dam core, uplift pressure is almost equal for both types in angles of 90, 100, and 110 degrees. In angles of 70 and 80 degrees of curtain, uplift pressure in upstream of dam core is less than downstream of dam core. So, setting curtain in upstream of dam core with angle of 70 and 80 degrees is optimum and economic. For other angles of curtain, uplift pressure in downstream is less than upstream.
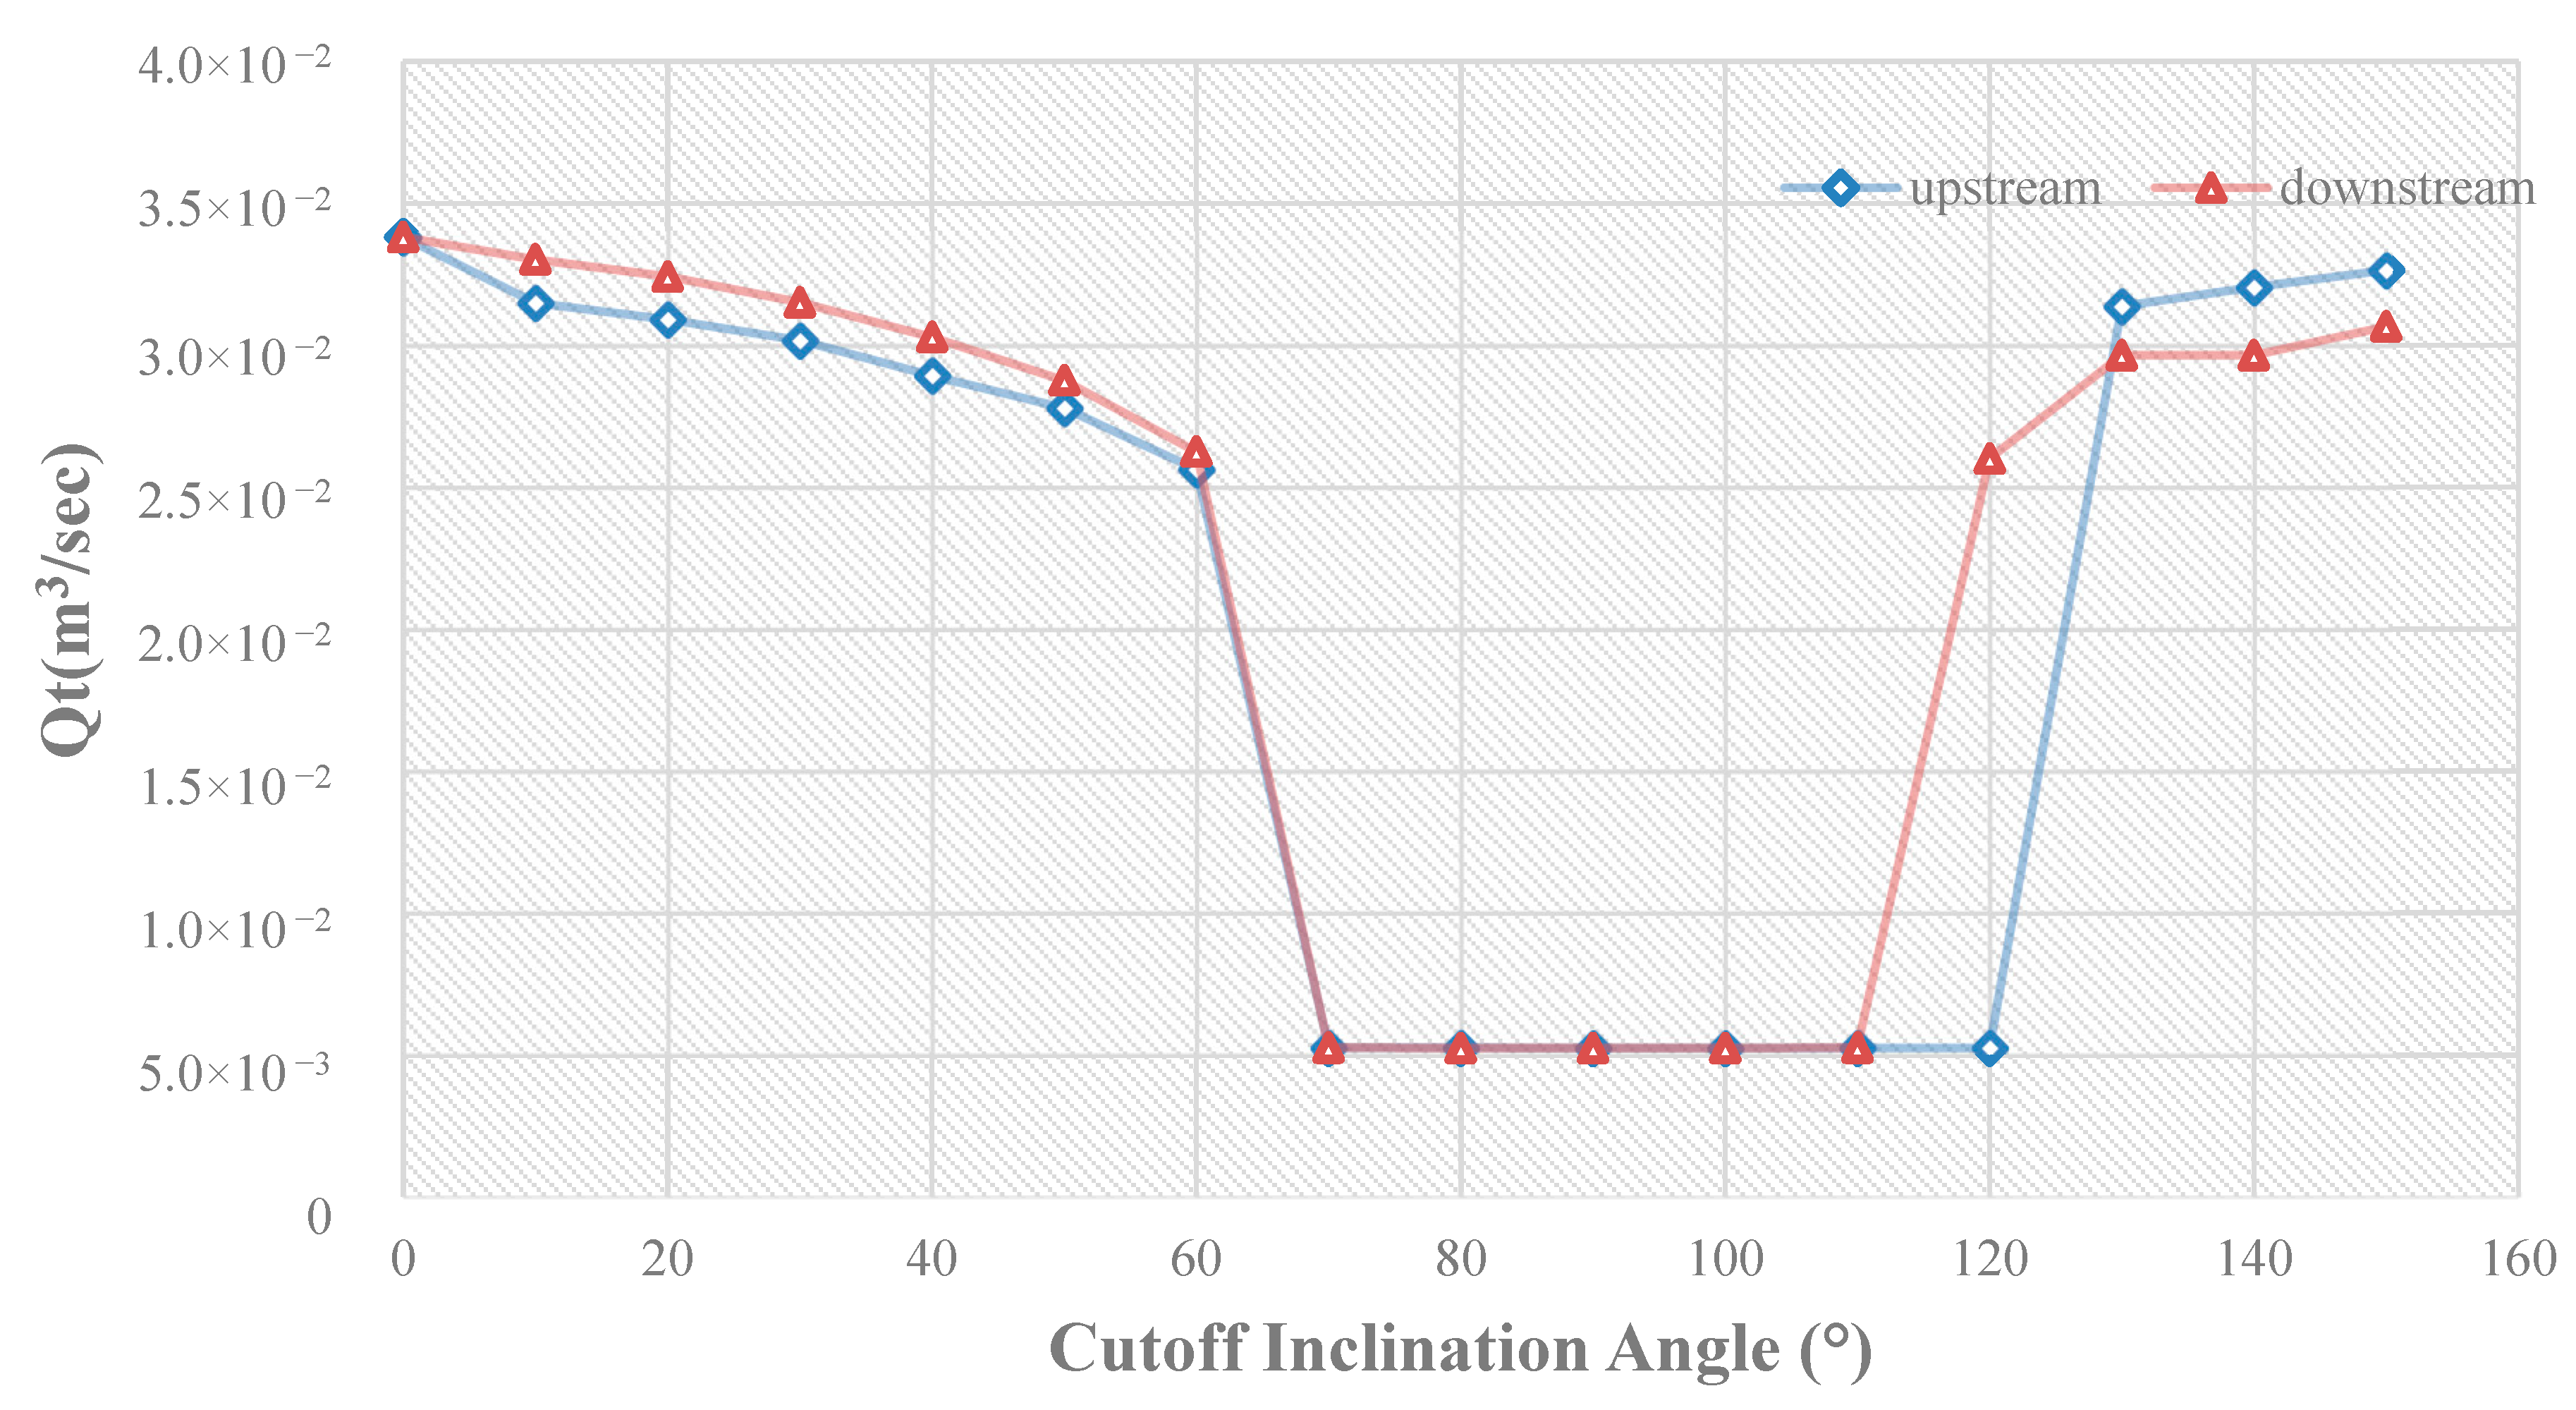
Figure 9 shows the effect of the angle of the grout curtain on the upstream and downstream of the dam and its effects on the discharge passing from underneath the structure. The cross-sectional view of the dam is taken from the core toe.
According to Figure 9, when the grout curtain is located at upstream of the dam, increase in the angle of the slope from 10° to 70° reduces the flow passing through the substructure. Meanwhile, the flow rate increases by increasing the slope from 70° to 150°. When the grout curtain is placed at the bottom of the structure, by increase in the angle of the wall from 10° to 100°, the flow passing through the substructure is decreasing. By further increase in the angle of the wall from 100° to 150°, the flow passing through the substructure is increasing.
3.3. Effect of the Length of the Vertical Curtain
The length of the grout curtain is one of the most important parameters affecting the leakage the earth’s dams. Occasionally, with an increase of several meters by the length of the water closure, there is a slight difference in body height or leakage flow, which is not profitable. Therefore, determining the optimal length of the seal is imperative.
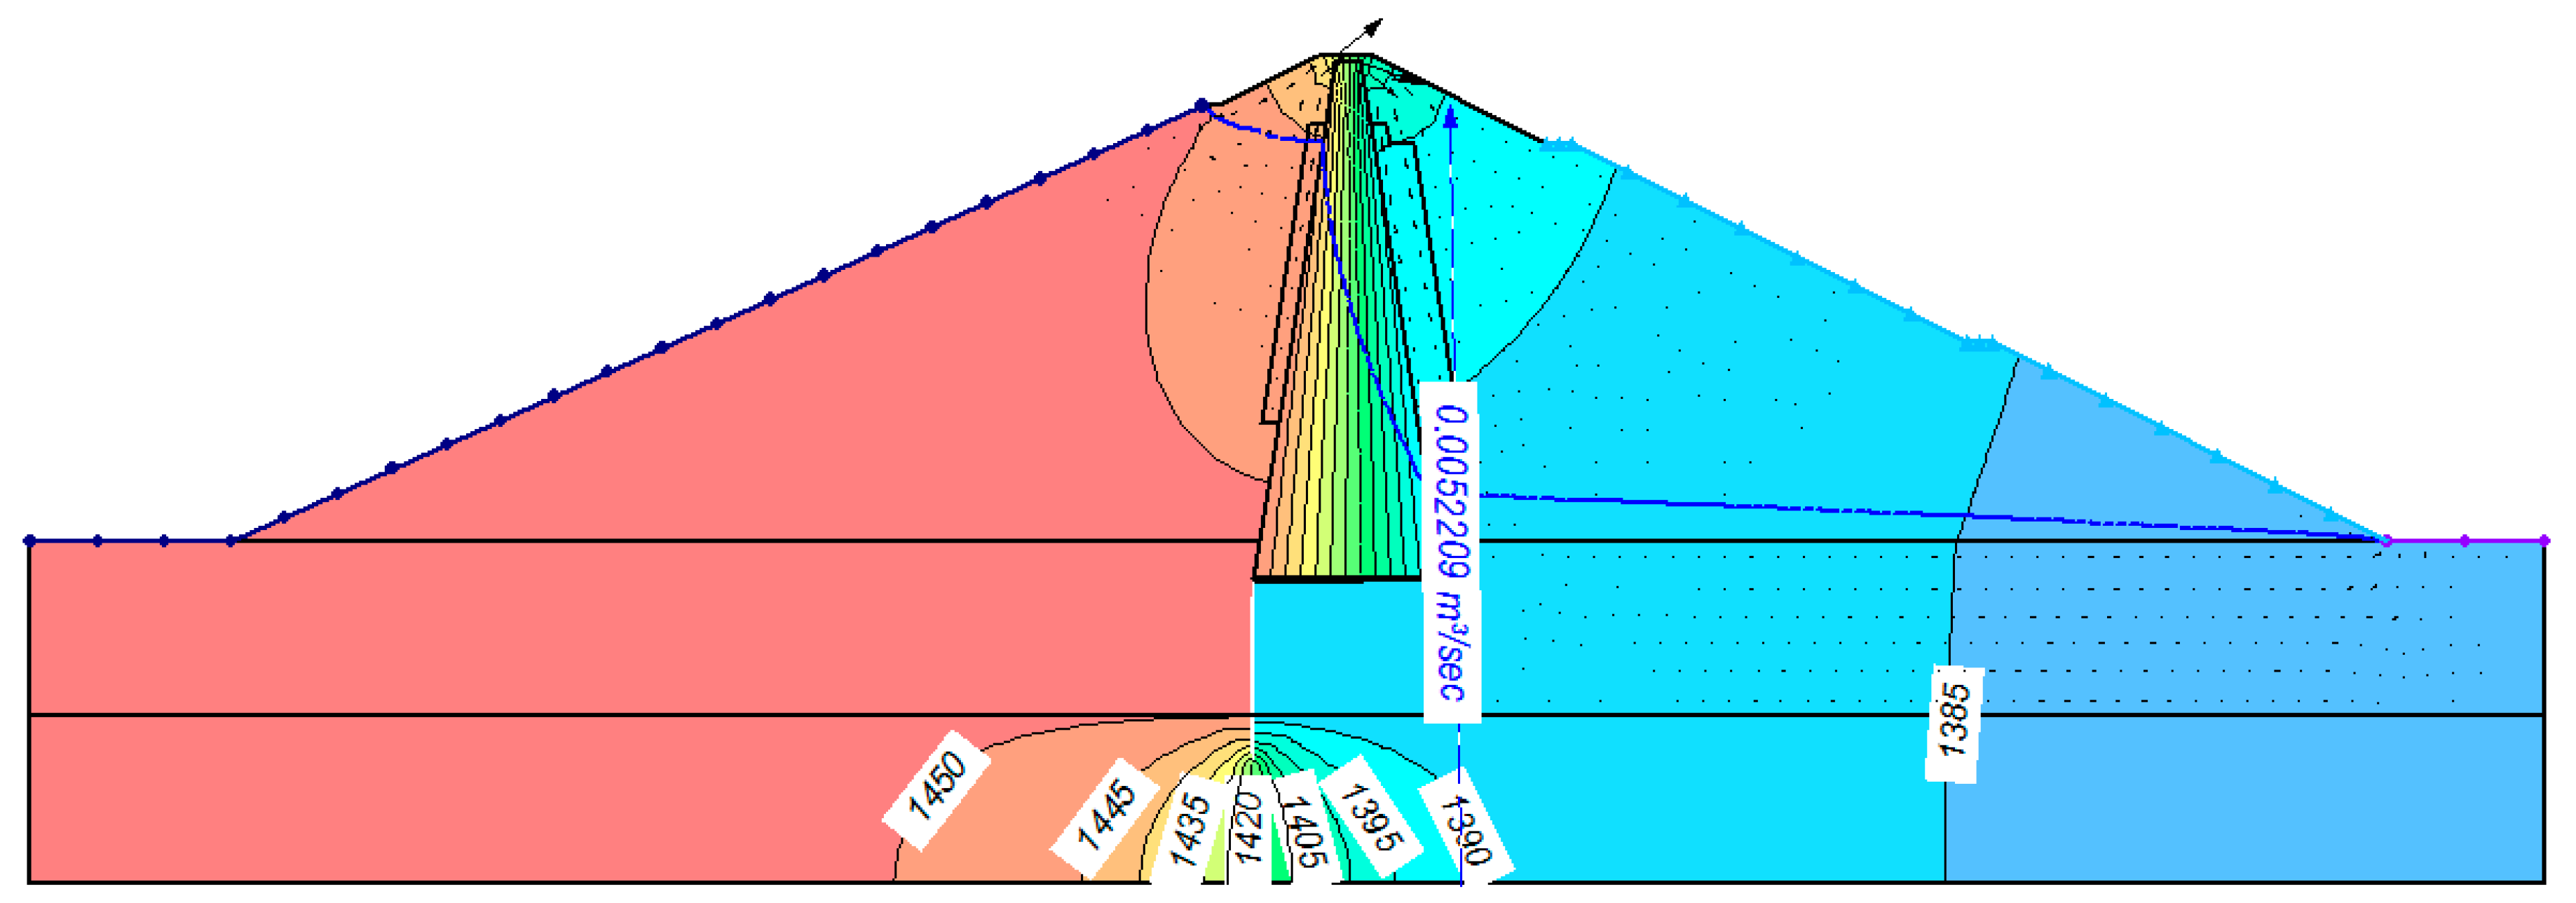
In order to investigate the effect of different parameters, the length of the grout curtain was measured at the core heel of the Sattarkhan Dam, and also with the length of 10, 20, 30, and 40 m. Figure 10 shows the equipotential and discharge lines of the Sattarkhan Dam for a 30-m long grout curtain.
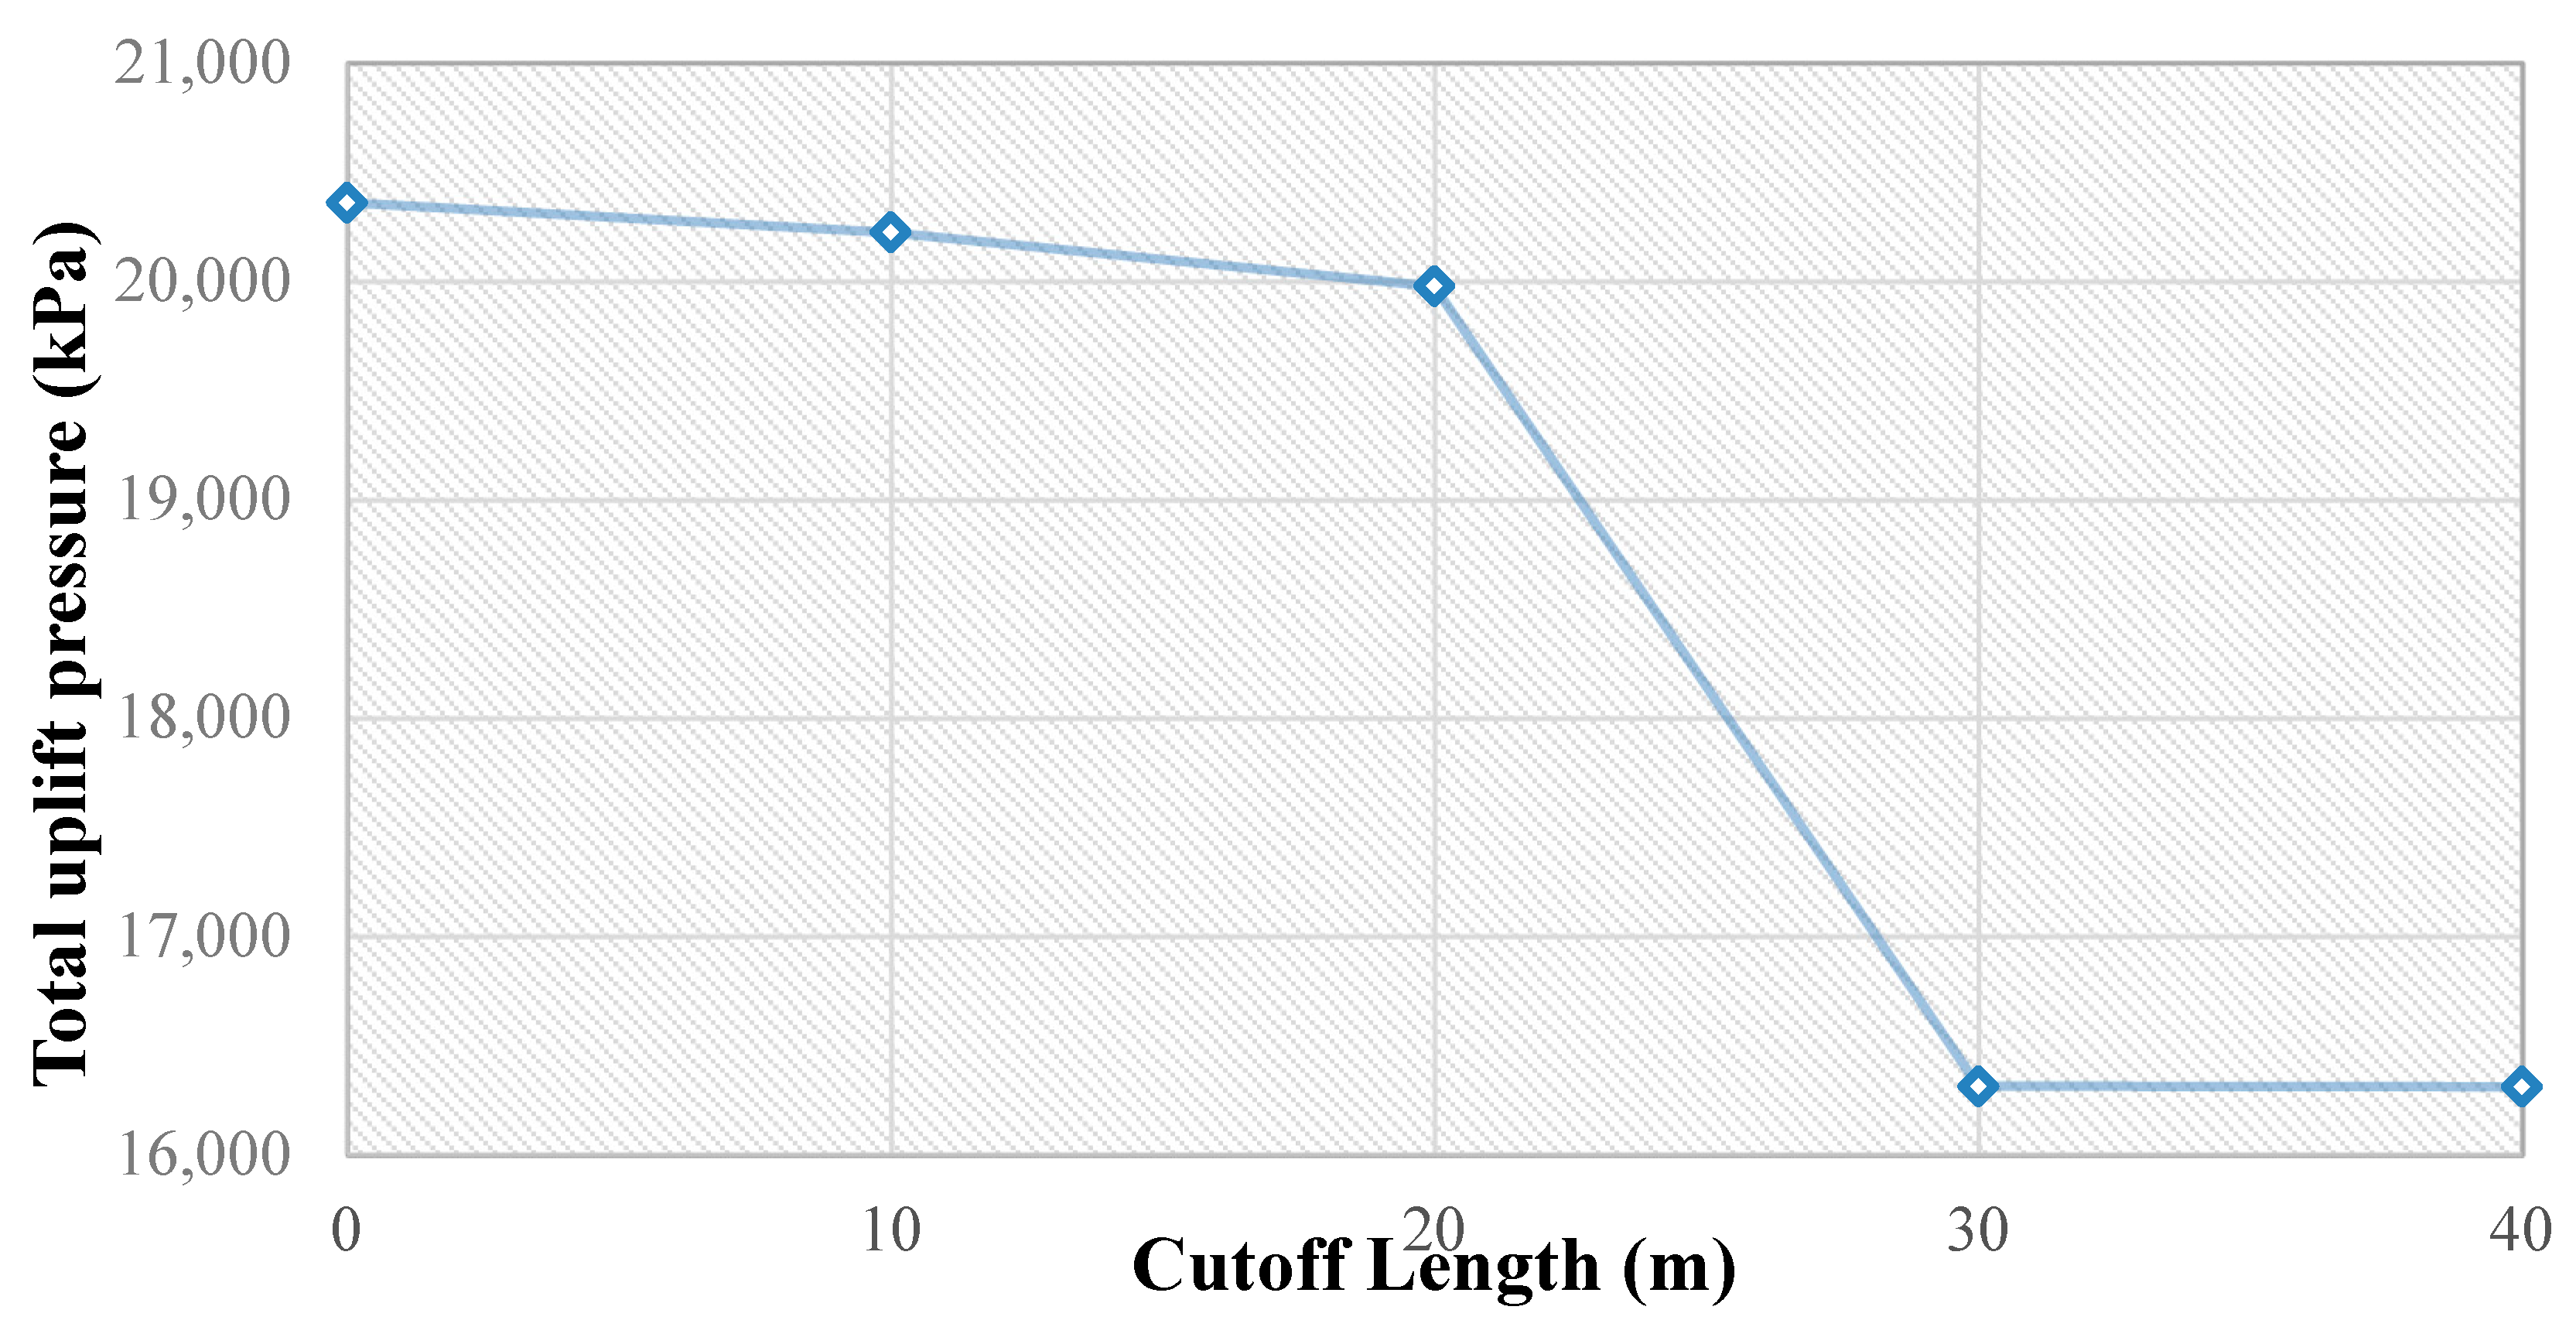
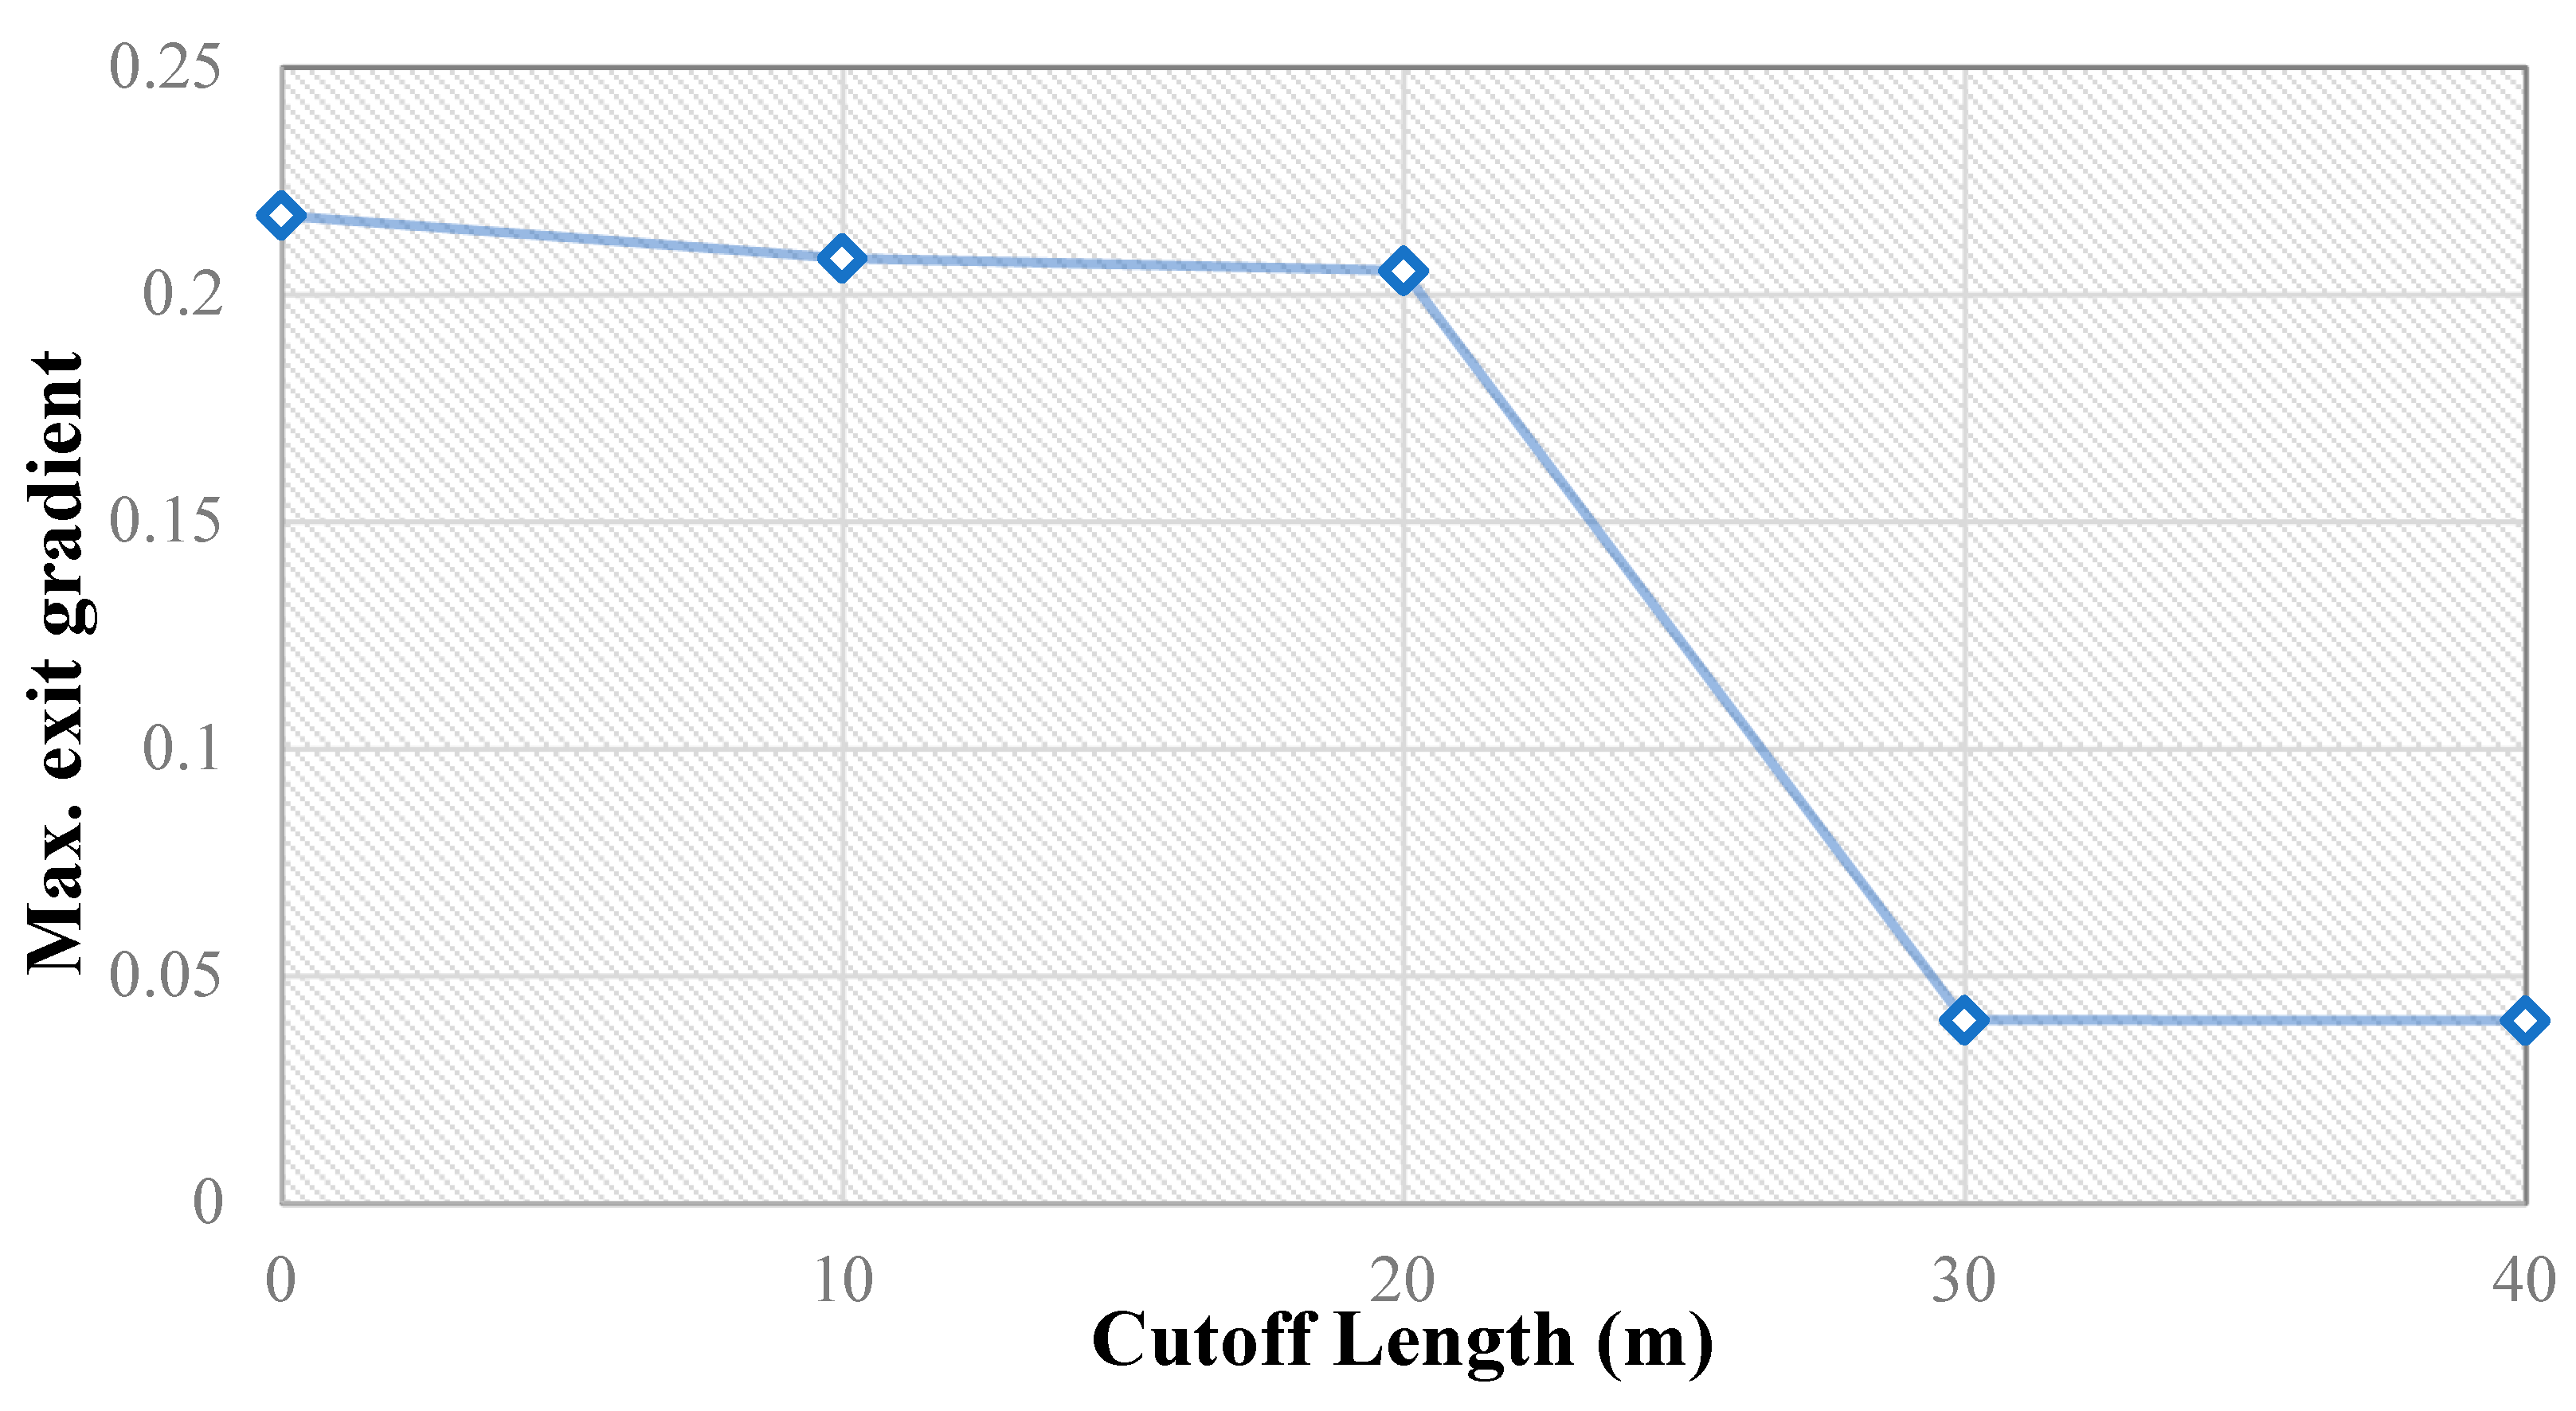
Figure 11 and Figure 12 respectively show the changes in overall uplift pressure and maximum outlet gradients relative to the changes in the length of the sealing strip in the Sattarkhan Dam.
In Figure 11 and Figure 12, amounts of uplift pressure and maximum gradient decrease by increasing the length of grout curtain. The decreasing trend in Figure 11 and Figure 12 from 20 m to 30 m, the period of curtain length is very high, but is almost constant from 30 m to 40 m. So, depending on chart, it is deducted that 30 m length is appropriate for grout curtain.
3.4. Effect of the Horizontal Distance between the Two Curtains
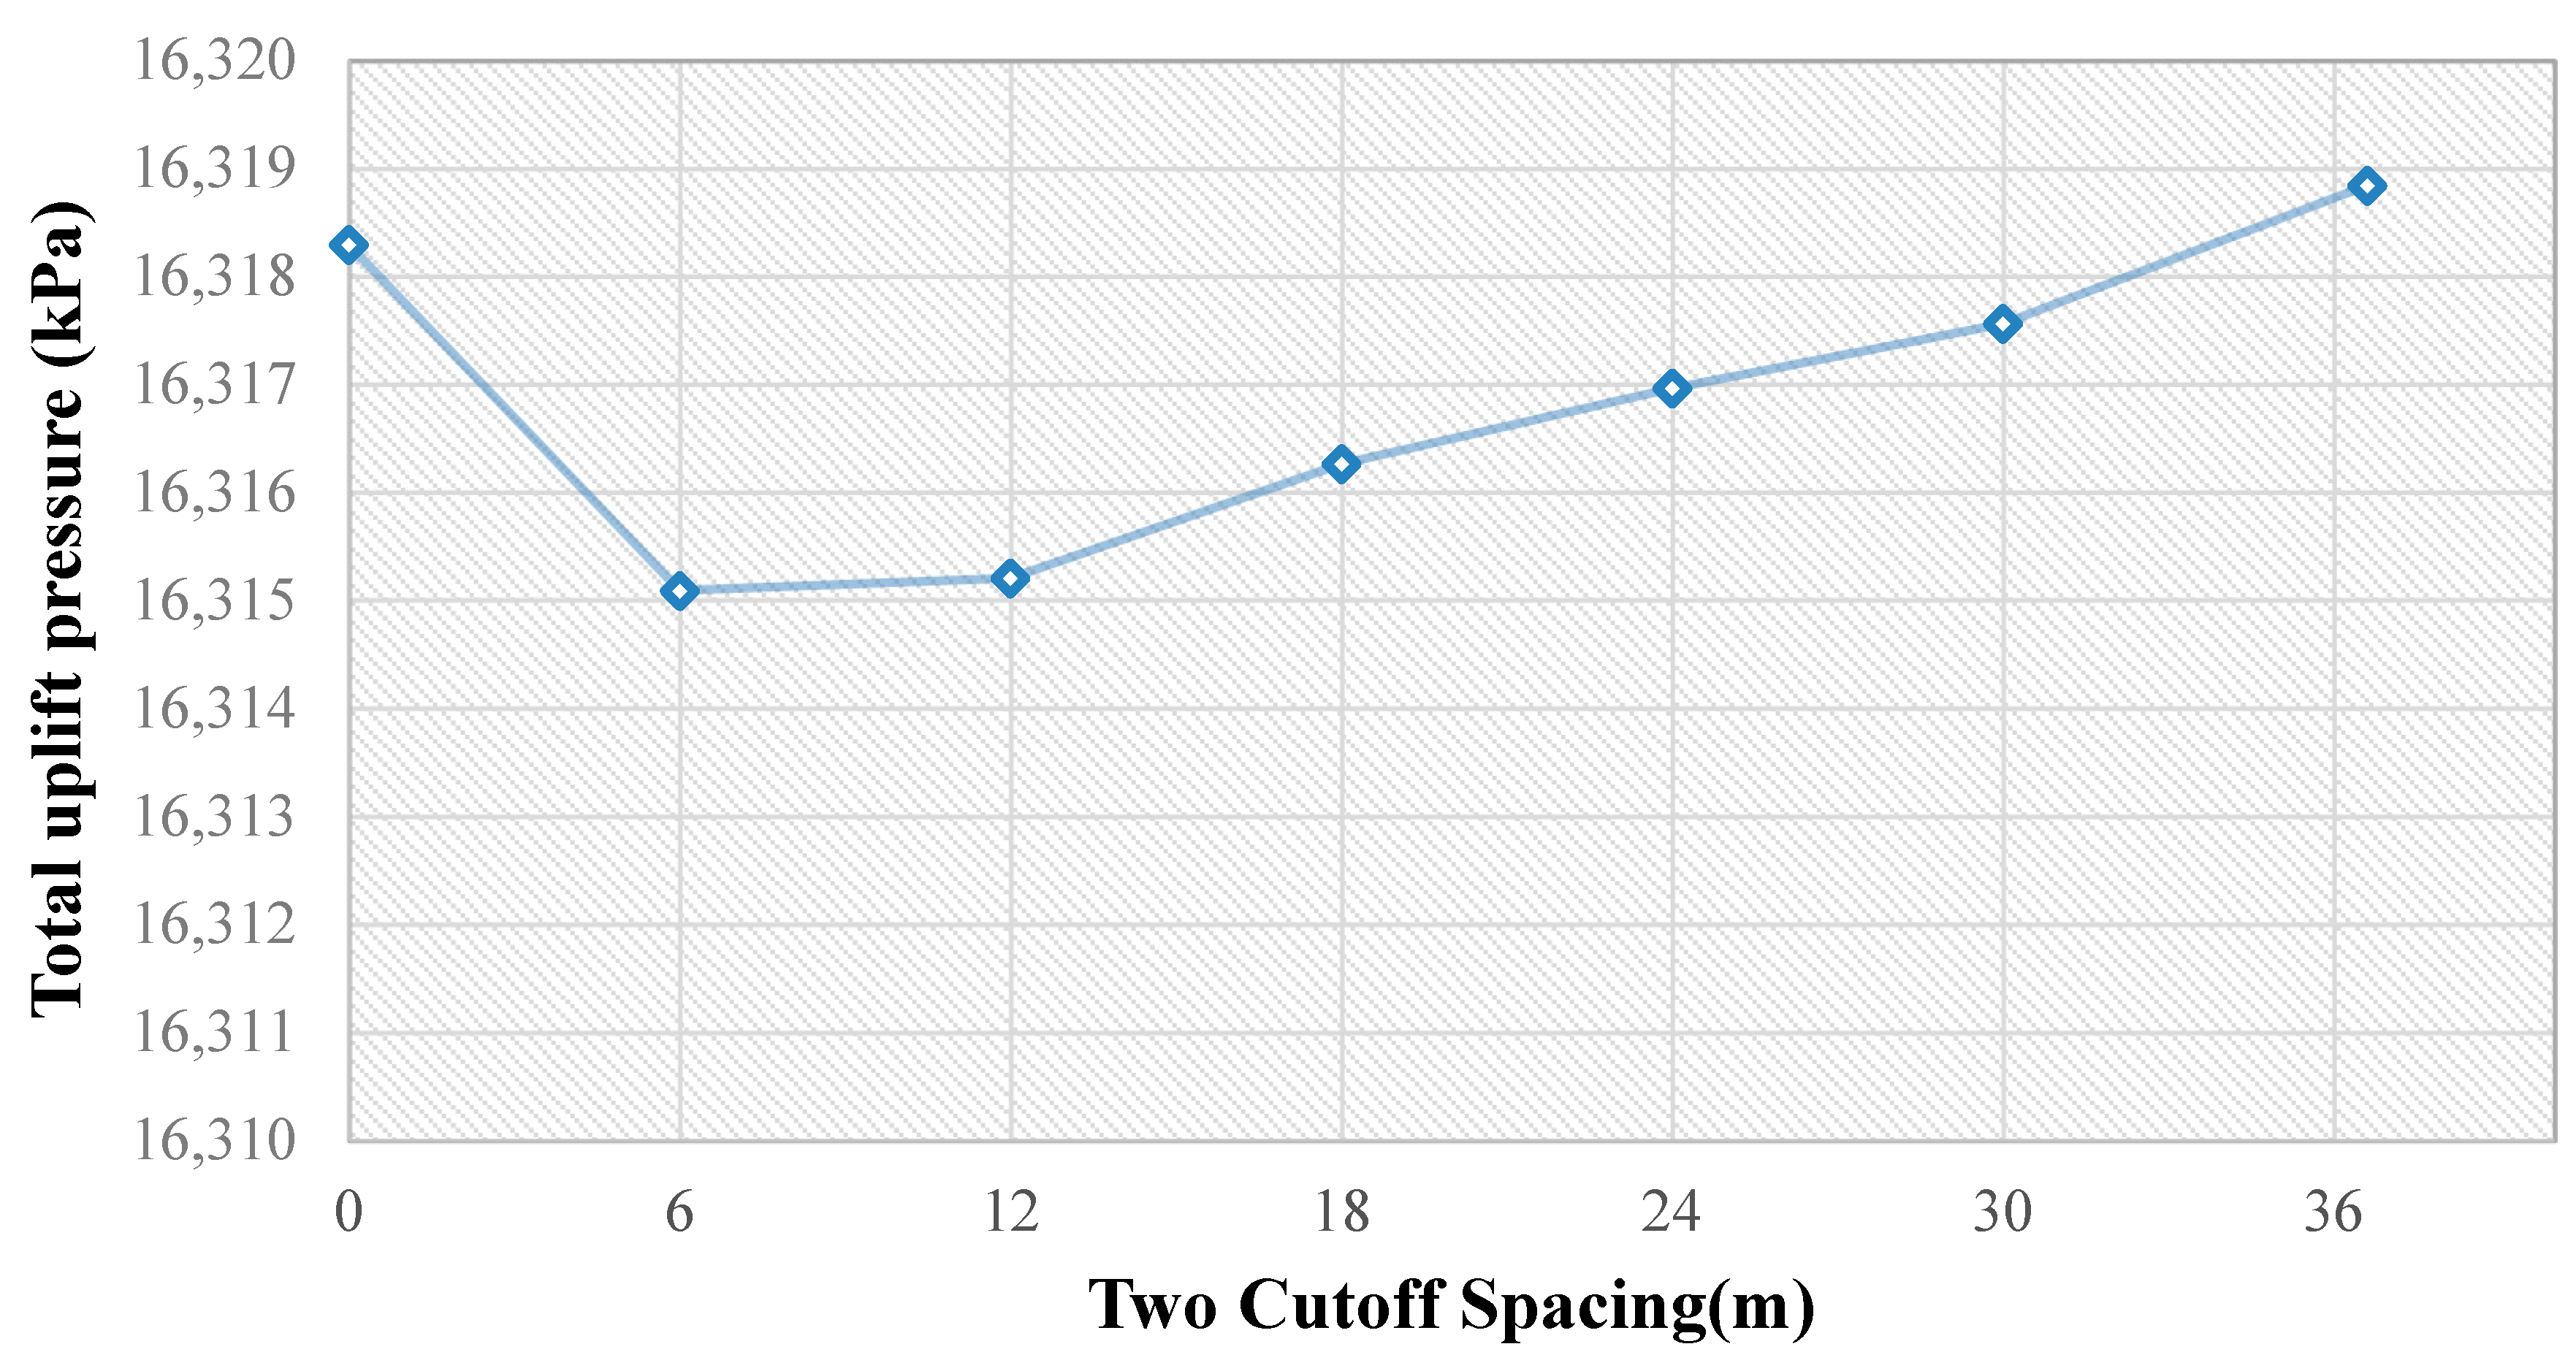
Another important parameter for the use of two or more watertight curtains below the dams is the gap between the grout curtains. In order to investigate the effect of the gap between the two curtains of the vertical curtain on the body uplift and the piping phenomenon, the distance between the two curtains is considered 6, 12, 18, 24, 30, and 38 m from the first grout curtain. For the models, the length of the curtains is 12 m.
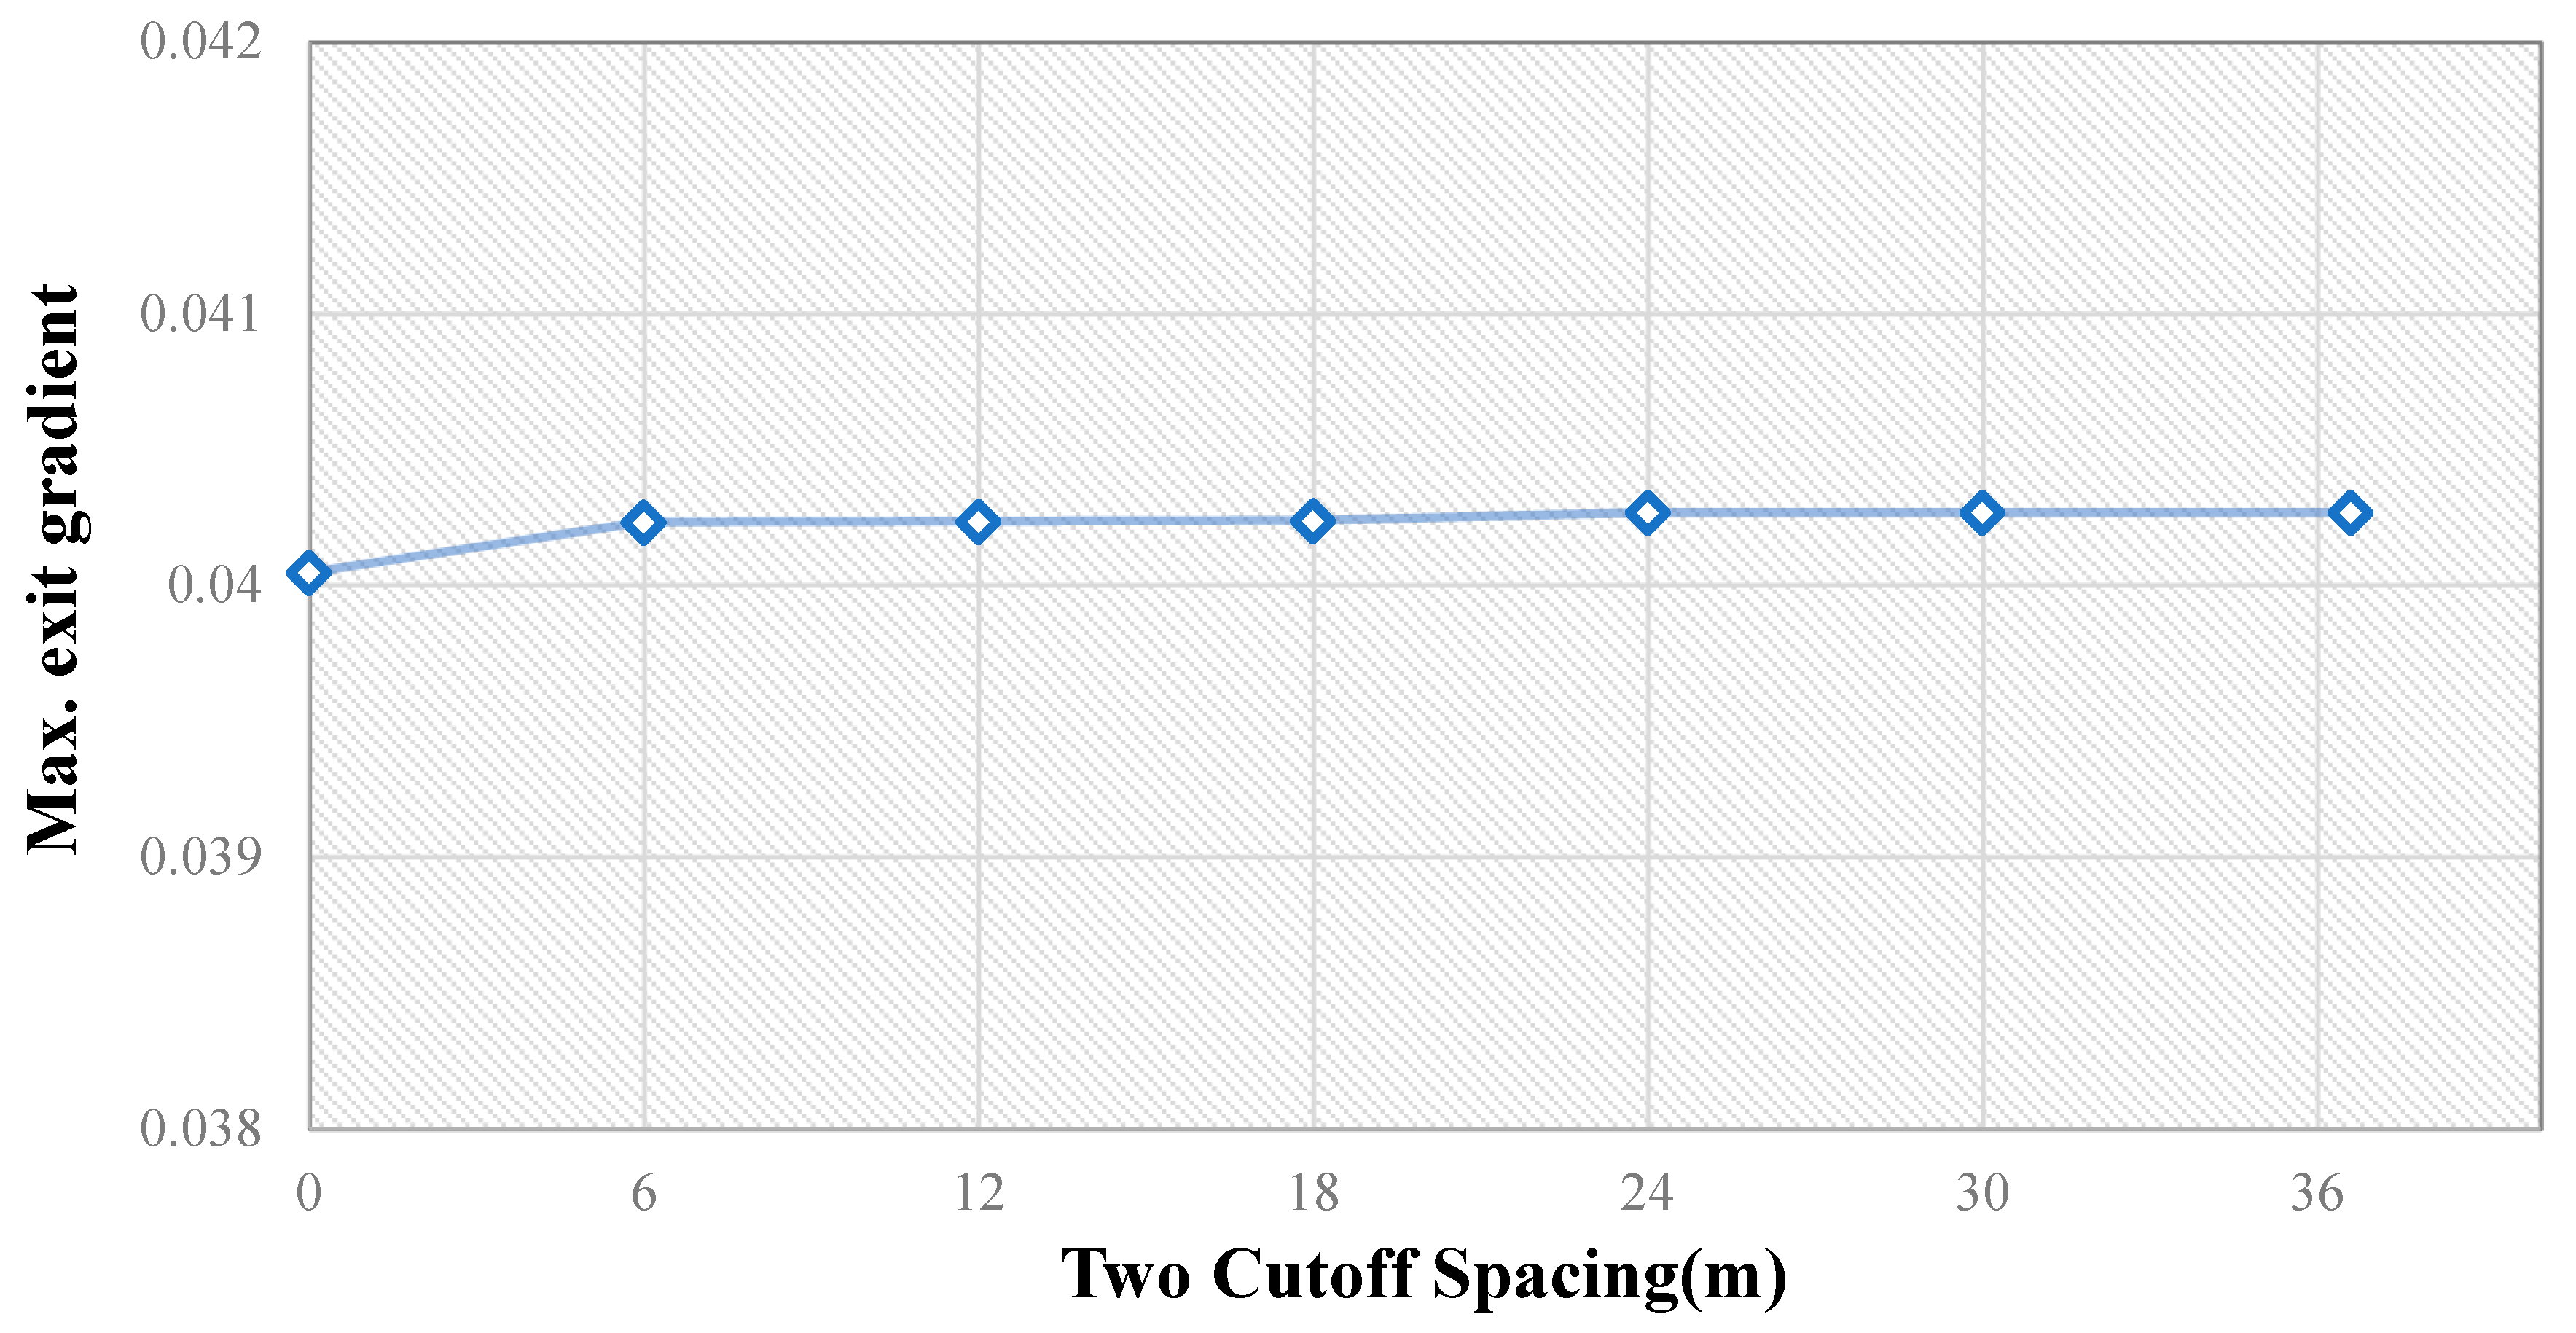
In Figure 13 and Figure 14, the effect of the spacing between the two vertical curtains is shown for the uplift pressure and the maximum outlet gradient.
The use of further spacing between the two-grout curtain under the core of the dam leads to increase in total uplift pressure and reduction in safety against uplift pressure. According to Figure 13, it is obvious that by increasing the distance of 2 curtain up to 6 m, uplift pressure decreases. In the period of 6 to 12 m, little increase is shown by increasing the distance from 12 to 38 m uplift pressure increases, and in 38 m the pressure is maximum. According to Figure 13, it can be said that horizontal distance of 6 m for 2 curtains is optimum. The maximum outlet gradient at the bottom of the dam does not change with the gap between the two drain curtains.
3.5. Effect of the Number of Curtains
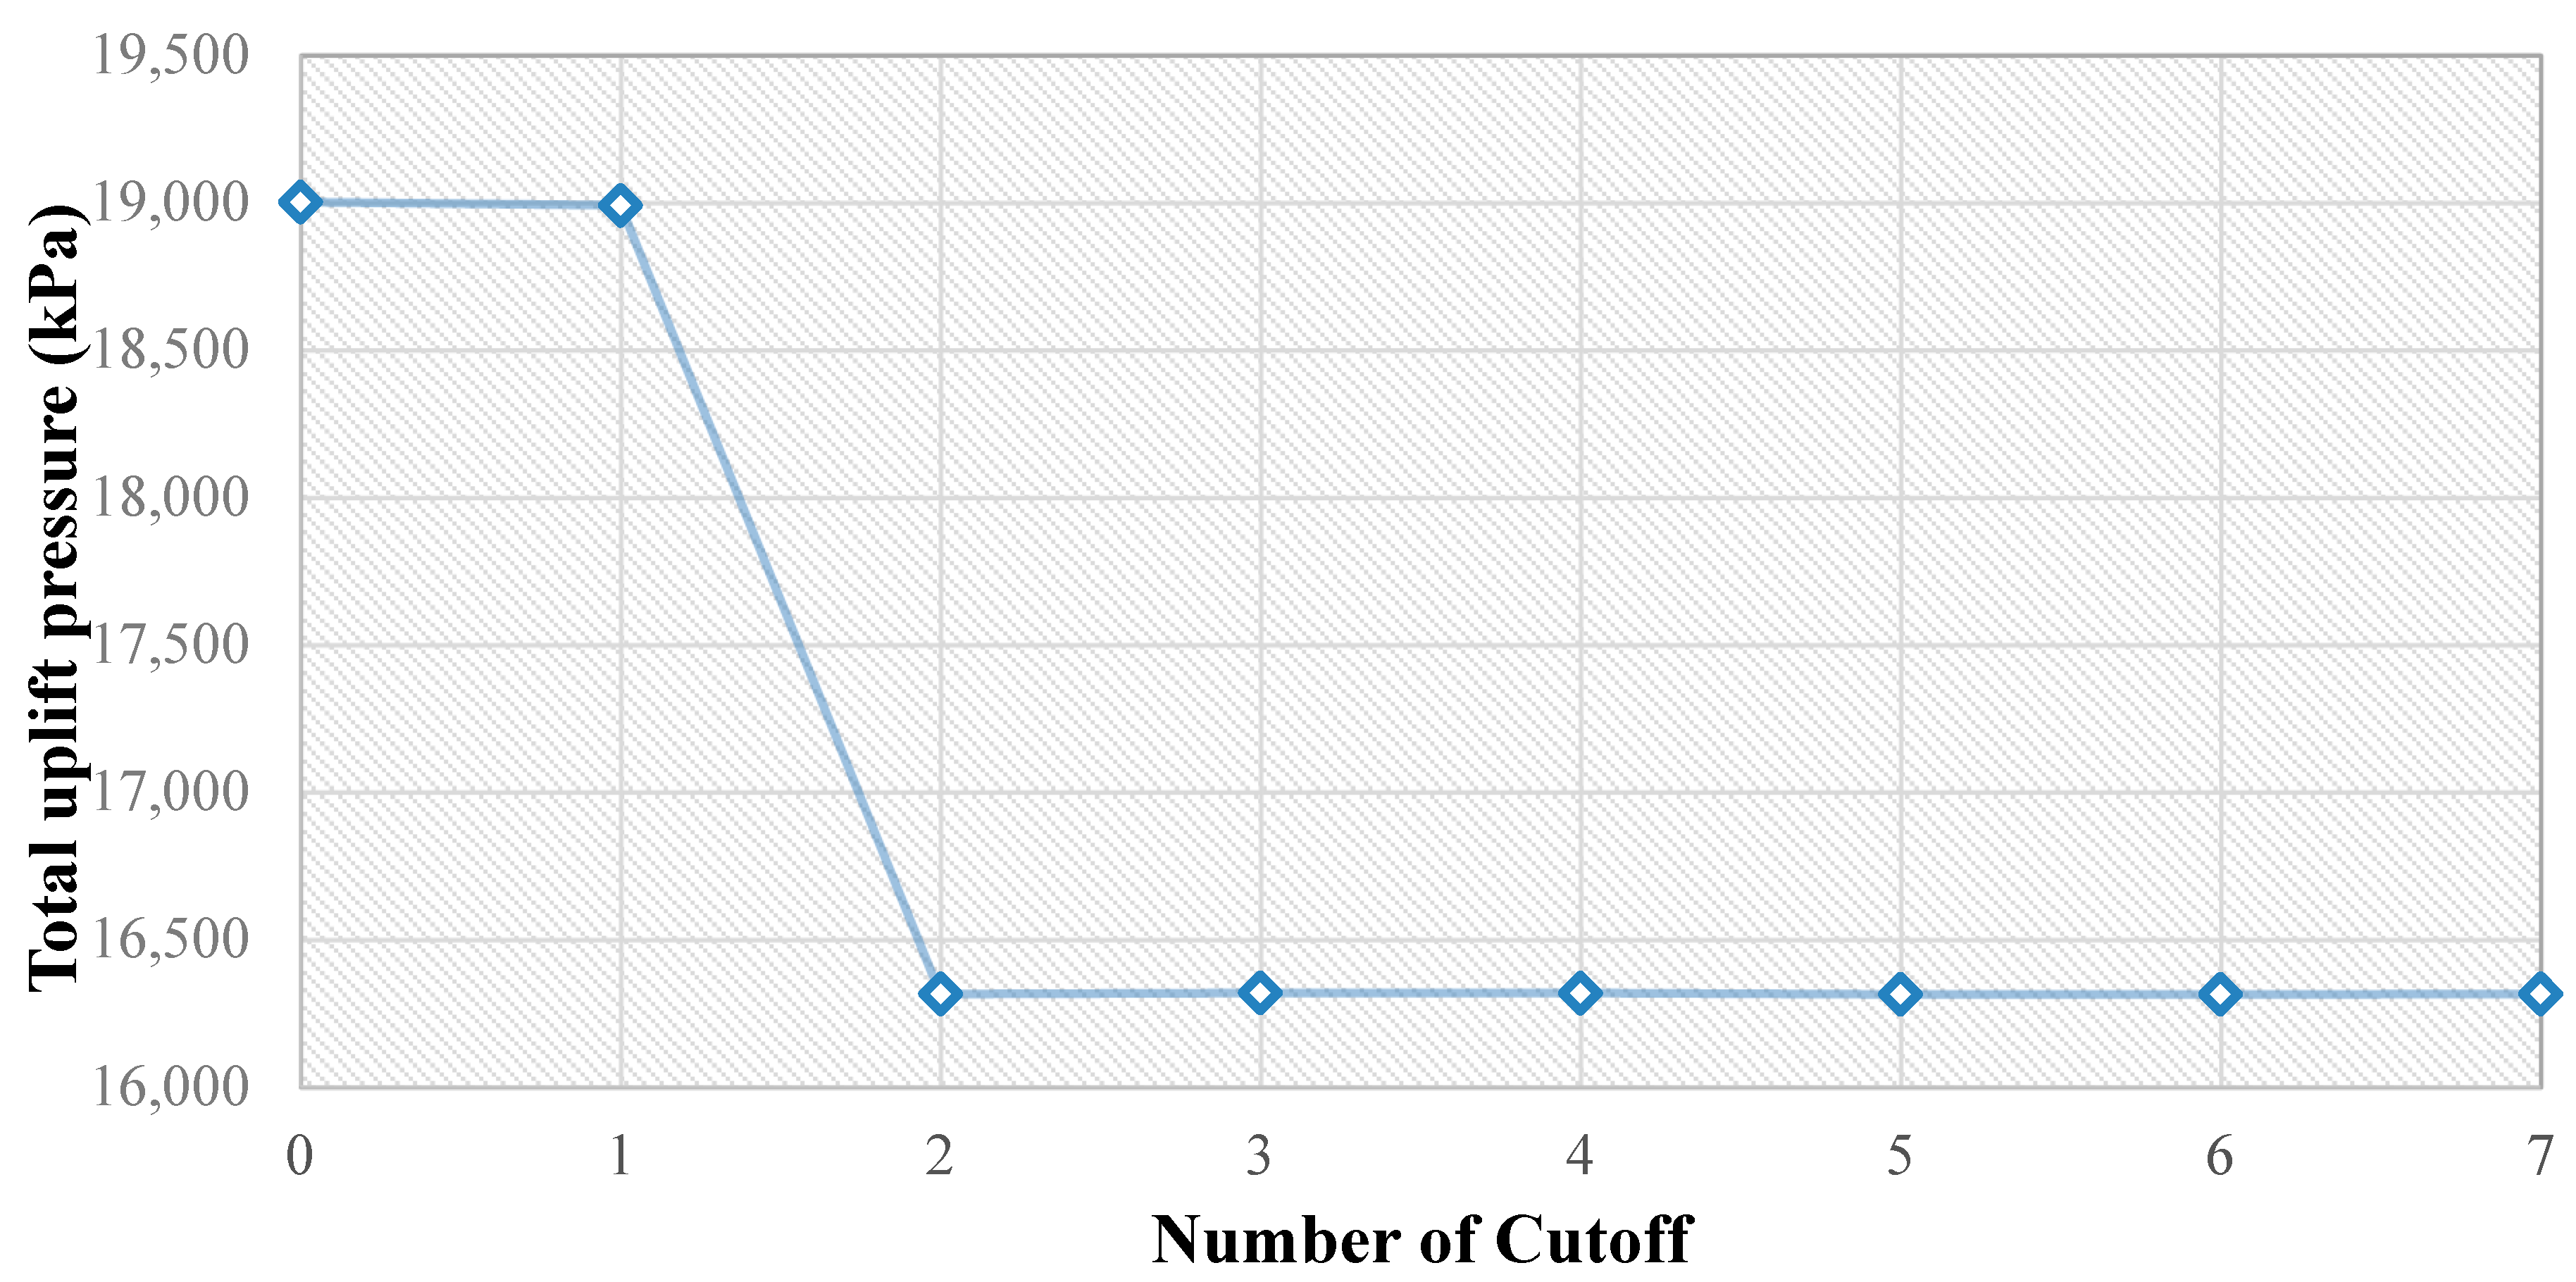
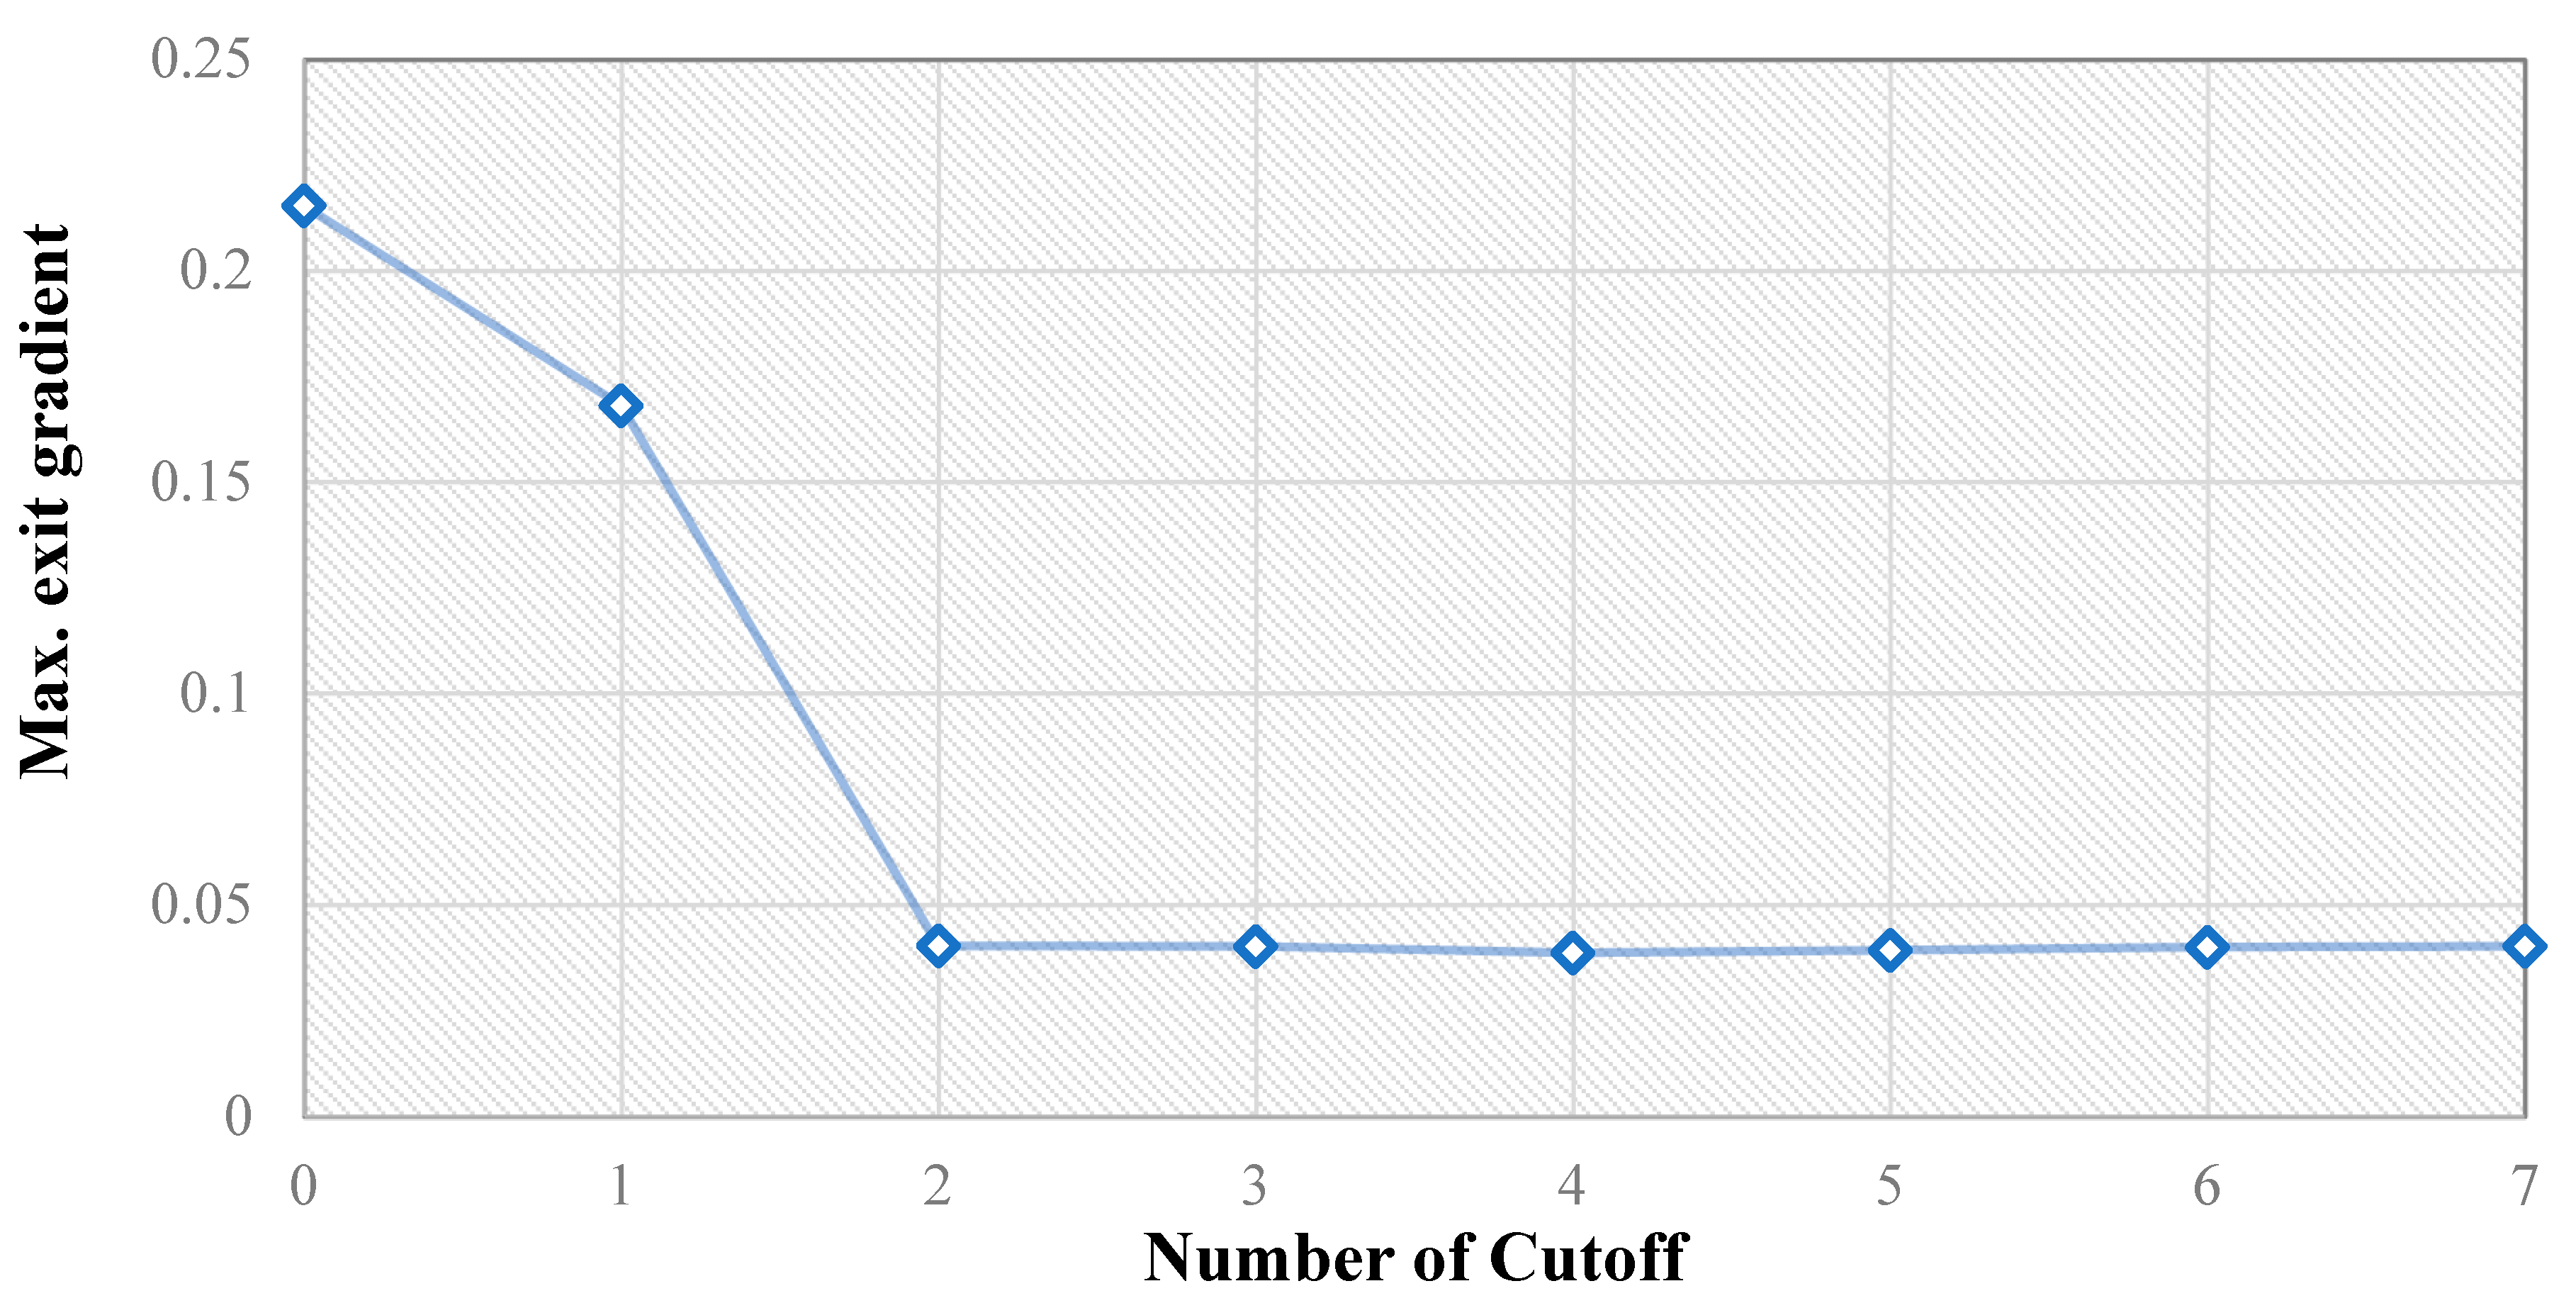
The effect of the number of damper blinds under the core of the dam with equal length and distance (L = 25 m and S = 6 m) on total uplift pressure and maximum outlet gradient are shown in Figure 15 and Figure 16.
As shown in Figure 16, by increasing the number of grout curtains from one to two, the uplift pressure and the maximum outlet gradient decrease by about 15% and 76%, respectively. Increasing the number of seals from 2 to 3, 4, 5, 6, and 7 does not change the above parameters. Hence, the best number of grout curtain for increasing safety against uplift pressure and piping phenomena is two.
3.6. The Effect of Horizontal Drainage
In order to investigate the effect of downward horizontal drainage length on total uplift pressure and maximum outlet gradient underneath of the dam, 18, 38, 54, ..., 162, and 180 m of drainage length were selected for modeling. Figure 17 shows the flow of water and the equipotential lines of the dam for a 22-m-long water drain in the middle of the core and a horizontal downstream drain of the dam with a length of 90 m.
Figure 18 and Figure 19 shows the results of the analysis of the effect of the downstream horizontal drainage on the total uplift pressure and outlet gradient.
According to Figure 18, increase in the length of the horizontal drainage reduces the uplift pressure. The horizontal drainage with at least 18 m height will reduce the uplift pressure by 15% and increasing its length to 180 m will reduce it by about 22%. By increasing the length of horizontal drainage, uplift pressure decreases. So, it can be seen that a length of 18 m is more appropriate and economic than other amounts. This diagram shows that for the specification considered for the dam, the creation and increase of the length of the horizontal drainage has a direct impact on the uplift pressure.
Figure 19 shows that creating a horizontal drainage with a length of 18 m reduces the maximum outlet gradient by 75%. Increasing the length of the horizontal drainage from 5 m to 60 m reduced this parameter by 92%. Therefore, no matter how long the horizontal drainage is, the safety of the barrier will increase against its piping phenomenon.
4. Conclusions
In this paper, the effects of various parameters of cutoff wall, including slope, length, distance, number of cutoff walls, effect of horizontal drainage and length of drainage on uplift pressure, and maximum exit gradient is studied, and these parameters are optimized in Sattarkhan Dam as a case study. Getting closer to the optimized parameters in big projects such as earth dams is very important. Sattarkhan Dam is very important because of agriculture and water demand of Ahar city and it plays a great role in adjusting the surface flow of Aharchai river.
According to the modeling results, the following conclusions are presented:
- The use of the upstream grout curtain with a vertical angle of inclination and also entering the lower layer with lower permeability is useful in increasing the safety of the hydraulic structure against the uplift pressure.
- Use of a grout curtain is useful in the upstream of the dam with a slope between 70 and 110 degrees in order to increase the safety of the dam against the piping phenomenon.
- With an angle of 70° for the upstream grout curtain, as well as the angle of inclination of 100° for the downstream grout curtain, the flow through the structure is the lowest.
- Due to the different lengths for the drain curtain, the suitable length to prevent the rising of the dam, the piping phenomenon and the control of the discharge through the core is 30 m.
- The best number of seals to reduce the uplift pressure and the maximum outlet gradient is two. The use of further spacing between the two curtains under the core of the dam leads to an increase in total uplift pressure. Also, changing the distance between the two curtains does not affect the piping phenomenon.
- Increasing the length of the horizontal drainage increases safety against uplift pressure and piping phenomenon.
As a proposition for future research we can point to these items:
- (a)
- study the parameters for different dams and find the best and economic methods of various forms of earth dams.
- (b)
- study function of effective parameters of cutoff wall on seepage under dynamic conditions.
- (c)
- study effect of other methods of seepage control including injection curtains, clay blanket, and drainage in dams.
- (d)
- evaluation of dynamic behavior of cutoff walls with various length and thickness.
- (e)
- study of this case study with other numerical methods and compare the results.
Studying the mentioned items increases the volume of modeling process and number of models, so these cannot be studied in this paper. In this paper, only static modeling is considered, and dynamic study is not the purpose of this paper. Also, instead of using other models and software, the SEEP/W model is considered in this paper.
Author Contributions
The author had equal contribution in all sections of research.
Funding
This research received no external funding.
Acknowledgments
The authors are grateful to technical supports of Department of Civil Engineering, Tabriz Branch, Islamic Azad University.
Conflicts of Interest
The authors declare no conflict of interest.
References
- Shroff, A.V.; Shah, D.L. Grouting Technology in Tunneling and Dam Construction; A A Balkema: Rotterdam, The Netherlands, 1999. [Google Scholar]
- Nohani, E. Impacts of Rubble and Sand Mining on River Morphology. Online J. Eng. Sci. Technol. 2018, 1, 1–5. [Google Scholar]
- Rashidi, M.; Haeri, S.M. Evaluation of The Behavior of Earth and Rockfill Dams During Construction and First Impounding Using Instrumentation Data and Numerical modeling. J. Rock Mech. Geotech. Eng. 2017, 9, 709–725. [Google Scholar] [CrossRef]
- Zoorasna, Z.; Hamidi, A.; Chanbari, A. Mechanical and Hydraulic Behavior of Cut Off-Core Connecting Systems in Earth Dams. Electron. J. Geotech. Eng. 2008, 13, 1–12. [Google Scholar]
- Taormina, R.; Chau, K.W.; Sethi, R. Artificial Neural Network Simulation of Hourly Groundwater Levels in a Coastal Aquifer System of the Venice Lagoon. Eng. Appl. Artif. Intell. 2012, 25, 1670–1676. [Google Scholar] [CrossRef]
- Mansuri, B.; Salmasi, F. Effect of Horizontal Drain Length and Cutoff Wall on Seepage and Uplift Pressure in Heterogeneous Earth Dam with Numerical Simulation. J. Civ. Eng. Urban. 2013, 3, 114–121. [Google Scholar]
- Moharrami, A.; Moradi, G.; Bonab, M.H.; Katebi, J.; Moharrami, G. Performance of Cutoff Walls Under Hydraulic Structures Against Uplift Pressure and Piping Phenomenon. Geotech. Geol. Eng. 2015, 33, 95–103. [Google Scholar] [CrossRef]
- Gholami, V.; Chau, K.W.; Fadaee, F.; Torkaman, J.; Ghaffari, A. Modeling of Groundwater Level Fluctuations Using Dendrochronology in Alluvial Aquifers. J. Hydrol. 2015, 529, 1060–1069. [Google Scholar] [CrossRef]
- Hassan, W.H. Application of A Genetic Algorithm for The Optimization of A Cutoff Wall Under Hydraulic Structures. J. Appl. Water Eng. Res. 2017, 5, 22–30. [Google Scholar] [CrossRef]
- Nourani, B.; Salmasi, F.; Abbaspour, A.; Bakhshayesh, B.O. Numerical Investigation of the Optimum Location for Vertical Drains in Gravity Dams. Geotech. Geol. Eng. 2017, 35, 799–808. [Google Scholar] [CrossRef]
- Tan, X.; Wang, X.; Khoshnevisan, S.; Hou, X.; Zha, F. Seepage Analysis of Earth Dams Considering Spatial Variability of Hydraulic Parameters. Eng. Geol. 2017, 228, 260–269. [Google Scholar] [CrossRef]
- Niec, J.; Zawadzki, P.; Walczak, Z.; Spychała, M. Calculating Earth Dam Seepage Using Hydrus Software Application. Acta Sci. Pol. 2017, 16, 43–56. [Google Scholar]
- Aghajani, H.F.; Anzabi, M.M.; Sheikhi, Z.; Shokri, R. Selecting Optimum Cutoff Wall Position for Rehabilitation of an Inclined Core Earthfill Dam. In Proceedings of the GeoShanghai International Conference, Shanghai, China, 27–30 May 2018; Springer: Singapore; pp. 252–260. [Google Scholar]
- Shende, S.; Chau, K.W. Forecasting Safe Distance of a Pumping Well for Effective Riverbank Filtration. J. Hazard. Toxic Radioact. Waste 2019, 23, 1–9. [Google Scholar] [CrossRef]
- Conker, A.; Hussein, H. Hydraulic Mission at Home, Hydraulic Mission abroad? Examining Turkey’s Regional Pax-Aquarum and Its Limits. Sustainability 2019, 11, 228. [Google Scholar] [CrossRef]
Figure 1.
Location of Sattarkhan Dam.

Figure 2.
Dam components.

Figure 3.
Water surface and equipotential lines.

Figure 4.
Pore water pressure and seepage counters.

Figure 5.
Total uplift pressure in different cutoff lengths for validation model.

Figure 6.
Water flow lines of the dam with vertical curtain on upstream.

Figure 7.
Equipotential lines of the Dam with vertical curtain on downstream.

Figure 8.
Uplift pressure for the dam in the case of one curtain on upstream and downstream with angle.
Figure 8.
Uplift pressure for the dam in the case of one curtain on upstream and downstream with angle.

Figure 9.
Seepage discharge of the cross section of the dam in different angles.

Figure 10.
Equipotential lines and discharge counters of the dam with a grout curtain of 30 m long.

Figure 11.
Total uplift pressure in different cutoff lengths.

Figure 12.
Maximum outlet gradient of downstream in different cutoff lengths.

Figure 13.
Uplift pressure under the core for different cutoff spacing.

Figure 14.
Maximum gradient of outlet discharge under the core for different cutoff spacing.

Figure 15.
Uplift pressure under the core for different numbers of grout curtains under the dam.

Figure 16.
Maximum gradient of outlet discharge under the core for different numbers of grout curtains under the dam.
Figure 16.
Maximum gradient of outlet discharge under the core for different numbers of grout curtains under the dam.

Figure 17.
Flow and equipotential lines of the dam with the 90 m drainage system.

Figure 18.
Uplift pressure under the core for different lengths for drainage system.

Figure 19.
Maximum gradient of outlet discharge for different lengths for drainage system.


Table 1.
The permeability of the materials used in the components of the dam.
| Type of the Material | Kx(m/sec) | Kx/ky |
|---|---|---|
| Core | 1 × 10⁻⁸ | 0.1 |
| Cutoff | 2 × 10⁻⁷ | 1.0 |
| Upper foundation | 5 × 10⁻⁶ | 1.0 |
| Lower foundation | 1 × 10⁻⁶ | 1.0 |
| Shell | 1 × 10⁻² | 1.0 |
| Drain and Filter | 1 × 10⁻³ | 1.0 |
Table 2.
Characteristics of dam constituent materials.
| Type of the Material | C(Kpa) | ||||||
|---|---|---|---|---|---|---|---|
| Core | CD | 2030 | 1 × 10⁷ | 45 | 37 | 0 | 0.3 |
| CU | 2030 | 1 × 10⁷ | 65 | 33 | 0 | 0.3 | |
| UU | 2030 | 1 × 10⁷ | 80 | 10 | 0 | 0.3 | |
| Shell | 2100 | 1 × 10⁸ | 0 | 40 | 10 | 0.3 | |
| Drain and Filter | 1560 | 2.5 × 10⁷ | 0 | 36 | 0 | 0.3 | |
| Foundation | 2200 | 1 × 10¹⁰ | 750 | 50 | 8 | 0.3 | |
© 2019 by the authors. Licensee MDPI, Basel, Switzerland. This article is an open access article distributed under the terms and conditions of the Creative Commons Attribution (CC BY) license (http://creativecommons.org/licenses/by/4.0/).
Share and Cite
MDPI and ACS Style
Meshkabadi, K.; Zandi, Y. The Effects of Grout Curtain Parameters on Uplift and Piping Phenomenon; Case Study: Sattarkhan Dam. Hydrology 2019, 6, 71. https://doi.org/10.3390/hydrology6030071
AMA Style
Meshkabadi K, Zandi Y. The Effects of Grout Curtain Parameters on Uplift and Piping Phenomenon; Case Study: Sattarkhan Dam. Hydrology. 2019; 6(3):71. https://doi.org/10.3390/hydrology6030071
Chicago/Turabian StyleMeshkabadi, Kambiz, and Yousef Zandi. 2019. "The Effects of Grout Curtain Parameters on Uplift and Piping Phenomenon; Case Study: Sattarkhan Dam" Hydrology 6, no. 3: 71. https://doi.org/10.3390/hydrology6030071
Note that from the first issue of 2016, this journal uses article numbers instead of page numbers. See further details here.