
Analysis of Precipitation and Drought Data in Hexi Corridor, Northwest China

1
College of Resources and Environment, Shandong Agricultural University, Tai’an 271018, Shandong, China
2
Key Laboratory of Tourism and Resources Environment in Colleges and Universities of Shandong Province, Taishan University, Tai’an 271000, Shandong, China
3
Forestry Ecological Engineering Research Center, School of Soil and Water Conservation, Beijing Forestry University, Beijing 100083, China
*
Author to whom correspondence should be addressed.
Hydrology 2017, 4(2), 29; https://doi.org/10.3390/hydrology4020029
Submission received: 22 March 2017
/
Revised: 16 May 2017
/
Accepted: 17 May 2017
/
Published: 19 May 2017
Abstract
:Precipitation data from nine meteorological stations in arid oases of Hexi Corridor, northwest China during 1970–2012 were analyzed to detect trends in precipitation and Standardized Precipitation Index (SPI) at multiple time scales using linear regression, Mann–Kendall and Spearman’s Rho tests. The results found that annual precipitation in the observed stations was rare and fell into the arid region category according to the aridity index analysis. The monthly analysis of precipitation found that three stations showed significant increasing trends in different months, while on the annual level, only Yongchang station had a significant increasing trend. The analysis of SPI-12 found three main drought intervals, i.e., 1984–1987, 1991–1992 and 2008–2011, and an extremely dry year among the stations was recorded in 1986; the southeast and middle portions of the study area are expected to have more precipitation and less dry conditions.
1. Introduction
Hexi Corridor (northwest China) is a prime portion of the “Silk Road” connecting China and Eurasian countries [1]. As they are located in the arid region, oases in this region were the main habitats for local residents. Since the late 1960s, oases in Hexi Corridor have experienced more prominent internal development and external extension [2]. However, highly impervious urban surfaces and a relative simplex cultivation structure weakened their ability to resist drought, which is a severe disaster for the arid oasis ecological system. Accurate selection of drought occurrence indicators is indispensable for drought forecasting and contingency planning [3] to promote local socio-economic development and water resource management.
Among various meteorological variables, precipitation is one of the most important and can directly impact the occurrence of drought [4]. Previous studies have monitored and compared precipitation changes at various spatio-temporal scales, e.g. using hourly and daily observations to detect intensity trends in Portland in the United States [5], understanding change patterns at seasonal scales in Iberia [6], Mongolia [7] and South Korea [8], and analyzing long-term data to investigate trends over coastal countries [9,10,11,12,13,14] and monsoon regions [15,16]. In China, monthly precipitation characteristics using data from 160 meteorological stations in China was detected and interpolated over 1951–2002 [17]. Precipitation trend analyses using the Mann–Kendall method have been performed in the Yangtze River [18], Yellow River [19] and Pearl River Basins [20] since the 1960s. Precipitation studies in Beijing area [21], Shandong province [22] and Xinjiang Uygur Autonomous Region [23] were also monitored to provide information on climate change.
Previous studies in Hexi Corridor have monitored the glacier change and its effects on oasis variation during 1970–2012 [2,24]. However, a comprehensive analysis of change trends and variability in precipitation series of Hexi Corridor over the same period was lacking, which hindered further studies of water management and oasis development planning in this region. The present study focused on characterizing the precipitation change and drought behavior in oases of Hexi Corridor using statistical tests and SPI. The aims of this study were to: (1) detect the change trends of precipitation in oases of Hexi Corridor during 1970–2012; (2) research variability in precipitation on monthly, seasonal and annual time series using linear regression, Mann–Kendall and Spearman’s Rho methods; and (3) investigate the drought severity in oases during the study period.
2. Materials and Methods
2.1. Study Area and Data Collection
The study area (90°11′–101°29′ E, 37°14′–42°15′ N) is located amidst Xijiang Uygur Autonomous Region, Inner Mongolia Autonomous Region and Qinghai province of northwest China, with an area of 2.76 × 10⁵ km2. The climate of Hexi Corridor is temperate continental with a gradual transition between the four seasons. The annual average temperature in 1970–2012 ranged from 4–10 °C, and the annual precipitation was less than 200 mm through the whole region, displaying a general decreasing trend from the southeast to northwest.
Due to the severe living conditions, meteorological stations in Hexi Corridor were all located in relatively large oases. Precipitation data from 1970–2012 used in this study were collected from nine selected meteorological stations located in the main oases of Hexi Corridor, i.e., Wuwei, Yongchang, Shandan, Zhangye, Gaotai, Jiuquan, Yumen, Guazhou and Dunhuang, from southeast to northwest (Figure 1). All the data used in this study were obtained from the China Meteorological Data Sharing Service System (http://data.cma.cn) in terms of monthly value, and were of good quality with no missing values or gap throughout the study period. The datasets were investigated for randomness and homogeneity, and autocorrelation analysis was applied to the monthly time series data of each station. More detailed description of the selected meteorological stations is shown in Table 1.
2.2. Aridity Index
The UNEP aridity index [25] was selected to indicate the degree of dryness of the climate in the study area. Regions were classified from hyper-arid to humid according to the ratio of precipitation and potential evapotranspiration (PET). The potential evapotranspiration (ETp) was estimated from the FAO-56 Penman–Monteith (FAO-56 PM) equation, which is as follows [26]:
where was the potential evapotranspiration (mm/d), was the slope of saturation vapor pressure function (k pa/ °C), was the net radiation (MJ/m2/d), represented soil heat flux density (MJ/m2/d), was the average 24-h wind speed at 2 m height (m/s), and was vapor pressure deficit (k pa).
According to the results from Equation (1), the regions were classified into five climate classes, i.e., hyper-arid (P/PET ≤ 0.05), arid (0.05 < P/PET ≤ 0.2), semi-arid (0.2 < P/PET ≤ 0.5), sub-humid (0.5 < P/PET ≤ 0.65) and humid (P/PET > 0.65).
2.3. Standard Precipitation Index (SPI)
The Standard Precipitation Index (SPI) was applied in the present study due to its effectiveness in drought identification and prediction of drought class transitions [27,28,29,30]. The SPI was developed to quantify the precipitation deficit for multiple time scales (e.g., 1, 3, 6, 12, 24 and 48 months) [31]. The SPI value is based on the total volume of the precipitation for any given time scale and the selection of the time scale is determined according to the purposes of the study. A Gamma distribution probability was adopted to describe the probability distribution of the precipitation and an SPI value was obtained through normal standardization [32]. Considering the location of the study area, the SPI values obtained in this study were classified into four categories: non-dry, mildly dry, moderately dry and severely/extremely dry (Table 2). A positive SPI implies that the observed precipitation is higher than the mean precipitation, while a negative SPI indicated the contrary. The severe and extremely severe drought classes were grouped for modeling purposes since transitions referring to the extremely severe dry categories are much less frequent [33].
2.4. Statistical Methods
2.4.1. Mann–Kendall Test
The Mann–Kendall test has been widely used to test for randomness in hydrology and climatology [34]. It is calculated via the following equation:
where n is the number of data points, xi and xj are the ith and jth data values in the time series (j > i), respectively, and sgn(xj − xi) is the sign function determined as:
In cases when the sample size n > 10, the mean value (μ(S)) and variance (σ2(S)) are given by the following equation:
where m is the number of tied groups and ti is the number of ties of extent i. A tied group is a set of sample data with the same value.
μ(S) = 0
In the absence of ties between the observations, the variance is calculated by the following equation:
The standard normal test statistic ZS is calculated as:
A positive ZS value indicates increasing trends; otherwise it represents decreasing trends. At the 5% significance level, the null hypothesis of the presence of no trend is rejected if |ZS| > 1.96.
2.4.2. Spearman’s Rho Test
Spearman’s Rho test is a non-parametric method commonly used to verify the absence of trends. The Spearman coefficient D and the standardized test statistic ZD are obtained from the following expressions separately [35,36]:
where n is the number of data items in the series, i is the order of the elements in the original series, and R(Xi) is the rank of ith observation Xi in the time series.
If ZD is a positive value, it indicates increasing trends; otherwise it shows decreasing trends. At the 5% significance level, the null hypothesis of no trend is rejected if |ZD| > 2.08.
2.4.3. Serial Autocorrelation Test
Temporal autocorrelation analysis correlates a time series dataset with itself at different time lags [37]. It is useful in checking randomness, locating patterns, or identifying the presence of a periodic signal in a time series dataset. For removing serial correlation from the series, previous study recommended pre-whitening the series before applying the Mann−Kendall and Spearman’s Rho tests [38]. The lag-1 serial correlation coefficient of sample data xi (designated by Rh) is expressed by [39]:
where μ(xi) is the mean of sample data and n is the sample size. If Rh > 0, the time series data show positive autocorrelation; if Rh < 0, the time series data is negative autocorrelation; if Rh = 0, the time series data shows no autocorrelation.
For the two-sided test, the Rh was obtained by the following equation at a 95% confidence level [39]:
where n is the sample size.
3. Results and Discussion
3.1. Summary of Statistical Parameters
Basic statistical parameters of monthly precipitation at the nine meteorological stations during 1970–2012 are summarized in Table 3. The minimum precipitation in the nine stations was zero, while the maximum values varied among the observed stations. During the study period, data from Dunhuang station in the northwest part of the study area showed the lowest mean monthly precipitation (3.59 mm), while Yongchang station in the southeast reported the highest, 17.22 mm. As for the coefficient of variation, the highest data was observed in Dunhuang station (105.01%), and the lowest, 76.37%, was found at Yumen station.
Analysis of the annual precipitation (Table 4) indicated that high variations occurred at the nine meteorological stations during the study period. The highest precipitation (301.2 mm) was found in 1983 at the Shandan station, and the lowest value of 11.60 mm occurred in 2008 at the Dunhuang station, as mentioned above, located in the northwest of the study area, which was the most distant from the sea and theoretically got the least precipitation. Furthermore, variations of annual precipitation varied from 20% to 50%; the largest CV value was found at Dunhuang station (47.13%), and data recorded at Yongchang station showed the lowest (18.19%).
3.2. Aridity Index
The calculated UNEP aridity index for the observed meteorological stations was given in Table 5. Overall, evaporation in the study area was much greater compared to the precipitation among the stations. Analysis of the results found that the three stations located in the northwest part (Dunhuang, Guazhou and Yumen) had high potential evapotranspiration, which were all more than 1,400 mm/a; while the minimum ET0 (2.44 mm/d) was found in Wuwei station, which was in the southeast end of the study area. Therefore, the results of the aridity index were merely ranged from 0.03 at Dunhuang and Guazhou stations to 0.22 at Yongchang station. In the study area, Dunhuang, Guazhou and Yumen stations were classified as hyper-arid, and Yongchang station was located in the semi-arid region, the other stations fell into the arid region according to the aridity index results.
3.3. Change of Precipitation at Different Time Scales
The serial correlation coefficient can verify the independence of precipitation time series. If the time series are completely random, the autocorrelation function will be zero for all lags other than zero [4]. Here, to accept the hypothesis that no correlation existed between the two consecutive observations and there was no persistence in the time series, the range of Rh (95%) was from −0.33 to 0.28 according to Equation (11) (n = 43).
The lag-1 serial correlation coefficients for seasonal and annual precipitation data of the nine meteorological stations are shown in Table 6. The coefficients ranged from −0.29 to 0.20 at the seasonal scale, and from −0.26 to −0.03 on the annual level, and both were in the range of Rh (95%). Therefore, the null hypothesis was accepted during the study period. Existence of the serial correlation had few effects on the following Mann−Kendall and Spearman’s Rho tests.
The results of Mann−Kendall, Spearman’s Rho statistical tests, and linear regression for the monthly precipitation series over the period 1970–2012 are summarized in Table 7.
As shown in Table 7, most of the stations in the study area displayed no significant change trends at thenmonth scale during 1979–2012. Only Yumen station showed significant increasing trends in three months, i.e., January, March and December, with a change rate of +0.04, +0.13 and +0.09 mm/a, respectively. Increasing change trends were also found at Shandan station in January with a slope of +0.08 mm/a, and at Dunhuang station in May with an increase rate of 0.13 mm/a. The other six stations showed no significant change patterns in monthly precipitation series.
Seasonal and annual trends of precipitation obtained by statistical methods are given in Table 8. Compared to the change characteristics of monthly series, the nine meteorological stations showed more significant change patterns at the seasonal and annual scales. On the seasonal level, both increasimg and decreasing trends were obtained in the four seasons. Yongchang, Gaotai and Yumen stations were dominated by significant increasing trends of 0.26, 0.28 and 0.34 mm/a in Spring season, respectively. Shandan, Gaotai, Jiuquan and Yumen stations had significant decreasing trends of 0.05, 0.14, 0.16 and 0.24 mm/a in winter season. Wuwei, Zhangye, Guazhou and Dunhuang stations displayed no significant change patterns in seasonal precipitation series, while at the annual scale, Yongchang station alone showed a significant trend with a rate of +0.38 mm/a.
As the change pattern results demonstrated, significant change patterns occurred less frequently from the monthly to annual levels. Significant decreasing trends were found at the seasonal level (winter), while significant increasing trends were identified at the monthly, seasonal (spring) and annual scales. Due to the location of the study area, the precipitation change was dominated by the East Asian monsoon [40], the geopotential height increase/decrease of Siberia and Iranian Plateau [41], the quantity of water vapor from Arabian Sea and Caspian Sea [42,43], westerly belt, plateau monsoon [44] and sea temperature [45]. All these factors significantly impacted the quantity and change of precipitation in the study area.
3.4. Analysis of SPI-12
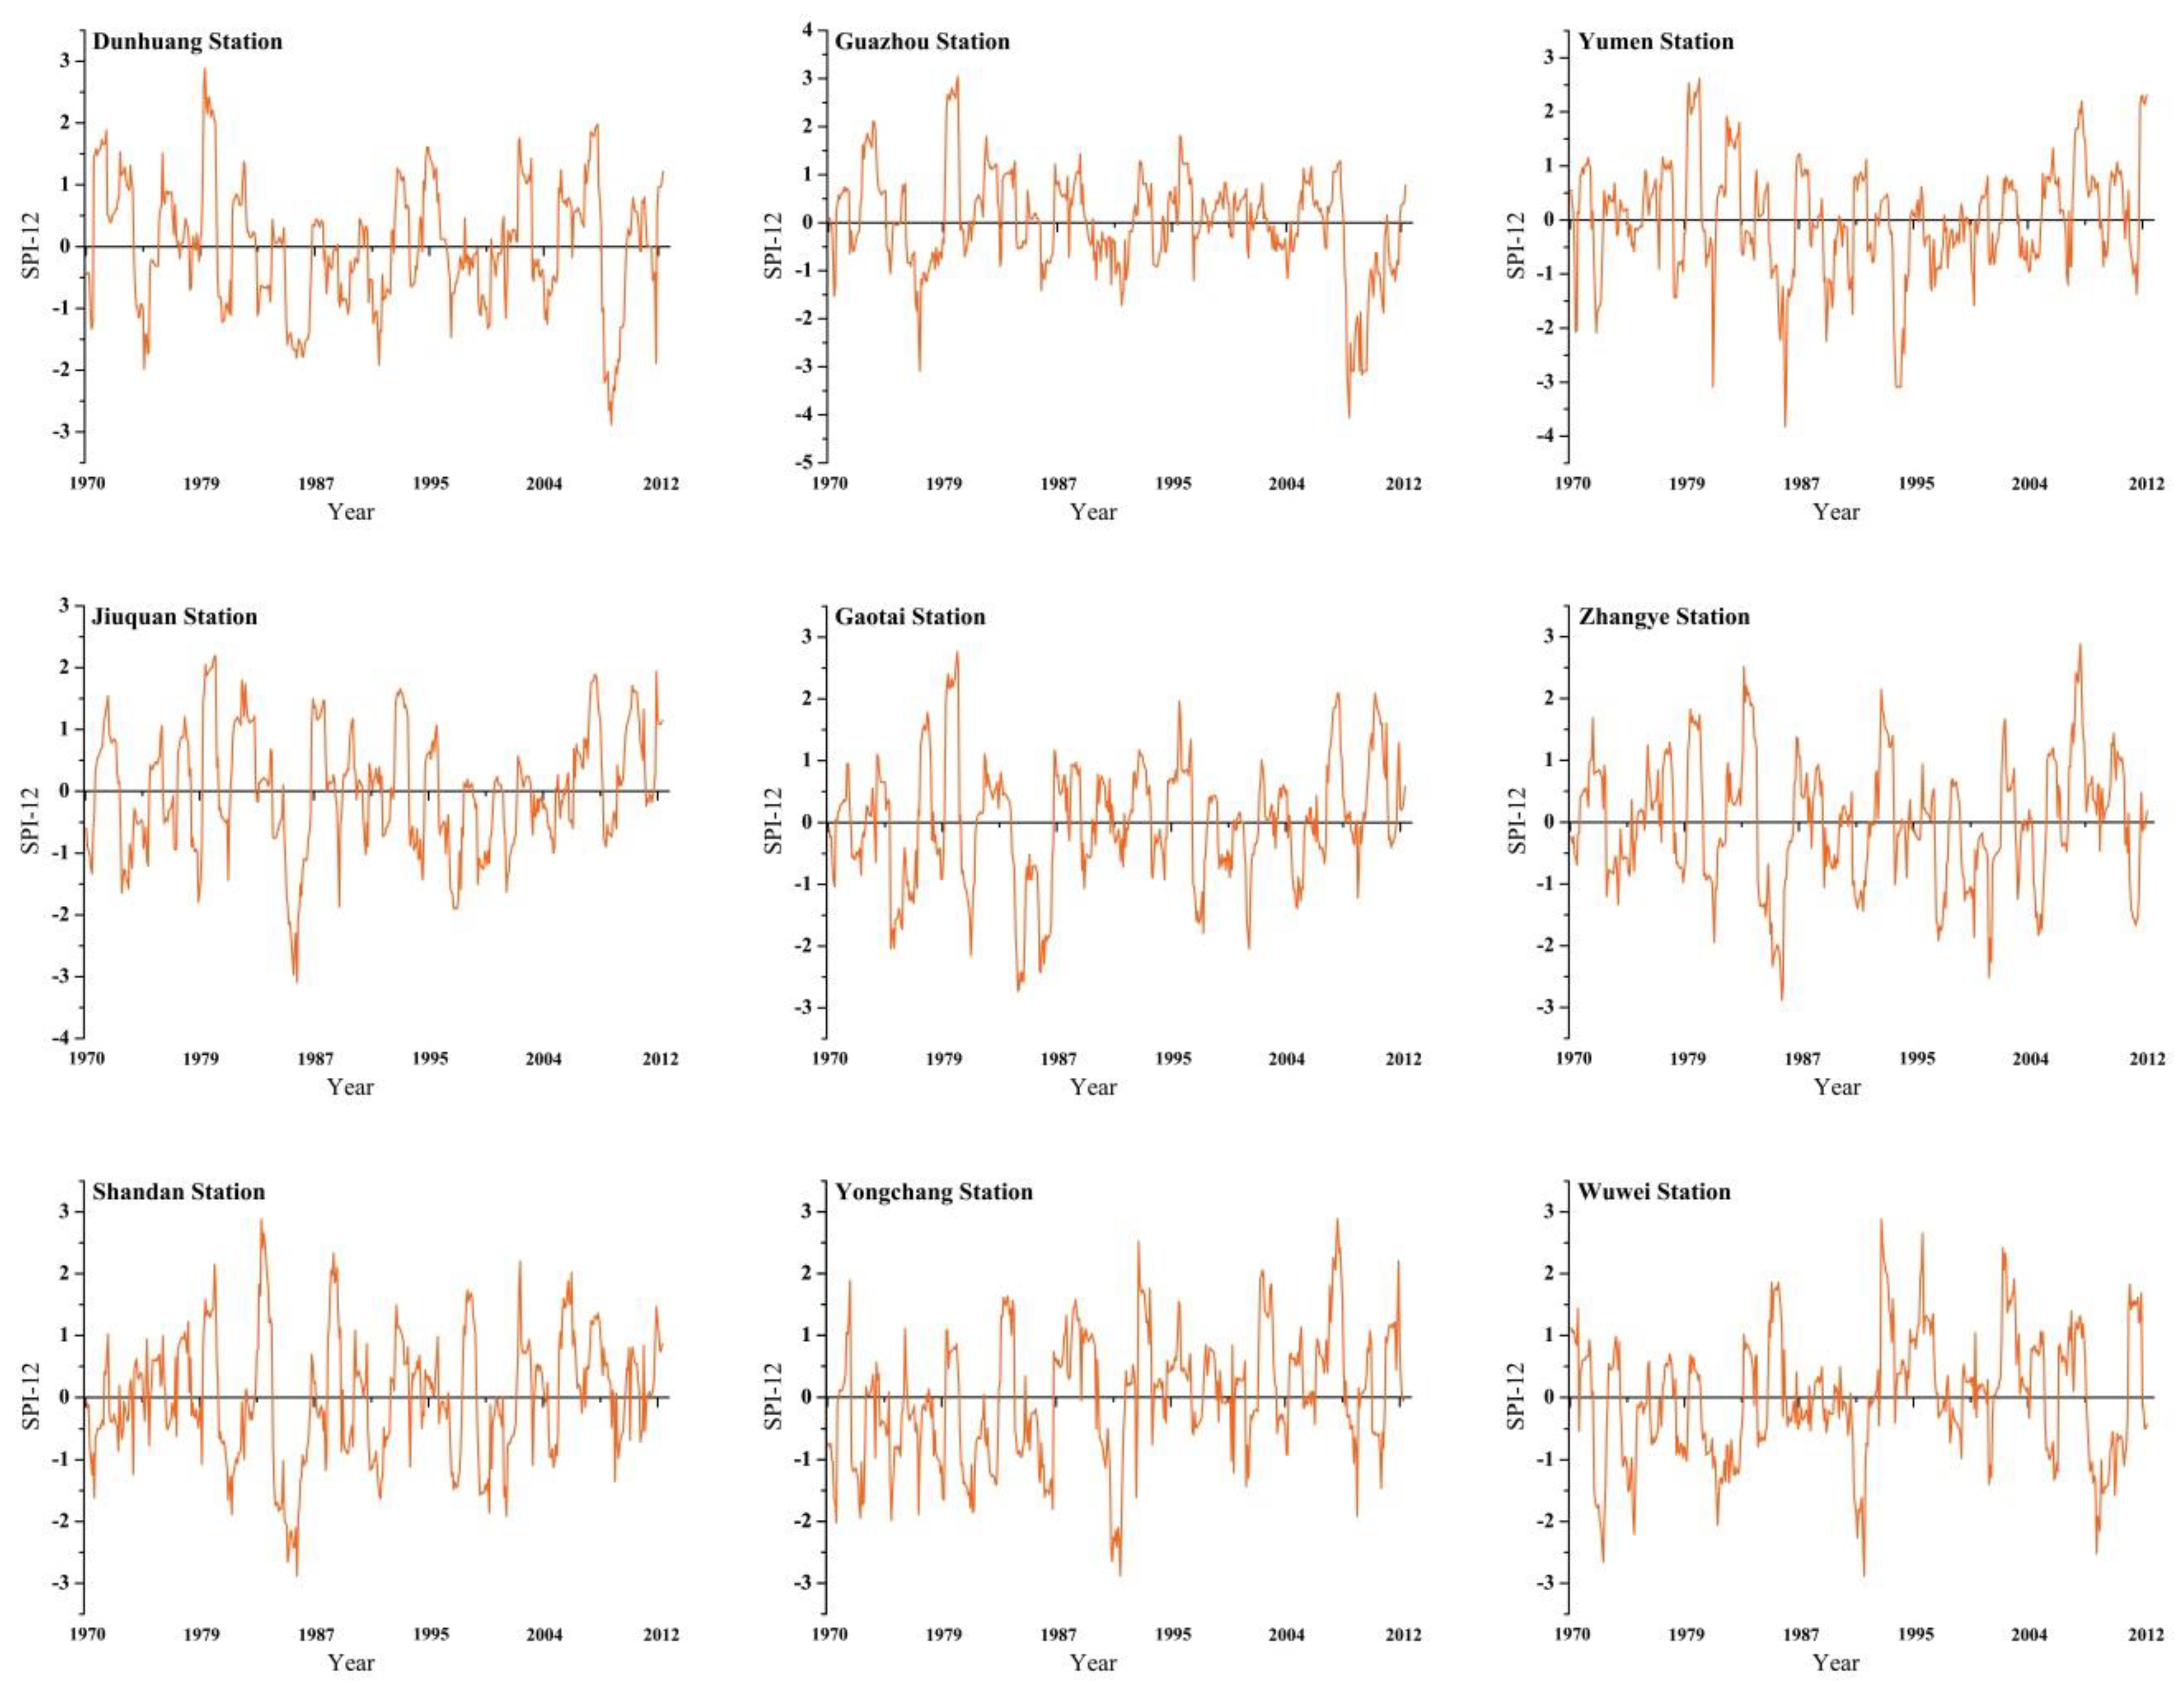
Due to the arid location of the study area, null values recorded at the observed stations in particular season occurred regularly. SPI at a short time interval may not be normally distributed for the highly skewed underlying precipitation distribution, which may contain more errors when simulating precipitation distributions in dry climates [46]. Here, SPI at a 12-month time scale for the observed meteorological stations were plotted in Figure 2, and the drought characteristics for SPI-12 at the observed stations were presented in Table 9 to identify long-term drought conditions.
According to the SPI results, the total continuing drought years ranged between 1 (at Wuwei, Yongchang, Shandan and Zhangye stations from 1991 to 1992) and 3 (at Gaotai and Guazhou stations between 1984–1987 and 2008–2011, respectively), and generally the most severe drought year was 1986 among the stations during the study period (Table 9). Specifically, the values of most severe drought indicated that the study area fell within severe or extreme dry conditions (SPI ≤ −1.5), which occurred in 1992 at Wuwei and Yongchang stations with the SPI-12 value of −2.88, 1984 at Gaotai station (−2.72), and 2009 at Dunhuang station (−2.88). Among the nine stations, the most severe drought occurred at Guazhou station (−4.06) in 2008. The total percentage of moderate and severe/extreme drought years during the study period ranged from 12.47% (Guazhou station) to 16.04% (Dunhuang station). However, for severe/extreme drought, Gaotai station had the highest percentage of 8.12%, and Guazhou station had the lowest (5.94%). Wuwei, Yongchang, Shandan, Zhangye and Dunhuang station, together with Jiuquan and Yumen station were dominated by the same severe/extreme percent, i.e., 6.93% and 6.34%, respectively. Overall, the rates of severe/extreme drought were generally lower than other study areas, e.g., Peninsular Malaysia [47], Southern Italy [48], Zimbabwe in southern Africa [49] and Iran in Central Asia [50], etc., in which various interpolation methods were used to detect the change pattern in the whole study area. Due to the deficiency of precipitation data in the study area, the estimated SPI results covering the whole Hexi Corridor were not available. However, as there were few drought monitoring studies for Hexi Corridor, the SPI results found in the present study can be used for reference and comparison.
4. Conclusions
The main objective of this study was to detect monthly, seasonal and annual precipitation changes and drought behavior in Hexi Corridor between 1970 and 2012. Monthly precipitation data from the nine meteorological stations were analyzed using the Mann–Kendall test, Spearman’s Rho test and linear regression. The results showed that precipitation in three stations had significant increasing change rates in different months. At the seasonal scale, significant increasing or decreasing trends varied at five stations, and four other stations displayed no significant change patterns. At the annual level, Yongchang station alone showed a significant increasing changing trend. Three main drought intervals were detected during the study period—an extremely dry year was found in 1986; the lowest SPI-12 index of −4.06 was detected in 2008 at Guazhou station; and decreasing trends were found at Guazhou and Dunhuang stations, while other stations had increasing trends for the SPI-12 series.
The results of precipitation characteristics and SPI-12 series found in this study can be conducive to agriculture production and rational use of water resources. Further research in forecasting drought using wavelet support vector regression models and analyzing the relationship of precipitation and climate change are recommended.
Acknowledgments
The authors would like to thank the editor and anonymous reviewers for their constructive comments and suggestions which have substantially improved the quality of this manuscript. This study was supported by the Postdoctoral Research Foundation (010/76562) and Youth Innovation Research Program (010/24150) of Shandong Agricultural University.
Author Contributions
X. Yu and G. Zhao conceived and designed the experiments; X. Yuan performed the experiments; W. Zhao and T. Yan analyzed the data; X. Yu wrote the paper.
Conflicts of Interest
The authors declare no conflict of interest.
References
- Han, L.; Zhang, Z.; Zhang, Q.; Wan, X. Desertification assessments in the Hexi corridor of northern China’s Gansu Province by remote sensing. Nat. Hazard. 2015, 75, 2715–2731. [Google Scholar] [CrossRef]
- Yu, X.; Lu, C. Alpine Glacier Change in the Eastern Altun Mountains of Northwest China during 1972–2010. PLoS ONE 2015, 10, e0117262. [Google Scholar] [CrossRef] [PubMed]
- Wagan, B.; Zhang, Z.; Baopeing, F.; Wagan, H.; Han, S.; Ahmad, I.; Kabo-Bah, A.T. Using the SPI to interpret spatial and temporal conditions of drought in China. Outlook Agric. 2015, 44, 235–241. [Google Scholar] [CrossRef]
- Gocic, M.; Trajkovic, S. Analysis of precipitation and drought data in Serbia over the period 1980–2010. J. Hydrol. 2013, 494, 32–42. [Google Scholar] [CrossRef]
- Cooley, A.; Chang, H. Precipitation Intensity Trend Detection using Hourly and Daily Observations in Portland, Oregon. Climate 2017, 5, 10. [Google Scholar] [CrossRef]
- Paredes, D.; Trigo, R.M.; Garciaherrera, R.; Trigo, I.F. Understanding Precipitation Changes in Iberia in Early Spring: Weather Typing and Storm-Tracking Approaches. J. Hydrometeorol. 2006, 7, 101–113. [Google Scholar] [CrossRef]
- Endo, N.; Kadota, T.; Matsumoto, J.; Ailikun, B.; Yasunari, T. Climatology and Trends in Summer Precipitation Characteristics in Mongolia for the Period 1960–1998. J. Meteorol. Soc. Jpn. 2006, 84, 543–551. [Google Scholar] [CrossRef]
- Chang, H.; Kwon, W.-T. Spatial patterns of summer precipitation trends in South Korea, 1973-2005. Environ. Res. Lett. 2007, 2, 045012. [Google Scholar] [CrossRef]
- Mahfouz, P.; Mitri, G.; Jazi, M.; Karam, F. Investigating the Temporal Variability of the Standardized Precipitation Index in Lebanon. Climate 2016, 4, 27. [Google Scholar] [CrossRef]
- Mayowa, O.O.; Pour, S.H.; Shahid, S.; Mohsenipour, M.; Harun, S.B.; Heryansyah, A.; Ismail, T. Trends in rainfall and rainfall-related extremes in the east coast of peninsular Malaysia. Journal of Earth System Science 2015, 124, 1609–1622. [Google Scholar] [CrossRef]
- Shahid, S. Spatio-temporal variability of rainfall over bangladesh during the time period 1969–2003. Social Sci. Electron. Publishing 2009, 45, 375–389. [Google Scholar]
- Sharma, S.; Singh, P.K. Long Term Spatiotemporal Variability in Rainfall Trends over the State of Jharkhand, India. Climate 2017, 5, 18. [Google Scholar] [CrossRef]
- Hanif, M.; Khan, A.H.; Adnan, S. Latitudinal precipitation characteristics and trends in Pakistan. J. Hydrol. 2013, 492, 266–272. [Google Scholar] [CrossRef]
- Niedźwiedź, T.; Twardosz, R.; Walanus, A. Long-term variability of precipitation series in east central Europe in relation to circulation patterns. Theor. Appl. Climatol. 2009, 98, 337–350. [Google Scholar] [CrossRef]
- Son, K.H.; Bae, D.H. Drought analysis according to shifting of climate zones to arid climate zone over Asia monsoon region. J. Hydrol. 2015, 529, 1021–1029. [Google Scholar] [CrossRef]
- Carvalho, L.M.V.; Jones, C.; Posadas, A.N.D.; Quiroz, R.; Bookhagen, B.; Liebmann, B. Precipitation Characteristics of the South American Monsoon System Derived from Multiple Datasets. J. Clim. 2012, 25, 4600–4620. [Google Scholar] [CrossRef]
- Gemmer, M.; Becker, S.; Jiang, T. Observed monthly precipitation trends in China 1951–2002. Theor. Appl. Climatol. 2004, 77, 39–45. [Google Scholar] [CrossRef]
- Becker, S.; Gemmer, M.; Jiang, T. Spatiotemporal analysis of precipitation trends in the Yangtze River catchment. Stoch. Environ. Res. Risk Assess. 2006, 20, 435–444. [Google Scholar] [CrossRef]
- Wang, W.; Shao, Q.; Yang, T.; Peng, S.; Yu, Z.; Taylor, J.; Xing, W.; Zhao, C.; Sun, F. Changes in daily temperature and precipitation extremes in the Yellow River Basin, China. Stoch. Environ. Res. Risk Assess. 2013, 27, 401–421. [Google Scholar] [CrossRef]
- Zhang, Q.; Xu, C.Y.; Becker, S.; Zhang, Z.X.; Chen, Y.D.; Coulibaly, M. Trends and abrupt changes of precipitation extremes in the Pearl River basin, China. Atmos. Sci. Lett. 2009, 10, 132–144. [Google Scholar] [CrossRef]
- Yin, S.; Li, W.; Jeonf, J.H.; Guo, W. Diurnal Variations of Summer Precipitation in the Beijing Area and the Possible Effect of Topography and Urbanization. Adv. Atmos. Sci. 2011, 28, 725–734. [Google Scholar] [CrossRef]
- Gao, M.; Hou, X. Trends and Multifractal Analyses of Precipitation Data from Shandong Peninsula, China. Am. J. Environ. Sci. 2012, 8, 271–279. [Google Scholar]
- Jiang, F.Q.; Hu, R.J.; Wang, S.P.; Zhang, Y.W.; Tong, L. Trends of precipitation extremes during 1960–2008 in Xinjiang, the Northwest China. Theor. Appl. Climatol. 2012, 111, 133–148. [Google Scholar] [CrossRef]
- Yu, X. Glacier Variation and Its Effects in Hexi Corridor during 1970–2012; Chinese Academy of Sciences: Beijing, China, 2015. [Google Scholar]
- UNEP. World Atlas of Desertification; Edward Arnold: London, UK, 1992. [Google Scholar]
- Allen, R.G. Crop Evapotranspiration-Guidelines for computing crop water requirements. Fao Irrig. Drain. Paper 1998, 300, D05109. [Google Scholar]
- Huang, W.; Yang, X.; Li, M.; Zhang, X.; Wang, M.; Dai, S.; Ma, J. Evolution characteristics of seasonal drought in the south of China during the past 58 years based on standardized precipitation index. Nongye Gongcheng Xuebao/Trans. Chin. Soc. Agric. Eng. 2010, 26, 50–59. [Google Scholar]
- Paulo, A.A.; Pereira, L.S. Prediction of SPI Drought Class Transitions Using Markov Chains. Water Resour. Manag. 2007, 21, 1813–1827. [Google Scholar] [CrossRef]
- Tabari, H.; Abghari, H.; Talaee, P.H. Temporal trends and spatial characteristics of drought and rainfall in arid and semiarid regions of Iran. Hydrol. Process. 2012, 26, 3351–3361. [Google Scholar] [CrossRef]
- Zargar, A.; Sadiq, R.; Khan, F.I. Uncertainty-Driven Characterization of Climate Change Effects on Drought Frequency Using Enhanced SPI. Water Resour. Manag. 2014, 28, 15–40. [Google Scholar] [CrossRef]
- McKee, T.B.; Doesken, N.J.; Kleist, J. The Relationship of Drought Frequency and Duration to Time Scales. In Proceedings of the 8th Conference on Applied Climatology, Anaheim, CA, USA, 17–22 January 1993. [Google Scholar]
- Lloyd-Hughes, B.; Saunders, M.A. A drought climatology for Europe. Int. J. Climatol. 2002, 22, 1571–1592. [Google Scholar] [CrossRef]
- Moreira, E.E.; Coelho, C.A.; Paulo, A.A.; Pereira, L.S.; Mexia, J.T. SPI-based drought category prediction using loglinear models. J. Hydrol. 2008, 354, 116–130. [Google Scholar] [CrossRef]
- Partal, T.; Kahya, E. Trend analysis in Turkish precipitation data. Hydrol. Process. 2006, 20, 2011–2026. [Google Scholar] [CrossRef]
- Mergenthaler, M.J. Nonparametrics: Statistical Methods Based on Ranks. Technometrics 1979, 21, 272–273. [Google Scholar] [CrossRef]
- Sneyers, R. On the statistical analysis of series of observations. J. Biol. Chem. 1990, 258, 13680–13684. [Google Scholar]
- Phillips, C.L.; Parr, J.M. Signals, systems and transforms. Anaesthesia 2003, 34, 217–218. [Google Scholar]
- Jolliffe, I. Analysis of Climate Variability: Applications of Statistical Techniques; Springer: New York, NY, USA, 2010. [Google Scholar]
- Salas, J. Applied Modeling of Hydrologic Time Series; Water Resources Publications: Littleton, CO, USA, 1980. [Google Scholar]
- Wang, W.; Zhu, Y.; Xu, R.; Liu, J. Drought severity change in China during 1961–2012 indicated by SPI and SPEI. Nat. Hazard. 2015, 75, 2437–2451. [Google Scholar] [CrossRef]
- Chen, D.; Dai, Y. Characteristics and analysis of typical anomalous summer rainfall patterns in Northwest China over the last 50 years. Chin. J. Atmos. Sci. 2009, 33, 1247–1258. [Google Scholar]
- Shen, L.; He, J.; Zhou, X.; Chen, L.; Zhu, C. The regional variabilities of the summer rainfall in China and its relation with anomalous moisture transport during the recent 50 years. Acta Meteorol. Sin. 2010, 68, 918–931. [Google Scholar]
- Zhang, Q.; Lv, J.; Yang, L.; Wei, J.; Peng, J. The interdecadal variation of precipitation pattern over China during summer and its relationship with the atmospheric internal dynamic processes and extraforcing factors. Chin. J. Atmos. Sci. 2007, 31, 1290–1300. [Google Scholar]
- Wang, K.; Jiang, H.; Zhao, H. Atmospheric water vapor transport from westerly and monsoon over the Northwest China. Adv. Water Sci. 2005, 16, 432–438. [Google Scholar]
- Wang, C.; Wang, S.; Yang, D.; Dong, A. The correlation between the Pacific sea surface temperature (SST) and precipitation over NW China. J. Trop. Meteorol. 2002, 18, 374–382. [Google Scholar]
- Mishra, A.K.; Singh, V.P. A review of drought concepts. J. Hydrol. 2010, 391, 202–216. [Google Scholar] [CrossRef]
- Yusof, F.; Hui-Mean, F.; Suhaila, J.; Yusop, Z.; Kong, C.Y. Rainfall characterisation by application of standardised precipitation index (SPI) in Peninsular Malaysia. Theor. Appl. Climatol. 2014, 115, 503–516. [Google Scholar] [CrossRef]
- Buttafuoco, G.; Caloiero, T.; Coscarelli, R. Analyses of Drought Events in Calabria (Southern Italy) Using Standardized Precipitation Index. Water Resour. Manag. 2015, 29, 557–573. [Google Scholar] [CrossRef]
- Manatsa, D.; Mukwada, G.; Siziba, E.; Chinyanganya, T. Analysis of multidimensional aspects of agricultural droughts in Zimbabwe using the Standardized Precipitation Index (SPI). Theor. Appl. Climatol. 2010, 102, 287–305. [Google Scholar] [CrossRef]
- Raziei, T.; Bordi, I.; Pereira, L.S.; Sutera, A. Space-time variability of hydrological drought and wetness in Iran using NCEP/NCAR and GPCC datasets. Hydrol. Earth Syst. Sci. Discuss. 2010, 14, 1919–1930. [Google Scholar] [CrossRef]
Figure 1.
Location of the nine meteorological stations in Hexi Corridor, northwest China.
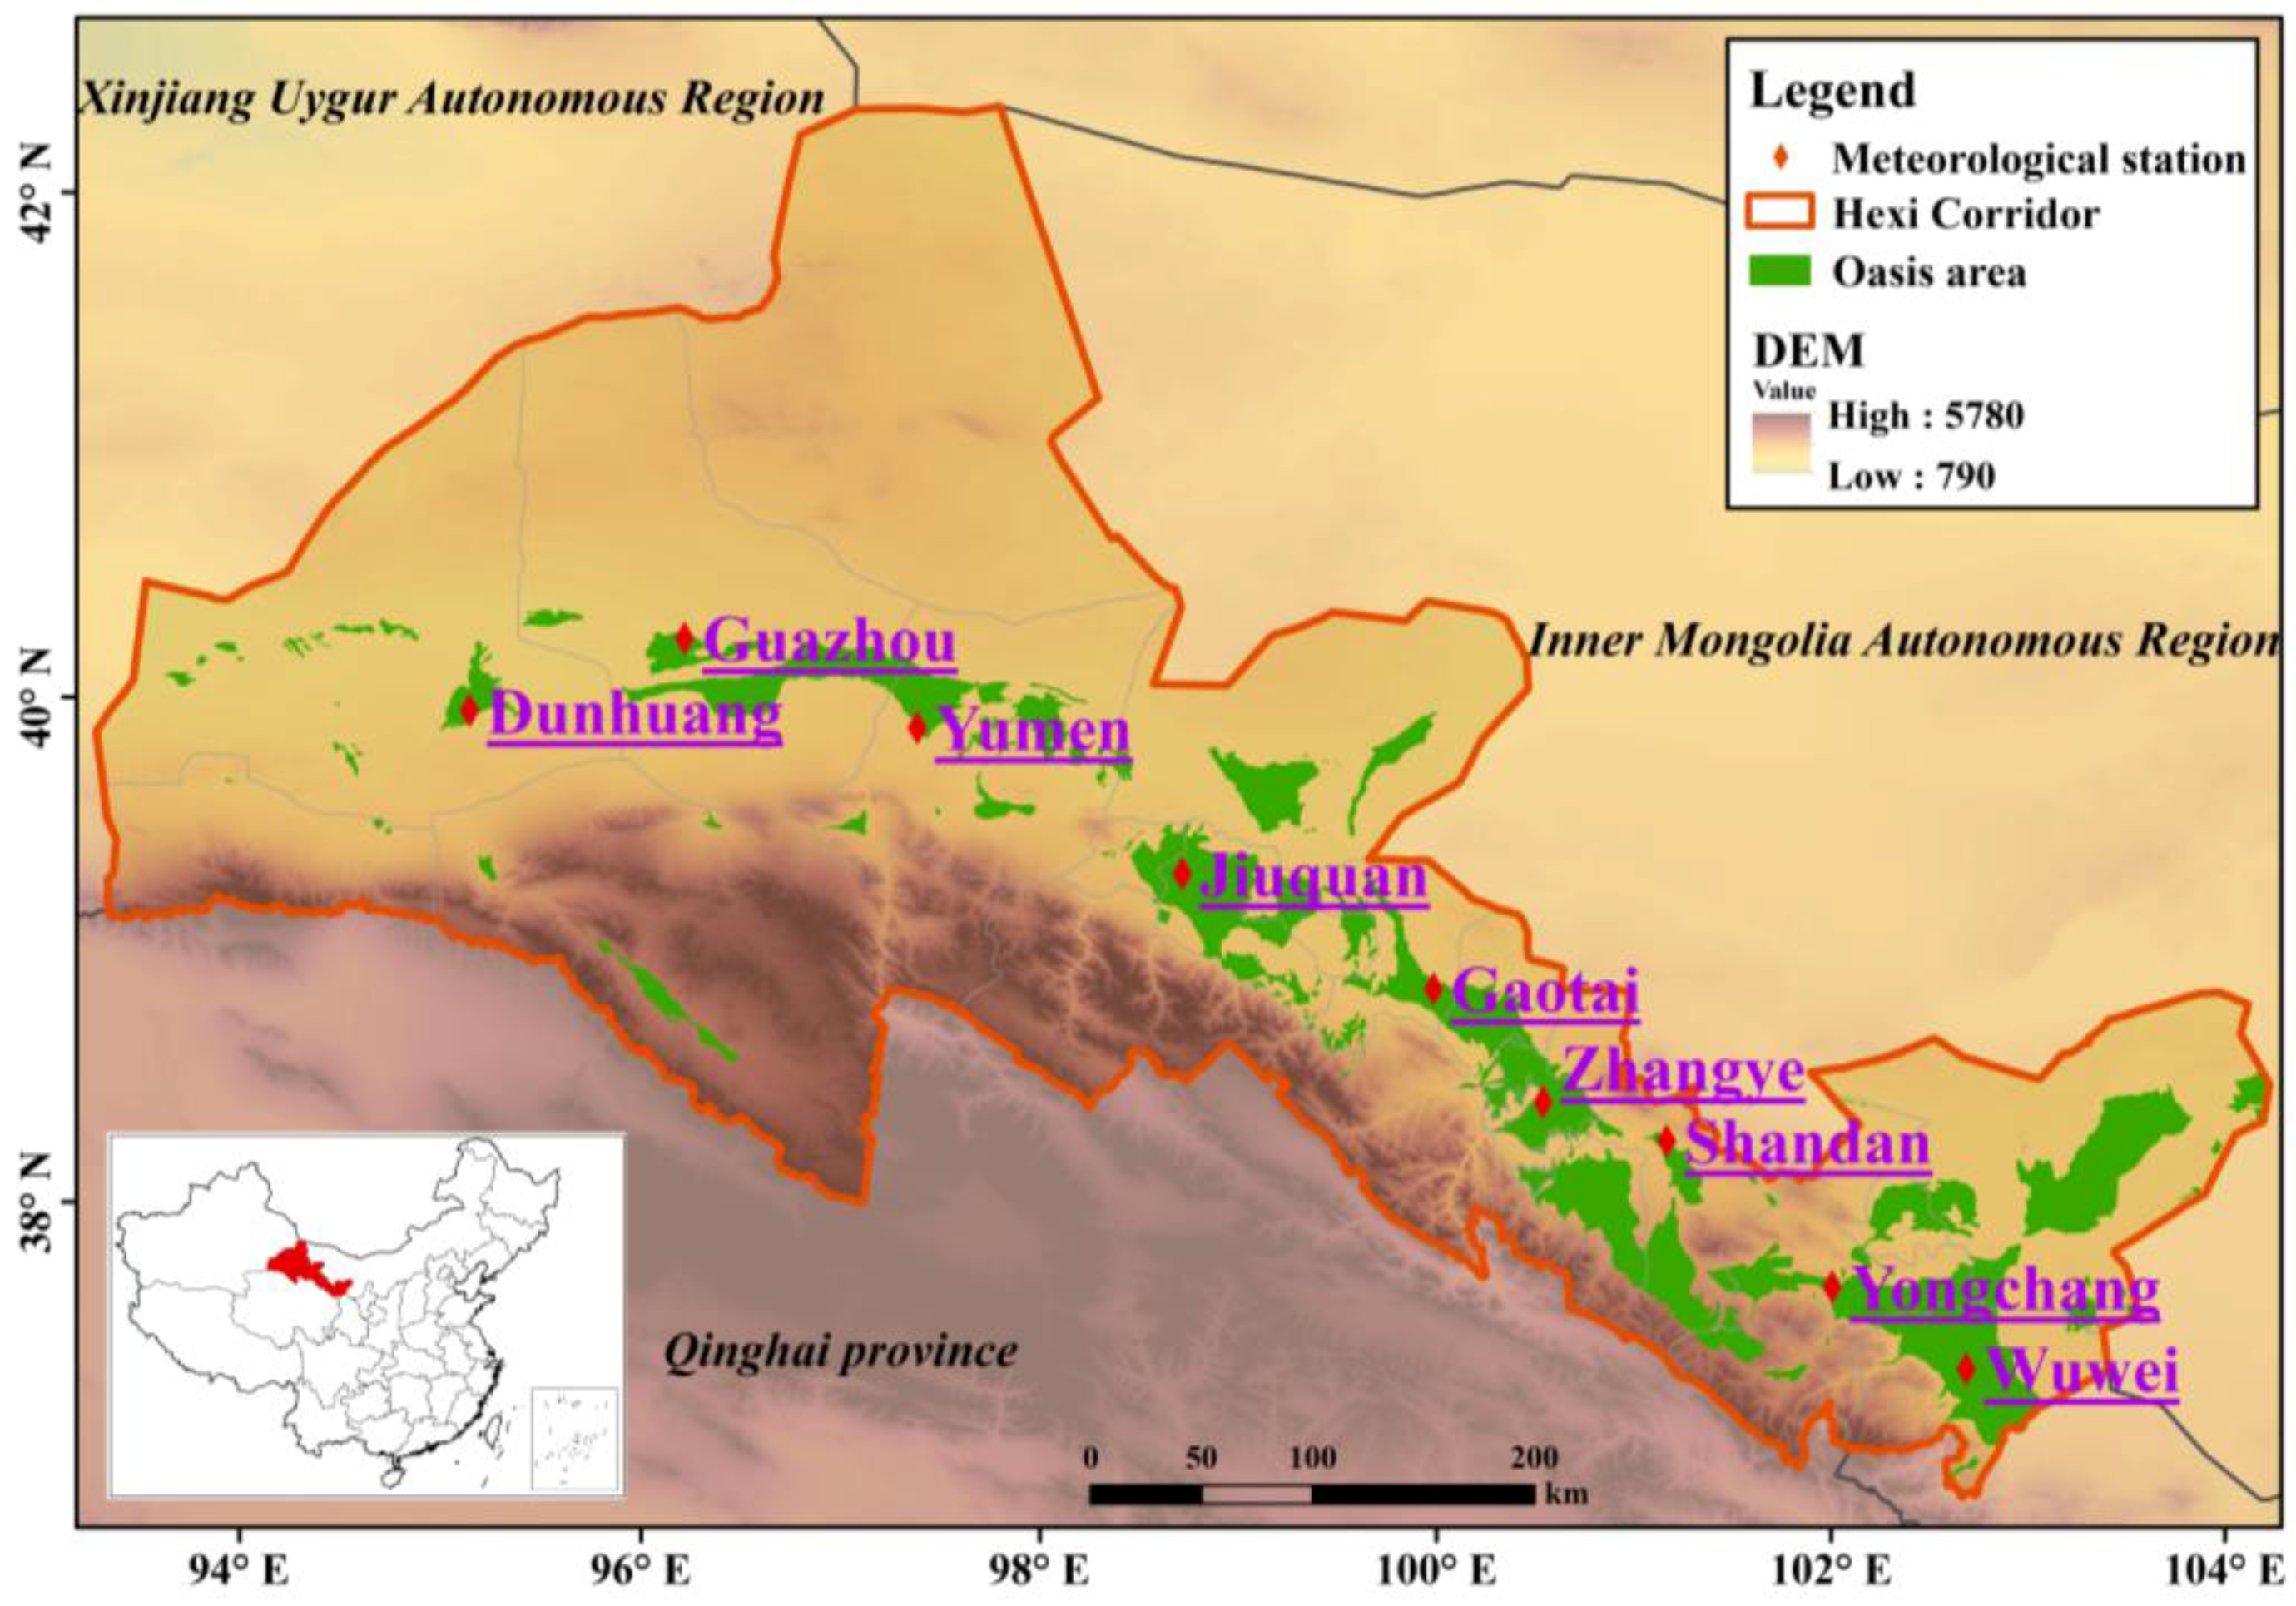
Figure 2.
SPI-12 at the nine meteorological stations during 1970–2012.


Table 1.
Geographical descriptions of meteorological stations in the study area.
| Name | Station ID | Longitude (°E) | Latitude (°N) | Elevation (m a.s.l.) |
|---|---|---|---|---|
| Wuwei | 52679 | 102.67 | 37.92 | 1532 |
| Yongchang | 52674 | 101.97 | 38.23 | 1976 |
| Shandan | 52661 | 101.08 | 38.80 | 1765 |
| Zhangye | 52652 | 100.43 | 38.93 | 1483 |
| Gaotai | 52546 | 99.83 | 39.37 | 1332 |
| Jiuquan | 52533 | 98.48 | 39.77 | 1477 |
| Yumen | 52436 | 97.03 | 40.27 | 1526 |
| Guazhou | 52424 | 95.77 | 40.53 | 1171 |
| Dunhuang | 52418 | 94.68 | 40.15 | 1139 |
Table 2.
The standardized precipitation index (SPI) categories based on the initial classification of SPI values.
Table 2.
The standardized precipitation index (SPI) categories based on the initial classification of SPI values.
| Class | SPI Value |
|---|---|
| Non-Dry | SPI ≥ 0 |
| Mildly dry | −1 < SPI < 0 |
| Moderately dry | −1.5 < SPI≤ −1 |
| Severely/extremely dry | SPI ≤ −1.5 |
Table 3.
Statistical parameters of monthly precipitation at the meteorological stations during the period 1970–2012.
Table 3.
Statistical parameters of monthly precipitation at the meteorological stations during the period 1970–2012.
| Station | Min (mm) | Max (mm) | Mean (mm) | SD (mm) | CV (%) | Skewness | Kurtosis |
|---|---|---|---|---|---|---|---|
| Wuwei | 0 | 114.50 | 14.13 | 12.58 | 89.03 | 2.23 | 6.55 |
| Yongchang | 0 | 122.40 | 17.22 | 17.02 | 98.84 | 1.90 | 4.21 |
| Shandan | 0 | 107.80 | 17.04 | 16.60 | 97.42 | 1.67 | 2.48 |
| Zhangye | 0 | 90.30 | 11.02 | 10.78 | 97.82 | 1.82 | 3.52 |
| Gaotai | 0 | 93.20 | 9.39 | 8.50 | 90.52 | 2.41 | 8.05 |
| Jiuquan | 0 | 92.40 | 7.45 | 6.84 | 91.81 | 3.10 | 13.07 |
| Yumen | 0 | 100.1 | 5.84 | 4.46 | 76.37 | 4.04 | 26.97 |
| Guazhou | 0 | 58.30 | 4.23 | 3.79 | 89.60 | 3.19 | 14.21 |
| Dunhuang | 0 | 60.70 | 3.59 | 3.77 | 105.01 | 3.69 | 18.03 |
Table 4.
Statistical parameters of annual precipitation at the meteorological stations during the study period.
Table 4.
Statistical parameters of annual precipitation at the meteorological stations during the study period.
| Station | Min (mm) | Max (mm) | Mean (mm) | SD (mm) | CV (%) | Skewness | Kurtosis |
|---|---|---|---|---|---|---|---|
| Wuwei | 101.60 | 251.30 | 169.52 | 40.66 | 23.98 | 0.27 | −0.73 |
| Yongchang | 110.50 | 294.60 | 206.58 | 37.57 | 18.19 | 0.28 | 0.42 |
| Shandan | 97.80 | 301.20 | 204.52 | 44.55 | 21.78 | 0.30 | 0.13 |
| Zhangye | 71.60 | 216.30 | 132.22 | 34.88 | 26.38 | 0.46 | 0.29 |
| Gaotai | 54.90 | 209.90 | 112.68 | 32.74 | 29.06 | 0.91 | 1.32 |
| Jiuquan | 41.40 | 165.60 | 89.28 | 30.39 | 34.03 | 0.82 | 0.11 |
| Yumen | 33.60 | 156.50 | 70.10 | 25.53 | 36.41 | 1.61 | 3.21 |
| Guazhou | 19.00 | 127.70 | 50.75 | 18.97 | 37.39 | 1.65 | 5.31 |
| Dunhuang | 11.60 | 105.50 | 43.12 | 20.32 | 47.13 | 1.04 | 1.04 |
Table 5.
Aridity index calculated using FAO-56 Pemman-Monteith equation.
| Station | Precipitation (mm/a) | ET0 (mm/d) | Aridity Index | Class |
|---|---|---|---|---|
| Wuwei | 169.52 | 2.44 | 0.19 | Arid |
| Yongchang | 206.58 | 2.57 | 0.22 | Semi-arid |
| Shandan | 204.52 | 2.80 | 0.20 | Arid |
| Zhangye | 132.22 | 2.59 | 0.14 | Arid |
| Gaotai | 112.68 | 2.57 | 0.12 | Arid |
| Jiuquan | 89.28 | 3.06 | 0.08 | Arid |
| Yumen | 70.10 | 3.84 | 0.05 | Hyper-arid |
| Guazhou | 50.75 | 4.63 | 0.03 | Hyper-arid |
| Dunhuang | 43.12 | 3.94 | 0.03 | Hyper-arid |
Table 6.
Lag-1 serial correlation coefficients for seasonal and annual precipitation data.
| Station | Spring | Summer | Autumn | Winter | Annual |
|---|---|---|---|---|---|
| Wuwei | 0.12 | 0.11 | 0.07 | −0.26 | −0.06 |
| Yongchang | 0.20 | 0.15 | 0.13 | −0.05 | −0.03 |
| Shandan | −0.01 | −0.19 | 0.07 | −0.29 | −0.19 |
| Zhangye | 0.04 | −0.22 | −0.03 | −0.16 | −0.19 |
| Gaotai | 0.13 | −0.22 | 0.05 | 0.14 | −0.26 |
| Jiuquan | 0.06 | −0.02 | −0.16 | 0.05 | −0.17 |
| Yumen | −0.03 | −0.08 | −0.12 | 0.22 | −0.22 |
| Guazhou | −0.00 | −0.09 | 0.04 | 0.12 | −0.04 |
| Dunhuang | −0.05 | 0.03 | −0.05 | −0.04 | −0.16 |
Table 7.
Statistical tests for monthly precipitation data of the nine stations during 1970–2012.
| Station | Test | Month | |||||||||||
|---|---|---|---|---|---|---|---|---|---|---|---|---|---|
| Jan. | Feb. | Mar. | Apr. | May | Jun. | Jul. | Aug. | Sep. | Oct. | Nov. | Dec. | ||
| Wuwei | ZS | 1.60 | −1.20 | 1.26 | −0.60 | 1.02 | −0.52 | 0.40 | 0.00 | 0.93 | 0.40 | 0.81 | 1.21 |
| ZD | 1.63 | −1.27 | 1.34 | −0.70 | 1.14 | −0.69 | 0.38 | 0.11 | 1.03 | 0.42 | 0.75 | 1.37 | |
| B (mm/a) | 0.25 | −0.20 | 0.21 | −0.11 | 0.18 | −0.11 | 0.06 | 0.02 | 0.16 | 0.07 | 0.12 | 0.21 | |
| Yongchang | ZS | 1.72 | 0.82 | 1.66 | 0.53 | 1.13 | −0.32 | 1.79 | −0.01 | 0.76 | 0.23 | 0.49 | 0.32 |
| ZD | 1.73 | 0.83 | 1.71 | 0.32 | 1.21 | −0.30 | 1.86 | 0.05 | 0.87 | 0.24 | 0.40 | 0.45 | |
| B (mm/a) | 0.26 | 0.13 | 0.26 | 0.05 | 0.19 | −0.05 | 0.28 | 0.01 | 0.14 | 0.04 | 0.06 | 0.07 | |
| Shandan | ZS | 2.03 * | −1.36 | 1.48 | −0.27 | 0.60 | −0.25 | 1.05 | −0.23 | 0.18 | 1.06 | 1.54 | 1.37 |
| ZD | 2.11 * | −1.48 | 1.42 | −0.34 | 0.68 | −0.15 | 0.96 | −0.18 | 0.15 | 0.93 | 1.66 | 1.32 | |
| B (mm/a) | 0.08 | −0.23 | 0.22 | −0.05 | 0.11 | −0.02 | 0.15 | −0.03 | 0.02 | 0.15 | 0.25 | 0.20 | |
| Zhangye | ZS | 1.47 | 0.39 | 0.57 | −0.99 | 1.17 | −0.78 | 0.00 | −1.58 | 0.38 | 0.74 | 0.65 | 1.76 |
| ZD | 1.54 | 0.49 | 0.59 | −0.92 | 1.30 | −0.80 | 0.03 | −1.58 | 0.28 | 0.45 | 0.61 | 1.70 | |
| B (mm/a) | 0.24 | 0.08 | 0.09 | −0.14 | 0.20 | −0.12 | 0.00 | −0.24 | 0.04 | 0.07 | 0.10 | 0.26 | |
| Gaotai | ZS | 1.52 | −0.97 | 1.09 | −0.50 | 0.39 | 0.81 | 0.43 | −0.86 | 0.37 | 0.39 | 0.33 | 1.29 |
| ZD | 1.83 | 0.27 | 2.54 | −0.89 | 1.12 | −0.86 | −0.23 | −0.52 | 0.22 | 0.78 | 1.00 | 3.19 | |
| B (mm/a) | 0.28 | 0.04 | 0.37 | −0.14 | 0.17 | −0.14 | −0.04 | −0.08 | 0.03 | 0.12 | 0.16 | 0.45 | |
| Jiuquan | ZS | 0.87 | −1.27 | 1.66 | −1.07 | 0.26 | −0.54 | 0.75 | −1.29 | 0.62 | 0.74 | 1.33 | 0.73 |
| ZD | 0.91 | −1.26 | 1.73 | −1.05 | 0.40 | −0.53 | 0.58 | −1.48 | 0.67 | 0.69 | 1.32 | 0.80 | |
| B (mm/a) | 0.14 | −0.20 | 0.26 | −0.16 | 0.06 | −0.08 | 0.09 | −0.23 | 0.11 | 0.11 | 0.20 | 0.13 | |
| Yumen | ZS | 1.96 * | −0.73 | 2.04 * | −1.54 | 1.11 | −1.37 | −0.46 | −0.81 | 0.76 | 0.33 | 0.57 | 2.54 * |
| ZD | 2.29 * | −0.77 | 2.10 * | −1.57 | 1.03 | −1.38 | −0.41 | −0.94 | 0.86 | 0.40 | 0.64 | 2.79 * | |
| B (mm/a) | 0.04 | −0.12 | 0.13 | −0.24 | 0.16 | −0.21 | −0.06 | −0.15 | 0.13 | 0.06 | 0.10 | 0.09 | |
| Guazhou | ZS | −0.07 | −0.49 | 1.38 | −0.90 | 0.66 | −1.19 | −1.43 | −1.53 | 0.73 | −0.20 | −0.18 | 1.70 |
| ZD | −0.07 | −0.54 | 1.32 | −0.86 | 0.59 | −1.19 | −1.29 | −1.55 | 0.89 | −0.22 | −0.12 | 1.55 | |
| B (mm/a) | −0.01 | −0.09 | 0.20 | −0.14 | 0.09 | −0.18 | −0.20 | −0.24 | 0.14 | −0.04 | −0.02 | 0.24 | |
| Dunhuang | ZS | −0.71 | −1.18 | 1.51 | −0.40 | 2.09 * | −1.09 | −1.10 | −1.72 | 1.90 | 0.59 | 0.02 | 1.37 |
| ZD | −0.84 | −1.50 | 1.72 | −0.40 | 2.08 * | −1.16 | −1.12 | −1.53 | 2.14 | 0.65 | 0.06 | 1.53 | |
| B (mm/a) | −0.13 | −0.23 | 0.26 | −0.06 | 0.13 | −0.18 | −0.17 | −0.24 | 0.32 | 0.10 | 0.01 | 0.24 | |
ZS: Mann–Kendall test; ZD: Spearman’s Rho test; B: Slope of linear regression. Bold characters represent trends identified by 2 statistical methods. * denotes statistically significant trends at the 5% significance level.
Table 8.
Statistical tests for seasonal and annual precipitation data during 1970–2012.
| Station | Test | Season | ||||
|---|---|---|---|---|---|---|
| Spring | Summer | Autumn | Winter | Annual | ||
| Wuwei | ZS | 1.42 | −0.28 | 0.54 | −0.50 | 0.77 |
| ZD | 1.44 | −0.46 | 0.68 | −0.56 | 0.62 | |
| B (mm/a) | 0.25 | −0.20 | 0.21 | −0.11 | 0.10 | |
| Yongchang | ZS | 2.48 * | 0.98 | 1.55 | −0.04 | 2.20 * |
| ZD | 2.60 * | 1.01 | 1.63 | 0.00 | 2.62 * | |
| B (mm/a) | 0.26 | 0.13 | 0.26 | 0.05 | 0.38 | |
| Shandan | ZS | 1.74 | −0.54 | 0.67 | −2.30 * | 1.09 |
| ZD | 1.71 | −0.37 | 0.60 | −2.34 * | 1.11 | |
| B (mm/a) | 0.32 | −0.23 | 0.22 | −0.05 | 0.17 | |
| Zhangye | ZS | 1.58 | −0.14 | −0.41 | −1.49 | 0.15 |
| ZD | 1.66 | −0.07 | −0.51 | −1.52 | 0.15 | |
| B (mm/a) | 0.24 | 0.08 | −0.09 | −0.14 | 0.02 | |
| Gaotai | ZS | 3.02 * | 0.07 | −0.01 | −2.48 * | 0.94 |
| ZD | 3.24 * | 0.05 | −0.06 | −2.59 * | 0.91 | |
| B (mm/a) | 0.28 | 0.04 | −0.37 | −0.14 | 0.14 | |
| Jiuquan | ZS | 1.60 | −1.05 | −0.70 | −2.18 * | 0.22 |
| ZD | 1.65 | −1.08 | −0.67 | −2.21 * | 0.20 | |
| B (mm/a) | 0.14 | −0.20 | −0.26 | −0.16 | 0.03 | |
| Yumen | ZS | 2.26 * | −0.74 | −0.07 | −1.98 * | −0.02 |
| ZD | 2.15 * | −0.80 | −0.11 | −2.07 * | −0.05 | |
| B (mm/a) | 0.34 | −0.12 | −0.31 | −0.24 | −0.01 | |
| Guazhou | ZS | −0.70 | −0.46 | −1.26 | −1.05 | −1.02 |
| ZD | −0.72 | −0.50 | −1.20 | −1.05 | −1.05 | |
| B (mm/a) | −0.01 | −0.09 | −0.20 | −0.14 | −0.16 | |
| Dunhuang | ZS | −0.29 | −0.05 | −1.39 | −1.05 | −0.00 |
| ZD | −0.25 | −0.03 | −1.33 | −1.19 | −0.09 | |
| B (mm/a) | −0.13 | −0.23 | −0.26 | −0.06 | −0.01 | |
ZS: Mann–Kendall test; ZD: Spearman’s Rho test; B: Slope of linear regression. Bold characters represent trends identified by the two statistical methods. * represents statistically significant trends at the 5% significance level.
Table 9.
Drought characteristics at a 12-month scale in the study area
| Station | The most Severe Drought | Percent of Drought Years during the Study Period | ||
|---|---|---|---|---|
| SPI-12 | Year | Moderate (%) | Severe/Extreme (%) | |
| Wuwei | −2.88 | 1992 | 8.91 | 6.93 |
| Yongchang | −2.88 | 1992 | 8.91 | 6.93 |
| Shandan | −2.88 | 1986 | 8.91 | 6.93 |
| Zhangye | −2.88 | 1986 | 8.91 | 6.93 |
| Gaotai | −2.72 | 1984 | 5.94 | 8.12 |
| Jiuquan | −3.09 | 1986 | 6.34 | 6.34 |
| Yumen | −3.82 | 1986 | 6.34 | 6.34 |
| Guazhou | −4.06 | 2008 | 6.53 | 5.94 |
| Dunhuang | −2.88 | 2009 | 9.11 | 6.93 |
© 2017 by the authors. Licensee MDPI, Basel, Switzerland. This article is an open access article distributed under the terms and conditions of the Creative Commons Attribution (CC BY) license (http://creativecommons.org/licenses/by/4.0/).
Share and Cite
MDPI and ACS Style
Yu, X.; Zhao, G.; Zhao, W.; Yan, T.; Yuan, X. Analysis of Precipitation and Drought Data in Hexi Corridor, Northwest China. Hydrology 2017, 4, 29. https://doi.org/10.3390/hydrology4020029
AMA Style
Yu X, Zhao G, Zhao W, Yan T, Yuan X. Analysis of Precipitation and Drought Data in Hexi Corridor, Northwest China. Hydrology. 2017; 4(2):29. https://doi.org/10.3390/hydrology4020029
Chicago/Turabian StyleYu, Xinyang, Gengxing Zhao, Weijun Zhao, Tingting Yan, and Xiujie Yuan. 2017. "Analysis of Precipitation and Drought Data in Hexi Corridor, Northwest China" Hydrology 4, no. 2: 29. https://doi.org/10.3390/hydrology4020029
Note that from the first issue of 2016, this journal uses article numbers instead of page numbers. See further details here.