Article

Application of a Standardized Precipitation Index for Meteorological Drought Analysis of the Semi-Arid Climate Influence in Minas Gerais, Brazil

by
Bruno Henrique Toná Juliani
* and
Cristhiane Michiko Passos Okawa
Department of Civil Engineering, State University of Maringá—Av Colombo, 5790, 87020-900 Maringá, Paraná, Brazil
*
Author to whom correspondence should be addressed.
Hydrology 2017, 4(2), 26; https://doi.org/10.3390/hydrology4020026
Submission received: 21 March 2017 / Revised: 26 April 2017 / Accepted: 27 April 2017 / Published: 3 May 2017

Abstract

:
In recent years, the Southeast region in Brazil has suffered from the effects of drought events. Analyzing the history of drought events is fundamental to establish potential risks of the occurrence of droughts in the future. One of the many ways to prevent substantial impacts and evaluate a drought risk assessment is through analysis of severity, duration and frequency characteristics of these events. In this context, the current study developed Severity-Duration-Frequency curves and derived an isohyetal map for the area influenced by the semi-arid climate in the state of Minas Gerais, through the analysis of 17 rainfall stations. The drought events identification and the analysis of its conditions were assessed using the Standardized Precipitation Index (SPI) for a 12-month time scale. The SDF curves were developed using the minimum cumulative 12-month precipitation values fitted to the Gamma distribution for 1, 3, 6, 9 and 12-month drought durations. The computed SDF curves for each station were further regionalized in order to obtain a general result for the study area. It can be observed that for a return period of 100 years, the estimated cumulative 12-month precipitation varies from 353 mm in a 1-month drought duration to 458 mm in a 12-month drought duration. The derived isohyetal map provides a more accurate local application of the results.

1. Introduction

A real challenge in water resources management is monitoring and forecasting drought events. There is no concrete definition of what is a drought, considering the many approaches it carries [1]. One of these approaches is the meteorological drought, where the events are characterized by precipitation rates below the average for a space area during a certain period of time [2]. Droughts differ from one another in three essential characteristics: severity, duration and spatial coverage [3]. Therefore, a useful tool in drought studies is severity-duration-frequency curves, that relate drought severity, its duration and frequency of occurrence in a single figure [4].
To quantify the duration, intensity, frequency and spatial extent of droughts, several drought indices have been used [4]. One of the indices is the Standardized Precipitation Index (SPI), developed by McKee, Doesken and Kleist [5]. The SPI provides an indicator of drought severity, and may be calculated for different time scales. The time scale is related with the cumulative amount of precipitation analyzed. Applying statistical procedures over a precipitation record, the SPI method results in normalized values associated with the probability of occurrence of precipitation rates.
Time series models are relevant tools for rainfall and drought forecasting. In fact, analyzing the history of drought events over time series models is fundamental to establish the potential risks of the occurrence of droughts in the future [6]. In recent years, many severe drought events occurred worldwide. Countries as Namibia, Angola, Brazil, New Zealand and countries from Central Europe suffered serious impacts due to droughts [7]. These effects were observed in the Southeast region in Brazil, where precipitation rates were found to be below the expected between 2013 and 2015 [8].
The frequency and severity of extreme drought events can be studied as an observation of factors of identified past events [4]. These information data may be presented in drought severity-duration-frequency curves and isoseverity maps, as new decision support tools to support planning and policy development [9]. For the curves, it is essential a suitable regression model. Previous studies applied different regression models in the estimation of reference potential evapotranspiration, estimation of water requirement for irrigation channels and in estimation of area equipped for irrigation. Some of the regression models may be performed using specific software [10,11,12,13].
Learning more about the hydrological characteristics of a region can help us to undertake better planning for the allocation of water resources, which is important in the occurrence of a drought event [14]. In areas with limited water resources or that are affected by droughts, a suitable irrigation planning can improve agricultural production and irrigation efficiency [15]. For example, the study carried out by Valipour [16] concludes that governments’ policies are important to assess countries’ conditions for agricultural water management, which is one of the most important parameters to achieve the sustainable development in the world [17].
With an area of 586,519.727 km2 and just over 19 million inhabitants, Minas Gerais is the biggest state and the second most populous state in Southeast region in Brazil [18]. The state of Minas Gerais has a varied climate ranging from semi-arid, tropical wet and hot temperate [19]. The vegetation of the state is predominantly that of the cerrado, similar to a savanna with wet and dry periods being well defined; the atlantic forest, located along the mountain range in the southeast Minas Gerais; and the caatinga, a desert vegetation correlated with the semi-arid climate located in the northeast Minas Gerais.
The present study aims to obtain the influence of semi-arid climate in the severity and occurrence of Minas Gerais drought through precipitation rates, in a way it can be understood by ordinary users. The Standardized Precipitation Index was applied with the 12-month cumulative time scale. Precipitation deficits were identified based on threshold levels corresponding to SPI drought class boundaries. Severity-Duration-Frequency curves were plotted for each studied station, and a regionalization for a general approach of the semi-arid region using Thiessen polygons was computed. More accurate values for the analysis in a local approach can be observed in the isohyetal map plotted for a 1-month drought duration and recurrence interval of 100 years.

2. Materials and Methods

Associating the semi-arid climate with the catchment areas presented by the Brazilian National Water Agency (ANA), we identified three sub-catchments in the referred area: numbers 44, 45 and 53 [20]. The study area comprehends the portion of those three sub-catchments contained in Minas Gerais State, as shown in Figure 1.
Nine stations across the semi-arid region in Minas Gerais were selected from the 41 available. Eight other stations placed in the surrounding area were also selected, aiming an appropriate spatial distribution over the study area in order to obtain a better and more accurate regionalization. Figure 2 presents the selected stations for the study. The data were downloaded from the Brazilian National Water Agency website [20]. As criteria for the selection of the stations, at least 30 years of rainfall data values should be available. This length of record ensures the reliability of the results. For missing monthly rainfall, the linear regression method was applied. This method consists of the selection of other stations in the surroundings of the one with the missing data and the analysis of the linear correlation between the monthly rainfall values of the stations. The neighbor station that presented the best correlation coefficient was selected, and the missing value is adopted as the result of the linear regression equation.
The Standardized Precipitation Index (SPI) was developed by McKee, Doesken and Kleist in 1993 to classify precipitation time series as standardized values related with a probability of occurrence of the rain [21]. The SPI computes the precipitation deficit for multiple time scales. Moreover, for this research, we adopted the 12-month time scale, since it is associated with flow of water bodies and reservoir water levels [22]. The estimation of SPI includes an application of aggregated monthly precipitation series in a cumulative probability distribution function (PDF) [23]. The gamma PDF is computed as:
g ( x ) = x α 1 e x / β β α Γ ( α )
where α is a shape parameter, which is estimated using the method of maximum likelihood; β is a scale parameter; x is the precipitation value; and Γ ( α ) is the gamma function, given as Γ ( α ) =   0 y α 1 e y d y . The cumulative distribution function (CDF) gamma is obtained integrating the PDF function, as shown in Equation (2):
G ( x ) =   0 x g ( x ) d x =   0 x x α ^ 1 e x / β ^ β ^ α ^ Γ ( α ^ ) d x
where the parameters of the CDF function G ( x ) are α ^ =   [ 1 4 A ( 1 + 1 + 4 A 3 ) ] ; β ^ =   [ x ^ a ^ ] ; and A = [ ln ( x ¯ ) ln ( x ) n ] ; n is the number of precipitation observations and x ¯ is the mean of the sample data.
The CDF gamma is transformed in the CDF of the standard normal distribution with mean zero and unit variance, given in the equation (3) [23]. The correlation given in equation 3 can be observed in Figure 3.
SPI =   Ψ 1 [ G ( x ) ]
A positive value of SPI represents the precipitation above average, and a negative SPI corresponds below average precipitation. According to McKee, Doesken and Kleist, a drought event is defined as a continuous period with negative SPI reaching a value of −1.0 or less, until it becomes positive. In Table 1, Rahmat adapts the classification system for drought intensities [1,5].
The precipitation threshold as well as the precipitation deficit can be calculated using the rainfall data applied for the SPI. The threshold levels are related with the categories of droughts listed in the Table 1. Furthermore, for this study, the threshold level is considered when the SPI reaches −1.00, which means a normal distribution cumulated probability of 0.158 in the analysis of the 12-month moving cumulative precipitation.
A partial duration series (PDS) analysis is conducted, since it is based on the magnitude of all drought events above a certain predetermined threshold and is related with the SPI event identification [24]. Therefore, the SPI time series was built using the PDS analysis. By the definition of droughts for the SPI analysis, the events start when the value of SPI reaches −1.00 and it finishes when the SPI becomes positive. The aim of the PDS analysis in this study is to identify events of drought with durations of 1, 3, 6, 9 and 12 months. One-month drought duration is the lowest 12-month precipitation from each event. For the other durations, the cumulative 12-month precipitation for each consecutive month is added, and the minimum value is taken. The critical values for each event should be selected and ranked in an ascendant order, with the first one being the driest period with the lower SPI value.
For the analysis of the ranked precipitation values, a simple statistical distribution that provides well fitting results is the gamma distribution. This distribution is simple considering it requires only two parameters: shape and scale [25]. The gamma distribution provides a well fitting distribution in drought analysis, since the gamma distribution is limited by zero. Furthermore, a analysis that excludes negative values is suitable for low precipitation rates [26]. The goodness of fit for this distribution is analyzed by the Anderson-Darling test [27], calculated as follows:
A D = ( i = 1 N ( 2 i 1 ) N [ ln F ( Y i ) + ln ( 1 F ( Y N + 1 i ) ] ) N
where F is the CDF of the specified distribution; i is the position in ascending order of magnitudes; and N is the number of data points.
To be significant at the 0.05 confidence level, the result of the AD test must not exceed the critical value (ADCV), calculated as in Equation (5).
A D C V = 0.752 1 + 0.75 N + 2.25 N 2
Following the same methodology as Rahmat, the application of the gamma distribution and the AD test is made by the use of the Minitab software package [1]. The software also provides the probabilities of exceedance related with each precipitation value. The output from the Minitab software package is used in the compilation of the Severity-Duration-Frequency (SDF) curves.
The exceedance probabilities given in the fit of the gamma distribution are transformed into recurrence intervals for the plotting of the SDF curves as shown in Equation (6).
EP   = 1 A R I   ×   100
where EP is the exceedance probability; and ARI is the average recurrence interval, in years.
The SDF curves for each station are plotted following the cumulative precipitation of 12 months for different return periods and selected drought durations. These precipitation values represent the amount of rainfall expected for the 12 months prior to the beginning of the drought event.
Aiming to obtain general SDF curves for the study area, a regionalization is estimated using a weighted average among the individual stations. The Thiessen polygon method consists of an analysis considering an influenced area of each one of the stations, observed in Figure 4. The Thiessen polygons were defined through the ArcMap 10.3 software (Esri, Redlands, CA, USA).
The regionalized SDF curves are tested on its precision by an error computation. The error is given as a percentage by the following equation.
%   Error   = ( P I S ( A R I ,       d )   P M ( A R I ,       d ) P I S ( A R I ,       d ) )   ×   100
where P I S ( A R I ,       d ) is the 12-month cumulative average precipitation value for each station, to an ARI equal to n years and a drought duration equal to d months; and P M ( A R I ,       d ) is the weighted mean of 12-month cumulative average precipitation values of the cluster of stations.
Isohyetal maps work as a visual and practical tool for better planning and management of water resources, and define a more accurate spatial distribution of precipitation [28]. For this paper, the inverse distance squared weighting method was applied, via the software ArcMap. The isohyetal map objectivized for this paper takes in consideration the critical values for a 1-month drought in an average recurrence interval of 100 years. For a better comprehension, contour lines are applied for the limits of precipitation ranges of 50 mm.

3. Results and Discussion
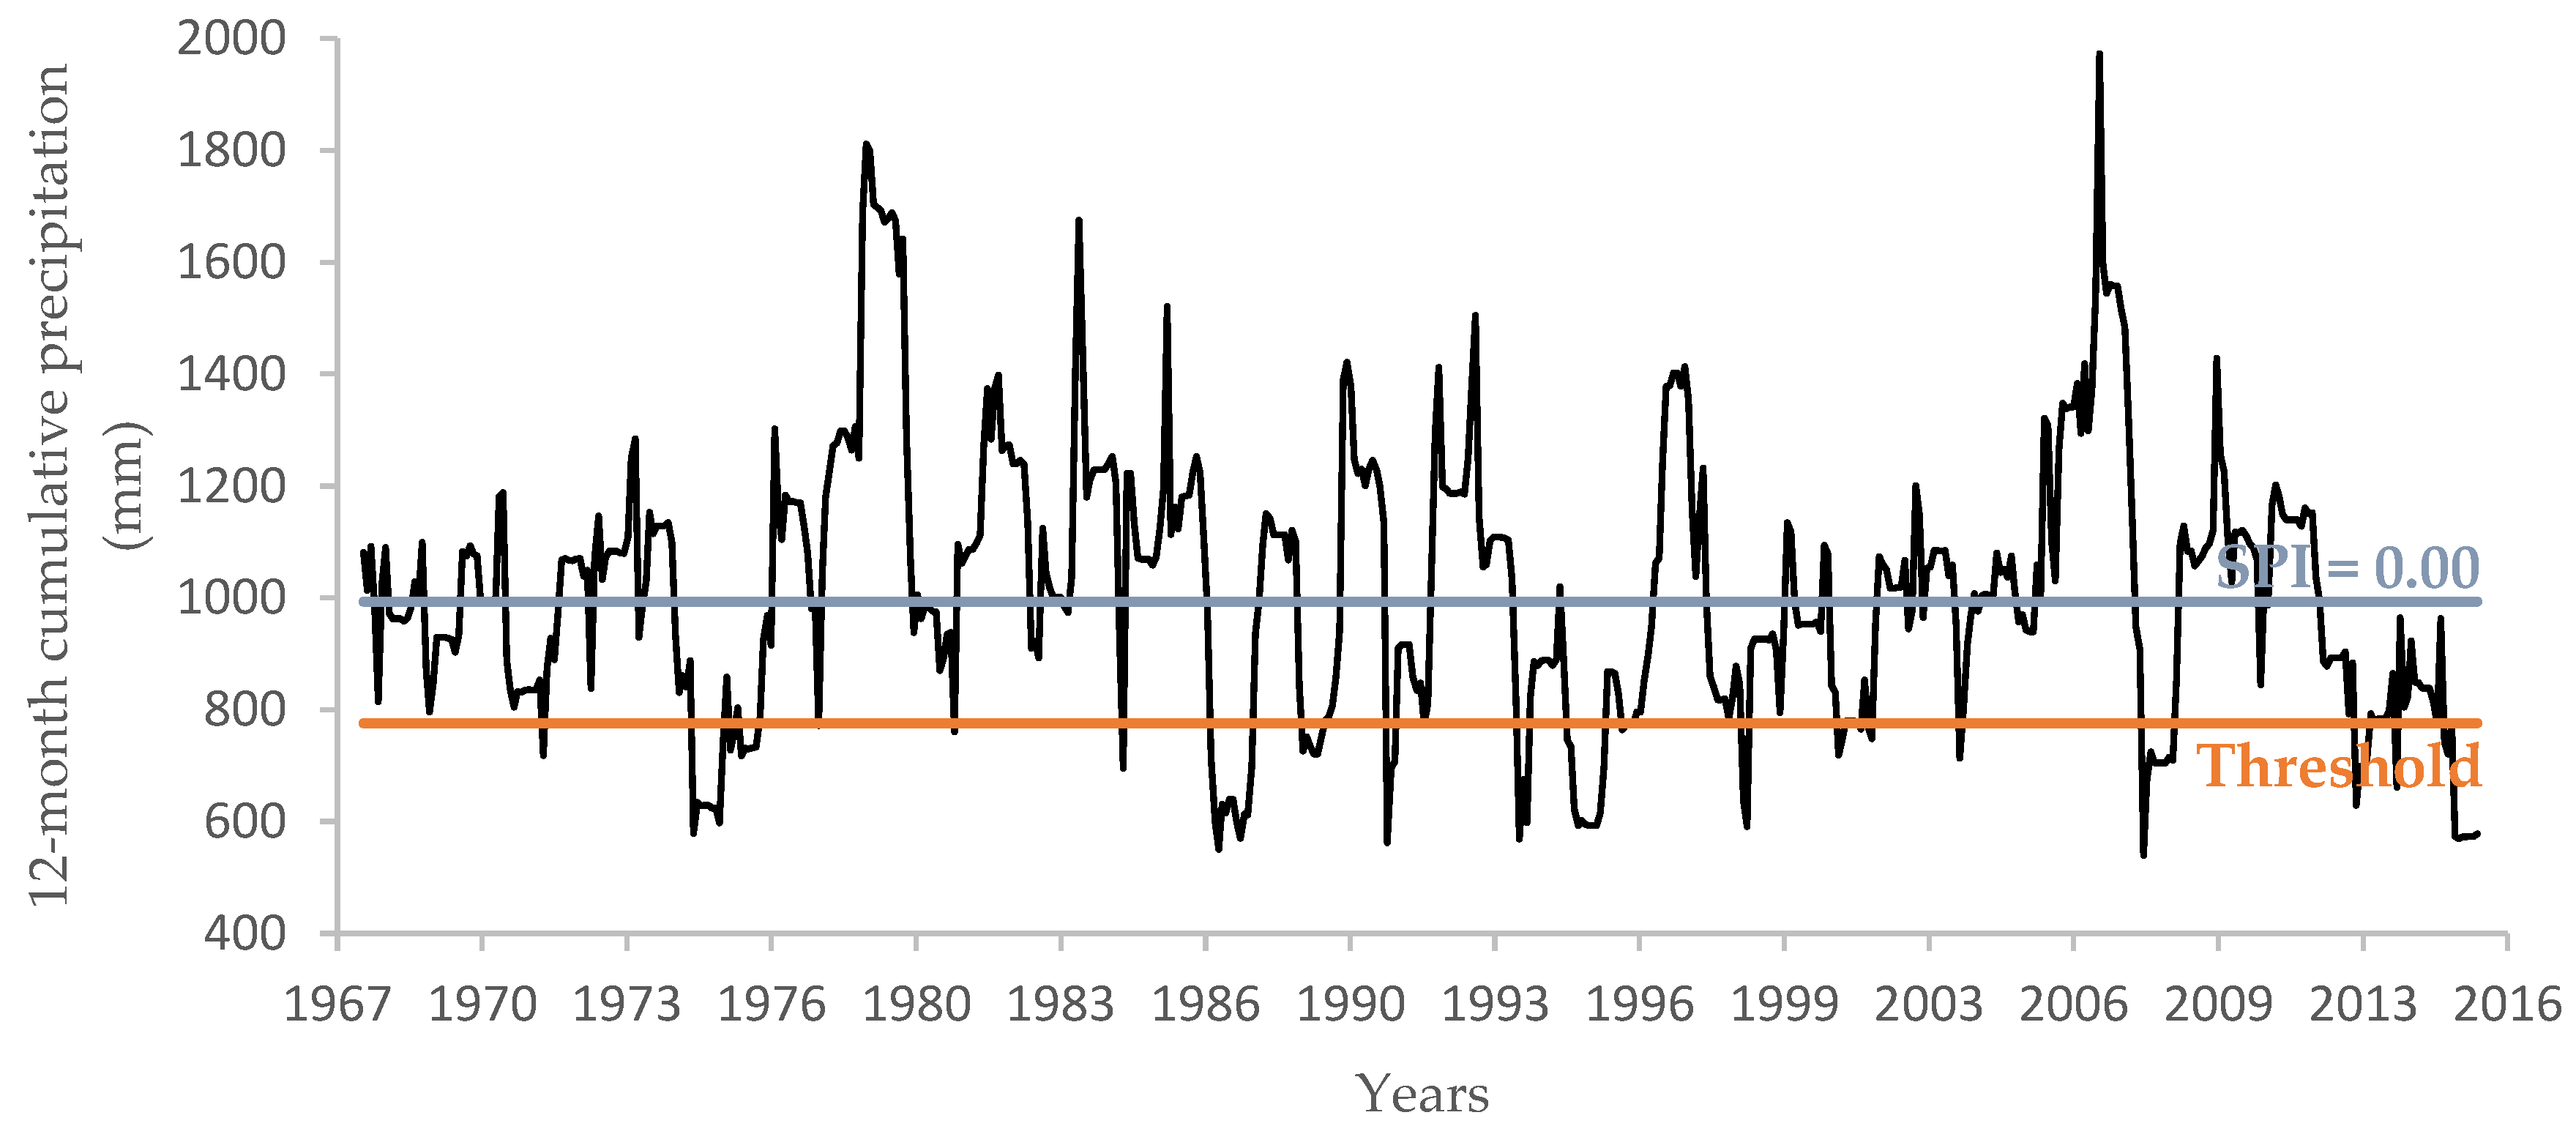
3.1. Drought Events

As described for the SPI method, for the record of data presented, a drought starts when the moving cumulative precipitation of 12 months reaches the precipitation threshold, characterized as a SPI with a value −1.0, and it ends when the SPI value becomes positive again. We applied the definition for all the selected stations with a contribution area in the influence of the semi-arid climate in Minas Gerais. For instance, the station São Francisco presented a threshold level of 775.7 mm, a precipitation level of 993.1 corresponding to the SPI = 0.00 and 15 drought events. The time-series representation for this specific station is shown in Figure 5. For example, one of the identified drought events initiates in December 1986 with a 12-month cumulative precipitation of 713.0 mm (SPI = −1.33) and ends in January 1988, with a 12-month cumulative precipitation of 994.1 mm (SPI = 0.00), lasting 14 months. Table 2 presents the threshold level and the number of identified events of each pre-established drought duration for all the studied stations.
As shown in Table 2, the threshold level, which means the value of 12-month cumulative precipitation at the beginning of each drought event, varies from station to station. A drought event for São Francisco station initiate when the cumulative 12-month precipitation equals to 775.7 mm, while for Janaúba station a drought event begins when the cumulative 12-month precipitation reaches 572.6 mm. Regarding São Francisco, it is shown that through the whole time series, there were 15 occurrences of a drought event of at least 1 month, 12 occurrences of a drought event of 3 months, 10 occurrences of a 6-month drought, 10 occurrences of a 9-month drought and 6 occurrences of a drought event lasting more than 12 months.
Considering the events mentioned in Table 2, the severity of a one-month drought duration is based on the most severe value of 12-month cumulative precipitation identified for each event. For the 14-month event that occurred in São Francisco Station cited above, the lowest 12-month cumulative precipitation occurs in February 1987, with a precipitation of 550.3 mm. The severity for the other durations is taken as the average between consecutive values of 12-month moving cumulative precipitation. For example, for the 3-month drought duration, the lowest consecutive values of 12-month cumulative precipitation were identified from January 1987 to March 1987 and the average precipitation value is 612.4 mm, this being the severity of the 3-month drought represented by this event.

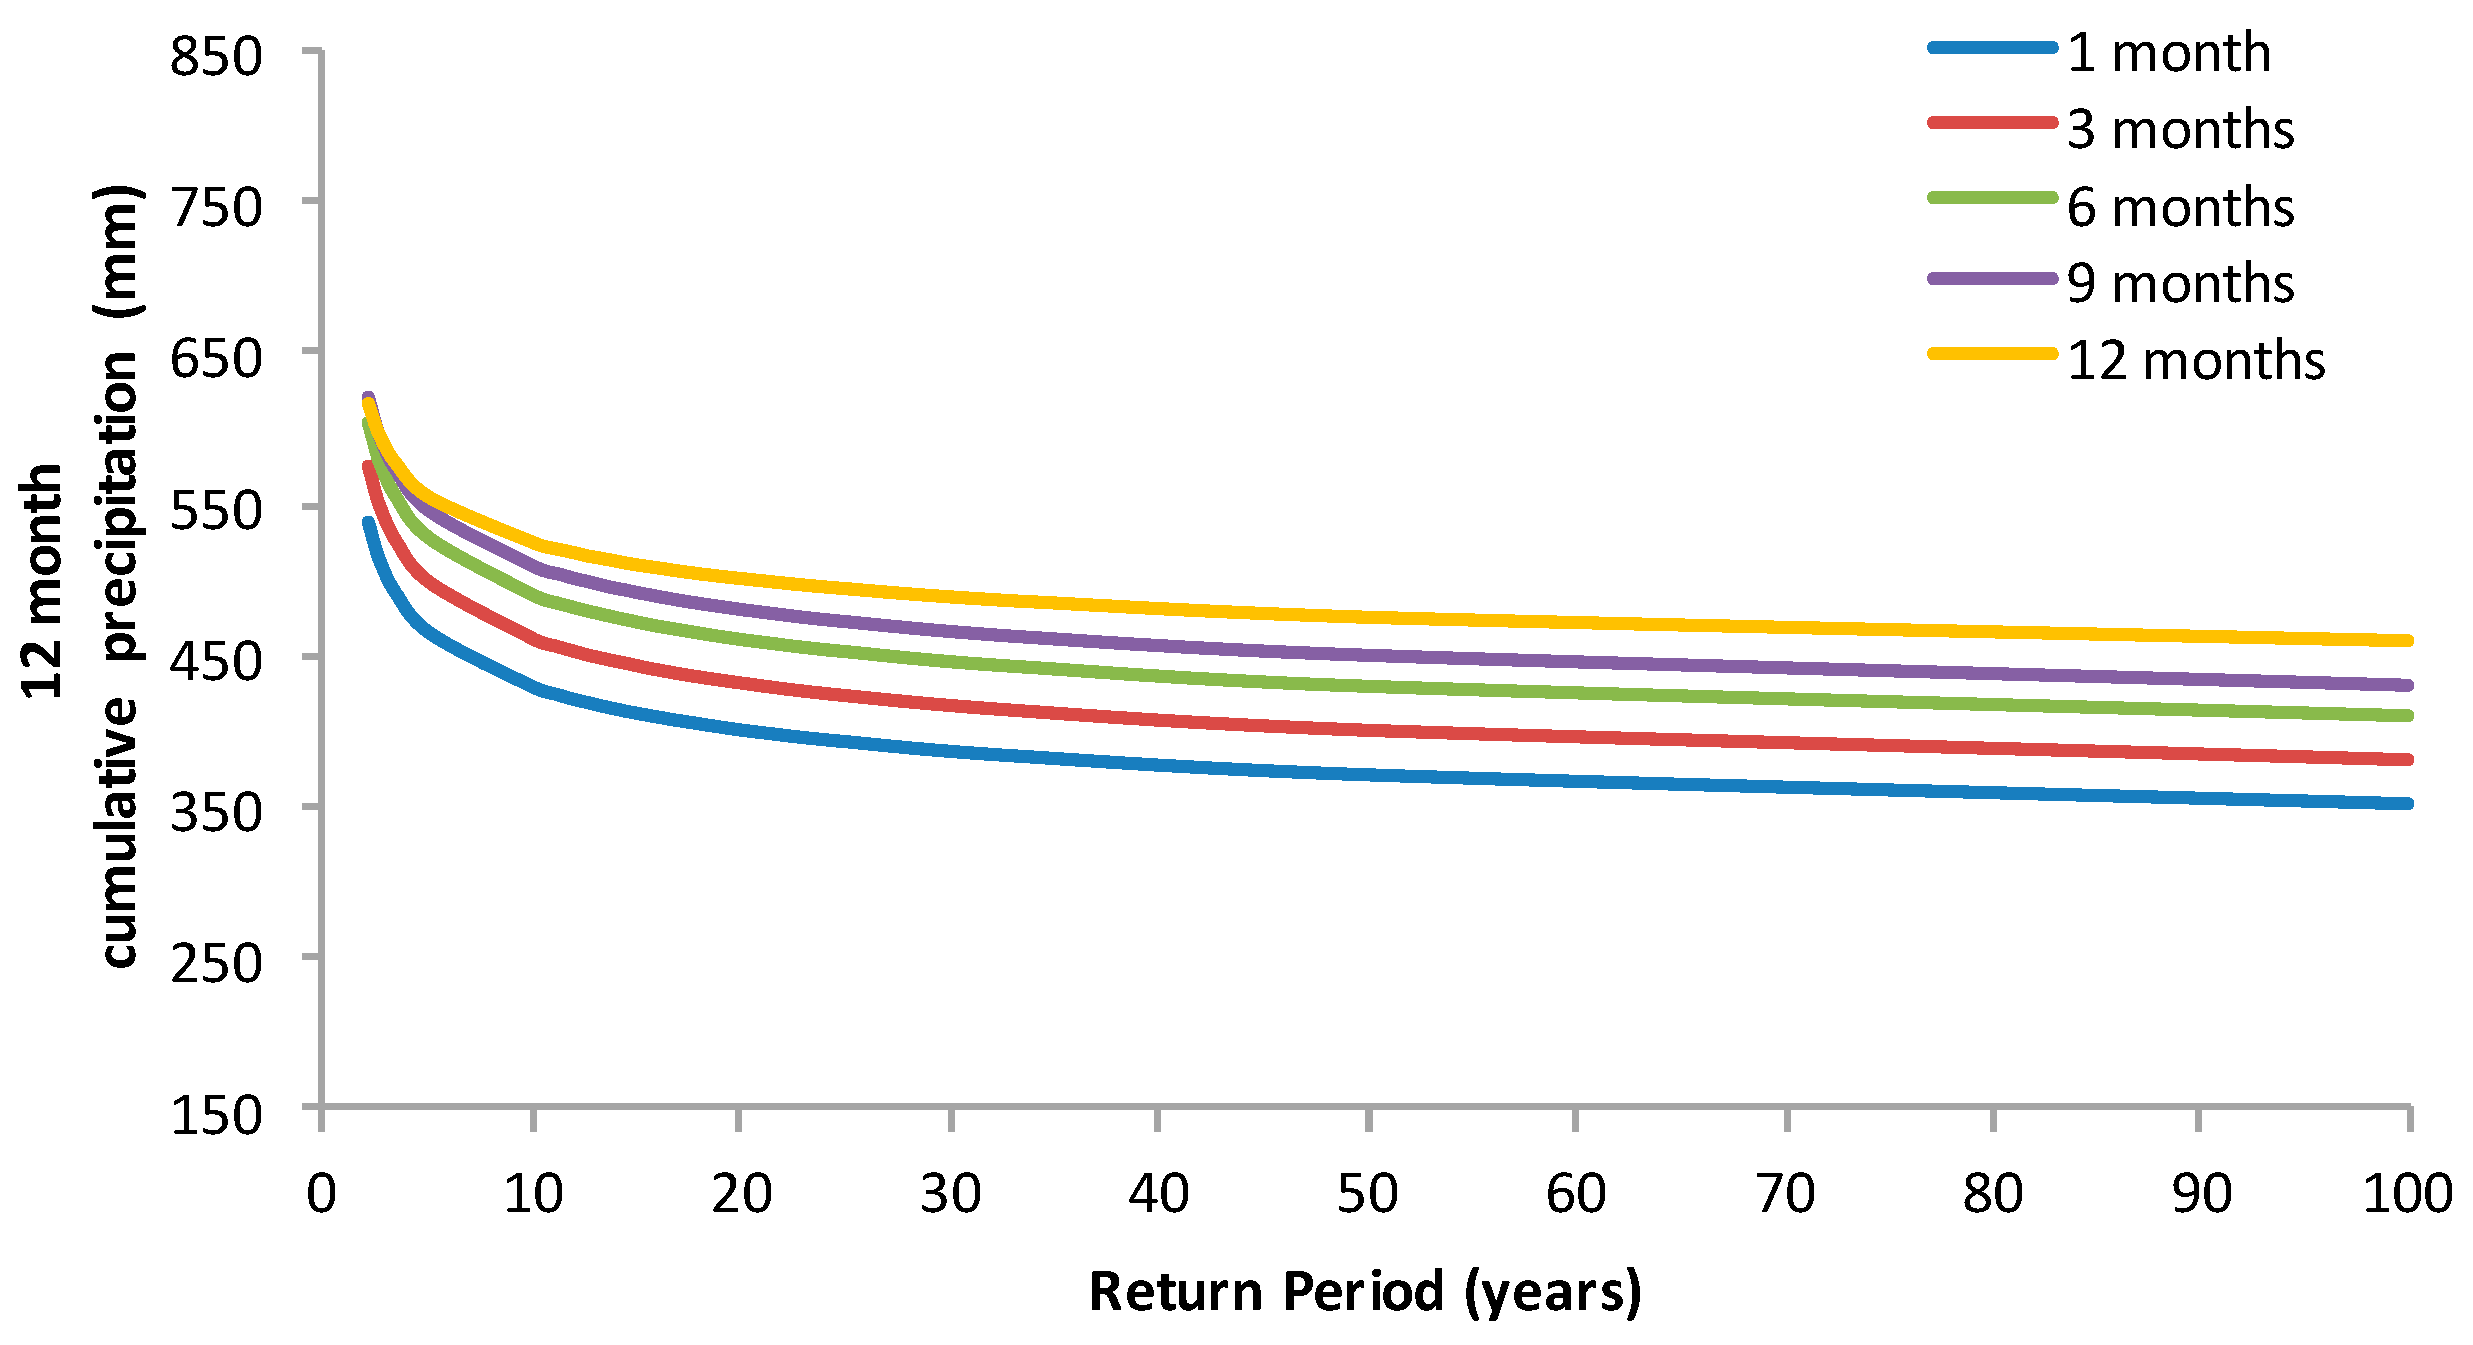
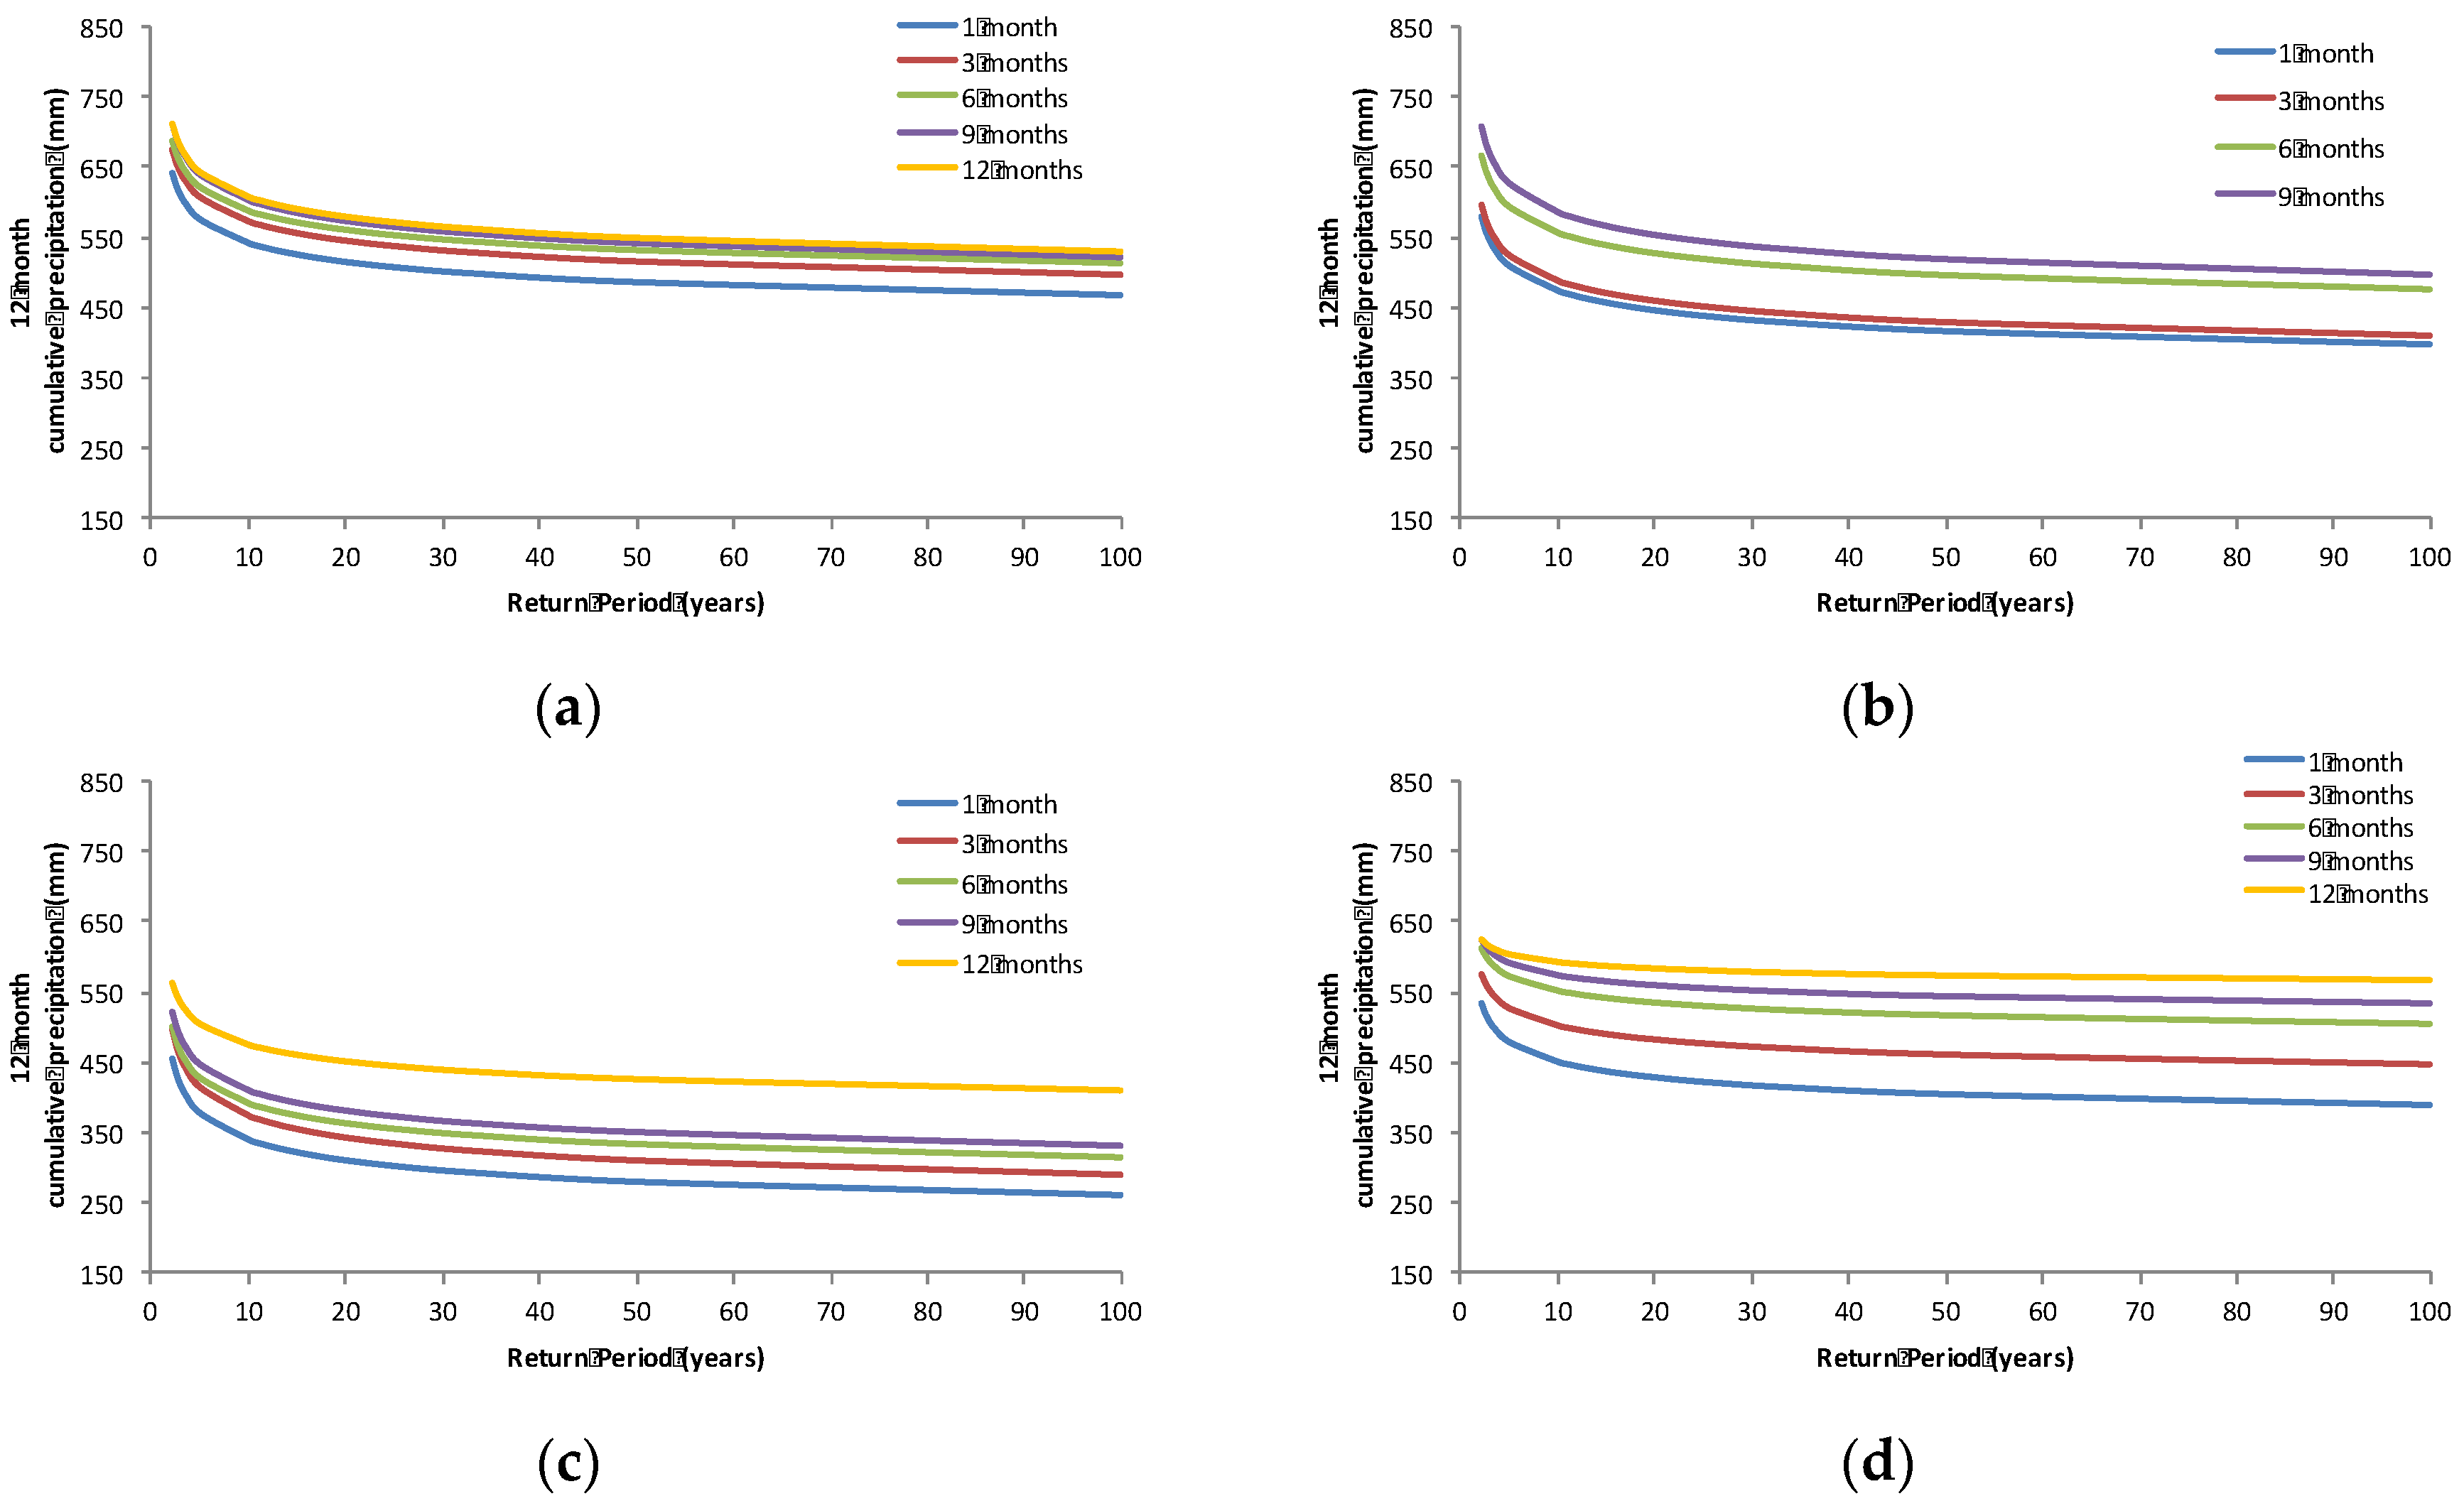
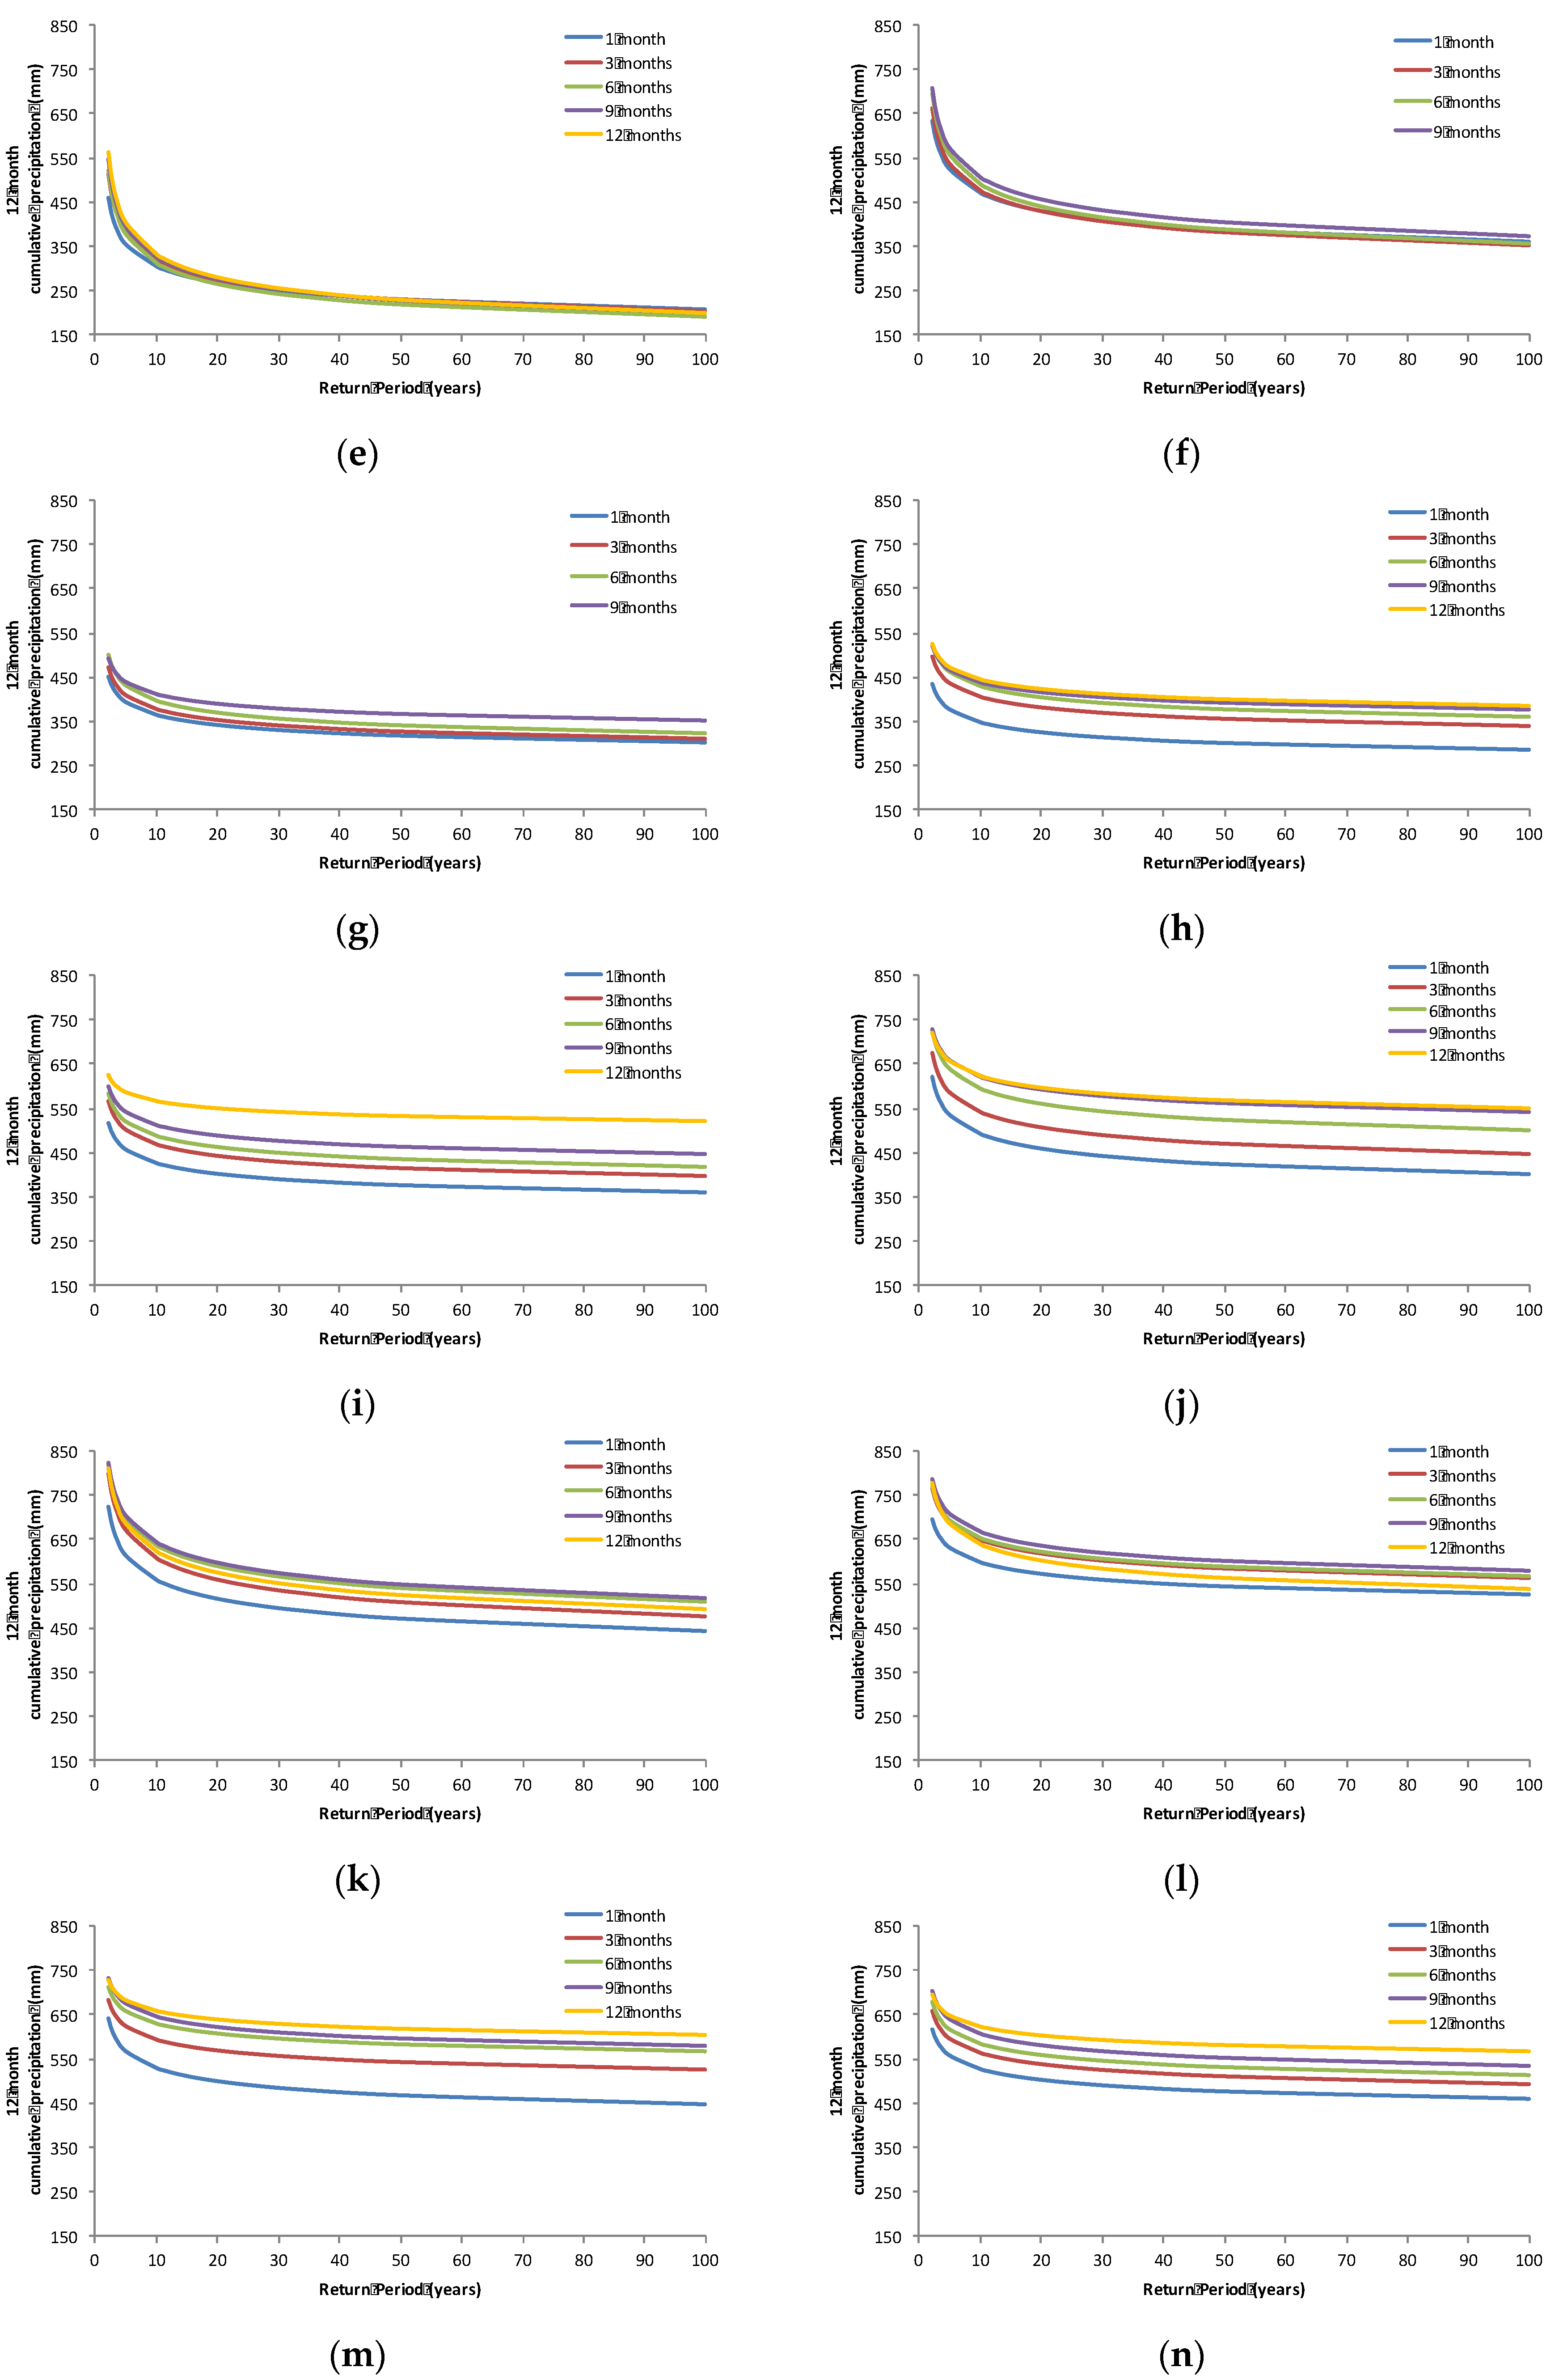
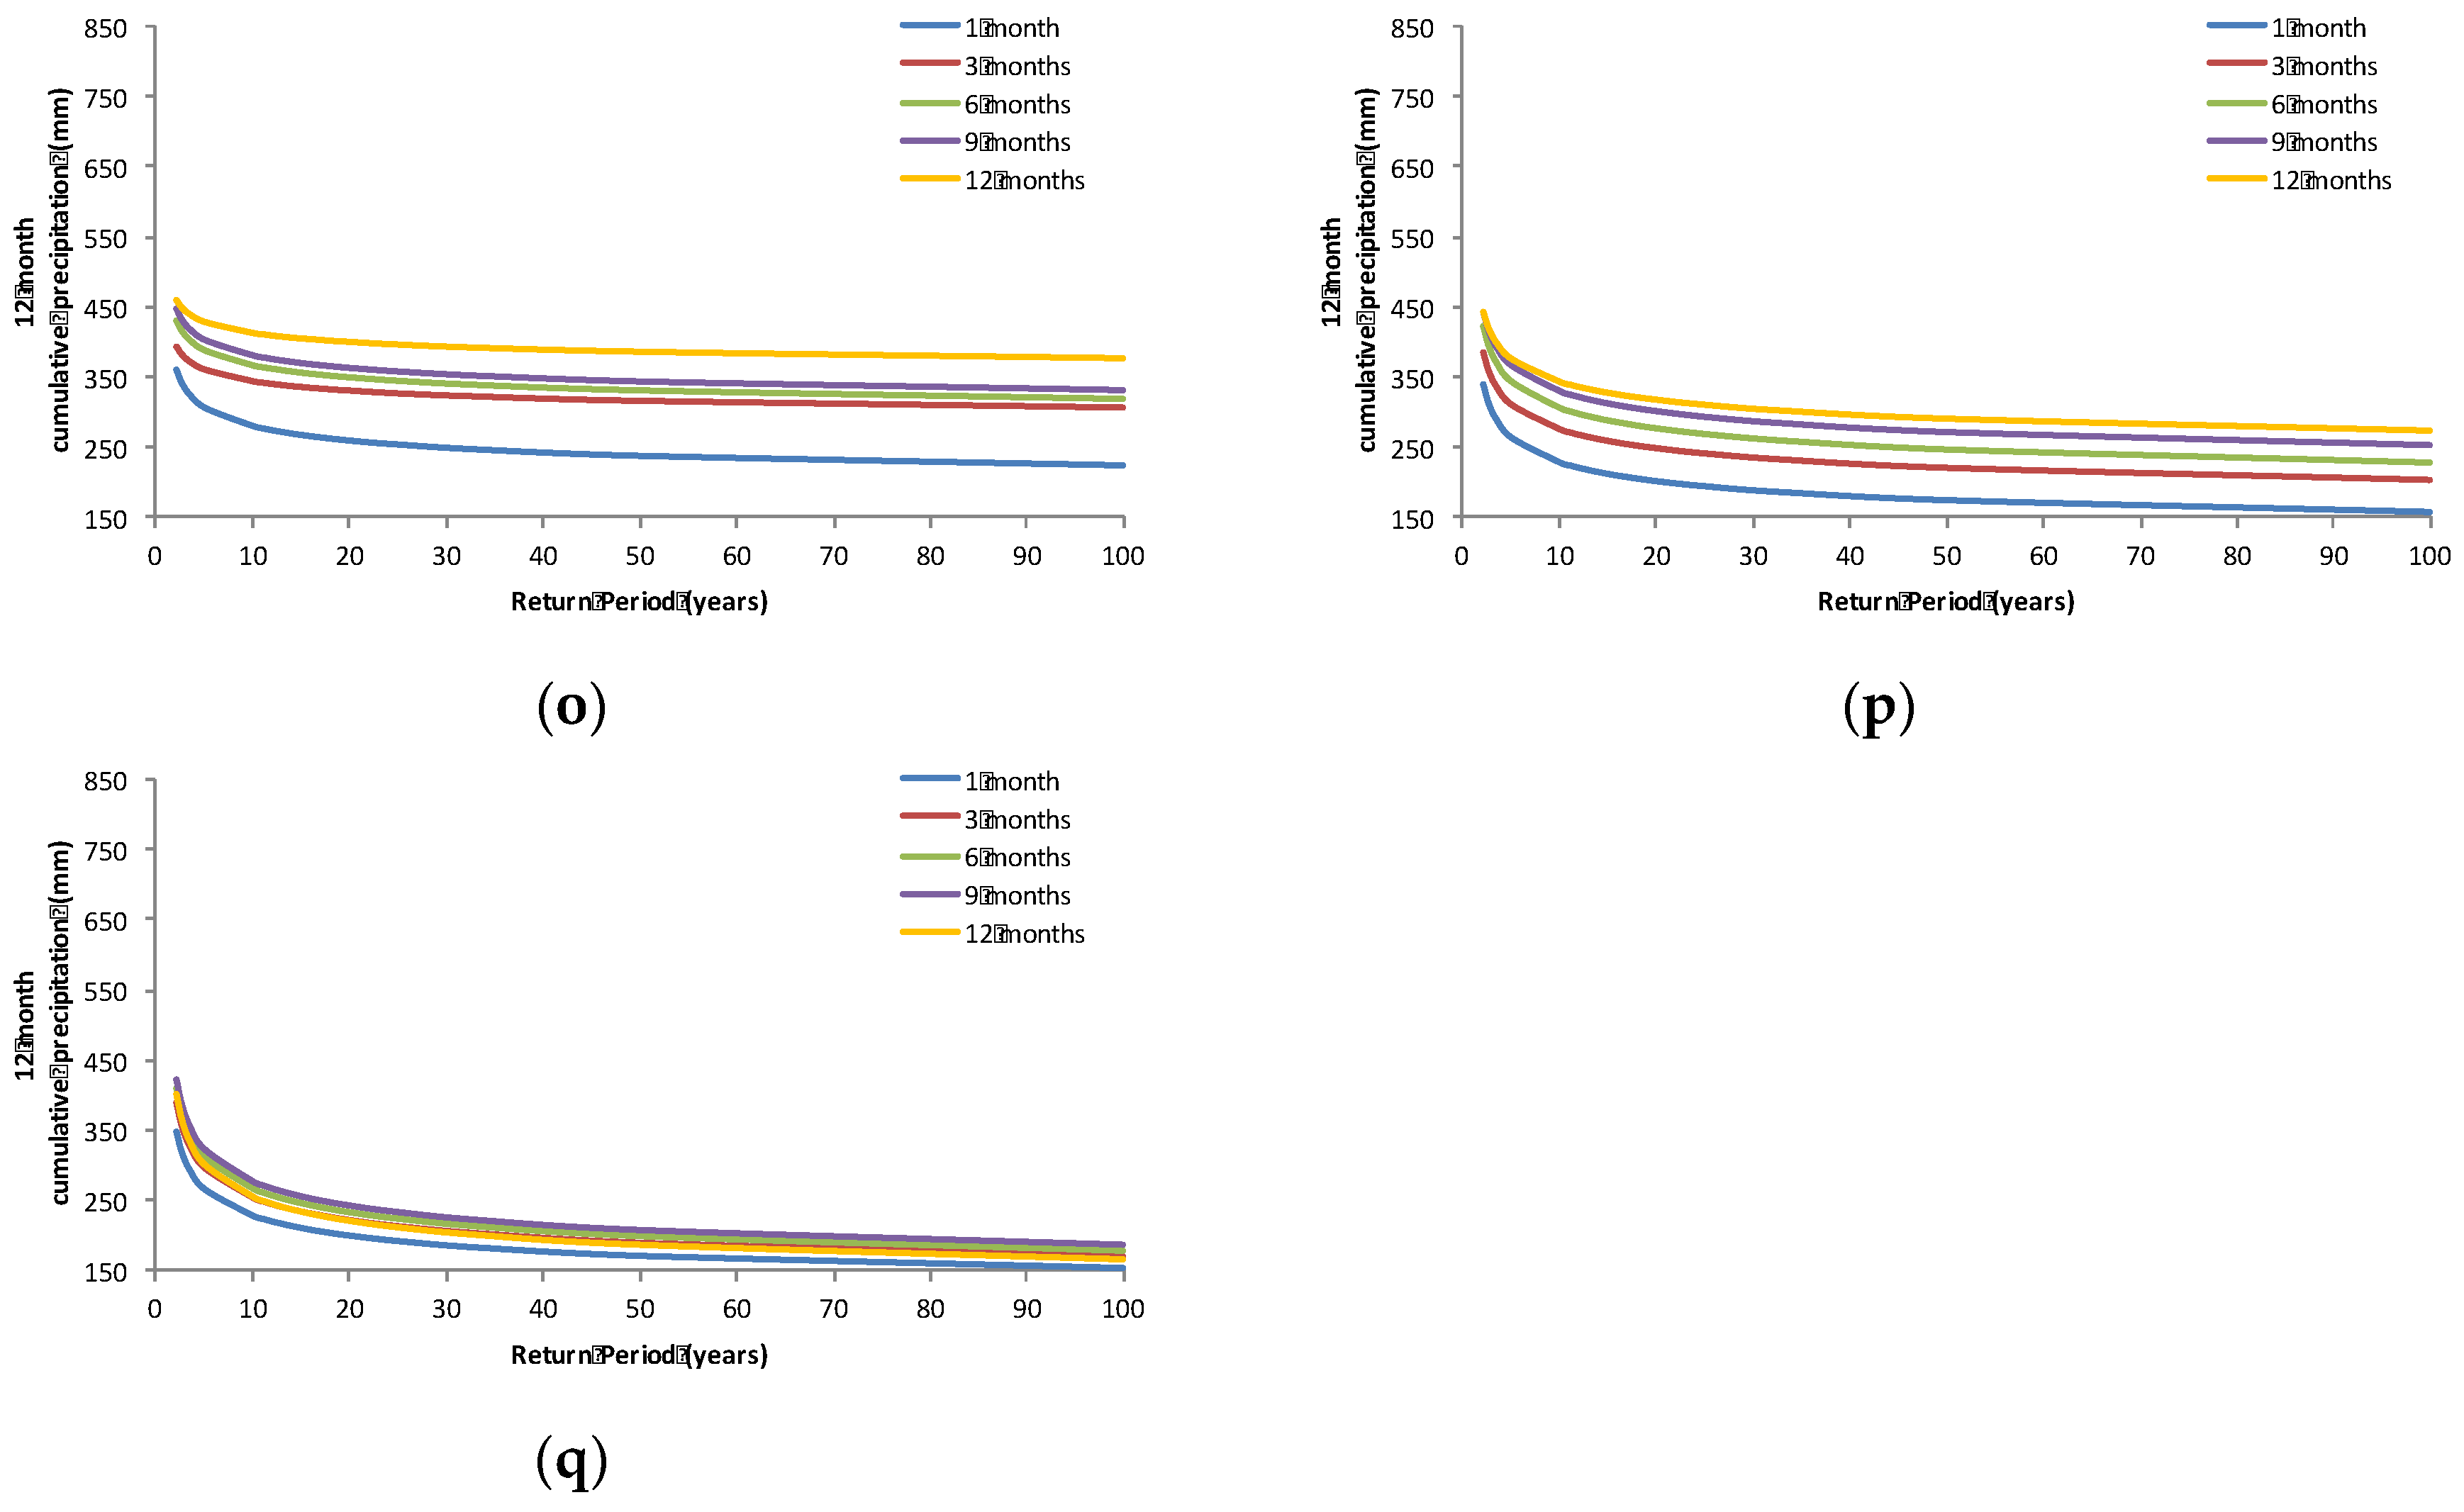
3.2. Severity-Duration-Frequency Curves

From the tabulated data analyzed for each station, the severity of the events was identified and ranked in ascending order as an input for the compilation of the Severity-Duration-Frequency curves. Table 3 is an example of the ranked events for the São Francisco station.
The gamma distribution was applied for the cumulative 12-month average precipitation of each one of the drought durations in all the studied stations, using the Minitab software package. The software determines by the input cumulative 12-month average precipitation, as shown above, an association between a cumulative 12-month precipitation value and its probability of exceedance. The exceedance probability was then transformed into recurrence intervals. As an example for the São Francisco station, the fitted gamma distribution values are presented in Table 4.
The Anderson-Darling test was calculated for all the given distributions. For all durations, the gamma distribution fitted well for the São João da Ponte, Manga, Cajueiro, Itamarati, São João do Paraíso, Rio Pardo de Minas, Vila Terra Branca, Vila Urucuia, São Romão, São João da Vereda and Urandi stations. With a good fit in four out of five durations, the stations São Francisco, Janaúba and Inhobim showed good results. For São Gonçalo, Arinos Montante and Itaobim, the gamma distribution fitted the data for less durations. Even though a few AD values were found to be greater than their correspondent critical values, it was observed that this difference was small. It can be concluded that for the selected stations, the gamma distribution is a suitable distribution for drought frequency analysis.
The minimum 12-month moving cumulative precipitation values correlated with their return periods were then plotted for all the 17 stations, as shown in Figure 6.
For a general approach in the semi-arid climate area contained in Minas Gerais, regionalized SDF curves were plotted. The adopted method for the regionalization was using a weighted average among the individual station results through the Thiessen polygons method. Considering the influenced area of each one of the stations, the weighted average of the 12-month cumulative precipitation for the semi-arid region in Minas Gerais was calculated and can be visualized in the regionalized SDF curves plotted in Figure 7.
The regionalized SDF curves were tested on its precision by the error computation, comparing the regionalized SDF curves with the 9 stations situated in the semi-arid area of Minas Gerais. The stations São Francisco, São João da Ponte, Manga, Cajueiro, Itamarati, São João do Paraíso and Rio Pardo de Minas showed errors not bigger than 25%, which represents a good pattern. The station Janaúba presented a few value errors of 30%; however, this fraction of the data is not relevant compared to the well fitted values. The discrepant station is São Gonçalo, which showed errors in a magnitude of 100%.

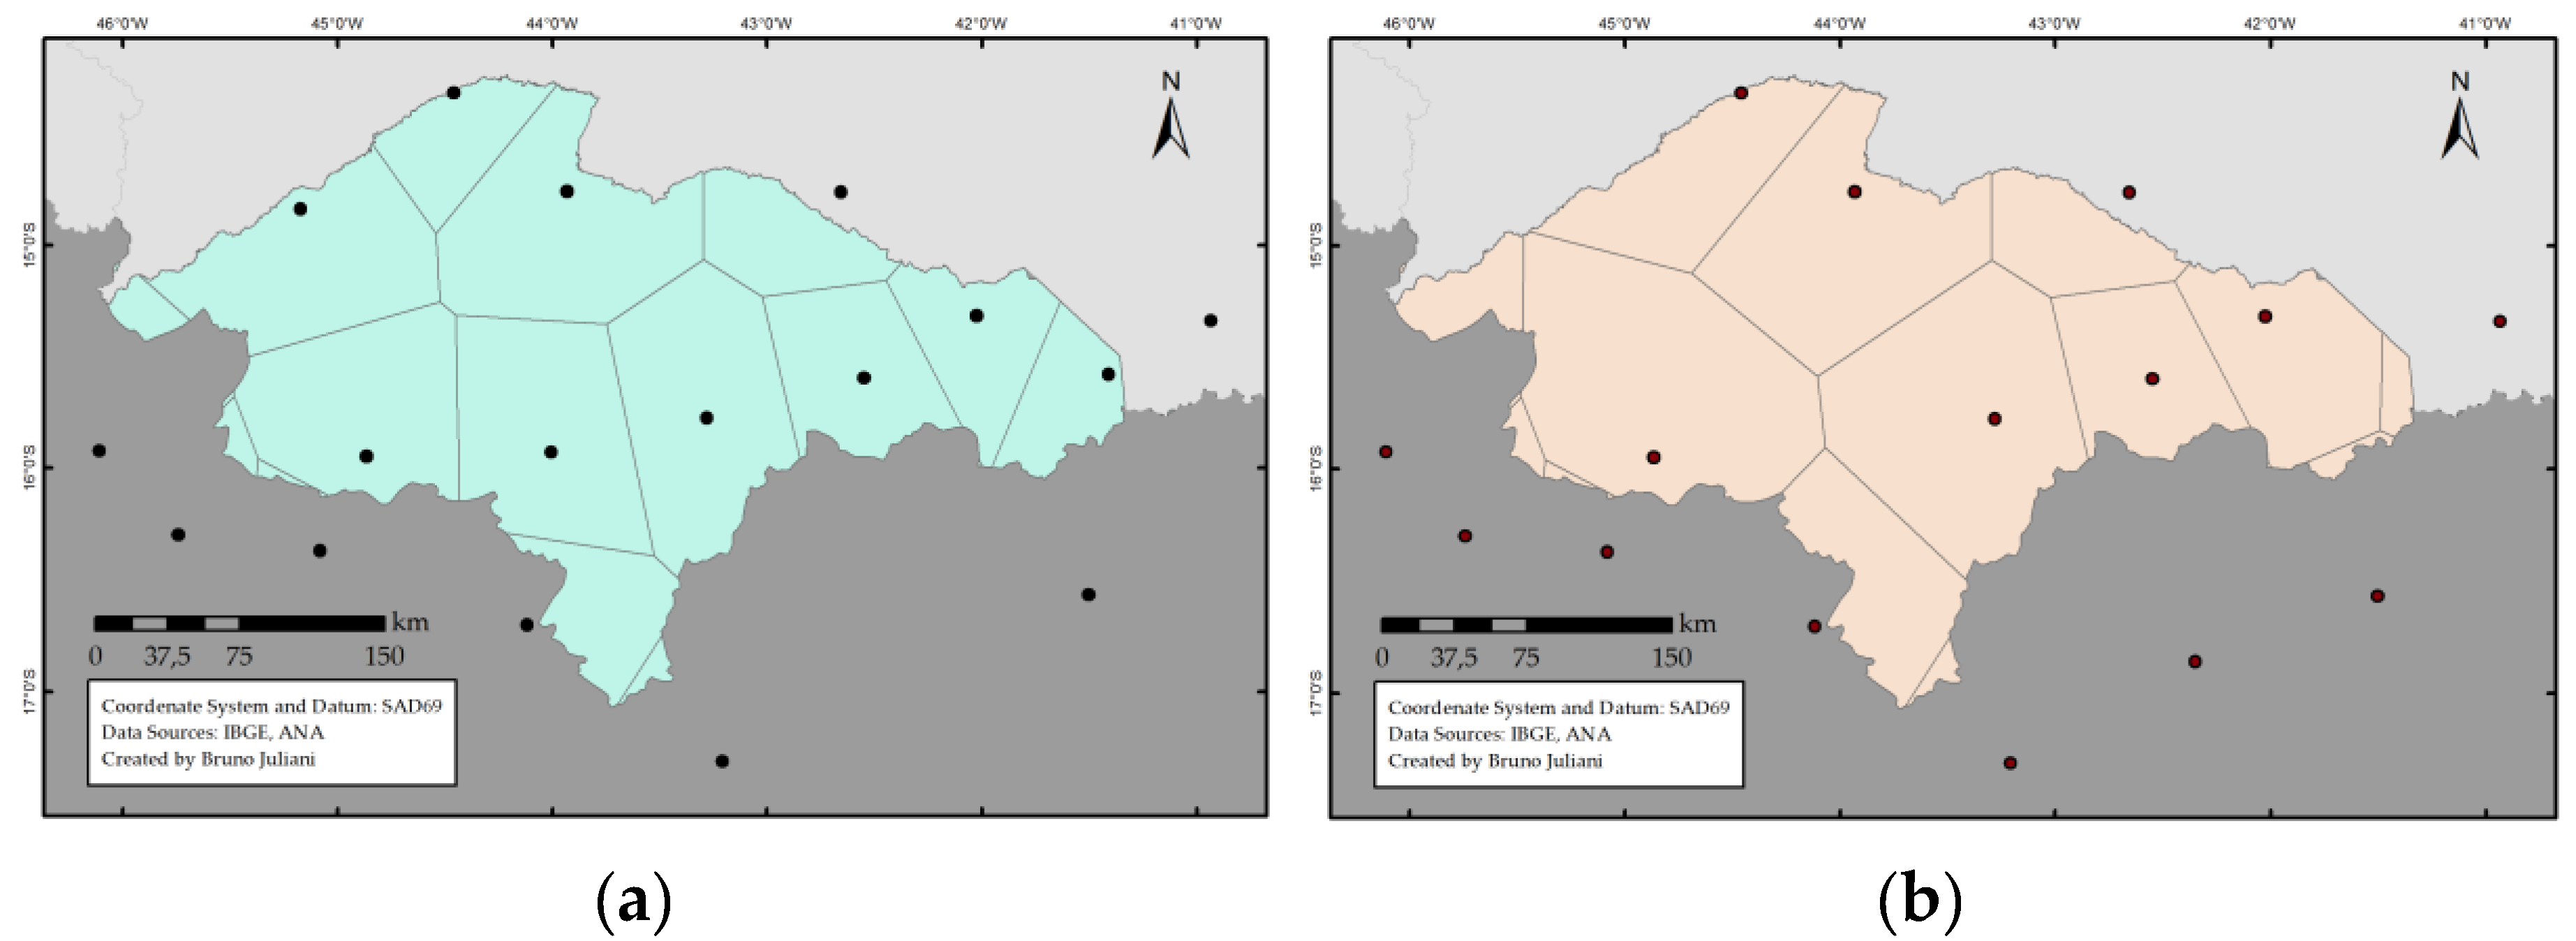
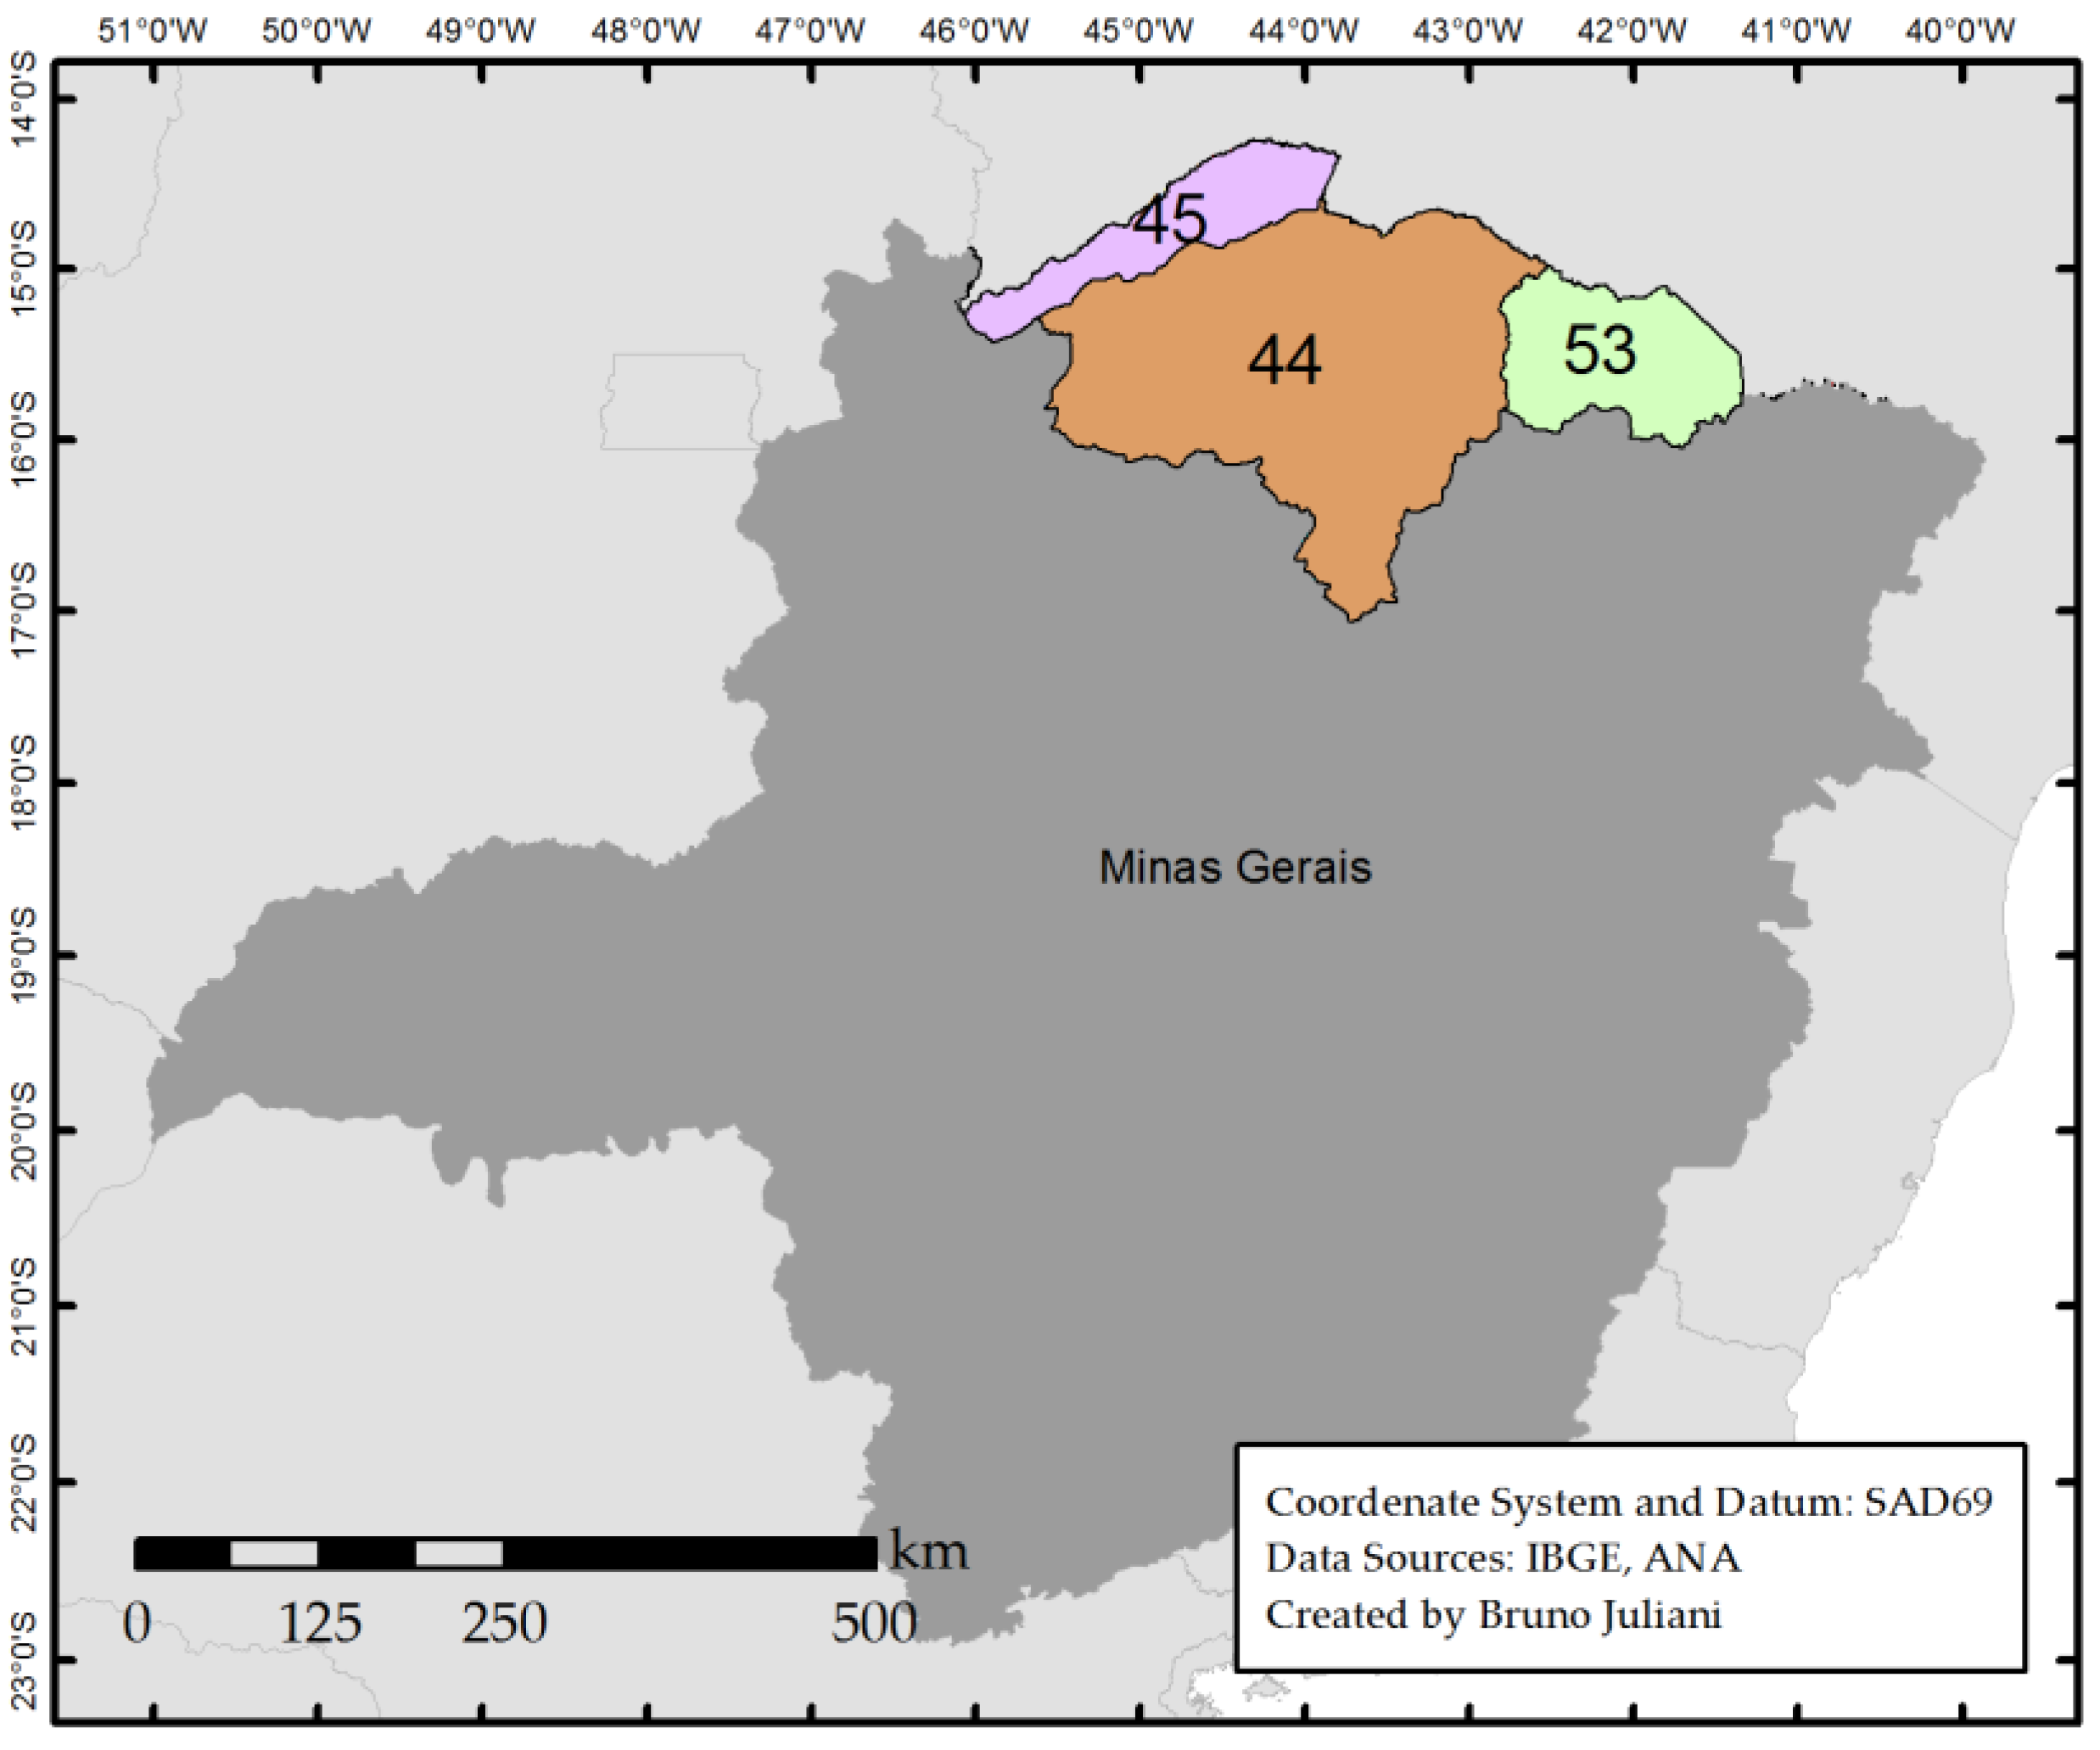
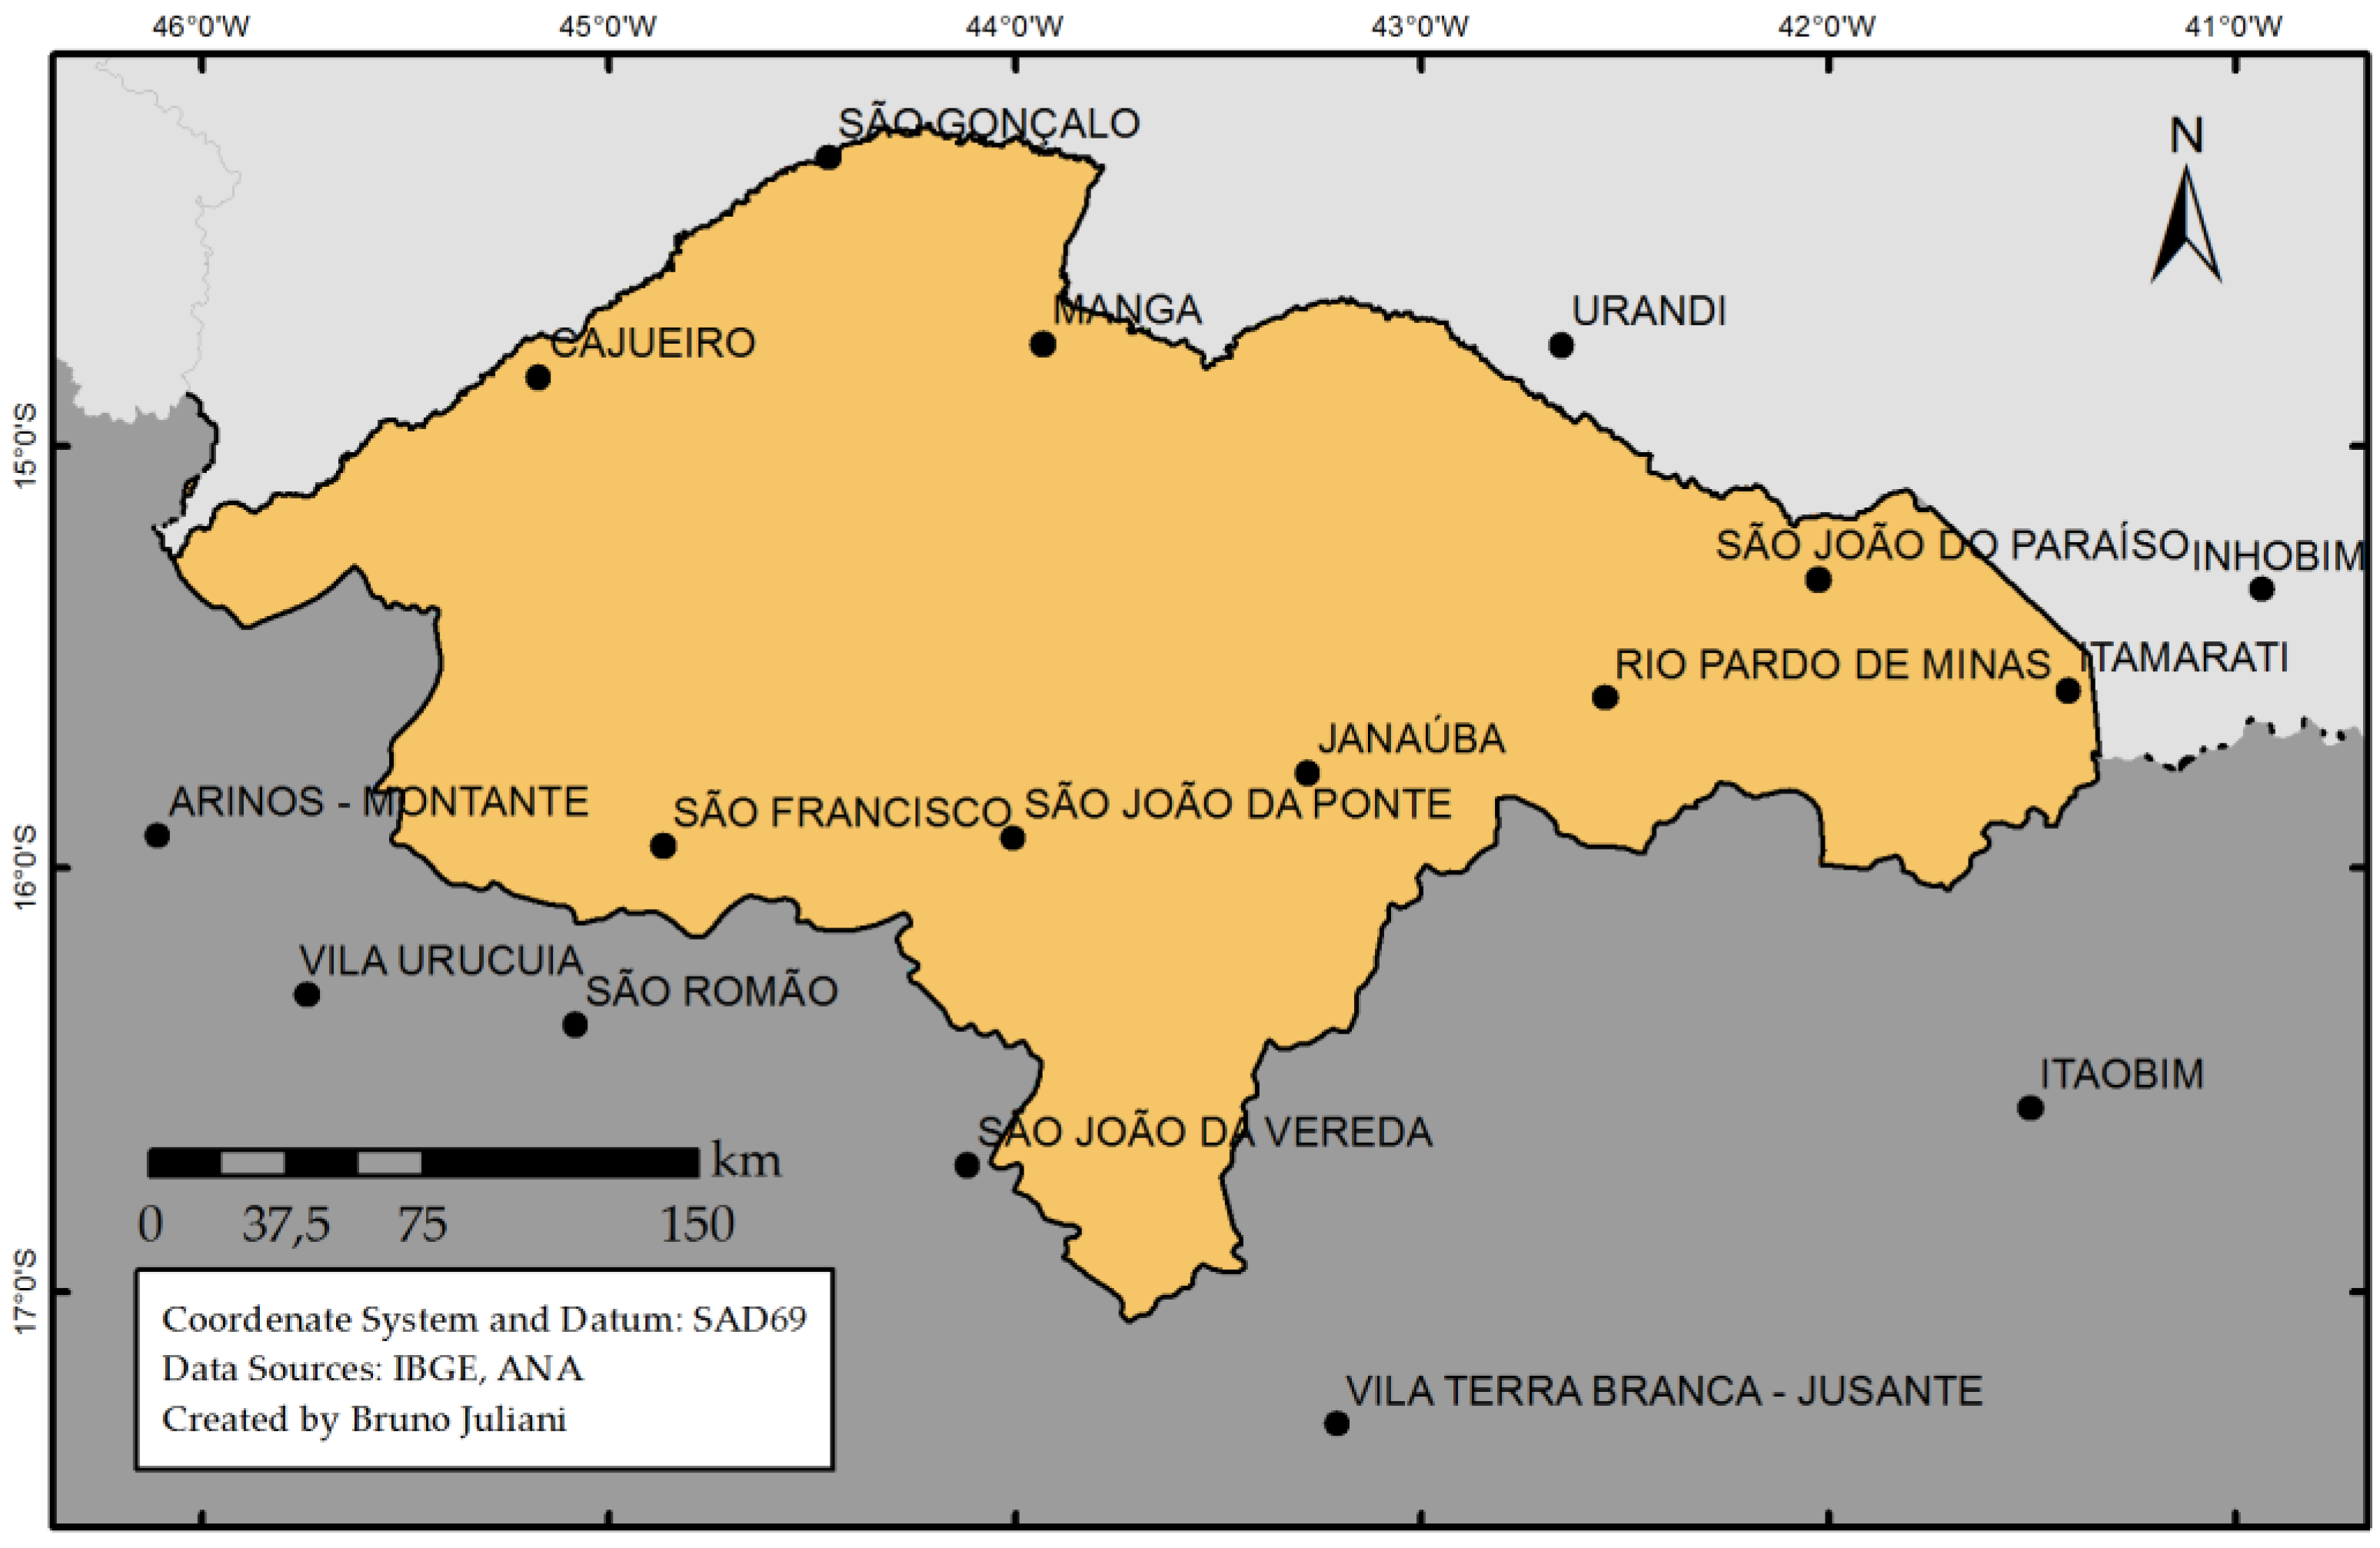
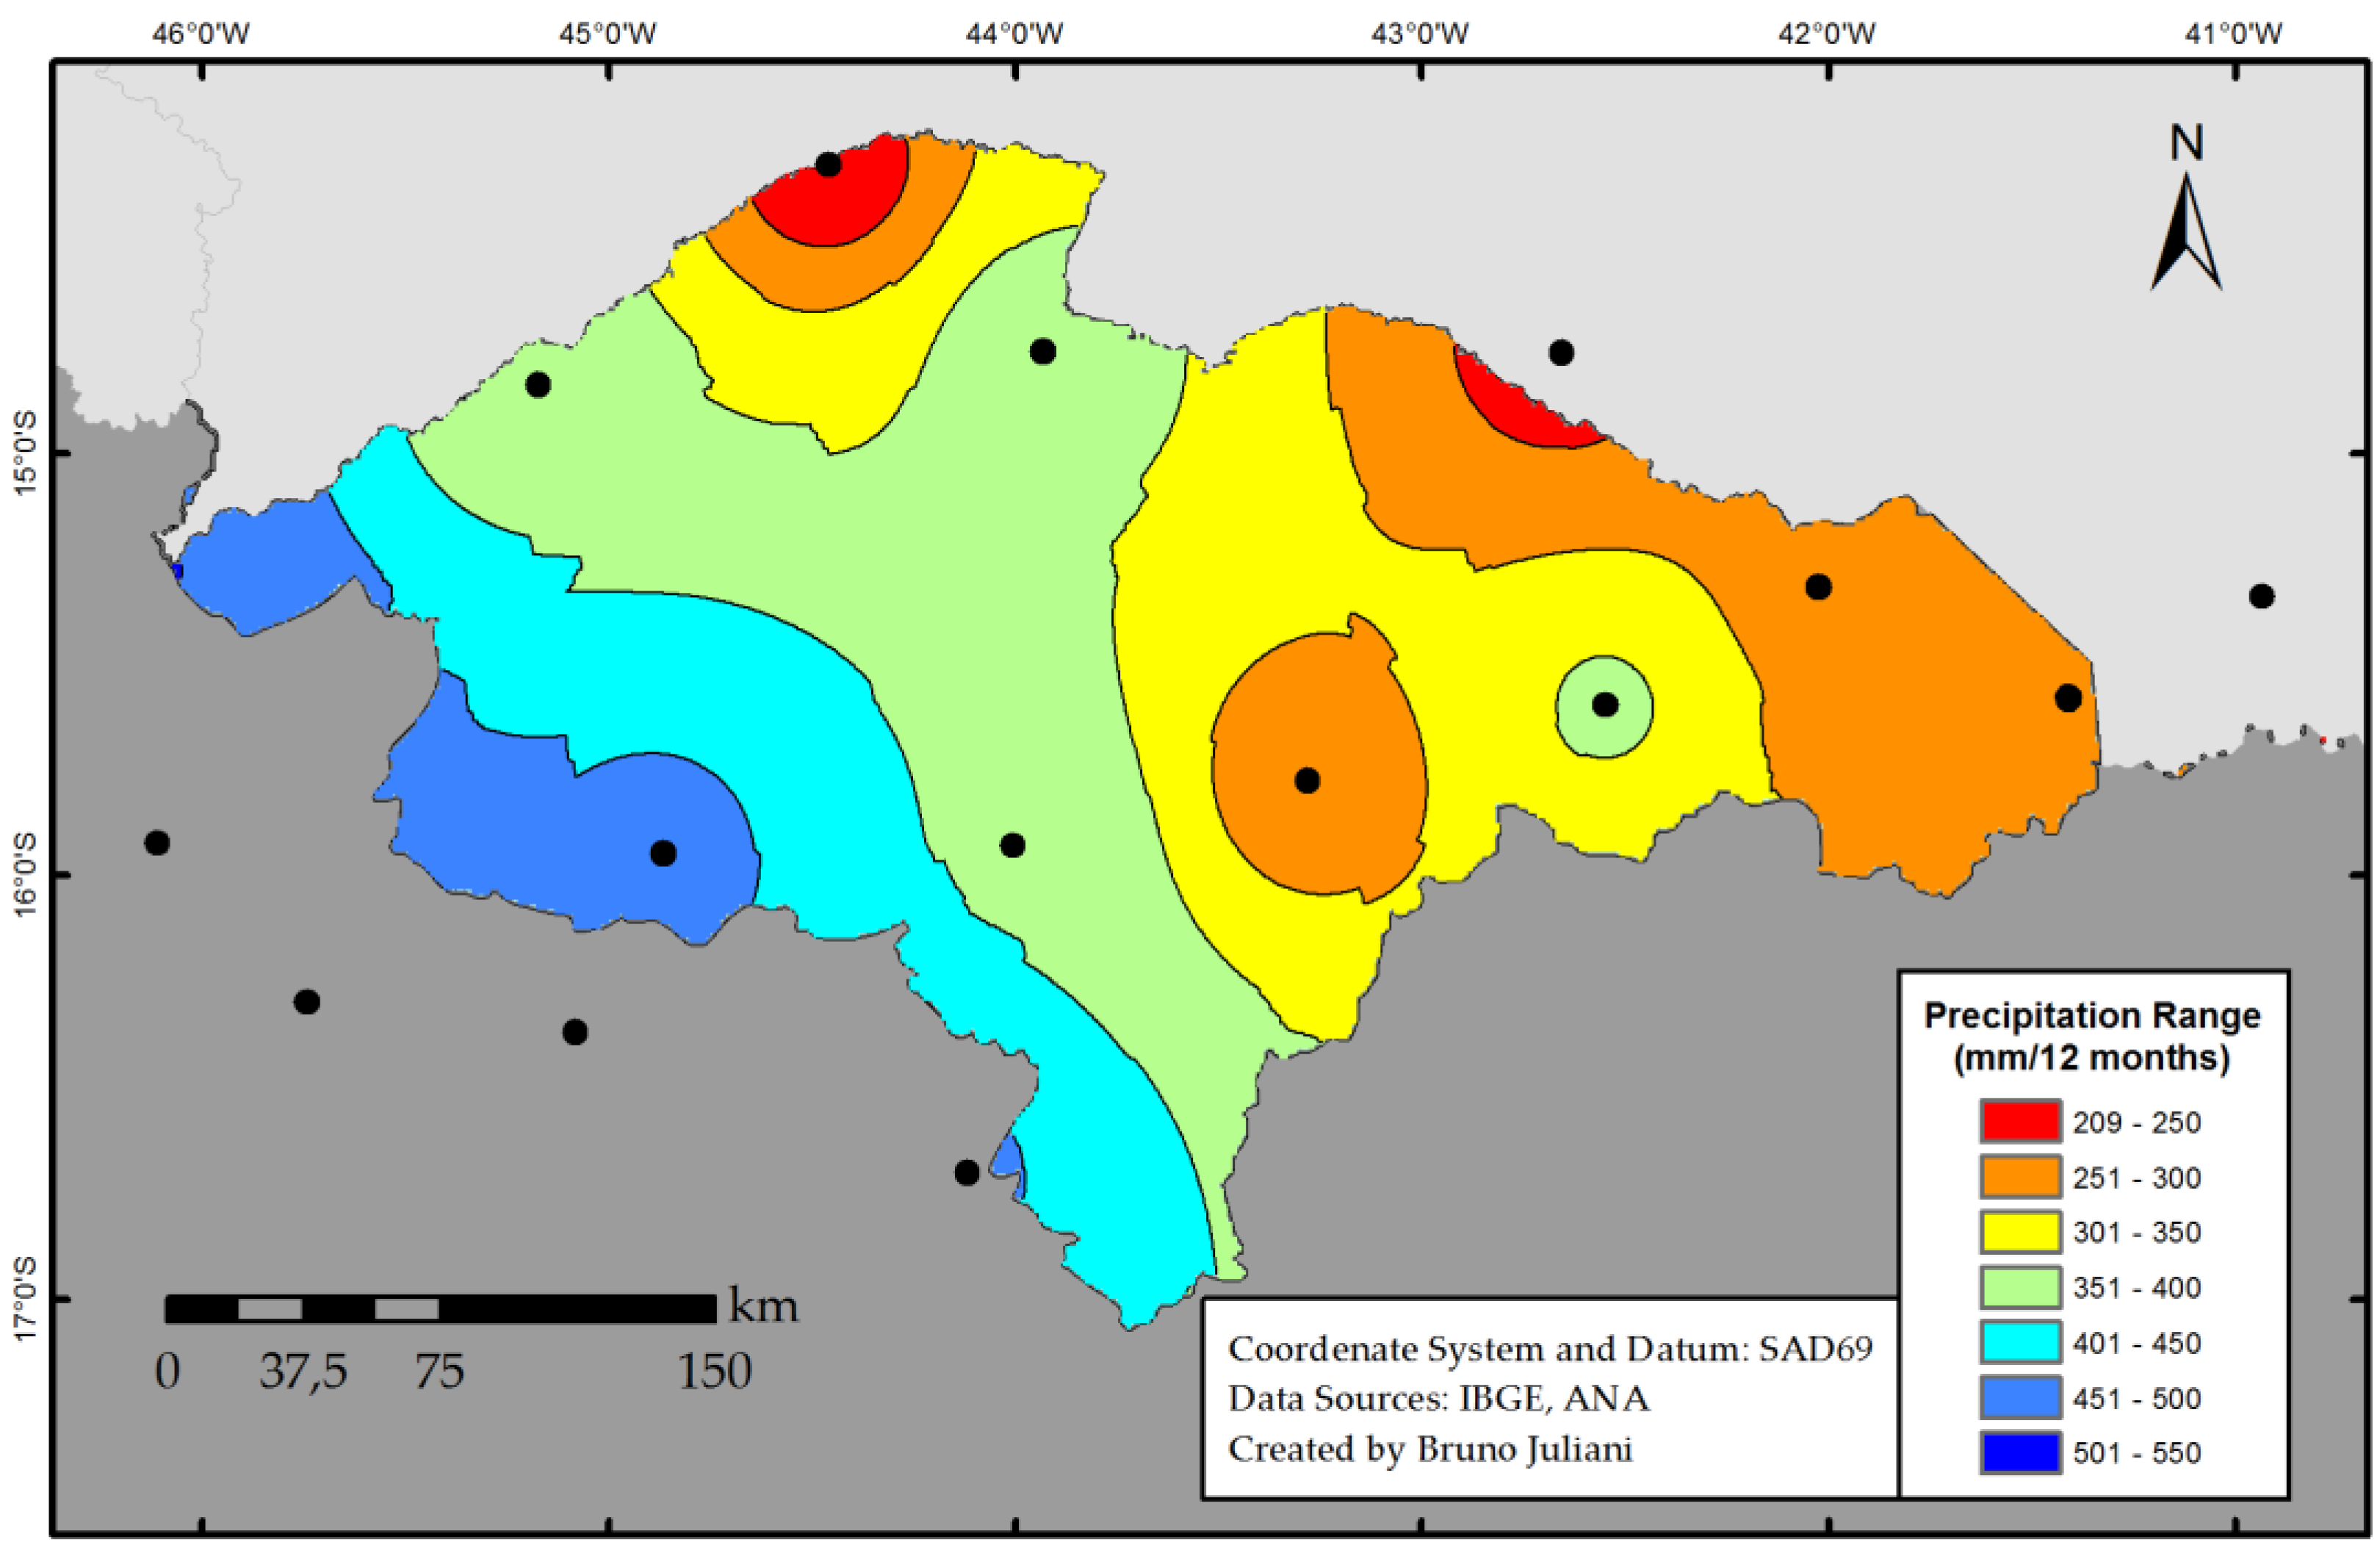
3.3. Isohyetal Maps for Drought Analysis

Taking into consideration the errors found for a general approach in the regionalized SDF curves, the mapping of isohyetal contours is a better tool for local approaches. The isohyetal map is illustrated in Figure 8.
As shown in Figure 8, we can observed the estimated critical 12-month cumulative precipitation rates for 1-month droughts in an average recurrence interval of 100 years. The map shows the spatial variance of precipitation rates over the whole area. It is observed that the northern section of the semi-arid area in Minas Gerais presents lower levels of precipitation than the southern side.

4. Conclusions

The identification and characterization of drought is important, taking into consideration such factors as frequency, severity, and duration. This study carried out a development of a visual and simple tool for identification of the mentioned drought characteristics.
Based on the analysis techniques presented in this paper, the gamma distribution proved to be a distribution with good results for the 12-month moving cumulative precipitation series, presenting a good fit for almost the totality of data records. The identified errors were not considered relevant and did not lead to an unsatisfactory result.
The developed Severity-Duration-Frequency curves proved to be an easy tool to visualize the characteristics of a drought, such as duration, severity and return period for different events. The SDF curves allow a better understanding of the results for ordinary users. The curves are also a tool for agricultural water management, as the values of cumulative precipitation may indicate deficits in water basin levels.
Regionalizing the SDF curves for a determined area allows the study in regions without the presence of a meteorological station. For the area influenced by the semi-arid climate in Minas Gerais, it was observed that one of the current stations showed precipitation rates outside the pattern of the others, which can be checked in the error analysis. The regionalized rates are not representative for that particular influence area.
Aiming for a more consistent local application of the SDF outcomes, instead of the regionalized SDF curves, the Isohyetal maps led to be a more suitable tool for a drought analysis. The maps were generated considering the spatial distribution of the rainfall stations. From then on, the performance of the Isohyetal maps could be improved through the selection and study of a larger number of rainfall stations.
The availability of hydrological information in Brazil provides good resources for further drought analysis. The methodology of SPI analysis and the development of Severity-Duration-Frequency curves may be taken for other regions of Brazil, and studied with a larger number of rainfall stations. Therefore, the outcomes of this research and possible future studies may be implemented in the estimation of drought events occurrence and further used in drought forecasting and mitigation measures.

Acknowledgments

We would like to show our gratitude to Nira Jayasuriya, RMIT University for the initial support and assistance for this research. We also thank Priscila Pessini for the collaboration in the application of the methodology in some studied stations.

Author Contributions

B.H.T. Juliani performed the literature review, methodology, data analysis and recommended revisions. C.M.P. Okawa, as an advisor, contributed with constructive comments and suggestions, and in an overall revision of the paper.

Conflicts of Interest

The authors declare no conflict of interest.

References

  1. Rahmat, S.N. Methodology for Development of Drought Severity-Duration-Frequency (SDF) Curves. Ph.D. Thesis, School of Civil, Environmental and Chemical Engineering, RMIT University, Melbourne, Australia, 2015. [Google Scholar]
  2. Ogallo, L.A. Drought and desertification: An overview. In Bulletin of the World Meteorological Organization; World Meteorological Organization: Geneva, Switzerland, 1994; Volume 1, p. 43. [Google Scholar]
  3. Gathara, S.T.; Gringof, L.G.; Mersha, E.; Sinha RAY, K.C.; Spasov, P. Impacts of desertification and drought and other extreme meteorological events. In WMO/TD 1343; World Meteorological Organization: Geneva, Switzerland, 2006. [Google Scholar]
  4. Dalezios, N.R.; Loukas, A.; Vasiliades, L.; Liakopoulos, E. Severity-duration-frequency analysis of droughts and wet periods in Greece. Hydrol. Sci. J. 2000, 45, 751–769. [Google Scholar] [CrossRef]
  5. McKee, T.B.; Doesken, N.J.; Kleist, J. Drought monitoring with multiple timescales. In Proceedings of the 8th Conference on Applied Climatology, Anaheim, CA, USA, 17–22 January 1993. [Google Scholar]
  6. Valipour, M. How Much Meteorological Information Is Necessary to Achieve Reliable Accuracy for Rainfall Estimations? Agriculture 2016, 6, 53. [Google Scholar] [CrossRef]
  7. Van Loon, A.F. Hydrological drought explained. Wiley Interdiscip. Rev. 2015, 2, 359–392. [Google Scholar] [CrossRef]
  8. Mello, C.R.; Viola, M.R.; Coelho, G.; Norton, L.D. Droughts in Southern Minas Gerais, Southeastern Brazil: Understanding the Last 100 Years. In Proceedings of the 10th International Symposium on Agriculture and the Environment, Purdue University, West Lafayette, IN, USA, 23–27 May 2016. [Google Scholar]
  9. Rajsekhar, D.; Singh, V.P.; Mishra, A.K. Hidrologic Drought Atlas for Texas. J. Hydrol. Eng. 2014, 20, 05014023. [Google Scholar] [CrossRef]
  10. Valipour, M. Ability of Box-Jenkins Models do Estimate of Reference Potential Evapotranspiration (A Case Study: Mehrabad Synoptic Station, Tehran, Iran). J. Agric. Vet. Sci. 2012, 1, 1–11. [Google Scholar]
  11. Valipour, M. Analysis of potential evapotranspiration using limited weather data. Appl. Water Sci. 2017, 7, 187–197. [Google Scholar] [CrossRef]
  12. Valipour, M. Hydro-Module determination for Vanaei village in Eslam Abad Gharb, Iran. J. Agric. Biol. Sci. 2012, 7, 968–976. [Google Scholar]
  13. Valipour, M. Variations of land use and irrigation for next decades under different scenarios. Irriga 2016, 1, 262–288. [Google Scholar] [CrossRef]
  14. Valipour, M. Use of Surface Water Supply Index to assessing of water resources management in Colorado and Oregon, US. Adv. Agric. Sci. Eng. Res. 2013, 3, 631–640. [Google Scholar]
  15. Valipour, M. Necessity of Irrigated and Rainfed Agriculture in the World. Irrig. Drain. Sys. Eng. 2013, 9, e001. [Google Scholar] [CrossRef]
  16. Valipour, M. Land use policy and agricultural water management of the previous half of century in Africa. Appl. Water Sci. 2015, 5, 367–395. [Google Scholar] [CrossRef]
  17. Valipour, M. Evolution of Irrigation-Equipped Areas as Share of Cultivated Areas. Irrig. Drain. Sys. Eng. 2013, 2, e114. [Google Scholar] [CrossRef]
  18. Brazilian Institute of Geography and Statistics (IBGE). Estados IBGE. Available online: http://www.ibge.gov.br/estadosat/perfil.php?lang=&sigla=mg (accessed on 02 February 2016).
  19. Sá Junior, A.; Carvalho, L.G.; Silva, F.F.; Carvalho Alves, M. Application of the Köppen classification for climatic zoning in the state of Minas Gerais, Brazil. Theor. Appl. Climatol. 2012, 108, 1–7. [Google Scholar] [CrossRef]
  20. Brazilian National Water Agency (ANA). HidroWeb—Sistema de Informações Hidrológicas. Available online: http://www.hidroweb.ana.gov.br (accessed on 15 August 2016).
  21. Teodoro, P.E.; Guedes Corrêa, C.C.; Torres, F.E.; Oliveira Junior, J.F.; Silva Junior, C.A.; Gois, G.; Coll Delgado, R. Analysis of the Occurrence of Wet and Drought Periods Using Standardized. J. Agron. 2015, 14, 80–86. [Google Scholar]
  22. Svoboda, M.; Hayes, M.; Wood, D. Standardized Precipitation Index—User Guide; World Meteorological Organization (WMO): Geneva, Switzerland, 2012. [Google Scholar]
  23. Edwards, D.C. Characteristics of 20th Century Drought in the United States at Multiple Time Scales. Master Thesis, Colorado State University, Fort Collins, CO, USA, 1997. [Google Scholar]
  24. Santos, J.F.; Portela, M.M.; Pulido-Calvo, I. Regional frequency analysis of droughts in Portugal. Water Resour. Manag. 2011, 25, 3537–3558. [Google Scholar] [CrossRef]
  25. Volkova, T.; Afanasev, I.; Longobardi, A.; Alexey, E. Gamma distribution function as a tool for monthly precipitation generation in the Bashkortostan Republic, Russian Federation. In Latest Trends in Energy, Environment and Development, Proceedings of the 7th International Conference on Environmental and Geological Science and Engineering (EG ’14), Proceedings of the 7th International Conference on Urban Planning and Transportation (UPT ’14), Proceedings of the 3rd International Conference on Energy Systems, Environment, Entrepreneurship and Innovation (ICESEEI ’14), Salerno, Italy, June 3–5, 2014; WSEAS Press: Salerno, Italy, 2014. [Google Scholar]
  26. Thom, H.C. A note on the gamma distribution. Mon. Weather Rev. 1958, 86, 117–122. [Google Scholar] [CrossRef]
  27. Stephens, M.A. EDF Statistics for Goodness of Fit and Some Comparisons. J. Am. Stat. Assoc. 1974, 69, 730–737. [Google Scholar] [CrossRef]
  28. Fiedler, F.R. Simple, practical method for determining station weights using Thiessen polygons and isohyetal maps. J. Hydrol. Eng. 2003, 4, 219–221. [Google Scholar] [CrossRef]
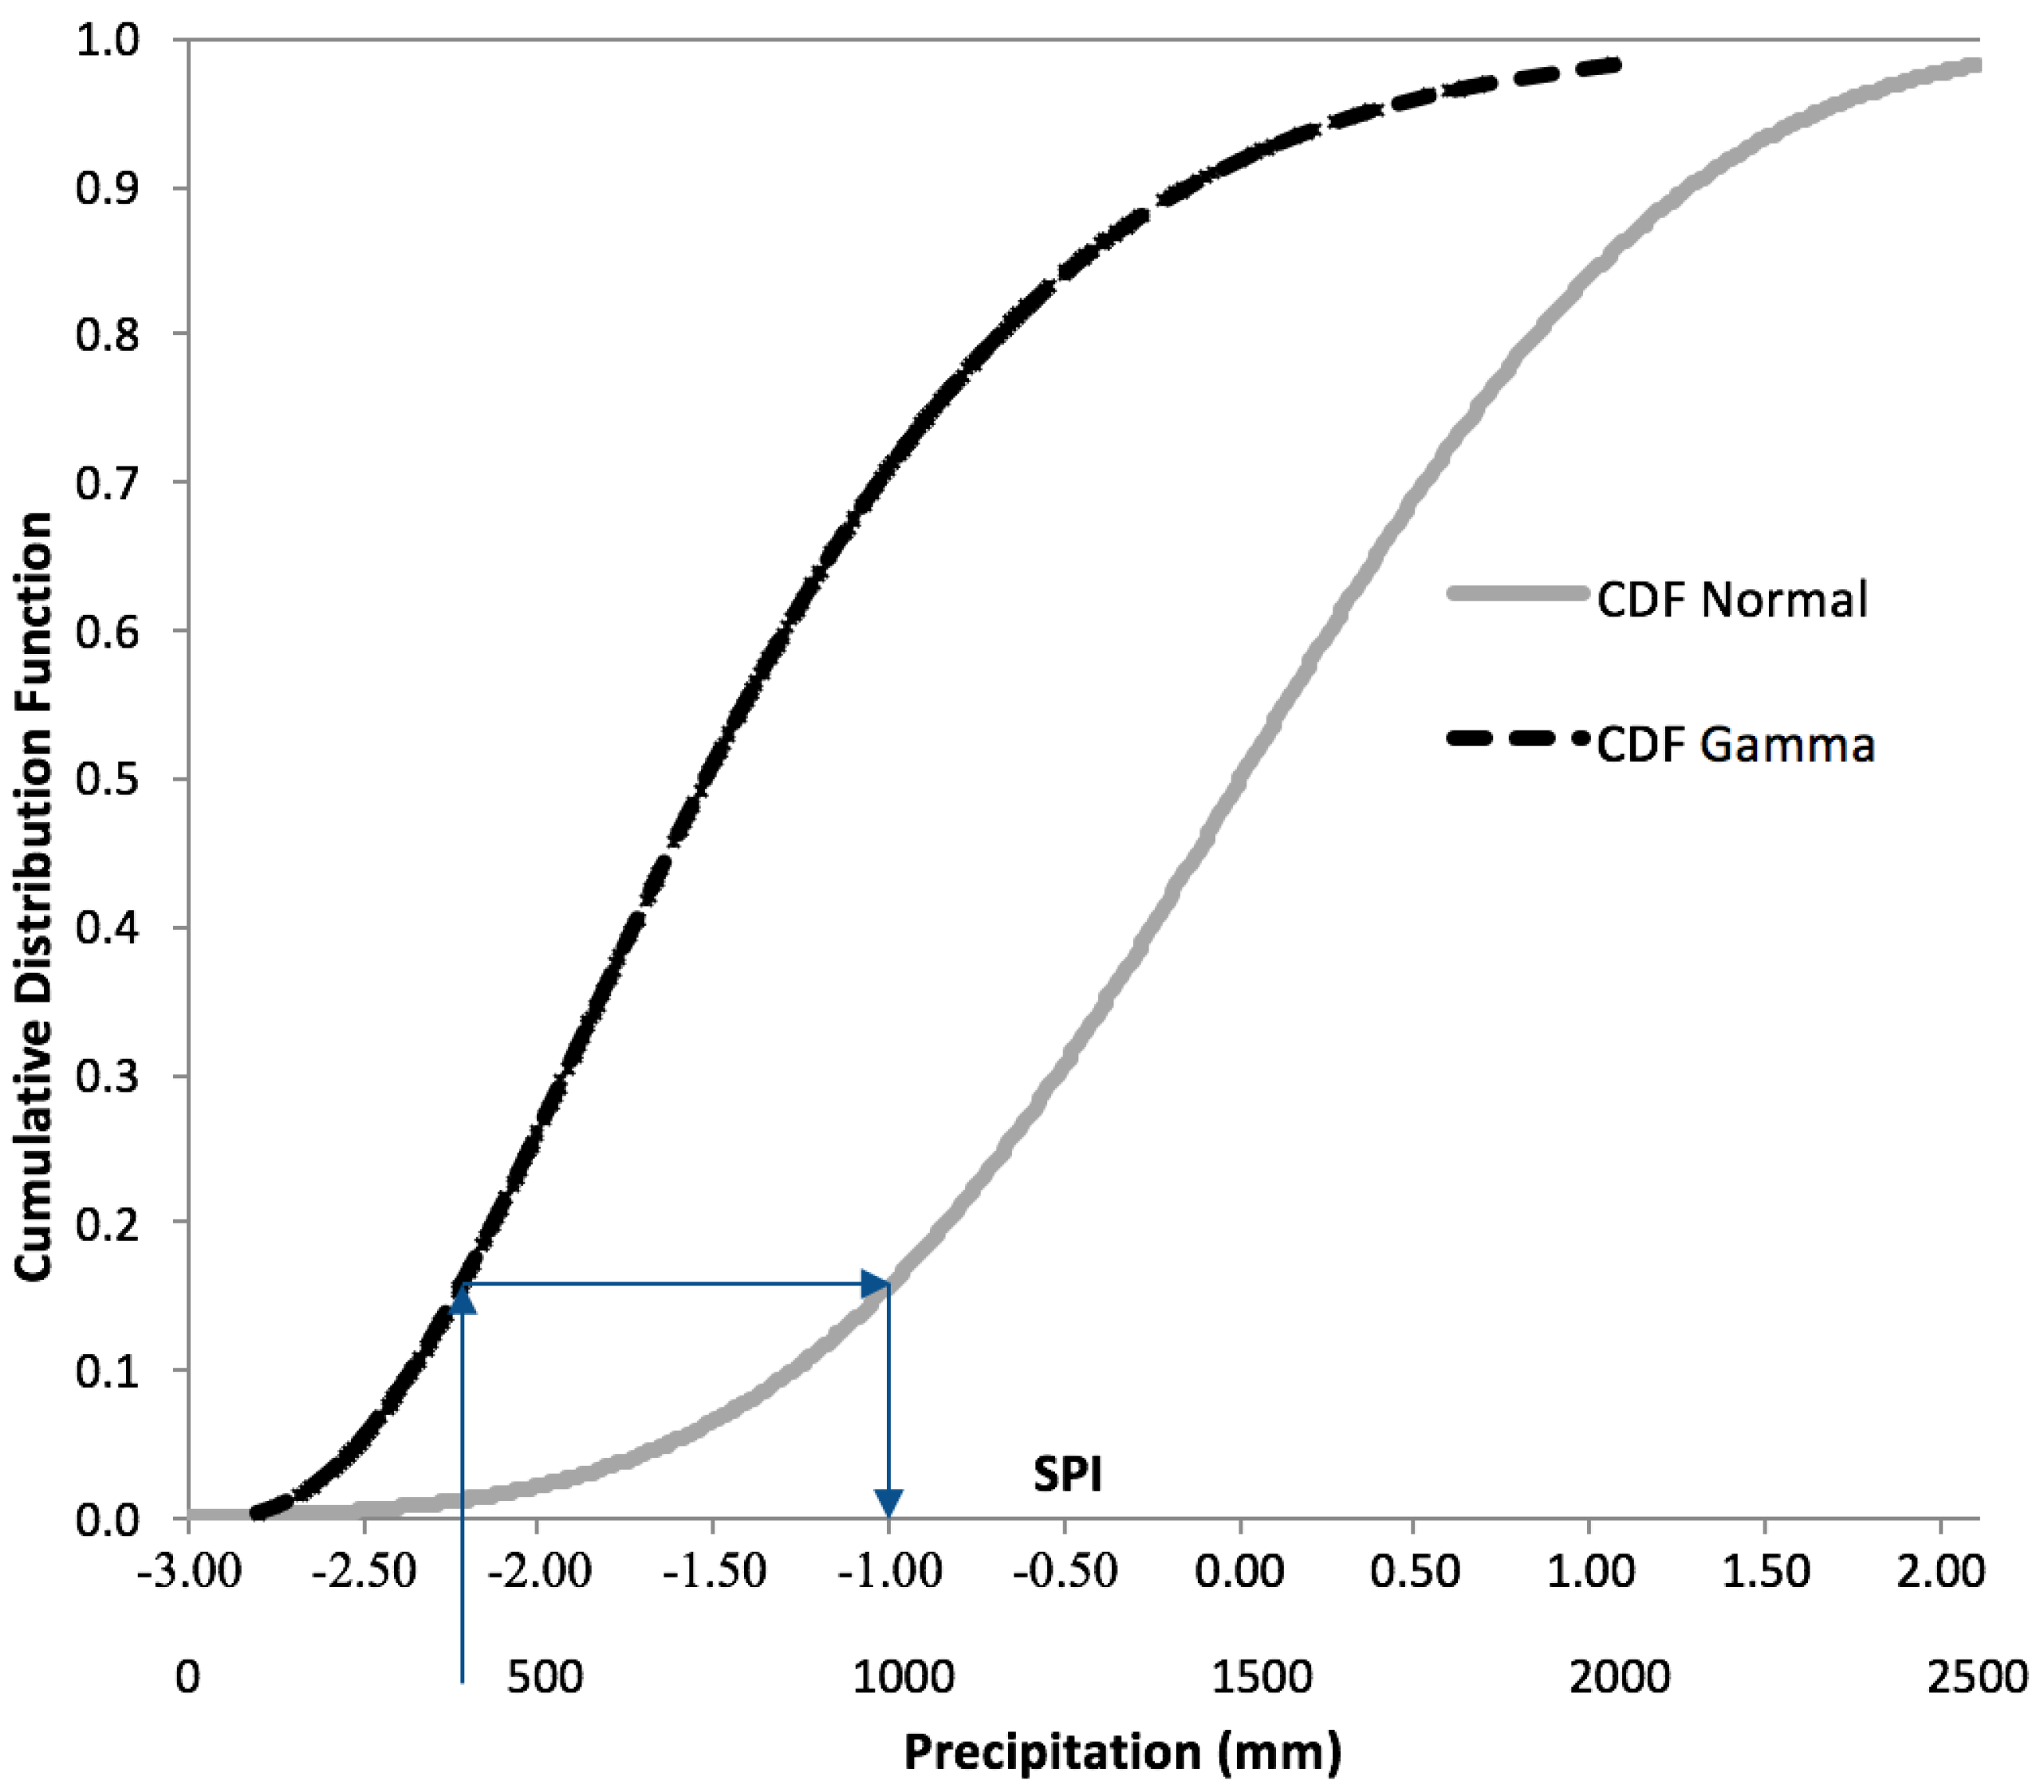
Figure 1. Sub-catchments influenced by the semi-arid climate in Minas Gerais.
Hydrology 04 00026 g001
Figure 2. Selected stations for drought analysis.
Hydrology 04 00026 g002
Figure 3. Transformation cumulative distribution function (CDF) gamma to CDF. Adapted from [1].
Hydrology 04 00026 g003
Figure 4. Thiessen polygon method for the semi-arid influence in Minas Gerais: (a) for a general application; (b) for 12-month drought events.
Hydrology 04 00026 g004
Figure 5. Twelve-month moving cumulative precipitation and drought events for São Francisco station.
Hydrology 04 00026 g005
Figure 6. Severity-Duration-Frequency curves for the stations: (a) São Francisco; (b) São Joã da Ponte; (c) Janaúba; (d) Manga; (e) São Gonçalo; (f) Cajueiro; (g) Itamarati; (h) Sã Joã do Paraíso; (i) Rio Pardo de Minas; (j) Vila Terra Branca; (k) Arinos Montante; (l) Vila Urucuia; (m) São Romã; (n) São Joã da Vereda; (o) Urandi; (p) Inhobim; (q) Itaobim.
Hydrology 04 00026 g006aHydrology 04 00026 g006bHydrology 04 00026 g006c
Figure 7. Regionalized Severity-Duration-Frequency (SDF) curves for semi-arid climate influence in Minas Gerais.
Hydrology 04 00026 g007
Figure 8. Isohyetal map of cumulative 12-month precipitation for analysis of 1-month drought and average recurrence interval of 100 years.
Hydrology 04 00026 g008
Table 1. Relationship between Standardized Precipitation Index (SPI) values and drought categories.
SPI ValuesCategoryNormal Distribution Cumulated Probabilities
0.00 to −0.99Near normal0.500
−1.00 to −1.49Moderate drought0.158
−1.50 to −1.99Severe drought0.066
−2.00 and lessExtreme drought0.022
Source: [1].
Table 2. Threshold level and number of drought events for different durations.
StationThreshold Level (mm)Number of Events of Drought
1-Month Duration3-Month Duration6-Month Duration9-Month Duration12-Month Duration
São Francisco775.7151210106
São João da Ponte748.0128884
Janaúba572.61210887
Manga632.9191614127
São Gonçalo634.41211998
Cajueiro763.365553
Itamarati549.91511984
São João do Paraíso540.8141313118
Rio Pardo de Minas645.31211985
Vila Terra Branca792.5131111106
Arinos Montante890.3141413128
Vila Urucuia833.5141310105
São Romão797.4161413137
São João da Vereda757.21211997
Urandi484.1119886
Inhobim493.11211996
Itaobim489.7121211117
Table 3. Severity of events identified for São Francisco station.
Ranked EventsCumulative 12-Month Average Precipitation (mm)
1-Month Duration3-Month Duration6-Month Duration9-Month Duration12-Month Duration
1539.5571.6572.6606.3623.3
2550.3592.8594.7611.3654.1
3562.2593.3612.4612.1665.7
4569.1613.7620.5631.9669.5
5569.7614.1675.5687.0812.4
6578.8645.7734.0752.9861.9
7590.9655.1738.4774.3
8592.8712.7763.7788.4
9695.4725.4784.7813.0
10713.7748.1819.5855.9
11717.9810.4
12718.5839.6
13721.0
14760.5
15771.6
Table 4. Fitted gamma distribution for São Francisco Station.
Exceedance ProbabilityAverage Recurrence Interval (years)Cumulative 12-Month Precipitation (mm)
1-Month Duration3-Month Duration6-Month Duration9-Month Duration12-Month Duration
1%100.00468.4497.2512.0521.2527.8
2%50.00486.7516.0530.8541.2547.4
3%33.33498.5528.2543.0554.2560.0
4%25.00507.5537.5552.4564.2569.7
5%20.00515.0545.1560.0572.3577.7
6%16.67521.3551.7566.6579.3584.5
7%14.29527.0557.5572.4585.5590.5
8%12.50532.1562.7577.6591.1595.9
9%11.11536.7567.5582.4596.2600.9
10%10.00541.0571.9586.8600.9605.5
20%5.00573.7605.5620.4636.9640.4
30%3.33598.1630.5645.4663.6666.4
40%2.50619.5652.5667.3687.1689.2
50%2.00640.0673.4688.2709.5710.9
60%1.67660.9694.8709.6732.5733.1
70%1.43683.8718.2732.9757.5757.4
80%1.25711.2746.2760.8787.6786.5
90%1.11750.4786.3800.7830.5828.0
91%1.10755.8791.8806.2836.4833.7
92%1.09761.6797.8812.1842.9839.9
93%1.08768.1804.4818.7850.0846.8
94%1.06775.4811.9826.1858.0854.5
95%1.05783.8820.4834.7867.2863.3
96%1.04793.7830.6844.7878.0873.8
97%1.03806.0843.1857.2891.5886.8
98%1.02822.6860.0874.0909.6904.3
99%1.01849.1887.0900.9938.7932.3

