Article

Influence of Crust Formation on Soil Porosity under Tillage Systems and Simulated Rainfall

by
Jaqueline Dalla Rosa
1,*,
Miguel Cooper
2,
Frédéric Darboux
3,†,
João Carlos Medeiros
1,
Carla Campanaro
2 and
Luiz Roberto Martins Pinto
4
1
Universidade Federal do Piauí, Campus Professora Cinobelina Elvas (UFPI/CPCE), CEP: 64900-000 Bom Jesus, PI, Brazil
2
Departamento de Ciência do solo, Escola Superior de Agricultura ‘‘Luiz de Queiroz’’, Universidade de São Paulo (ESALQ/USP), CEP: 13400-000 Piracicaba, SP, Brazil
3
INRA, UR0272, UR Science du sol, F-45075 Orléans, France
4
Universidade Estadual de Santa Cruz, Campus Soane Nazaré de Andrade, Rodovia Jorge Amado, Km 16, Bairro Salobrinho, CEP: 45662-900 Ilhéus, Bahia, Brazil
*
Author to whom correspondence should be addressed.
Presently at: Inra, Laboratoire Sols et Environnement, UMR 1120, F-54518 Vandoeuvre-lès-Nancy, France.
Hydrology 2017, 4(1), 3; https://doi.org/10.3390/hydrology4010003
Submission received: 28 June 2016 / Revised: 15 December 2016 / Accepted: 21 December 2016 / Published: 5 January 2017

Abstract

:
Surface crusts, formed by raindrop impact, degrade the soil surface structure causing changes in porosity. An experiment was conducted with the objective of evaluating the influence of the formation of a crusting layer on the porosity (percentage of area, shape and size) of a Haplic Acrisol under three tillage systems, and simulated rainfall. The tillage systems were: conventional tillage (CT), reduced tillage (RT) and no-tillage (NT). Each tillage system was submitted to different levels of simulated rainfall (0, 27, 54 and 80 mm) at an intensity of 80 mm·h−1. Undisturbed soil samples were collected and resin impregnated for image analysis in two layers: layer 1 (0–1 cm) and layer 2 (1–2 cm). Image analysis was used to obtain the pore area percentage, pore shape and size. The degradation of the soil surface and change in porosity, caused by rainfall, occurred differently in the tillage systems. In the CT and RT systems, the most pronounced pore changes caused by rainfall occurred in layer 1, but in the NT system, this change occurred in layer 2. The rainfall caused change of pore area percentage in the CT and RT systems, with reduction of complex and an increase of rounded pores. The NT system showed greater occurrence of the rounded pores (vesicles), originated by processes of wetting below the residue cover, and by alternating periods of wetting and drying. In this study, the changes in porosity were attributed to two main factors: (1) to the effect of the raindrop directly on the soil surface (for CT and RT tillage systems) and (2) water transfer processes in the soil surface (for NT systems).

1. Introduction

Soil functions as an environmental regulator of the hydrological and biogeochemical cycles, besides being a reservoir of biodiversity [1,2]. However, soil is also a natural resource that can be easily degraded. Erosion is one of the main forms of soil degradation, and the erosive process begins by degrading the soil surface. Surface crusts, formed by raindrop impact, degrade the soil surface structure causing changes in porosity. Soil porosity is a dynamic attribute and has been used in different ways by scientists to evaluate soil surface degradation by crusting [3]. Superficial crusts are formed under rain or irrigation through two main processes. Initially, raindrop impact disaggregates the soil surface structure into micro-aggregates, which are rearranged “in situ” without evidence of lateral movement, forming structural crusts. Secondly, depositional crusts are formed by the translocation of micro-aggregates by runoff or still depositional processes, as in puddles, which can be deposited at variable distances from the origin [4].
Studies that use soil porosity to evaluate the surface degradation by crusting are based on qualitative techniques, such as micromorphological descriptions of soil thin sections, quantitative techniques that use 2D or 3D image analysis, and also soil infiltration data to assess changes in porosity before and after the application of rainfall [3,4,5,6]. Searching for a greater detailing, Fox et al. [3] evaluated changes in soil porosity with depth in a structural crust by quantifying pore type and size distribution to distinguish between the crust layer and underlying soil.
The data on porosity obtained from image analysis or observations of the pore morphological characteristics are important to evaluate the soil structure and the processes that influence its formation or degradation [7]. Parameters such as the size and shape, distribution and the relative position of the pores are essential to evaluate changes in soil structure caused, for example, by different tillage practices [7,8,9], wetting and drying processes [10].
Macroporosity (>75 μm) is highly influenced by changes in soil structure. In a study developed in the field using conventional tillage systems, the results showed the formation of soil compaction due to successive rainfall events, and that this process impacted mainly the soil macroporosity [11]. A similar process was observed by Rousseva et al. [12] that evaluated the formation of crusts under simulated rainfall in two layers 0–3 cm and 3–6 cm. The authors observed that the occurrence of crusts caused a decrease in macroporosity in the both layers mainly due to the loss of elongated pores. The greatest reduction occurred in the 3–6 cm layer and was caused by the pressure exerted by the raindrops on the soil surface that was transferred to this deeper layer, resulting in the destruction of large pores. Similarly, in tilled soils without crop residue cover in Italy, soil crusting reduced pore connectivity [6].
The degradation of the soil surface caused by raindrop impact and, consequently, crusting may occur at different magnitudes and it depends on the soil characteristics, such as: texture; mineralogy; organic matter; initial moisture; distribution, size and aggregate stability [13,14,15,16,17]; and climatic factors, especially rain intensity, drop size distribution, drop impact velocity and kinetic energy, etc. [18,19,20,21,22].
Moreover, tillage practices, tillage intensity and crop residue cover also affect crust formation by rainfall and can influence mayor or minor degradation of the soil surface. Studies have recommended the adoption of soil conservation systems, such as reduced or no-tillage, to prevent soil structural degradation, crust formation and soil loss by erosion [23,24,25,26]. Part of this study has already been published and showed that the greater soil revolving and incorporation of crop residues, promotes greater degradation by drop impact and crust formation [27]. However, many aspects about the process dynamics of crust formation in these tillage systems still need clarification, such as the changes caused by rain events on the surface porosity and the predominant pore types.
Therefore, the objective of this study was to evaluate the changes in soil porosity in a crusting layer of a Haplic Acrisol under three tillage systems and simulated rainfall using image analysis techniques.

2. Materials and Method

2.1. Study Area, Soil Characteristics and Experimental Design

The experiment was carried out in the municipality of Piracicaba, São Paulo State, Brazil (coordinates: 22°42′′ S, 47°36′′ W) on a sandy Haplic Acrisol according to WRB 2014 [28]. The climate of the study site is tropical Cwa (Köppen classification). The landscape is gently undulating and the altitude is 542 m. The average annual precipitation for the last ten years was 1193 mm and the three maximum rainfalls in 24 h occurred in March 2002 (104 mm), May 2005 (139 mm) and January 2008 (87 mm) (Meteorological database from the University of São Paulo-ESALQ, coordinates: 22°42′0′′ S–47°38′00′′ W; Elevation: 546 m).
The soil chemical properties for the 0–20 cm layer are: pH in CaCl2 = 5.11; OM = 32 g·dm−3; P = 5 mg·dm−3; K = 0.8 mmolc·dm−3; Ca = 23 mmolc·dm−3; Mg = 12 mmolc·dm−3; H + Al = 28 mmolc·dm−3; Al = 0.43 mmolc·dm−3; SB = 35.8 mmolc·dm−3; CEC = 63.8 mmolc·dm−3; V = 56%. Where: pH in CaCl2: pH extracted with CaCl2 (0.01 M); OM: Organic Matter; P: Phosphorous; K: Potassium; Ca: Calcium; Mg: Magnesium; H + AL: Hydrogen + Aluminum (potential acidity); SB: Sum of bases; CEC: effective cation exchange capacity; V: base saturation. The chemical analyses were performed according to Raij and Quaggio (1997) [29]. The particle size distribution of the studied soil, with sand particles separation for the 0–5 cm layer, and the general particle size distribution for the other layers are described in Table 1. The particles size distribution was analyzed according to Gee and Bauder (1986) [30].
In November 2008, the soil was tilled in all the experimental area (one plowing + three harrowing procedures) to standardize the conditions of the soil surface and a cover crop was sown (Brachiaria decumbens Stapf., without seed incorporation and sowing density of 13 kg·ha−1).
The experimental design was completely randomized with micro-plots and three repetitions. The treatments consisted of three tillage systems (CT, RT and NT) and four simulated rainfall volumes (0, 27, 54 and 80 mm) applied on the micro-plots. The effects of the treatments were evaluated in two soil layers (layer 1: 0–1 cm and layer 2: 1–2 cm) and in two consecutive years (2009 and 2010). In 2010 the experiment was installed in the same plots of the previous year.

2.2. First Year of Experiment (2009)

In early April 2009, the fully developed brachiaria was mechanically mowed and the regrowth was controlled with a systemic herbicide (Glyphosate), at a dosage of 4.0 L·ha−1. The average dry matter produced by brachiaria amounted to 8.400 kg·ha−1. The dry matter was determined with the aid of a metal square (0.5 m × 0.5 m). All plant material retained in the square was cut near the soil surface, dried in stove and determined the dry matter in kg·ha−1.
To evaluate the effect of soil tillage on the pore soil system, in June 2009, we established three tillage systems, with different soil mobilization intensities: conventional tillage (CT) performed with one plowing and two disking procedures; reduced tillage (RT) with heavy disking; and no-tillage (NT), without mobilization of the soil surface. The soil tillage depths were 25–30 cm in CT and 15–20 cm in RT. After each preparation, the remaining dry matter cover on the soil surface was 0% for CT, 70%–80% for RT and 100% for NT. Each tillage system was performed in 7 m × 30 m plots, in which 12 micro-plots of 1 m × 1 m, were installed randomly.
To assess the effect of rainfall on the soil surface porosity, we applied different simulated rainfall amounts (0, 27, 54 and 80 mm). Each rainfall amount was applied only once in the different micro-plots, with three repetitions, totaling 12 micro-plots for each soil tillage system. The simulated rainfall intensity was 80 mm·h−1 (±5 mm·h−1), applied shortly after the soil tillage operations with a rainfall simulator operated at 2.4 m above the ground. The simulator consisted of an oscillating nozzle type VeeJet Spray Nozzle (H/U-80100, Spraying Systems Co., City, State abbrev. if USA, Country). The mean weighted diameter (MWD) of the raindrops ranged from 1.5 to 2.5 mm. The rainfall was applied to an area corresponding to 1 m2. Studies using rainfall simulators are frequently used to evaluate surface degradation and crust formation [27], aggregate breakdown [22,31] and soil erosion [32].

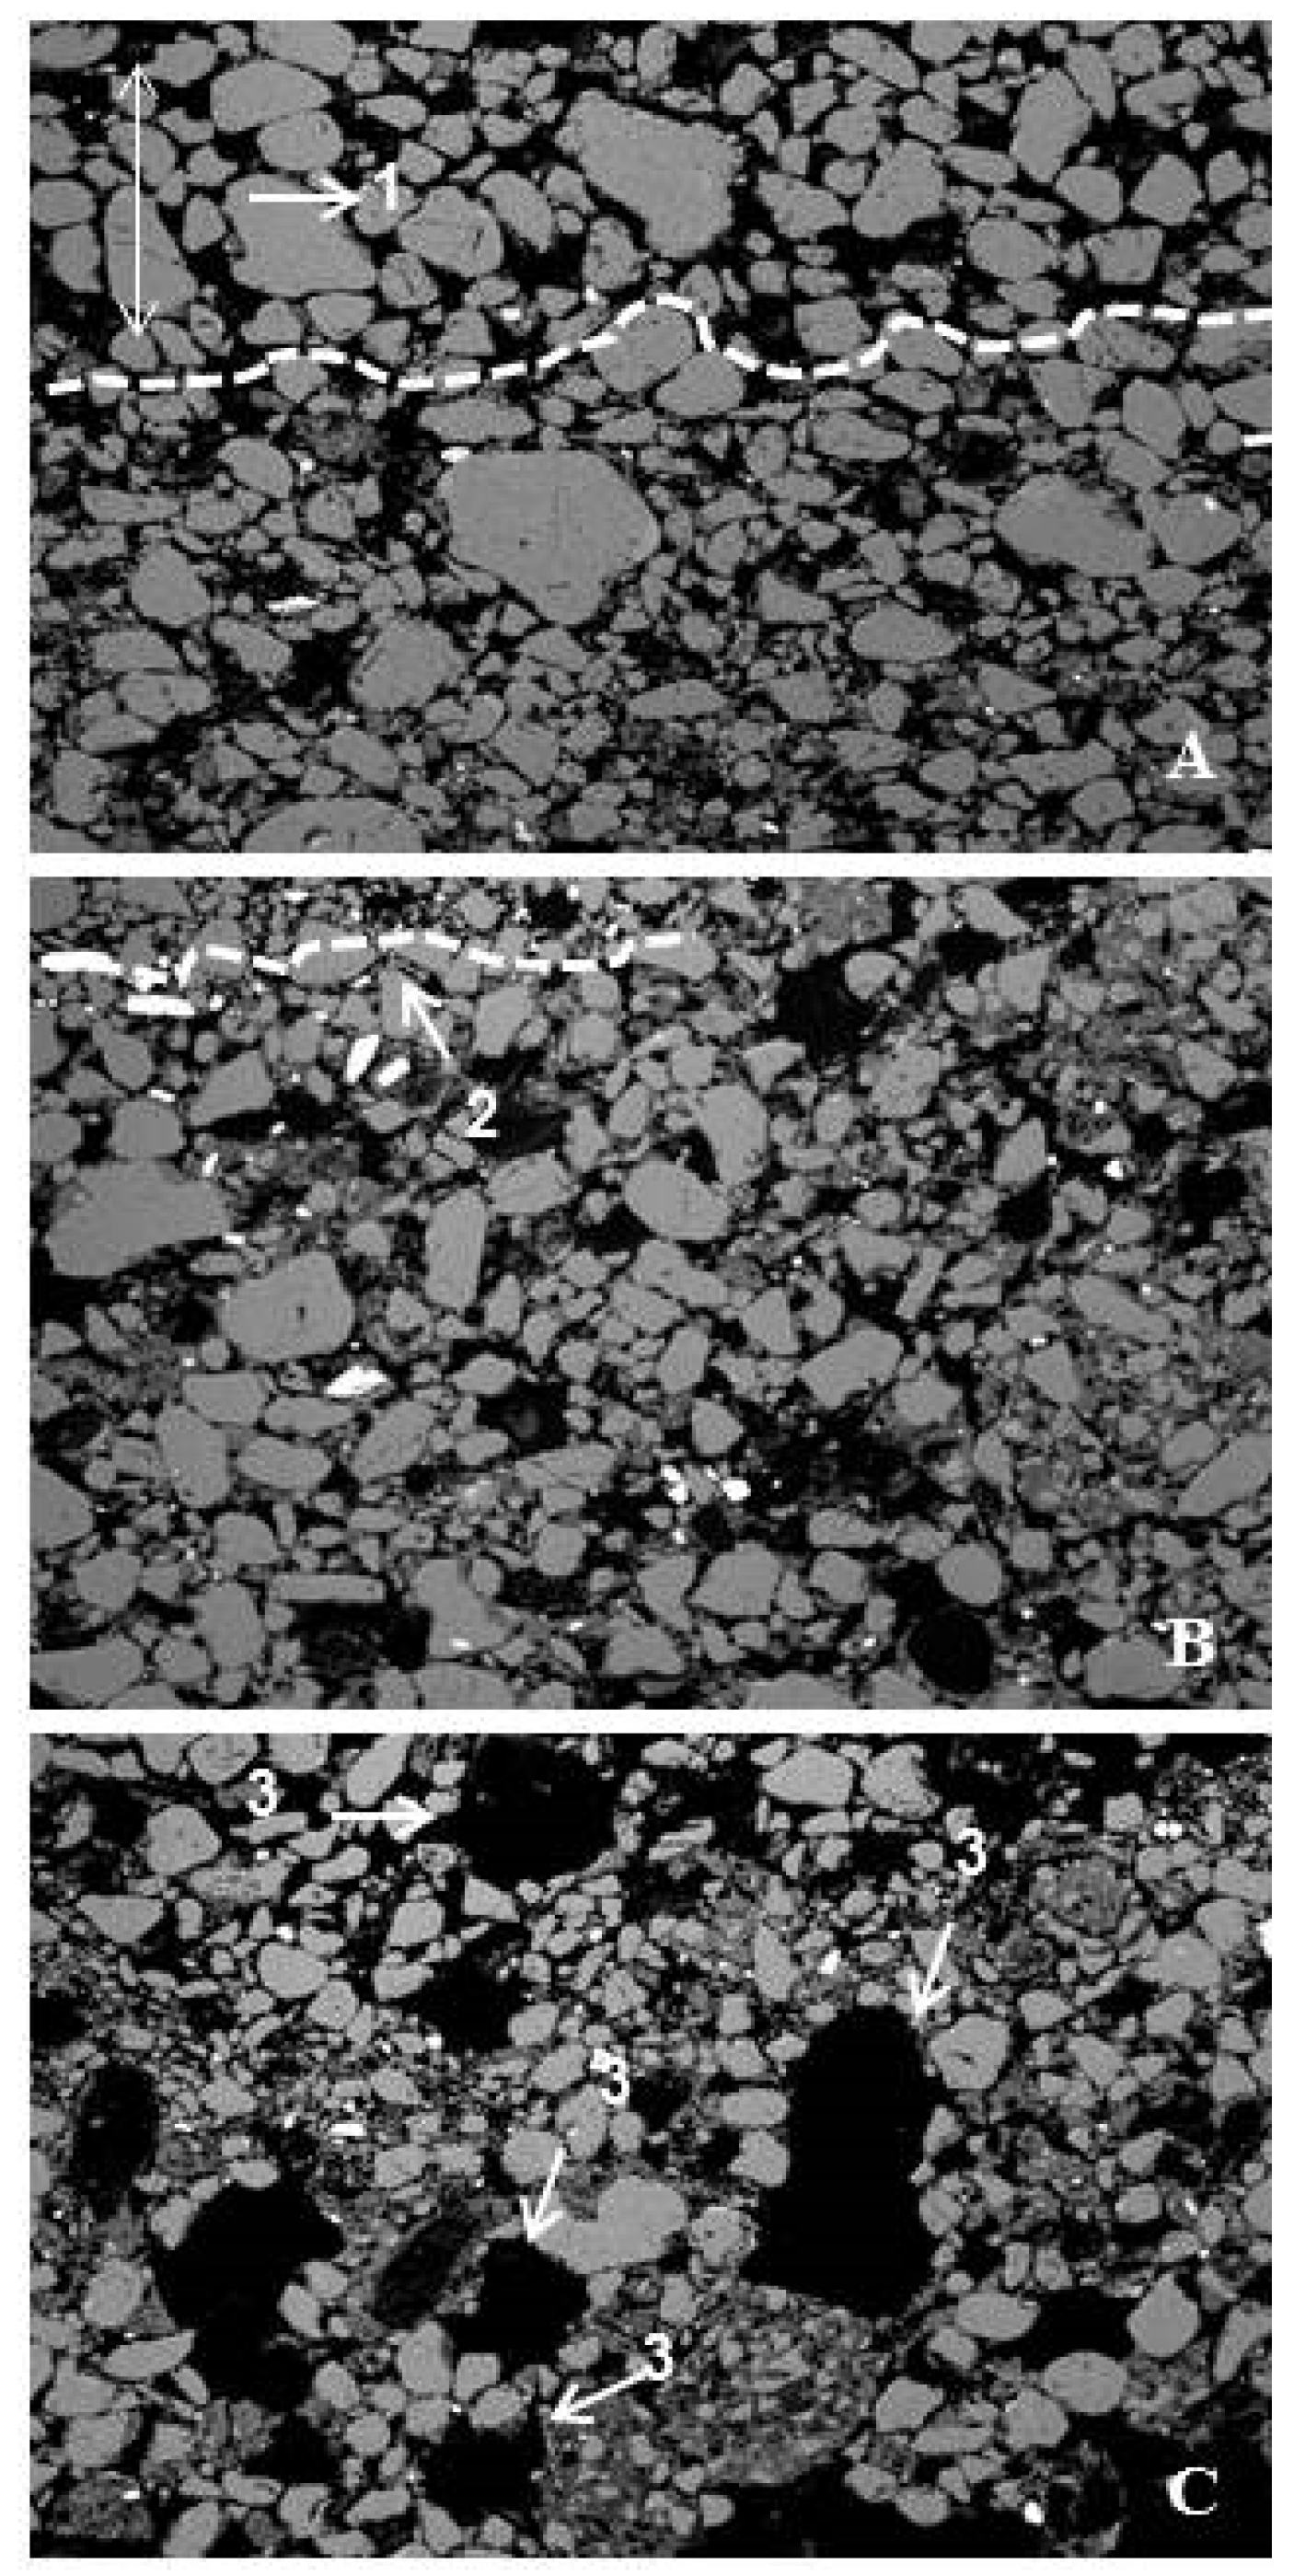
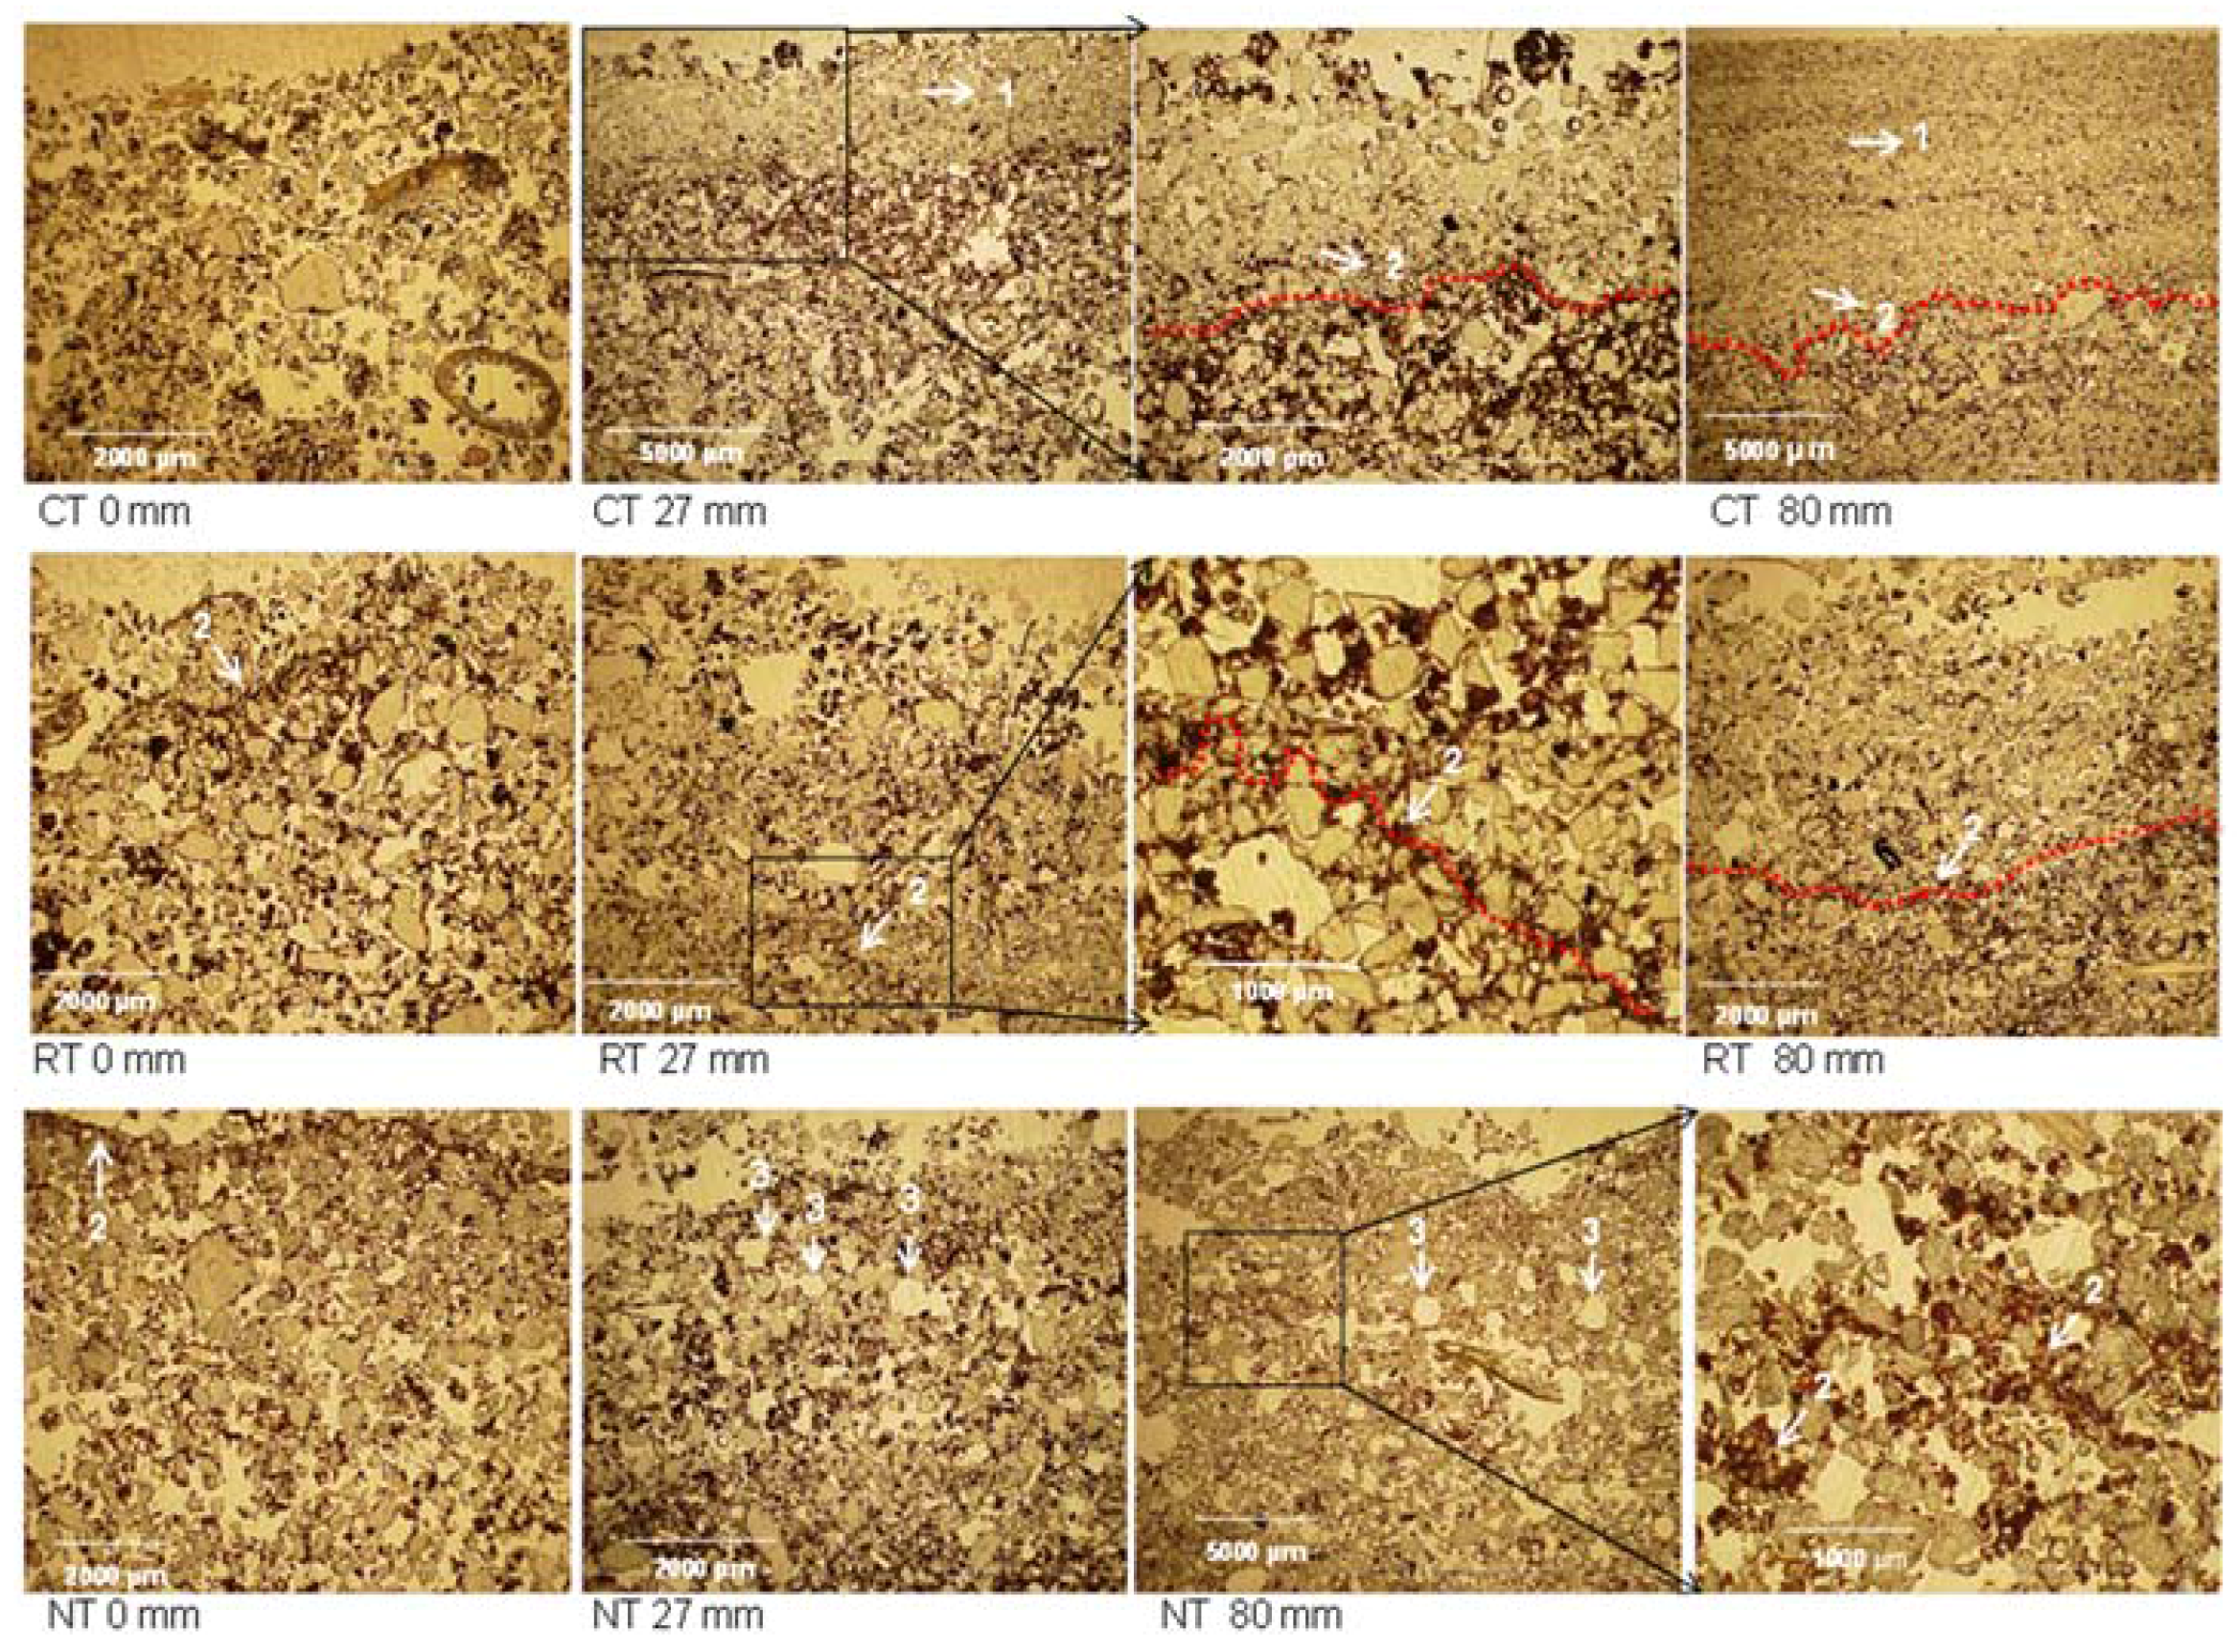
2.3. Soil Sampling, Impregnation and Porosity Analysis

For the porosity analysis, the samples were collected from the experimental area 24 h after the rainfall simulation. In each micro-plot, undisturbed samples were collected, which consisted of a block of soil (7 cm × 5 cm × 12 cm), surface-oriented, and placed in special paper boxes. In the laboratory, the samples were air-dried for 15 days and then in a ventilated oven at 40 °C for 48 h. Next, the samples were impregnated with polyester resin [33,34,35]. After full impregnation, hardening and drying, the blocks were cut into vertical surface-oriented slices (approximately 0.5 cm thick). A representative slice was chosen and sanded and polished with a lapping machine.
To evaluate the effects of the rainfall amount on soil porosity in depth, the image analysis was sequenced in two layers, (i) “layer 1”, directly affected by the raindrops, corresponding to the first 1 cm of soil (0–1 cm) and (ii) “layer 2”, right below the crust, with a thickness also of 1 cm (1–2 cm), which can be indirectly affected by the pressure exerted by the crust. Each layer (layer 1 and 2) was analyzed using three micro-photographs of 1 cm × 1 cm.
Knowing that pore distribution and morphology is important to assess soil structure, these attributes were analyzed by image analysis techniques, as proposed by Murphy et al. [34] and Ringrose-Voase [8]. Two-dimensional images (digital microphotographs, 1 cm × 1 cm), with 1024 × 768 pixels resolution and 10× magnification, were obtained with a CCD Sony® camera attached to a Zeiss® stereomicroscope. An ultraviolet light source was used to separate the pores from the soil matrix at image acquisition. The images were processed and analyzed using the Noesis® Visilog 5.4 software, Manufacturer, City, State abbrev. if USA, Country).
The soil porosity determined by the image analysis was expressed in percentage (%) of the image area occupied by pores. The pores were classified as: rounded (Round.), elongated (Elong.) and complex (Comp.), according to two shape indices (I1 and I2), as described in Cooper et al. [36]; and according to size: small (S) (156–15,600 μm2), medium (M) (15,600–156,000 μm2) and large (L) (>156,000 μm2), as described in Pagliai et al. [37,38].
To help understand the distribution of pores after rainfall application, thin sections were prepared for each tillage system at the highest rainfall amount (80 mm) for analysis in a scanning electron microscope at 35× magnification. The thin sections were vertically oriented prepared and carbon-coated [35].

2.4. Second Year of Experiment (2010)

After soil sampling in June 2009, the experimental area remained fallow until November 2009, when the brachiaria was sown again (13 kg·ha−1) and nitrogen (200 kg·ha−1 of N) was applied superficially without incorporation. All the steps until the second sample collection, in June 2010, followed the same protocol of the previous year (2009), with the tillage and rainfall applied in the same micro-plots. The dry matter produced by brachiaria in 2010 was 10.400 kg·ha−1. In the second year of the experiment, the percentage of remaining dry matter cover after tillage on the soil surface was 0% for CT, 80%–85% for RT and 100% for NT.
During the fallow period, that preceded soil tillage (December 2008 to May 2009, and July 2009 until May 2010), the experimental area was hit by natural rains. The natural rainfall accumulated for the study period amounted to 554 mm (December 2008 to May 2009) and 1.348 mm (July 2009 to May 2010) (Meteorological database from the University of São Paulo—ESALQ).

2.5. Statistical Analysis
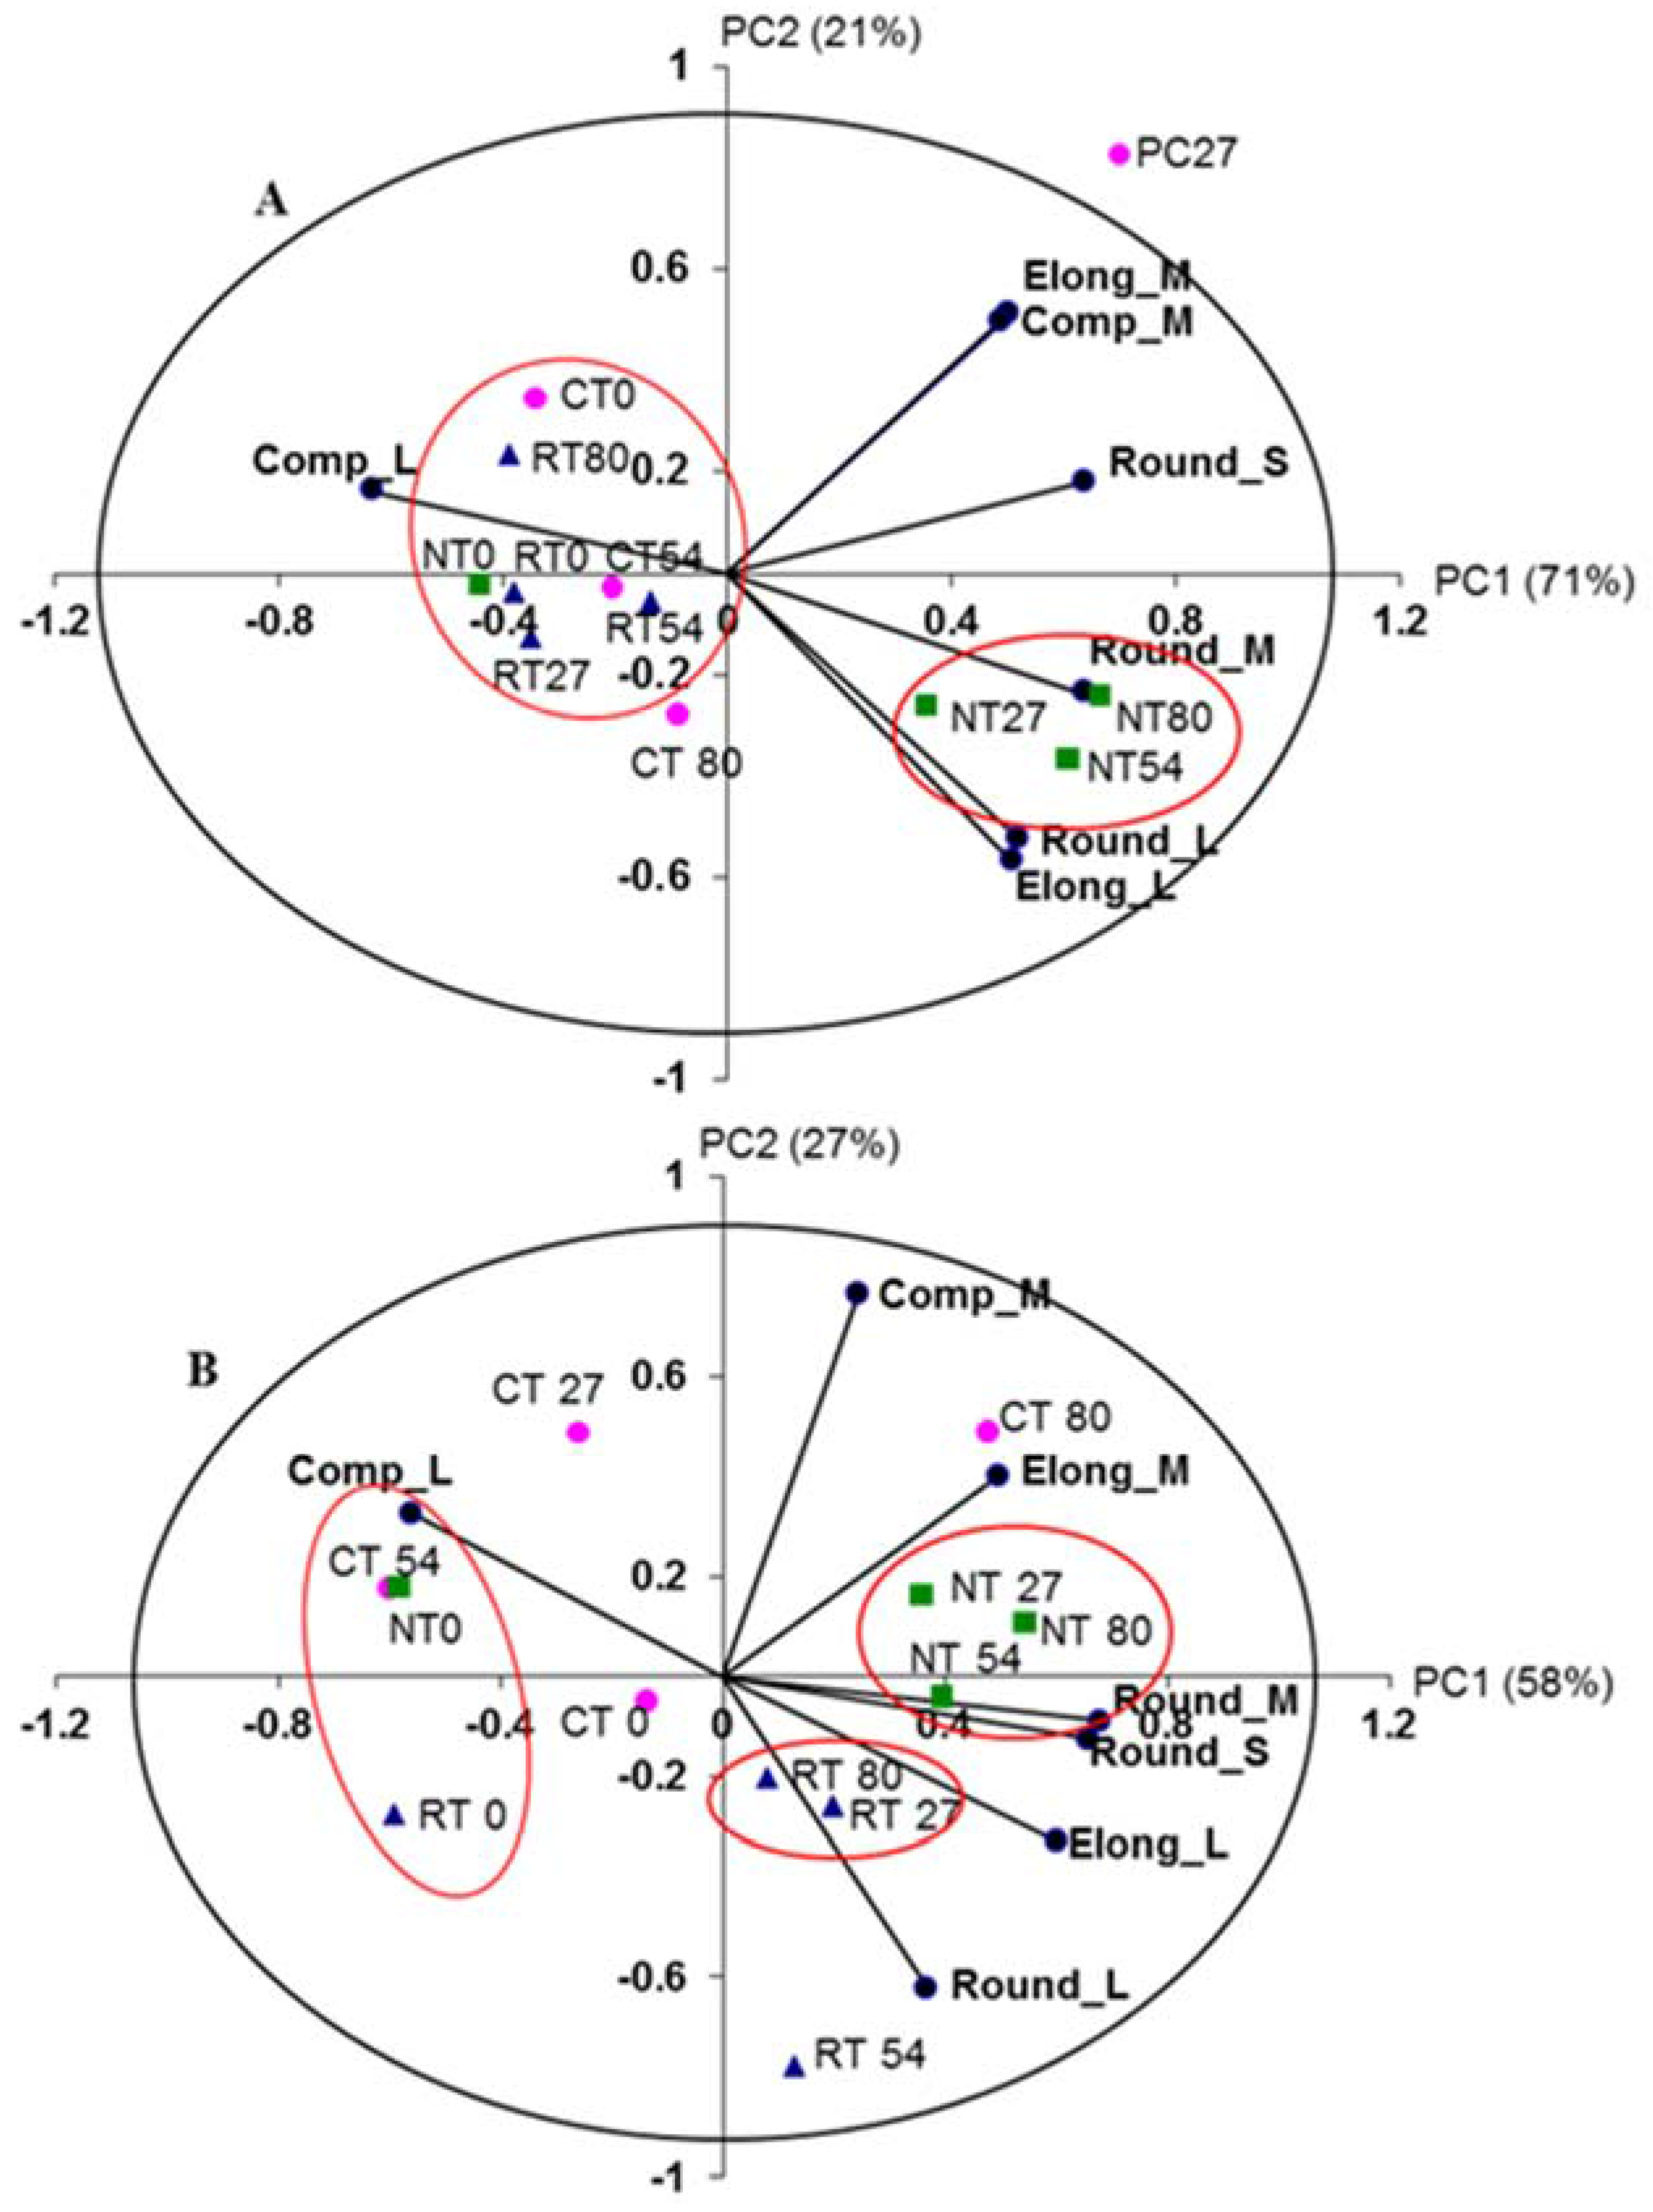
We analyzed the area percentage of the image occupied by each type of pore according to shape and size: rounded small (Round_S), rounded medium (Round_M), rounded large (Round_L), elongated small (Elong_S), elongated medium (Elong_M), elongated large (Elong_L), complex small (Comp_S), complex medium (Comp_M), complex large (Comp_L) and total pore area (TPA).
We performed ANOVA and F tests to evaluate the effects of the variation factors (soil tillage, simulated rainfall, soil layers) by years using the GLM Procedure in SAS (2002–2004). Soil tillage type was compared by Tukey’s test (p < 0.05) and regression analyses were done to analyze the impact of rainfall on soil structure. To understand the relationships between the types of pores and the effects of other factors in the experiment we performed multivariate analyses using the PCA technique and biplot graphs [39,40]. Biplot graphs were created considering the first two principal components with greater variance and eigenvalues greater than 1.0. [41,42,43]. The PCA was calculated by means of a data matrix to test the relationships between (1) soil tillage; (2) rainfall; (3) soil tillage and rainfall interaction, and to select the most important pores. The relevance of variables was judged according to the direction, orientation and magnitude of their vectors. The PCA and the biplot graphs were prepared with ‘Biplot and Singular Value Decomposition Macros for Excel ©’ [42].
Due to the large number of variables evaluated in this work (soil tillage, rain, soil layer and year), we decided to conduct some exploratory PCA’s to better understand the effects of soil tillage and simulated rainfall amount on the area percentage occupied with pores. Based on these exploratory PCA’s, which showed differences for the years (and soil layers (), we proceeded with the PCA analysis for each layer and each year (for layer 1 and layer 2).

3. Results

The analysis of variance demonstrated significant effect for soil tillage, rainfall and layer for 2009 and 2010 (Table 2). The effect of the tillage systems is observed in Table 3, where the different types of pores showed similar behavior in the three tillage systems evaluated for both years. The % TPA and Comp_L showed higher values in CT and RT, decreasing in NT. Already the % area of rounded pores was higher in NT and lower in the CT and RT.
Significant effects were observed for rainfall applied to CT and RT tillage systems in 2009 (Figure 1). In both tillage systems, the increase in the amount of rain caused a decrease in the % area of Comp_L pores and TPA. For both tillage systems (CT and RT) there is no difference in the % pore area between 27 and 54 mm rain amounts, this means that the % of Comp_L pore area and TPA decrease between 0 and 27 mm rain depth, do not change between 27 and 54 mm and decrease again with 80 mm of rain amount (Figure 1).
For the year 2010, similarly to what was observed in 2009, the significant effects of the applied rainfall occurred only in CT and RT. The increase of the applied rain volume in CT caused a reduction in the % area of Comp_L pores and TPA, and an increase in the area occupied by rounded pores. In RT a quadratic effect was observed for Comp_L, TPA, Round_S and Elong_L (Figure 2). Unexpectedly, for the 80 mm rain amount there was an increase in Comp_L pore area percentage and TPA (Figure 2A), and a reduction of Round_S and Elong_L. Still in this tillage system, the % area of Round_M pores increased with the increase in rain amount. For NT, rainfall amount did not have a significant effect on pore shape and size.

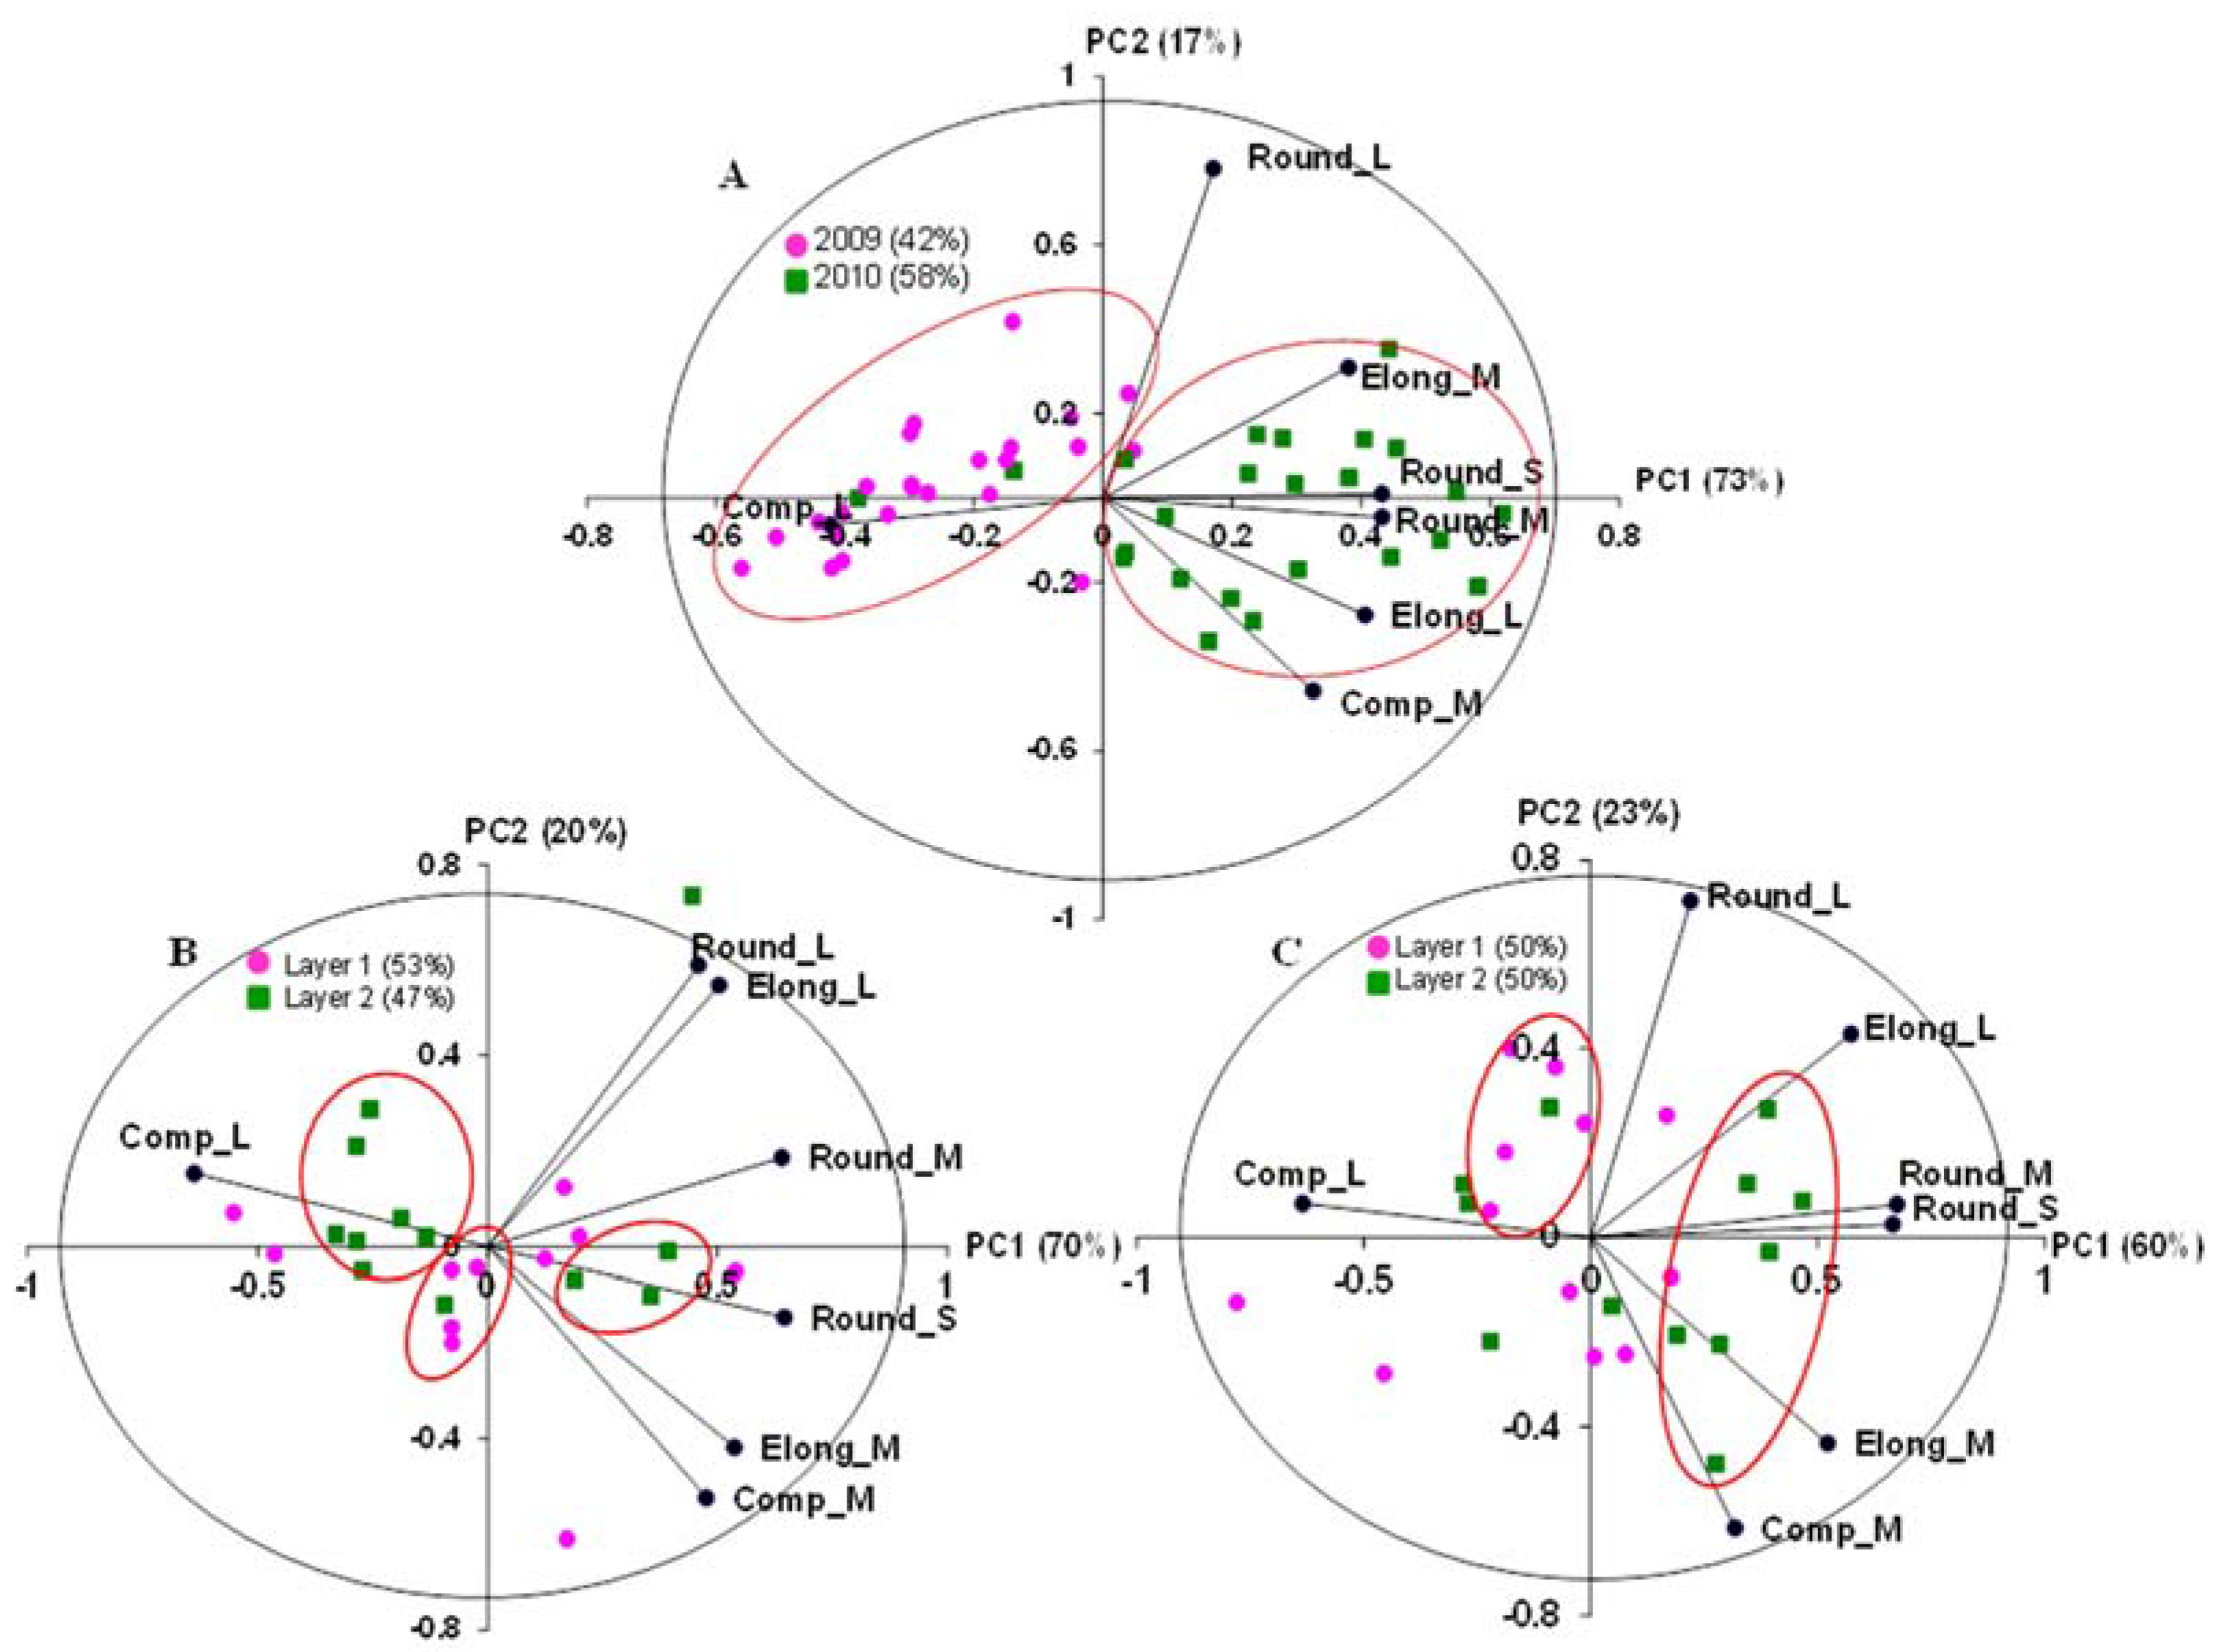
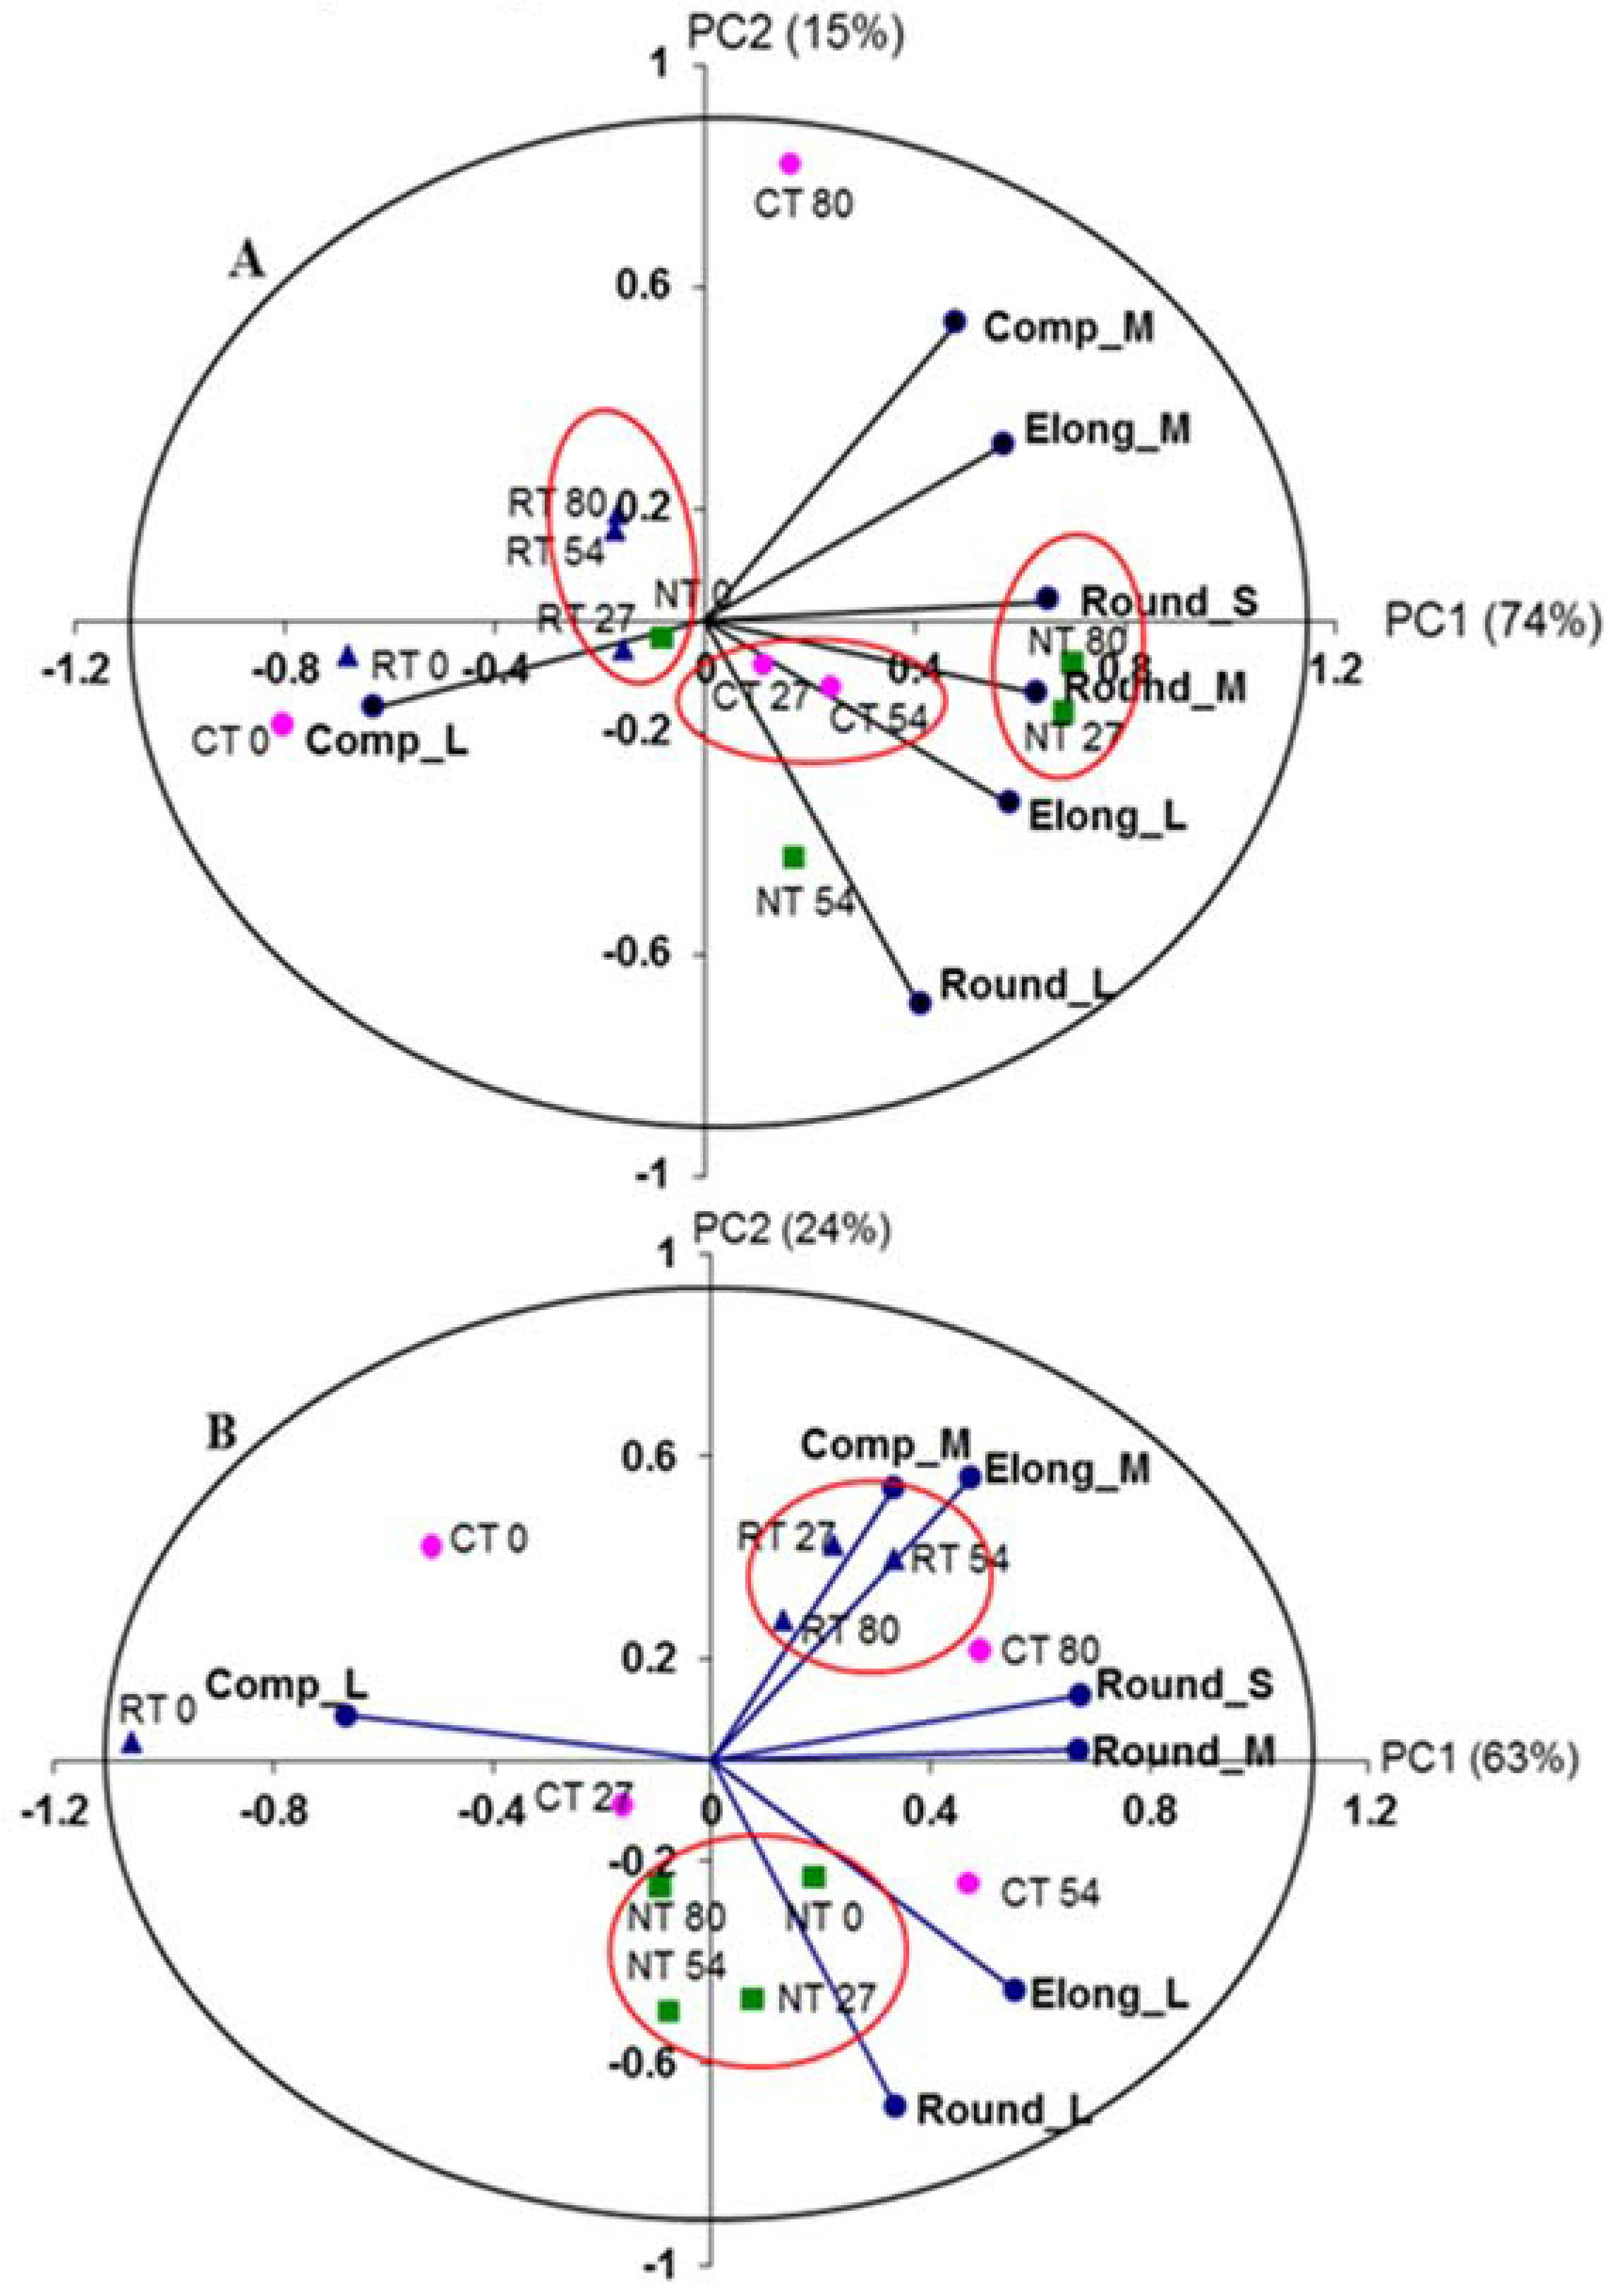
3.1. Effects of Years (2009 and 2010) and Layers on the Percentage of the Image Area Occupied by Pores

The percentage of pore area in 2009 differed significantly from that in 2010 (Figure 3A), suggesting to evaluate the years separately. The year 2009 explained 42% of the variability of the pore area, while 2010 explained 58%. In 2009, a greater association with large complex pores (Comp-L) was observed (Figure 3B), while 2010 showed a better relationship with rounded and elongated pores (Figure 3C). The greatest relation with the pores Comp_L in 2009 is because the area had an initial tillage (in December 2008) and after the development of the brachiaria the tillage was applied again, for each treatment (CT and RT). Thus, in a short period the area was intensively revolved. From 2009 to 2010, the area remained without tillage (fallow) for one year, hence the greater relationship with rounded and elongated pores. The Comp_M pores correlated positively with Elong_M, orthogonally with Comp_L, Round_M and Round_S, and negatively with Elong_L and Round_L.

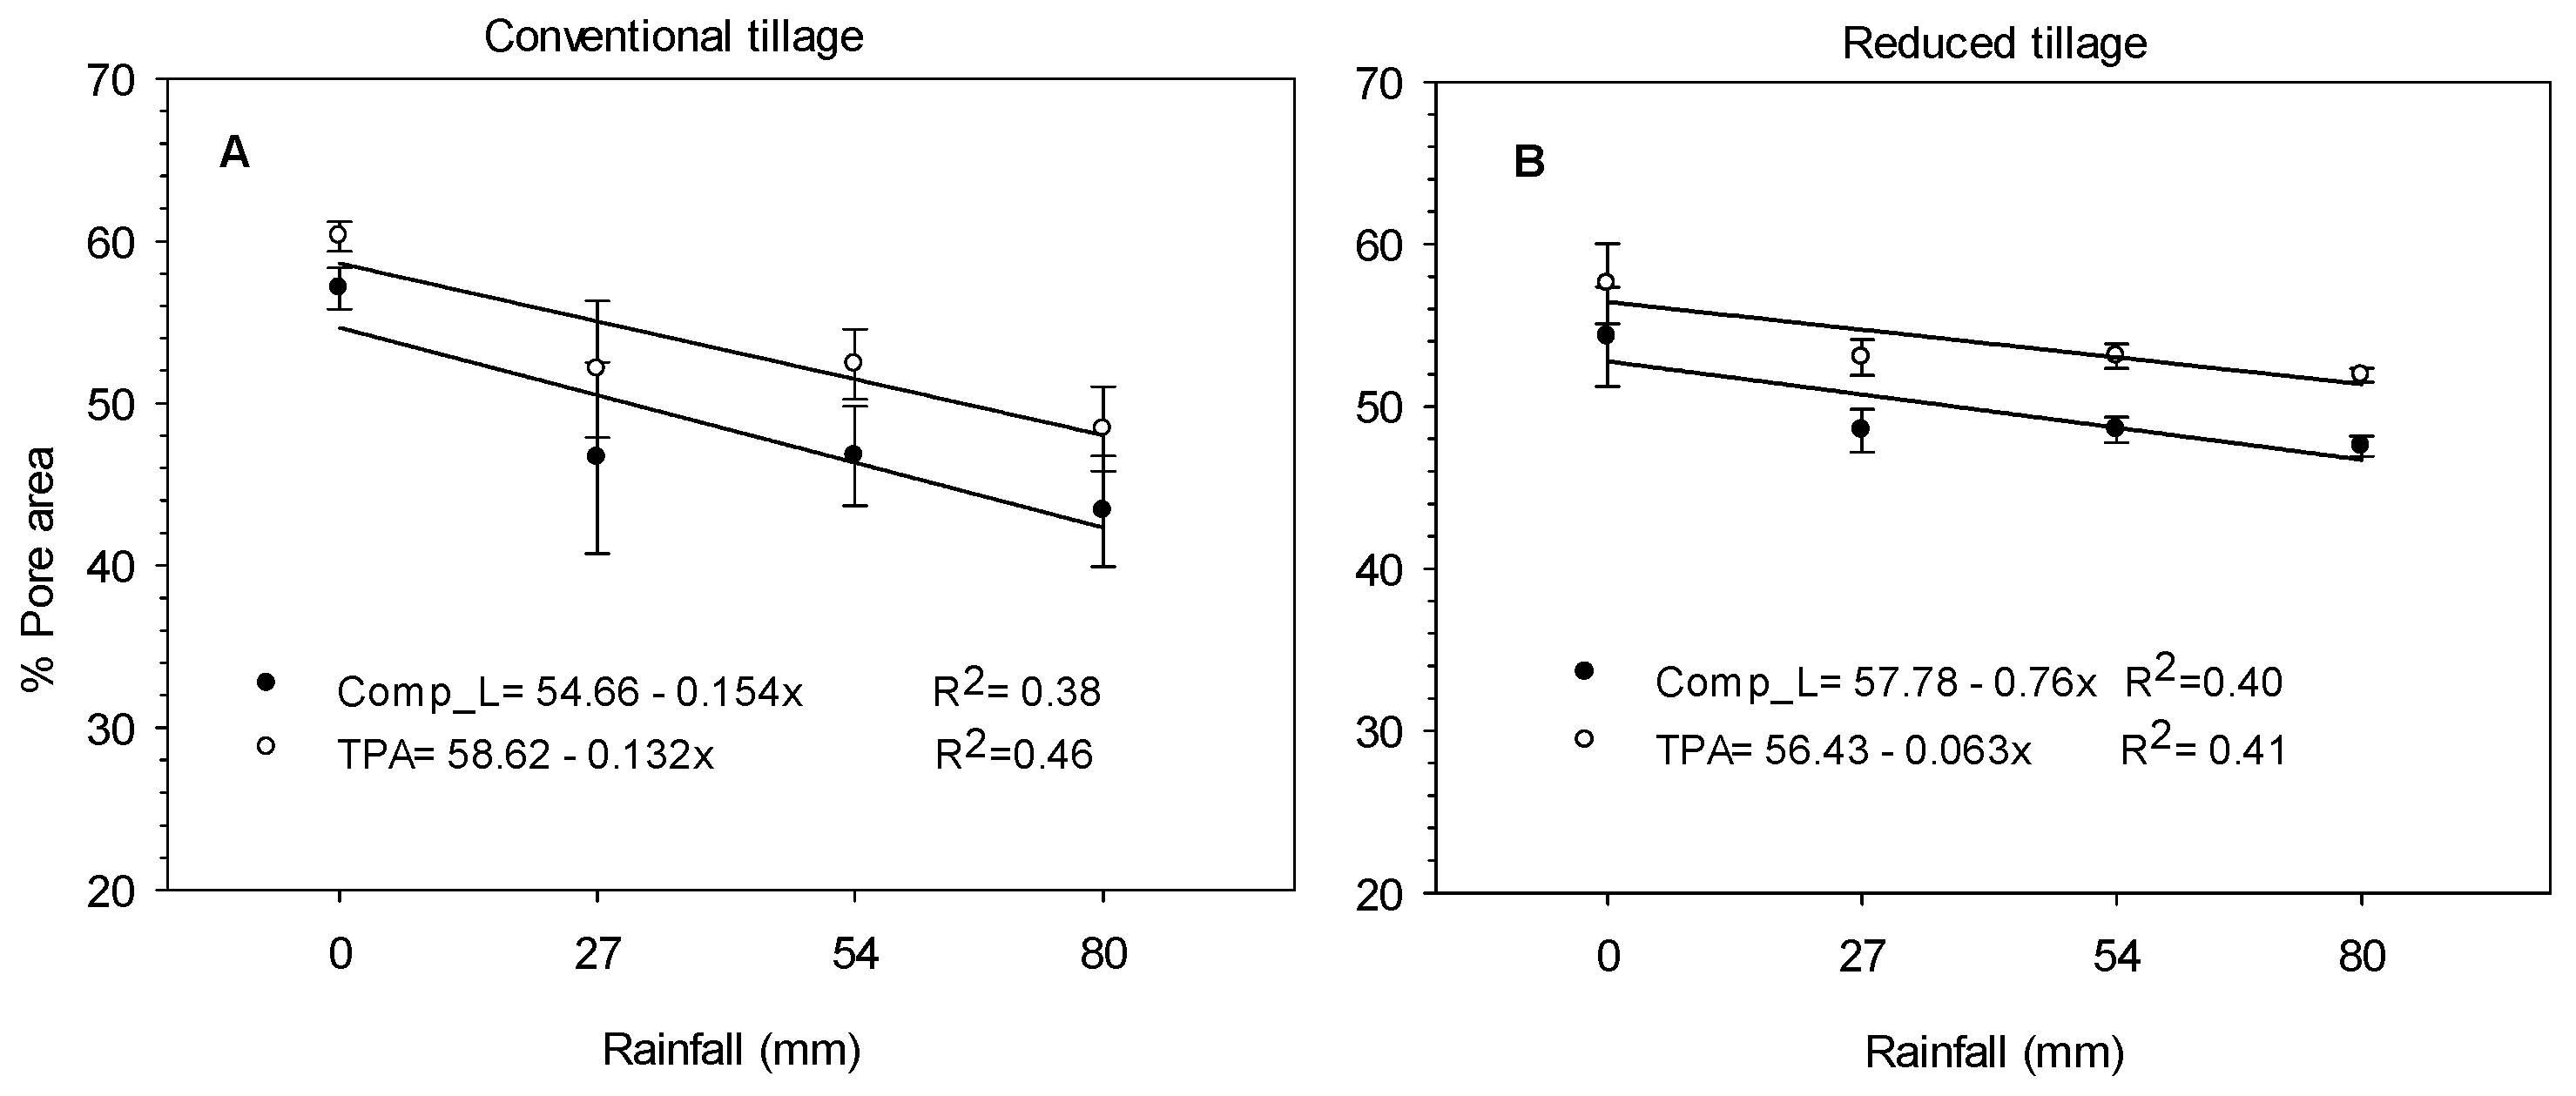
3.2. Effect of Soil Tillage and Rainfall Amount on the Percentage of the Area Occupied by Pores in Layer 1 (2009 and 2010)

For layer 1 in 2009 (Figure 4A), the total variability of the pore area percentage, due to the different tillage systems and rain amounts, was 89% (74% explained by PC1 and 15% PC2). In addition, for layer 1 in 2010 (Figure 4B), the PC1 explained 63% and PC2 24% of pore area percentage variability, which represents 87% of the total variation. In both years, we observed the formation of some groups. These groups show clusters in the graph due to soil tillage and the distribution of these clusters are a result of the applied rainfall amounts.
The change in pore shapes due to the rainfall applied in 2009 and 2010 was observed with the reduction of Comp_L favoring the formation of smaller pores (Figure 4A,B). This effect was also observed in the regression analysis (Figure 1 and Figure 2).
The change of pore area percentage due to the applied rainfall was similar in the two years of the study for each tillage system. The CT system showed a change clearly associated with the simulated rainfall applied, which is due to the raindrop impact. Immediately after tillage (no rainfall = CT0) there is a higher percentage of Comp_L pore area. With the increase of the rainfall amount (54 and 80 mm) we observed an increase in the percentage of rounded pore area (Round_M and Round_S) (Figure 1A, Figure 2C and Figure 4A,B), and a reduction of the Comp_L and in the percentage of the total pore area (TPA).
The pore changes related to the rainfall amount observed in the CT system also occurred in the RT system. CT and RT systems showed reduction of Comp_L pores and TPA as rainfall increased in 2009 and 2010. In 2010 there was a larger increase of small pores and reduction of large pores with the applied rainfalls.
The NT system showed a high association with Round_L and Elong_L in both years, demonstrating that the pores did not undergo major changes in the study period. The NT system did not provide a clear change of the pore area percentage with the increase of applied rainfall amount as observed in the CT and RT systems.

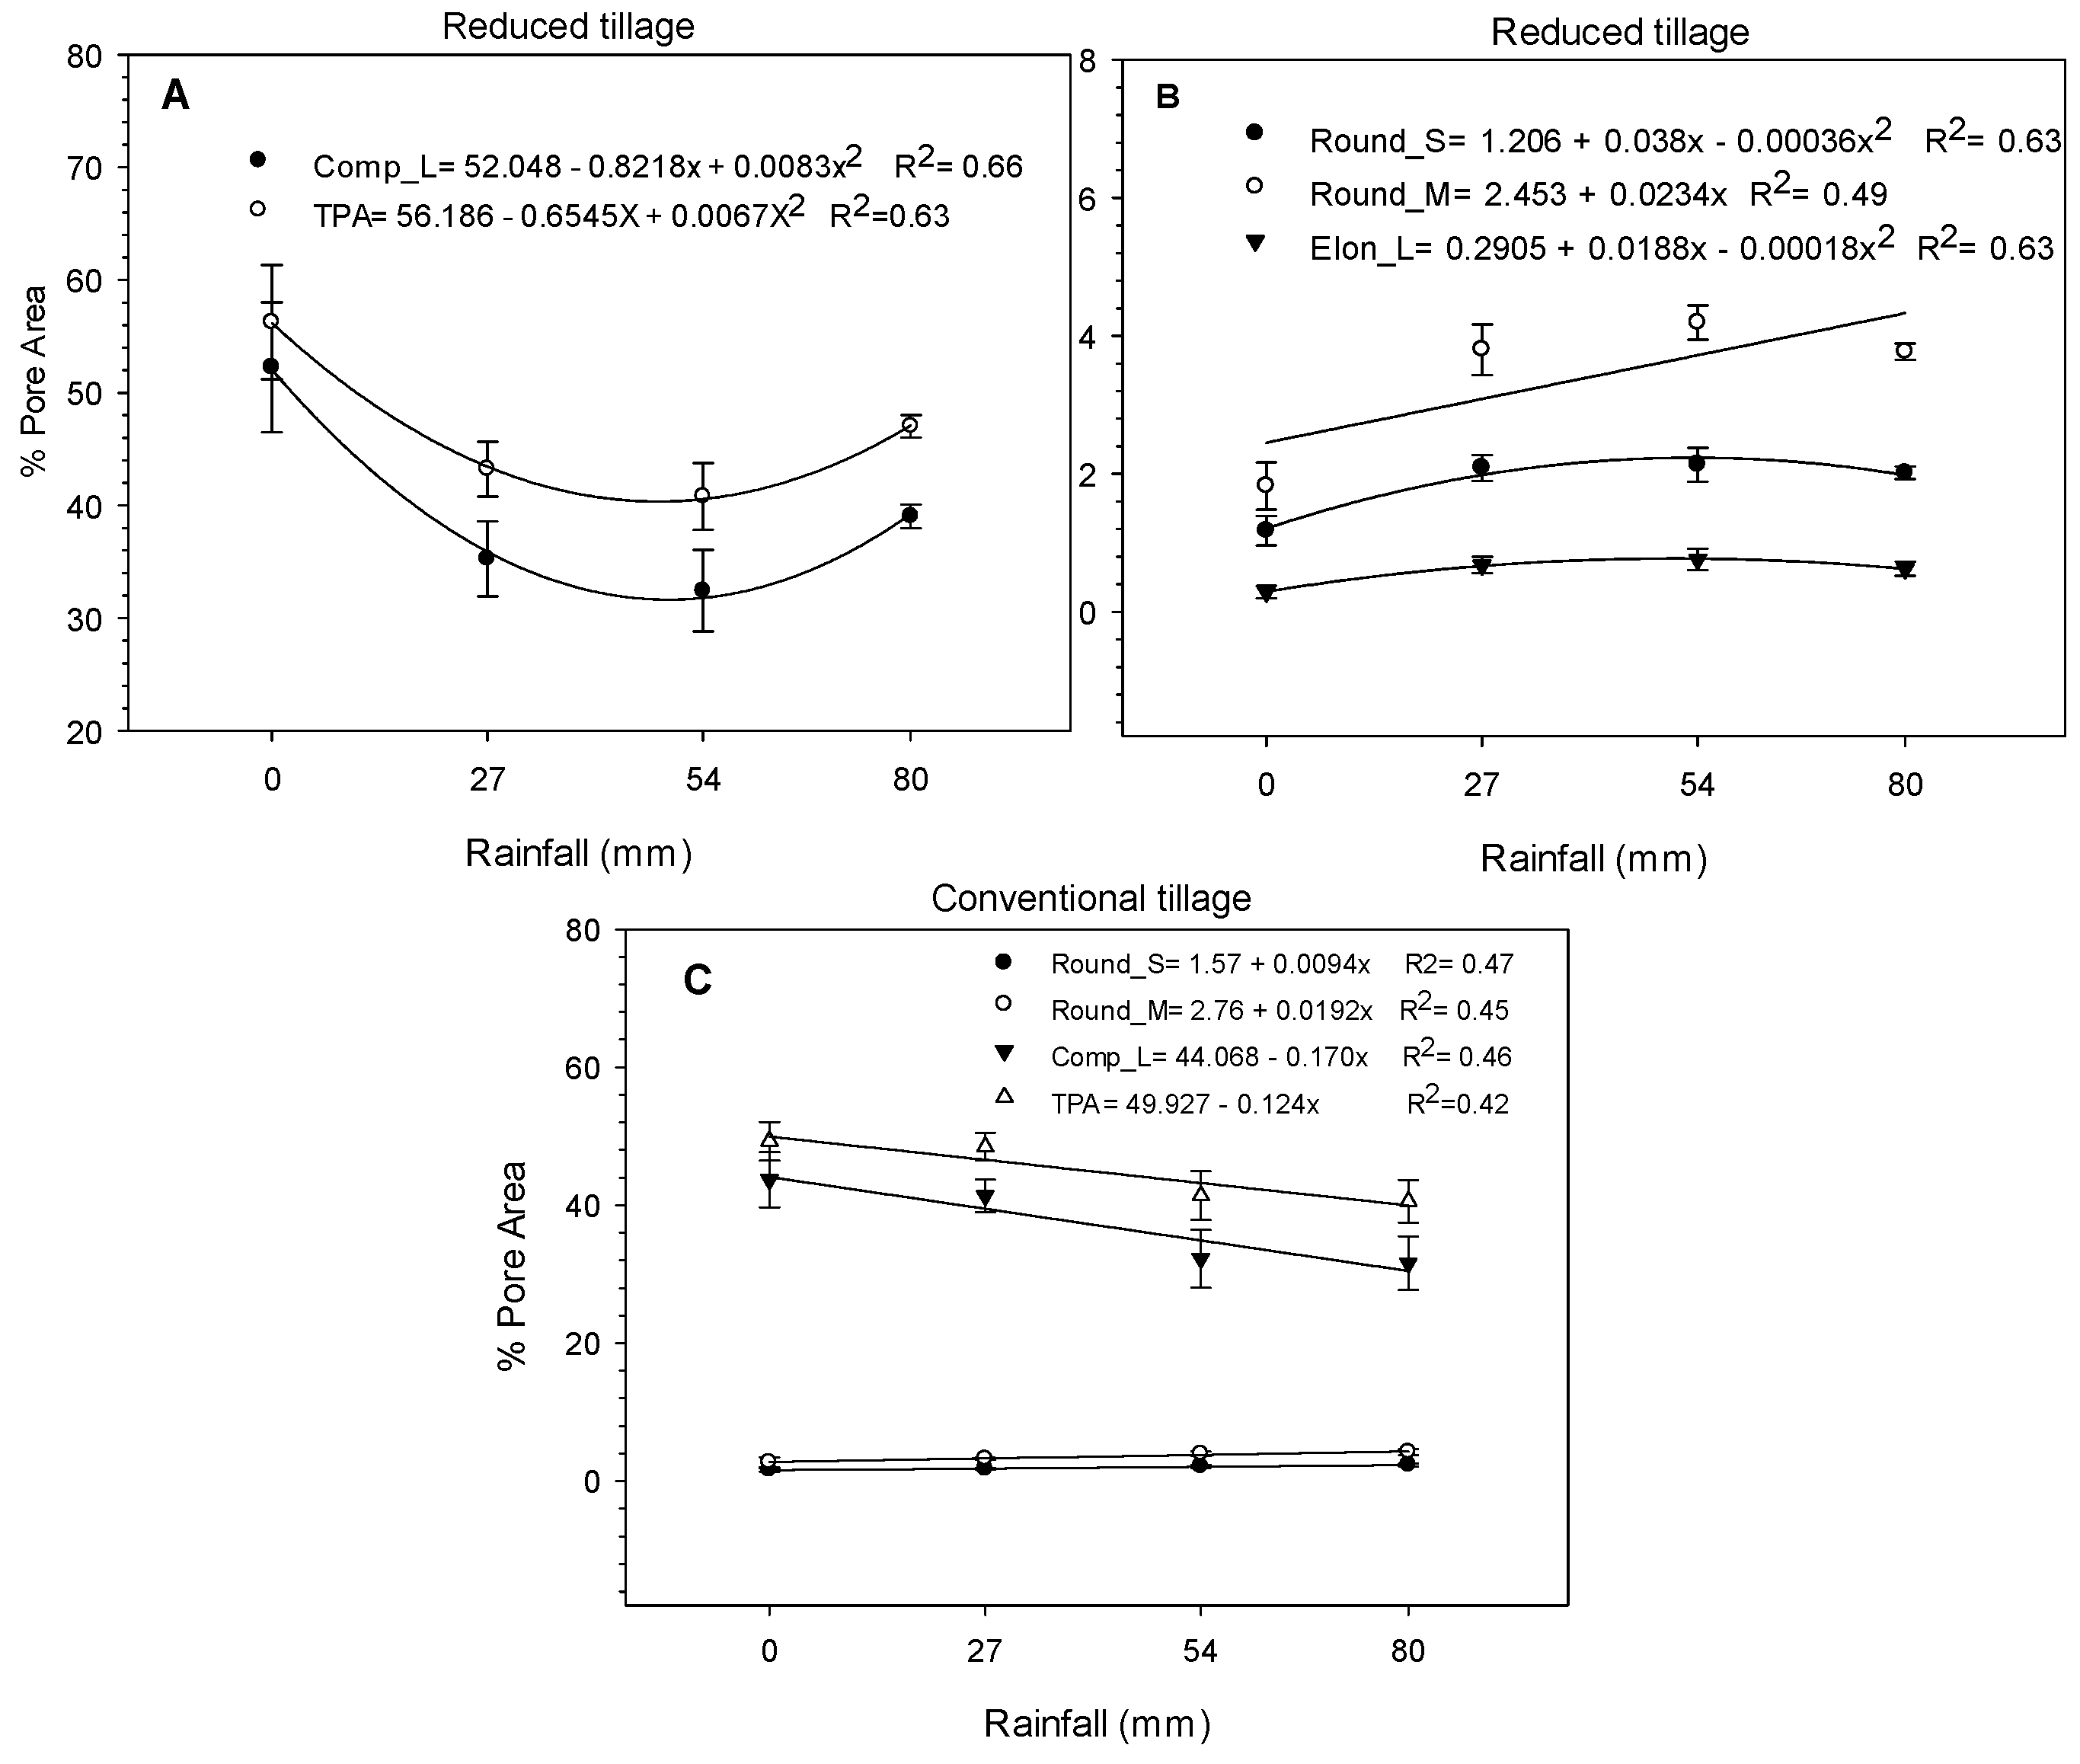
3.3. Effect of Soil Tillage and Rainfall Volume on the Percentage of the Area Occupied by Pores in Layer 2 (2009 and 2010)

The total variability of the pore area percentage in layer 2 in 2009, due to the different tillage systems and rain amounts, was 92% (71% explained by PC1 and 21% by PC2) (Figure 5A). In 2010 year, the total variability was 85% (58% explained by PC1 and 27% explained by PC2) (Figure 5B).
In 2009, the CT and RT systems showed greater association with Comp_L pore area percentage than with rounded and elongated pores. Changes in the pore shapes of these systems were not observed with the increase of simulated rainfall amount, as observed in layer 1 (Figure 5A). In 2010 this behavior continued in the CT system, but the RT system showed an increase of Round_L and Elong_L pore areas and, consequently, a decrease of Comp_L pore area (Figure 5B). The NT system, for both years, showed greater association with elongated and rounded pores (Figure 5A,B), except where rainfall was not applied (0 mm), which showed greater association with Comp_L pores. This behavior is different to the one observed in layer 1.

4. Discussion

4.1. Effect of Tillage on Soil Porosity

Soil tillage affected the structure and pore arrangement of the studied soil. The higher percentage of large complex pore area in the CT and RT systems compared to NT, occurred due to the tillage system employed (Table 3). This effect was more pronounced in the first year, where the % Comp_L pores was greater in CT and RT. Similarly, other authors have reported an increase in the percentage of large pores (>500 μm) in CT and RT systems due to soil tillage, and most of the total porosity was represented by few large-sized pores [9,44,45].
The NT system demonstrated greater relationship with rounded and elongated pores in both years (Table 3). A greater presence of rounded pores called “vesicles” was observed (Figure 6 and Figure 7C) in relation to other tillage systems that can be explained by the lack of ploughing and seedbed preparation. These “vesicles” were possibly originated by air entrapment due to particle transportation and deposition at short distances that were detached by possible rapid wetting events under the soil cover. This process occurred with the natural rain during alternating periods of wetting and drying. Chong-Feng et al. [15] also observed that the dominant process in the formation of crusts in covered soil was the eluviation process.
Pore characteristics depend on the structure and the structure evolution processes that occur in the soil. Therefore, the occurrence of certain pore shapes and sizes reflect the soil structural evolution processes that occurred in the soil. For example, vesicles are more numerous and larger as the number of wetting and drying cycles increases [46]. These pores are characterized by having smoothed walls with rounded and regular shape [35], furthermore, they show little or no connection to other pores, and, thus, hinders water distribution in the soil. Elongated pores (channels and chambers) are usually caused by biological activity and plant roots, while the drying-wetting processes can lead to planar pores [47,48].
The reduction in soil tillage or the adoption of alternative systems to conventional tillage practices can preserve soil structure with a balanced pore size distribution [45,49] and, consequently, confer proper water distribution in the soil profile.

4.2. Effect of Simulated Rainfall on Crust Formation and Porosity

The simulated rainfall degraded the soil surface and caused crust formation. Crust formation was not only caused by rainfall but was also a consequence of the soil characteristics and tillage as observed in the micromorphological descriptions done by Dalla Rosa et al. [27] studying the same soil. In CT, the formation of crusts was observed after 27 mm of rain. A higher rain amount (80 mm) increased the degradation of the surface structure and the thickness of the crust layer (Figure 6; CT 80 mm). Greater degradation occurred in the CT system, because the soil surface, after tillage, remained fully exposed to rainfall. The raindrop impact on the bare soil surface promotes mechanical breakdown of aggregates [12], splash and crusting. The crusts formed in CT were classified as sieving crusts [27]. These are primarily developed by the separation of soil particles by the direct impact of the raindrops after which, with water infiltration, the dispersed material is reorganized into layers [4]. The differentiation of the quartz grain sizes and the accumulation of fine material inside the crusts forming distinct layers (Figure 6 and Figure 7A) result mainly from mechanical sieving, caused by the rainfall infiltration, which deposits the fine particles deeper in the soil [4,27,44]. Clay translocation and accumulation form fine internal laminae (link capping) caused by particle dispersion and deposition as water infiltrates in the soil (Figure 6, CT 27 and CT 80 mm; and Figure 7A). The dominance of quartz grains in the crust layer is due to the sandy particle size class of the surface horizon of this soil.
Under RT and NT, the changes in the surface conditions and the formation of crusts did not evolve with the increase of the rain amount (volumes), differently to what was observed in CT. The detachment by single-raindrop impact decreases with the increase in soil strength [21]. In this case, these tillage systems keep mulch on the soil surface, covering the whole surface or partially by semi-incorporation of the residues, which promotes greater resistance to breakdown by raindrop impact.
The soil surface was more heterogeneous in RT. In this tillage system the crusts were classified as Sieving crusts for the uncovered areas of the soil surface directly affected by rain, and as Slaking crusts, characterized as been more irregular and with incipient orientation, for the covered areas [27]. The fine material accumulated in the surface layer (Figure 7 RT and NT) can result from physical and chemical dispersion of clay particles, which are redistributed in the surface layer or migrate to deeper layers in the soil with water infiltration, concentrating in the form of lamina or simply accumulating in specific areas [17].
These changes in the soil surface (rearrangement of quartz grains and fine material accumulation in the first few centimeters of the soil surface) caused by the raindrop impact also modified the pore system. The changes caused a reduction of large complex pores (originated by soil tillage) and an increase in rounded and elongated pores (originated and/or changed primarily by the direct rainfall on the soil surface). In 2009 there was a reduction of the percentage area of Comp_L pores and TPA observed for CT and RT systems (Figure 1). In 2010 for CT, a reduction was also observed in the % area of Comp_L pores and TPA that resulted in an increase in the percentage area of rounded pores, especially Round_S and Round_M, (Figure 2C). The volume of rainfall applied influenced this pore shape and size transformation, the highest amount of rainfall (80 mm) resulted in the highest reduction of Comp_L pores and increase of rounded pores (Figure 2C). These results agree with Fox et al. [3], where the pore frequency was inversely proportional to pore area, as elongate and irregular pores were broken into smaller rounded pores under the compacting, detachment and splash effect of the raindrop impact. Rousseva et al. [12] also observed a strong decrease in the frequency of the largest pores, especially elongated porosity, while the frequency of the smaller pores remain almost constant and sometimes even increased with the accumulated simulated rainfall. However, for the same soil used in this study, Castilho et al. [50] found that crust formation caused by natural rainfall did not affect significantly the pore morphology.
The quadratic effect observed for RT in 2010 (Figure 2A,B) showed an increase of Comp_L and TPA, and a decrease of Round_S and Elong_L between the 54 and 80 mm rainfalls. This behavior could be explained by changes in the soil structure caused by the high volume rainfalls that result in the entrapment of air bubbles between aggregates and soil particles, and/or air entrapment in the interior of the aggregates that can cause aggregate breakdown and in sandy materials increase the amount of complex pores and, consequently, TPA.
Other authors have reported a reduction in porosity by crust formation resulting from rainfall incidence [4,8,26]. Chong-Feng et al. [15] observed that the pore space of the soil surface declined across time in both covered and uncovered treatments, but the changes were greatest in the uncovered treatments. This reduction was attributed to the impact of the raindrops on the soil surface [1]. Therefore, the complex (continuous) and large pores were destroyed and/or transformed into elongated and rounded (non continuous) pores. The pores in the crust layer tend to be rounded and disconnected from one another, and become inefficient to conduct water [6]. The reduction of irregular and continuous pores, which are responsible for water conduction, usually affects the soil-water-plant relations and degrades soil structure [44].
In layer 2, changes in the area of pores occurred in the RT system (2010) and NT system (2009 and 2010) resulting in the reduction of Comp_L pores and an increase of rounded pores. Possibly this change in porosity was caused by a transfer of the rainfall effect from the surface layer 1 to the sub-layer (layer 2), because in these tillage systems layer 1 remained protected by plant residue cover. This effect, as previously discussed, was probably induced by wetting and by the effect of alternating periods of wetting and drying caused by natural rains during the fallow period. This process can cause dispersion and eluviation of fine particles internally in the soil altering the soil porosity [15,17]. On the other hand, Rousseva et al. [12] also evaluating the porosity after rainfall in two layers, 0–3 cm and 3–6 cm, observed that the greatest reduction occurred in the 3–6 cm layer, and the reason given by the authors was the transfer to the sublayer of the pressure exerted by the raindrops on the soil surface.
The degradation of the soil surface and crust formation by the rainfall effect was more pronounced in the CT system, followed by RT and NT systems (Figure 6). The greatest pore changes caused by the rainfall effect also occurred in the CT system (changes of complex to rounded pores). On the other hand, even without direct effect of rainfall on the soil surface, the NT system also demonstrated presence of rounded pores, this could be associated with soil particles detached during the soil wetting process, transported and deposited at short distances favoring subsurface air entrapment that form the vesicles (Figure 6 and Figure 7) also described by Valentin (1991) [51].

5. Conclusions

Soil porosity assessed by image analysis showed differences between the studied years (2009 and 2010).
In conventional tillage and reduced tillage systems, the greatest pore changes caused by the effect of rainfall amount occurred in soil layer 1, due to the direct raindrop impact. In the no-tillage system, the major changes occurred in layer 2, by the process of water transfer.
Simulated rainfall caused surface degradation and reduction of pore area percentage in conventional tillage and reduced tillage systems, with the reduction of complex and increase of rounded pores.
The no-tillage system showed greater occurrence of the rounded pores (vesicles), originated by processes of wetting below the residue cover, and by alternating periods of wetting and drying.
Image analysis techniques and PCA explained satisfactorily the changes caused in the soil porosity by the use of different tillage systems and simulated rainfall amount.

Acknowledgments

The authors are thankful to the São Paulo Research Foundation (FAPESP) for the scholarship granted to the first author and financial support (Process 2008/53591-08). To CAPES for the sandwich Ph.D. scholarship (Process 1278/10-0). The authors also thank CNPq for the research fellowship.

Author Contributions

Jaqueline Dalla Rosa wrote the paper, performed the experiments, analyzed the data and coordinated the data collection. Miguel Cooper and Frédéric Darboux were Jaqueline Dalla Rosa’s academic advisers and supported her in writing and proofreading the paper. João Carlos Medeiros and Carla Campanaro supported Jaqueline Dalla Rosa in performing the experiments, data collection and laboratory analysis. Luiz Roberto Martins Pinto supported Jaqueline Dalla Rosa in analyzing the data.

Conflicts of Interest

The authors declare no conflict of interest.

References

  1. Keesstra, S.D.; Geissen, V.; Mosse, K.; Piiranen, S.; Scudiero, E.; Leistra, M.; van Schaik, L. Soil as a filter for groundwater quality. Curr. Opin. Environ. Sustain. 2012, 4, 507–516. [Google Scholar] [CrossRef]
  2. Brevik, E.C.; Cerdà, A.; Mataix-Solera, J.; Pereg, L.; Quinton, J.N.; Six, J.; van Oost, K. The interdisciplinary nature of SOIL. Soil 2015, 1, 117–129. [Google Scholar] [CrossRef] [Green Version]
  3. Fox, D.M.; Bryan, R.B.; Fox, C.A. Changes in pore characteristics with depth for structural crusts. Geoderma 2004, 120, 109–120. [Google Scholar] [CrossRef]
  4. Valentin, C.; Bresson, L.M. Morphology, genesis and classification of surface crusts in loamy and sandy soils. Geoderma 1992, 55, 225–245. [Google Scholar] [CrossRef]
  5. Usón, A.; Poch, R.M. Effects of tillage and management practices on soil crust morphology under a Mediterranean environment. Soil Till. Res. 2000, 54, 191–196. [Google Scholar] [CrossRef]
  6. Panini, T.; Torri, D.; Pellegrini, S.; Pagliai, M.; Sanchis, M.P.S. A theoretical approach to soil porosity and sealing development using simulated rainstorms. Catena 1997, 31, 199–218. [Google Scholar] [CrossRef]
  7. Rasa, K.; Eickhorst, T.; Tippkötter, R.; Yli-halla, M. Structure and pore system in differently managed clayey surface soil as described by micromorphology and image analysis. Geoderma 2012, 173, 10–18. [Google Scholar] [CrossRef]
  8. Ringrose-Voase, A.J. Micromorphology of soil structure: description, quantification, application. Aust. J. Soil Res. 1991, 29, 777–813. [Google Scholar] [CrossRef]
  9. Pagliai, M.; Pezzarossa, B.; Mazzoncini, M.; Bonari, E. Effects of tillage on porosity and microstructure of a loam soil. Soil Technol. 1989, 2, 345–358. [Google Scholar] [CrossRef]
  10. Pires, L.F.; Cooper, M.; Cássaro, F.A.M.; Reichardt, K.; Bacchi, O.O.S.; Dias, N.M.P. Micromorphological analysis to characterize structure modifications of soil samples submitted to wetting and drying cycles. Catena 2008, 72, 297–304. [Google Scholar] [CrossRef]
  11. Schiettecatte, W.; Jin, K.; Yao, Y.; Cornelis, W.M.; Lu, J.; Wu, H.; Verbist, K.; Cai, D.; Gabriels, D.; Hartmann, R. Influence of simulated rainfall on physical properties of a conventionally tilled loess soil. Catena 2005, 64, 209–221. [Google Scholar] [CrossRef]
  12. Rousseva, S.; Torri, D.; Pagliai, M. Effect of rain in the macroporosity at the soil surface. Eur. J. Soil Sci. 2002, 53, 83–94. [Google Scholar] [CrossRef]
  13. Hu, F.N.; Xu, C.Y.; Li, H.; Li, S.; Yu, Z.H.; Li, Y.; He, X. Particles interaction forces and their effects on soil aggregates breakdown. Soil Till. Res. 2015, 147, 1–9. [Google Scholar] [CrossRef]
  14. Ma, R.M.; Li, Z.X.; Cai, C.F.; Wang, J.G. The dynamic response of splash erosion to aggregate mechanical breakdown through rainfall simulation events in Ultisols (subtropical China). Catena 2014, 121, 279–287. [Google Scholar] [CrossRef]
  15. Chong-Feng, B.U.; Gale, W.J.; Qiang-Gu, C.I.; Shu-Fang, W.U. Process and mechanism for the development of physical crusts in three typical Chinese Soils. Pedosphere 2013, 23, 321–332. [Google Scholar]
  16. Fox, D.M.; Le Bissonnais, Y. A process-based analysis of the influence of aggregate stability on surface crusting, infiltration, and interrill erosion. Soil Sci. Soc. Am. J. 1998, 62, 717–724. [Google Scholar] [CrossRef]
  17. Agassi, M.; Shainberg, I.; Morin, J. Effect of electrolyte concentration and soil sodicity on infiltration rate and crust formation. Soil Sci. Soc. Am. J. 1981, 45, 848–851. [Google Scholar] [CrossRef]
  18. Salles, C.; Poesen, J. Rain properties controlling soil splash detachment. Hydrol. Process. 2000, 14, 271–282. [Google Scholar] [CrossRef]
  19. Sharma, P.P.; Gupta, S.C. Sand detachment by single rain drops of varying kinetic energy and momentum. Soil Sci. Soc. Am. J. 1989, 53, 1005–1010. [Google Scholar] [CrossRef]
  20. Torri, D.; Sfalanga, M.; Del Sette, M. Splash detachment: runoff depht and soil cohesion. Catena 1987, 14, 149–155. [Google Scholar] [CrossRef]
  21. Al-Durrah, M.M.; Bradford, J.M. The mechanism of raindrop splash on soil surfaces. Soil Sci. Soc. Am. J. 1982, 46, 1086–1090. [Google Scholar] [CrossRef]
  22. Darboux, F.; Dalla Rosa, J.; Cooper, M. Conditions for the occurrence of slaking and other disaggregation processes under rainfall. Hydrology 2016, 27, 1–9. [Google Scholar] [CrossRef]
  23. Sun, Y.; Zeng, Y.; Shi, Q.; Pan, X.; Huang, S. No-tillage controls on runoff: A meta-analysis. Soil Till. Res. 2015, 153, 1–6. [Google Scholar] [CrossRef]
  24. Armand, R.; Bockstaller, C.; Auzat, A.V.; van Dijk, P. Runoff generation related to intra-field soil surface characteristics variability. Application to conservation tillage context. Soil Till. Res. 2009, 102, 27–37. [Google Scholar] [CrossRef]
  25. Castro, L.G.; Cogo, N.P.; Volk, L.B.D. Alterations in soil surface roughness by tillage and rainfall in relation to water erosion. Rev. Bras. Cienc. Solo 2006, 30, 339–352. [Google Scholar] [CrossRef]
  26. Pagliai, M.; Vignozzi, N.; Pellegrini, S. Soil structure and the effect of management practices. Soil Till. Res. 2004, 79, 131–143. [Google Scholar] [CrossRef]
  27. Dalla Rosa, J.; Cooper, M.; Darboux, F.; Medeiros, J.C. Processo de formação de crostas superficiais em razão de sistemas de preparo do solo e chuva simulada. Rev. Bras. Cienc. Solo 2013, 37, 400–410. (In Portuguese) [Google Scholar] [CrossRef]
  28. Food and Agriculture Organization of the United Nations (FAO). World Reference Base for Soil Resources; Food and Agriculture Organization of the United Nations: Rome, Italy, 2014. [Google Scholar]
  29. Raij, B.V.; Quaggio, J.A.; Cantarella, H.; Ferreira, M.E.; Lopes, A.S.; Bataglia, O.A. Análise de Solo para Fins de Fertilidade; Fundação Cargill: Campinas, Brazil, 1987; p. 170. (In Portuguese) [Google Scholar]
  30. Gee, G.W.; Bauder, J.W. Particle size analysis. In Methods of Soil Analysis, 2nd ed.; Klute, A., Ed.; American Society of Agronomy; Soil Science Society of America: Madison, WI, USA, 1986; pp. 383–411. [Google Scholar]
  31. Legout, C.; Leguédois, S.; Le Bissonnais, Y. Aggregate breakdown dynamics under rainfall compared with aggregate stability measurements. Eur. J. Soil Sci. 2005, 56, 225–238. [Google Scholar] [CrossRef]
  32. Lassu, T.; Seeger, M.; Peters, P.; Keesstra, S.D. The Wageningen rainfall simulator: Set-up and calibration of an indoor nozzle-type rainfall simulator for soil erosion studies. Land Degrad. Dev. 2015, 26, 604–612. [Google Scholar] [CrossRef]
  33. Murphy, C.P. Thin Section Preparation of Soils and Sediments; A.B. Academic Publication: Berkhamsted, UK, 1986; p. 149. [Google Scholar]
  34. Murphy, C.P.; Bullock, P.; Turner, R.H. The measurement and characterization of voids in soil thin sections by image analysis. Part I. Principles and techniques. J. Soil Sci. 1977, 98, 498–508. [Google Scholar] [CrossRef]
  35. Castro, S.S.; Cooper, M.; Santos, M.C.; Vidal-Torrado, P. Micromorfologia do solo: Bases e aplicações. Tópicos Ciência Solo 2003, 3, 107–164. (In Portuguese) [Google Scholar]
  36. Cooper, M.; Vidal-Torrado, P.; Chaplot, V. Origin of microaggregates in soils with ferralic horizons. Sci. Agricola 2005, 62, 256–263. [Google Scholar] [CrossRef]
  37. Pagliai, M.; La Marca, M.; Lucamante, G.; Genovese, L. Effects of zero and conventional tillage on the lengh and irregularity of elongated pores in a clay loam soil under viticulture. Soil Till. Res. 1984, 4, 433–444. [Google Scholar] [CrossRef]
  38. Pagliai, M.; La Marca, M.; Lucamante, G.; Genovese, L. Micromorphometric and micromorphological investigations of a clay loam soil in viticulture under zero and conventional tillage. Soil Sci. Soc. Am. J. 1983, 34, 391–403. [Google Scholar] [CrossRef]
  39. Gabriel, K.R. The Biplots graphic display of matrices with application to principal component analysis. Biometrika 1971, 58, 453–467. [Google Scholar] [CrossRef]
  40. Kroonenberg, P.M. Introduction to Biplots for GxE Tables. 1997. Available online: http://www.fsw.leidenuniv.nl/~kroonenb/document/biplot.zip (accessed on 12 February 2012).
  41. Anderson, W.F.; Beute, M.K.; Wynne, J.C.; Wongkaew, S. Statistical procedures for assessment of resistance in a multiple foliar disease complex of peanut. Phytopathology 1990, 80, 1451–1459. [Google Scholar] [CrossRef]
  42. Moraaguilera, G.; Nietoangel, D.; Teliz, D.; Campbell, C.L. Development of a prediction model for papaya ringspot in Veracruz, Mexico. Plant Dis. 1993, 77, 1205–1211. [Google Scholar]
  43. Lipkovich, I.; Smith, E.P. Biplot and Singular Value Decomposition Macros for Excel©. J. Stat. Softw. 2002, 7, 1–15. Available online: http://www.jstatsoft.org/v07/i05 (accessed on 12 February 2012). [Google Scholar] [CrossRef]
  44. Pagliai, M.; Raglione, M.; Panini, T.; Maletta, M.; La Marcac, M. The structure of two alluvial soils in Italy after 10 years of conventional and minimum tillage. Soil Till. Res. 1995, 34, 209–223. [Google Scholar] [CrossRef]
  45. Mermut, A.R.; Grevers, M.C.J.; Jong, E. Evaluation of pores under different management systems by image analysis of clay soils in Saskatchewan, Canada. Geoderma 1992, 53, 357–372. [Google Scholar] [CrossRef]
  46. Bresson, L.M.; Valentin, C. Soil surface crust formation: contribution of micromorphology. In Developments in Soil Science; Ringrose-Voase, A.J., Humphreys, G.S., Eds.; Elsevier: Amsterdam, The Netherlands, 1993; pp. 737–762. [Google Scholar]
  47. Thompson, M.L.; Singh, P.; Corak, S.; Straszheim, W.E. Cautionary notes for the automated analysis of soil pore-space images. Geoderma 1992, 53, 399–415. [Google Scholar] [CrossRef]
  48. Vandenbygaard, A.J.; Protz, R.; Tomlin, A.D. Changes in pore structure in a no-till chronosequense of silt loam soils, Southern Ontario. Can. J. Soil Sci. 1999, 79, 149–160. [Google Scholar] [CrossRef]
  49. Pagliai, M. Micromorphometric and micromorphological investigations on the effect of compaction by pressures and deformations resulting from tillage and wheel traffic. In Soil Compaction and Regeneration; Monnier, G., Goss, M.J., Eds.; AA Balkema: Rotterdam, The Netherlands, 1987; pp. 31–38. [Google Scholar]
  50. Castilho, S.C.P.; Cooper, M.; Juhász, C.E.P. Influence of crust formation under natural rain on physical attributes of soils with different textures. Rev. Bras. Cienc. Solo 2011, 35, 1893–1905. [Google Scholar] [CrossRef]
  51. Valentin, C. Surface crusting in 2 alluvial soils of northern Niger. Geoderma 1991, 48, 201–222. [Google Scholar] [CrossRef]
Figure 1. Effect of applied rainfall on percentage of pore area, in conventional (A) and reduced tillage (B) for layer 1 in 2009 year. Comp_L: complex large; TPA: total pore area. Error bars are standard errors.
Hydrology 04 00003 g001
Figure 2. Effect of applied rainfall on percentage of pore area, for layer 1 in 2010 year, in reduced (A,B) and conventional tillage (C). Round_S: rounded small; Round_M: rounded medium; Elong_L: elongated large; Comp_L: complex large; TPA: total pore area. Error bars are standard errors.
Hydrology 04 00003 g002
Figure 3. (A) PCA of the percentage of pore area in both years of study (2009 and 2010); (B) PCA of the percentage of pore area in the layers for 2009 and (C) PCA of the percentage of pore area in the layers for 2010 for a Haplic Acrisol, municipality of Piracicaba, São Paulo State, Brazil. Pore shapes (Round: rounded; Elong: elongated; Comp: complex) and sizes (S: 156–15,600 μm2; M: 15,600–156,000 μm2 and L: >156,000 μm2). PC1: Principal Component 1; PC2: Principal Component 2.
Hydrology 04 00003 g003
Figure 4. (A) PCA for the percentage of pore area in layer 1 for 2009, and (B) PCA for the percentage of pore area in layer 1 for 2010, in a Haplic Acrisol, municipality of Piracicaba, São Paulo State, Brazil. Pore shapes (Round: rounded; Elong: elongated; Comp: complex) and sizes (S: 156–15,600 μm2; M: 15,600–156,000 μm2 and L: >156,000 μm2). PC1: Principal Component 1; PC2: Principal Component 2; CT: Conventional Tillage; RT: Reduced Tillage; NT: No-Tillage. 0, 27, 54 and 80 mm: simulated rainfall amount.
Hydrology 04 00003 g004
Figure 5. (A) PCA for the percentage of pore area in layer 2 for 2009 and (B) PCA for the percentage of pore area in layer 2 for 2010, in a Haplic Acrisol, municipality of Piracicaba, São Paulo State, Brazil. Pore shapes (Round: rounded; Elong: elongated; Comp: complex) and sizes (S: 156–15,600 μm2; M: 15,600–156,000 μm2 and L: >156,000 μm2). PC1: Principal Component 1; PC2: Principal Component 2; CT: Conventional Tillage; RT: Reduced Tillage; NT: No-Tillage: 0, 27, 54 and 80 mm: simulated rainfall amount.
Hydrology 04 00003 g005
Figure 6. Images of thin sections vertically oriented for the different tillage systems and rainfall amount applied. 1: crust formed, quartz grains arranged after simulated rainfall; 2: lamination of accumulated fine material; 3: rounded pores (vesicles); CT: Conventional Tillage; RT: Reduced Tillage; NT: No-Tillage; 0, 27, 54 and 80 mm: simulated rainfall amount.
Hydrology 04 00003 g006
Figure 7. Thin sections vertically oriented and carbon-coated. Scanning electron microscope images with 35× magnification. (A): CT—Conventional Tillage; (B): RT—Reduced Tillage; (C): NT—No-Tillage. Images (AC) refer to maximum rainfall amount applied (80 mm). 1: crust formed, quartz grains arranged after rain applied; 2: lamination of accumulated fine material; 3: rounded pores (vesicles).
Hydrology 04 00003 g007
Table 1. Particle size distribution for the soil studied.
LayerClaySiltSand
(cm) VFSFSMSCSVCSTotal Sand
g·kg−1
0–516420164471155206816
5–2017938-----783
40–6025752-----691
80–10026237-----701
VFS: very fine sand (0.105–0.053 mm); FS: fine sand (0.210–0.105 mm); MS: medium sand (0.50–0.210 mm); CS: coarse sand (1.00–0.50 mm); VCS: very coarse sand (2–1.00 mm).
Table 2. Analysis of variance for percentage of pore area in the two years of the experiment and for the studied soil.
2009
Variation Factors/PorosityRound_SRound_MElong_MElong_LComp_MComp_LTPA
Soil Tilllage0.0160.02710.0320.034ns0.0002<0.0001
Layernsnsnsns0.0343nsns
Soil tillage*Layernsnsnsnsnsnsns
Rainfall0.0262ns0.0082ns0.00440.00340.0017
2010
Round_SRound_MRound_LElong_LComp_MComp_LTPA
Soil Tilllagensns0.0010.00730.0007nsns
Layer0.0140.0065ns0.032ns0.00050.0003
Soil tillage*Layernsnsnsnsnsnsns
Rainfall0.0150.0005ns0.0002ns0.0050.011
Round_S: rounded small; Round_M: rounded medium; Elong_M: elongated medium; Elong_L: elongated large; Comp_M: complex medium; Comp_L: complex large; TPA: total pore area; Round_L: rounded large; ns: no significance.
Table 3. Effect of the tillage systems on pore area percentage in the two years of the experiment and for the studied soil.
2009
Pores/Soil TillageRound_SRound_MRound_LElong_MElong_LComp_MComp_LTPA
CT1.31AB2.42AB0.21ns0.47AB0.35AB0.13ns49.01B53.89B
RT1.22B1.98B0.14 0.42B0.25B0.10 50.19B54.31B
NT1.50A2.60A0.25 0.60A0.40A0.15 43.56A49.05A
2010
CT2.02ns3.72ns0.57A0.76ns0.82AB0.12A35.50ns43.52ns
RT1.99 3.72 0.35B0.83 0.66B0.17B33.97 41.69
NT2.09 4.02 0.67A0.72 0.94A0.11A31.06 39.61
CT: Conventional Tillage; RT: Reduced Tillage; NT: No-Tillage; Round_S: rounded small; Round_M: rounded medium; Round_L: rounded large; Elong_M: elongated medium; Elong_L: elongated large; Comp_M: complex medium; Comp_L: complex large; TPA: total pore area; Different letters indicate significant differences between tillage systems by Tukey test (p < 0.05); ns: no significance.

