Article

Simulating the Hydrologic Impact of Arundo donax Invasion on the Headwaters of the Nueces River in Texas

1
Department of Biological and Agricultural Engineering, Texas A&M University, College Station, TX 77843, USA
2
Texas A&M AgriLife Research (Texas A&M University System), Vernon, TX 76384, USA
3
Grassland Soil and Water Research Laboratory, USDA-ARS, Temple, TX 76502, USA
*
Author to whom correspondence should be addressed.
Hydrology 2015, 2(3), 134-147; https://doi.org/10.3390/hydrology2030134
Submission received: 31 May 2015 / Revised: 12 August 2015 / Accepted: 13 August 2015 / Published: 20 August 2015

Abstract

:
Arundo donax (hereafter referred to as Arundo), a robust herbaceous plant, has invaded the riparian zones of the Rio Grande River and the rivers of the Texas Hill Country over the last two decades. Arundo was first observed along the Nueces River in central Texas in 1995 by the Nueces River Authority (NRA). It then spread rapidly downstream due to its fast growth rate and availability of streamflow for its consumptive use, and it completely displaced the native vegetation, primarily Panicum virgatum (hereafter referred to as switchgrass) in the riparian zone. It was hypothesized that Arundo reduced streamflows due to higher water use by Arundo when compared to switchgrass. The overall goal of this study was to assess the impacts of Arundo invasion on hydrology of the headwaters of the Nueces River through observed long-term streamflow and precipitation data analysis and simulation modeling with the Soil and Water Assessment Tool (SWAT). The observed data analysis indicated that while there was no significant change in monthly precipitation between the pre-Arundo invasion (1979–1994) and post-Arundo invasion (1995–2010) periods, streamflows changed significantly showing a positive (slightly increasing) trend during the pre-invasion period and a negative (slightly decreasing) trend during the post-invasion periods. The simulated average (1995–2010) annual evapotranspiration of Arundo in the seven Hydrologic Response Units (HRUs) in which Arundo invaded, was higher by 137 mm when compared to switchgrass. The water uptake by Arundo was therefore higher by 7.2% over switchgrass. Higher water uptake by Arundo resulted in a 93 mm higher irrigation (water use from the reach/stream) annually when compared to switchgrass. In addition, the simulated average annual water yield (net amount of water that was generated from the seven Arundo HRUs and contributed to streamflow) under Arundo was less by about 17 mm as compared to switchgrass. In conclusion, model simulations indicated that Arundo invasion in the Nueces River has caused a statistically significant increase in water uptake and reduction in streamflow compared to the native switchgrass, which previously dominated the headwaters.

1. Introduction

Arundo donax (hereafter referred to as Arundo), also known as giant cane, was originally brought into California from the Mediterranean in the 1820s to make thatched roofs, musical instruments and prevent soil erosion [1]. It later spread into different parts of the United States and invaded the riparian areas of the Rio Grande River and, since 1994, has invaded the rivers of the Texas Hill Country. Arundo is a hydrophyte [2] that transpires up to 1100 mm of water annually [3]. Water uptake parameters of Arundo varied highly in the literature. In the Rio Grande Basin in Texas, Gowda et al. [4] have found the water demand of the Arundo species to be 5.2 mm/day while Watt and Moore [5] found the demand to be as high as 9.1 mm/day. In southern California, Giessow et al. [6] reported even higher water demand of 41.1 mm/day. The Leaf Area Index (LAI) of the Arundo species has been reported to range from 4.5 on the lower Rio Grande River in Texas [5] to 15.6 in California [6]. Arundo has a growth rate of up to 50 mm of height per day under optimum conditions [1].
Because of its high growth rate, LAI and vegetative reproduction, Arundo can dominate native species after invasion [7]. During the invasion process, Arundo forms colonies that can be of several acres in size and its rhizomatous root masses stabilize stream banks and alter flow regimes [8]. Arundo colonies are often dense and difficult to penetrate. Due to high water uptake and associated concerns of reducing streamflow, Arundo has been eradicated at many places in the world. Dudley [9] documented millions of dollars spent on Arundo management and eradication, which was done using chemicals [3] and biological controls [10].
Arundo was first observed along the headwaters of the Nueces River in 1995 by the Nueces River Authority (NRA). It then spread rapidly downstream and completely displaced the native vegetation, primarily Panicum virgatum (hereafter referred to as switchgrass), in the riparian areas. The NRA felt that Arundo reduced streamflows in the Nueces River due to higher water use and longer growth period of Arundo when compared to switchgrass, and hence started an eradication program in 2010 using targeted application of herbicides.
The effects of invasive plant species on hydrology have been studied at both field and watershed scales. At the field level, techniques such as the eddy-covariance flux towers for assessing evapotranspiration [11,12,13], rainfall simulators for assessing water budget at a plot scale [14], and bulk density measurements fitted to models such as Van Dechten or Durner to assess root water uptake capability [15] were used. While several studies were conducted at the field scale, Wilcox et al. [16] emphasized the importance of understanding the effects of changes in vegetation on water cycle at the watershed scale.
Process-based models used for watershed scale studies include the Soil and Water Assessment Tool (SWAT) [17,18], Hydrological Simulation Program- FORTRAN (HSPF) [19], Soil and Water Integrated Model (SWIM) [20] and Dynamic Watershed Simulation Model (DWSM) [21]. In a review of applications of three models including the SWAT, HSPF and DWSM, Borah and Bera [22] reported that the HSPF model is useful for mixed agricultural and urban watersheds and SWAT is a more appropriate model for continuous simulations in agricultural watersheds. DWSM is a storm event (rainfall) model and hence would not be appropriate for this study. SWIM, which is based on the SWAT model, is developed mainly for temperate zones. The SWAT model is a hydro-dynamic and physically-based semi-distributed model [23], which has been widely used in the field of ecohydrology. For example, the SWAT model was used to study the hydrological impacts of invasive species such as Juniperus ashei J. Buchholz (ashe’s juniper), Tamarix chinensis Luor (salt cedar) and Prosopis glandulosa (mesquite) in the works of Afinowicz et al. [24] and Bednarz et al. [25]. Recently, Qiao et al. [26] also used the SWAT model to simulate the impacts of a prolifically encroaching juniper species, Juniperus virgininiana (eastern red cedar) on the water budget in three pairs of grassland and eastern red cedar watersheds in the south-central Great Plains. Hence, we found it to be the most appropriate model for this study.
The overarching goal of this study was to assess the impacts of Arundo invasion on hydrology of the headwaters of the Nueces River through observed long-term streamflow and precipitation data analysis, and hydrologic modeling to provide a scientific basis to the management projects being undertaken for its control and for ecological risk management. The specific objectives were to: (i) assess if Arundo invasion caused any changes to streamflow patterns by comparing observed streamflow trends before and after the Arundo invasion, (ii) calibrate and validate the Soil and Water Assessment Tool (SWAT) for the Nueces River Headwaters watershed in central Texas, and (iii) assess the effects of Arundo invasion on watershed hydrology by comparing water balances under Arundo and switchgrass scenarios.

2. Methodology

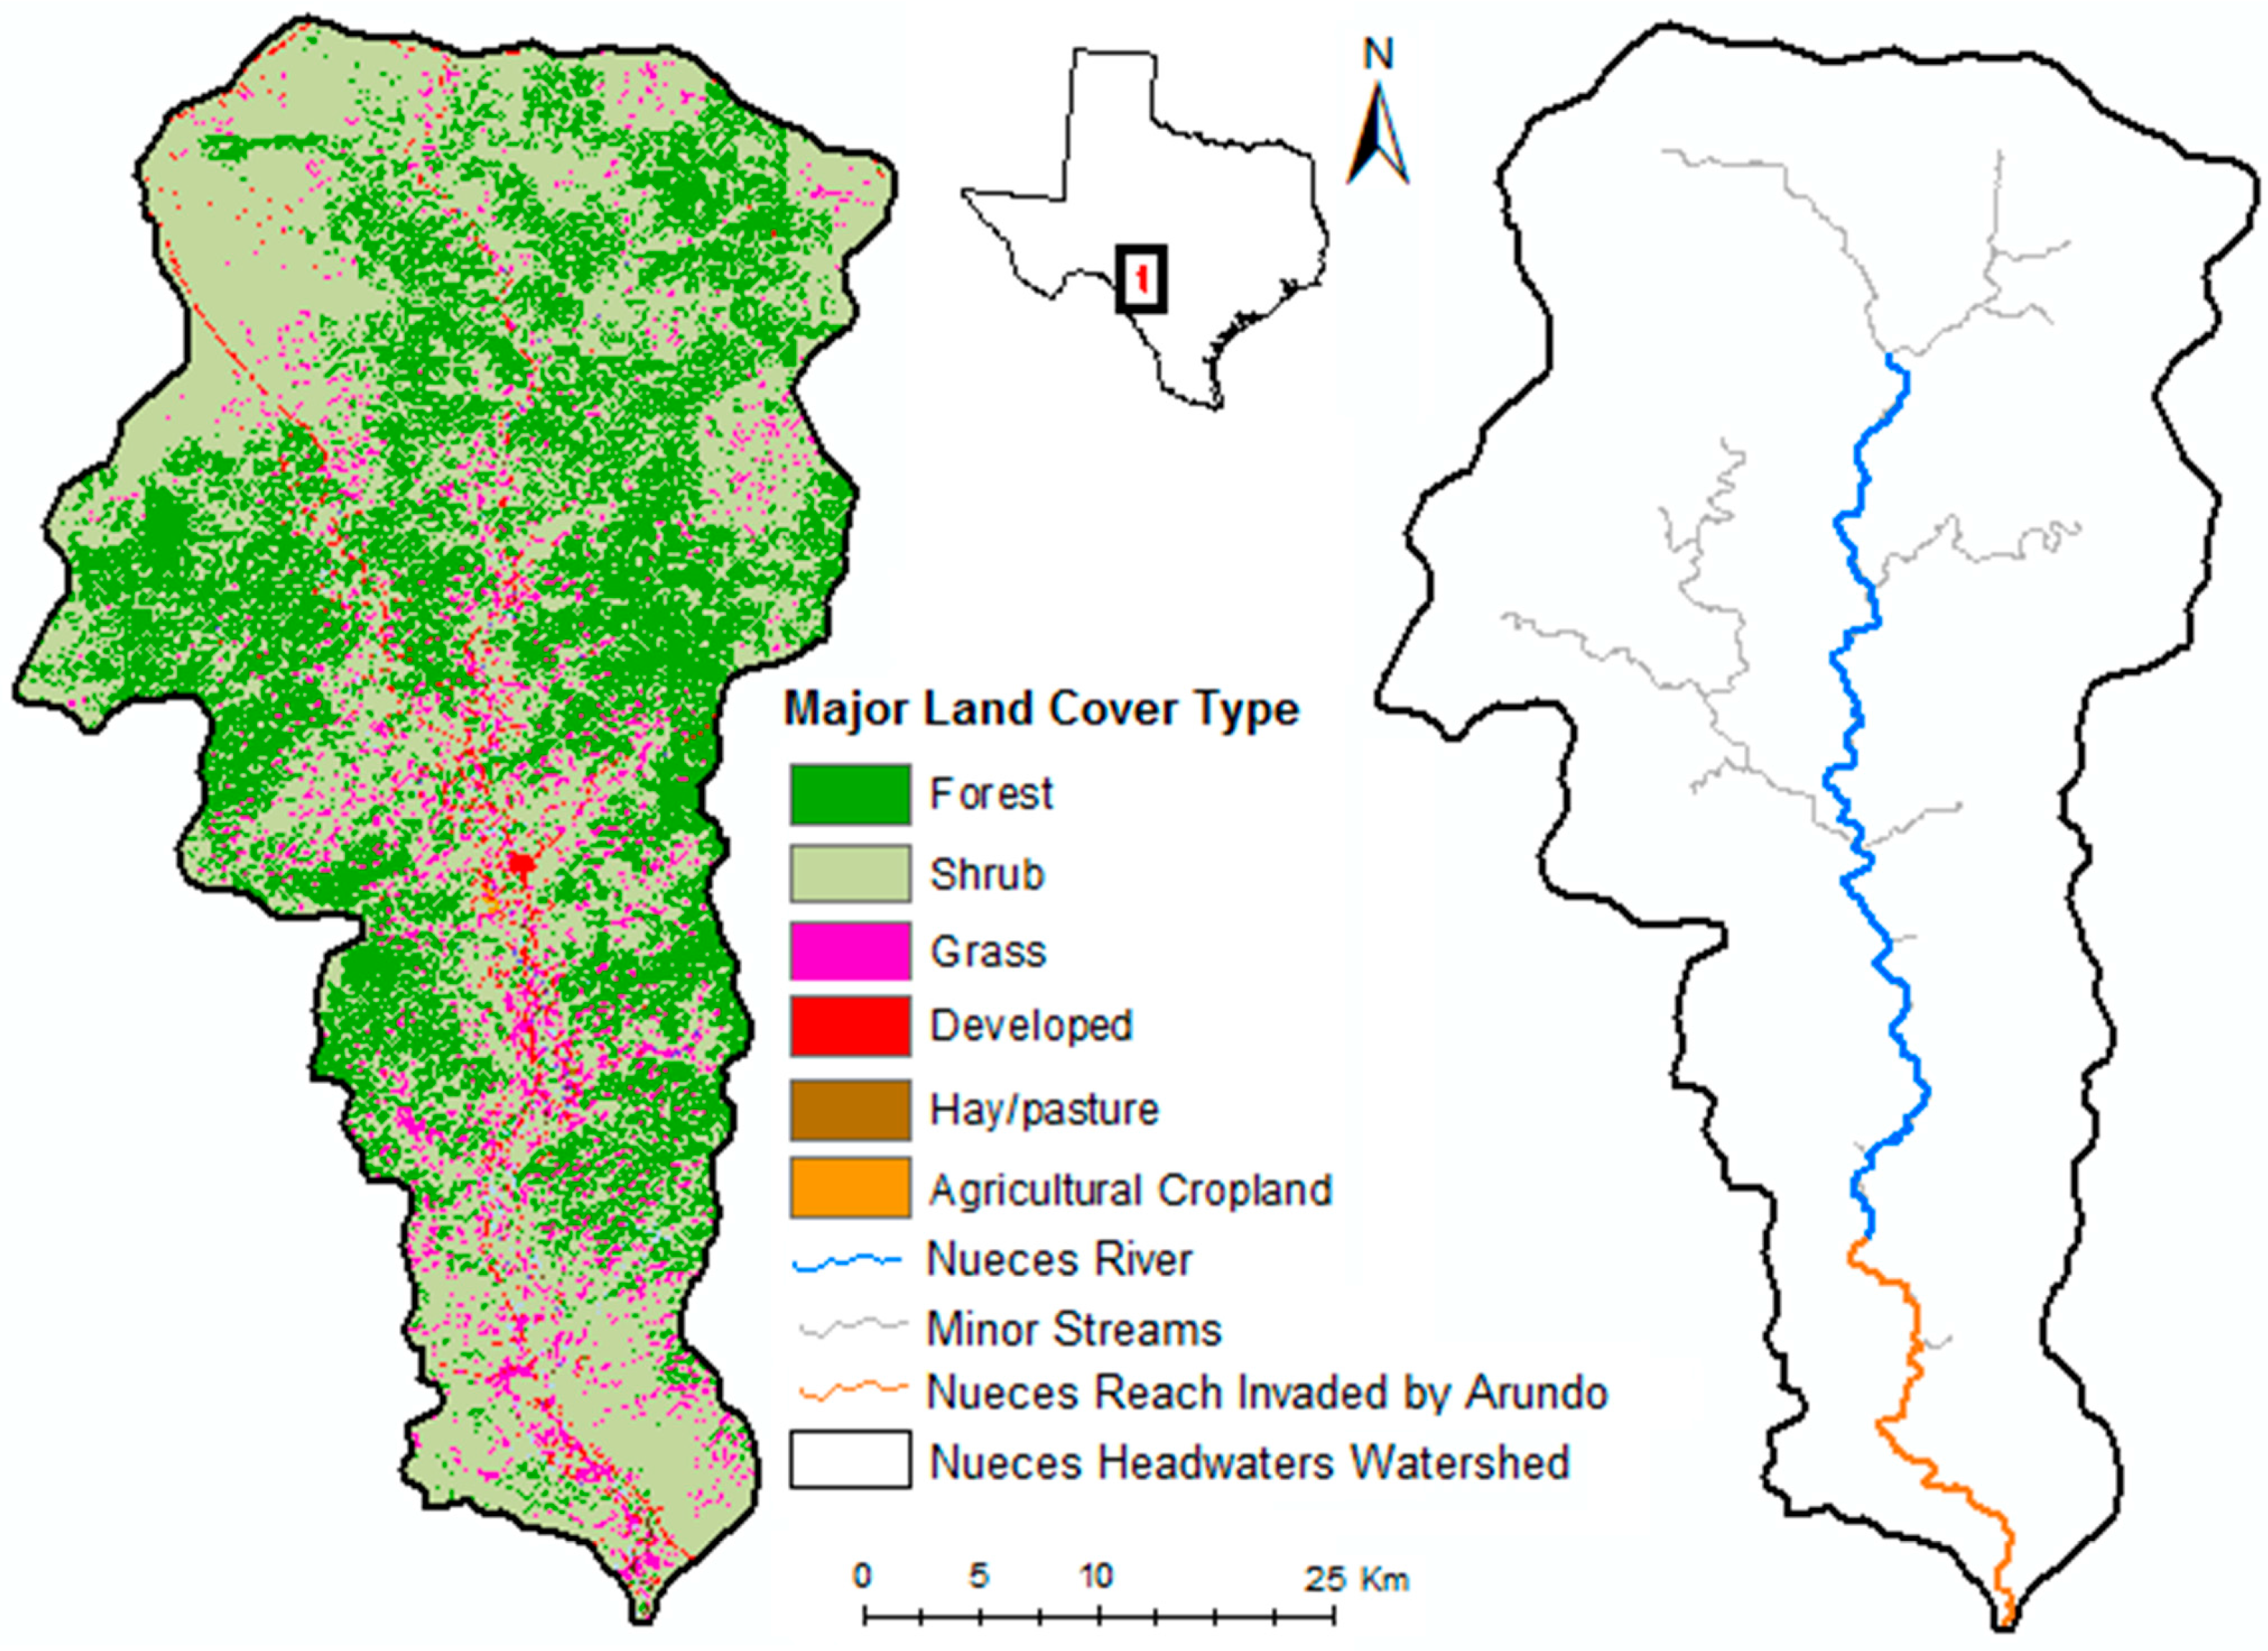
2.1. Description of Study Area

The Nueces River Headwaters (HUC 12110101) watershed is located in the “Hill Country” in Texas (Figure 1), and it lies just north of the Edwards aquifer recharge zone, which is a karst region. It covers an area of about 2126 km2. The temperature in the watershed ranges from a maximum of 43 °C during the months of August and September to −15 °C in the months between December and February. The average annual rainfall from 1950 to 2010 was 690 mm. The major land type in this region is rangeland covered by brushy woody plants (55%) according to the 2006 National Land Cover Dataset (NLCD) (Figure 1). Although the Edwards aquifer recharge zone is to the south of the study area, this watershed area is still karst and water disappears into the ground and comes out of the stream through springs in various stretches of the river [27]. The Nueces River is also geomorphologically complex in that it changes its course rapidly and underlying processes are not well understood. An area of 3.52 km2 in the riparian areas of an 8 km stretch of the Nueces River north of the Laguna gage at the watershed outlet has been densely populated by Arundo.
Figure 1. Land cover in the Nueces Headwaters Watershed (HUC 12110101) in Texas.
Hydrology 02 00134 g001

2.2. Streamflow Analysis

Daily, monthly and yearly streamflow data recorded at the Laguna gage (USGS 08190000) over the period from 1979 to 2010 was analyzed to compare streamflow trends before and after the Arundo invasion and thereby assess if Arundo invasion caused any changes to streamflow patterns. A Web GIS Based Hydrography Analysis Tool (WHAT) developed by Lim et al. [28] was used to separate measured streamflow into baseflow and stormflow components. This program, which uses recursive filtering techniques, was chosen over other methods because of the karst nature of this region. The recession curve falls very sharply for the karst areas because of sinkholes. Hence, signal separation on the basis of frequency was a better option than recession-based separation. Two 15-year time periods, 1979–1994 and 1995–2010, were considered for the analysis to represent the pre- and post-Arundo invasion conditions, respectively. The daily baseflow, streamflow and precipitation were converted to incremental percentiles for further analysis [29]. The data were initially tested for normality. The null hypothesis that the data were normal, was rejected for both baseflow and streamflow with p values of <0.0001. Since data were found to be non-normal, we tested for serial correlation using the Durbin Watson test [30]. No significant serial correlation was found for either streamflow or baseflow data. Finally, the non-parametric Kendall’s tau statistic was used to analyze both baseflow and streamflow data. The null hypothesis used for the Mann-Kendall test [31,32,33] was that there was no change in baseflow, streamflow and precipitation trends over time. This hypothesis was tested based on a significance value of 0.1.

2.3. Arundo Parametrization

Arundo does not exist as a crop option in the SWAT model database. Many of the crop growth parameters required by the SWAT model have not been studied for Arundo and the existing parameter values found in the literature vary widely. The ALMANAC (Agricultural Land Management Alternatives with Numerical Assessment Criteria) [34] model was therefore used to establish crop growth parameters for Arundo. This model simulates the water balance using various methods of calculating potential ET and determines plant water use while considering such variables as soils, weather, and plant species cover. Simulated plant growth is reduced when simulated soil water is depleted. The plant growth model simulates changes in leaf area as well as changes in plant biomass. Sugarcane (Saccharum spp.), which is physiologically the closest crop to Arundo available in the ALMANAC model, was used as the base crop for this simulation. Parameter values for sugarcane were modified to derive realistic values for Arundo based on unpublished observations of leaf area development and dry matter production of Arundo [35] (Table 1).
Table 1. Comparison of Arundo parameters determined using Agricultural Land Management Alternatives with Numerical Assessment Criteria (ALMANAC) model with sugarcane parameters (only the parameters that were modified are listed).
ParameterDefinitionSugarcaneArundoUnits
BIO_E (RUE)Radiation-use efficiency or biomass-energy ratio 2545(kg/ha)/(MJ/m2)
BIOEHIBiomass-energy ratio corresponding to the 2nd point on the radiation use efficiency curve3352
BLAIMaximum potential leaf area index612
FRGRW1Fraction of the plant growing season or fraction of total potential heat units corresponding to the 1st point on the optimal leaf area development curve0.150.1
LAIMX1Fraction of the maximum leaf area index corresponding to the 1st point on the optimal leaf area development curve0.010.2
DLAIFraction of growing season when leaf area begins to decline0.90.95
CHTMXMaximum canopy height 33.6m
T_baseMinimum (base) temperature for plant growth 1110°C
HVSTIHarvest index for optimal growing conditions0.50.9
WSYFLower limit of harvest index 0.010.15(kg/ha)/(kg/ha)
CNYLDNormal fraction of nitrogen in yield 00.0069kg N/kg yield
CPYLDNormal fraction of phosphorus in yield 00.0017kg P/kg yield
GSIMaximum stomatal conductance at high solar radiation and low vapor pressure deficit 0.00550.007m/s
EXT_COEFLight extinction coefficient-0.65
Especially important for plant transpiration is the maximum potential leaf area index (BLAI), whereas for biomass production, radiation-use efficiency (BIO_E) is the main controlling parameter. These parameter adjustments were designed to accurately simulate the LAI curve for Arundo in this region. This is especially important for the SWAT simulations of water uptake by Arundo, where LAI plays such an important role. While BLAI for sugarcane in the SWAT crop database is six, that for Arundo was found to be 12 through ALMANAC simulations. The BIO_E was increased from 25 to 45 (kg/ha) (MJ/m2). These changes were based on the fact that Arundo biomass was twice that of sugarcane under the climatic conditions in the region. Other major changes made were increasing the harvest index (HVSTI) from 0.5 to 0.9 since Arundo is not harvested while sugarcane is harvested as an agricultural crop. Later, Arundo was added as a new crop into the SWAT crop database and Arundo parameters were populated.

2.4. Setting up the SWAT Model

The geospatial and temporal datasets for the SWAT modeling were obtained from various sources. The Digital Elevation Model (DEM) of the study area was downloaded from the National Hydrography Dataset [36]. The DEM resolution was 30 m × 30 m. The land cover/land use data for the watershed was obtained from the 2006 National Land Cover Dataset (NLCD) [37]. The soil information was obtained from the Natural Resources Conservation Service (NRCS) State Soil Survey Geographic Data (STATSGO) available in the SWAT databases. The weather data for the period from 1950 to 2010 was obtained from the United States Department of Agriculture - Agricultural Research Service (USDA-ARS) Laboratory, Temple, TX, USA website [38].
The DEM was used to delineate the study watershed using the ArcSWAT (Version 2012.10_1.9 released on 7/8/13) for ArcGIS 10.1 platform. The watershed boundary was delineated based on the points of highest elevation in the topography of the region after selecting the Laguna gage (USGS 08190000) as the watershed outlet. Twenty nine subbasins were created within this watershed. Based on the recommendations made in a gain-loss study [27], the subbasins with springs and those with no observed flows were isolated. Because of the karst nature of the study watershed, the coordinates of the sinkholes and springs were marked on the delineated watershed, and finally six subbasins that contained the areas of no flow and two subbasins with springs, were identified. The Hydrologic Response Units (HRUs) were defined based on a unique combination of soils, slopes and land use based on thresholds of 10%, 10% and 0% respectively. The 0% threshold was used for land use so that Arundo, which was occupying a small fraction of the area of the watershed, could be mapped and simulated. A total of 1224 HRUs were created, of which seven HRUs contained Arundo. Auto irrigation was simulated in the Arundo HRUs in order to simulate non-water limiting conditions for the plant water uptake that existed in the riparian areas of the Nueces Headwaters. This was done assuming that the soil in the Arundo HRUs was always saturated.

2.5. Model Calibration and Validation

The SWAT model simulations were run for the period from 1950 to 1994 on a daily time step, and the first 10 years were considered as warm up period. The 1960–1977 and 1978–1994 periods were chosen as the model calibration and validation periods, respectively, to correctly simulate the hydrology of the watershed before the Arundo invasion.
The most sensitive parameters during model calibration were found to be curve number (CN2), soil available water capacity (SOL_AWC), baseflow recession constant (ALPHA_BF), groundwater delay (GW_DELAY), soil evaporation compensation factor (ESCO), transmission losses (CH_K2), threshold water level in shallow aquifers for baseflow (GWQMN), saturated hydraulic conductivity of the first layer of the soil (SOL_K) and aquifer percolation constant (RCHRG_DP) (Table 2). In this karst watershed, there are regions with rapid groundwater recharge. These regions have a GW_DELAY of as low as one day while in other regions the GW_DELAY is as slow as 218 days. The baseflow filter in the SWAT model [39] was used to partition the streamflow hydrograph into baseflow and stormflow components. From this analysis, an ALPHA_BF value of 0.015 and GW_DELAY value of 218 days were obtained.
Table 2. Parameters adjusted during the calibration of the soil and water assessment tool (SWAT) model.
ParameterDefault ValuesCalibrated Values
Subbasins with No Flow
ALPHA_BF0.0480.9–1.0
GW_DELAY31 days1 day
SOL_KDefault+15%
CH_K20250 mm/h
RCHRG_DPDefault+0.2
GWQMN05 mm
Subbasins with Springs
ALPHA_BF0.0480.015
GW_DELAY31 days218 days
SOL_KDefault−30%
Subbasins without Springs and Sinkholes
ALPHA_BF0.0480.015
GW_DELAY31218 days
SOL_KDefault−20%
CH_K2050 mm/h
All Subbasins
CN2Default−15%
ESCODefault−0.1
SOL_AWCDefault+0.1
For the subbasins with no streamflow, the fraction of recharge to a deep aquifer, transmission losses, SOL_K, and ALPHA_BF were increased and GW_DELAY was decreased based on studies by Baffaut and Benson [40] and Echegaray [41]. The default values and the finally adjusted values of these parameters are shown in Table 2. For the subbasins where springs were found, they could not be treated as point sources due to lack of information on flow from these springs. However, the GW_DELAY in these subbasins was increased and transmission losses were decreased.
The model performance during the calibration and validation periods was assessed using three statistical measures including the Nash-Sutcliffe Efficiency (NSE) [42], percent bias (PBIAS) [43], and coefficient of determination (R- square) [44]. The NSE ranges from −∞ to one, and the NSE values closer to one indicate the better model performance. The P-Bias varies between −100 and ∞, with smaller absolute values closer to zero indicating better agreement. R-square ranges between zero and one, with higher values closer to one implying better performance of the model.

2.6. Scenario Analysis

Once the SWAT model was calibrated and validated, two scenarios were run for the period of 1992–2010. The first three years were considered as a warm up period and the results for the 1995–2010 period were analyzed. Under the first scenario, Arundo was simulated in the seven identified Arundo HRUs in the riparian areas (baseline scenario). Under the hypothetical second scenario, Arundo was assumed to have not invaded the riparian areas and the native switchgrass continued to grow in those seven HRUs. The simulated water balance components in the seven Arundo HRUs under both scenarios were finally examined to assess the impacts of Arundo invasion on hydrology of the invaded region of the watershed.

3. Results and Discussion

3.1. Streamflow Trend Analysis

The results from the Mann-Kendall test indicated that the annual values of baseflow, streamflow and precipitation during the pre-Arundo invasion (1979–1994) and post-Arundo invasion (1995–2010) periods showed no significant trends (i.e., neither increased nor decreased over the period of time). However, monthly values of these variables showed mixed trends. No significant trend was found in monthly precipitation during both pre- and post-invasion periods. In case of monthly streamflow and baseflow, positive (slightly increasing) and negative (slightly decreasing) trends were found for the pre-invasion and period post-invasion periods, respectively. The null hypothesis of no trend in flow was therefore rejected at a significance value of 0.1. This analysis emphasized the need for further assessment of the hypothesis that the Arundo invasion was responsible for the changes in streamflow trends.

3.2. Model Calibration and Validation Results

An NSE of 0.79, a P-Bias of 15.5% and an R-square value of 0.76 were achieved for the model calibration period. According to Moriasi et al. [45] criteria, the NSE obtained for the calibration period was very good, the PBIAS was satisfactory and the R-square was very good. For the validation period, a NSE of 0.74, a P-Bias of 4.3% and an R-square value of 0.64 were achieved. The NSE achieved for the model validation period was good, PBIAS was very good and R-square was good [45]. The model performance statistics achieved in this study are superior or comparable to those achieved in other published SWAT modeling studies in karst watersheds [24,46]. For example, Afinowicz et al. [24] used the SWAT model to simulate a karst watershed in the Edwards aquifer region in Texas and obtained a NSE value of 0.29 and 0.5 for monthly calibration and validation periods, respectively. Spruill et al. [46] modeled a karst region in central Kentucky using the SWAT model and obtained a monthly NSE of 0.89 and 0.58 for calibration and validation periods, respectively. Considering the karst nature of the watershed modeled in this study, the achieved NSE of 0.79 and 0.74 for calibration and validation periods, respectively, were considered as acceptable for conducting scenario analysis.

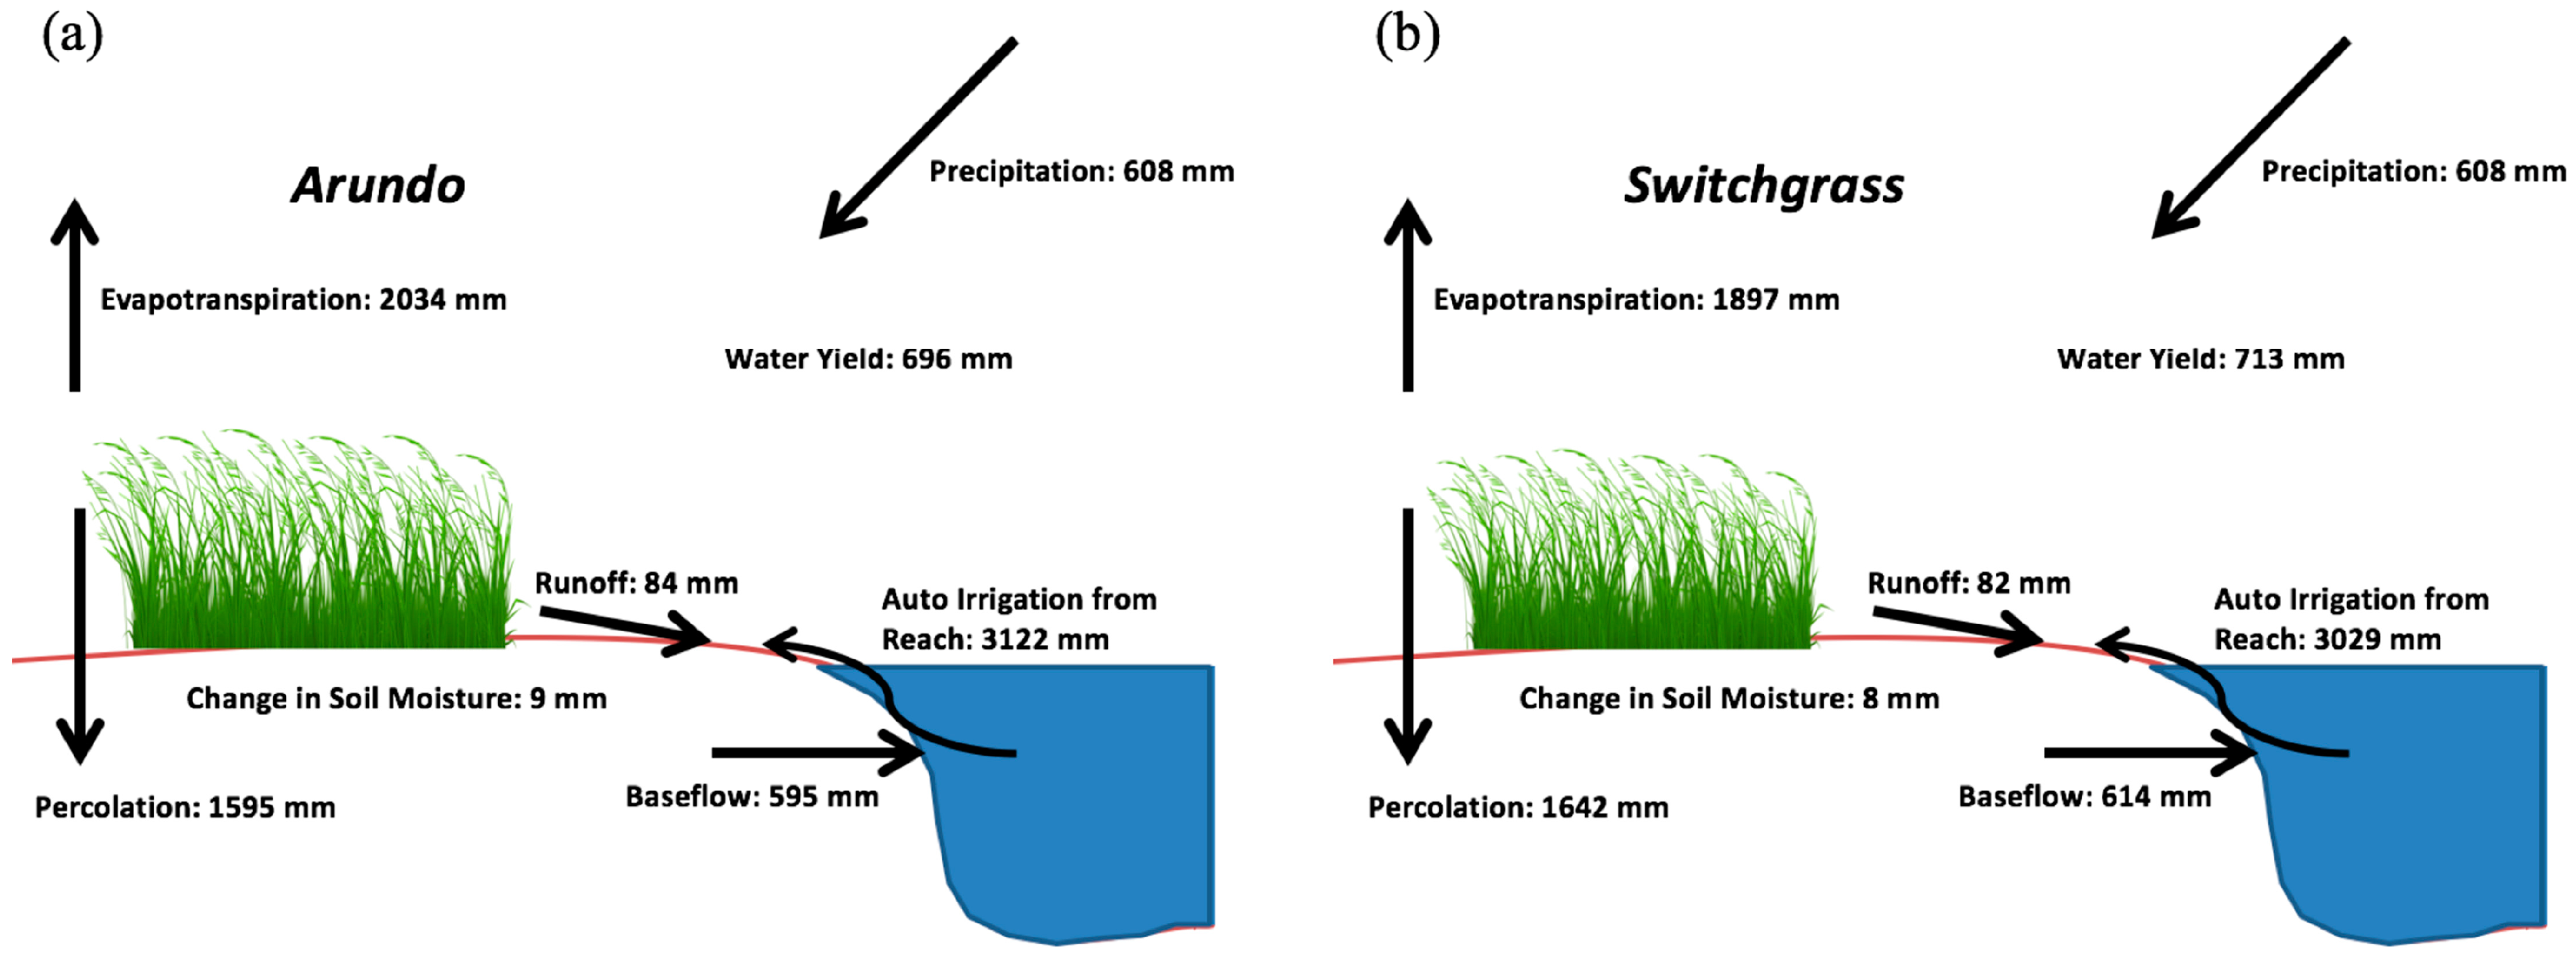
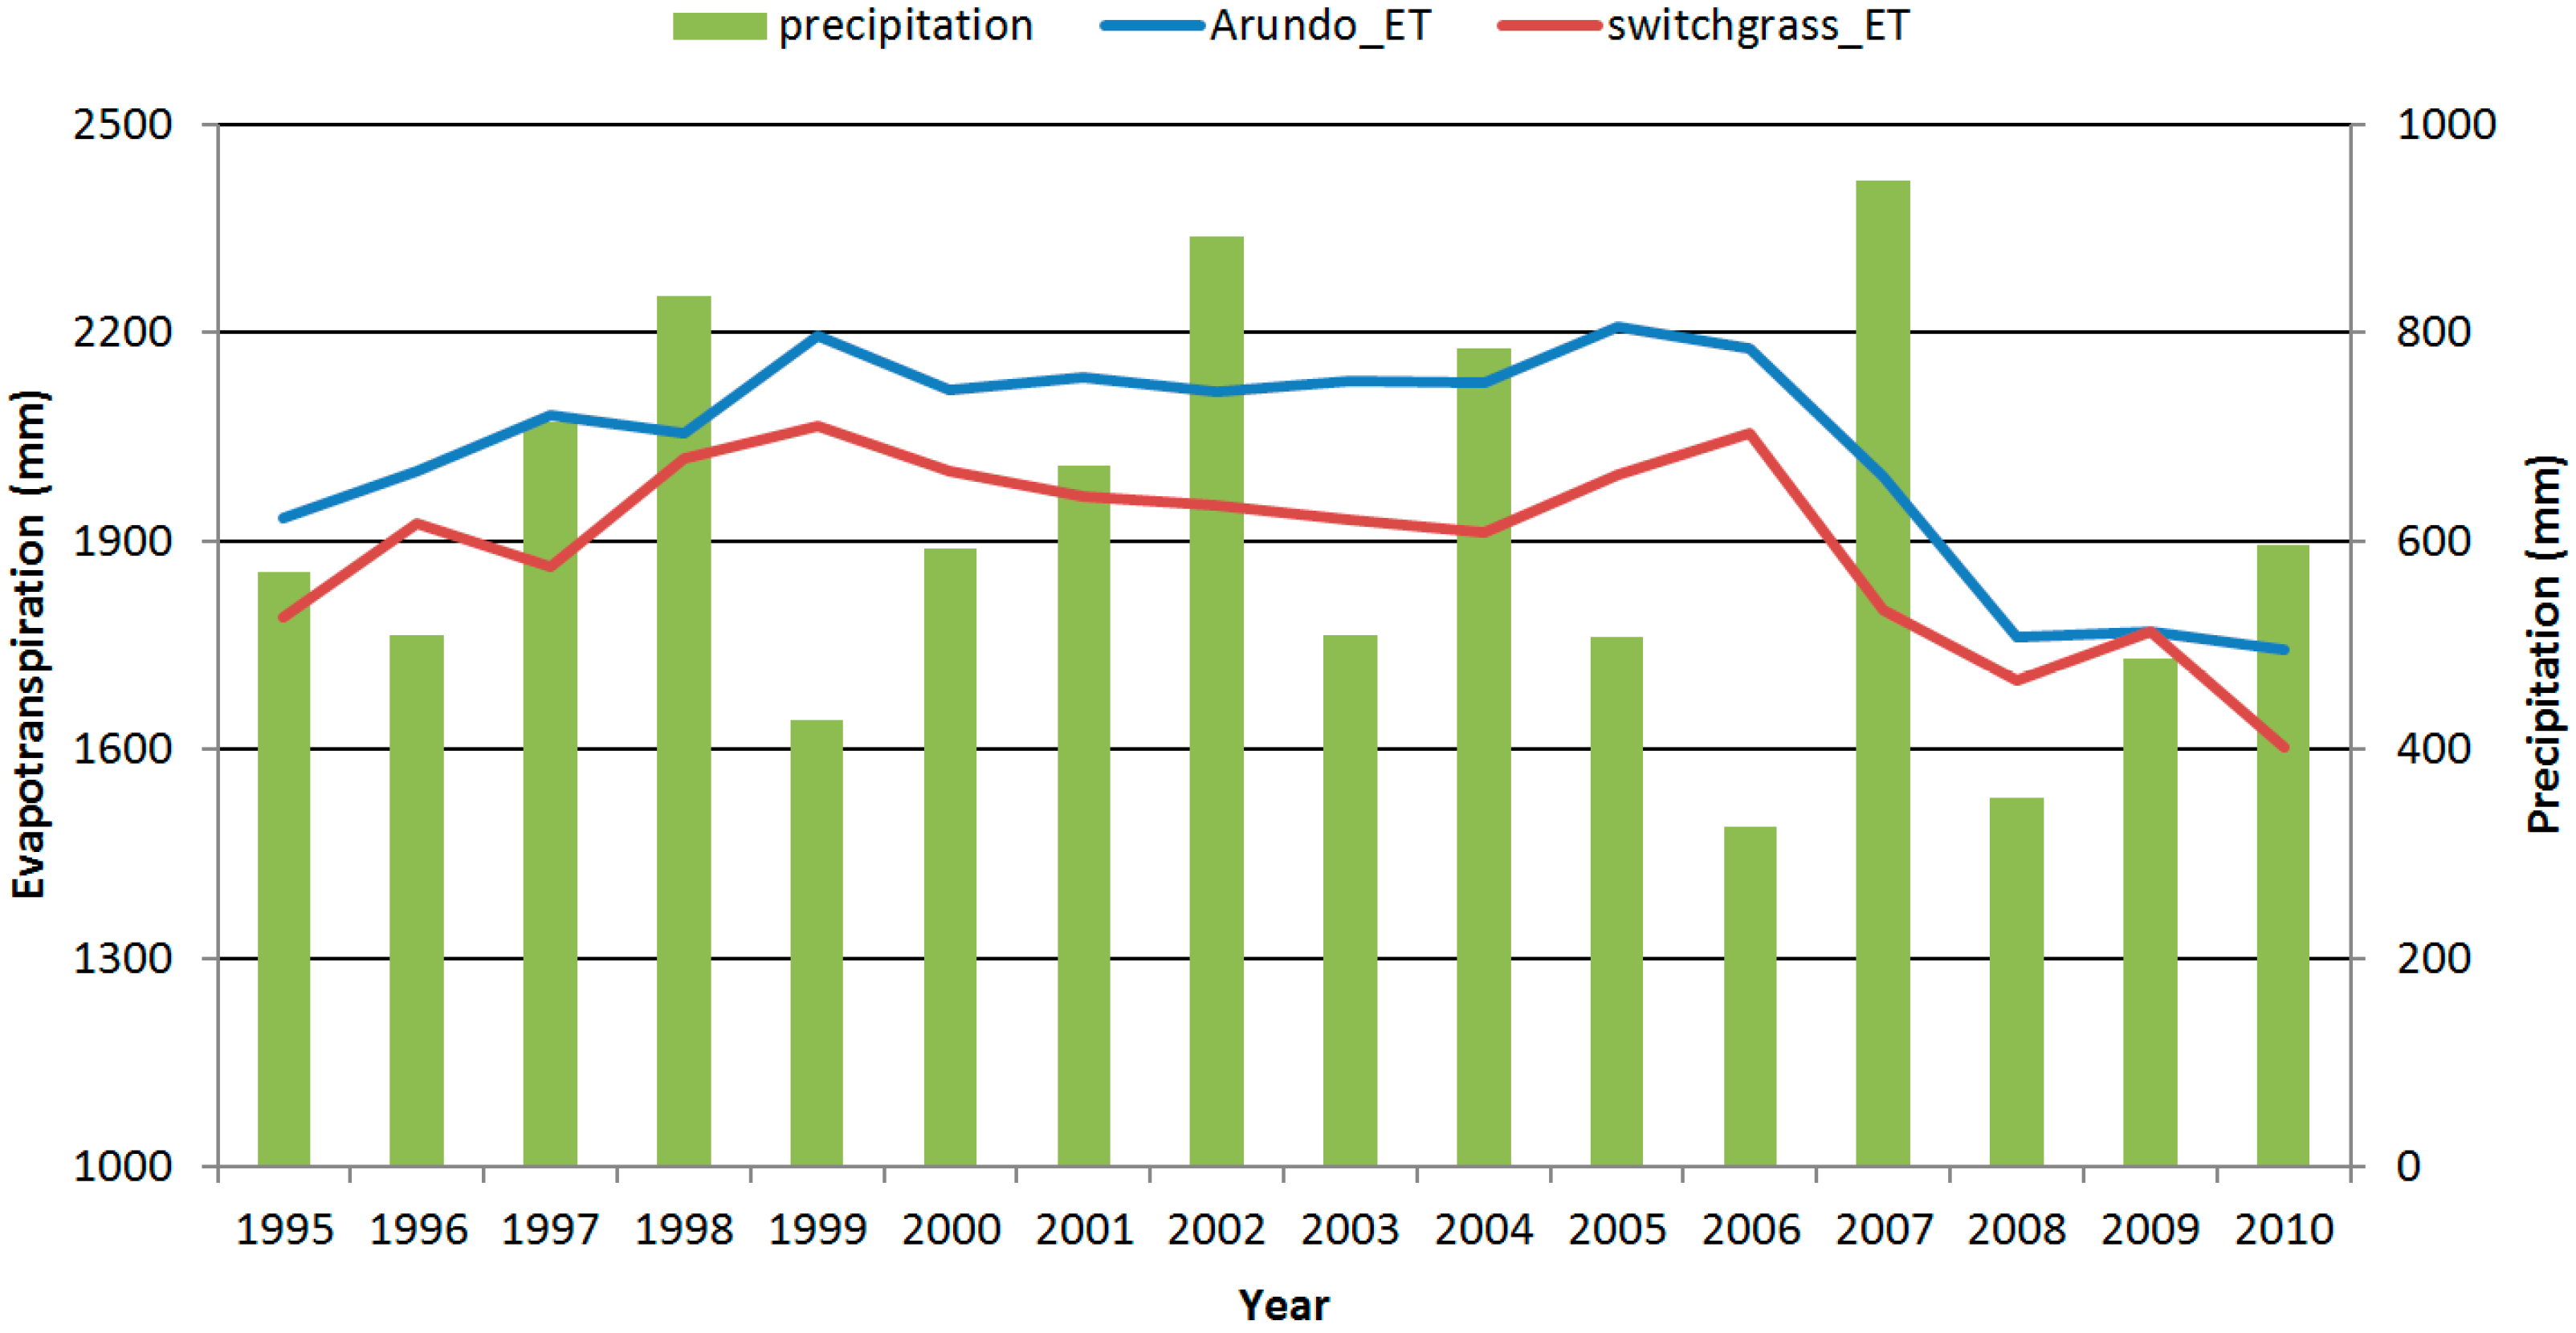
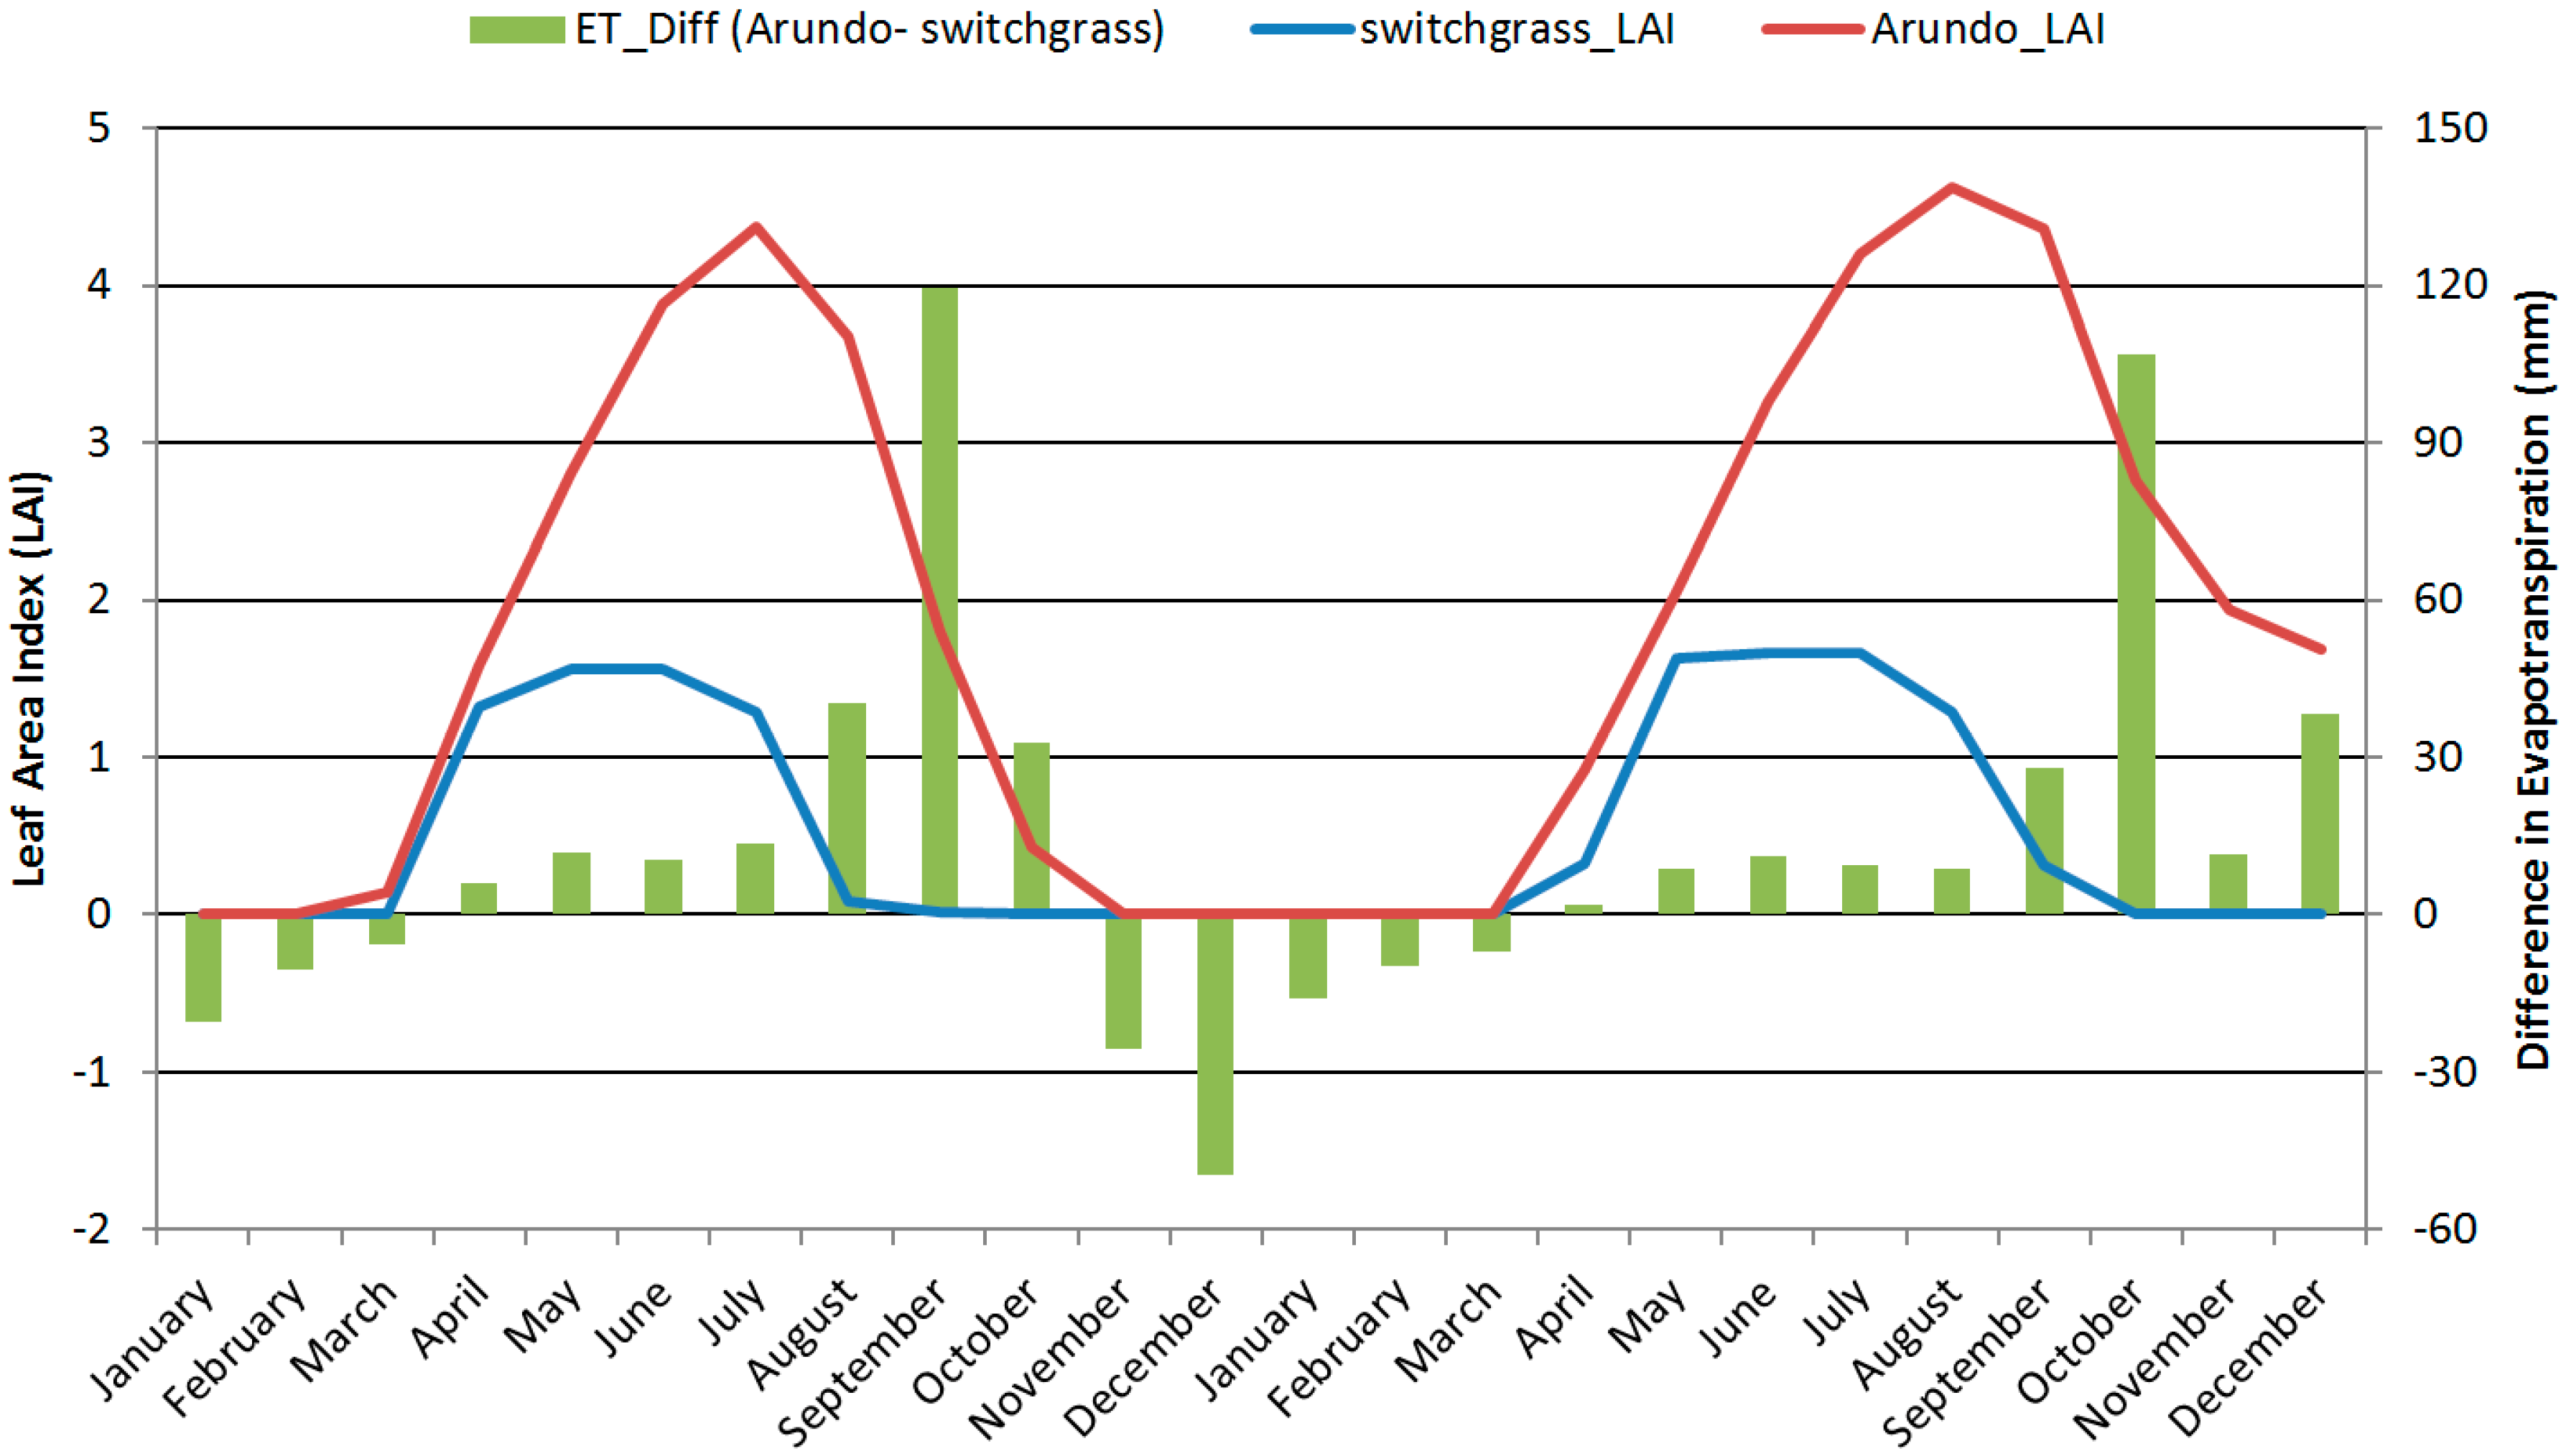
3.3. Water Balances—Arundo vs. Switchgrass Scenarios

The simulated average (1995–2010) annual evapotranspiration (ET) in the seven Arundo HRUs under the baseline Arundo scenario was higher by 137 mm when compared to a native switchgrass scenario (Figure 2). The simulated average (1995–2010) annual ET of Arundo was 2034 mm as compared to 1897 mm for switchgrass. The ET for Arundo was consistently higher than that of switchgrass in all 16 years of evaluation (Figure 3). The simulated average annual water uptake by Arundo was determined to be 7.2% higher than that of switchgrass. Higher water uptake by Arundo resulted in a 93 mm higher irrigation (water use from the reach/stream) annually when compared to switchgrass. In addition, the simulated average annual water yield (net amount of water that was generated from the seven Arundo HRUs and contributed to streamflow) under the Arundo scenario was lower than that under the switchgrass scenario by 17 mm. The simulated annual percolation was also lower under Arundo scenario by an average of 47 mm as compared to switchgrass. This was due to the fact that switchgrass has a different root structure and deeper rooting depth than Arundo. The increased water uptake and irrigation, and decreased water yield and percolation under the baseline Arundo scenario when compared to the hypothetical switchgrass scenario indicated that Arundo has caused reductions in streamflow when compared to the native switchgrass scenario. The results obtained for the study watershed from this SWAT modeling are therefore consistent with the observed trends in streamflow. These results are also in agreement with Zou et al. [47] who reported a reduction in magnitude and frequency of streamflow in Oklahoma due to the encroachment of juniper.
Figure 2. Comparison of water budget for the seven Arundo HRUs under (a) Arundo and (b) switchgrass scenarios. All the values are annual averages over 16 years.
Hydrology 02 00134 g002
The seasonal differences in water uptake between Arundo and switchgrass were evaluated by studying monthly ET and LAI values in years 2006 and 2007 (Figure 4). As can be seen, the difference in monthly ET (Arundo - switchgrass) was positive during the months of April to October as the LAI of Arundo was higher than that of switchgrass during these months. Switchgrass leaves start senescing earlier than those of Arundo towards the end of September and that is why Arundo, which has a higher LAI during September–October, continued to transpire, and, hence, the difference in ET during that period was the highest. As soon as both plants became dormant in the winter, the difference in ET between Arundo and switchgrass became negative. This can be attributed to the fact that the transpiration component of the ET was inactive and the evaporation was higher for the switchgrass scenario because of lower canopy cover than Arundo. Overall, Arundo used more water than switchgrass over the entire year.
Figure 3. Comparison of simulated annual Arundo and switchgrass evapotranspiration.
Hydrology 02 00134 g003
Figure 4. Differences in monthly Leaf Area Index (LAI) and Evapotranspiration (ET) between Arundo and switchgrass over two consecutive years (2006–2007).
Hydrology 02 00134 g004

4. Conclusions

Arundo, which was originally brought from the Mediterranean region to California, has invaded riparian areas of the karst Nueces Headwaters watershed and replaced native switchgrass since 1995. Hypothesizing that the Arundo invasion reduced streamflow due to its high water uptake, the Nueces River Authority implemented an eradication program in 2010, but this decision needed to be justified by actual and model-based simulation data. We determined the impact of Arundo invasion on water balances in the riparian areas and streamflow patterns by analyzing observed long-term streamflow data and using the SWAT model. The analysis revealed that under no significant differences in precipitation patterns, streamflow had a slightly positive (increasing) trend in the 15 years before Arundo invasion (1979–1994) and a slightly negative (decreasing) trend in the 15 years after invasion (1995–2010). The SWAT model was calibrated and validated using observed streamflow data. The calibrated SWAT model was used to assess water balances in the invaded areas (seven HRUs) under the baseline Arundo scenario and a hypothetical native switchgrass scenario. The simulated average (1995–2010) annual ET of Arundo was 2034 mm as compared to 1897 mm for switchgrass. Hence, there was a 7.2% increase in simulated water uptake due to the invasion of Arundo. On average, annual ET in the case of Arundo was higher by 137 mm, and, accordingly, annual irrigation (water use from reach/stream) was also higher by 93 mm. This was in agreement with our hypothesis that Arundo used more water from the system when compared to native switchgrass. Arundo also reduced water yield (net amount of water that was generated from the seven Arundo HRUs and contributed to streamflow) by 17 mm and percolation by 47 mm, when compared to switchgrass. Arundo has therefore used more water from the Nueces River Headwaters when compared to native switchgrass and hence has slightly decreased streamflow.

Acknowledgments

We thank the Nueces River Authority (NRA), Texas A&M University Water Management and Hydrologic Sciences (WMHS) program and the Texas A&M AgriLife Research for funding this research. We also thank Sky Lewey of the NRA for all her support. We would like to acknowledge the help of Mike White and Jeff Arnold at the USDA-ARS lab in Temple, Texas in answering our questions pertaining to SWAT modeling. We also would like to acknowledge the help of Amber Williams, who helped us in parametrizing the ALMANAC model for simulating Arundo.

Author Contributions

Shailee Jain conducted this research as a part of her M.S. Thesis under the guidance of Clyde Munster and Srinivasulu Ale. Shailee Jain wrote the initial version of the manuscript, and Srinivasulu Ale helped her in improving the manuscript. R. James Ansley served as a member of Shailee Jain’s graduate committee and provided guidance related to his expertise on invasive species. James R. Kiniry ran ALMANAC simulations and helped Shailee Jain in establishing crop growth parameters for Arundo in the SWAT model. All co-authors contributed by reviewing the manuscript, and improving the discussion and interpretation of the results.

Conflict of Interest

The authors declare no conflict of interest.

References

  1. Perdue, R.E., Jr. Arundo donax: Source of musical reeds and industrial cellulose. Econ. Bot. 1958, 12, 368–404. [Google Scholar] [CrossRef]
  2. McGaugh, S.; Hendrickson, D.; Bell, G.; Cabral, H.; Lyons, K.; McEachron, L.; Munoz, O. Fighting an aggressive wetlands invader: A case study of giant reed (Arundo donax) and its threat to Cuatro Ciénegas, Coahuila, Mexico. In Studies of North American Desert Fishes in Honor of EP (Phil) Pister, Conservationist; Lozano-Vilano, M.D.L., Contreras-Balderas, A.J., Eds.; Universidad Autónoma de Nuevo León, Facultad de Ciencias Biológicas: Monterrey, Nuevo León, México, 2006. [Google Scholar]
  3. Bell, G.P. Ecology and management of Arundo donax, and approaches to riparian habitat restoration in Southern California. In Plant Invasions. Studies from North America and Europe; Brock, J.H., Wade, M., Pyšek, P., Green, D., Eds.; Backhuys Publishers: Leiden, The Netherlands, 1998; pp. 103–113. [Google Scholar]
  4. Gowda, P.H.; Goolsby, J.A.; Yang, C.; Basu, S.; Racelis, A.; Howell, T.A. Estimating water use by giant reed along the Rio Grande using a large aperture scintillometer. Subtrop. Plant Sci. 2011, 63, 1–6. [Google Scholar]
  5. Watts, D.A.; Moore, G.W. Water-use dynamics of an invasive reed, Arundo donax, from leaf to stand. Wetlands 2011, 31, 725–734. [Google Scholar] [CrossRef]
  6. Giessow, J.; Casanova, J.; MacArthur, R.; Leclerc, R.; Fleming, G. Arundo donax Distribution and Impact Report; 06-374-559-0; California Invasive Plant Council (Cal-IPC): Berkeley, CA, USA, 2011. [Google Scholar]
  7. Benton, N.; Bell, G.; Swearingen, J.M. Fact Sheet: Giant Reed. Available online: http://www.nps.gov/plants/alien/fact/ardo1.htm (accessed on 10 January 2013).
  8. Zahran, M.A.; Willis, A.J. The Vegetation of Egypt, 2nd ed.; Springer Science & Business Media: Heidelberg, Baden-Württemberg, Germany, 2008. [Google Scholar]
  9. Dudley, T.L. Arundo Donax L. In Invasive Plants of California’s Wildlands, 1st ed.; Bossard, C.C., Randall, J.M., Hoshovsky, M.C., Eds.; University of California Press: Oakland, CA, USA, 2000; pp. 53–58. [Google Scholar]
  10. Goolsby, J.; Moran, P.; Kirk, A.; Jones, W.; Everitt, J.; Yang, C.; Parker, P.; Flores, D.; Spencer, D.; Pepper, A. Arundo donax-giant reed, an invasive weed of the Rio Grande Basin. In Proceedings of the Weed Science Society Annual Meeting, Champaign, IL, USA, June 2007.
  11. Snyder, K.A.; Scott, R.L.; McGwire, K. Multiple year effects of a biological control agent (Diorhabda carinulata) on Tamarix (saltcedar) ecosystem exchanges of carbon dioxide and water. Agric. For. Meteorol. 2012, 164, 161–169. [Google Scholar] [CrossRef]
  12. Sonnentag, O.; Detto, M.; Vargas, R.; Ryu, Y.; Runkle, B.R.K.; Kelly, M.; Baldocchi, D.D. Tracking the structural and functional development of a perennial pepperweed (Lepidium latifolium L.) infestation using a multi-year archive of webcam imagery and eddy covariance measurements. Agric. For. Meteorol. 2011, 151, 916–926. [Google Scholar] [CrossRef]
  13. Dzikiti, S.; Schachtschneider, K.; Naiken, V.; Gush, M.; Moses, G.; Le Maitre, D.C. Water relations and the effects of clearing invasive Prosopis trees on groundwater in an arid environment in the Northern Cape, South Africa. J. Arid Environ. 2013, 90, 103–113. [Google Scholar] [CrossRef]
  14. Porter, S.C. The Use of a Rainfall Simulator for Brush Control Research on the Edwards Plateau Region of Texas. Ph.D. Thesis, Texas A&M University, College Station, TX, USA, 2006. [Google Scholar]
  15. Tokumoto, L. Root Water Uptake and Soil Water Dynamics in a Karst Savanna on the Edwards Plateau, TX. Ph.D. Thesis, Texas A & M University, College Station, TX, USA, 2013. [Google Scholar]
  16. Wilcox, B.P.; Thurow, T.L. Emerging issues in rangeland ecohydrology: Vegetation change and the water cycle. Rangel. Ecol. Manag. 2006, 106, 261–289. [Google Scholar] [CrossRef]
  17. Arnold, J.G.; Srinivasan, R.; Muttiah, R.S.; Williams, J.R. Large area hydrologic modeling and assessment part I: Model development. J. Am. Water Resour. Assoc. 1998, 34, 73–89. [Google Scholar] [CrossRef]
  18. Arnold, J.G.; Allen, P.M.; Bernhardt, G. A comprehensive surface-groundwater flow model. J. Hydrol. 1993, 142, 47–69. [Google Scholar] [CrossRef]
  19. Bicknell, B.R.; Imhoff, J.C.; Kittle, J.L., Jr.; Donigian, A.S., Jr.; Johanson, R.C. Hydrological Simulation Program—Fortran: User’s Manual for Version 11; US Environmental Protection Agency, National Exposure Research Laboratory: Athens, GA, USA, 1997.
  20. Krysanova, V.; Müller-Wohlfeil, D.; Becker, A. Development and test of a spatially distributed hydrological/water quality model for mesoscale watersheds. Ecol. Model. 1998, 106, 261–289. [Google Scholar] [CrossRef]
  21. Borah, D.; Bera, M.; Xia, R. Storm event flow and sediment simulations in agricultural watersheds using DWSM. Trans. ASAE 2004, 47, 1539–1559. [Google Scholar] [CrossRef]
  22. Borah, D.K.; Bera, M. Watershed-scale hydrologic and nonpoint-source pollution models: Review of applications. Trans. ASAE 2004, 47, 789–803. [Google Scholar] [CrossRef]
  23. Arnold, J.G.; Moriasi, D.N.; Gassman, P.W.; Abbaspour, K.C.; White, M.J.; Srinivasan, R.; Santhi, C.; Harmel, R.D.; Griensven, A.V.; VanLiew, M.W.; et al. SWAT: Model use, calibration, and validation. Trans. ASABE 2012, 55, 1491–1508. [Google Scholar] [CrossRef]
  24. Afinowicz, J.D.; Munster, C.L.; Wilcox, B.P. Modeling effects of brush management on the rangeland water budget: Edwards plateau, Texas. J. Am. Water Resour. Assoc. 2005, 41, 181–193. [Google Scholar] [CrossRef]
  25. Bednarz, S.T.; Dybala, T.; Amonett, C.; Muttiah, R.S.; Rosenthal, W.; Srinivasan, R.; Arnold, J.G. Brush Management/Water Yield Feasibility Study for Four Watersheds in Texas; Texas Water Resources Institute: College Station, TX, USA, 2003. [Google Scholar]
  26. Qiao, L.; Zou, C.B.; Will, R.E.; Stebler, E. Calibration of SWAT model for woody plant encroachment using paired experimental watershed data. J. Hydrol. 2015, 523, 231–239. [Google Scholar] [CrossRef]
  27. Banta, R.J.; Lambert, R.B.; Slattery, R.N.; Ockerman, D.J. Streamflow Gain and Loss and Water Quality in the Upper Nueces River Basin, South-Central, Texas, 2008-10. Available online: http://pubs.usgs.gov/sir/2012/5181/ (accessed on 17 August 2015).
  28. Lim, K.J.; Engel, B.A.; Tang, Z.; Choi, J.; Kim, K.; Muthukrishnan, S.; Tripathy, D. Automated Web GIS Based Hydrograph Analysis Tool, WHAT. J. Am. Water Resour. Assoc. 2005, 41, 1407–1416. [Google Scholar] [CrossRef]
  29. Wilcox, B.P.; Huang, Y.; Walker, J.W. Long-term trends in streamflow from semiarid rangelands: Uncovering drivers of change. Glob. Chang. Biol. 2008, 14, 1676–1689. [Google Scholar] [CrossRef]
  30. Durbin, J.; Watson, G.S. Testing for serial correlation in Least Squares Regression: III. Biometrika 1971, 58, 1–19. [Google Scholar] [CrossRef]
  31. Kendall, M.G.; Gibbons, J.D. Rank Correlation Methods, 5th ed.; Oxford University Press: New York, NY, USA, 1990. [Google Scholar]
  32. Mann, H.B. Nonparametric tests against trend. Economterica 1945, 13, 245–259. [Google Scholar] [CrossRef]
  33. Gilbert, R.O. Statistical Methods for Environmental Pollution Monitoring, 87th ed.; Van Nostrand Reinhold Co.: New York, NY, USA, 1987. [Google Scholar]
  34. Kiniry, J.R.; Williams, J.R.; Gassman, P.W.; Debaeke, P. A general process-oriented model for two competing plant species. Trans. ASAE 1992, 35, 801–810. [Google Scholar] [CrossRef]
  35. Kiniry, J.R.; USDA-ARS Grassland, Soil and Water Research Laboratory, Temple, TX, USA. Field measurements of Arundo donax at Temple, TX, USA. Unpublished Data. 2010. [Google Scholar]
  36. National Hydrography Database. Available online: http://nhd.usgs.gov/data.html (accessed on 13 October 2013).
  37. Fry, J.A.; Dewitz, J.A.; Homer, C.G.; Xian, G.; Jin, S.; Yang, L.; Barnes, C.A.; Herold, N.D.; Wickham, J.D. Completion of the 2006 national land cover database for the conterminous United States. Photogramm. Eng. Remote Sens. 2011, 77, 858–864. [Google Scholar]
  38. Climatic Data for the United States. Available online: http://ars.usda.gov/Research/docs.htm?docid=19388 (accessed on 6 June 2014).
  39. Arnold, J.G.; Allen, P.M.; Muttiah, R.; Bernhardt, G. Automated base flow separation and recession analysis techniques. Ground Water 1995, 33, 1010–1018. [Google Scholar] [CrossRef]
  40. Baffaut, C.; Benson, V.W. Modeling flow and pollutant transport in a karst watershed with SWAT. Trans. ASABE 2009, 52, 469–479. [Google Scholar] [CrossRef]
  41. Echegaray, G.A. Modification of the SWAT Model to Simulate Hydrologic Processes in a Karst-influenced Watershed. Master’s Thesis, Virginia Polytechnic Institute and State University, Blacksburg, VA, USA, 2009. [Google Scholar]
  42. Nash, J.E.; Sutcliffe, J.V. River flow forecasting through conceptual models part I—A discussion of principles. J. Hydrol. 1970, 10, 282–290. [Google Scholar] [CrossRef]
  43. Gupta, H.V.; Sorooshian, S.; Yapo, P.O. Status of automatic calibration for hydrologic models: Comparison with multilevel expert calibration. J. Hydrol. Eng. 1999, 4, 135–143. [Google Scholar] [CrossRef]
  44. Pearson, E.S. Mathematical Statistics and Data Analysis, 2nd ed.; Duxbury: Belmont, CA, USA, 1938. [Google Scholar]
  45. Moriasi, D.; Arnold, J.; Van Liew, M.; Bingner, R.; Harmel, R.; Veith, T. Model evaluation guidelines for systematic quantification of accuracy in watershed simulations. Trans. ASABE 2007, 50, 885–900. [Google Scholar] [CrossRef]
  46. Spruill, C.; Workman, S.; Taraba, J. Simulation of daily and monthly stream discharge from small watersheds using the SWAT model. Trans. ASAE 2000, 43, 1431–1439. [Google Scholar] [CrossRef]
  47. Zou, C.B.; Turton, D.J.; Will, R.E.; Engle, D.M.; Fuhlendorf, S.D. Alteration of hydrological processes and streamflow with juniper (Juniperus virginiana) encroachment in a mesic grassland catchment. Hydrol. Process. 2014, 28, 6173–6182. [Google Scholar] [CrossRef]

