Novel formation of Ferrite in Ingot of 0Cr17Ni4Cu4Nb Stainless Steel

1
Special Material Institute of Inner Mongolia North Heavy Industry Group Corp LTD, Baotou 140332, China
2
Xuanda Metal Research Institute, Xuanda Industrial Group China Co., Ltd., Wenzhou 325105, China
3
Biological Anti Metal Corrosion Program, United Biologics Inc., Oakville, ON L6H 3K4, Canada
*
Author to whom correspondence should be addressed.
ChemEngineering 2018, 2(3), 44; https://doi.org/10.3390/chemengineering2030044
Submission received: 1 August 2018
/
Revised: 23 August 2018
/
Accepted: 5 September 2018
/
Published: 10 September 2018
Abstract
:The ferrite body is the origin of crack and corrosion initiation of steels. Distribution and density of ferrite in seven steel ingots were examined by light optical microscopy and computational modeling, in the study, to explore the correlation of ferrite formation to chemical composition and the mushy zone temperature in ingot forming. The central segregation phenomenon in ferrite distribution was observed in all the examined steel specimens, except 0Cr17Ni4Cu4Nb stainless steel. No significant difference was found in the distribution and density of ferrite among zones of the surface, ½ radius, and core in neither the risers nor tails of 0Cr17Ni4Cu4Nb ingots. Additionally, fewer ferrites were found in 0Cr17Ni4Cu4Nb compared to other examined steels. The difference of ferrite formation in 0Cr17Ni4Cu4Nb elicited a debate on the traditional models explicating ferrite formation. Considering the compelling advantages in mechanical strength, plasticity, and corrosion resistance, further investigation on the unusual ferrite formation in 0Cr17Ni4Cu4Nb would help understand the mechanism to improve steel quality. In summary, we observed that ferrite formation in steel was correlated with the mushy zone temperature. The advantages of 0Crl7Ni4Cu4Nb in corrosion resistance and mechanical stability could be the result of fewer ferrites being formed and distributed in a scattered manner in the microstructure of the steel.
1. Introduction
Typical 0Crl7Ni4Cu4Nb stainless steel is characteristic by low carbon (C) and high alloying elements of chromium (Cr), nickel (Ni), and copper (Cu). The material data of this chromium rich GB/T 3280 stainless steel has been provided by Metalinfo, Eagle International Software [1], with the following mass percent composition (wt %): C 0.04%–0.07%, silicon (Si) 0.3%–1%, manganese (Mn) 0.7%–1%, phosphorum (P) 0.02%–0.04%, sulfur (S) 0.01%–0.03%, Cr 15%–17.5%, Ni 3%–5%, Niobium (Nb) 0.35%–0.45%, Cu 3%–5%, Molybdenum (Mo) 0.3%–0.5%, and Iron (Fe) 72–73.2%. 0Crl7Ni4Cu4Nb is of duplex ferrite-austenite microstructure, and is excellent in corrosion resistance and mechanical stability [2]. It is widely used in aerospace, turbine blades, the food industry, offshore platforms, and synthetic fiber mold manufacturing. However, the thermal plasticity of 0Crl7Ni4Cu4Nb remains to be improved. Cracks often arise in ingot forming and the hot forging process, which is the major cause of reducing steel plasticity and limiting the service life of 0Crl7Ni4Cu4Nb steel in practice.
The service life of duplex ferrite-austenite steel highly depends on aging factors, such as ferrite formation, chemical composition, thermal history, corrosion, microstructure, and texture [3]. Among those factors, ferrite formation plays an essential role in steel aging. Ferrite in steel leads to the decrease in ductility, toughness, and impacts corrosion resistance—thus damage and the fracture of steel microstructure—and consequently limits its service life [3,4]. Ferrite is a blend of Fe and one or more additional metallic elements, such as Cr, C, Mo, and other alloying elements. It is commonly formed at high temperature in steel forming, thus it is also called high temperature ferrite. Ferrite is susceptible to thermal hardening, which leads to local premature cracking in steel microstructure. The formed cracks eventually become cavities that lead to the final ductile fracture by cavity growth and fusion [3,4]. Therefore, controlling ferrite formation is the key technique to improve the mechanical property and to prolong the service life of steel.
Ferrite in steel can be divided into equilibrium and non-equilibrium phase ferrite, according to the mechanism of ferrite body formation [3,5]. Ferrite body in the equilibrium state is mainly determined by the chemical composition of steel. The increase of ferrite elements, such as Cr, Mo, vanadium (V), and Si in steel microstructure, can promote the formation of ferrite. The ferrite body, once formed in equilibrium phase, is difficult to be removed by subsequent heat treatment. The ferrite in a non-equilibrium state is generally formed at high temperatures, which is indeed part of the steel tissue not yet transited into austenite in the supercooling processes. The ferrite formed in a non-equilibrium state can be thermally eliminated in subsequent processes. Ferrite also appears at the time of solidification and heat processing. The temporally different ferrites are various in morphology and distribution.
To date, no publication is available yet, being specifically addressed on ferrite formation in 0Crl7Ni4Cu4Nb stainless steel. The current study intends to reveal the mechanism attributable to the steel’s compelling advantages in mechanical stability and corrosion resistance by exploring ferrite formation in stainless steel.
2. Materials and Methods
2.1. Computational Modeling to Predict Ferrite Forming in Correlation with Chemical Composition and Mushy Zone Temperature of Steel
The thermo-values were obtained by thermos-analytical methods with the generally used empirically based formulas and thermos-dynamical Computherm software. Computational chromium Equation (1) was taken as the base mathematic equation in this study, combining chemical composition (Equation (2)) and forging temperature (Equation (3)) [6,7] as key simulation parameters.
EδF = ECr + ET
ECr represents chemical components and ET denotes the temperature equivalents. Equation (2) [6,7] below was applied to simulate shrinkage styles and ferrite formation in steel forming process.
where the K coefficient varies with respect to different contents of carbon: C > 2%, K = 65; C < 2%, K = 88.
TL = 2619 − K (%C) − 8 (%Si) − 5 (%Mn) − 30 (%P) − 25 (%S) − 1.7 (%Al) − 5 (%Cu) − 1.5 (%Cr) − 4 (%Ni) − 2 (%V) − 1 (%W) − 1.7 (%Co) − 12,8 (%Zr) − 7 (%Nb) − 3 (%Ta) − 14 (%Ti) − 14 (%As) − 10 (%Sn) − 1.59 (%Cr) + 0.007 (%Cr)2
Based on the formula developed by Garyc [6] and the combination of dynamic thermal measurement of the melting temperature of 0Cr17Ni4Cu4Nb steel, the solidus was determined by Equation (3) [6,7], that is:
Ts = 2619 − [415.5 (%C) + 12.3 (%Si) + 6.8 (%Mn) + 124.5 (%P) + 183.9 (%S) + 4.3 (%Ni) + 1.4 (%Cr) + 4.1 (%Al)]
The chemical composition of 0Cr17Ni4Cu4Nb, listed in Table 1 below, was used as parameters to compute liduidus and solidus values. The Bulletin of the Seismological Society of America (BSSA) verified the chemical (corrosion) analysis method going through spectrographic procedures and was used to quantitatively determine the composition of 0Crl7Ni4Cu4Nb stainless steel.
2.2. Microscopic Examination of Morphology, Distribution and Density of Ferrite
The examined steel samples were Φ10 mm polished cylinders with a length of 30 mm. Sample slices were repeatedly polished to 0.1 mm in thickness, then corroded with ferric chloride and hydrochloric acid solution previously to quantify ferrite content in the sections under the microscope. Microstructures of sample slices were examined by light optical microscopy (LOM). The gold phase method was used to determine the region of interest by superimposing the mesh on the image under the metallographic microscope. The number of targets or the total number of test points were divided by the number of grids, and the average value was taken as the result. The final results were the average value of the N monitoring field.
3. Results
3.1. Ferrite Formation in Steel Was Associated with Mushy Zone Temperature
The intrinsic liquidus and solidus temperatures of seven steels, different in chemical composition, were measured and the difference between liquidus (TL) and solidus (TS), named mushy zone temperature (TL−Ts), were calculated as shown in Figure 1 and Table 2 and Table 3. The international grades of the examined steels were listed in Table 4. For estimations of liquidus and solidus temperature in stainless steels, both the thermodynamic chemical potential error (CPE) equations with IDS data [8] and CPE equations with Thermo-Calc data (TC) were used, as described by Howe and Mettinen [8,9]. The mushy zone temperature gradually decreased in the order of stainless steel 0Crl7Ni4Cu4Nb > P91 > H13 > 42CrMo in correlation with the decreases of Cr and Cu content, while the mushy zone was decreased in correspondence to the increase of C content in all the examined steels. Notably, there was an observable difference in the mushy zone temperature between P91 and H13, though the Fe content in each of the stainless steels are almost same (89% vs. 89.995%), while Cr: Fe and C:Fe in P91 were higher than those in H13, inferring that both ratios could be the dependent variables of the steel mushy zone temperature. Further analyses found that Cr:Fe and C:Fe ratios (Table 2 and Table 3, Figure 2 and Figure 3) were closely correlated to the mushy zone temperatures of all the examined stainless steels in trend. The observation implied that ratios of certain chemical components, such as Cr:Fe and C:Fe ratios, could play an important role to determine the mushy zone temperature of stainless steel. This phenomenon was not observed in carbon steels.
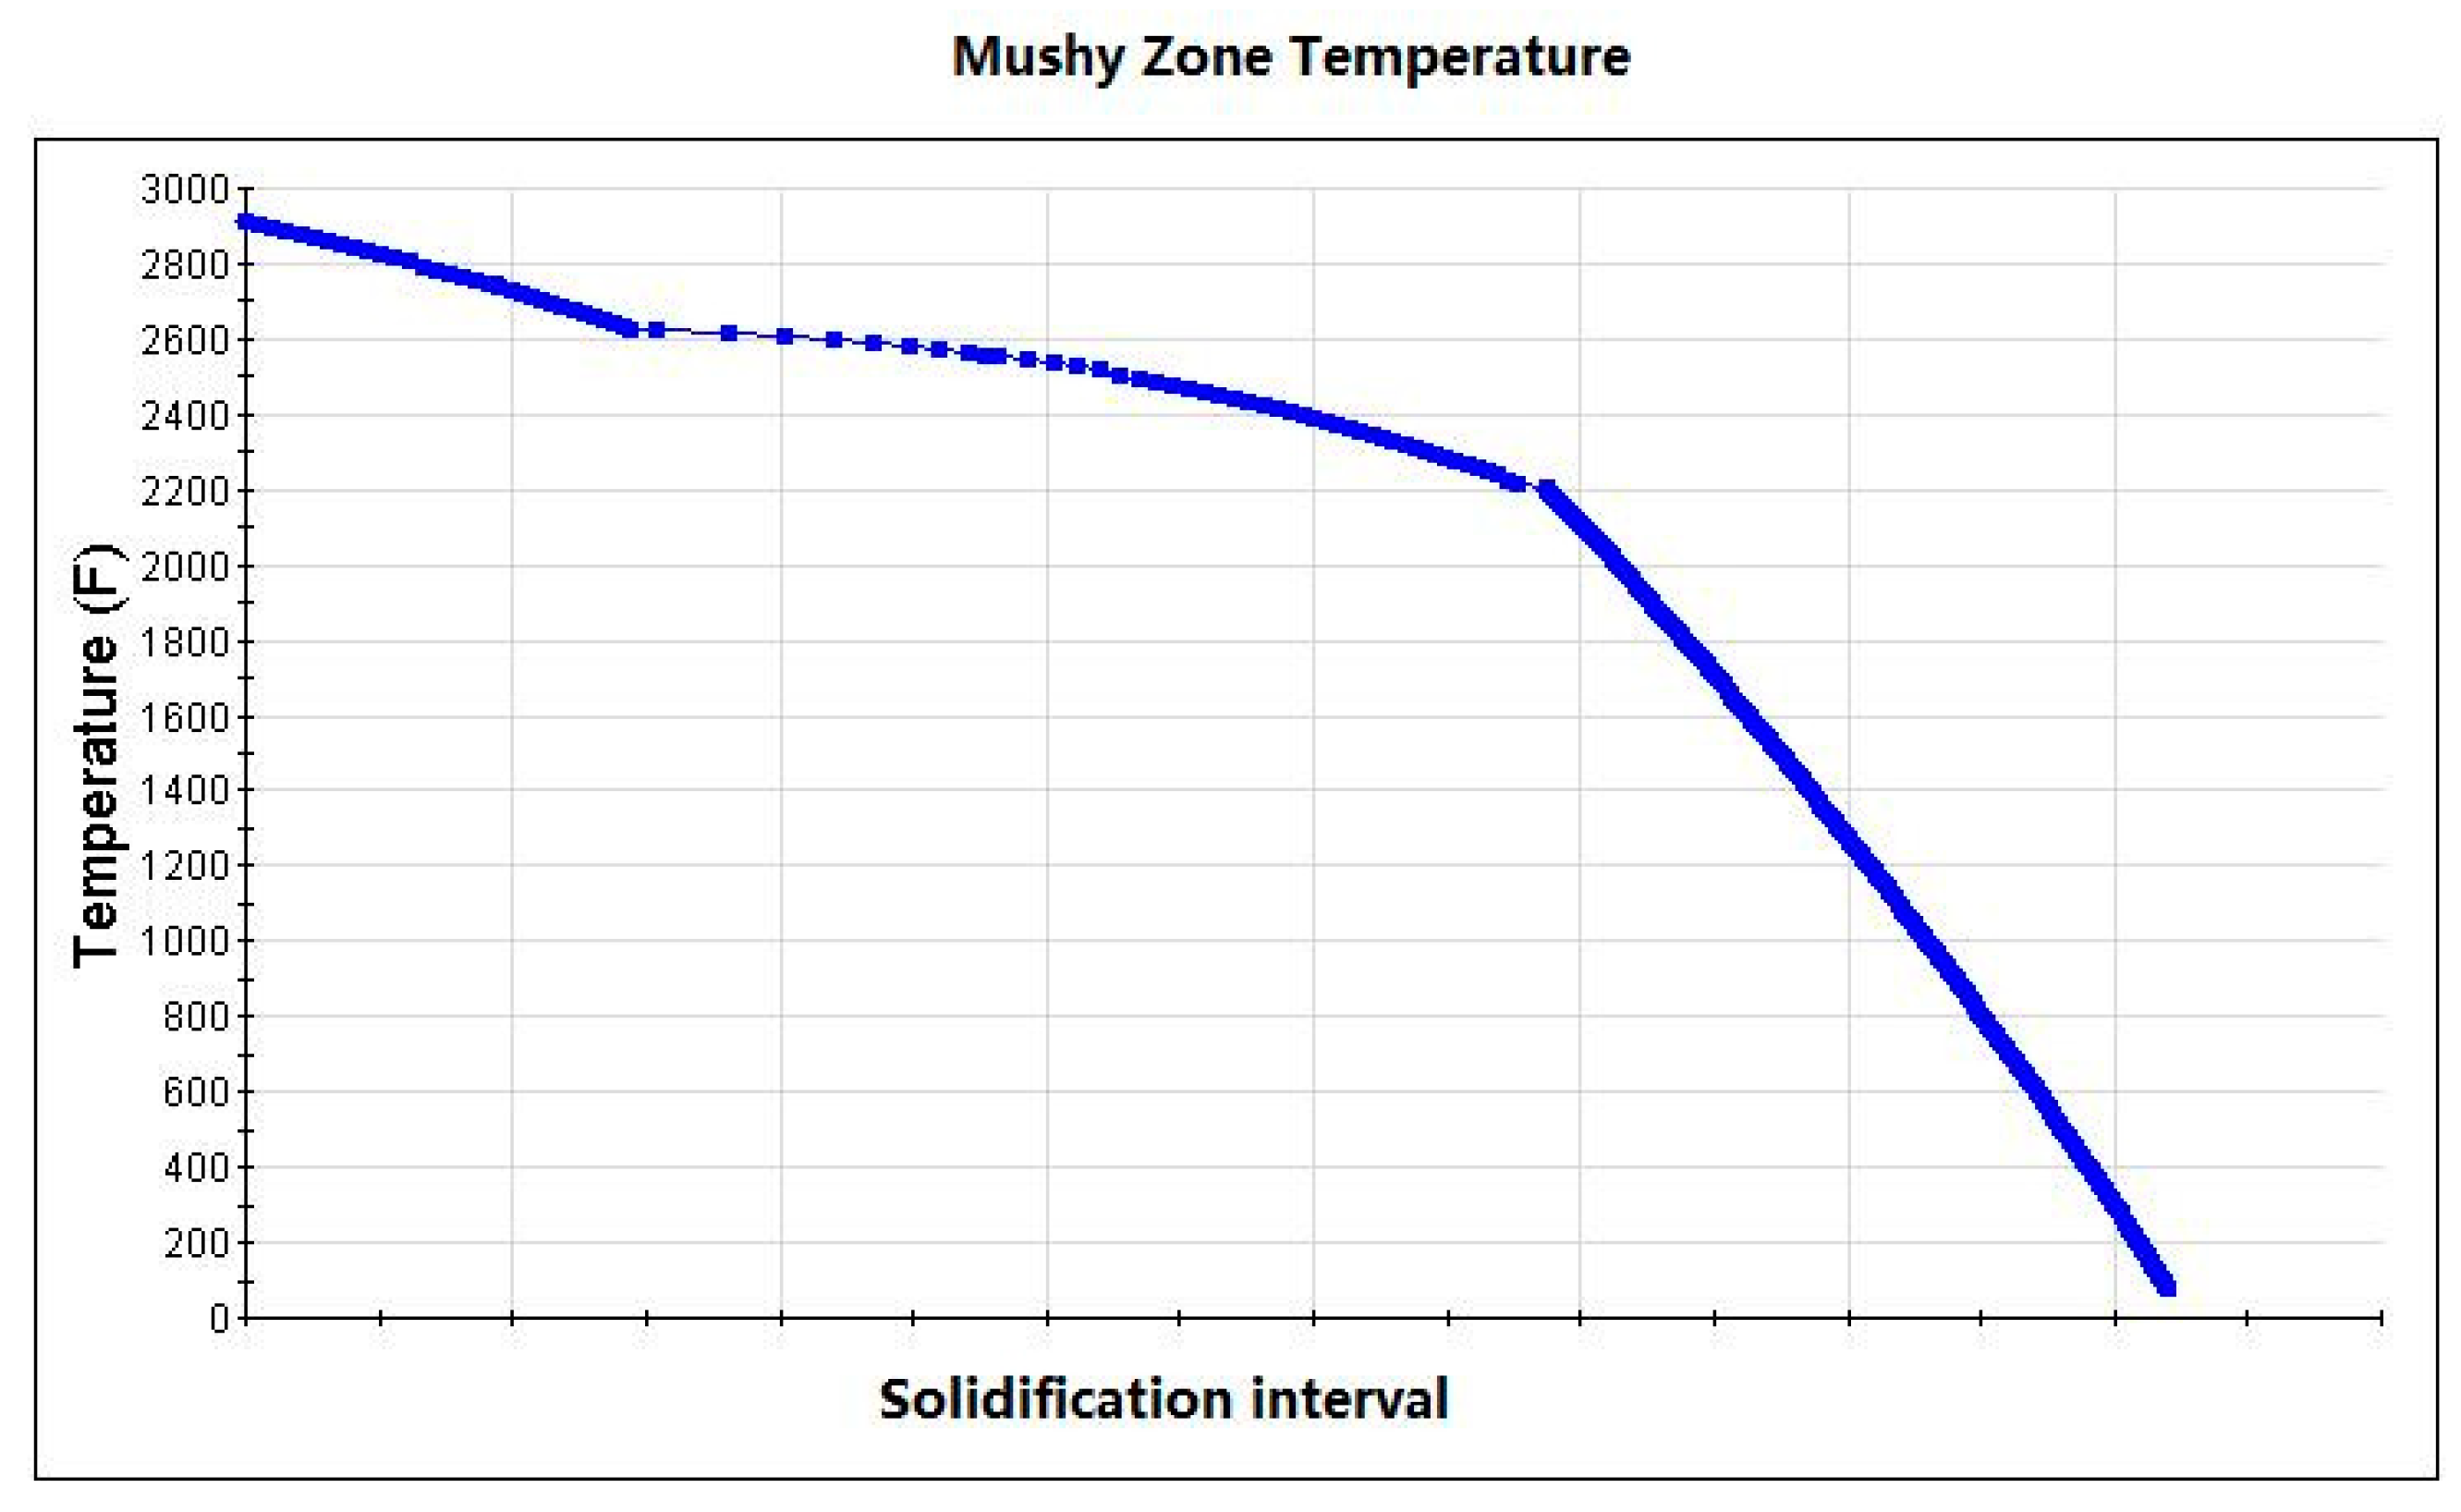
TL and TS of 0Crl7Ni4Cu4Nb were calculated using Equations (2) and (3), and were also described in other studies [6,8,9]. Markedly, the mushy zone temperature of 0Crl7Ni4Cu4Nb is higher than that of all the other examined steels, as shown in Figure 1 below.
As shown in Table 3, Cr:Fe and C:Fe decreased in trend with coefficient between the dependent variables of the mushy zone and Cr:Fe and C:Fe ratios. Based on the observation, we hypothesized that Cr:Fe and C:Fe ratios, rather than the absolute Cr and C contents, could play a more important role to determine mushy zone temperature of a stainless steel.
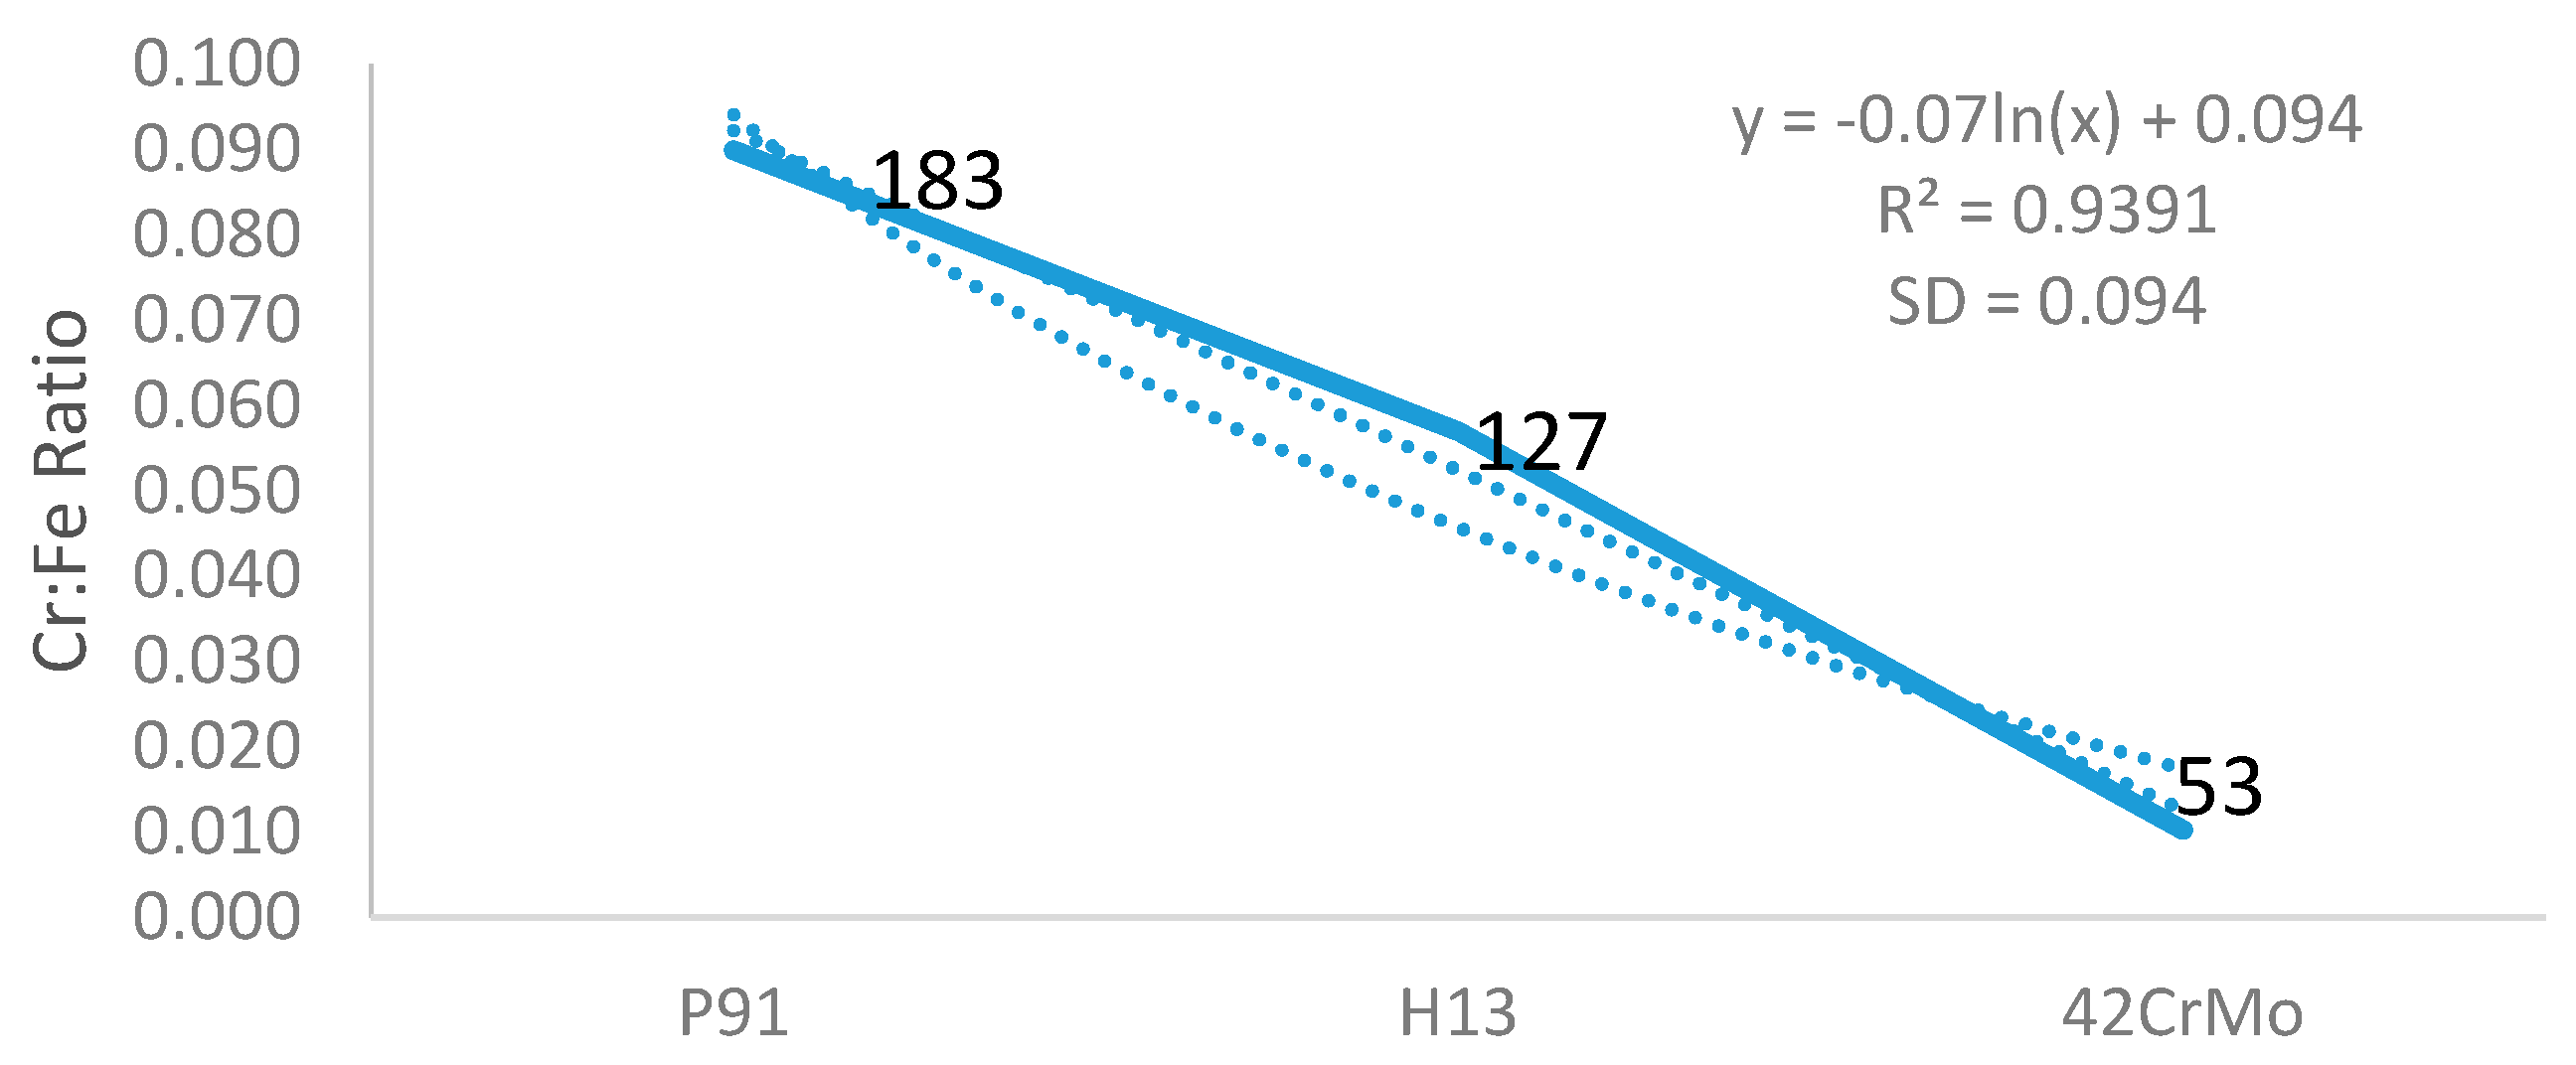
Further analysis found that, as shown in Figure 2, the ratio of Cr:Fe was closely correlated to the mushy zone temperature, and based on that, the coefficient of determination—squared correlation coefficient R2 equals as high as 93.91%. The computational outcome further verified the hypothesis that steel with a higher Cr:Fe ratio could have a relative higher mushy zone temperature.
The mushy zone temperature was also correlated to C:Fe ratio. As shown in Figure 3 below, the squared correlation coefficient R2 is as high as 97.19%, indicating the computational model could provide a measure of how well the mushy zone temperature are replicated, based on a C:Fe proportion. A steel with higher C:Fe ratio could have higher mushy zone temperature potential.
3.2. Ferrite Density and Distribution in Steel Were Correlated with Mushy Zone Temperature
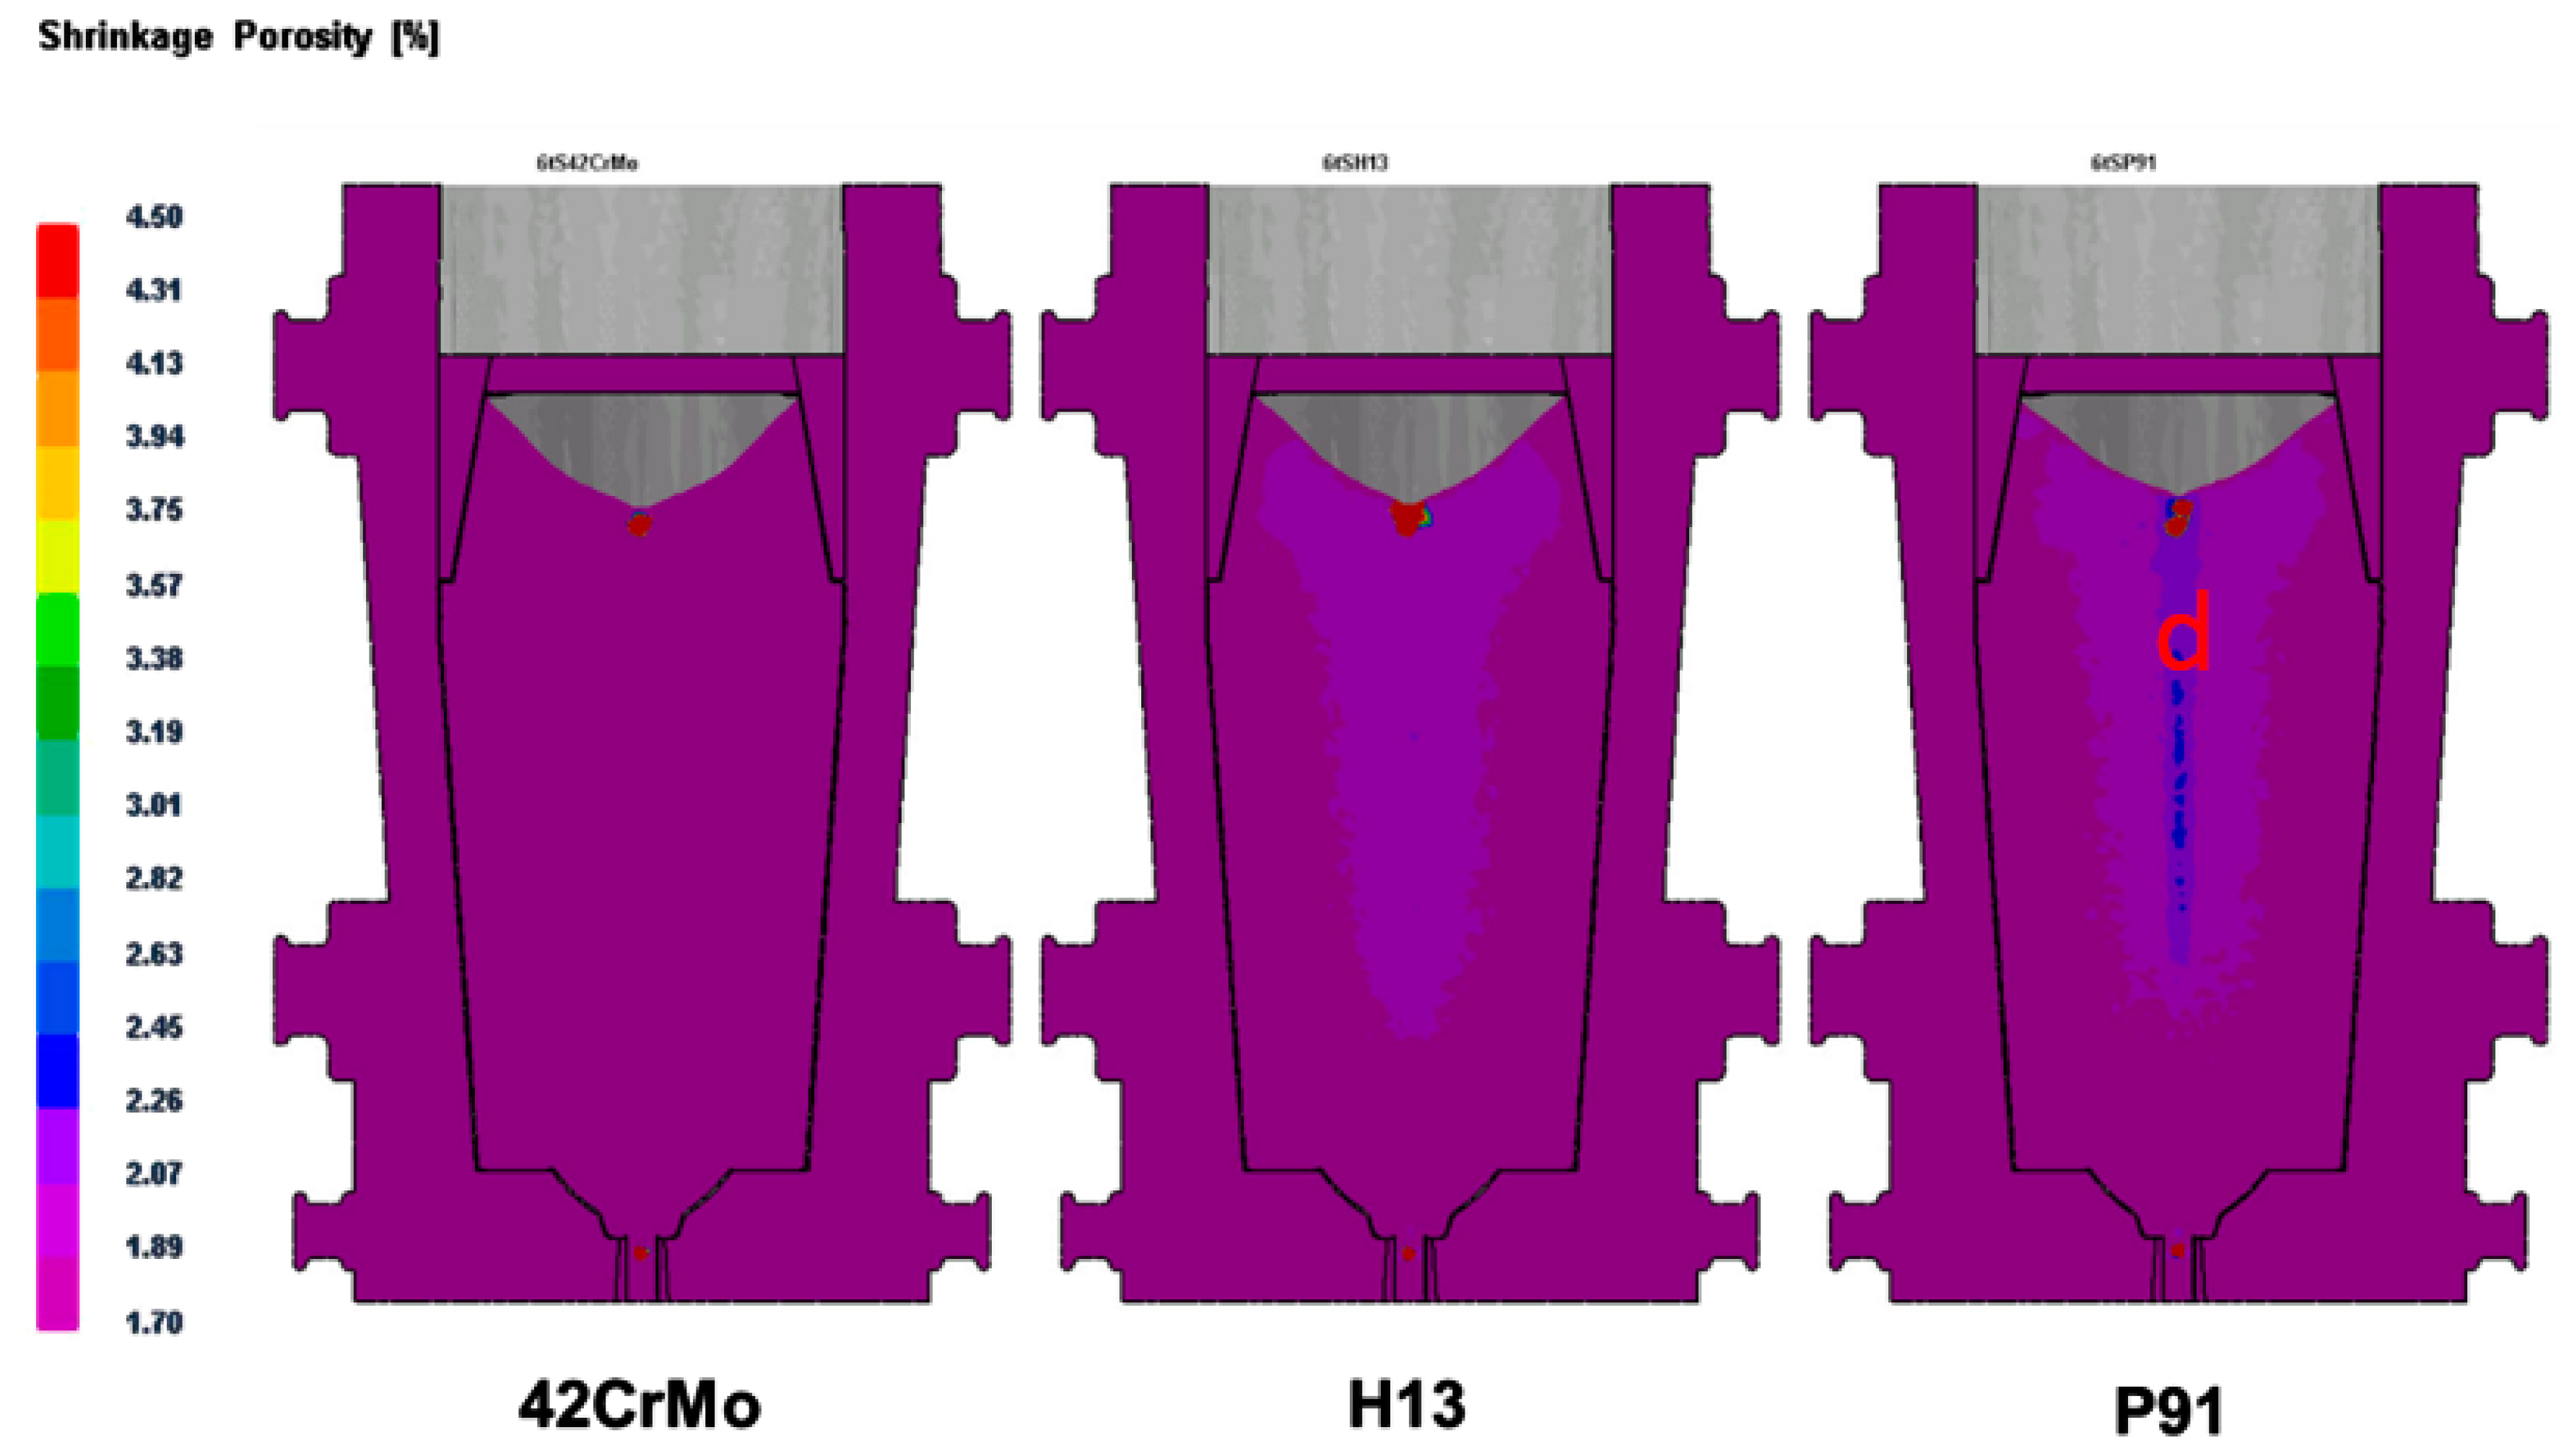
Shrinkage styles of steel ingot forming were simulated with different mushy zone temperatures using Anycasting software. The shrinkage zone, labeled “d” in P91, was also named as a ferrite band, for ferrite forming generally occurs in the zone. As shown in Figure 4, P91 stainless steel with a higher mushy zone temperature was shrunk in the “I” style and resulted in a deep ferrite band (labelled as “d”) in the core region from the riser to tail of the ingot, while H13, the stainless steel with a low mushy zone temperature, was shrunk in a “Y” panache and molded a superficial ferrite band in the central region of riser, not in the tail portion. Almost no ferrite band was formed in 42CrMo, which was the stainless steel with the lowest mushy zone temperature.
Ferrite formation correlating to mushy zone temperature was also demonstrated in the examined high carbon steel as shown in Figure 5. A style between “Y” and “I” was developed in high carbon steel, and formed a deep and wide ferrite band in the central region. No apparent ferrite bands were developed in low carbon steel that was with a low mushy zone temperature.
Figure 5 shows the effect of solidification status in the mushy region of steels with different carbon content on shrinkage porosity and ferrite formation. In high carbon steel, the mushy region is wider and solidified in a U-shape, which was with a large temperature gradient, e.g., a high mushy zone temperature. This shrinkage mode was found to be relatively easier to arouse crystalline rain in the supercooling process and to provoke ferrite formation in the mushy region [7]. While the mushy region in low carbon steel is narrower and solidification forming is carried out in a temperature-gradient-low V mode, which was unfavorable to ferrite formation. Ferrite formation generally occurs in the mushy region during the shrinkage phase [10,11,12].
3.3. Distributions of Ferrite in All the Examined Stainless and Carbon Steel Ingots Were Complied with the Simulated Shrinkage Style and the Central Segregation Concept, except 0Crl7Ni4Cu4Nb Stainless Steel and Fewer Ferrite Was Found in 0Crl7Ni4Cu4Nb
Specimens were collected from the seven steel samples for microstructural characterization by light optical microscopy (LOM). The specimens were mounted in planar view to examine the solidification ferrites, which intersected the sample surface. All specimens were polished to slices in 0.1 mm thickness in hydrochloric acid solution. Samples taken from the surface region, ½ radius zone, and the core region in the risers and tails of stainless steel ingots were examined under LOM.
As shown in Figure 6, photo “a” represented the steel microstructure in the surface zone of P91 ingot riser. Obviously, ferrite content (uneven coarse black banded strips that red arrow lines point on) in the region was fewer than that in the ½ radius zone (Photo “b” and “c”) and the core region (photo “d”) of the ingot. Ferrites in the central region (the labeled “d” region of P91 on Figure 4 as an example) presented as continuous coarse black-banded strips with an increased density. The observed surface area was adjusted to the standard of metallographic determination of the area content of the alpha phase in GB/T13305-2008 austenitic stainless steel [12]. The adjusted ferrite contents in five different fields were averaged and summarized.
Using the same method, the distribution and density of ferrite at surface and the vertical zones were prudently examined in the riser and tail of three 0Cr17Ni4Cu4Nb ingots. Notably, as shown in Table 5 the density of ferrite in all the examined ½ radius regions in riser and tail was less than 5%, showing no statistically significant difference among the external and internal zones relevant to ferrite distribution in all the tested 0Cr17Ni4Cu4Nb samples.
3.4. The Simulated Ferrite Formation Was in Accordance with the Experimental Results That Mushy Zone Temperature Governs the Distribution and Density of Ferrite in Steel Ingot
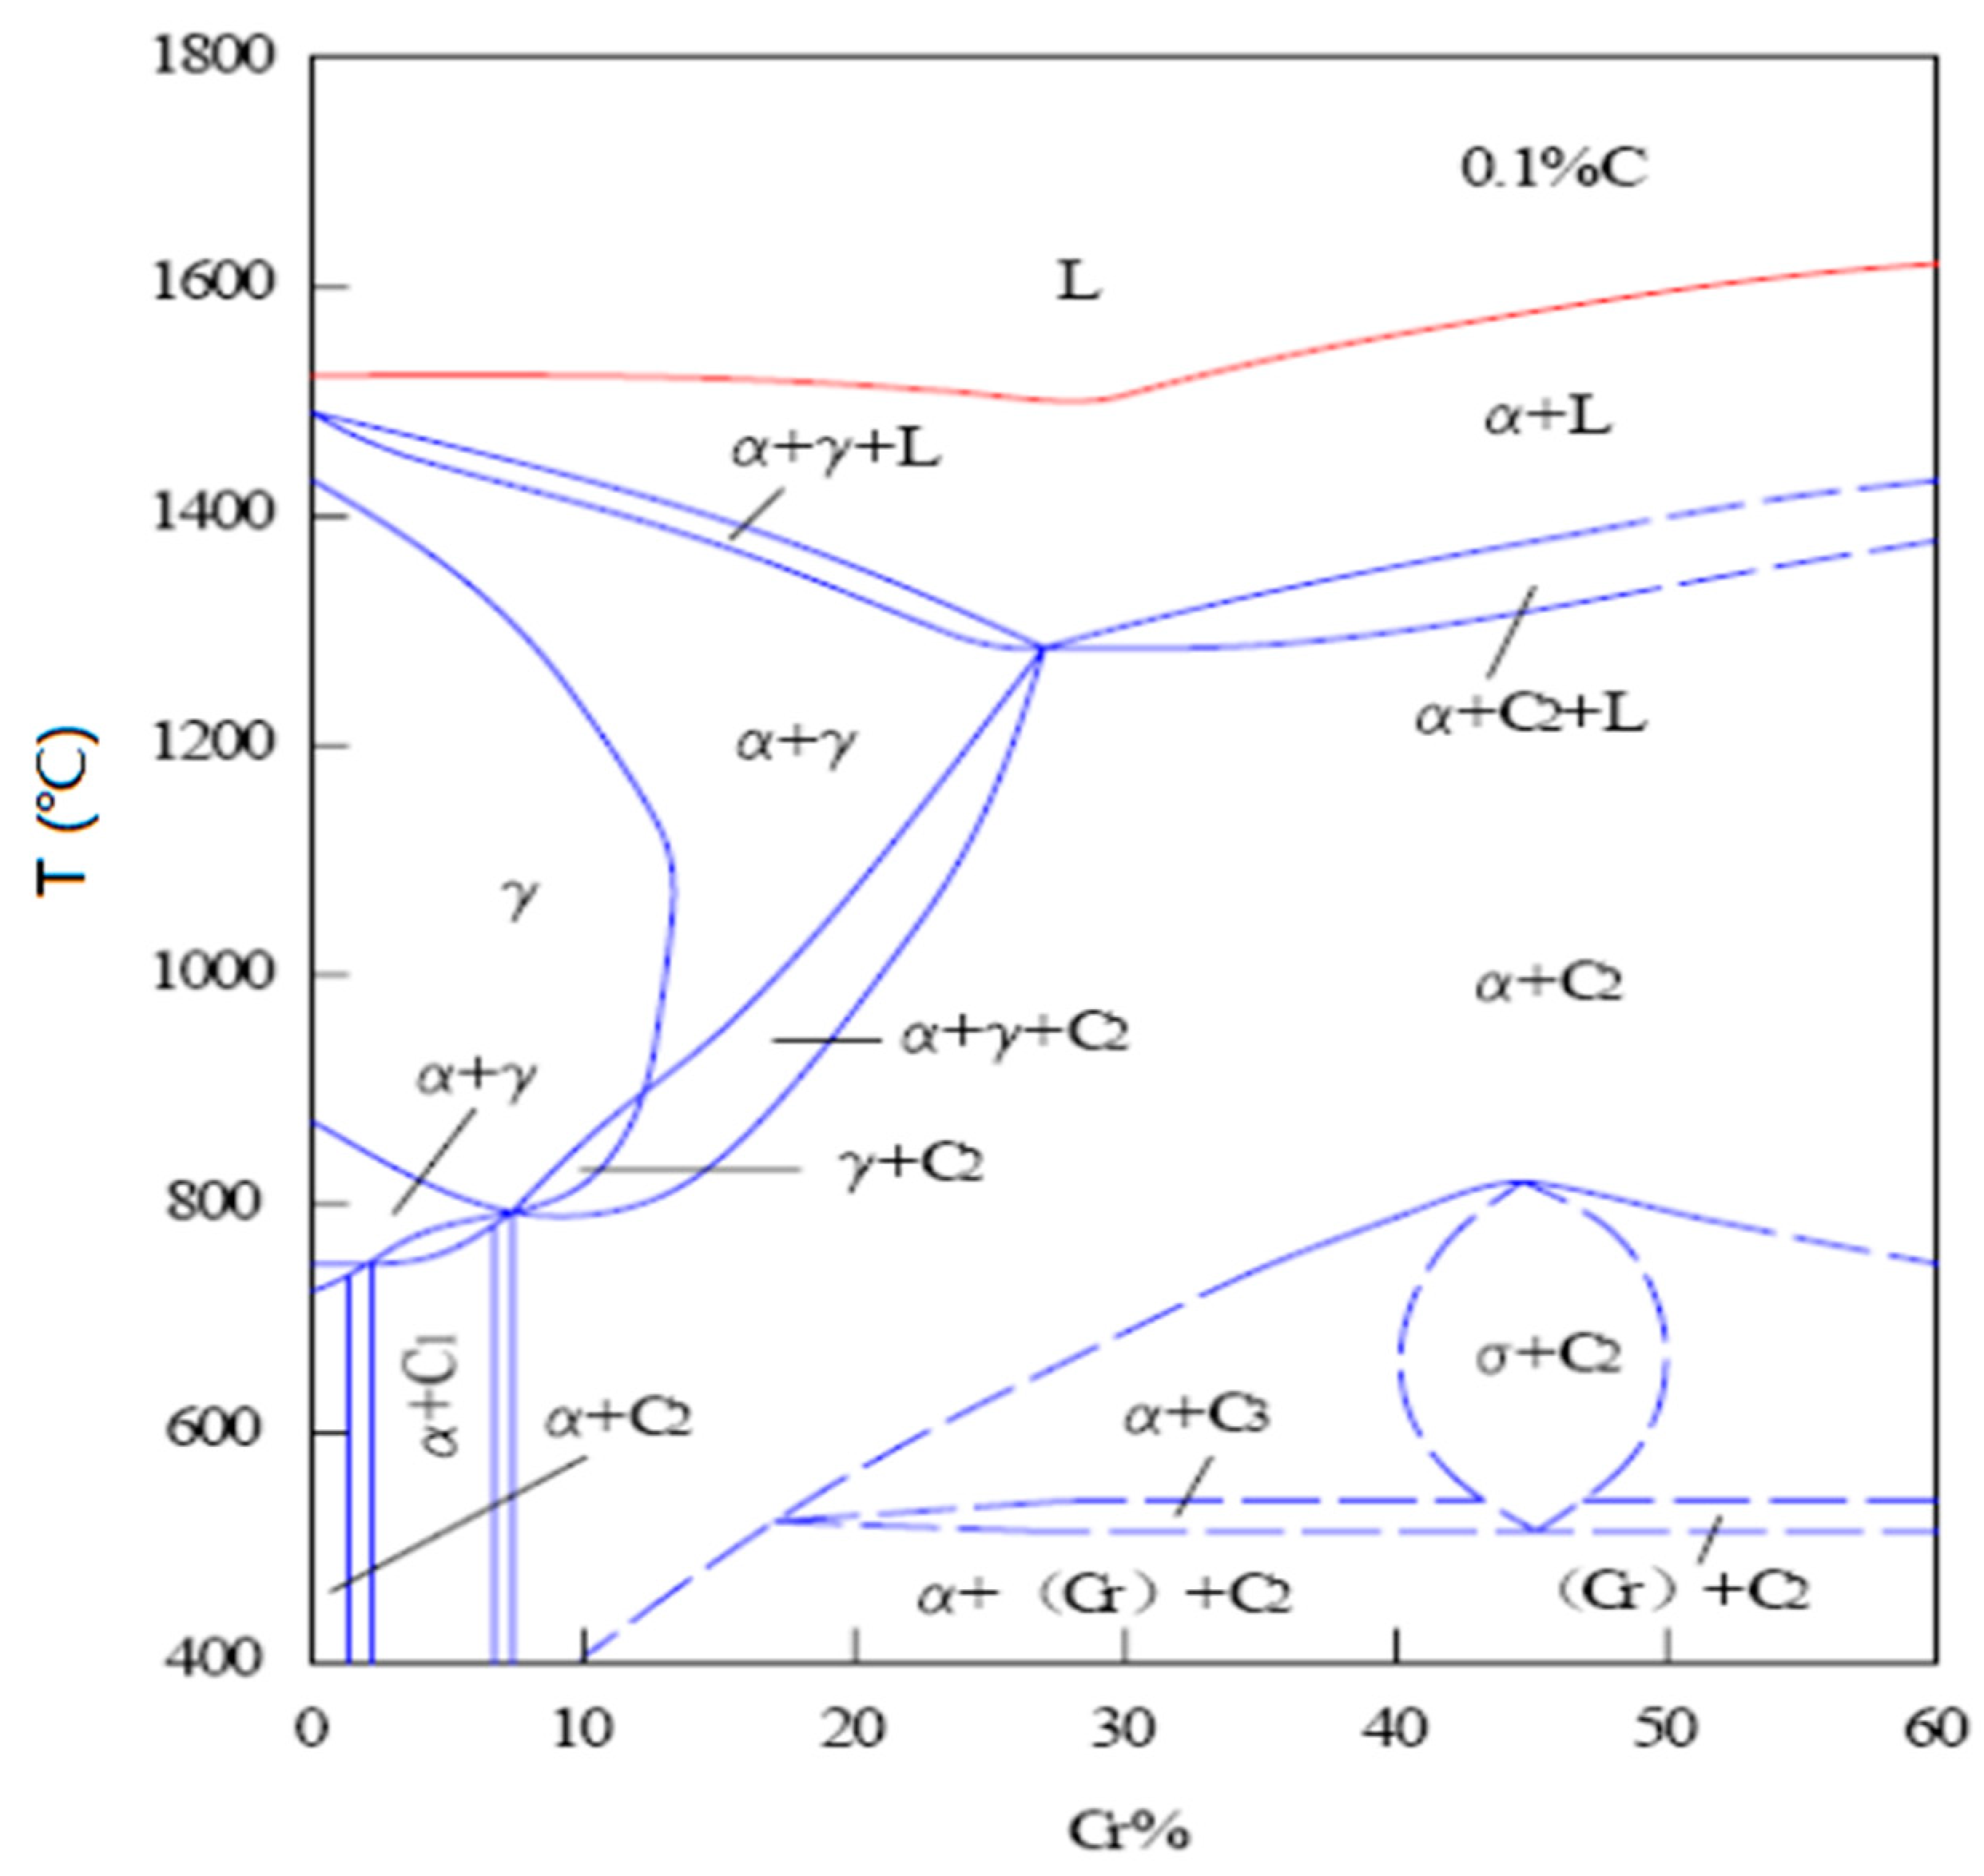
Figure 7 shows the simulated ferrite formation correlating to temperature. The vertical section for the Fe-C-Cr phase diagram with 0.05% C shifted to the biphasic zone of high temperature ferrite and austenite when Cr content was set up at a high range as 17%, and a high heating temperature at 1200 °C. The simulation results were complied with the established conclusion that high Cr (relevant to higher Cr:C, C:Fe and Cr:Fe ratios) and temperature promote ferrite formation.
Ferrite formation in correspondence to temperature was estimated by Equation (4).
ET = [T (°C) − 1150]/80
4. Discussion
Ferrite is the origin of crack initiation and corrosion commencement of steels [10]. Theoretically, minimizing ferrite formation and thickening ferrite-free surface zones has the potential measures to improve the mechanical stability and corrosion resistance of steel. Thus, it is necessary to understand the mechanism of ferrite formation and distribution in the process of steel forming.
The current study investigated the correlation of ferrite formation to chemical composition and the mushy zone temperature (the difference between solidus and liquidus temperatures TL−TS). Ferrite is generally formed at high temperatures [10]. At the beginning of ingot forming, the L to Delta transformation occurs first, then followed by the peritectic transformation to form austenite Gamma. Ferrite is often nucleated and grown up in the material when the processing temperature reaches Delta and Gamma phase or Delta single-phase. It could be retained in the tissue if the formed ferrite was not completely transformed into austenite gamma when cooling [11]. As shown in Figure 6, the morphology, density, and distribution pattern of ferrite in stainless steel P91 were different in the zones away from surface. More ferrite showing as continuous densified banded strips were observed in the core region than in the regions close to surface of ingot. This phenomenon could be attributable to the central segregation propensity of ferrite forming elements, in the solidification process, in addition to the temperature in the core region being higher due to a relatively slower heat exchange compared to the region close to surface.
Previous studies concluded that solidus and liquidus temperatures of a stainless steel were determined by its chemical composition [10,11]. Proper forging temperature relevant to solidus and liquidus temperatures can minimize the secondary ferrite formation and extend ferrite-free surface zone during forging process. Several computational models have been developed for the simulation of ferrite formation in correlation to temperature in stainless steel. Equation (3) is highly reliable in predicting ferrite formation tendency [10,11,12,13,14]. The reliability of Equation (3) was validated with experimental data from several studies tested with various steels. Based on the formula, optimal temperatures for thermal treatment to various steels have been established. For example, the forging temperatures of stainless steel and heat-resistant steel are generally set up below 1180 °C [12], the initial forging and final forging temperatures of 0Cr13, 1Cr13, 2Cr13, and 3Cr13, the GB standard martensite stainless steels being composed of 12–14% Cr, 82–84% Fe, and other trace alloying elements are 1150 °C and 850 °C, respectively [15]; the initial forging and final forging temperatures of 1Cr18Ni9Ti are 1180 °C and 850 °C [16]; the initial forging and final forging temperatures of 2Cr3WMoV are 1150 °C and 800 °C [12,16]. Equation (3) was further validated with C controlled steel, as shown in Figure 7. The simulation result was complied with the established conclusion that high Cr and temperature, and low C promote ferrite formation; in return, the result verified the reliability of Equations (1) and (3) in the prediction of ferrite formation.
Computational programs have been also used to predict ferrite formation in carbon steel precipitation hardening processes [13,14,16]. Those programs took elements referring to chemical composition as simulating parameters, which can predict tendency, but do not quantitatively estimate ferrite formation. The chromium Equation (1) was up-graded to Equations (2)–(4) in considering the numerous ferrite formation affecting factors of chemical composition vs. the mushy zone and forging temperatures. The effect of each element of chemical composition on ferrite formation was expressed in chromium equivalence. The chemical composition elements (Cr, Mo, W, V, Nb, Al, and Si) were considered as factors favorable to ferrite formation, while the austenite forming elements (C, N, Mn, Ni, and Cu) were regarded as inhibitors to the appearance of ferrite. According to the chemical composition of 0Crl7Ni4Cu4Nb steel, Cr equivalent ECr Equation (5), as shown below, was established corresponding to the effective index of each chemical element.
ECr = Cr − 40C − 2Mn − 4Ni + 6Si + 4Mo + 11V − 30N + 1.5W
ECr in Equation (5) was regarded as the simulating index of chemical composition controlling ferrite formation in tapping steel. C, N, and V, as seen in the formula, have greater impacts on ferrite formation, followed by Si, Mo, Ni, and Mn. Cr is the key element attributable to the corrosion resistance of stainless steel, mainly due to its fundamental property against oxidizing medium, such as acidic chloride. The level of Cr content also affects the resistance to intergranular, electrolytic, and the crevice corrosions of steel. Carbon is a harmful element to stainless steel. C and Cr in the steel can form a high Cr carbide of Cr23C6 at 650–850 °C, resulting in Cr-depletion that leads to the decrease of corrosion resistance, particularly the intergranular corrosion resistance of stainless steel [4,5]. Thus, the C content is generally controlled to be at a low level for the optimization of corrosion resistance. However, the inappropriate low level of C content can reduce a single austenite stability and increase the cost of the smelting process. Moreover, carbon is a strong austenite forming element that helps expand and stabilize austenite forming. The potentiality of carbon to austenite forming is about 30 times that of nickel (Ni). Ni is a main austenitic stabilizing element in stainless steel forming. Ferrite content in the solidification structure of Fe alloy steel may be significantly changed by adjusting Ni content and Ni equivalent elements [15]. Cu is the element that can reduce the tendency to the cold hardening phase in steel forming, which improves the hardness and strength, corrosion resistance, plasticity, and cold workability of austenitic stainless steel [15,16]. Theoretically, ferrite could be minimized, or even totally avoided in steel tissue by an attentive control of chemical components within appropriate ranges, based on Equations (2) and (5).
Ferrite could be also formed during the forging process for implementing an inappropriate high temperature in thermal treatment, or an overtime heat preservation procedure [2,3]. Ferrite formation, in correspondence to temperature, was estimated by Equation (4).
The observation of the current study is aligned with the previous reported results that ferrite formation in stainless steels is different among those with dissimilar compositions [2,3,4,5,10,11]. In the study, we found that ferrite formation in steel ingots was highly relevant to the mushy zone temperature. The mushy zone temperature is a critical parameter for the proper adjustment of models (physical or numerical) or in the final stage of applied research of the real process. It indeed represents temperature gradients that significantly affect shrinkage porosity and ferrite formation, as shown in Figure 4 and Figure 5. We hypothesize that a wider mushy zone indicates a higher temperature gradient, which was susceptible to arouse crystalline rain in the supercooling process and provoked ferrite formation. More ferrites were observed in as-cast steels with high mushy zone temperatures, which supports our hypothesis. We found that ratios of Cr:Fe and C:Fe are more correlated to mushy zone temperature, which attracts our attention on the role of Fe, the major chemical content in ferrite formation. Based on our observation, we assume that ratios of Cr:Fe, C:Fe and Cr:C, rather arbitrary Cr and C contents, could be more relevant to ferrite formation in stainless steel, as shown in Figure 2, Figure 3, Figure 4 and Figure 5. Notably, as presented in Table 4, both the distribution pattern and density of ferrite in 0Cr17Ni4Cu4Nb ingot risers and tails were deviated from the phenomenon of central segregation observed in all other examined steels in the study. Moreover, ferrite content was much lower than that in the standard reference steel GB/T8732, although Cr concentration was higher and the mushy zone temperature reached up to the higher level at 222 °C. Bizarrely, fewer ferrite presented in 0Cr17Ni4Cu4Nb tissue, though its mushy zone temperature and Cr content were the highest among the examined steels. The controversial observation on ferrite formation in 0Cr17Ni4Cu4Nb steel remains inexplicable and further studies will be required.
In responding to the inevitable ferrite formation in steels, strategies to improve steel quality should include minimizing ferrite formation and avoiding ferrite accumulation in the steel forming process. The current main-stream study has been focusing on the control of ferrite forming. As an alternative approach to extend the service life of steel, more attention has been attracted to exploit the ferrites existing in steel tissue. A biological metal coating technology developed in Canada is a typical example to take advantage of existing ferrite to improve steel’s corrosion resistance (publication in process).
5. Conclusions
The current study verified previous studies that concluded Cr and high temperature treatment promoted ferrite formation, and ferrites generally gathered in the core region of steel ingot. We further found, in the study, that ferrite formation was highly correlated to the mushy zone temperature, while the mushy zone temperature was closely associated with ratios of Cr:Fe and C:Fe in steel composition. This is the first report to draw attention to the effect of Fe—the key component of steel on ferrite formation in steel. However, the ferrite formation in 0Cr17Ni4Cu4Nb stainless steel was deviated from the verified concept—steel with a high mushy zone temperature would have a greater propensity to ferrite formation. Fewer ferrites in random distributions were observed in the zones of 0Cr17Ni4Cu4Nb steel tissue, though the steel had a high Cr content and mushy zone temperature. We assume that disseminated ferrites had less probability to gather together and trigger local premature cracking, i.e., less crack formation in steel microstructure, thus improving the steel’s mechanical stability. While, the observation remains inexplicable, a few inferences could be drawn from the study: (1) Fe, the major component of steel could impact on ferrite formation through its proportion to other chemical components, such as Cr, Cu, Ni, and C in stainless steels; (2) mushy zone temperature was an important intrinsic factor affecting ferrite formation; and (3) the advantages of 0Crl7Ni4Cu4Nb in corrosion resistance and mechanical stability could arise from the fact that fewer ferrite and no central segregation in ferrite distribution in the steel. Contributions of Ni and Cu to the advantages of 0Crl7Ni4Cu4Nb need to be further studied.
Author Contributions
Conceptualization, F.H., H.Y. and X.C.; Methodology, F.H. and X.C.; Software, F.H. and H.Y.; Validation, H.Y., J.D. and X.C.; Formal Analysis, F.H., J.D. and X.C.; Investigation, X.C. and J.D.; Resources, Xuanda Metal Research Institute.; Data Curation, Xuanda Metal Research Institute.; Writing-Original Draft Preparation, F.H.; Writing—Review & Editing, X.C. and J.D.; Visualization, J.D.; Supervision, X.C.; Project Administration, H.Y. and J.D.; Funding Acquisition, Xuanda Metal Research Institute.
Funding
This research received no external funding.
Acknowledgments
We would acknowledge the imaging lab at Xuanda Metal Research Institute for their kind support in steel specimen preparation.
Conflicts of Interest
The authors declare no conflict of interest. The funders had no role in the design of the study; in the collection, analyses, or interpretation of data; in the writing of the manuscript, and in the decision to publish the results.
References
- Metalinfo, Eagle International Software. Available online: https://www.metalinfo.com (accessed on 11 March 2017).
- Shoushtari, M.R.T.; Moayed, M.H.; Davoodi, A. Post-weld heat treatment influence on galvanic corrosion of GTAW of 17-4PH stainless steel in 3.5% NaCl. Corros. Eng. Sci. Technol. 2011, 46, 415–424. [Google Scholar] [CrossRef]
- Ibrahim, O.H.; Ibrahim, I.S.; Khalifa, T.A.F. Effect of Aging on the Toughness of Austenitic and Duplex Stainless Steel Weldments. J. Mater. Sci. Technol. 2010, 26, 810–816. [Google Scholar] [CrossRef]
- Joly, P.; Cozar, R.; Pineau, A. Effect of crystallographic orientation of austenite on the formation of cleavage cracks in ferrite in an aged duplex stainless steel. Scr. Metall. Mater. 1990, 24, 2235–2240. [Google Scholar] [CrossRef]
- Krielaart, G.P.; Sietsma, J.; van der Zwaag, S. Ferrite formation in Fe-C alloys during austenite decomposition under non-equilibrium interface conditions. Mater. Sci. Eng. A 1997, 237, 216–223. [Google Scholar] [CrossRef] [Green Version]
- Gryc, K.; Smetana, B.; Tkadlečková, M.; Žaludová, M.; Michalek, K.; Socha, L.; Dobrovská, J.; Janiszewski, K.; Machovčák, P. Determination of solidus and liquidus temperatures for s34mnv steel grade by thermal analysis and calculations. Metalurgija 2014, 53, 295–298. [Google Scholar]
- Zhou, R.; Zhang, H.; Tang, L. Xi’an Thermal Power Research Institute Co Technical Report (Number: TPRI/TN-RB-126-2008); Xi’an Thermal Power Research Institute Co., Ltd.: Xi’an, China, 2008; pp. 34–36. [Google Scholar]
- Miettinen, J.; Howe, A.A. Estimation of liquidus temperatures for steels using thermodynamic approach. Ironmak. Steelmak. 2000, 27, 212–227. [Google Scholar] [CrossRef]
- Mettinen, J. Solidification Analysis Package IDS for Steels—User Manual of DOS Version; Report TKK-MK-11; Laboratory of Metallurgy, Helsinki University of Technology: Espoo, Finland, 1977. [Google Scholar]
- Thomas, B.G.; B1imacombe, J.K.; Samarasekera, I.V. The Formation of Panel Cracks in Steel Ingots: A State-of-the-Art Review. ISS Trans. 1986, 7, 7–20. [Google Scholar]
- DuPont, J.N. Microstructural Development and Solidification Cracking Susceptibility of a Stabilized Stainless Steel. Weld. Res. Suppl. 1999, 78, 253-s–263-s. [Google Scholar]
- GB 5310-2008 Seamless Steel Tube for High Pressure Boiler, People 2019s Republic of China National Standard, 2008; p. 24. Available online: http://www.steels-supplier.com/steel-standard/gb-5310-seamless-boiler-pipe.html. (accessed on 11 March 2017).
- De Angelis, F. A comparative analysis of linear and nonlinear kinematic hardening rules in computational elastoplasticity. Technische Mechanik 2012, 32, 164–173. [Google Scholar]
- De Angelis, F.; Taylor, R. Numerical algorithms for plasticity models with nonlinear kinematic hardening. In Proceedings of the 11th World Congress on Computational Mechanics (WCCM ’14), Barcelona, Spain, July 2014. [Google Scholar]
- China’s Electrical Power Sector, Environmental Protection and Sustainable Trade—IISD. DL/T 438 Thermal Power Plant Metal Technology Supervision Regulation, People’s Republic of China Electric Power Industry Standard, Released in 2009. Available online: https://www.iisd.org/pdf/2010/china_power_sector_sd.pdf. (accessed on 11 March 2017).
- Ryu, S.H.; Yu, J. A new equation for the Cr equivalent in 9 to 12 pct Cr steels. Metall. Mater. Trans. A 1998, 29A, 1573. [Google Scholar] [CrossRef]
Figure 1.
The simulated liquidum and solidum temperatures of 0Crl7Ni4Cu4Nb.
Figure 2.
Correlation of Cr:Fe to mushy zone temperature.

Figure 3.
Correlation of C:Fe to mushy zone temperature.
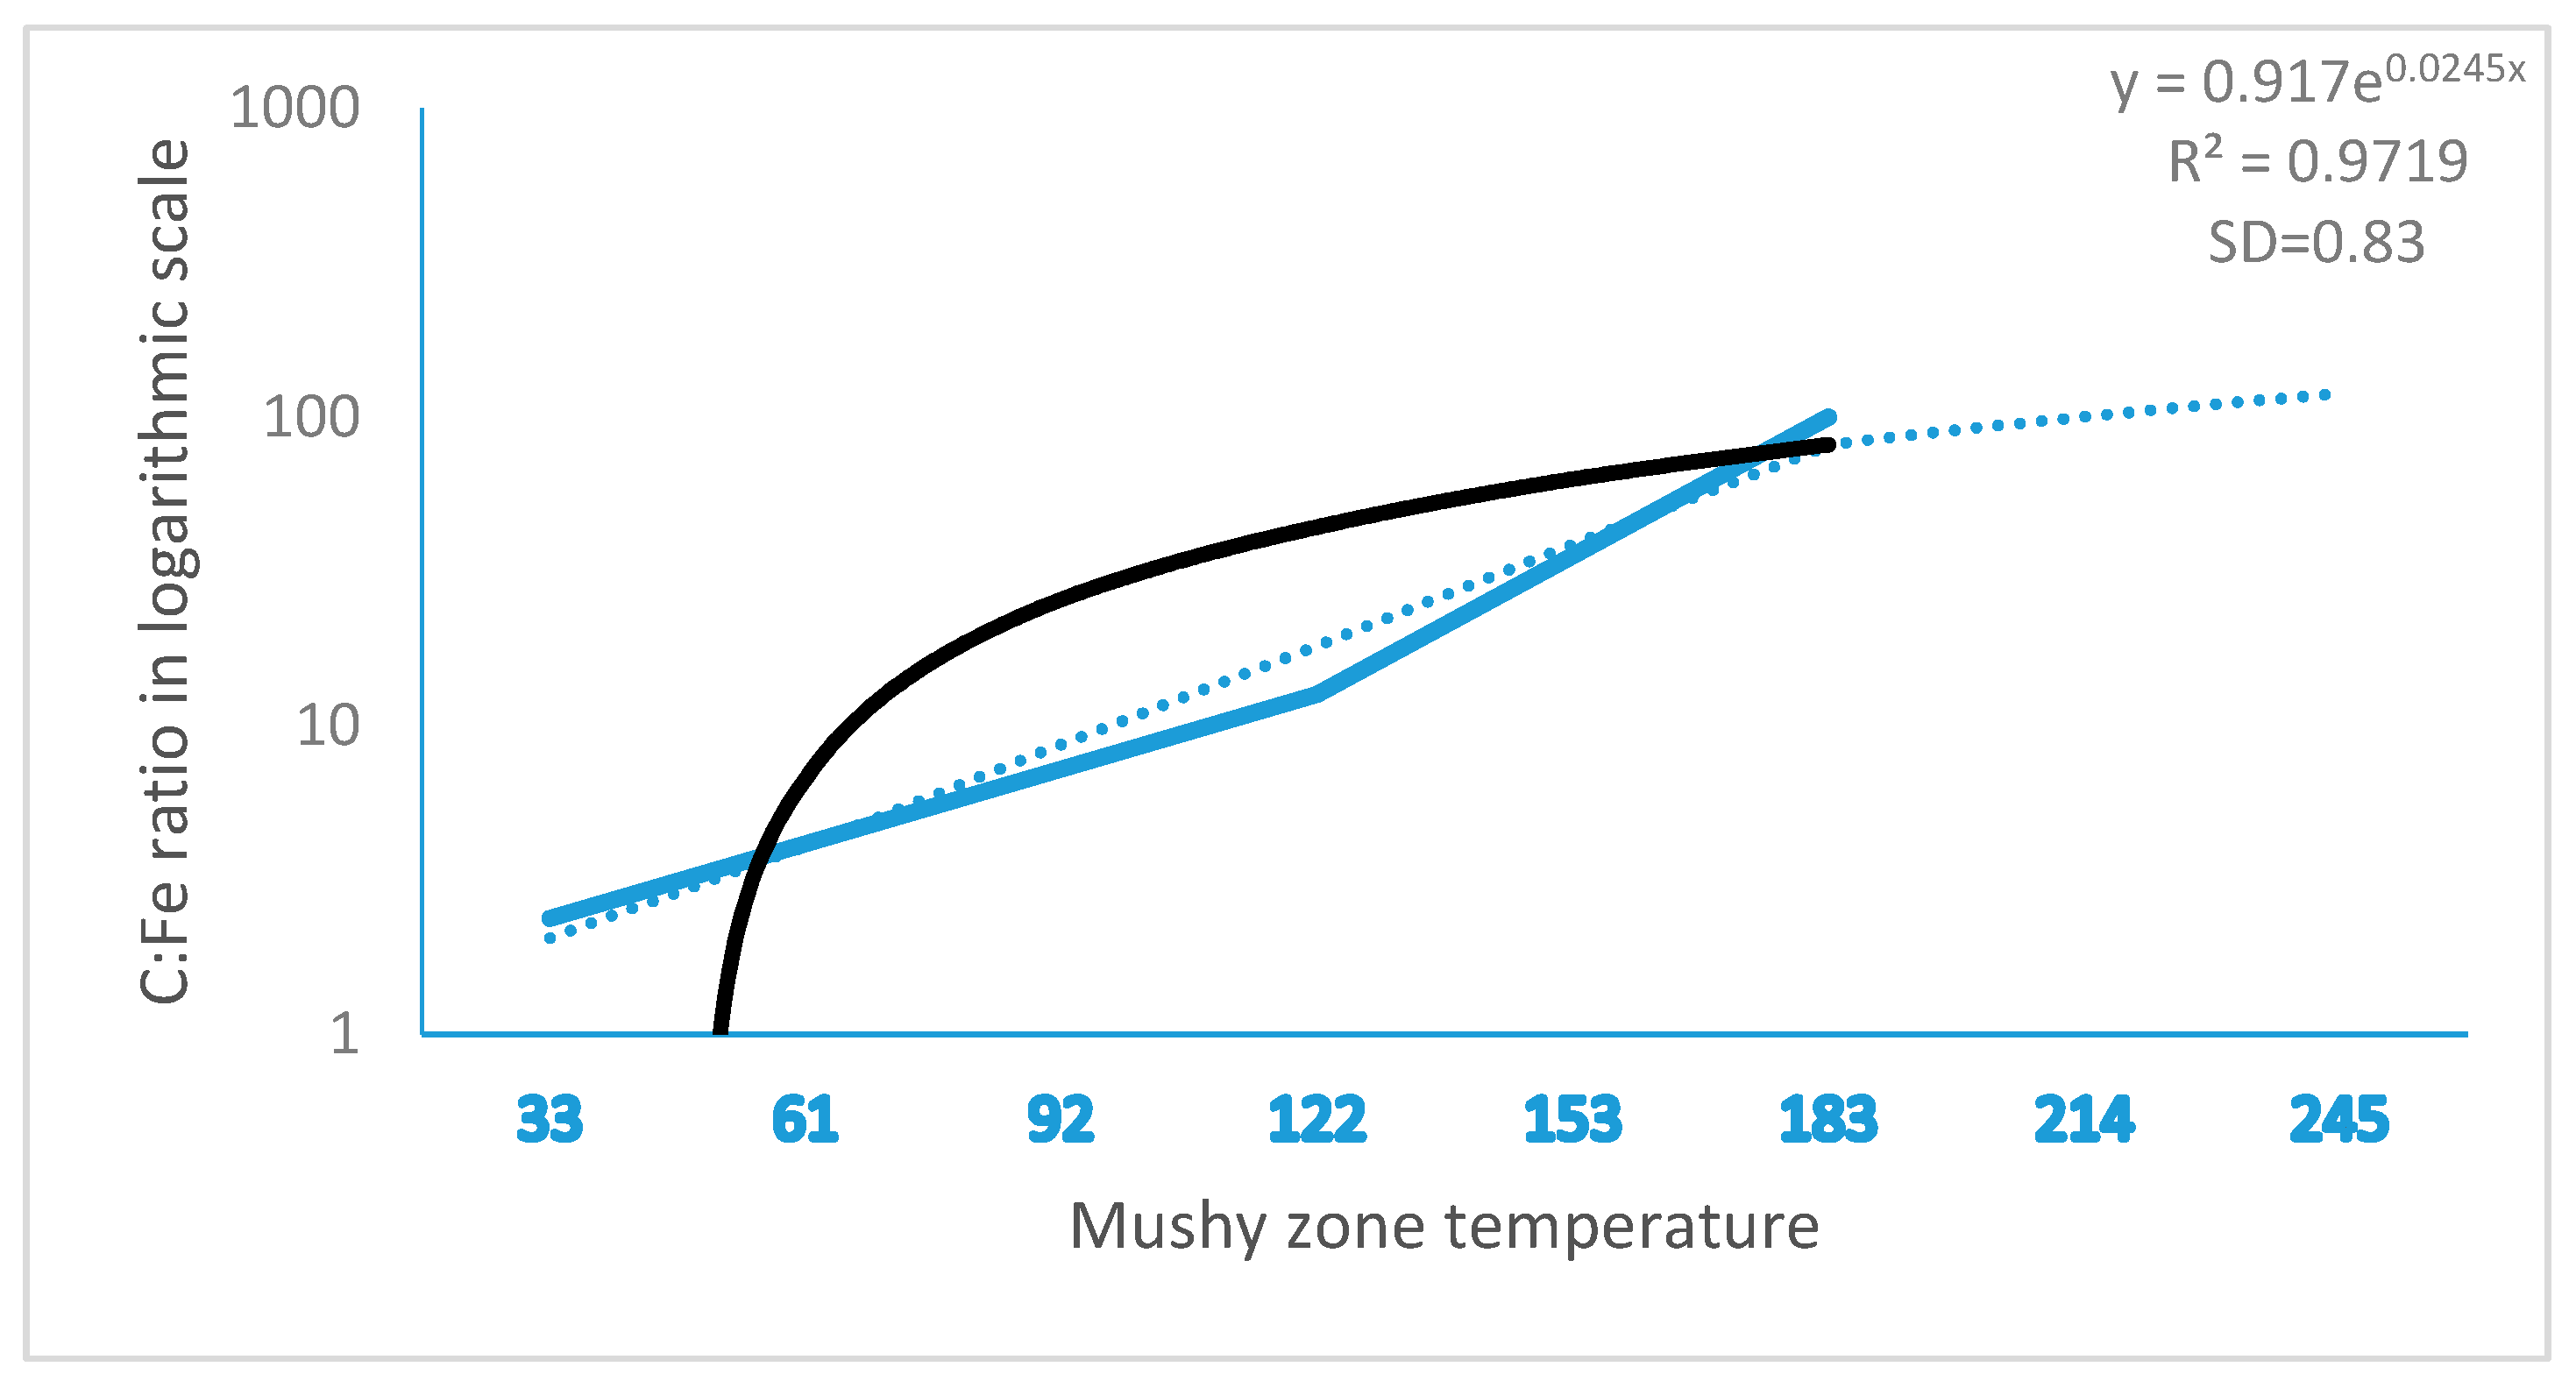
Figure 4.
Simulated ferrite formation in stainless steel ingots with different mushy zone temperatures. “d” represents the shrinkage zone, i.e. ferrite formation band.
Figure 4.
Simulated ferrite formation in stainless steel ingots with different mushy zone temperatures. “d” represents the shrinkage zone, i.e. ferrite formation band.

Figure 5.
Simulation of style of ferrite formation in carbon steels.
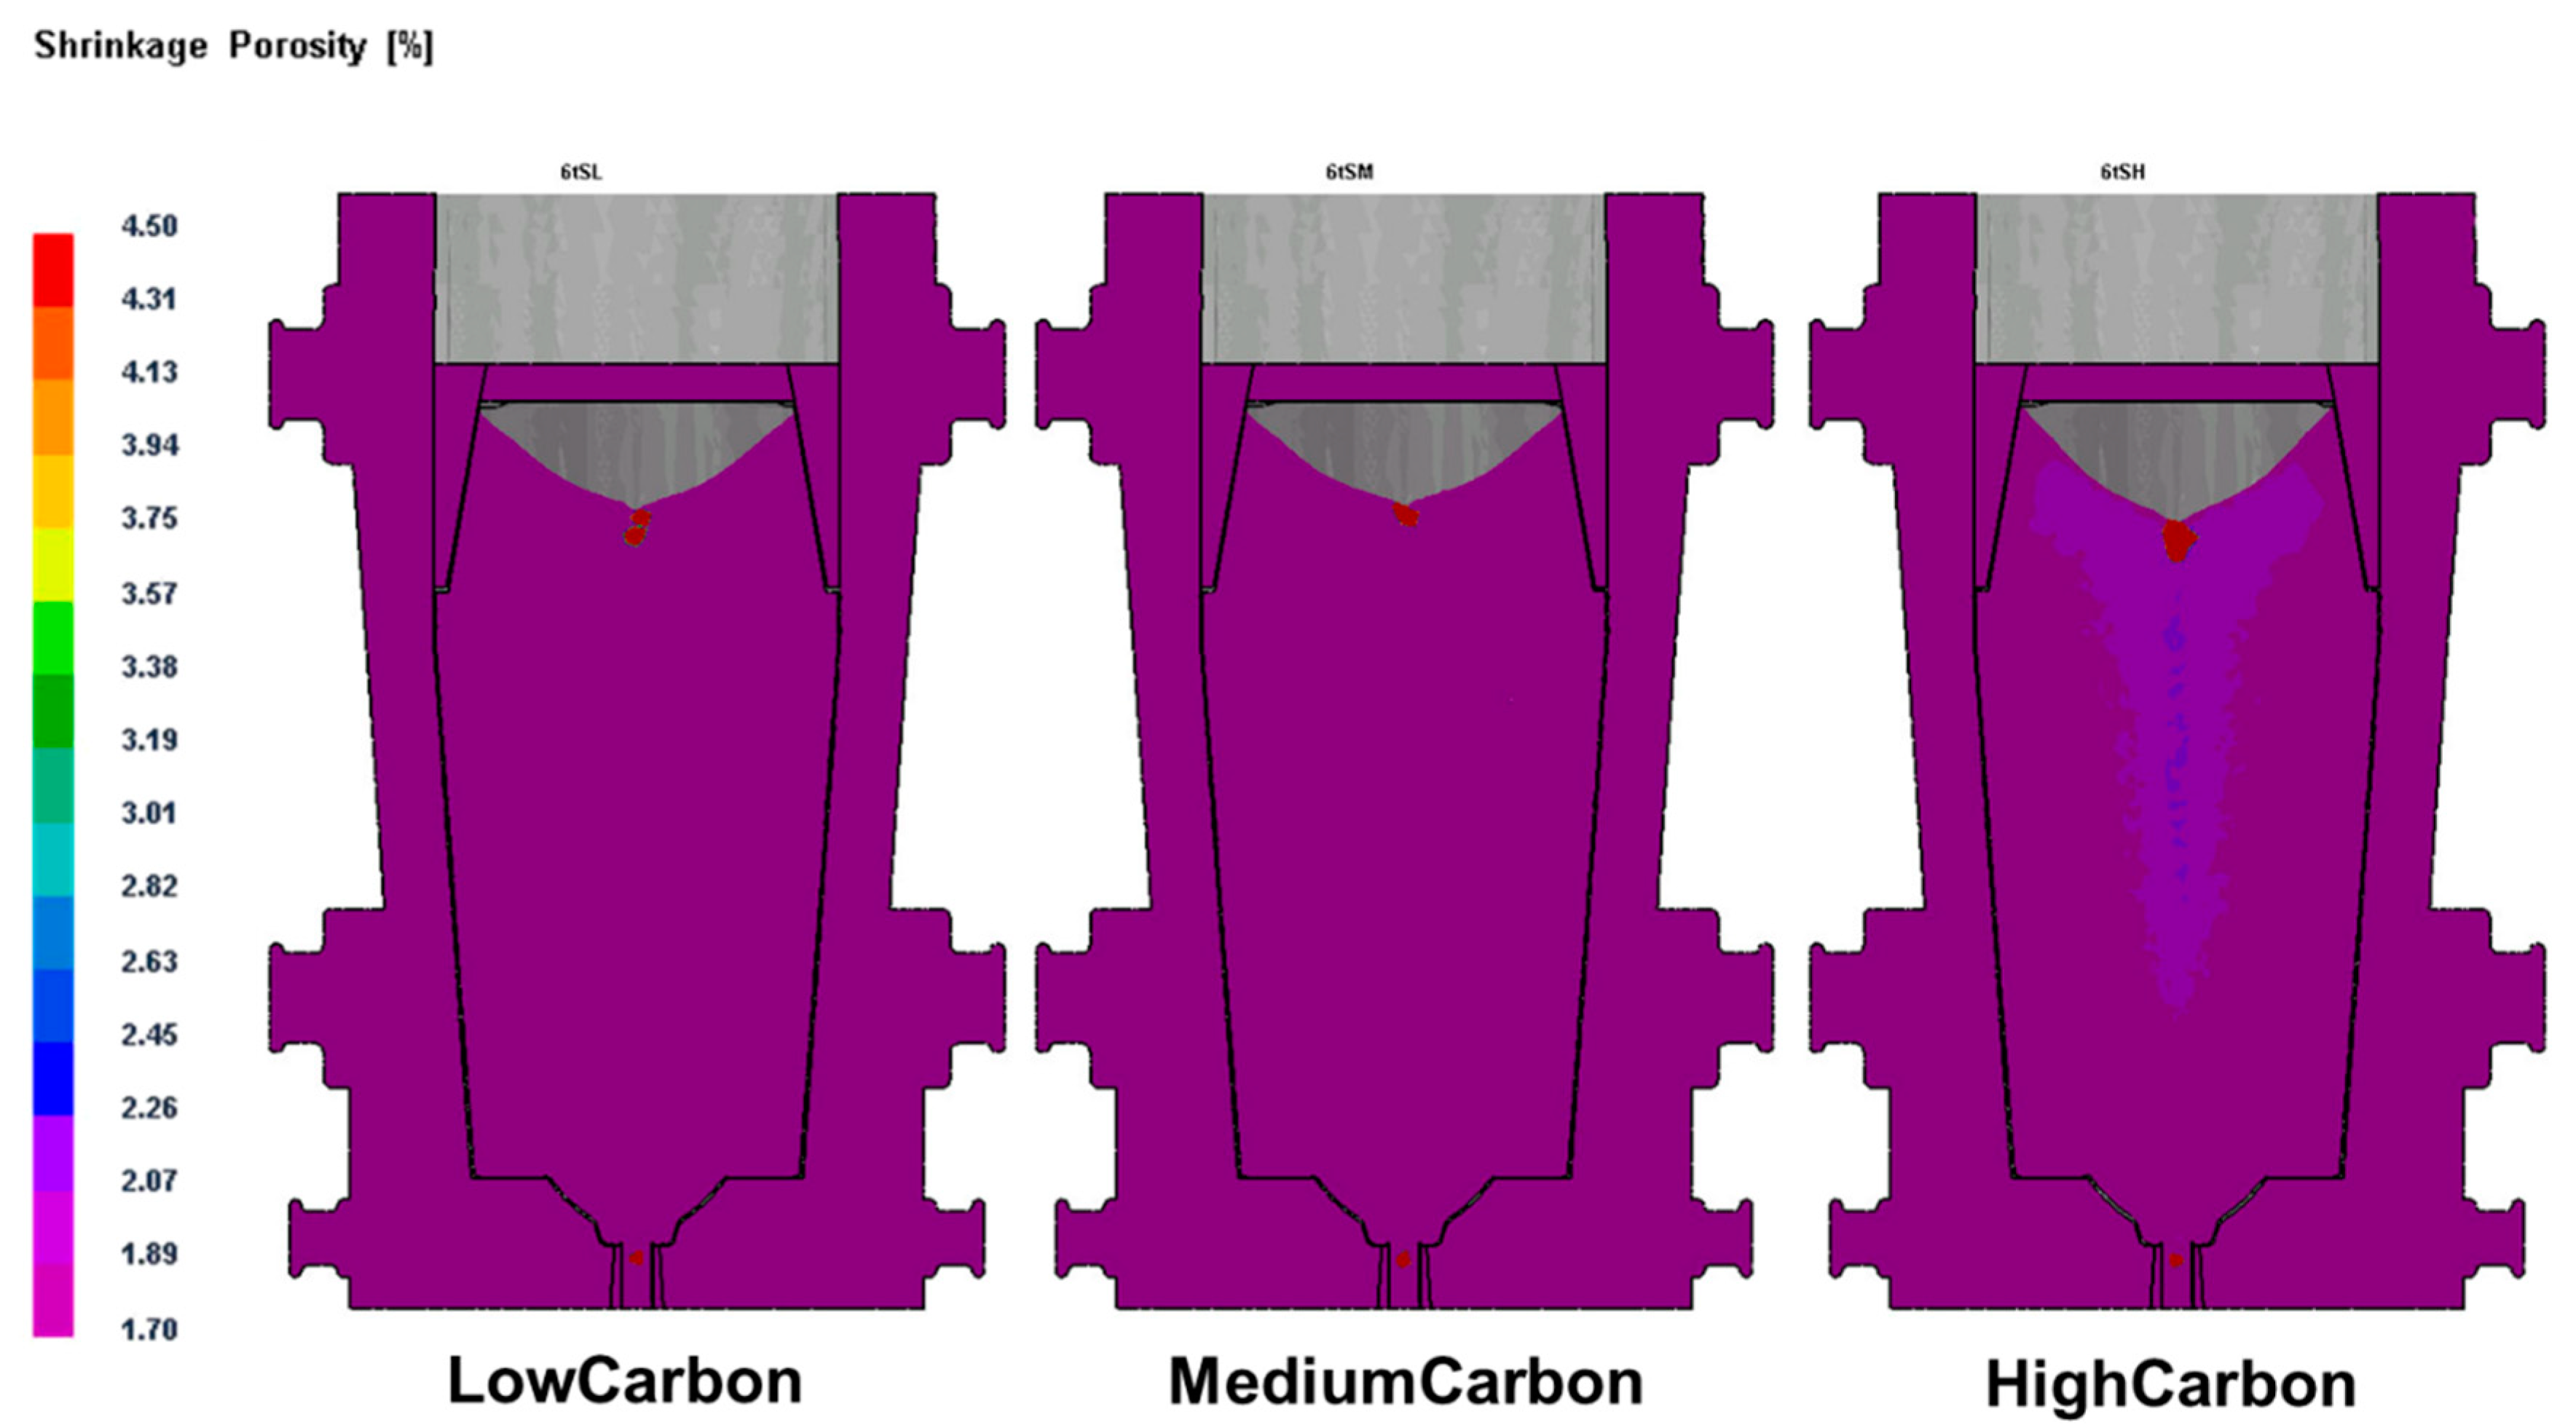
Figure 6.
Distribution, density, and morphology of ferrite in the riser of P91 steel ingot. (a) surface zone; (b) ½ radius zone close to surface zone; (c) ½ radius zone close to core zone; (d) core zone.
Figure 6.
Distribution, density, and morphology of ferrite in the riser of P91 steel ingot. (a) surface zone; (b) ½ radius zone close to surface zone; (c) ½ radius zone close to core zone; (d) core zone.
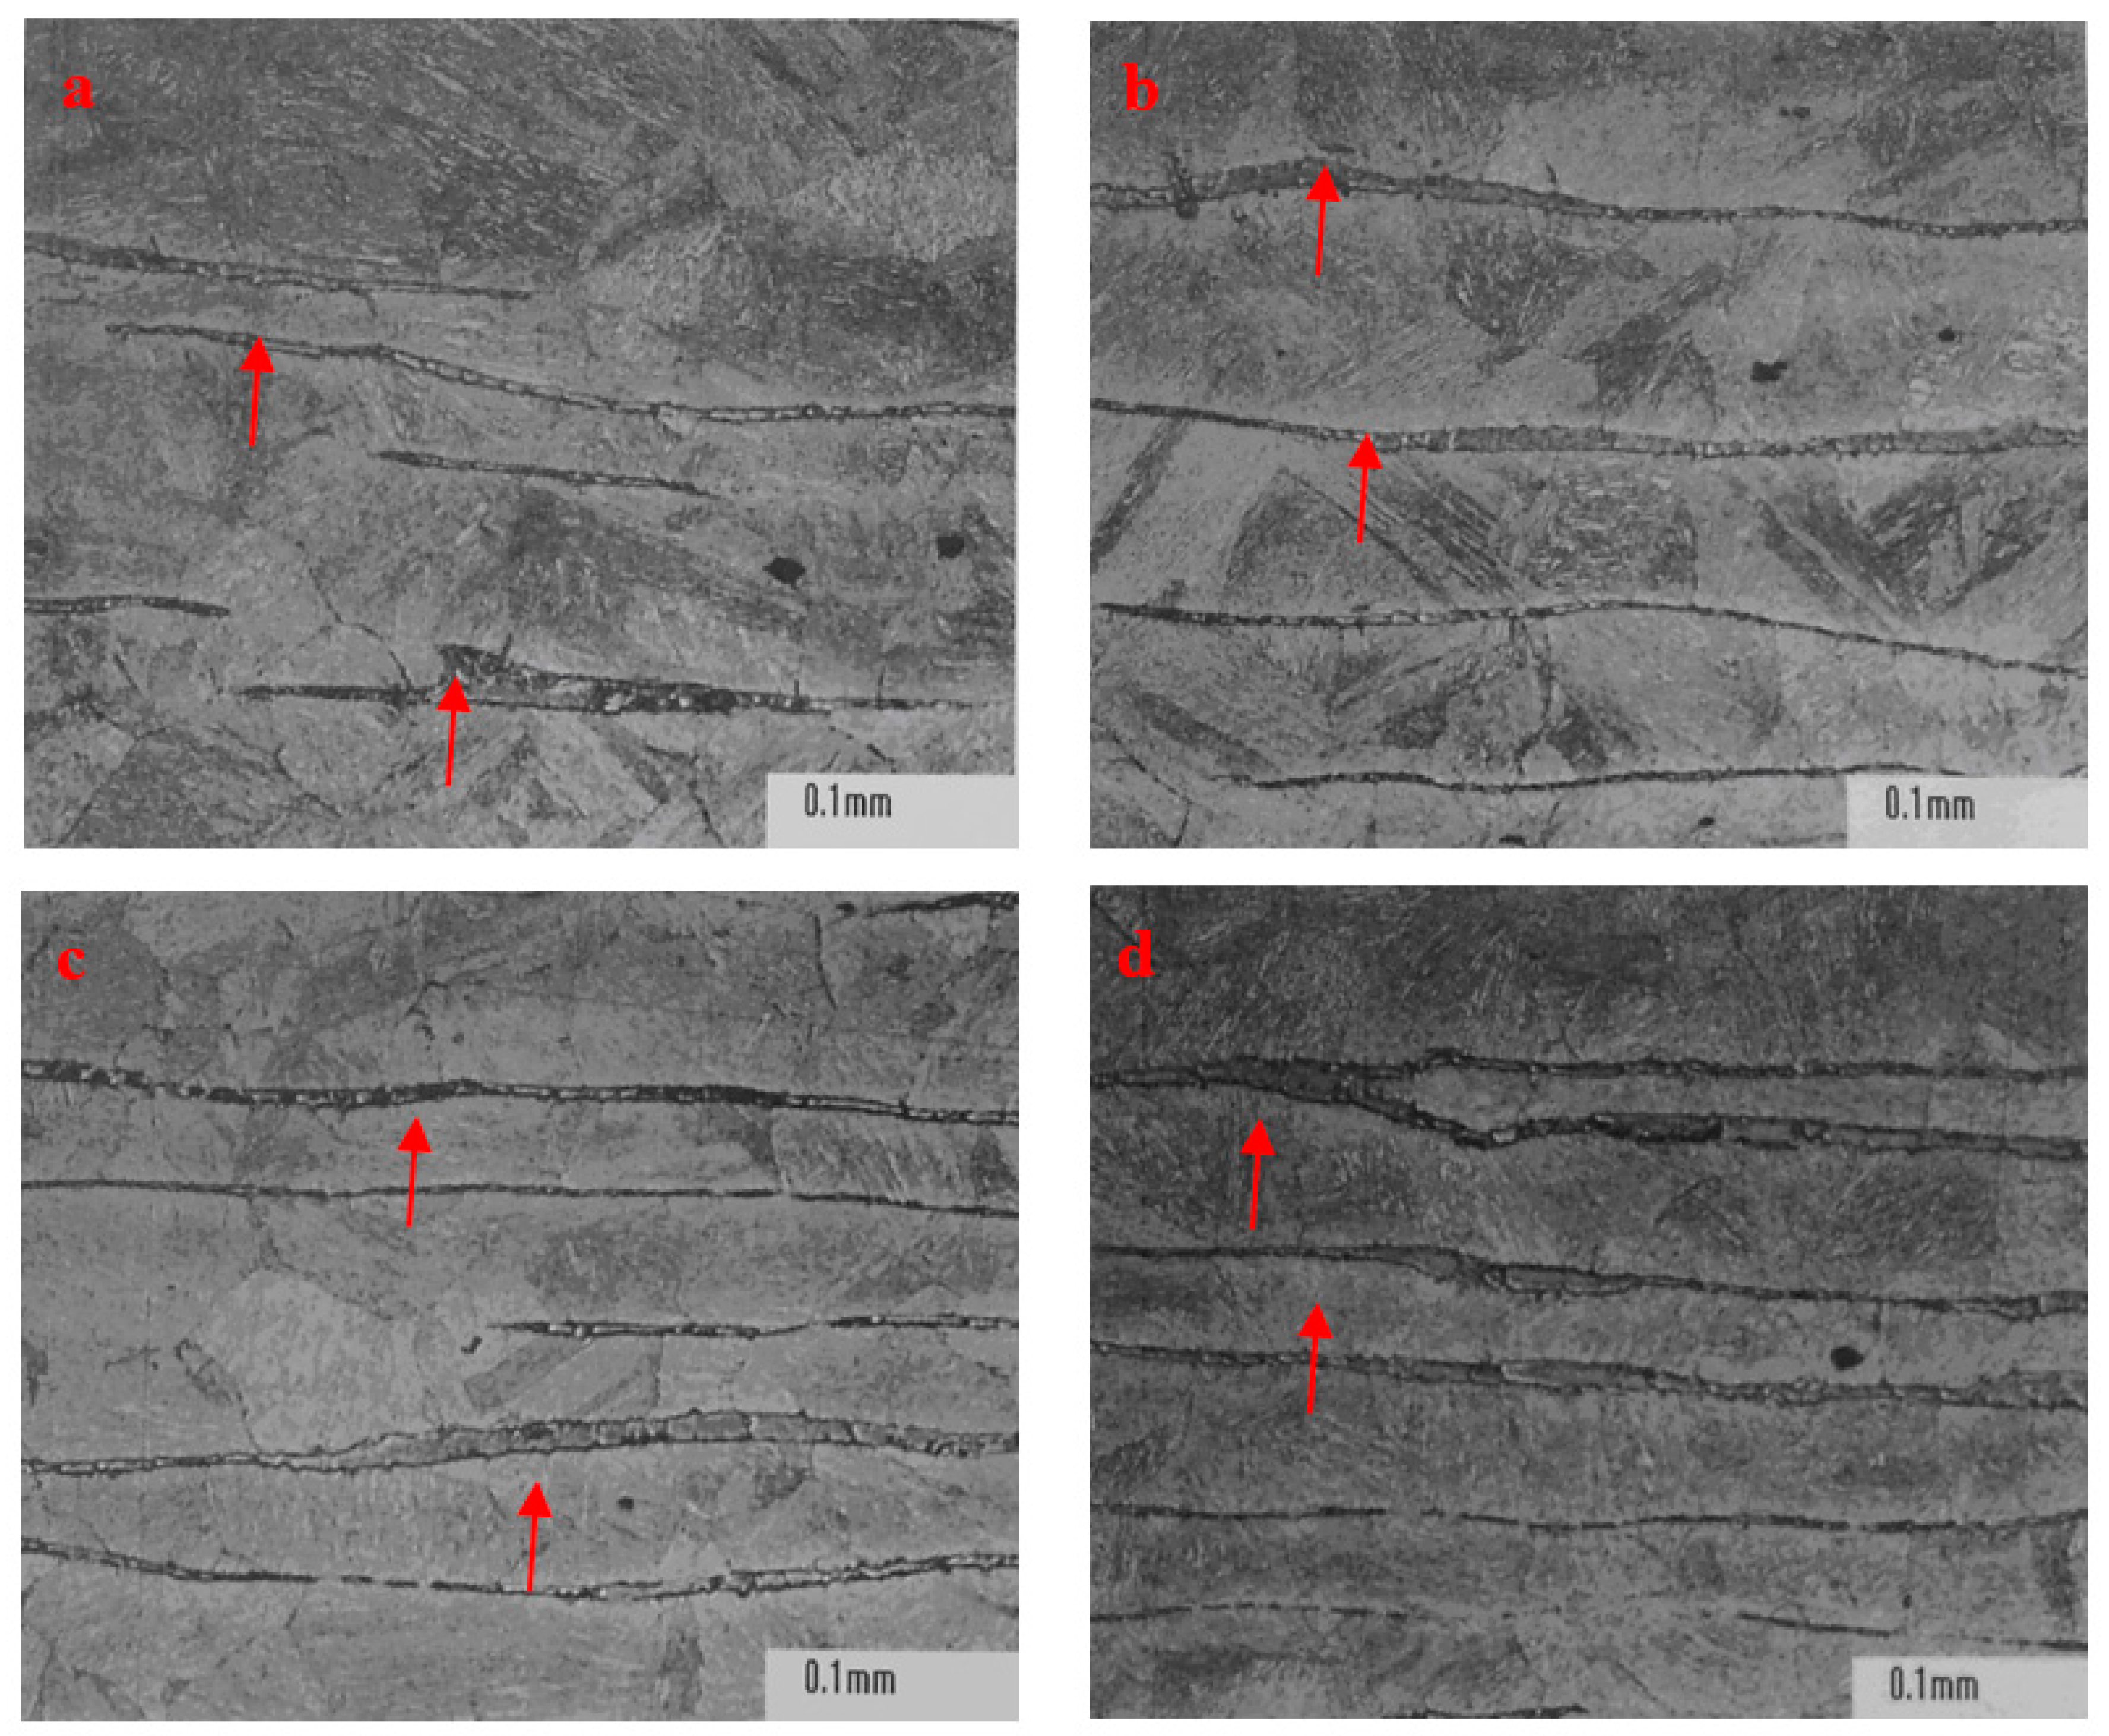
Figure 7.
Vertical section diagram of Fe-C-Cr phase diagram with 0.05% C.

Table 1.
0Cr17Ni4Cu4Nb internal control chemical composition (wt %).
| C | Si | Mn | S | P | Cr |
| ≤0.055 | ≤1.00 | ≤0.50 | ≤0.025 | ≤0.030 | 15.00–16.00 |
| Ni | Cu | Al | Ti | N | Nb + Ta |
| 3.80–4.50 | 3.00–3.70 | ≤0.050 | ≤0.050 | ≤0.050 | 0.15–0.35 |
Table 2.
Correlation of mushy zone to chemical composition of steels.
| Steels | C | Si | Mn | V | Cr | Mo | Ai | N | Nb | Ni | Cu | P | S | Fe | L* | S* | TL−TS |
|---|---|---|---|---|---|---|---|---|---|---|---|---|---|---|---|---|---|
| P91 | 0.08 | 0.2 | 0.3 | 0.18 | 8 | 0.9 | 0 | 0.03 | 0.06 | 0 | 1.25 | 0 | 0 | 89 | 1509 | 1326 | 183 |
| H13 | 0.405 | 1 | 0.35 | 1 | 5.125 | 1.425 | 0 | 0 | 0 | 0 | 0.7 | 0 | 0 | 89.995 | 1472 | 1345 | 127 |
| 42CrMo | 0.42 | 0.25 | 0.7 | 0.05 | 1 | 0.17 | 0.01 | 0 | 0 | 0 | 0 | 0 | 0 | 97.4 | 1493 | 1440 | 53 |
| Low C | 0.08 | 0.08 | 0.31 | 0 | 0.45 | 0 | 0 | 0 | 0 | 0 | 0 | 0.03 | 0.05 | 99 | 1526 | 1446 | 80 |
| Medium C | 0.23 | 0.11 | 0.63 | 0 | 0 | 0 | 0 | 0 | 0 | 0.07 | 0 | 0.034 | 0.034 | 98.892 | 1516 | 1430 | 86 |
| High C | 0.8 | 0.13 | 0.32 | 0 | 0.11 | 0 | 0 | 0 | 0 | 0.13 | 0 | 0.009 | 0.009 | 98.492 | 1473 | 1370 | 103 |
| 0Cr17* | 0.55 | 1 | 0.5 | 0 | 16 | 0.4 | 0.05 | 0.05 | 0.3 | 4.2 | 3.7 | 0.03 | 0.02 | 73.2 | 1427 | 1205 | 222 |
Note: 0Cr17*—0Crl7Ni4Cu4Nb; L*—liquidum; S*—solidum; TL−TS: L*−S*.
Table 3.
Correlation of mushy zone to Cr:Fe, C:Fe, and Cr:C ratio.
| Steels | Cr:Fe | C:Fe | Cr:C | Cu:C | TL−TS |
|---|---|---|---|---|---|
| 0Cr17 | 0.219 | 0.051 | 29 | 6.73 | 222 |
| P91 | 0.090 | 0.014 | 100.000 | 15.625 | 183 |
| H13 | 0.057 | 0.008 | 12.654 | 1.728 | 127 |
| 42CrMo | 0.010 | 0.000 | 2.381 | 0.000 | 53 |
Table 4.
International grades of the examined steels.
| Examined Steels | International Grade |
|---|---|
| P91 | ASTM A335 |
| H13 | T20502 |
| 42CrMo | GB/T 3077-1999 |
| Low C | AISI 4130 |
| Medium C | ASTM A99 |
| High C | AISI M10 |
| 0Cr17Ni4Cu4Nb | GB/T 3280 |
Table 5.
Ferrite content detected in 0Cr17Ni4Cu4Nb steel material.
| Ingot Number | Position | part | Ferrite % | Position | Part | Ferrite % |
|---|---|---|---|---|---|---|
| 15,121 | riser | The outer wall | 4 | Ingot tail | The outer wall | 3 |
| 1/2 radius | 3 | 1/2 radius | 2 | |||
| core | 1 | core | 5 | |||
| 25,266 | riser | The outer wall | 5 | Ingot tail | The outer wall | 4 |
| 1/2 radius | 3 | 1/2 radius | 3 | |||
| core | 4 | core | 4 | |||
| 25,269 | riser | The outer wall | 4 | Ingot tail | The outer wall | 4 |
| 1/2 radius | 5 | 1/2 radius | 4 | |||
| core | 5 | core | 5 | |||
| GB/T8732 | - | - | ≤10 | - | - | ≤10 |
© 2018 by the authors. Licensee MDPI, Basel, Switzerland. This article is an open access article distributed under the terms and conditions of the Creative Commons Attribution (CC BY) license (http://creativecommons.org/licenses/by/4.0/).
Share and Cite
MDPI and ACS Style
Han, F.; Yu, H.; Dessau, J.; Chen, X. Novel formation of Ferrite in Ingot of 0Cr17Ni4Cu4Nb Stainless Steel. ChemEngineering 2018, 2, 44. https://doi.org/10.3390/chemengineering2030044
AMA Style
Han F, Yu H, Dessau J, Chen X. Novel formation of Ferrite in Ingot of 0Cr17Ni4Cu4Nb Stainless Steel. ChemEngineering. 2018; 2(3):44. https://doi.org/10.3390/chemengineering2030044
Chicago/Turabian StyleHan, Fei, Haicheng Yu, Jeffrey Dessau, and Xianghai Chen. 2018. "Novel formation of Ferrite in Ingot of 0Cr17Ni4Cu4Nb Stainless Steel" ChemEngineering 2, no. 3: 44. https://doi.org/10.3390/chemengineering2030044