1. Introduction
This study concerns hydrotalcite-like compounds, also known as Layered Double Hydroxides (LDHs) with the general formula [M
II(1−x)M
III(x)(OH)
2]A
n(n/2)·H
2O (0.25 ≤
x ≤ 0.33) and a structure derived from that of brucite, where some divalent cations are substituted by trivalent ones, providing an overall positive charge to the octahedral layers. In order to balance this charge, anions are located in the interlayer space. Their chemical and structural properties make them very desirable solids in countless applications, which is confirmed from the large amount of scientific publications and patents in the last few years after they were first reported during the middle of the XIX century. The polytypism of the so called hydrotalcite-supergroup minerals has been summarized by Evans and Slade [
1].
This type of solid, with different cationic and/or anionic compositions and different M
II/M
III molar ratios, has been applied in different fields and the results have been compiled in several reviews, which aim in many cases to find a sort of correlation between the method of synthesis followed and their applications. For instance, O’Hare et al. [
2] discussed the preparation methods of LDHs nanosheets and related them to their recent applications. Likewise, the role of layered double hydroxides as precursors of catalyst supports, catalyst precursors, or catalysts for different reactions have also been reported [
3,
4,
5]. Recent advances on the implementation of LDH-catalysts in biorefinery have been compiled by Verberckmoes et al. [
6], highlighting the versatility of LDHs. The derived materials are multifunctional, tunable, cheap, and easily produced heterogeneous catalysts. The relationship between the layered structure and the different synthesis routes of hydrotalcite-based catalyst have been widely discussed. Sikander et al. [
7] have recently reported a comprehensive study on the use of these materials in hydrogen production processes and they have emphasized the importance of the effects of the synthesis routes on the structural properties and of the reaction performance.
Among their catalytic applications, hydrotalcites have been used as catalytic coatings on honeycombs, open cell foams, and fibers for steam reforming [
8], catalytic oxymethane reforming [
9], dry reforming of methane [
10], partial oxidation of methane to syngas [
11], and the feasibility of the electrodeposition to quickly synthesize in situ Rh/Mg/Al hydrotalcite-type (HT) syngas catalyst precursors with controlled composition, morphology, and thickness on the surface of FeCrAlloy foams has been recently reported [
12].
The high relevance of these LDHs in biological, pharmaceutical, and environmental applications has been detailed in several overview articles that provide insight on the relationships between the structure and the synthesis methods of LDHs and their role as antimicrobial composites or controlled release carriers of pharmaceutically active ingredients [
13,
14,
15,
16]. This kind of solid has also a great interest in the pharmaceutical industry as delivery carriers, because of their excellent biocompatibility, anion exchange capability, and high drug loading efficacy, etc. [
17,
18,
19].
The growing interest on the upgrading water treatment technologies has enhanced the interest on the study of the applicability of LDH in water purification on a large scale [
20]. Actually, these layered materials have been successfully used as water decontaminants [
21]. They have also been applied as inorganic fillers in composites [
22,
23], as flame retardants, luminescent nanocomposites, and adsorbents for other decontamination processes [
24], etc.
For these purposes, the control of the structural and textural properties of the final solids is of paramount importance and many specific studies of the effect of the synthesis procedures on the structural and textural properties or their catalytic activity have been published [
25,
26,
27,
28,
29].
In addition to the synthesis procedures followed to prepare these materials, which have been recently reviewed [
30], post-synthesis procedures are usually applied to tailor the textural properties of the solids. Among these aging treatments, microwave hydrothermal treatment and the hydrothermal synthesis of LDHs have been reported frequently in several scientific papers [
29,
31,
32,
33,
34,
35,
36]. More recently, and due to the great interest that these types of solids arouse, Chubar et al. associated their properties to the synthetic methods used for LDH preparation [
20], concluding that the synthetic strategy can be refitted to add the missing properties to this layered inorganic adsorbent and to maximize its efficiency in surface-based phenomena.
Labajos et al. [
37] and Sharma et al. [
38] reported the effect of hydrothermal treatment on the structural and textural properties of LDHs prepared by coprecipitation, but none of these authors studied the effect of microwave treatment on these properties for the prepared solids. Zadaviciute et al. [
39] studied the effect of both treatments separately on samples prepared from MgCO
3 and
γ-Al
2O
3 dispersed in water. In this work our target is to tune up an effective method (fast, cheap, and clean) to obtain LDHs with predefined characteristics. In order to establish an exact protocol for the synthesis method to be followed to obtain solids with predefined characteristics by diminishing time, using cleaner, cheaper and, ultimately, more effective methods, we have first carried out an extensive study on the incidence of the aging treatment on the chemical, structural, and textural characteristics of the solids, and secondly, we have refined the work parameters to reduce costs, pollution and energy expenditure. To carry out this study, we first characterized deeply by different techniques (powder X-ray diffraction, thermal analysis, infrared spectroscopy, surface texture, and particle size distribution) a synthesized hydrotalcite prepared by the coprecipitation method without further aging, then with two types of hydrothermal treatments, namely, conventional and under microwave irradiation. Finally, we have set carefully the parameters of the microwave treatments that lead to solids with the same characteristics of those found in the solids obtained after a conventional treatment by using a more efficient modus operandi.
2. Results and Discussion
We have prepared three sets of samples: set M1X consists of two samples aged in air at room temperature for one or seven days; set M2X, consists of two samples aged under hydrothermal conditions at autogenous pressure at 150 °C for one or two days, and set M3X, consisting of five samples aged under microwave hydrothermal treatment at 150 °C for 2, 3, 5, 7, or 10 h. An initial batch of coprecipitated Mg, Al-carbonate LDH was used to prepare all the samples. Data for all samples are included as
Supplementary Material, and in the paper the discussion is restricted to those samples that are usually representative of the set they belong to, or exhibit singular properties.
Results of element chemical analysis for selected samples are included in
Table 1; the values for the other samples were almost coincidental with those shown here.
Together with the mass percentage for each cation, the values of 1 −
x and
x correspond, respectively, to the metal molar fraction of Mg
2+ and Al
3+, according to the formula [Mg
1−xAl
x(OH)
2](CO
3)
x/2·
mH
2O for the solids prepared. The results show a Mg
2+/Al
3+ molar ratio close to 2, the deviation from the expected value being within the experimental error, or it can alternatively be due to a slight selective redissolution of one of the cations during the aging process. Assuming that carbonate is the only interlayer anion, the molecular formula of the anhydrous compounds have been calculated, and the water content has been calculated from the mass loss up to ca. 220 °C after submitting the samples to thermogravimetric analysis (see below and
Figures S1, S5 and S6). The results are included in
Table 2.
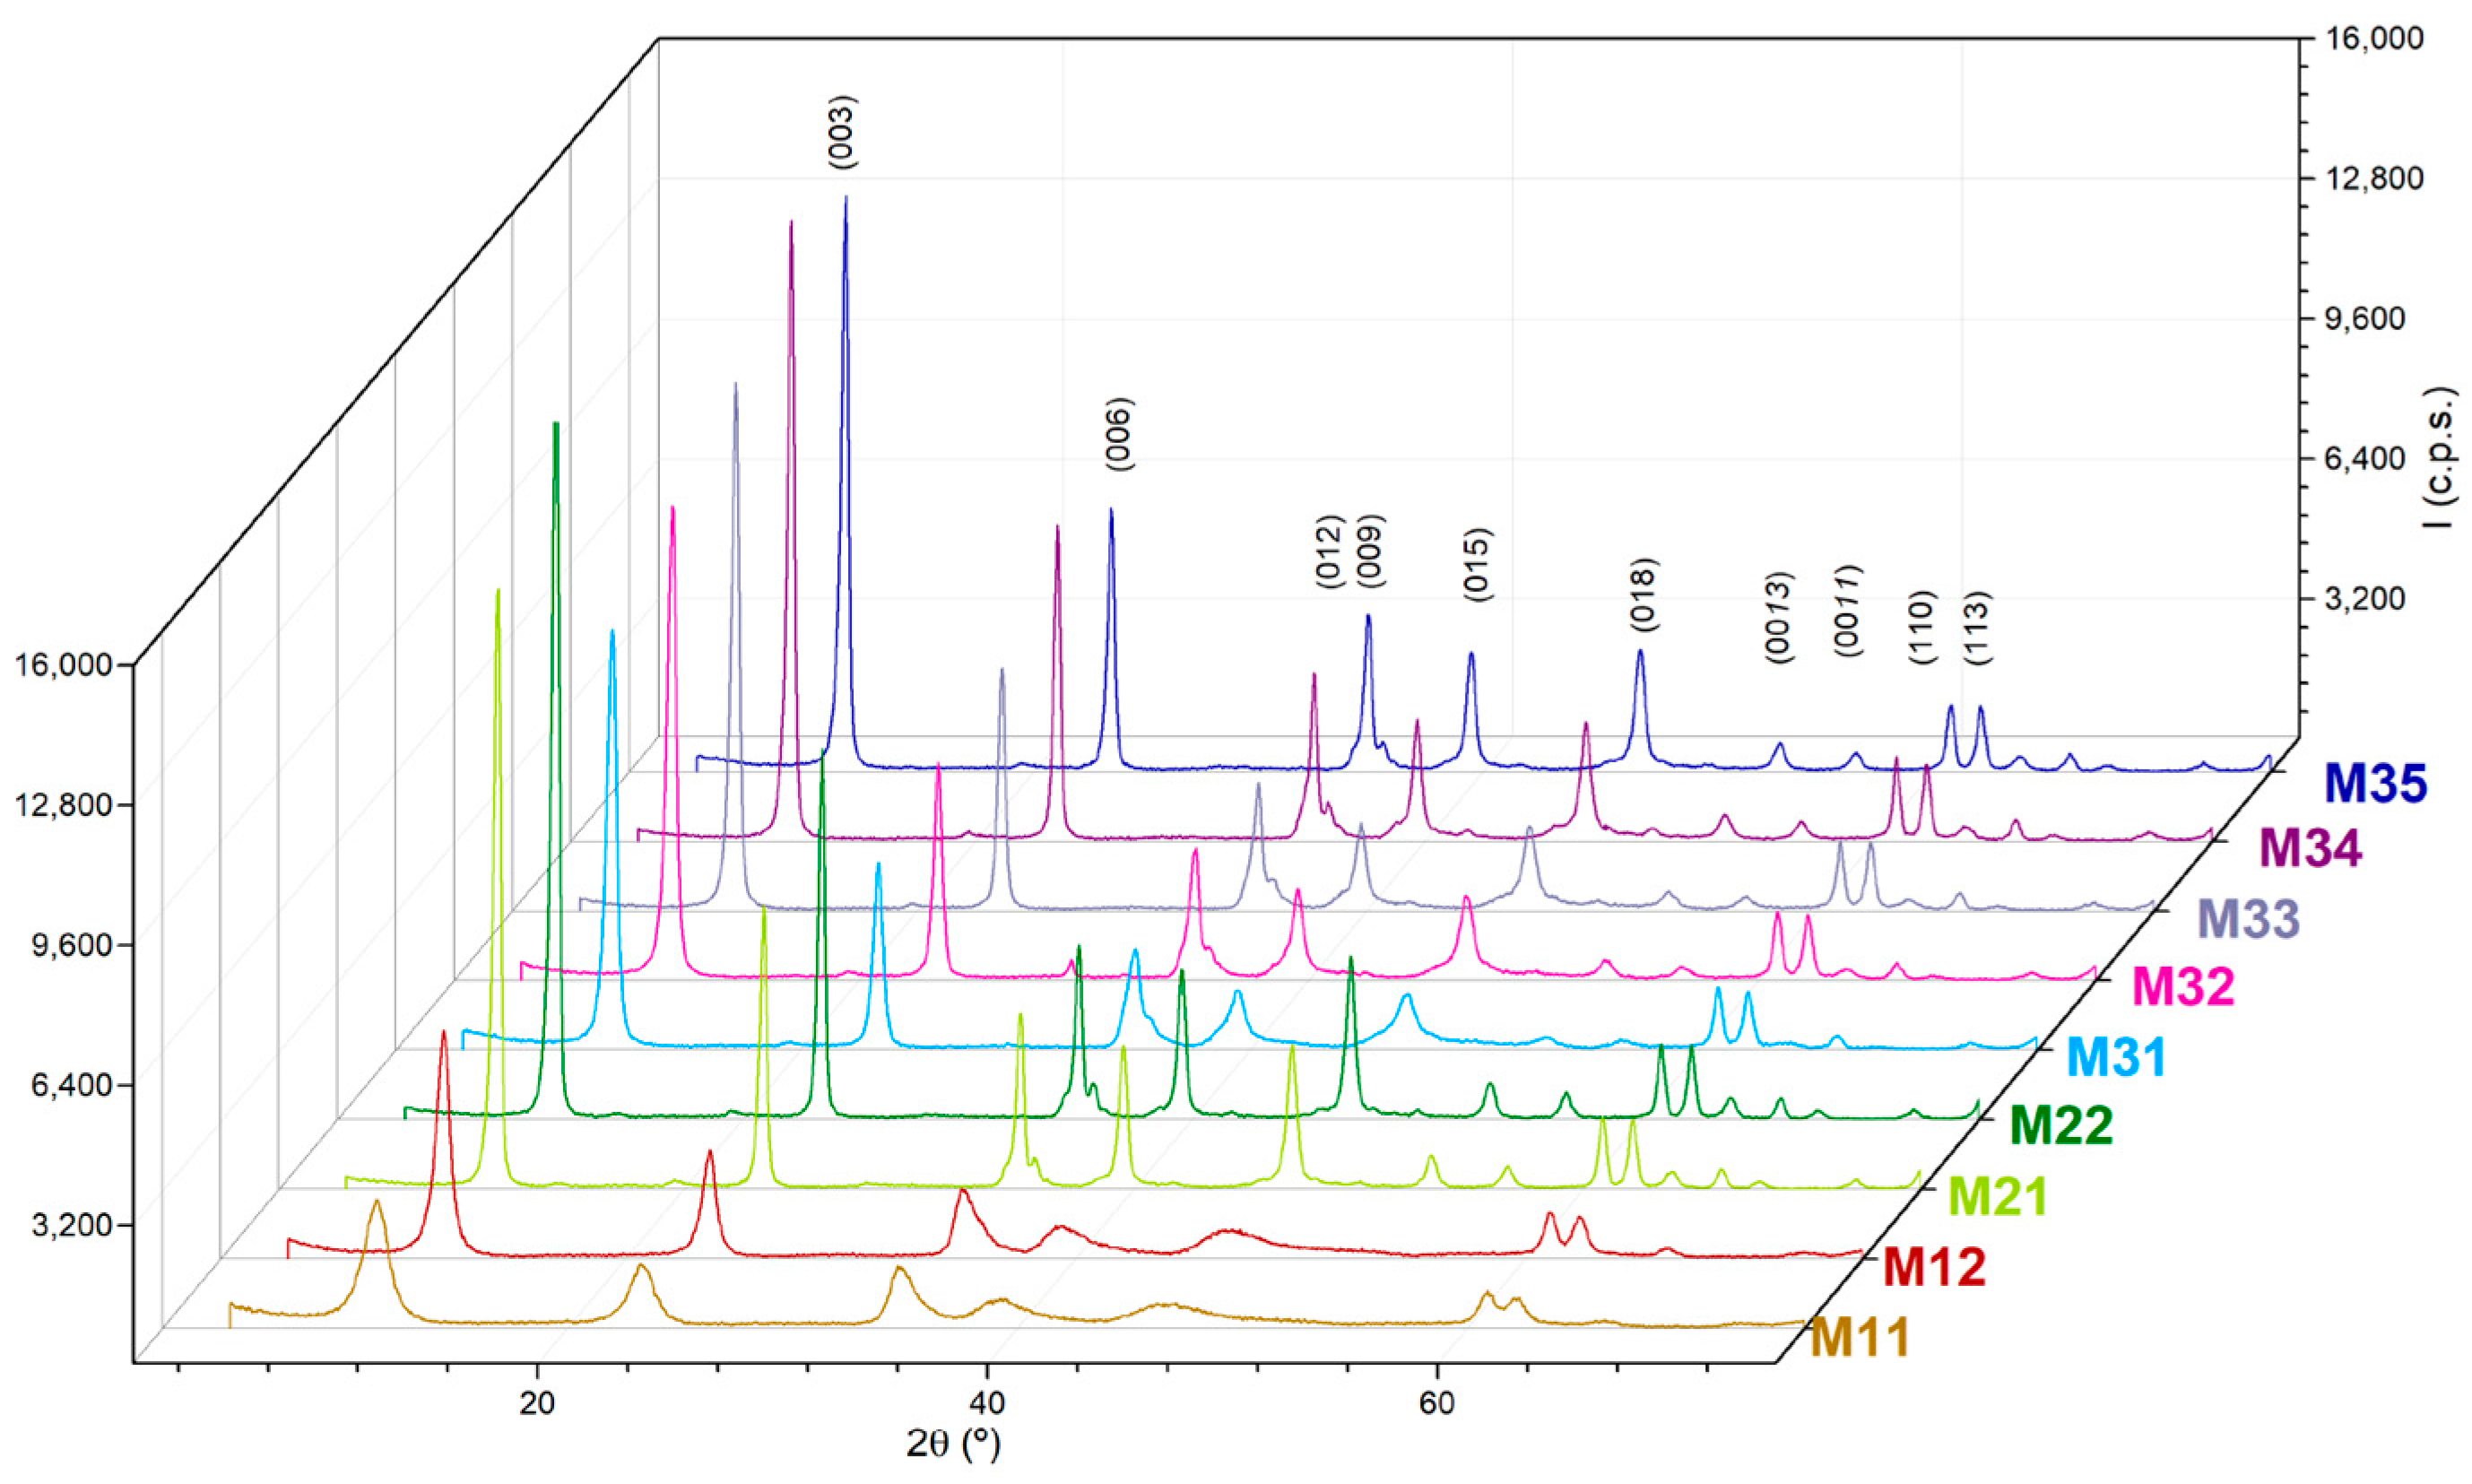
The powder X-ray diffraction (PXRD) diagrams of the samples show diffraction peaks, which positions and relative intensities are typical of layered compounds with the hydrotalcite-type structure; the diagrams are shown in
Figure 1. Although all the peaks recorded correspond to the hydrotalcite structure and their positions are coincident for each other and for the values reported elsewhere [JCPDS Card No. 89-0460], significant differences are observed for the relative intensities and width of the peaks. In any case, the spacing for the peaks are due to diffraction by the planes (003), close to 2θ = 10°, (006), close to 2θ = 23°, and (110); the first one of the doublet recorded just above 2θ = 60°, and it has been used to calculate the lattice parameters of the samples,
c and
a, respectively, assuming a 3R polytype [
40,
41] according to the formulae
c = (3/2) [
d003 + 2
d006] and
a = 2
d110 [
42]. The height of the repeating unit (i.e., one brucite-like layer and one interlayer space) corresponds to the
d-value and is one third of the lattice parameter
c, while parameter
a corresponds to the average metal cation—metal cation distance (M − M) within a brucite-like layer. The calculated values for parameters
c and
a for all samples prepared are given in
Table 3. As it can be seen, the values for the lattice parameter
a are very close to each other (the maximum difference is ca. 1%), and slightly lower than the value reported in the literature [
41], 3.054 Å. The values for parameter
c are also very close to each other, around the value reported in the literature [
41], 22.81 Å, and to the ideal value, 22.68 Å (
d-value 7.56 Å) reported for a M
II/M
III molar ratio of 2.0 [
43]. For all samples belonging to series M2X and M3X a very weak diffraction peak is recorded close to
d = 4.2 Å, indicating the formation of a superlattice as a result of the ordering of the M
II and M
III cations within the brucite-like layers.
Despite these similarities, differences can be seen among the intensities and broadening of the peaks recorded. Sharp, intense peaks are recorded for samples corresponding to series M2X and M3X, while those for samples M11 and M12 are relatively weaker and broader. This can be easily concluded from the basal diffraction peaks recorded at low diffraction angles, but even the two peaks slightly above 2θ = 60° are very well resolved for samples M2X and M3X, but overlapped for samples M11 and M12. Generally, the most severe the aging treatment, the sharper the diffraction peaks. Within a given aging treatment, the longer duration of the treatment leads to sharper and more intense diffraction peaks. It seems that as the “aggressiveness” of the treatment (from open conditions to hydrothermal and combined microwave-hydrothermal treatment) is increased, as well as its duration, the peaks become sharper and better defined. Sharpening of the peaks is a consequence of the increase in the crystallite size. On comparing series M2X and M3X, it is observed that samples M22 and M35 show similar crystallinities, although 48 and 10 h are required, respectively, in the absence or presence of microwave irradiation.
The average crystallite size (D) of the crystallites can be determined from the width of the diffraction peaks [
44]. The positions and widths of the peaks were determined with the software of the diffracrometer (once the contribution of the
Kα
2 radiation had been substracted) and was the result of averaging three measurements. As the particles are clearly anisotropic, two crystallite sizes have been determined, namely, in the direction perpendicular to the sheets (from the width of the diffraction peaks due to planes (003)) and in the direction parallel to the layers, using in this case the width of the diffraction due to planes (110), except for sample M11, as for this sample the peak is overlapped with that due to the diffraction by planes (113). The values calculated are also included in
Table 3. As expected, it is observed that the crystallite size along the direction perpendicular to the sheets increase on passing from samples M1X to the other two series. The values were coincident, within the experimental error, for samples M21 and M22, and definitively increased with the treatment time for samples M3X, although a ca. 10% decrease is observed on passing from sample M34 to sample M35, a finding which can be tentatively due to a partial destruction of the crystallites when submitted to a severe treatment.
The
d-values are in the 7.40–7.65 Å range, fitting very well with the value of 7.56 Å, calculated on the basis of crystal chemical reasons for a M
II/M
III molar ratio of 2 [
43].
From the
d-value and the crystallite size along direction [003], the approximate number of stacked layers can be calculated, as shown in
Table 3. Obviously, the values follow a parallel trend to that of parameter D
(003). It is ca. double for sample M12 than for sample 11, it keeps constant (and higher than for samples M1X) for samples M2X and steadily increases with the treatment time for samples M3X, except the anomaly found for the pair M34–M35.
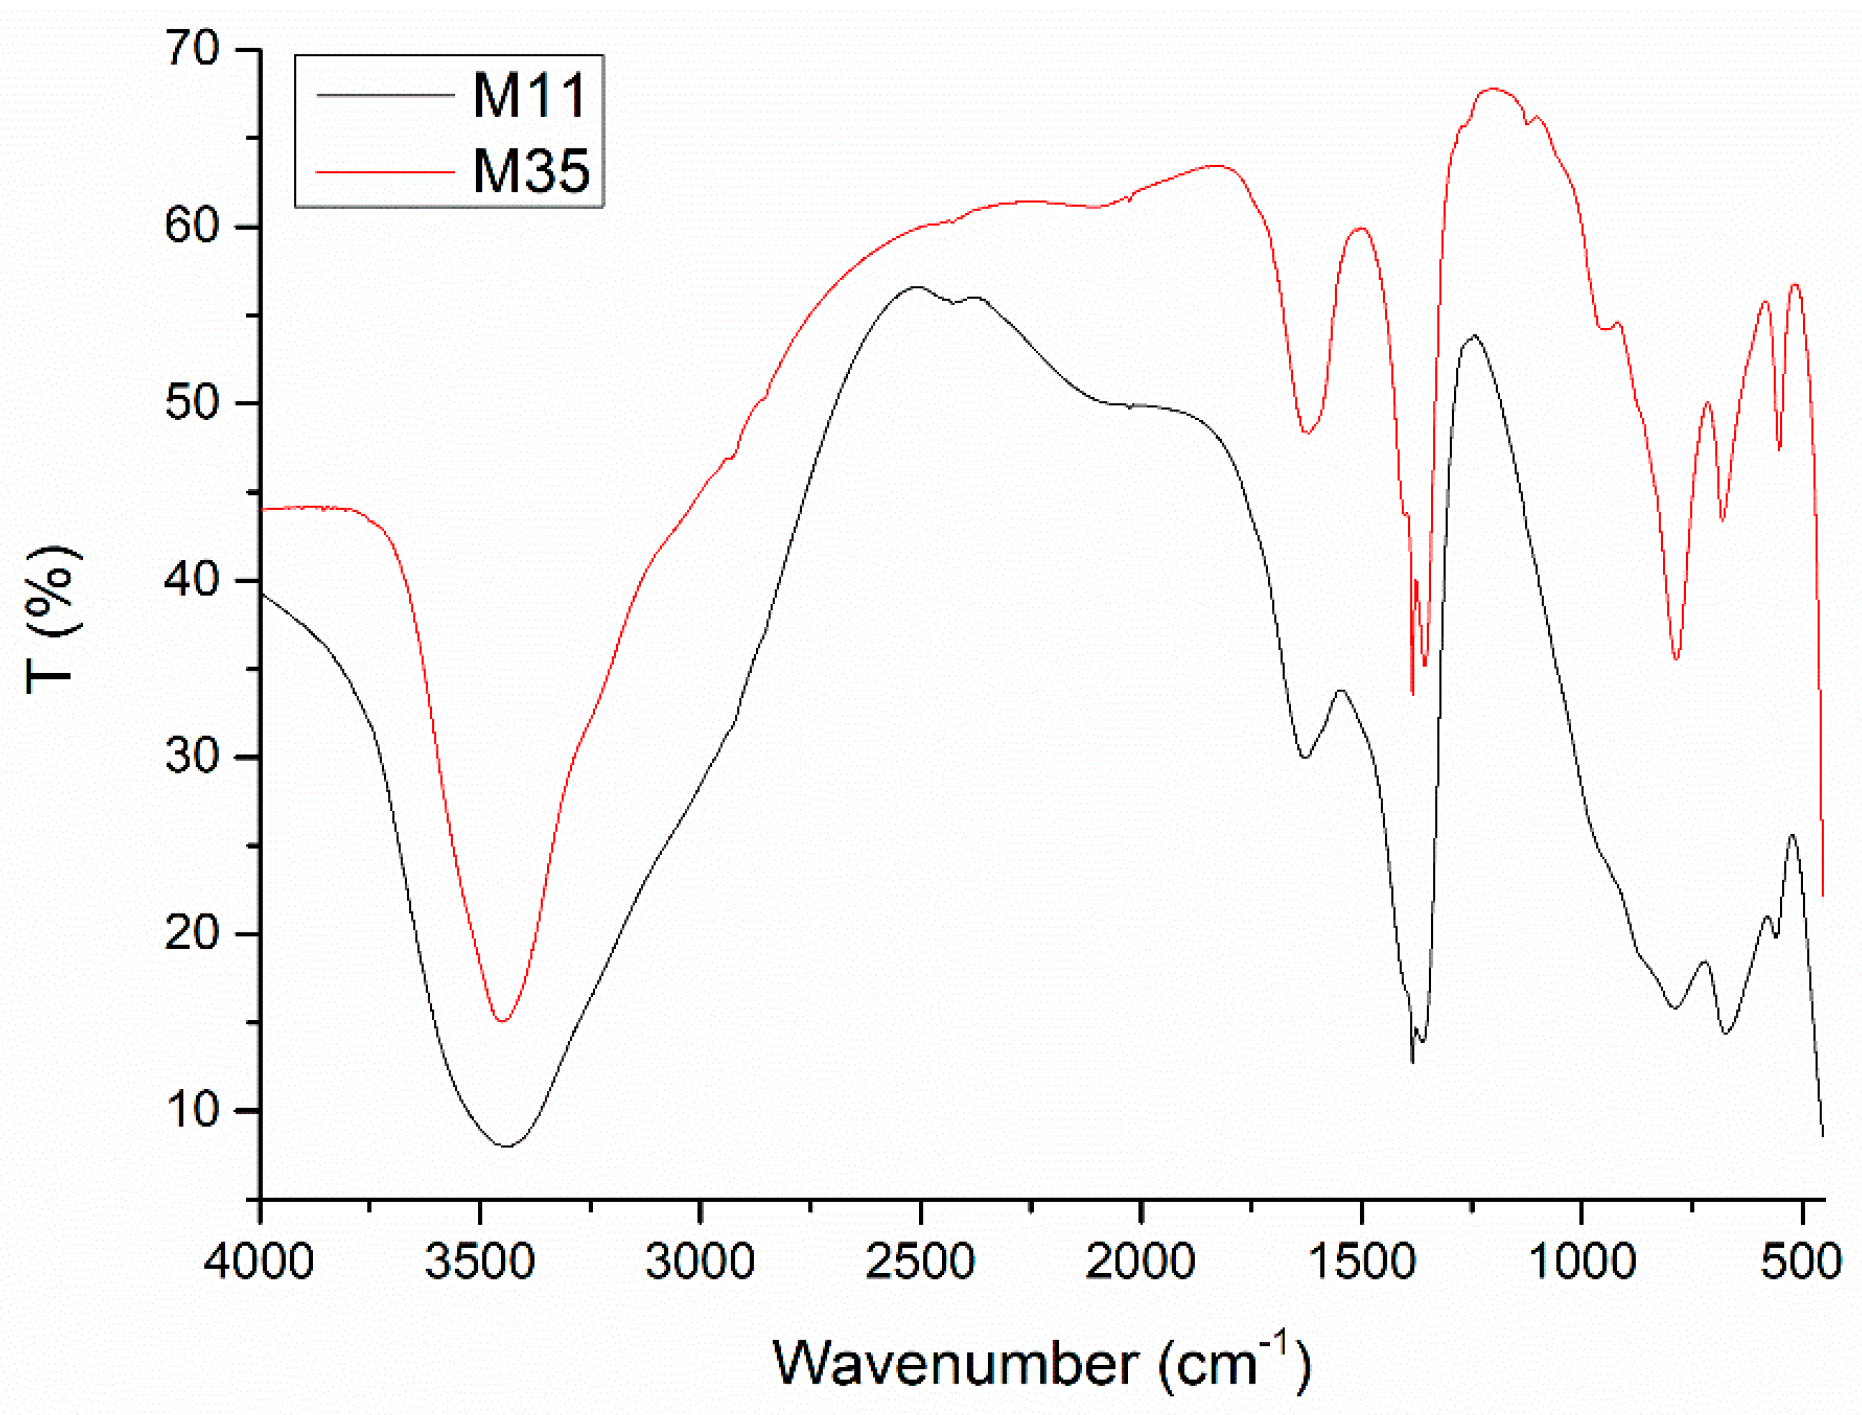
The Fourier-Transform Infrared (FT-IR) spectra of all samples are very similar to each other, as their compositions are essentially identical. Selected spectra are displayed in
Figure 2 (all spectra are included as
Figures S1–S3). Despite the fact that the bands are recorded in the same positions, their widths and relative intensities show some differences.
The broad, intense band centered around 3450 cm
−1 is due [
45,
46] to the O–H stretching mode of the layer hydroxyl groups and the interlayer water molecules. The existence of the hydroxyl groups in different symmetry environments and of the hydrogen bonds with different strengths account for the broadness of the band. The absence of the overlapped sharp peaks discards the presence of free hydroxides, namely, Mg(OH)
2 and Al(OH)
3. The shoulder slightly below 3000 cm
−1 is due to the OH stretching mode of the hydroxyl groups hydrogen bonded to the interlayer carbonate anions [
45,
46]. The medium intensity band at ca. 1620 cm
−1 is due to the bending mode of the interlayer water molecules, while the rather intense band at 1350–1360 cm
−1 is due to mode
ν3 of interlayer carbonate species. An extremely sharp band recorded just above that due to mode
ν3 of carbonate is ascribed to mode
ν3 of impurifying nitrate species, probably from the KBr used to prepare the samples to record the FTIR spectra. Other bands due to carbonate anions, together with those related to vibrations involving Mg
2+ and Al
3+ cations, are recorded at lower wavenumbers [
45,
46,
47].
Concerning the shapes of the bands, it can be observed that those for sample M11 are broader and probably less defined than for the other samples; even on comparing the spectra for samples M11 and M12. The simple extension of the aging treatment from one to seven days gives rise to a sharpening of the bands. However, this effect is even more noticeable for the samples submitted to hydrothermal (M2X) or microwave-hydrothermal (M3X) treatments: even for the gentlest treatment, the bands become sharper and actually much better defined in the low wavenumber range, this effect being more evident for samples M3X. This effect is clearly observed in the two spectra included in
Figure 2 for all bands recorded. These results suggest that as the aging treatment is enhanced and prolonged, a better ordering of the different species in the crystallites is attained, which is in agreement with the PXRD results.
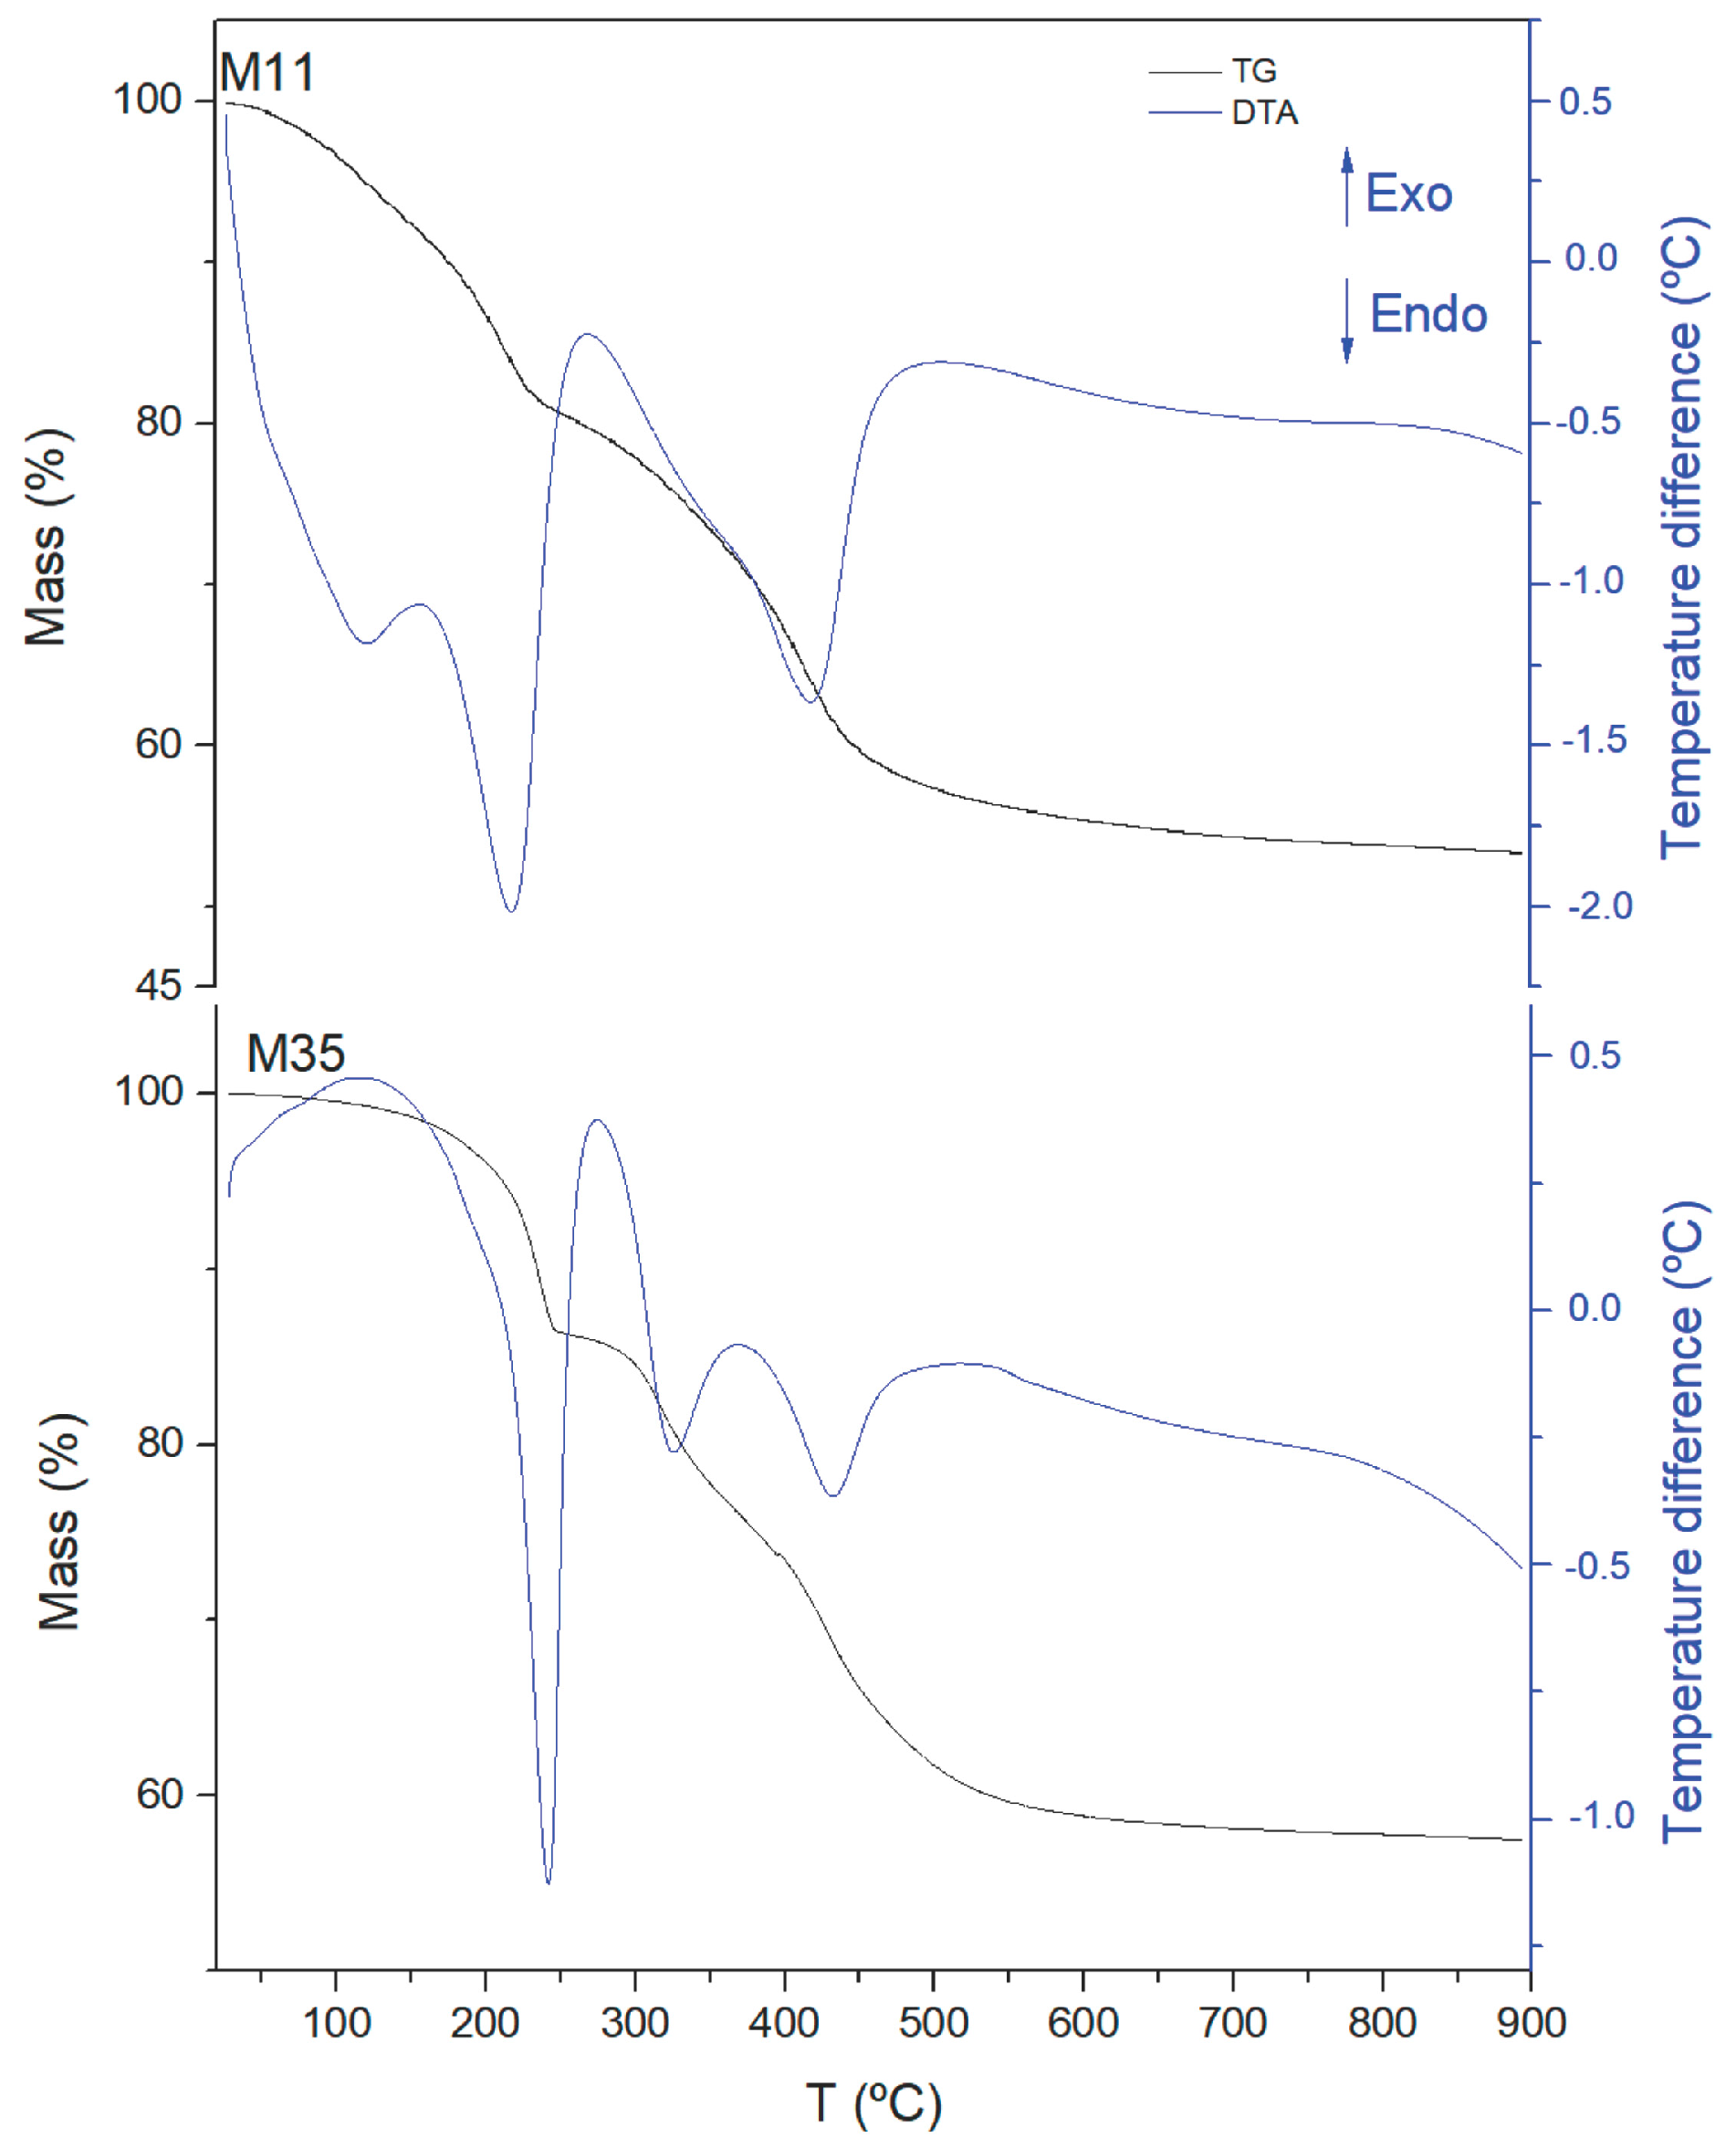
Similar conclusions can be reached on examining the results from the thermal analysis, TG and DTA, in
Figure 3 (Plots for all samples are included in
Figures S4–S6). The TG curves show three consecutive mass losses: from room temperature to ca. 220 °C, up to 450 °C and up to the end of the analysis (ca. 900 °C). According to previous results with Mg,Al-CO
3 LDHs [
48,
49], the first loss corresponds to the removal of externally adsorbed and interlayer water molecules, while the second one corresponds to the removal of water via condensation of layer hydroxyl groups and of CO
2 from interlayer carbonate anions. The last mass loss, above ca. 450 °C, corresponds to the removal of occluded water and/or CO
2 [
50]. As the final products are MgO and Al
2O
3 (or MgO and MgAl
2O
4, as confirmed from PXRD analysis of the solid residues after calcination at 900 °C, however the account for mass loss is the same whichever the final products, MgO and Al
2O
3, or MgO and MgAl
2O
4) in all cases, from the element chemical analysis data for Mg and Al, and assuming that carbonate is the only interlayer anion, the amount of interlayer water has been calculated (see
Table 2). Although for sample M11 (and partially for sample M12), the value calculated should also include the amount of water adsorbed on the external surface of the crystallites, which is easily removed up to 150 °C. Thus, the two broad DTA endothermic effects (clearly recorded for sample M12, and somewhat obscured by the first one for sample M11) should correspond to the removal of externally adsorbed water molecules, while the sharp, intense effect somewhat above 200 °C for all samples studied should correspond to the removal of more strongly held structure-bonded interlayer water molecules. Two endothermic effects (better defined for samples M2X and M3X) in the same temperature range as the second mass loss should correspond, as indicated above, to the removal of CO
2 (from interlayer carbonate species) and of H
2O (through condensation of layer hydroxyl groups), as previously reported for this family of materials [
49,
51,
52].
As already observed from the FTIR studies (sharper bands as the treatment becomes more severe), it is clear that the endothermic differential thermal analysis (DTA) effects become sharper for samples M2X and M3X. The doubt remains, however, if both DTA peaks recorded between ca. 220 and 450 °C, with one corresponding to CO
2 removal and the other to H
2O removal, the release of both chemicals is involved in both effects. In any case, it is also observed that while the first effect for samples M11 and M12 seems to be weaker than the second one, their intensities are rather similar for the other samples. Probably, the better ordering of the species in the hydrothermally (M2X) and microwave-hydrothermally (M3X) aged samples should be in the origin of this behavior. However, removal of the anions could follow the reaction
And in such a case, removal of both gases would take place simultaneously, as reported previously [
51] from the mass spectrometric analysis of evolved gases during the thermal decomposition of a Mg,Al-CO
3 LDH. If this reaction holds, then the “transfer” of intensity from one peak to the other should also be a result of the ordering of the species upon severe aging. In all cases, total mass loss was ca. 44–46% of the initial sample mass.
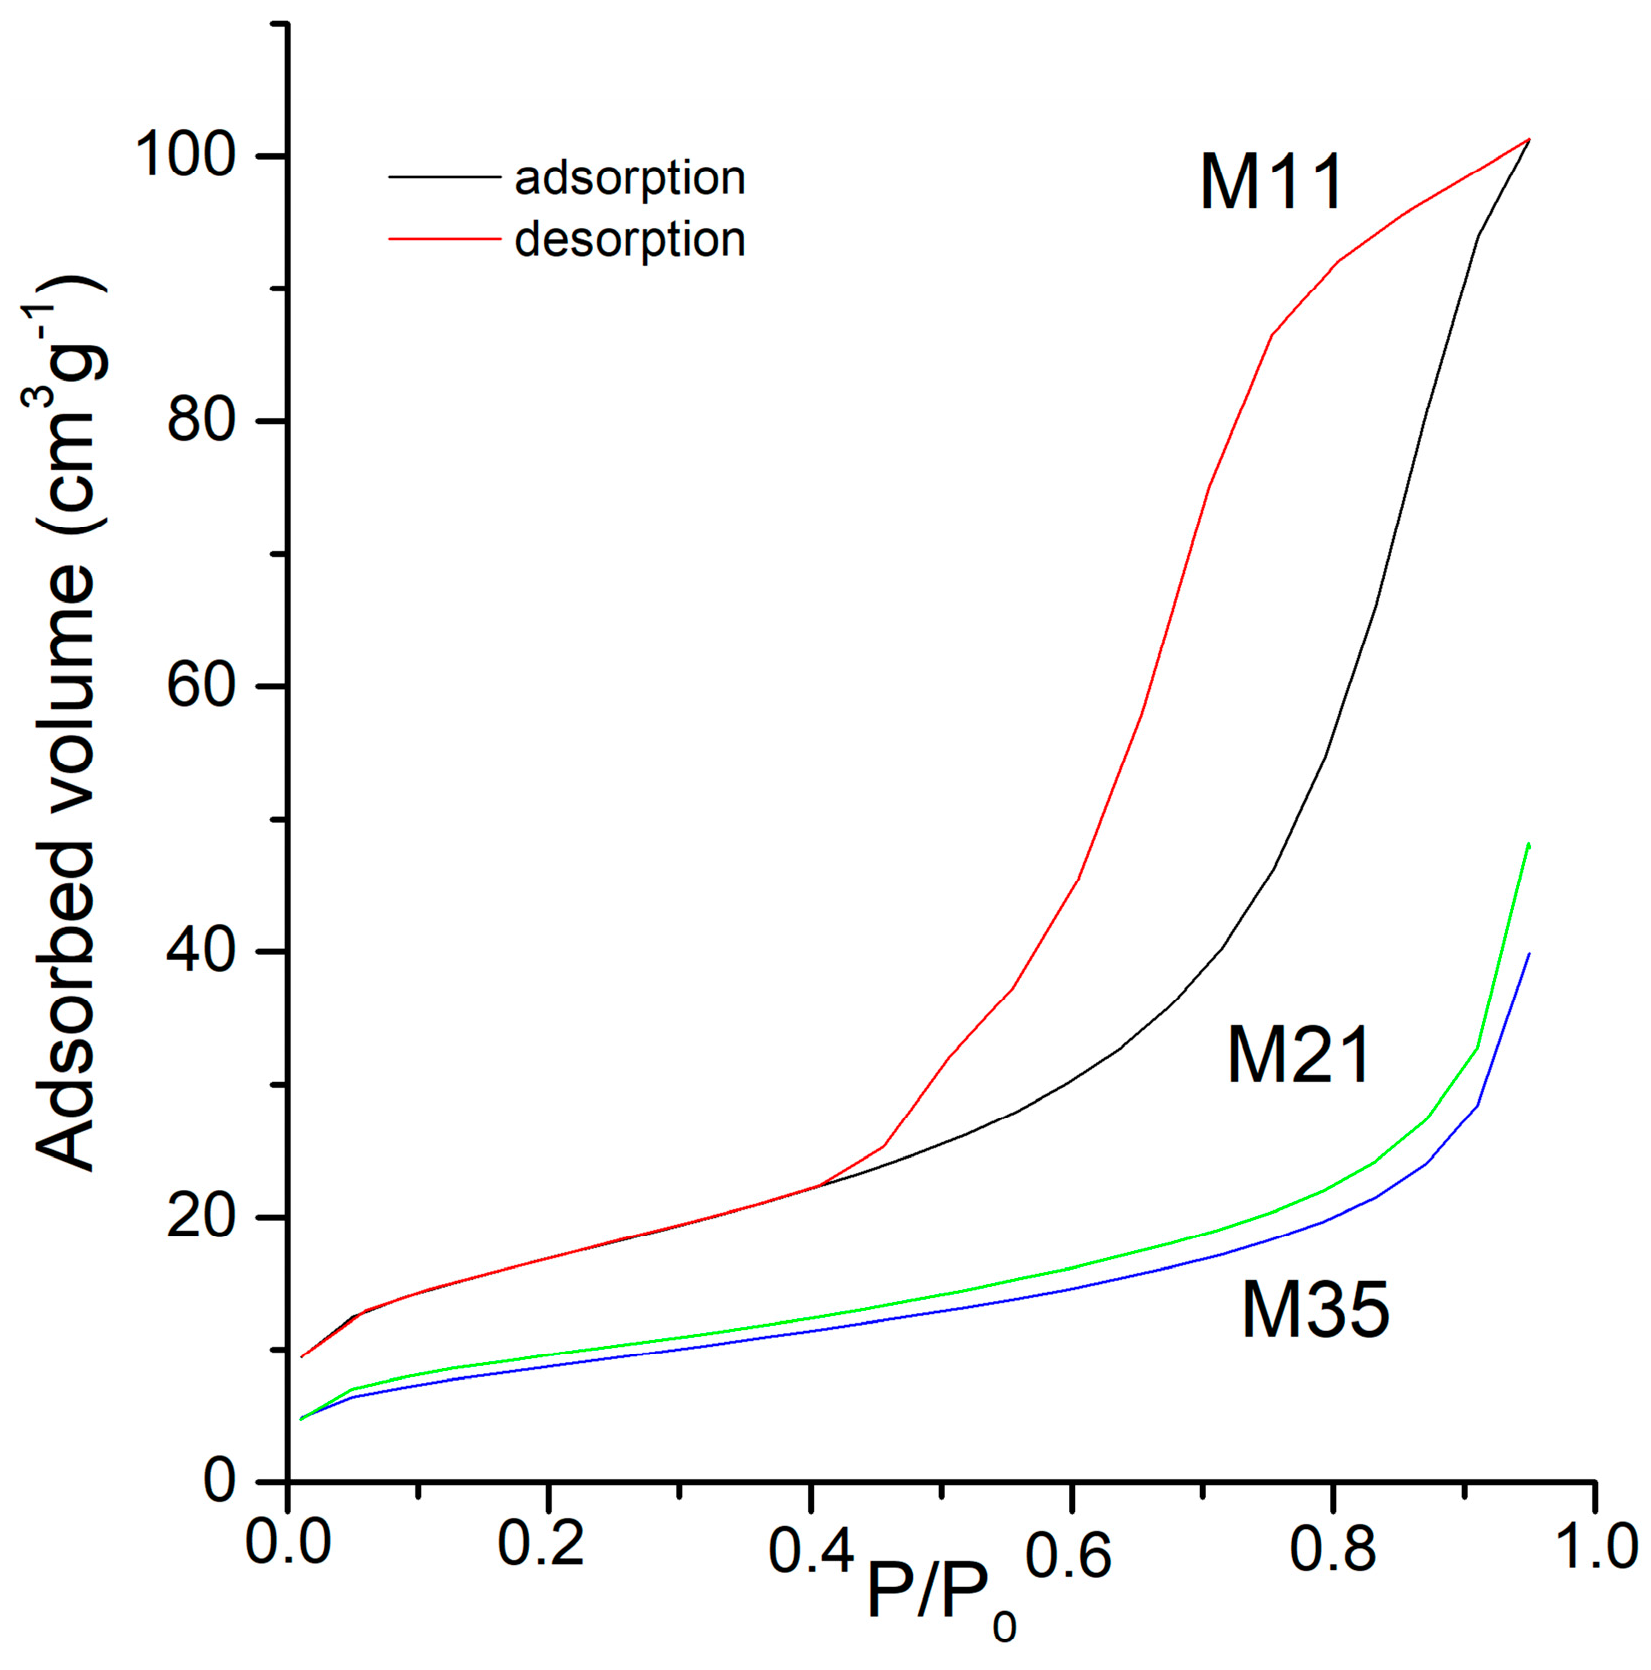
The change in the specific surface area and pore volume of the samples with the different treatments has been monitored from the adsorption-desorption isotherms of N
2 at −196 °C. The values measured for these two magnitudes are included in
Table 4. Representative plots of the adsorption-desorption isotherms are included in
Figure 4. In all cases, the isotherms correspond to type II in the IUPAC classification [
53], which is characteristic of non porous samples or where mesopores predominate.
The shape of all isotherms for samples M2X is the same. The shape for the isotherms of samples M3X is the same as well, with a general decrease in the adsorption capacity as longer time treatments are applied, but those for samples MX1 are different. The adsorption capacity (roughly taken from the amount of nitrogen adsorbed at a relative pressure of 0.95) is almost twice for sample M12 than for sample M11. There is also a change in the shape of the hysteresis loop, from type H2 for sample M11, characteristic of disordered materials and with ill-defined distribution of size and shape, to type H3 for sample M12, characteristic of aggregates of sheets, leading to slit-like pores [
53]. The isotherms recorded for samples M2X and M3X all correspond to type II with a H3-type hysteresis loop, and the width is smaller than sample M12 and decreases as the intensity of the corresponding aging treatment is increased.
Concerning the specific surface areas (
SBET), the values for sample M12 is ca. 50% larger than that for sample M11. The difference between these two samples is simply the time (24 h vs. 168 h) they have been aged in air. It is generally assumed that as the crystallinity increases, the specific surface area decreases (except for very highly porous solids). From the PXRD results (see
Figure 1) it is clear that sample M12 is more crystalline than sample M11 (although without reaching the high crystallinity of samples M2X and M3X), contrary to what is expected from the specific surface area results. This apparent lack of agreement can be explained if one considers the so-called Ostwald ripening [
54]. According to this, on aging a suspension, the small particles are dissolved and reprecipitated, increasing the size of the larger crystallites; if the small particles, prior to aging, were blocking the pores in a raw, just-precipitated (or slightly aged) sample, as it occurs in sample M11, it is obvious that the crystallinity of sample M12, after 168 h aging even in open air, as well as its specific surface area, will increase, as the pores will be unblocked and the nitrogen molecules will have free access to them.
The behavior of the samples belonging to series M2X and M3X is in agreement with this: as the intensity of the aging treatment under severe conditions (hydrothermal or microwave-hydrothermal) is increased, the crystallinity increases (
Figure 1), but in this case their specific surface area decreases. This is probably due to a complete dissolution and reprecipitation of the small particles (those mostly contributing to the specific surface area) even after the shortest aging treatments (24 h for sample M21, 2 h for sample M31), which are enough to completely unblock the pores. Then, as the aging treatment is prolonged (sample M22 and samples M32 to M35) the crystallinity increases and the specific surface area decreases. However, the specific surface area of samples M34 and M35 are somewhat smaller than that of sample M33, as probably the severe treatment leads to a partial destruction of the crystallites, small particles again are formed, which could block the pores again.
The t-plot method [
53] has been also applied to further insight in the textural properties of these samples. On plotting the volume adsorbed vs. the width of the adsorbed layer (
t), a straight line should be obtained unless some additional effects exist. The external surface area (
St) is calculated from the slope of the linear portion of the plot, while the zero intercept is used to determine the surface area corresponding to the adsorption on the micropores; the corresponding values are included in
Table 4. It should be noticed that the interlayer space is not considered “accessible micropores”, as the kinetic diameter of the nitrogen molecule (3.65 Å) is larger than the height of the interlayer space (ca. 3 Å), and so the adsorbate molecules cannot access the interlayer space. Samples M12, M31, M32, M33, and M34 are those showing micropores.
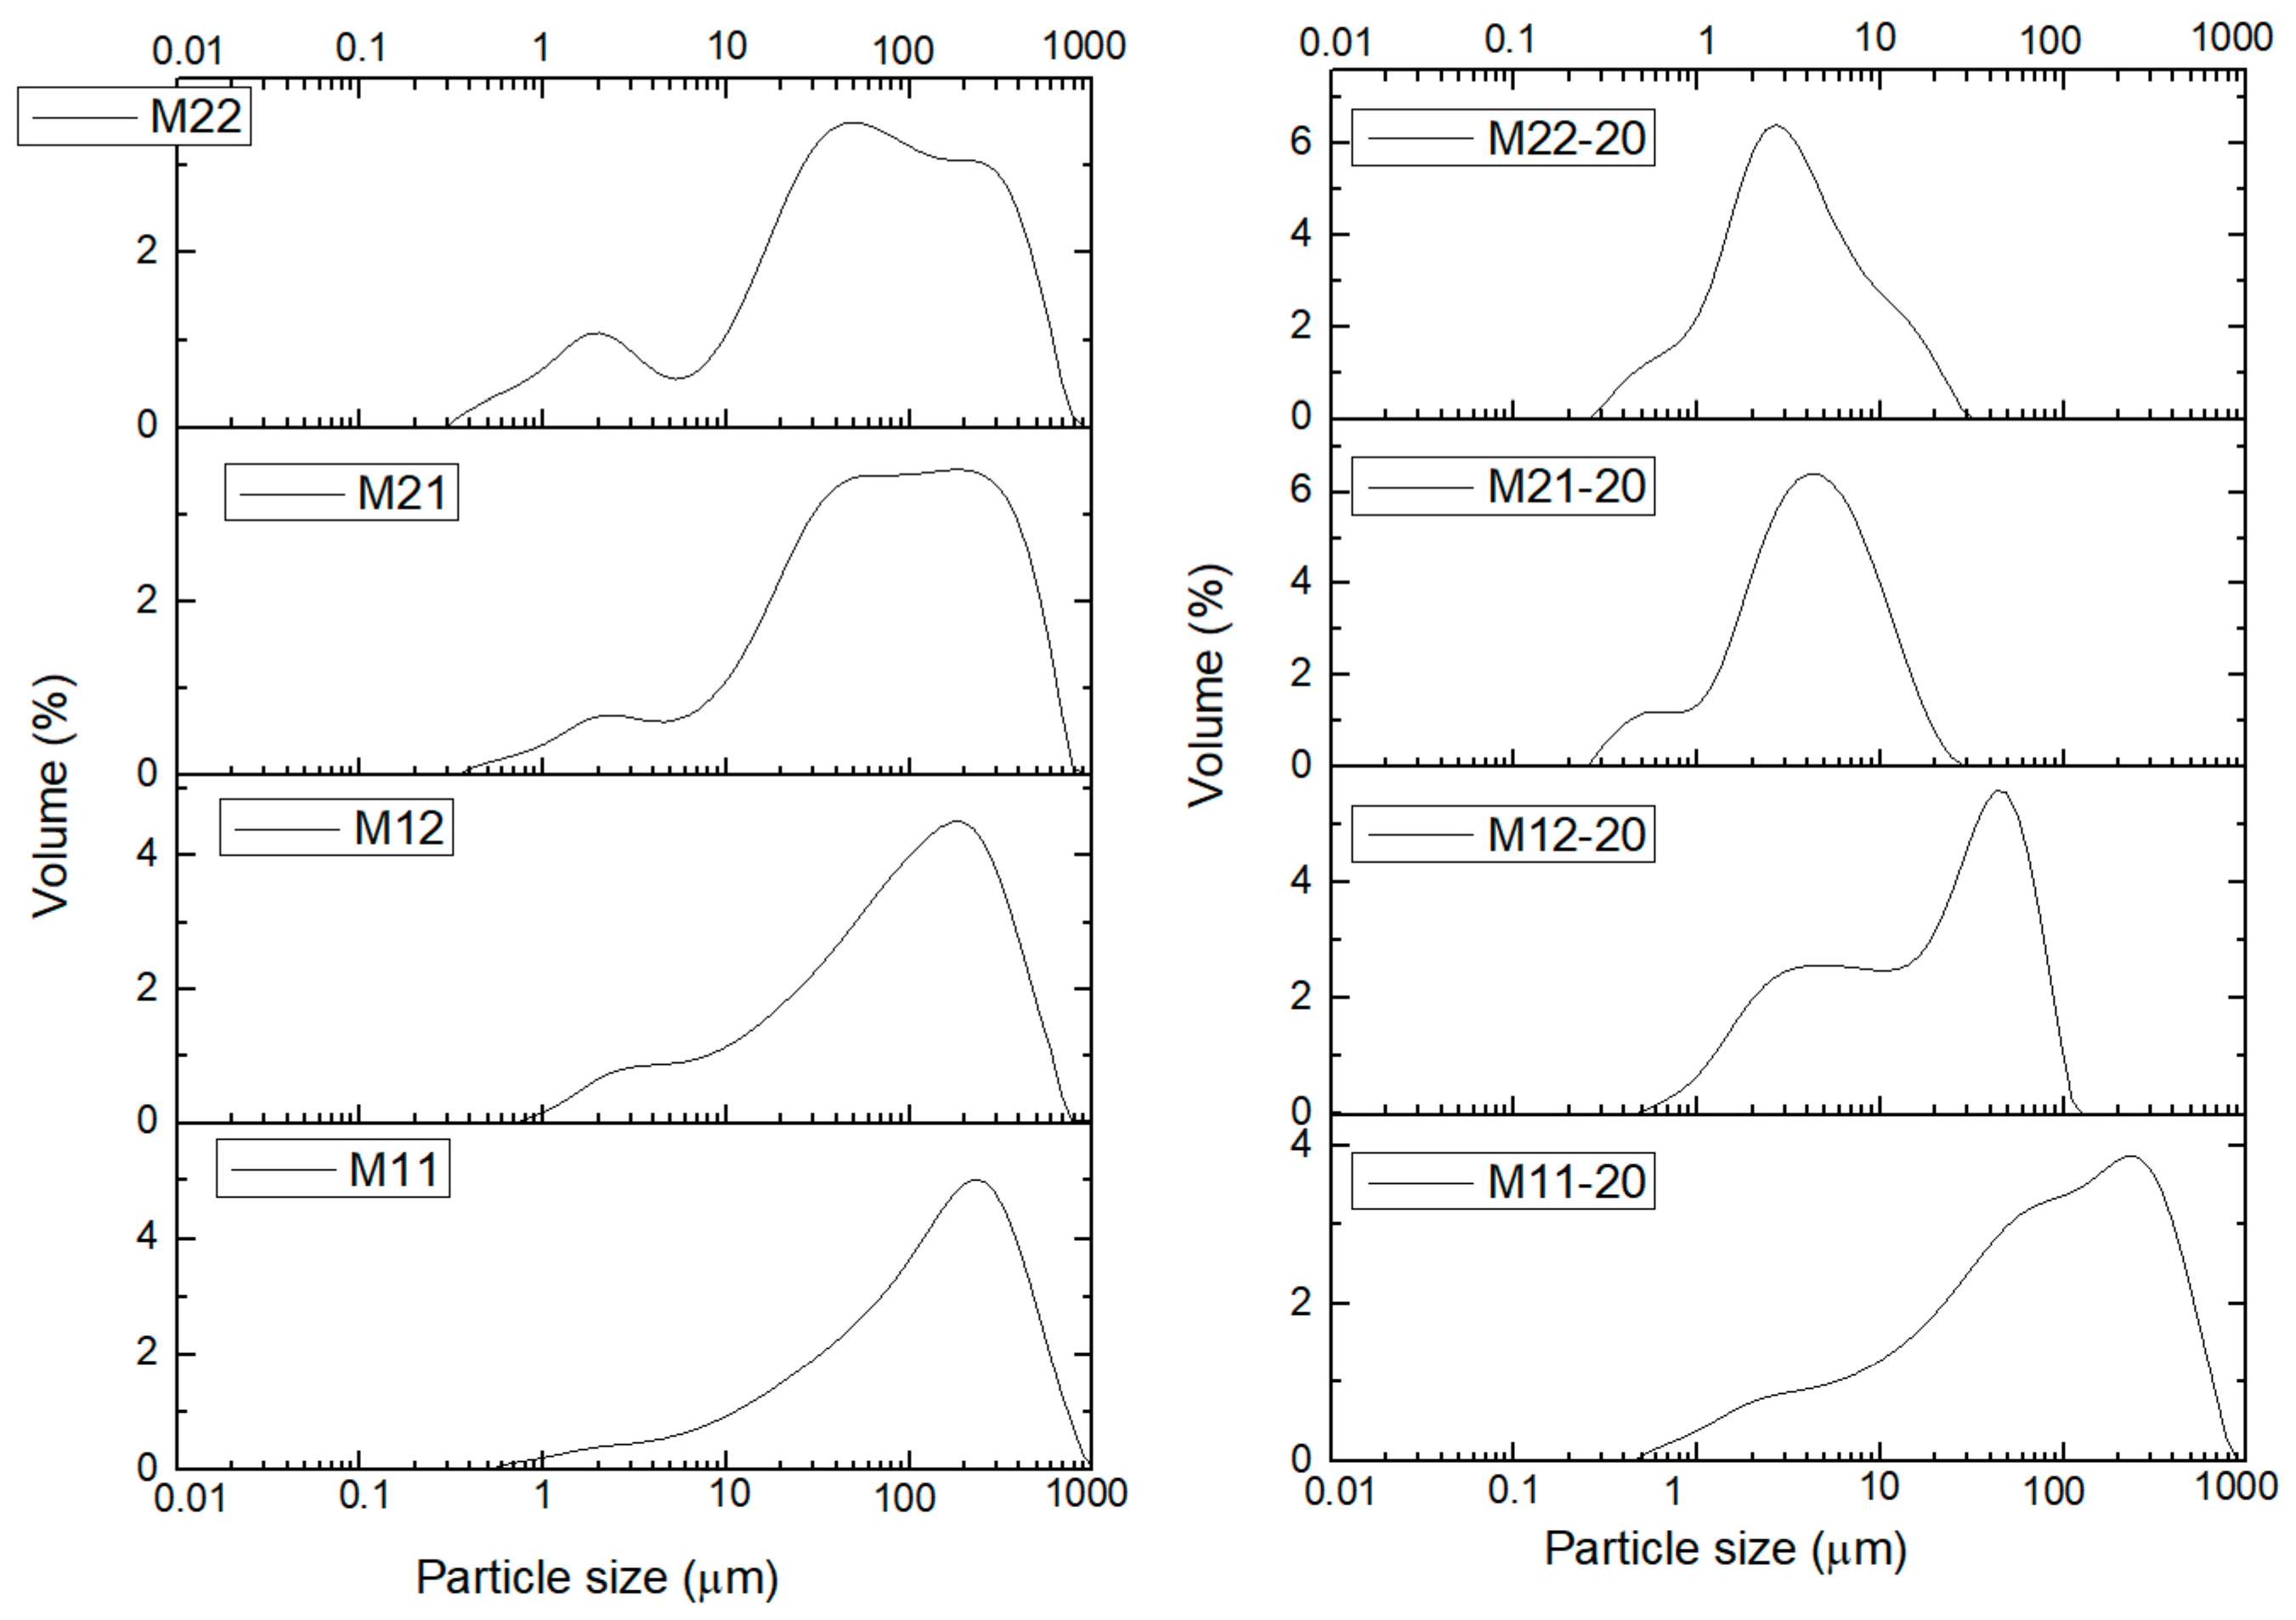
Characterization of the samples has been completed determining the particle size distribution (PSD). The particle size distribution was measured for the samples dispersed in water and then they were treated in situ with ultrasounds (US) to disaggregate the secondary particles. It was observed that exposures to US larger than 20 min did not change significantly the curves. Consequently, in
Figure 5 and
Figure 6 the distributions have been plotted for the US-untreated and 20 min US-treated samples. Curves for all samples treated under US for 0, 5, 10, 15, and 20 min can be found in
Figures S7–S15.
Sample M11 (aged for 24 h in open air) shows almost the same PSD prior to or after US treatment, even after 20 min. It is also worthwhile mentioning that sample M12 (treated under the same conditions, but for 168 h) shows the same PSD as sample M11 before the US treatment. The peak of the PSD curve is recorded at ca. 200–250 μm, with a sharp decrease for higher diameters, and a smoother slope in the low diameter side, up to ca. 0.5–0.7 μm. However, when sample M12 is submitted to US for 20 min, a bimodal distribution of particle size is observed, with sharper, better defined curves, and two peaks at ca. 45 and 4–5 μm, although the contribution from particles with a diameter between these two ends cannot be completely discarded (deconvolution of the curves was not performed). Thus, we can conclude that on extending this aging treatment smaller particles are formed, with their diameters within a narrower range.
Samples M21 (aged under hydrothermal conditions for 1 day) and M22 (same, but for 2 days) show similar curves. In this case, prior to US treatment the PSD curves are very similar to each other, with a broad split into two overlapped peaks at ca. 50 and 250 μm and a smaller peak around 2 μm. Upon US treatment both samples behave in the same way and the particle size is sharply decreased. A single peak (with shoulders) at 3 (sample M22) or 5 (sample M21) μm is recorded in both cases. This means that the shorter time of treatment under hydrothermal conditions (24 h) is enough to stabilize the PSD and on extending the treatment to 48 h (sample M22) no significant changes develop, although it should be mentioned that the small peak close to ca. 0.5 μm for sample M21 is less significant in sample M22, where it seems it has been “absorbed” by the main peak; and the peak at 3–5 μm for the untreated samples has completely vanished. It seems that on extending the hydrothermal treatment in this series of samples, the Oswald ripening continues acting on the smaller particles.
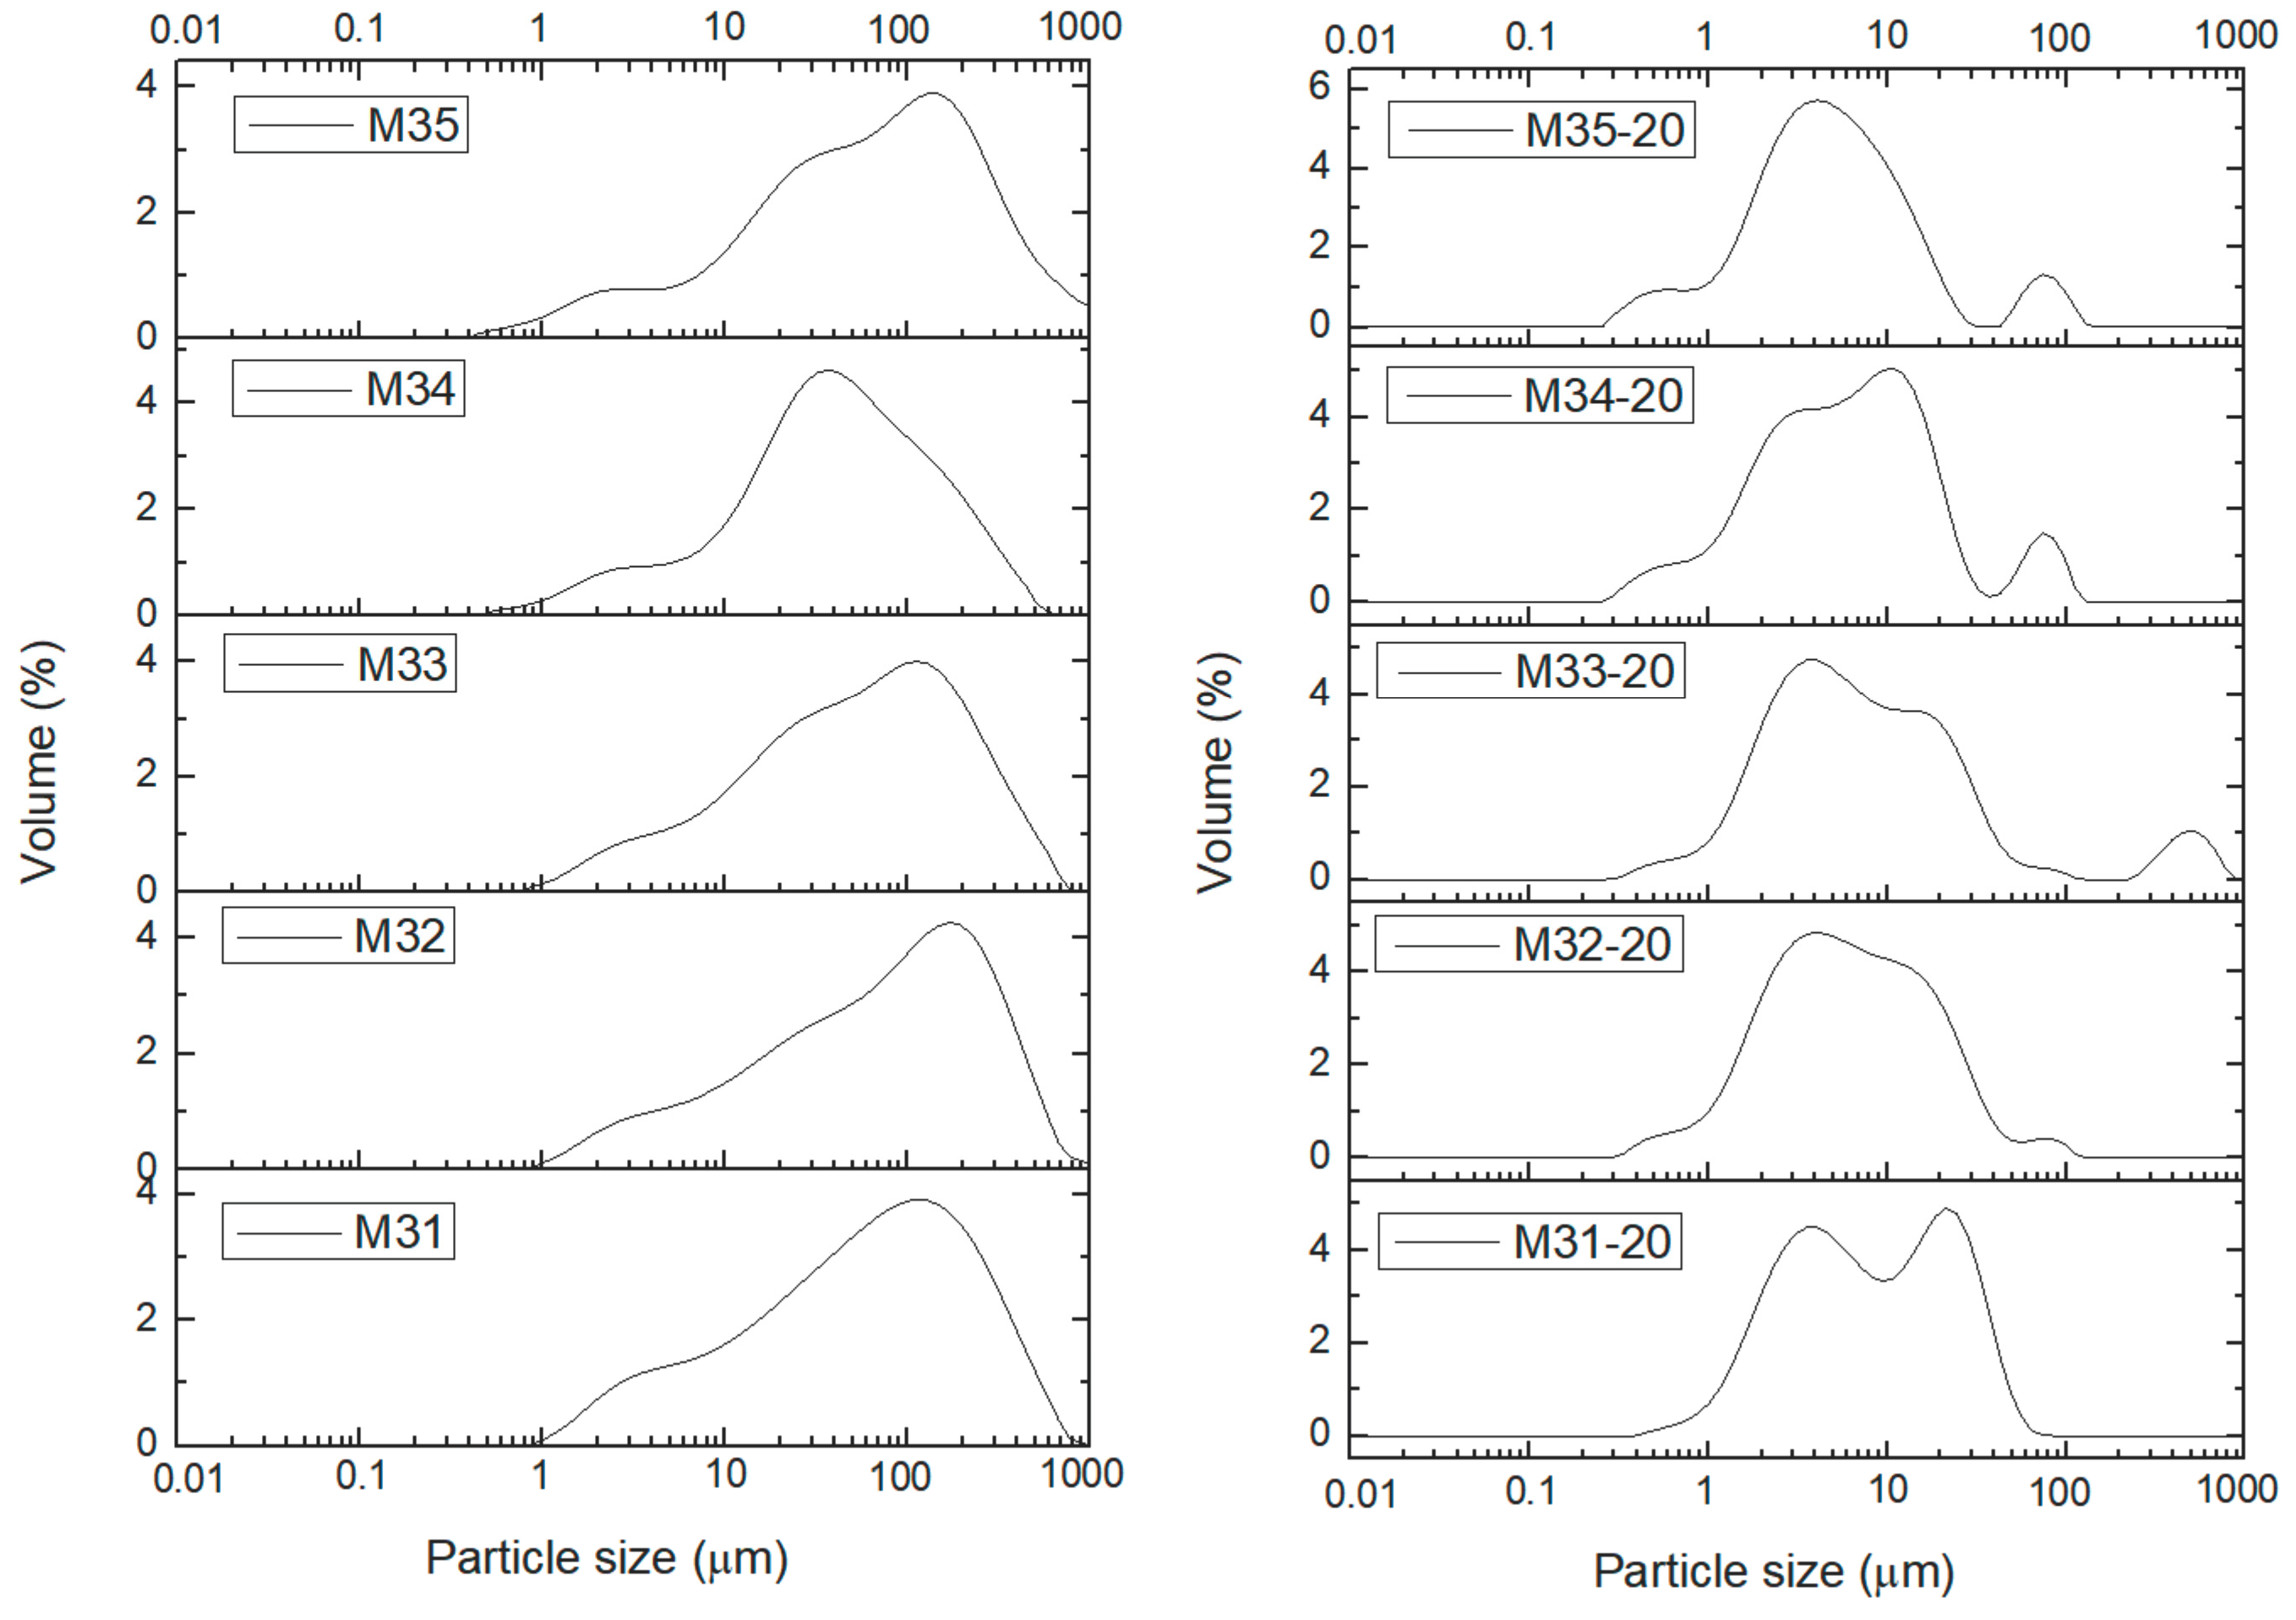
Finally,
Figure 6 shows the curves for the PSD of samples from series M3X. As with the previous series of samples, the PSD curves for the US-untreated samples are roughly coincident, with a peak at ca. 150 μm, except for sample M34, for which the peak is recorded close to 40 μm (it should be remembered that this sample showed some different behavior also in the studies applying other characterization techniques). The shape of the curves is very similar to those shown by samples M1X, but, surprisingly, not to those for samples M2X, which have been also aged, although under softer conditions. When the samples are treated under US for 20 min the peak shifts towards lower values and shows different splitting and components. So, for sample M31 two rather “clean” peaks are recorded at ca. 4 and 25 μm. Sample M35 shows a main peak at ca. 4 mm, but with two smaller peaks at ca. 0.5 and 80 μm. In the PSD curves in SI it can be seen that the changes are observed even after the shortest time of US treatment for all samples, except for sample M11, which does not show any change even after the longest US treatment.
Data in
Table 5 correspond to the 90% percentile; i.e., the average particle size below which 90% of the sample is included, both without and after 20 min US treatment to disaggregate the particles. It is clear that, except for sample M11, which has been submitted to the softest aging treatment and the value decreases only to ca. 90% after US treatment, in all other cases the decrease is markedly larger. However, no definitive trend can be observed. While both samples belonging to series M2X show the same decrease percentages, those for series M3X seem to behave randomly. Nevertheless, it is clear that all aging treatments here applied lead to samples that are more easily disaggregated than when only a soft aging treatment is applied.


