Resolved-Pore Simulation of CO Oxidation on Rh/Al2O3 in a Catalyst Layer


Department of Chemical Engineering, Worcester Polytechnic Institute, Worcester, MA 01609, USA
*
Author to whom correspondence should be addressed.
ChemEngineering 2018, 2(1), 2; https://doi.org/10.3390/chemengineering2010002
Submission received: 22 November 2017
/
Revised: 22 December 2017
/
Accepted: 26 December 2017
/
Published: 29 December 2017
(This article belongs to the Special Issue Chemical Kinetics and Computational Fluid Dynamics Applied to Chemical Reactors Analysis and Design)
Abstract
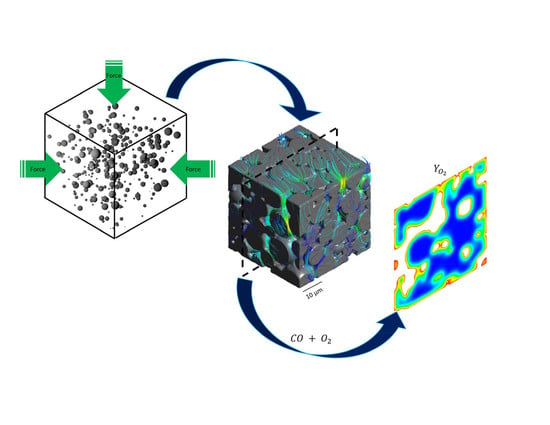
:Computational fluid dynamics (CFD) is coupled with reaction and transport in a micro-scale pellet simulation to study CO oxidation over Rh/Al2O3 catalyst. The macro-pores are explicitly modeled to study the interaction of these phenomena in both the solid and fluid phases. A catalyst layer is computationally reconstructed using a distribution of alumina particles and a simple force model. The constructed geometry properties are validated using the existing data in the literature. A surface mesh is generated and modified for the geometry using the shrink-wrap method and the surface mesh is used to create a volumetric mesh for the CFD simulation. The local pressure and velocity profiles are studied and it is shown that extreme changes in velocity profile could be observed. Furthermore, the reaction and species contours show how fast reaction on the surface of the solid phase limits the transport of the reactants from the fluid to meso- and micro-porous solid structures and therefore limits the overall efficiency of the porous structure. Finally, the importance of using a bi-modal pore structure in the diffusion methods for reaction engineering models is discussed.
1. Introduction
CO oxidation is one of the most studied catalytic reaction mechanisms. The simple and fast mechanism of the reaction is suitable to investigate reaction and transport interactions on the catalyst surface both computationally and experimentally. Therefore, it has been studied on different scales: from atomic behavior of the active sites and microscale diffusion limitations to macroscale reactor design. The reaction has important environmental and industrial impacts as it is being used to oxidize CO to CO2 in catalytic converters of automobile engines, and also contributes elementary steps in reactions such as the water–gas shift mechanism.
The reaction mechanism of CO oxidation has been studied on several different catalysts (e.g., Pt, Rh, RuO2, Au, etc.). Alavi et al. studied CO oxidation on Pt(111) using Density Functional Theory (DFT) to identify the energy barriers and transition states [1]. They provided evidence that the main energy barrier in the mechanism is due to the bond strength between O atoms and the surface. Chen et al. studied surface activities of Rh, Pt and Pd catalysts and O2/CO ratio effects on the reaction [2]. They showed that the O2/CO ratios that lead to so-called “hyperactive” states relate directly to the adsorption energies of oxygen, heats of formation of the bulk oxides, and also the size of metal particles, while for stoichiometric O2/CO ratio the active sites are basically saturated with adsorbed CO and become less active for the oxidation reaction. Carabineiro et al. studied effects of gold (Au) particles on cerium oxide catalyst on CO oxidation. They showed how the catalyst increases the reactivity of the reaction, particularly, at low temperatures. They also showed that oxide Au particle size could play an important role in the reaction [3,4]. Rogal et al. used a first-principles thermodynamics approach to investigate the possibility of a thin oxide layer formation on the surface of the Pd(100) during CO oxidation [5]. Their results show that under the realistic reaction conditions a thin surface oxide layer is the most stable phase on the surface and the catalyst is almost at a transition between the oxide state and CO-covered Pd(100) surface. The authors then used first-principles kinetics Monte Carlo (1p-kMC) to show the dominance of the oxide layer on the surface under the relevant pressure conditions [6]. Reuter and co-workers have investigated the CO oxidation on RuO2 in several different studies [7,8,9]. In one of their most important studies Matera and Reuter show how heat and mass transfer can actually mask intrinsic reactivity of the catalyst for normal modern in situ experiments under typical gas phase conditions [10]. Furthermore, they show that coupling the gas phase transport with surface reaction could lead to multiple steady-states in case of CO oxidation on RuO2. Karadeniz et al. used a combined experimental-numerical study to investigate their developed mean-field microkinetics model for CO oxidation on Rh/Al2O3 [11]. The study emphasizes the effects of external and internal mass transfer limitations on the reaction rate measurements and how surface science experiments should be aware of these limitations for such a fast reaction. These important findings show how sophisticated the experimental procedures should be designed to be able to truly investigate the active phase behavior, and furthermore, highlight the importance of integrating flow and transport with the reaction in all the different stages of design of catalytic systems.
To avoid confusion, here we use the International Union of Pure and Applied Chemistry (IUPAC) definition of porous structures. Pores are classified based on their diameter to three different categories: (1) micro-pores (smaller than 2 nm); (2) meso-pores (between 2–50 nm); and (3) macro-pores (larger than 50 nm). We emphasize that pores with a diameter larger than one micrometer are the ones that are explicitly modeled in this work and are referred to here as the macro-pores. It should be noted the pore structures that are reconstructed in this work are based on an assumption that the catalyst layer is made of milled spherical alumina powder with different size distributions but similar particle shape.
The numerical reconstruction of porous catalysts is an important step to model the transport and reaction in micro- and nano-scales. Different approaches could be used for this purpose. Montemore et al. used Scanning Electron Microscopy (SEM) and Transmission Electron Microscopy (TEM) for imaging different layers of the catalyst and then imported the images into the computer package and used a numerical scheme to interpolate between the images and digitally reconstruct the catalyst layer [12]. On the other hand, both stochastic and semi-deterministic methods such as Gaussian correlated random fields [13] and diagenesis, particle packings [14], respectively could also be used for the generation of a desired porous medium. In the diagenesis method particles with a given size and shape distribution are initially packed, and then the deposition of droplets is modeled followed by the spreading and solidification steps. The simulation continues until the system reaches its final stage. Dudak et al. used the Discrete Element Method (DEM) to pack randomly positioned particles in space with a simple force model [15]. The particle sizes were assigned according to a distribution provided from measuring milled alumina particle diameters. The packing of particles continued until the desired macroscopic properties of the porous medium were obtained. The constructed geometry then was translated into a three-dimensional matrix and each spatial position was represented by a voxel. Since the geometry only represents two phases (i.e., solid and fluid) an index with value of 0 or 1 was assigned to each voxel to distinguish between the two phases. The latter method is the simplest while it still accurately represents the main features of the micro structure such as bulk porosity, pore size distribution and tortuosity.
Computational fluid dynamics (CFD) studies have shown that the flow profile in a complex geometry is highly correlated to the structural properties such as bulk and local porosities [16]. Furthermore, it was shown that in such structures heat and mass transfer patterns strongly follow the local velocity profile [17,18]. Therefore, when studying the reaction and transport interactions for such structures it is recommended to integrate these phenomena into one multiscale model. Currently, resolved-particle CFD simulations in macro scale (e.g., fixed bed reactors) are state of the art. These simulations during the past decade have provided invaluable information for design and optimization of catalyst particles and fixed bed reactors [19,20]. However, on the microscale level there have been very few such studies. Icardi et al. conducted a three-dimensional resolved-pore simulation of fluid flow and solute dispersion in a general porous medium [21]. The focus of the work was on numerical difficulties related to mesh generation and spatial discretization. They studied the flow profile for a wide range of the Reynolds (Re) numbers and showed that dispersion within the medium can be described with the classical power law models that are deduced by analytical homogenization. However, there was no reaction involved in their model. Koci and colleagues have extensively studied the reaction and transport interactions in digitally reconstructed catalysts [15,22,23,24]. Specifically, a tremendous effort was implemented by the group to improve the understanding of diffusion and transport through the micro-structure with an emphasis on exhaust gas oxidation. However, CFD was never integrated into their model. Dong et al. investigated effects of the catalyst pore size structure on overall performance of the reactor. It was shown that it is important to distinguish between macro- and micro-pores in the diffusion model and the hot spot temperature and yield of the reactor can be greatly affected by the pore characteristics [25]. Bufe et al. studied the effect of explicit modeling of cylindrical pores for Fischer-Tropsch synthesis. The authors showed that for pores with diameter larger than 10 μm, a 3D description of pores is necessary for an accurate model [26].
Clearly, there is a gap in the literature when it comes to integrating both reaction and transport into resolved-pore CFD models. Given the emphasis of different studies on the importance of coupling different phenomena on the catalyst surface, here we introduce a framework to generate a micro-scale porous structure and use it to develop a resolved pore CFD simulation of CO oxidation over Rh/Al2O3.
2. Materials and Methods
2.1. Catalyst Reconstruction
The first step to reconstruct the catalyst layer is to obtain the size distribution, mixing ratio and sintering level of the support material milled particles. Size distribution provides probability of existence of a certain particle size in the mixture. In the case that only a few particle sizes exist in the mixture, the mixing ratio is used instead to define the ratio of those particles in the sample. Finally, sintering level is the percentage of each particle diameter that is overlapped due to the sintering effect during the formation of the catalyst structure. The algorithm that is used for the computational reconstruction of the micro-structure is as follows: (1) Particles are randomly positioned in the space according to their distribution or mixing ratios; (2) A simple force model is used to mimic the pressurizing in the pellet construction process. Bullet physics library is used to perform this simulation; (3) Step 2 continues until the aimed microscopic properties (e.g., bulk porosity, pore size distribution) are reached; (4) A cubic sample of the structure with desired dimensions is cut and exported as a STereoLithography (STL) file. Overall porosity of the sample is measured by the ratio of the volume of the STL file to the volume of a complete cube with the same dimensions. To evaluate the macro-pore size distribution the Maximum Sphere Inscription method (MSI) is implemented. It is proven that MSI can measure the pore size accurately comparing to a standard method such as virtual capillary condensation [27]. The algorithm for the MSI method is as follows: (1) The 3-dimensional space is discretized into high resolution elements; (2) In a single element inside the pore volume (fluid phase) a sphere with radius r = h/2 is generated (h = element size); (3) The sphere radius is increased (r + dr) and tested to determine if the new sphere intersects with the solid region; (4) If the sphere does not, step 3 is repeated; (5) If it does the r value is saved for all the elements in the sphere radius unless they already have been assigned to a larger r value; (6) Move to the next element in the fluid region and steps 2 to 5 are repeated. To capture the right pore diameter for regions with high non-linearity, a very fine grid is needed that can significantly increase the computational cost of the algorithm. In order to address this issue, a k-dimensional tree (k-d tree) is introduced that partitions the space-data structure and significantly increases the efficiency of the algorithm by reducing the computational time by an order of magnitude.
2.2. Mesh Generation
Once the desired geometry is obtained it is imported into Fluent Meshing software. Since the structure has many sharp corners, and connectivity issues (so-called dirty CAD) it would be challenging to generate a proper volumetric mesh. Here we use the shrink-wrap method to build a manifold and watertight surface mesh based on the original geometry. The shrink-wrap method is described in detail in our previous study [28]. Using a proper size-function is critical to capture the geometric properties of the original geometry. Once a watertight, high quality surface mesh is generated, a bounding-box is created to encompass the solid structure and represent the fluid region. It is critical to have a fine mesh at the solid–fluid interface to capture the sharp gradients due to fast reaction on the solid surface. Therefore, two prism layers with thickness of are generated on both sides of the interface where is the minimum defined mesh size.
2.3. Reaction Kinetics
Microkinetics from Karadeniz et al. [11] are used to model the surface kinetics and reaction rate on the Rh/Al2O3 catalyst. The model was validated with experimental results for a temperature range of 521–873 K and reactant mole fractions of 0–5%. The surface mechanism contains ten elementary steps, three gas and four surface species (Table 1). The rate constants are defined by an Arrhenius type expression which includes a temperature dependent pre-exponential factor.
where is pre-exponential constant, is temperature [K], and is activation energy [kJ/mol] of the step i. The reaction rate is defined by:
where is component j concentration [mol/cm3]. The reaction is thermodynamically consistent for the temperature range of 273–1273 K. To couple the reaction with the transport and flow in the macropores, the mechanism is initially solved for a specific range of operating conditions. Therefore, a four-dimensional grid is generated with CO, O2, and CO2 mole fraction ranges of 0–0.05 and temperature range of 500–700 K. In order to obtain steady-state solutions of the mechanism the system of ordinary differential equations is integrated over time until there are no changes in the species concentration. After the numerical solution for elementary steps is obtained, the reactions are mapped into quadratic splines. The coefficients of the splines are extracted and imported into 1-dimensional arrays and saved as C/C++ header files. These arrays are later called during the CFD simulations to evaluate the reaction rates that are the source term for species mass and energy balances. The details of the methodology were described in our previous study [29]. The accuracy of the splines is evaluated in the results and discussion section.
2.4. Governing Equations
The model consists of two discrete phases: fluid and solid. The viscous flow in the macro-pores is modeled by continuity and Navier–Stokes equations [21,30].
The CO oxidation only happens in the solid phase (both on the outer surface and inside). The solid phase outer surface (i.e., the interface with the macropore fluid phase) is the main interaction area of the gas phase species with the active-sites that are dispersed in the solid phase. However, that is not the only reacting surface. The species can diffuse through small pores (meso- and micro-pores) and react inside the solid phase as well. It should be noted that for very fast reaction such as CO oxidation the latter could be extremely limited by external mass transfer through the boundary layer. To model the micro- and meso-scale phenomena, three scalars are defined to represent the mass fractions of the species. The conservation of mass in the macro-pores (fluid phase) is modeled by:
where is density, is velocity and is mass fraction of the kth specie. Since there is no reaction in the fluid phase, the right-hand side of the equation is set to zero. is diffusivity term:
and the molecular diffusivities are calculated by the Fuller, Schettler and Giddings correlation [31].
In the solid phase the mass conservation becomes:
where is the source term that is evaluated by overall consumption/production rate of specie k. Considering that the rest of the pores in the model are meso-micro pores, Knudsen diffusion will be dominant, and therefore, in the solid phase becomes:
where is effective Knudsen diffusivity, and represented by:
where is mean meso-pore diameter, is meso-porosity, is tortuosity, Rg is the gas constant, T is temperature and is the molar mass of specie k. In order to make sure that the solid and fluid phases are coupled correctly, at the interface the value of the user defined scalar () and the flux for all the species should be equal in both phases.
2.5. Computational Parameters
2.5.1. Catalyst Construction Parameters
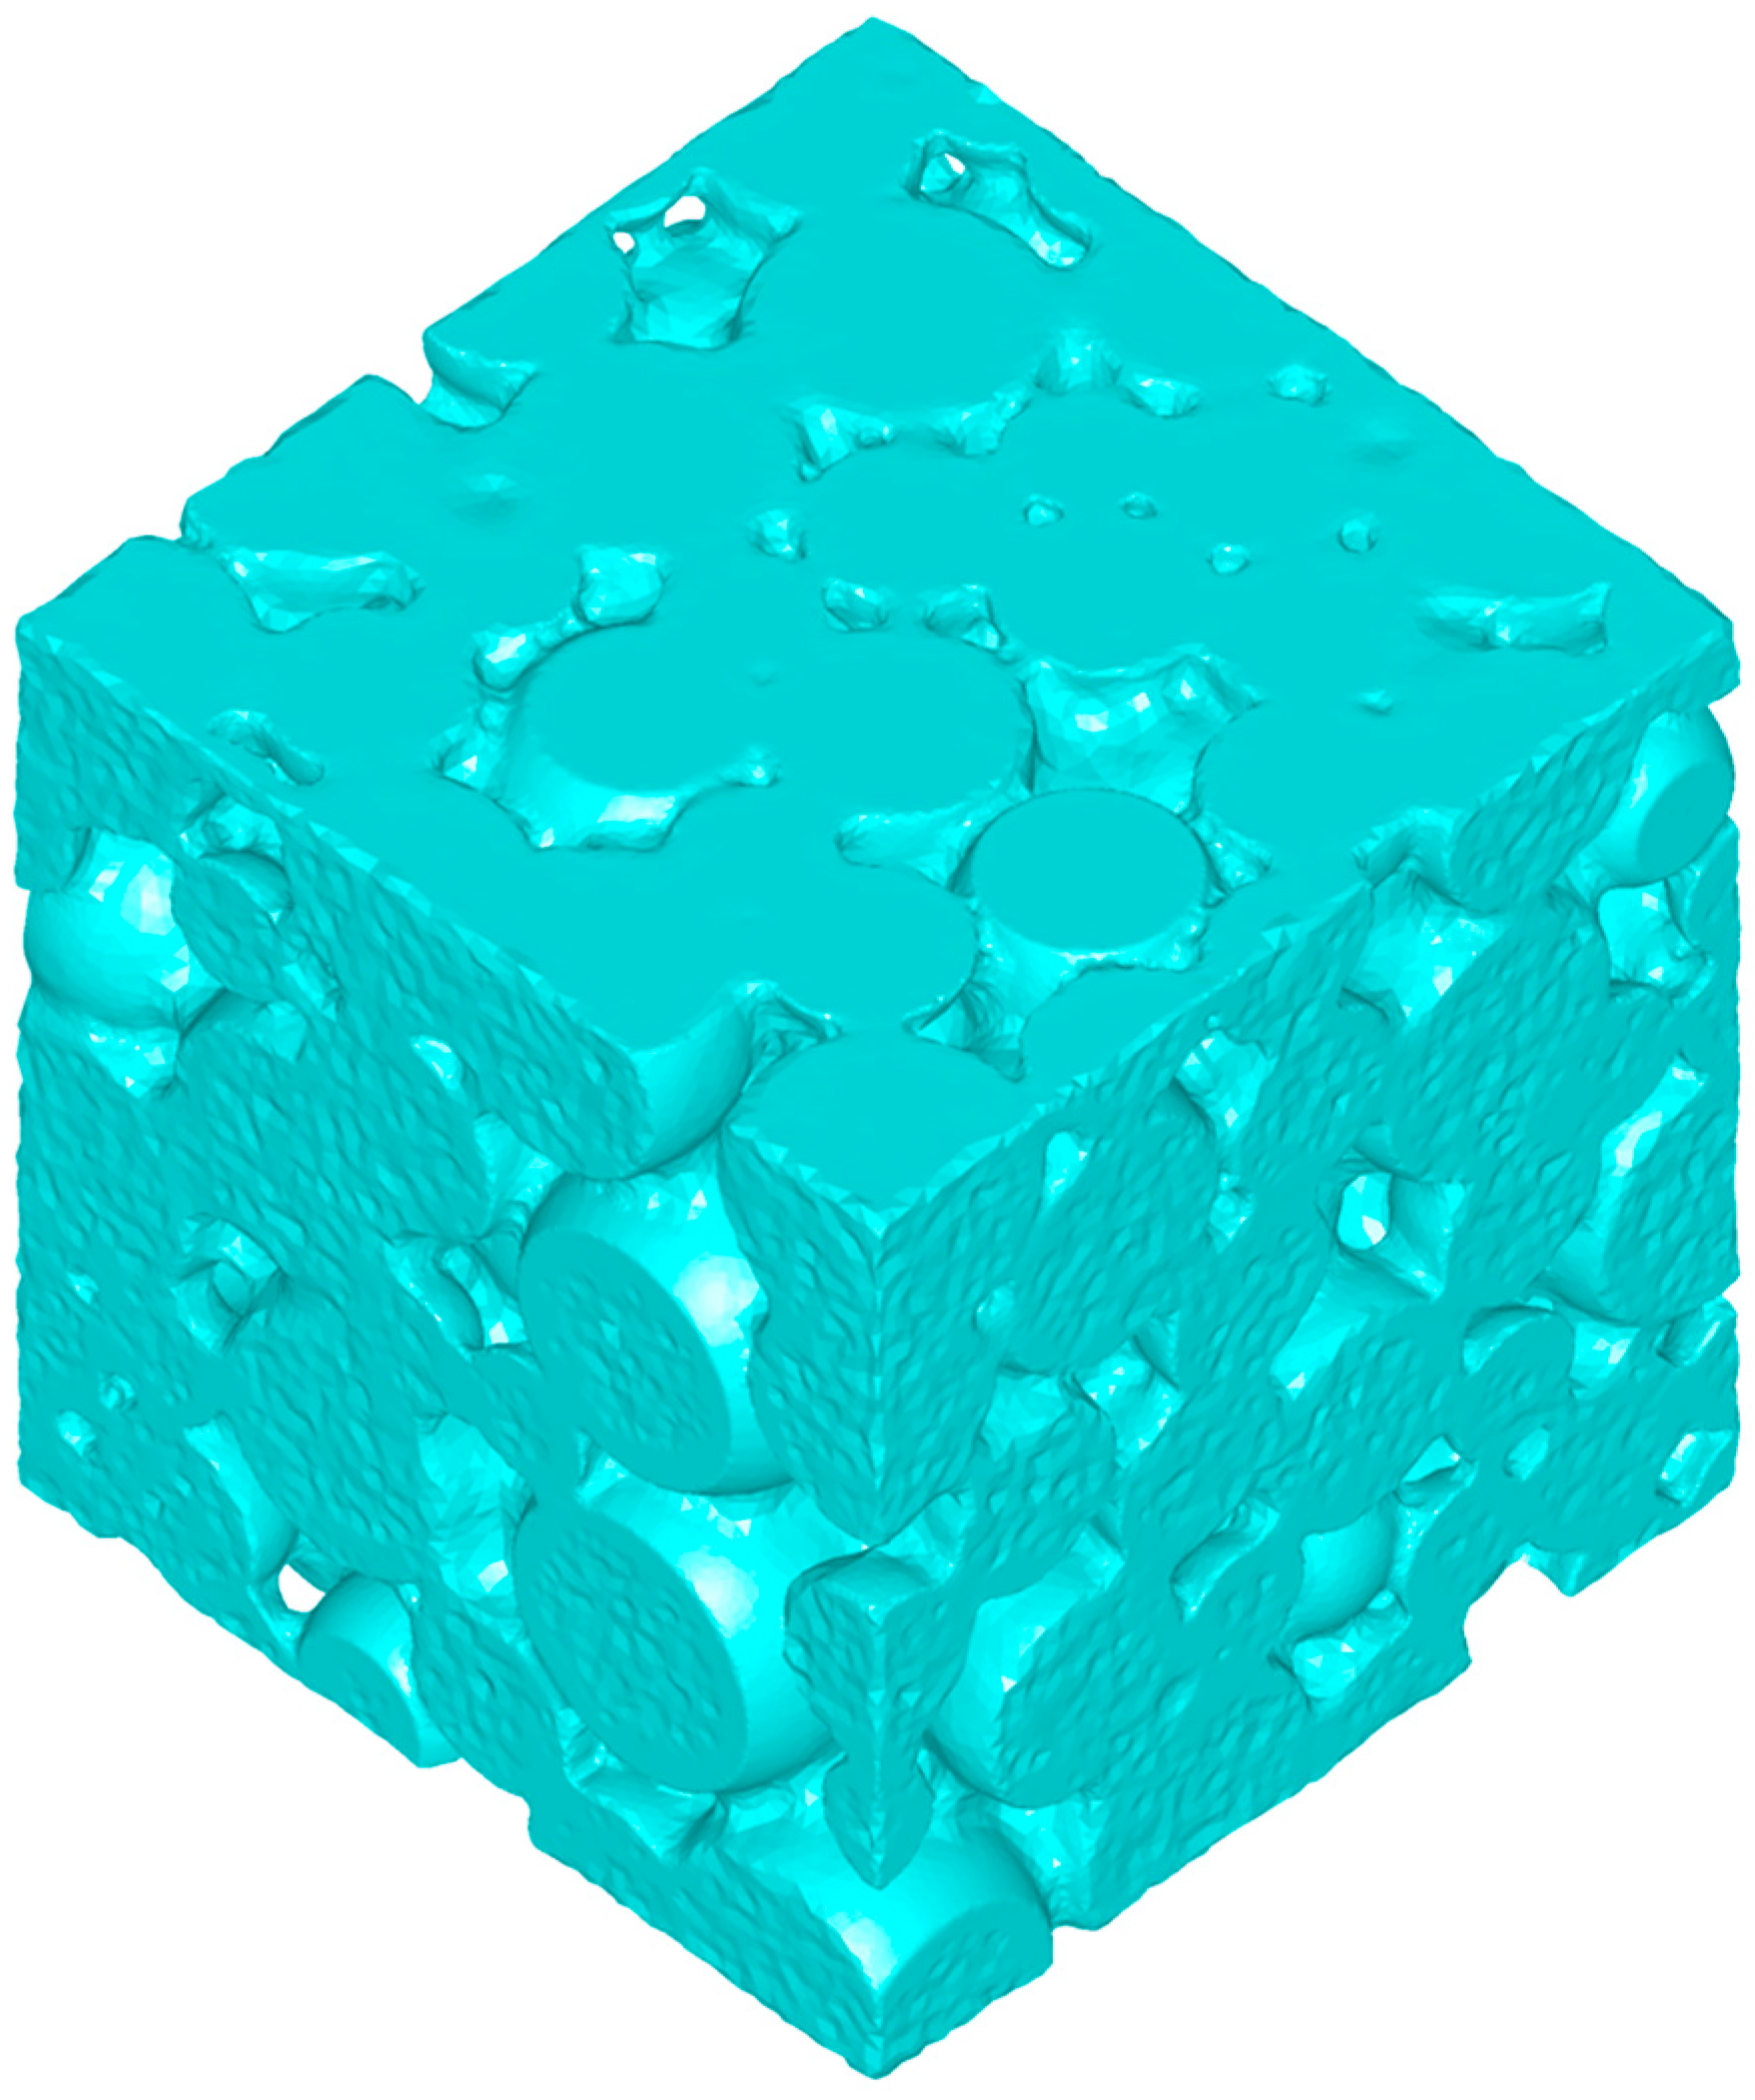
Three different catalyst structures are studied in this work. Two models were generated with the same properties as in the Novak et al. and Koci et al. studies [22,23] to validate the methodology. The first model used spherical particles with radii r1 = 4 and r2 = 8 and with mixing ratio of n1/n2 = 8 and fractional sintering level of 0.15. In the second model r1’ = 0.5 μm and r2’ = 1.5 μm with mixing ratio of n1’/n2’ = 32 and fractional sintering level of 0.15 were used. The third model was developed for the resolved-pore simulations in this work; it consists of 200 particles with rp = [4, 5, 6, 7, 8] μm and probability distribution of [0.32, 0.26, 0.23, 0.13, 0.06]. This model was made to make sure that the majority of macro-pores are larger than 1 μm to avoid the Knudsen flow conditions in any pore in which the flow is explicitly modeled. The final geometry was cut into a cubic shape of 42 × 42 × 42 μm in length, width and height (Figure 1). To mimic the deviation of the particles from perfect spheres a Laplacian smoothing function is applied to randomly selected vertices of the final geometry.
2.5.2. Mesh Parameters
A volumetric mesh was generated using tetrahedral cells with minimum mesh size of and maximum mesh size of , where is the particle radius in Section 2.5.1. The shrink-wrap method was carried out with resolution factor of 0.8. The Auto-node move method in Fluent meshing software was used to improve the quality of bad cells until a skewness factor <0.85 and orthogonal quality >0.10 was obtained.
2.5.3. Simulation Parameters
Figure 2 shows the computational domain. Two different cases are studied: (1) zero velocity at the top of the catalyst layer; (2) fixed inlet velocity upstream from the layer. Flow direction is from top to down, and inlet velocity () is set to 0.0001 m/s to insure laminar flow through the computational domain. In both cases operating temperature and pressure are set to 600 K and 1 atm, respectively, and the inlet mass fractions of O2, CO and CO2 were set to fixed values of 0.01, 0.01 and 0.0001, with nitrogen as inert material with mass fraction of 0.9799. Density of the fluid phase was calculated by ideal gas law which is reasonable for gas phase high temperature catalytic reactions. Constant dilute gas approximation was used for mass diffusion coefficient of the gas phase since the 97.99% of the gas phase consists of nitrogen. Typical alumina properties in catalytic converters were used for the solid phase. Heat conductivity and density of solid phase are set to 0.5 W/(m·K) and 550 kg/m3. Average meso-pore diameter ( is assumed to be 10 nm while mesoporosity and tortuosity of the solid phase are set to 0.5 and 1.7 [9,13].
The simulation was carried out in commercial finite volume software Ansys Fluent 16.2. Second order upwind scheme was used for numerical discretization of the partial differential equations. Under-relaxation factor of 0.5 was initially introduced until the system reached stability and it then gradually was increased to 0.8. The steady-state simulation was initialized with inlet parameter values. The simulations were carried out using 16 processors and 9.8 million computational cells. It took 20,000 iterations for the simulation to converge with an average iteration time of 30 s.
3. Results
3.1. Reconstructed Catalyst Properties and Validation
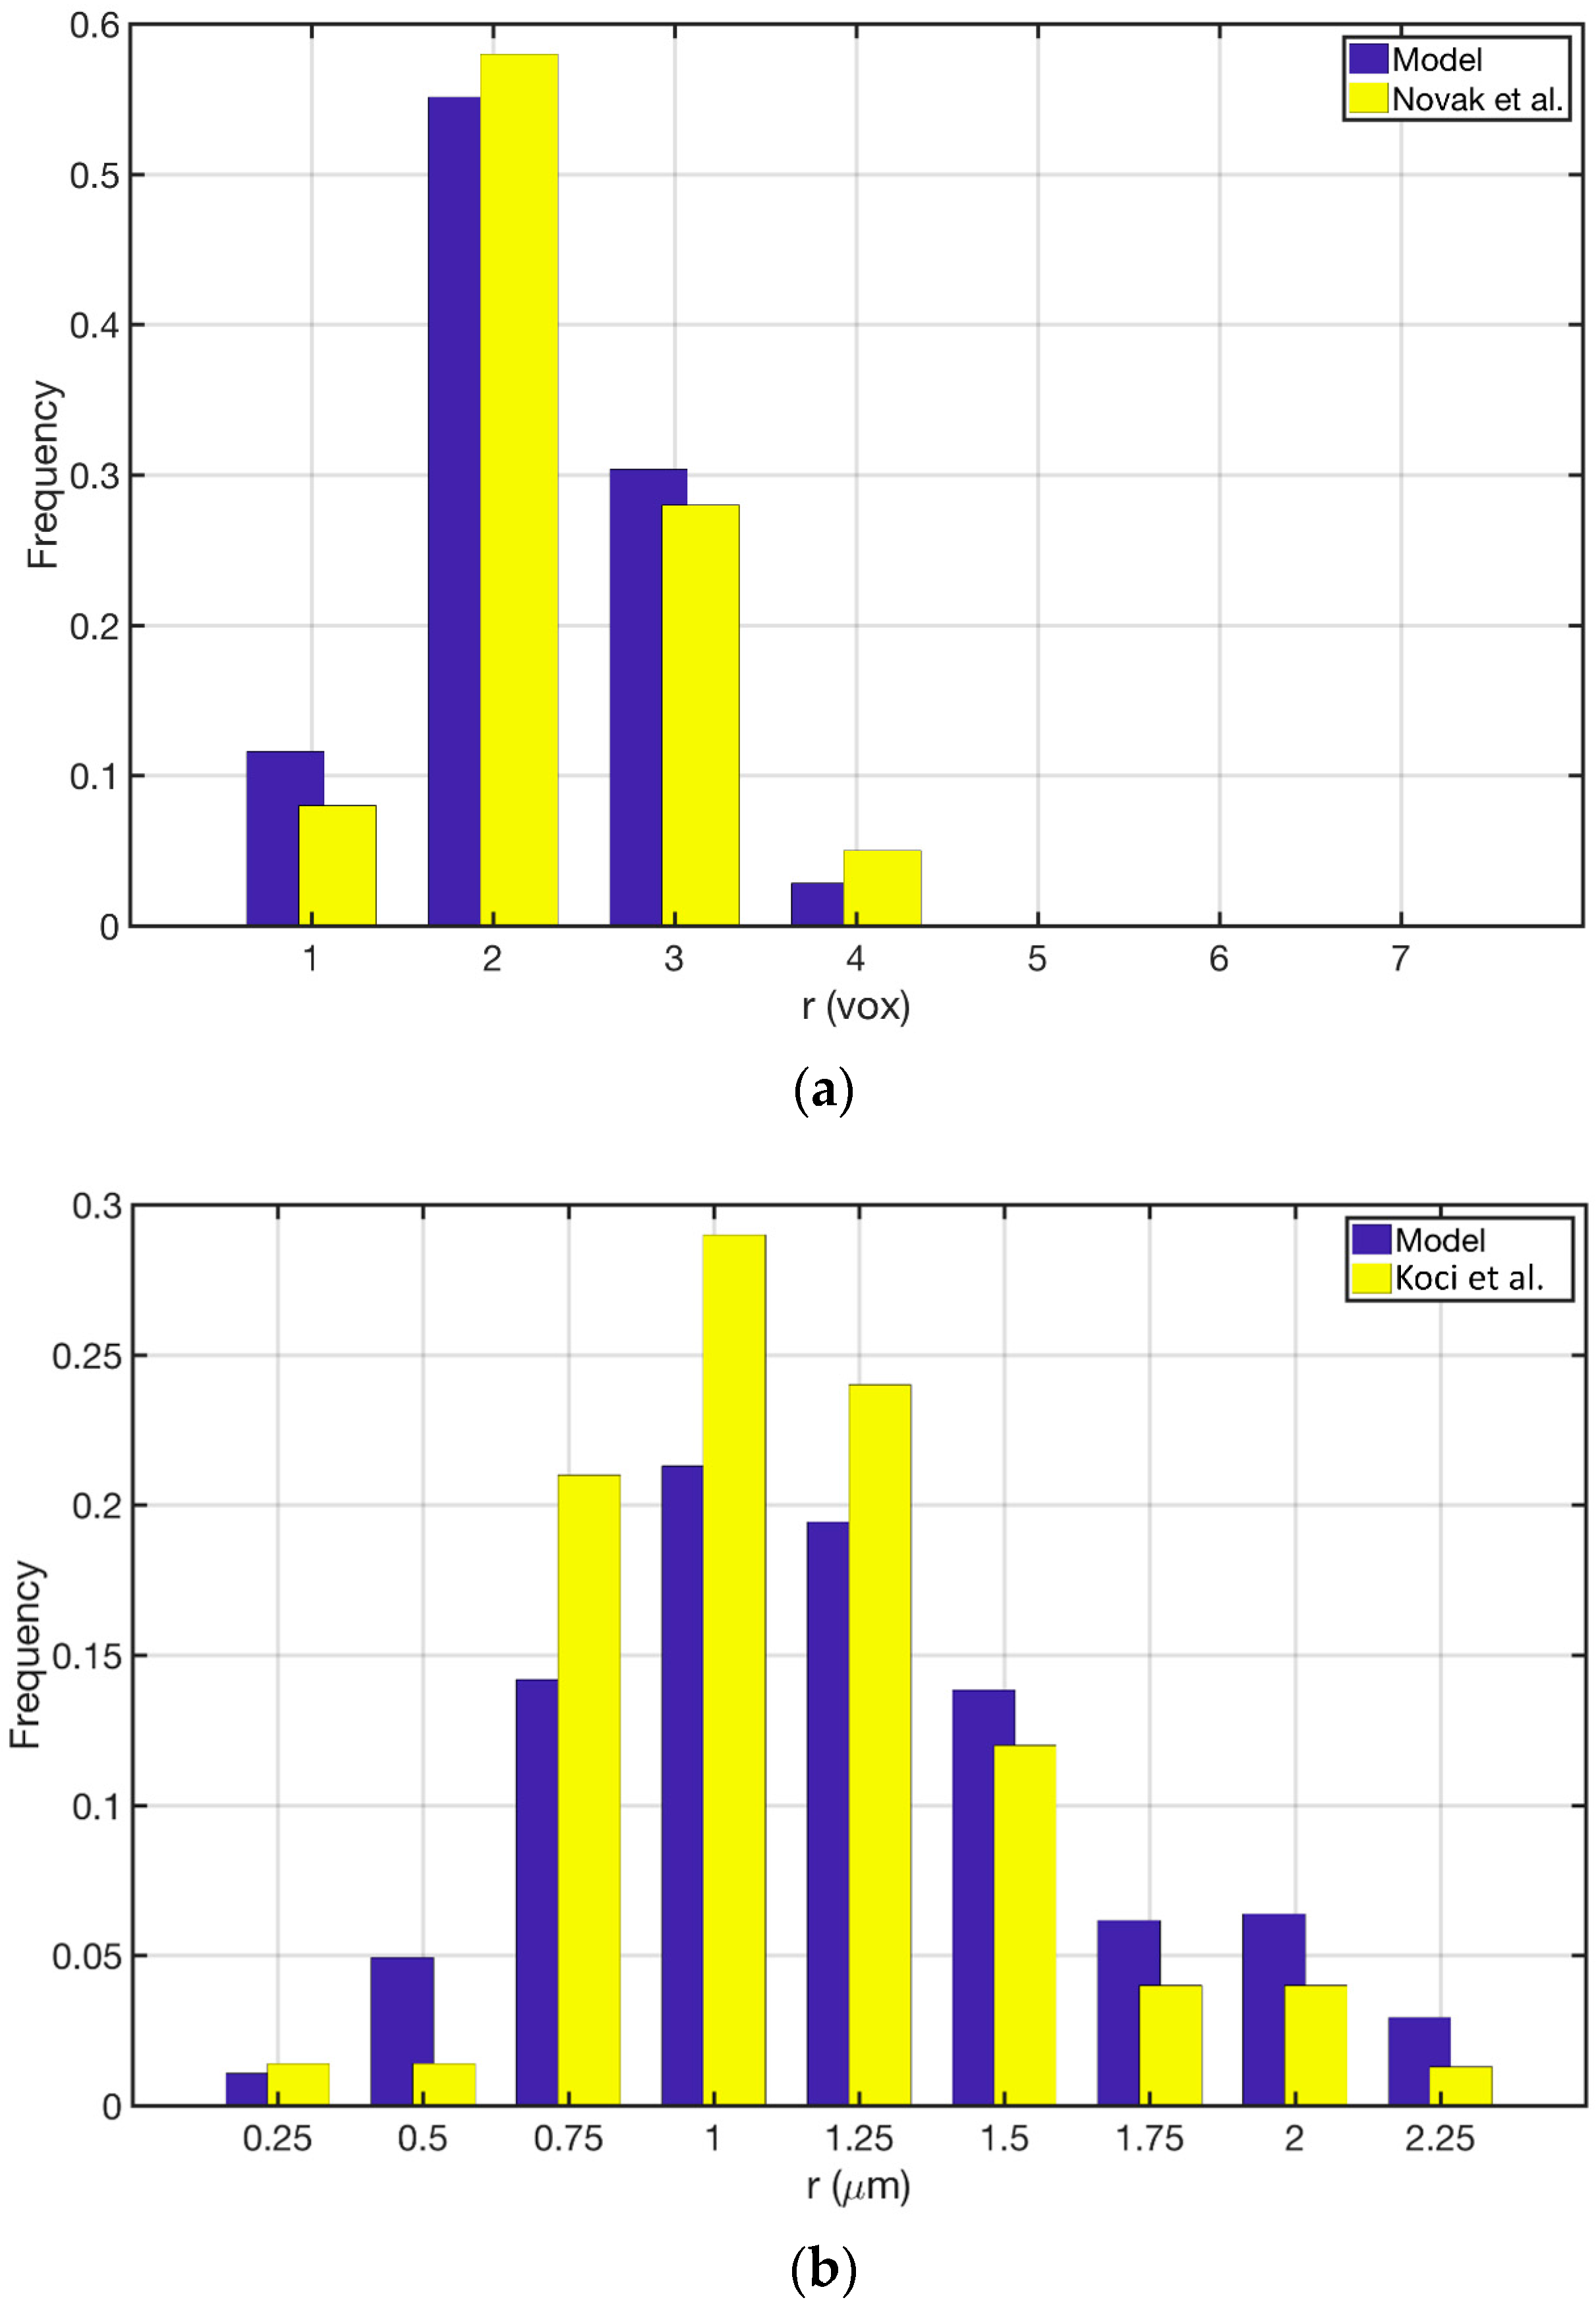
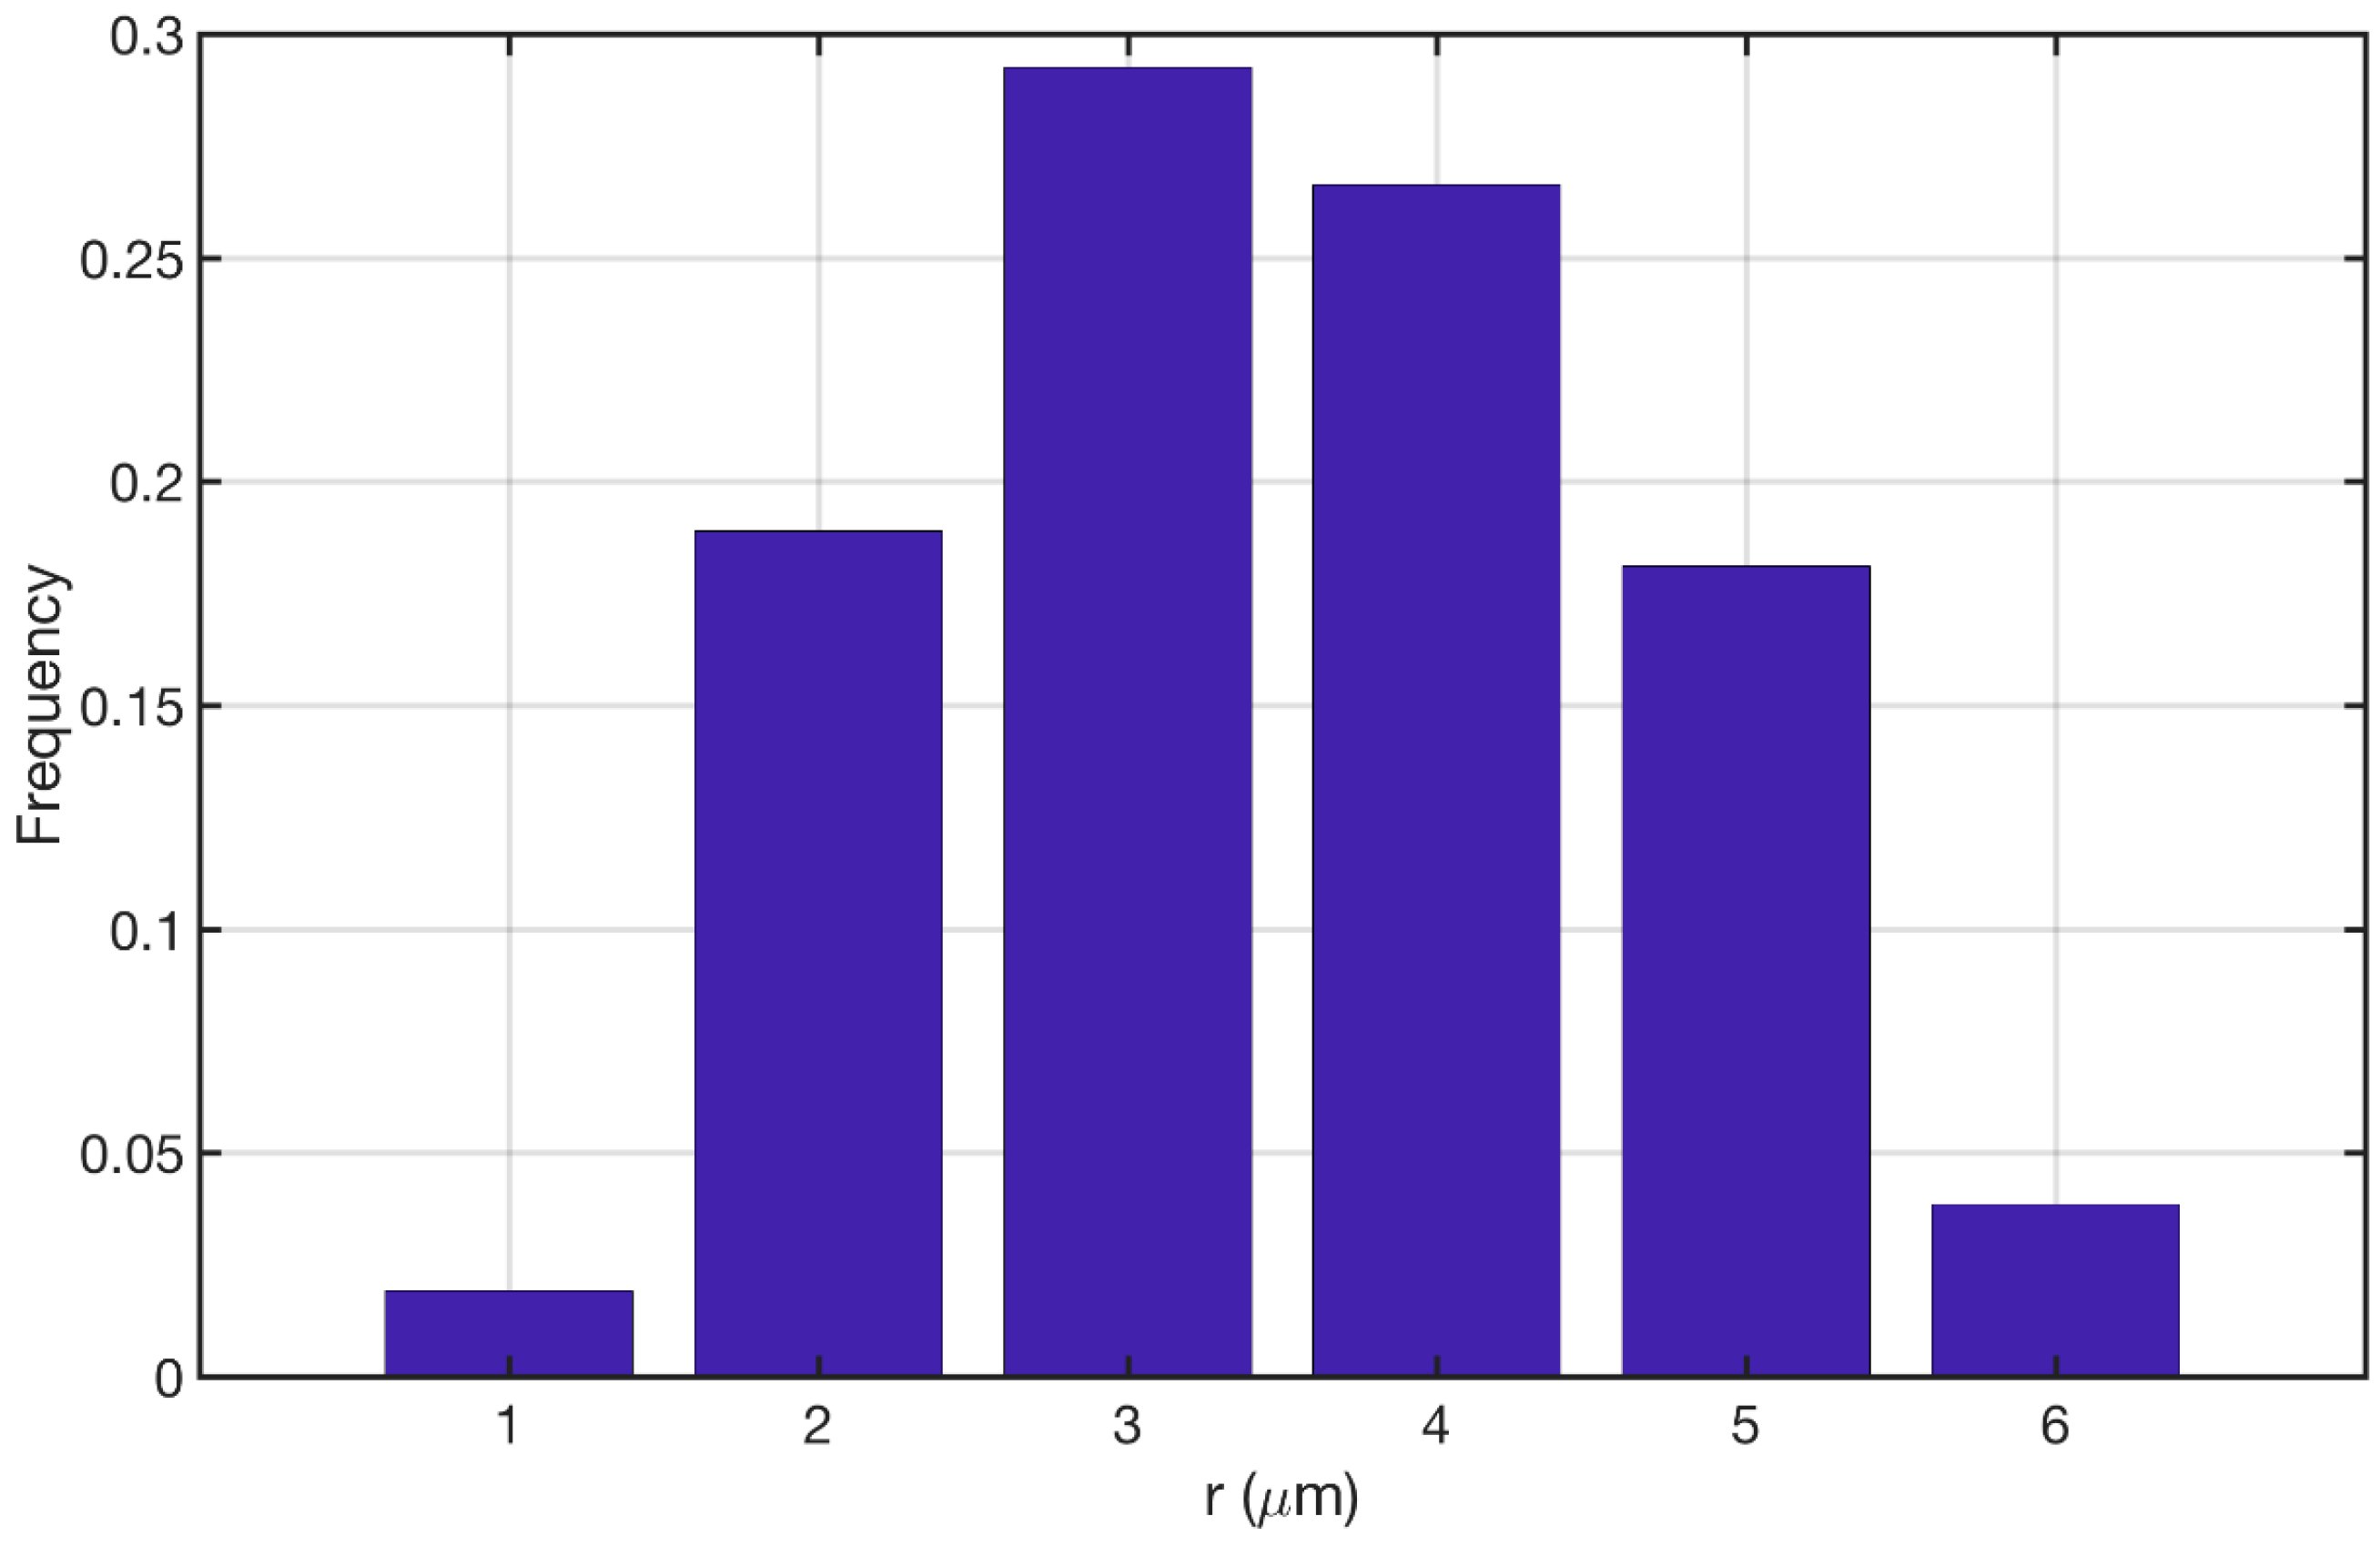
Figure 3a shows the comparison between the Novak et al. study [22] and its reproduction in the current study. The model was able to reproduce the same qualitative trend in pore size distribution while the quantitative discrepancy is kept below 10%. Figure 3b shows the comparison between the Koci et al. [23] study and the reproduction of their model in the current study. Our approach was able to produce the same qualitative trend for this model as well. Here the overall quantitative discrepancy between the two models is around 25%. The main sources of this discrepancy could be (1) Resolution of the discretization for MSI method; (2) The overall size of the constructed geometry; and (3) The force model parameters that are applied to the cluster of particles. Overall the proposed approach is capable of reproducing the pore size distributions given the uncertainties that both studies could introduce to the models. Figure 4 shows the pore size distribution of the model that is used for the simulations in the current study. The parameters are reported in Section 2.5.1. The averaged macro-pore size for this structure is 3.37 μm. It is depicted that the majority of the macro-pores are larger than 1 μm as was desired. The overall macro-porosity of the constructed geometry is 0.28. The tortuosity is evaluated using the pathfinder algorithm [32] and is equal to 1.85. This value is in agreement with the reported values in the literature [11,22,23,24].
3.2. Splines Accuracy
To ensure that the splines accurately can predict the reaction rates for the unseen data inside the interpolation domain, a four-dimensional grid of 5000 data points using the quasi-random number generator in MATLAB R2016a was generated, for which the steady-state solution of the complete mechanism was computed () as well as predicted values by splines (). The mean squared relative error (MSRE) as well as the maximum error for this data set were 0.5% and 1.5%, respectively. Both values are promising and show that the mapped rates are accurate enough for the computations.
3.3. CFD Results
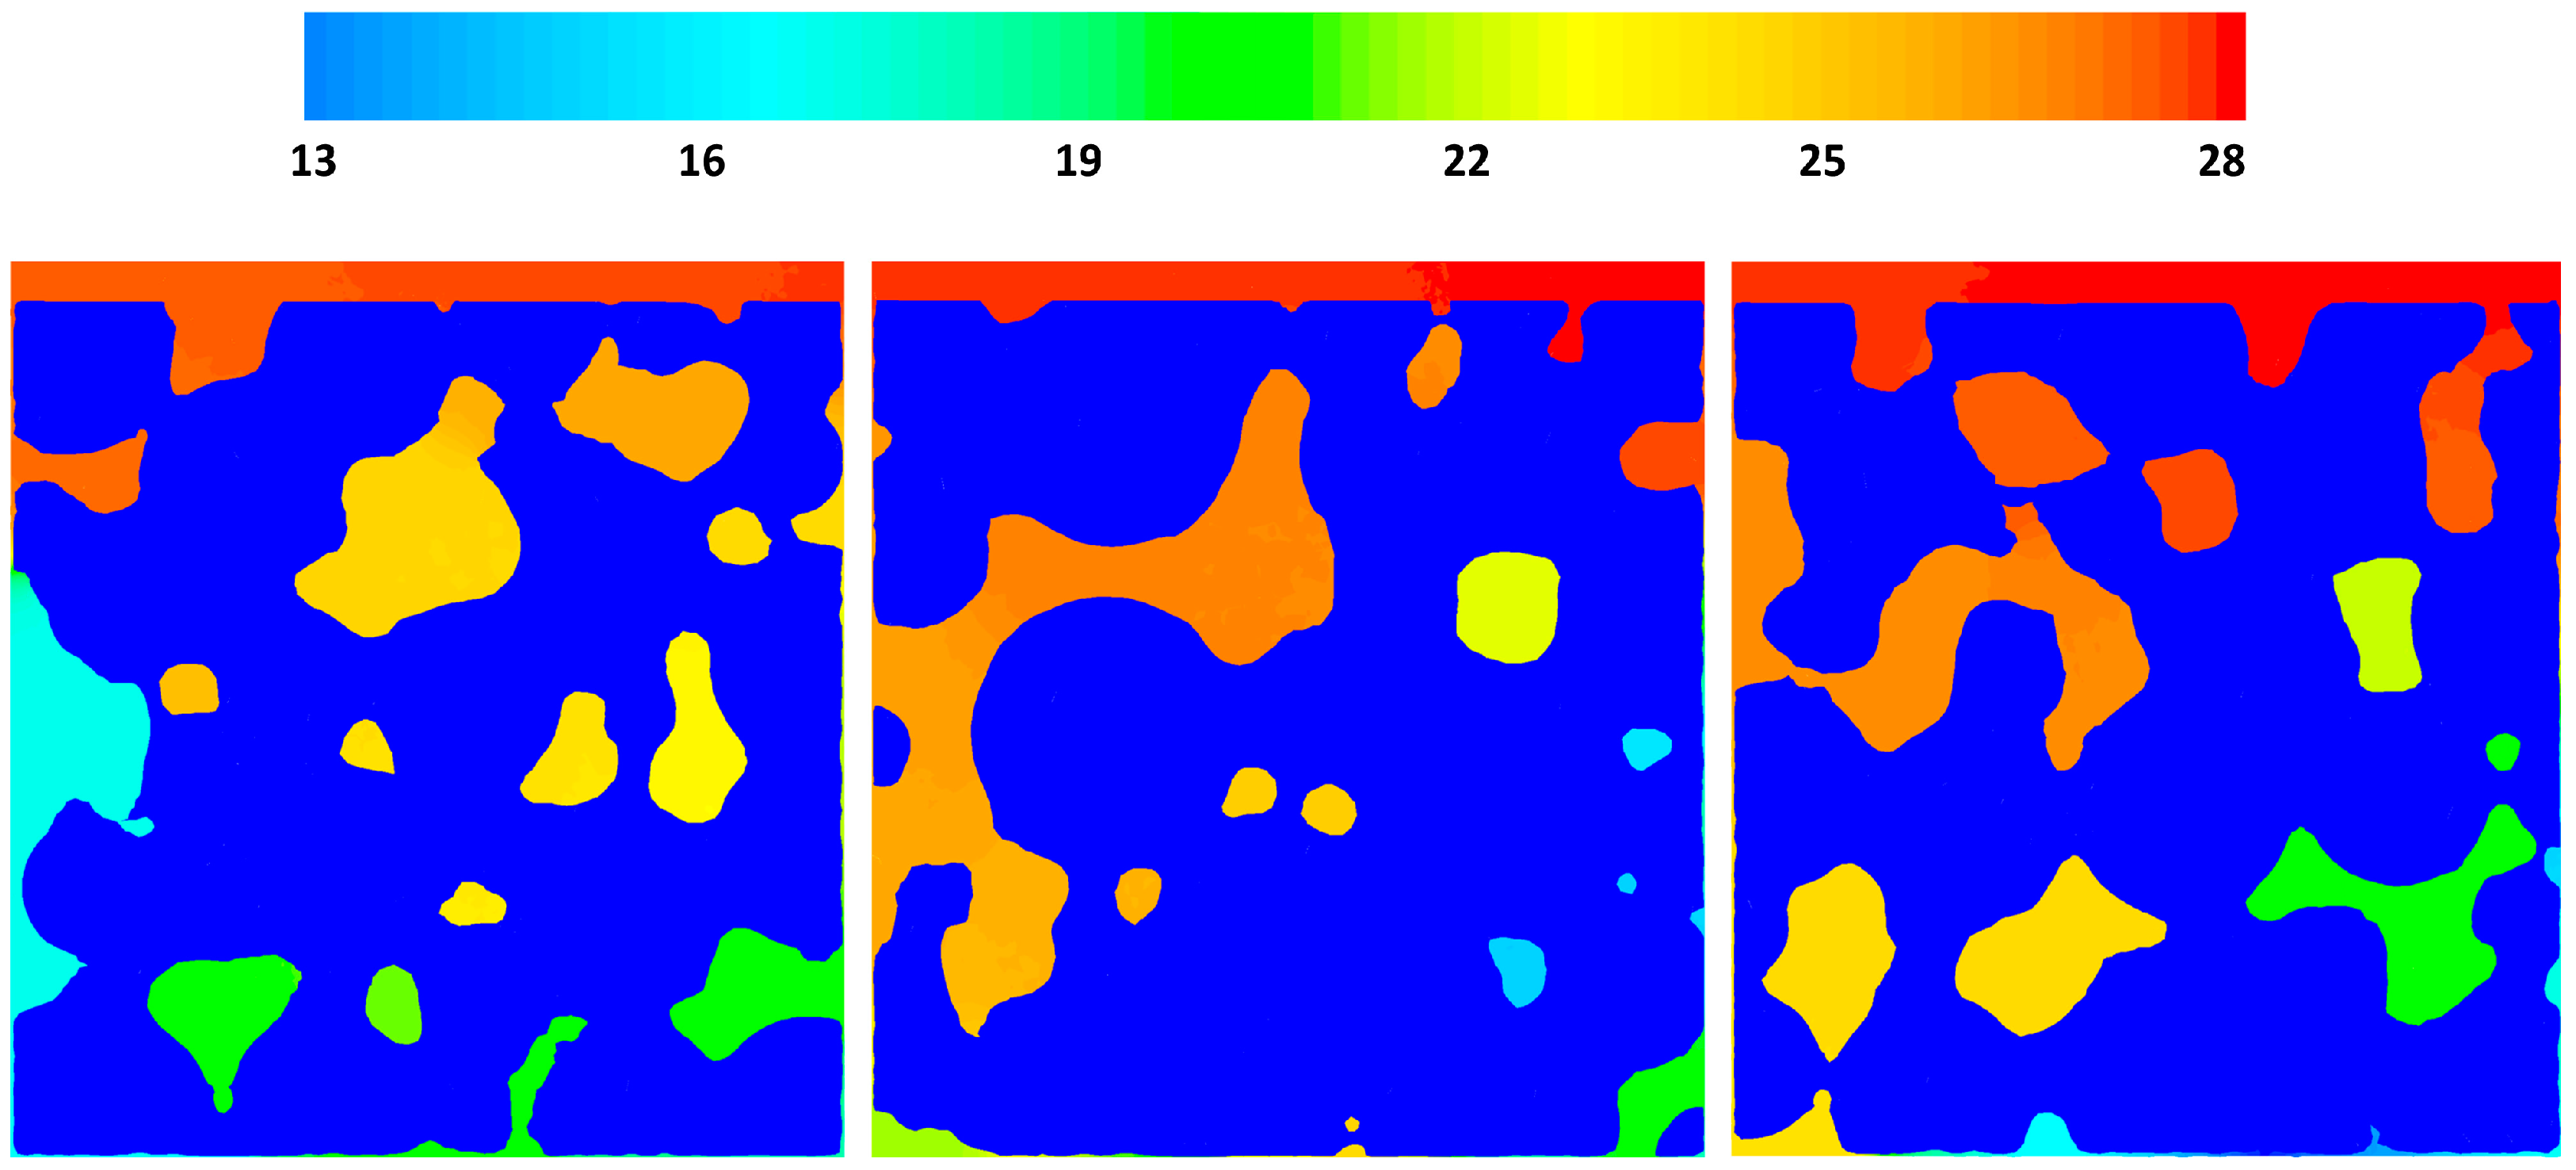
Figure 5 shows the pressure drop contours in three different cross sections of the geometry, x = 15, 0, −15 μm for case 2, where there is an inlet velocity. The local pressure is correlated to the local macro-pore dimensions as can be seen in the figure. Overall, for the given velocity it seems that pressure change is not significant, however, it should be noted that almost 14 Pa pressure change in a 42 μm structure could be considerable. The reaction rates are functions of the partial pressures of the gas phase species and a pressure change in a large structure with similar properties could have an effect on the local reaction rate patterns.
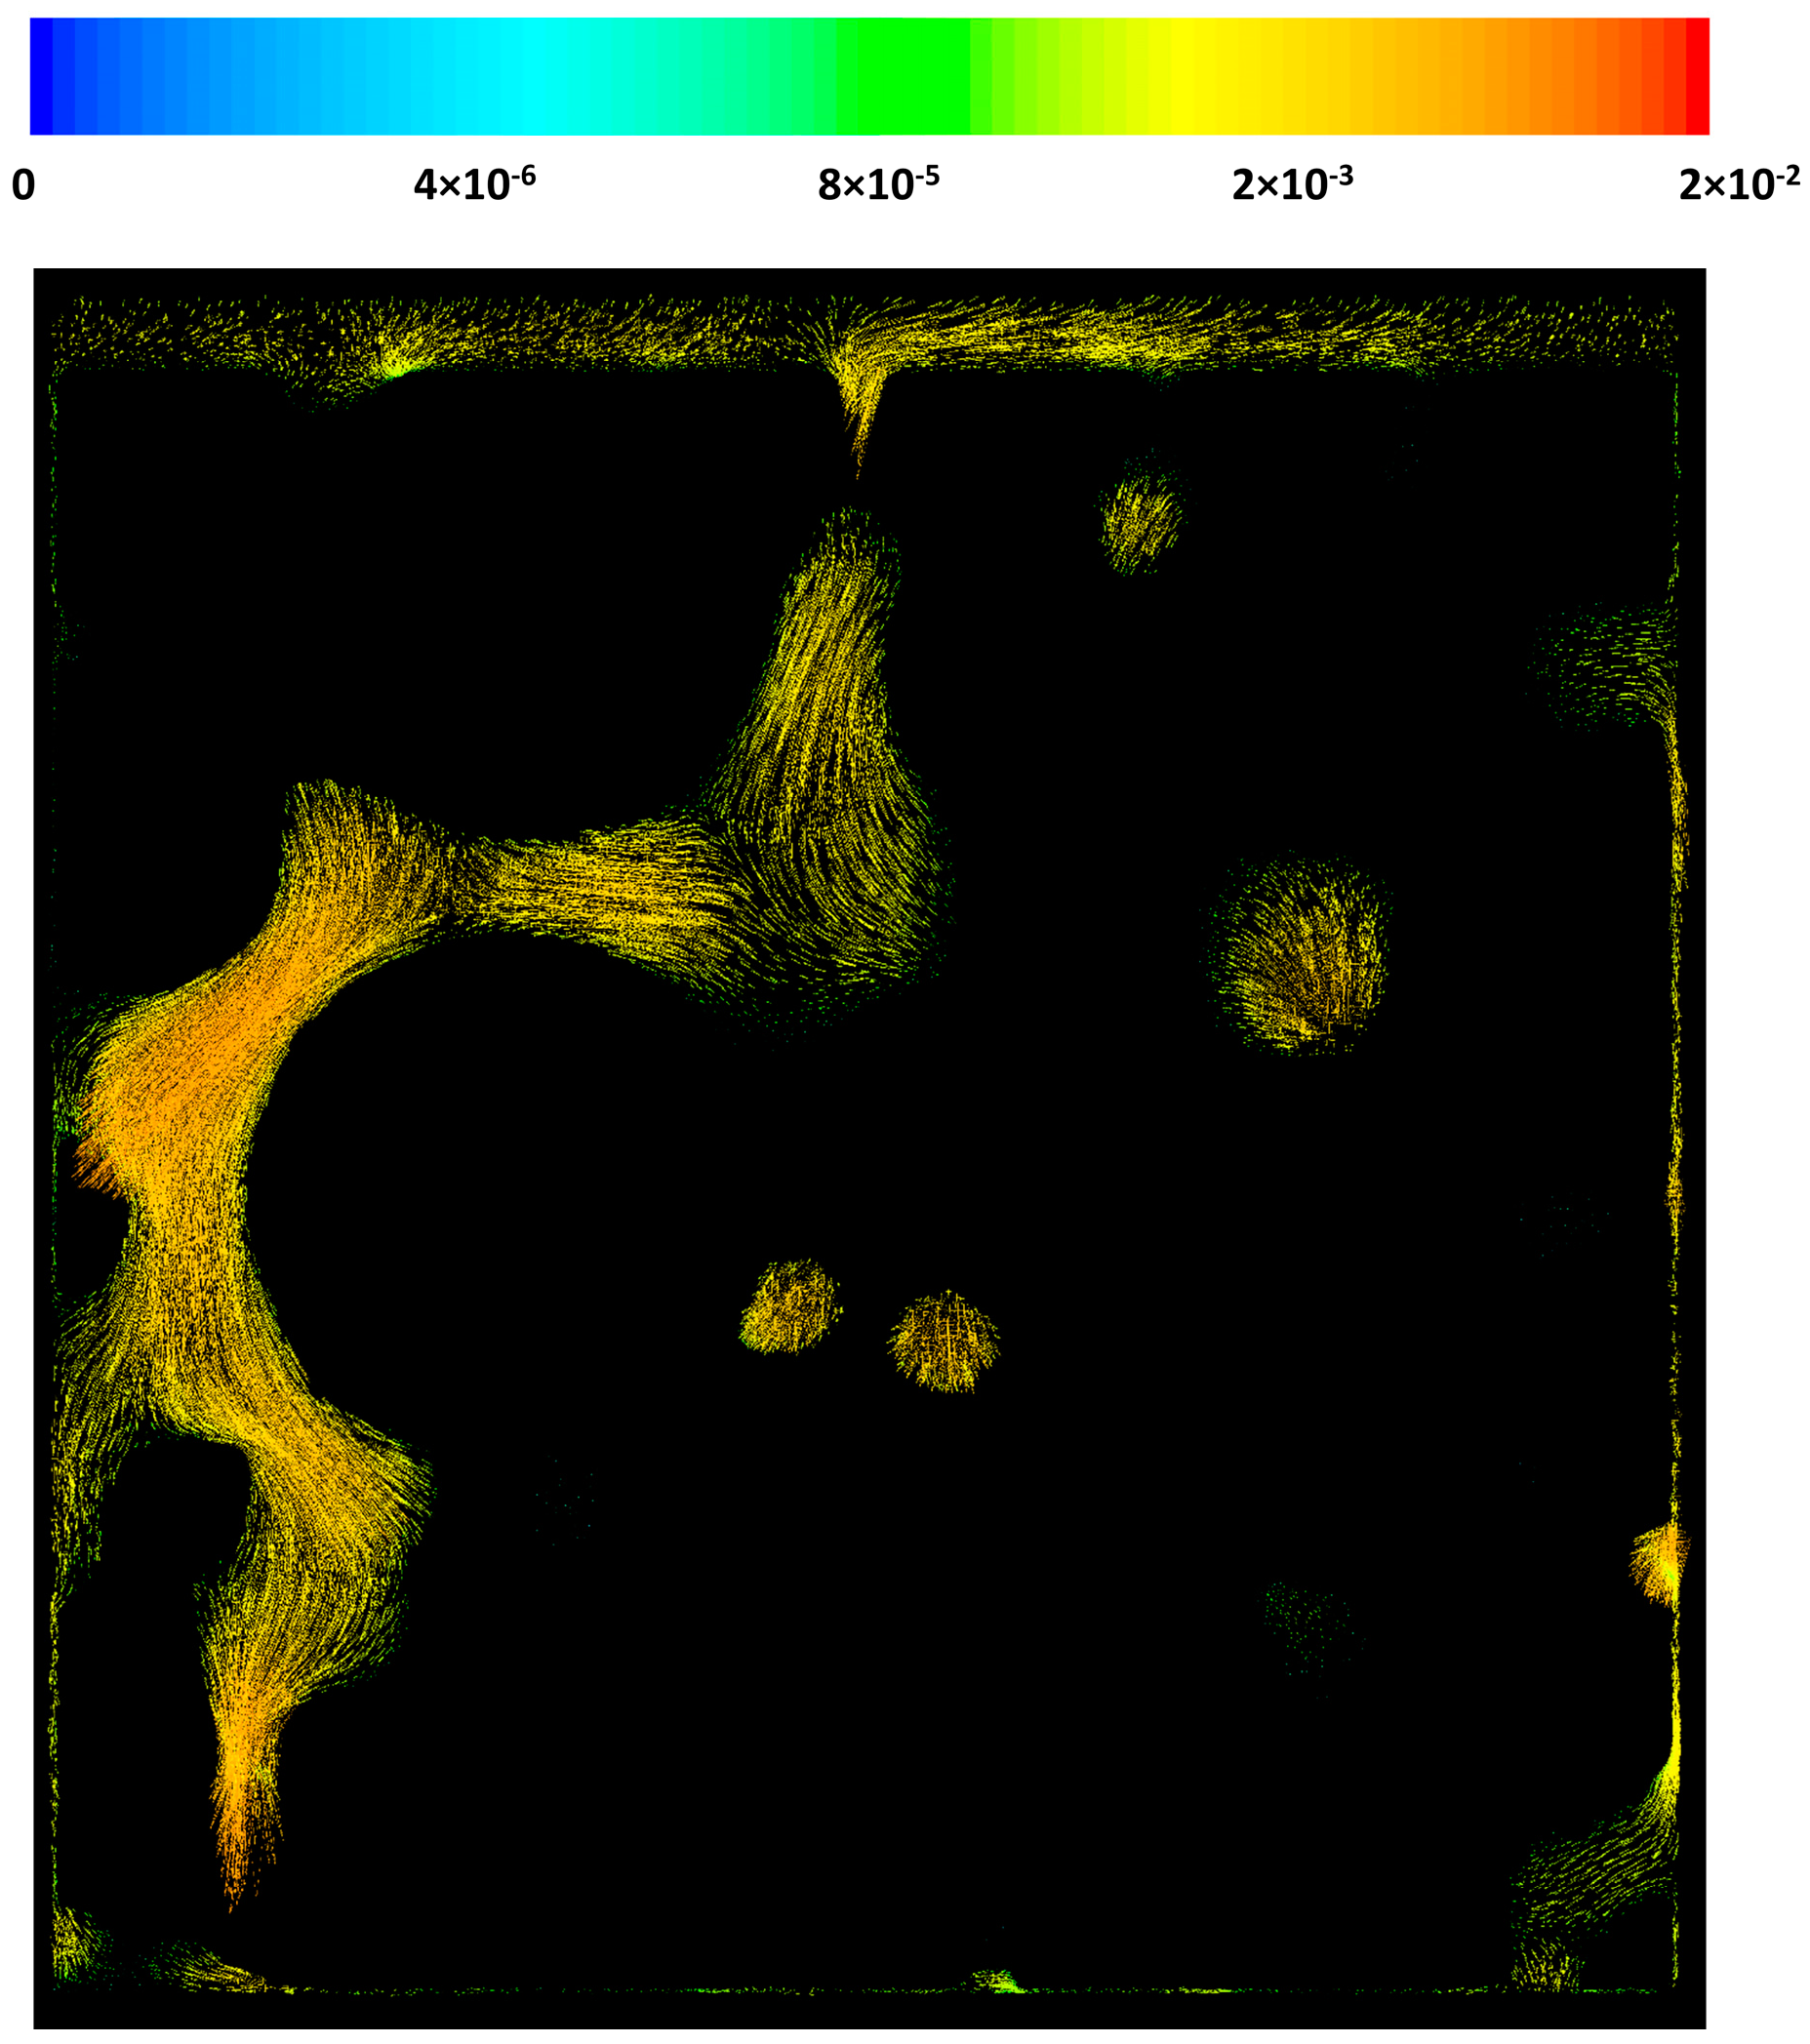
Figure 6 shows the velocity contours on the x = 0 plane for case 2 as well. It can be seen that the local macro-pore size variation results in extreme changes in the velocity profile. While in some regions the velocity magnitude is 0.02 m/s, in some other pores, the velocity could drop to as low as 1 μm/s. This extreme behavior could greatly affect the local heat and mass transfer patterns in the catalyst pellets or in a washcoat. The velocity components direction is another important factor that can affect heat and mass transfer in the structure. Although it is very hard to see from the figure, due to the structural properties of the geometry at certain parts of the catalyst layer the flow has a circulating pattern.
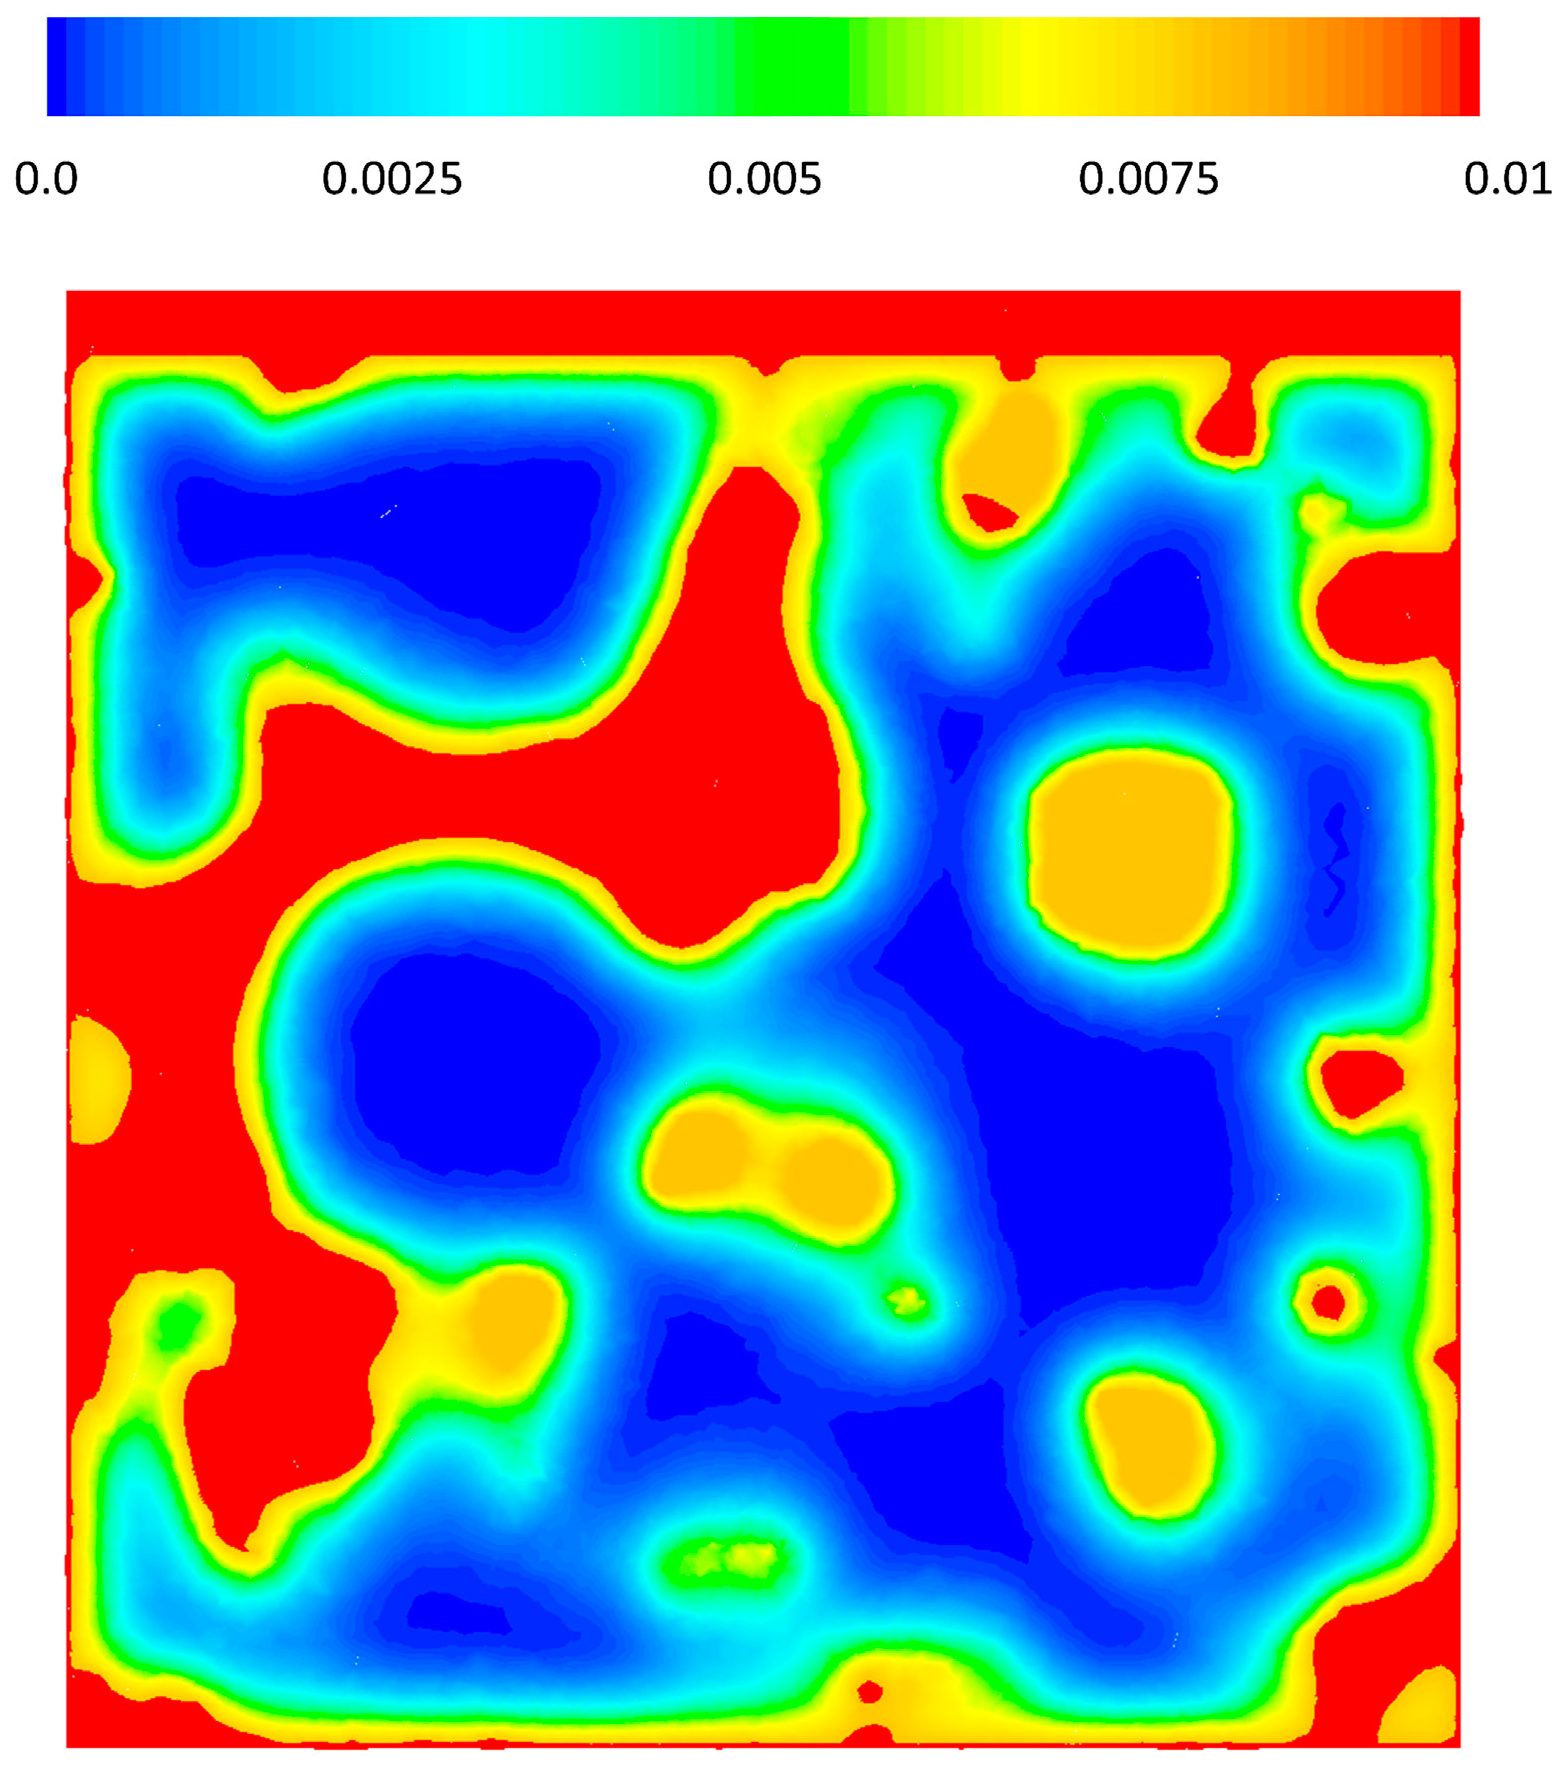
Figure 7 shows the reaction rate contours on a cross-sectional plane through the middle of the structure (x = 0). It is depicted that the rate is high and reaction happens really fast (red color represents the extreme value in the range). Therefore, the reaction is happening mostly on the outer surface of the solid phase. Inside the solid the rate becomes very small and almost zero (blue color represents the lowest value in the range). The sharp transition of the rate at the interface is represented by the fast changes in the color scheme. Therefore, it could be seen that in only a few micrometer-long distance the reaction rate changes almost three orders of magnitude. This extreme reaction rate causes a fluid to solid mass transfer limitation. It is also shown that the reaction rate is completely independent of the velocity of the gas phase in the pores and for both cases the reaction contours are very similar. It could be said that the reaction is completely controlled by the gas-solid diffusion and in the studied scale diffusion is independent of the gas velocity in the pores.
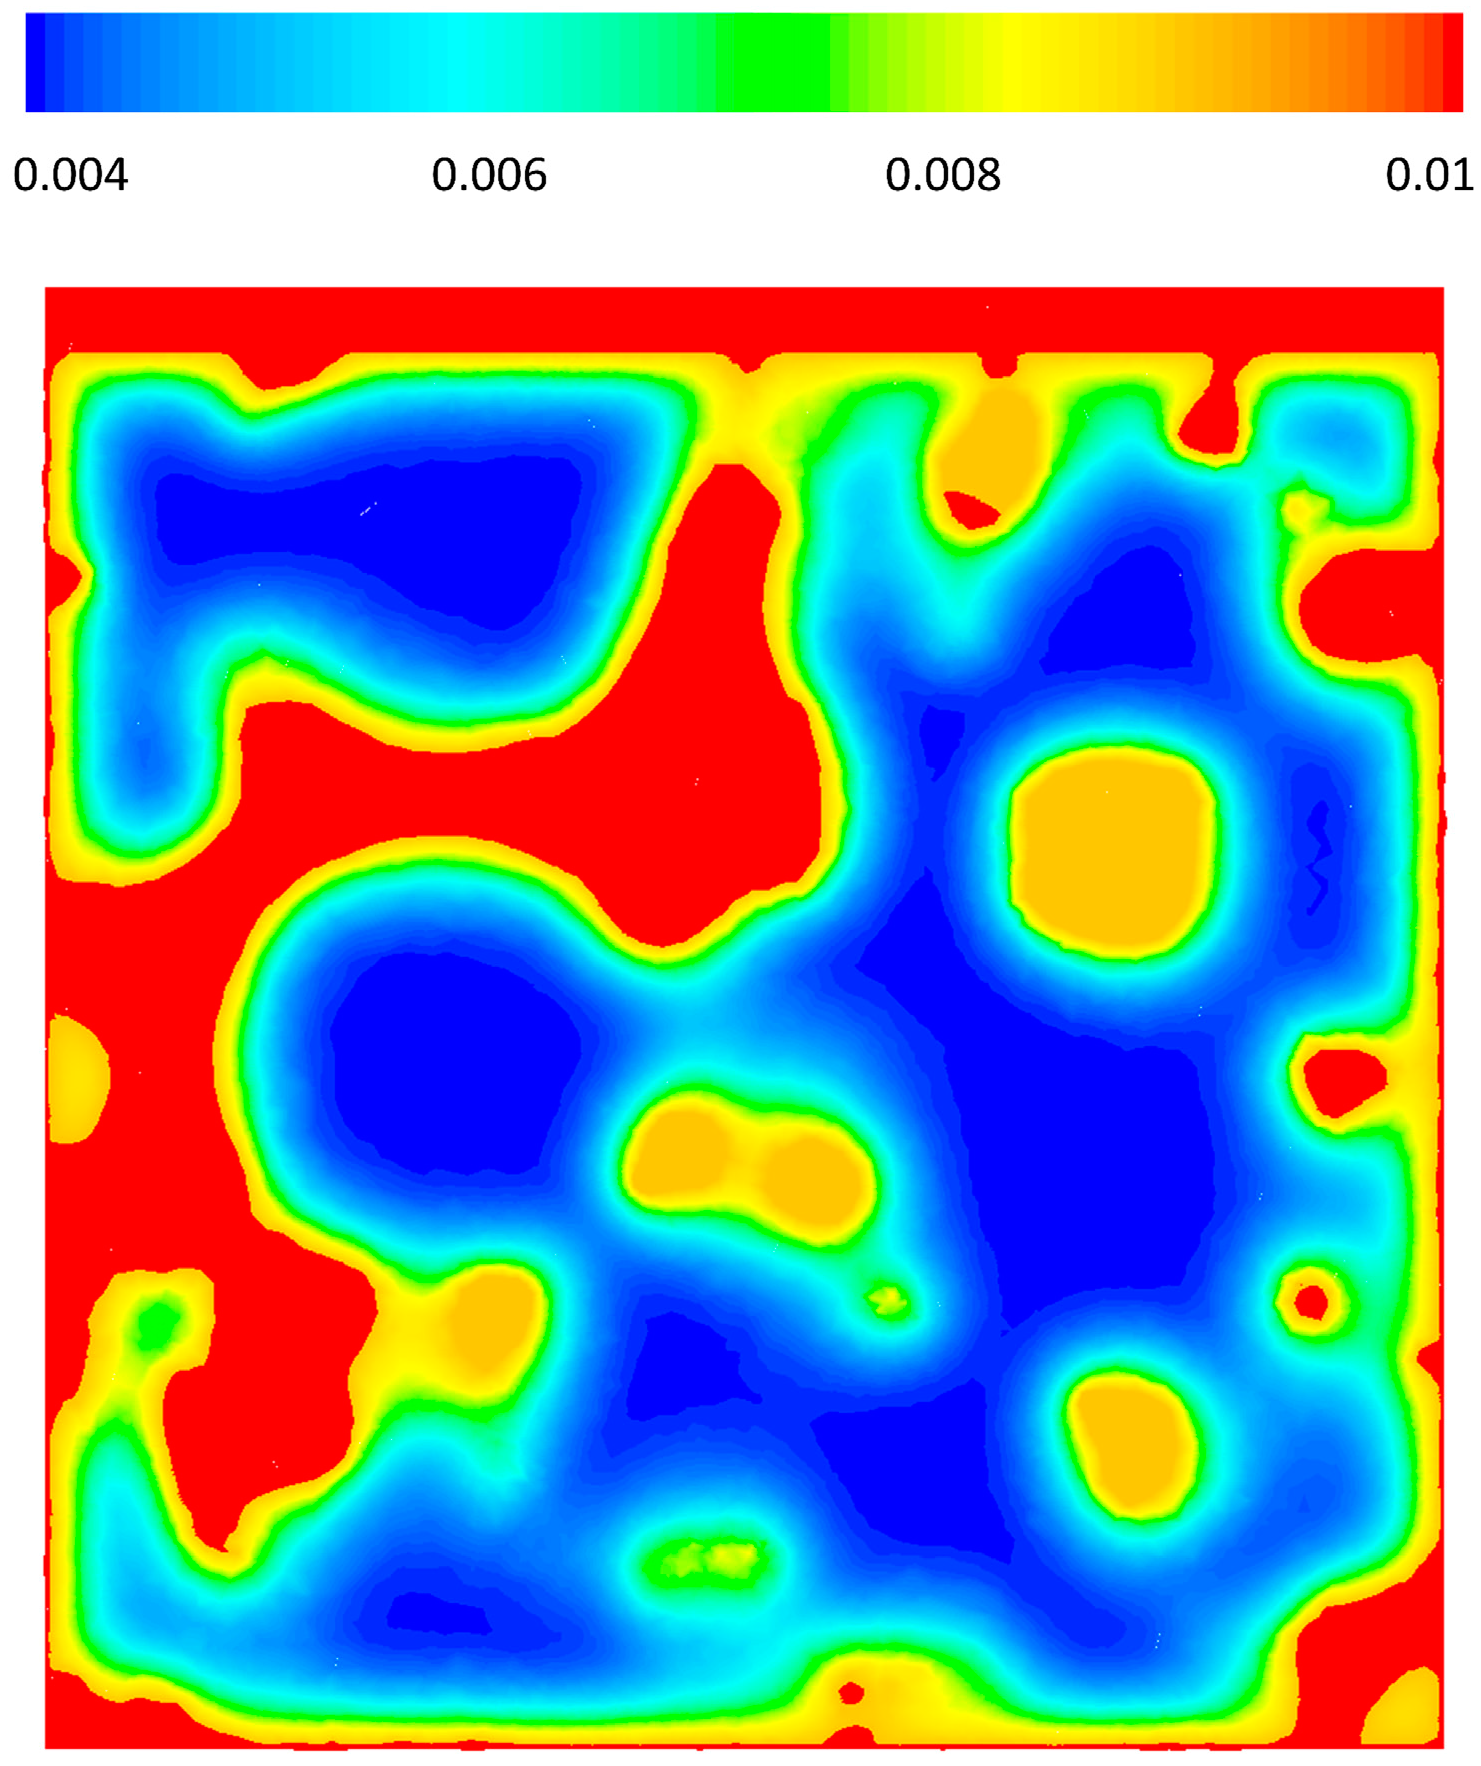
Figure 8 shows the contours of mole fraction of CO on a cross-sectional plane through the middle of the structure (x = 0). Comparison to Figure 7 should make it clear which regions are the micro/mesoporous material. The very fast reaction rate as well as the low diffusion rate in the solid phase leads to complete depletion of CO inside the solid. The very sharp change of the colors at the solid–fluid interface on the contour plot (red to yellow, and yellow to blue) depicts the domination of the reaction rate over the diffusion rate. The O2 profile looks similar to CO, and while O2 does not deplete completely, since there is no CO anymore the reaction stops (Figure 9). Despite the high consumption of the species on the surface of the pores and their exhaustion inside the meso-pores, in the fluid phase (inside the macro-pores) their concentration stays very high. Local concentration variations could be correlated to the macro-pore sizes as it is depicted in the figures where inside the smaller pores concentration of reactants drops more than the larger pore. Two important implications can be drawn from this point. First, while most diffusion models, particularly single pore models, predict complete depletion of the limiting reactant in the catalyst structure only a few micrometers from the surface interface with the bulk fluid for such a fast reaction (e.g., [11]), the reactant concentration could be still high in the macro-pores. An average value of the fluid and solid phase even in a resolved model shows a significant drop in the concentration of the reactants, however, that is only an average value and does not represent the macro-pore conditions at all, which leads to the second point.
The second implication is that consumption of the reactants in the macro-pores is highly dependent on the size of those pores. The reaction is extremely fast and almost the only place available for the reactants to react is the solid–fluid interface. Therefore, the more available surface the more efficient are the macro-pores. Unfortunately, the conventional catalyst area/weight parameter is not sufficient to study only the macro-pores “efficiency”. Assuming the macro-pores are spherical or cylindrical shapes, which is a conventional assumption, the surface/volume of an individual macro-pore is a function of . Therefore, larger macro-pores provide less available surface area for the reactants. Furthermore, it could be concluded that variation of species concentration inside the larger macro-pores is less than smaller ones.
4. Conclusions
The study has presented a successful approach for computational reconstruction and evaluation of the micro-scale catalytic structure. The workflow is extended to volumetric mesh generation and resolved-pore CFD simulation which is capable of integrating detailed kinetics mechanisms with the flow and transport. It is shown that local pore sizes impact velocity and transport profiles. The transport limitations at the solid–fluid interface have also been shown to be significant even though it is widely believed that the limiting reactant within a few microns of the surface of the washcoat is completely depleted. The results of this study emphasize the importance of the local porosity of the micro-structures and how those could affect the overall efficiency of the catalyst pellet. Most importantly, it shows that the reaction-diffusion inside the micro-structure is more complicated than most effective diffusion models take into account. Studies by Dong et al. [25] and Bufe et al. [26] have already shown that the transport and reaction are greatly affected by including the shape and structure parameters in lumped diffusion models. This study expands on those findings by explicit modeling of the porous structure and reproducing similar results. Hence, all these studies lead to the conclusion that having an accurate method using improved diffusion models with structural characteristic parameters is inevitable. Future work could focus on comparison of the resolved-pore model with existing reaction-diffusion models to highlight the important parameters in the models and potentially fundamentally improve the existing methods. Furthermore, the suggested workflow here could be used to investigate the more complex approaches such as 1p-kMC models of CO oxidation to address concerns that are highlighted by Matera and Reuter [10].
Acknowledgments
Acknowledgment is made to the Donors of the American Chemical Society Petroleum Research Fund for support of this research. The authors also would like to thank P. Koci and F. Stepanek for helpful discussions on this topic.
Author Contributions
Behnam Partopour developed the CFD models and ran the simulations and performed analysis of the results, under supervision of Anthony G. Dixon. Both authors contributed to the discussion of the results and the writing of the manuscript.
Conflicts of Interest
The authors declare no conflict of interest. The funding sponsors had no role in the design of the study; in the collection, analyses, or interpretation of data; in the writing of the manuscript, and in the decision to publish the results.
References
- Alavi, A.; Hu, P.; Deutsch, T.; Silvestrelli, P.L.; Hutter, J. CO oxidation on Pt(111): An Ab initio density functional theory study. Phys. Rev. Lett. 1998, 80, 3650–3653. [Google Scholar] [CrossRef]
- Chen, M.S.; Cai, Y.; Yan, Z.; Gath, K.K.; Axnanda, S.; Goodman, D.W. Highly active surfaces for CO oxidation on Rh, Pd, and Pt. Surf. Sci. 2007, 601, 5326–5331. [Google Scholar] [CrossRef]
- Carabineiro, S.A.C.; Silva, A.M.T.; Drazic, G.; Tavares, P.B.; Figueiredo, J.L. Effect of chloride on the sinterization of Au/CeO2 catalysts. Catal. Today. 2010, 154, 293–302. [Google Scholar] [CrossRef]
- Santos, V.P.; Carabineiro, S.A.C.; Bakker, J.J.W.; Soares, O.S.G.P.; Chen, X.; Pereira, M.F.R.; Orfao, J.J.M.; Figueiredo, J.L.; Gascon, J.; Kapteijn, F. Stablizied gold on cerium-modified cryotimelane: Highly active in low-temperature CO oxidation. J. Catal. 2014, 309, 58–65. [Google Scholar] [CrossRef]
- Rogal, J.; Reuter, K.; Scheffler, M. CO oxidation at Pd(100): A first-principles constrained thermodynamics study. Phys. Rev. B 2007, 75, 205433. [Google Scholar] [CrossRef]
- Rogal, J.; Reuter, K.; Scheffler, M. CO oxidation on Pd(100) at technologically relevant pressure conditions: First-principles kinetic Monte Carlo study. Phys. Rev. B 2008, 77, 155410. [Google Scholar] [CrossRef]
- Reuter, K.; Scheffler, M. First-principles kinetic Monte Carlo simulations for heterogeneous catalysis: Application to the CO oxidation at RuO2 (110). Phys. Rev. B 2006, 73, 045433. [Google Scholar] [CrossRef]
- Rogal, J.; Reuter, K.; Scheffler, M. First-principles statistical mechanics study of the stability of a subnanometer thin surface oxide in reactive environments: CO oxidation at Pd(100). Phys. Rev. Lett. 2007, 98, 046101. [Google Scholar] [CrossRef] [PubMed]
- Matera, S.; Reuter, K. First-principles approach to heat and mass transfer effects in model catalyst studies. Catal. Lett. 2009, 133, 156–159. [Google Scholar] [CrossRef]
- Matera, S.; Reuter, K. Transport limitations and bistability for in situ CO oxidation at RuO2 (110): First-principles based multiscale modeling. Phys. Rev. B 2010, 82, 085446. [Google Scholar] [CrossRef]
- Karadeniz, H.; Karakaya, C.; Tischer, S.; Deutschmann, O. Numerical modeling of stagnation-flows on porous catalytic surfaces: CO oxidation on Rh/Al2O3. Chem. Eng. Sci. 2013, 104, 899–907. [Google Scholar] [CrossRef]
- Montemore, M.M.; Montessori, A.; Succi, S.; Barroo, C.; Falcucci, G.; Bell, D.C.; Kaxiras, E. Effect of nanoscale flows on the surface structure of nanoporous catalysts. J. Chem. Phys. 2017, 146, 214703. [Google Scholar] [CrossRef] [PubMed]
- Roberts, A.P. Morphology and thermal conductivity of model organic aerogels. Phys. Rev. E 1996, 55, R1286–R1289. [Google Scholar] [CrossRef] [Green Version]
- Štěpánek, F.; Ansari, M.A. Computer simulation of granule microstructure formation. Chem. Eng. Sci. 2005, 60, 4019–4029. [Google Scholar] [CrossRef]
- Dudák, M.; Novák, V.; Kočí, P.; Marek, M.; Blanco-García, P.; Jones, G. Prediction of diffusivity and conversion of n-decane and CO in coated Pt/γ-Al2O3 catalyst depending on porous layer morphology. Appl. Catal. B Environ. 2014, 150–151, 446–458. [Google Scholar] [CrossRef]
- Dixon, A.G.; Nijemeisland, M. CFD as a design tool for fixed-bed reactors. Ind. Eng. Chem. Res. 2001, 40, 5246–5254. [Google Scholar] [CrossRef]
- Behnam, M.; Dixon, A.G.; Nijemeisland, M.; Stitt, E.H. A new approach to fixed bed radial heat transfer modeling using velocity fields from computational fluid dynamics simulations. Ind. Eng. Chem. Res. 2013, 52, 15244–15261. [Google Scholar] [CrossRef]
- Dixon, A.G.; Boudreau, J.; Rocheleau, A.; Troupel, A.; Taskin, M.E.; Nijemeisland, M.; Stitt, E.H. Flow, transport, and reaction interactions in shaped cylindrical particles for steam methane reforming. Ind. Eng. Chem. Res. 2012, 51, 15839–15854. [Google Scholar] [CrossRef]
- Wehinger, G.D.; Klippel, F.; Kraume, M. Modeling pore processes for particle-resolved CFD simulations of catalytic fixed-bed reactors. Comput. Chem. Eng. 2017, 101, 11–22. [Google Scholar] [CrossRef]
- Taskin, M.E.; Troupel, A.; Dixon, A.G.; Nijemeisland, M.; Stitt, E.H. Flow, transport, and reaction interactions for cylindrical particles with strongly endothermic reactions. Ind. Eng. Chem. Res. 2010, 49, 9026–9037. [Google Scholar] [CrossRef]
- Icardi, M.; Boccardo, G.; Marchisio, D.L.; Tosco, T.; Sethi, R. Pore-scale simulation of fluid flow and solute dispersion in three-dimensional porous media. Phys. Rev. E 2014, 90, 1–13. [Google Scholar] [CrossRef] [PubMed]
- Novák, V.; Kočí, P.; Marek, M.; Štěpánek, F.; Blanco-García, P.; Jones, G. Multi-scale modelling and measurements of diffusion through porous catalytic coatings: An application to exhaust gas oxidation. Catal. Today 2012, 188, 62–69. [Google Scholar] [CrossRef]
- Kočí, P.; Novák, V.; Štěpánek, F.; Marek, M.; Kubíček, M. Multi-scale modelling of reaction and transport in porous catalysts. Chem. Eng. Sci. 2010, 65, 412–419. [Google Scholar] [CrossRef]
- Kočí, P.; Štěpánek, F.; Kubíček, M.; Marek, M. Meso-scale modelling of CO oxidation in digitally reconstructed porous Pt/γ-Al2O3 catalyst. Chem. Eng. Sci. 2006, 61, 3240–3249. [Google Scholar] [CrossRef]
- Dong, Y.; Keil, F.J.; Korup, O.; Rosowski, F.; Horn, R. Effect of the catalyst pore structure on fixed-bed reactor performance of partial oxidation of n-butane: A simulation study. Chem. Eng. Sci. 2015, 142, 299–309. [Google Scholar] [CrossRef]
- Bufe, A.; Klee, M.; Wehinger, G.; Turek, T. 3D Modeling of a Catalyst Layer with Transport Pore for Fischer-Tropsch Synthesis. Chem. Ing. Tech. 2017, 89, 1385–1390. [Google Scholar] [CrossRef]
- Novak, V.; Štěpánek, F.; Kočí, P.; Marek, M.; Kubicek, M. Evaluation of local pore sizes and transport properties in porous catalysts. Chem. Eng. Sci. 2010, 65, 2352–2360. [Google Scholar] [CrossRef]
- Partopour, B.; Dixon, A.G. An integrated workflow for resolved-particle packed bed models with complex particle shapes. Powder Technol. 2017, 322, 258–272. [Google Scholar] [CrossRef]
- Partopour, B.; Dixon, A.G. Computationally efficient incorporation of microkinetics into resolved-particle CFD simulations of fixed-bed reactors. Comput. Chem. Eng. 2016, 88, 126–134. [Google Scholar] [CrossRef]
- Tartakovsky, A.M. Langevin model for reactive transport in porous media. Phys. Rev. E 2010, 82, 026302. [Google Scholar] [CrossRef] [PubMed]
- Fuller, E.N.; Schettler, P.D.; Giddings, J.C. A new method for prediction of binary gas-phase diffusion coefficients. Ind. Eng. Chem. 1966, 16, 551. [Google Scholar] [CrossRef]
- Sobieski, W. The use of Path Tracking Method for determining the tortuosity field in a porous bed. Granul. Matter 2016, 18, 72. [Google Scholar] [CrossRef]
Figure 1.
The reconstructed geometry using the proposed workflow.
Figure 2.
Computational domain and boundary conditions.
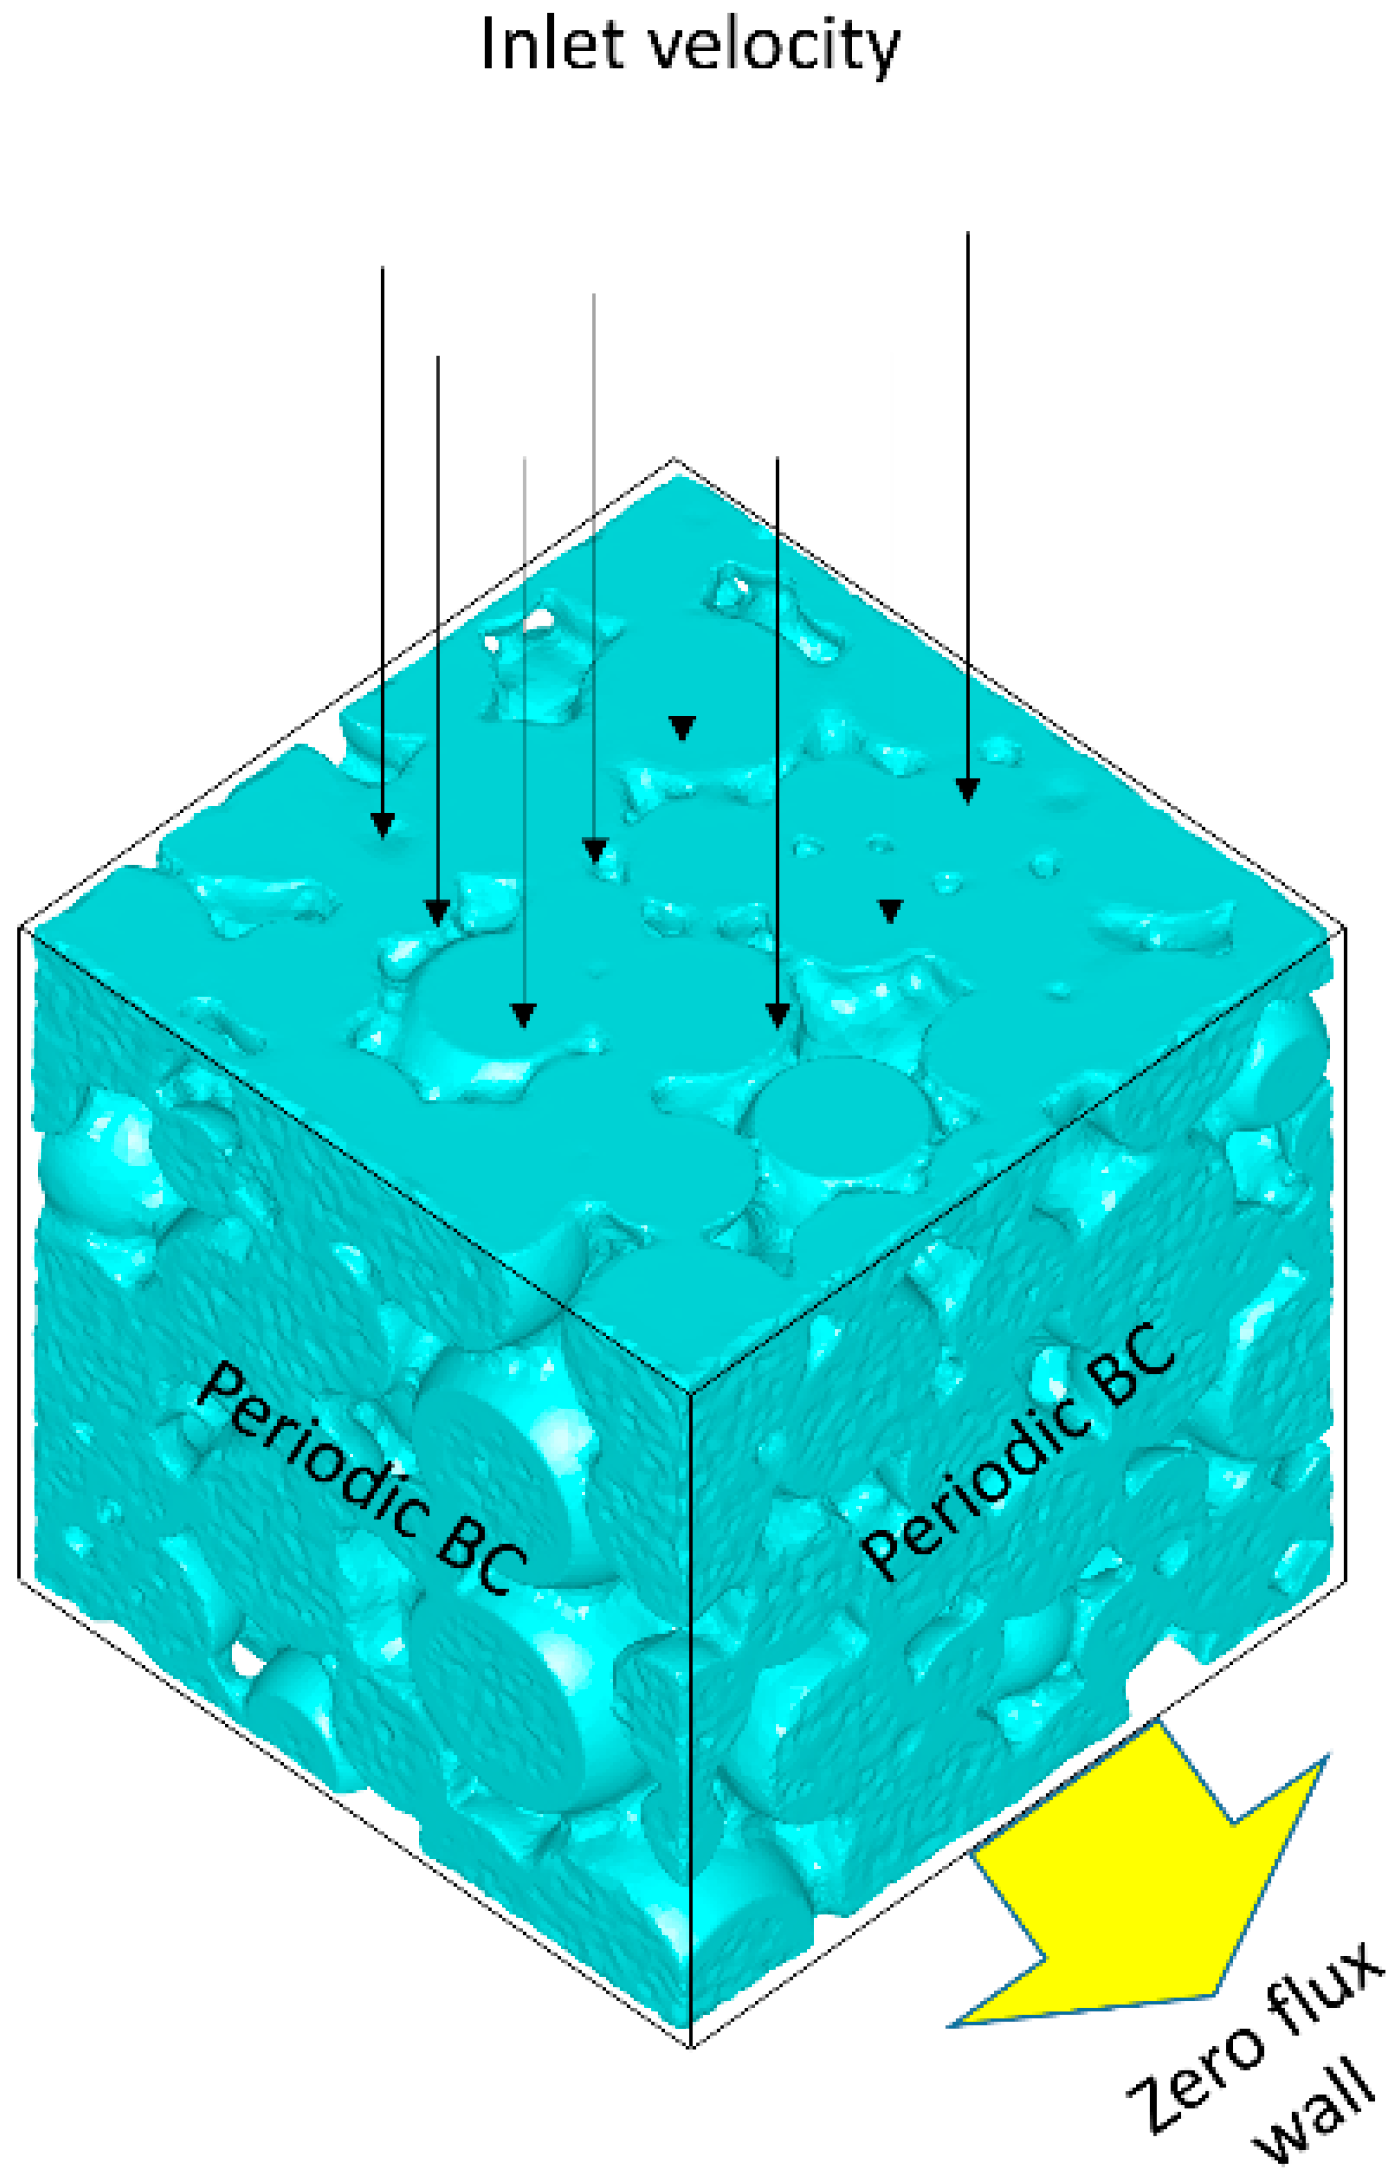
Figure 3.
Comparison of the pore size distribution between the current study and: (a) Novak et al., 2010; (b) Koci et al., 2010.
Figure 3.
Comparison of the pore size distribution between the current study and: (a) Novak et al., 2010; (b) Koci et al., 2010.
Figure 4.
Pore size distribution of the reconstructed catalyst for the present study.
Figure 5.
Relative pressure (Pabs − 101,300) gradients on cross-sectional planes x = −1.5, x = 0 and x = 1.5.
Figure 5.
Relative pressure (Pabs − 101,300) gradients on cross-sectional planes x = −1.5, x = 0 and x = 1.5.
Figure 6.
Velocity vectors on a cross-sectional plane, x = 0.
Figure 7.
Reaction rates (mol/(m3·s)) on a cross-sectional plane, x = 0.
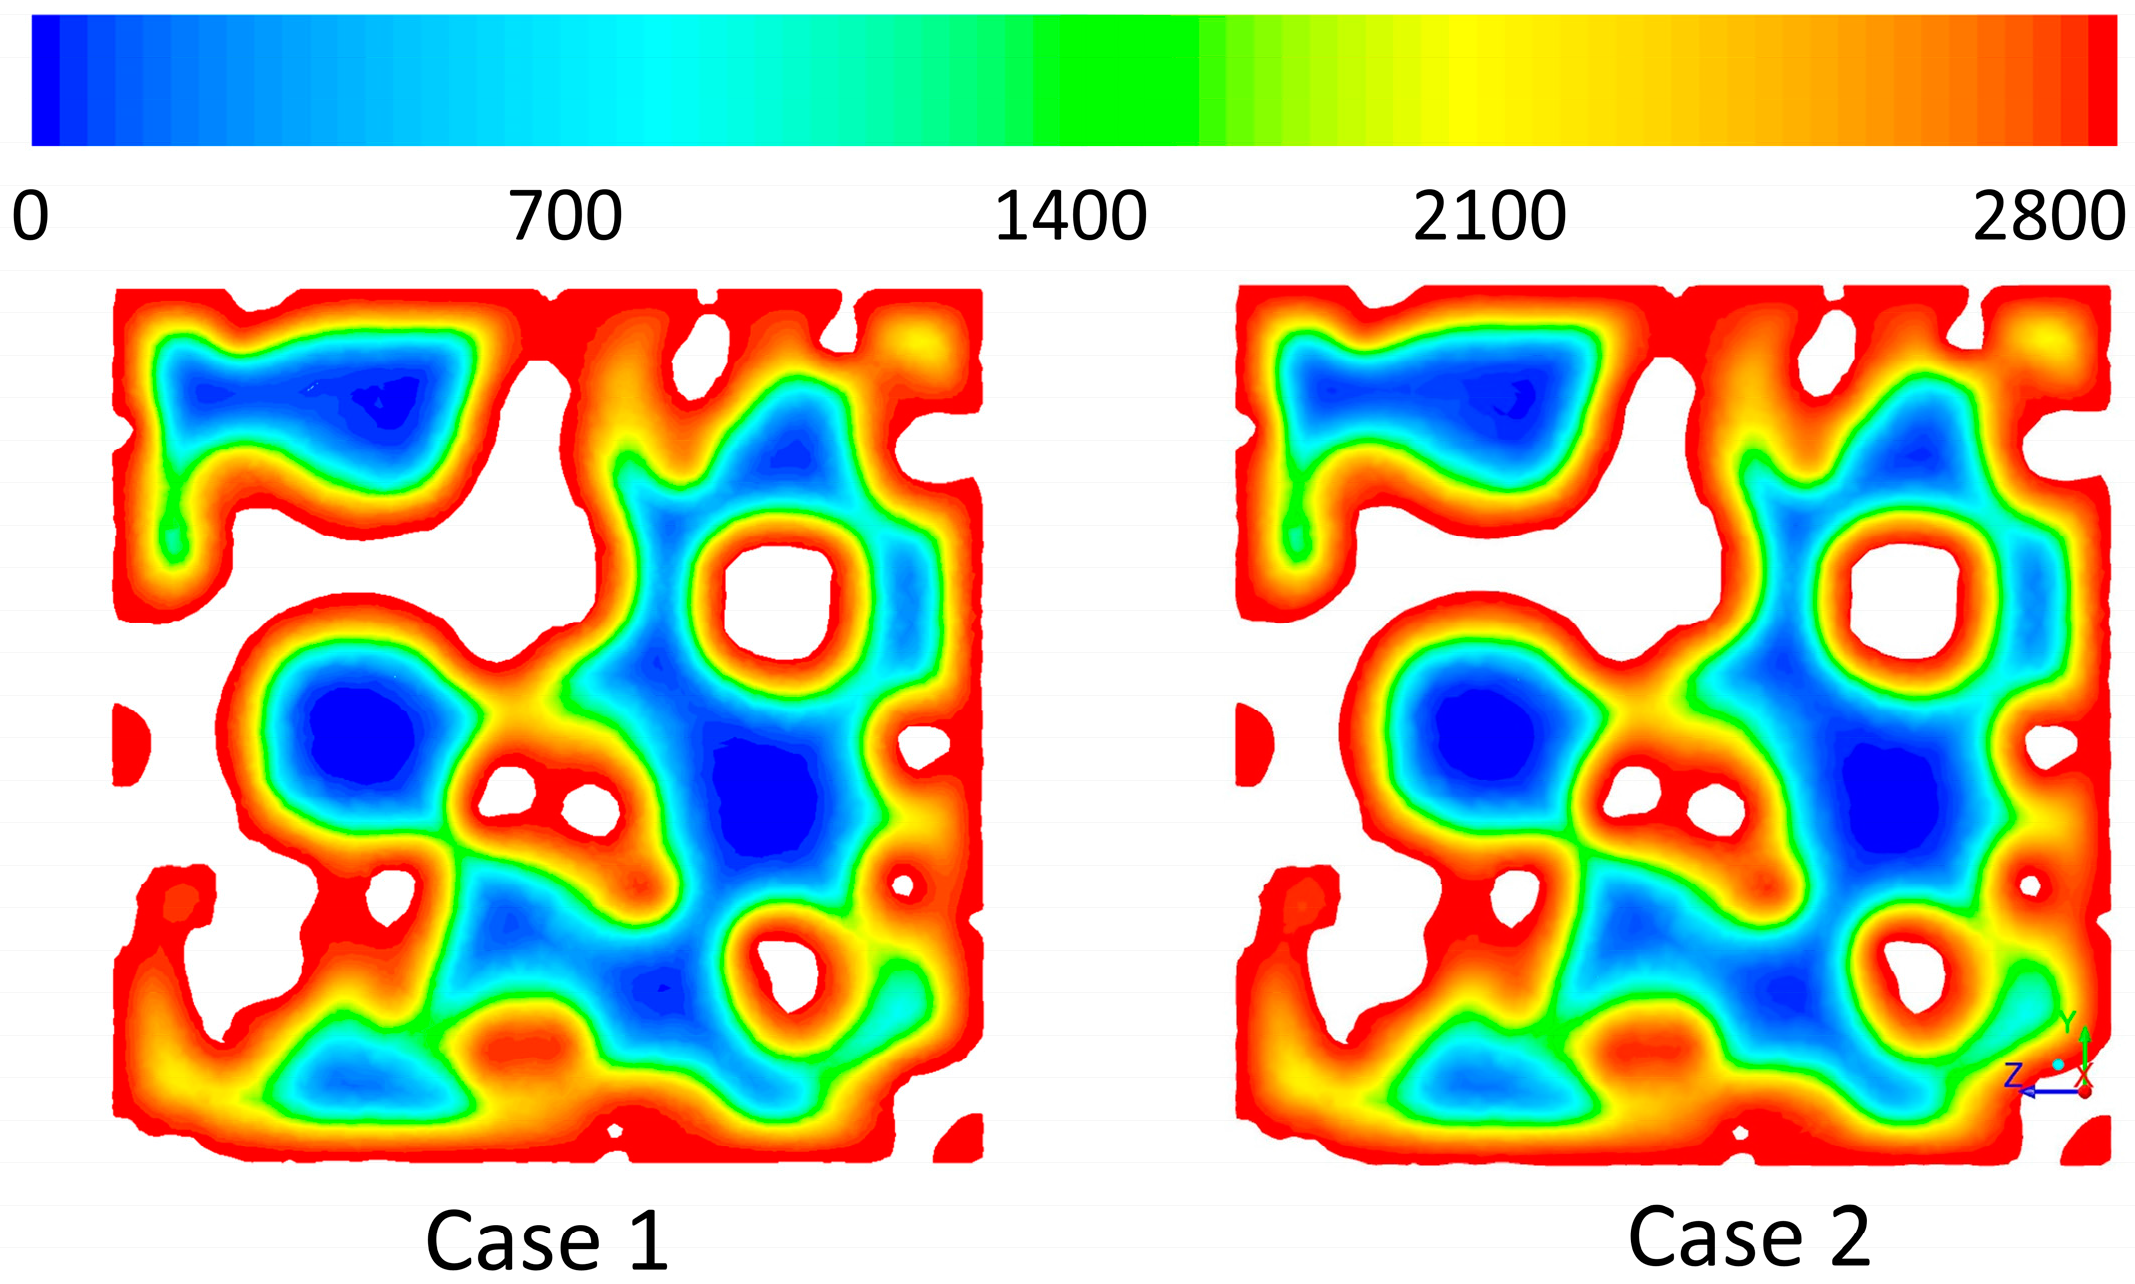
Figure 8.
CO mass fraction on a cross sectional plane, x = 0.
Figure 9.
O2 mass fraction on a cross-sectional plane, x = 0.


Table 1.
Reaction mechanism for CO oxidation on Rh [9].
Table 1.
Reaction mechanism for CO oxidation on Rh [9].
| Reaction | A (cm,mol,s) | β | Ea (kJ/mol) | |
|---|---|---|---|---|
| R1 | O2 + 2Rh(s) → 2O(s) | 1.00 | ||
| R2 | CO2 + Rh(s) → CO2(s) | 4.80 | ||
| R3 | CO + Rh(s) → CO(s) | 4.971 | ||
| R4 | 2O(s) → O2 + 2Rh(s) | 5.329 × 10²² | −0.137 | 387 |
| R5 | CO(s) → CO + Rh(s) | 1.300 × 10¹³ | 0.295 | 134 |
| R6 | CO2(s) → CO2 + Rh(s) | 3.920 × 10¹¹ | 0.315 | 20.51 |
| R7 | CO2(s) + Rh(s) → CO(s) + O(s) | 5.735 × 10²² | −0.175 | 106.49 |
| R8 | CO(s) + O(s) → CO2(s) + Rh(s) | 6.183 × 10²² | 0.034 | 129.98 |
| R9 | CO(s) + Rh(s) → C(s) + O(s) | 6.290 × 10²¹ | 0.000 | 174.76 |
| R10 | C(s) + O(s) → CO(s) + Rh(s) | 1.173 × 10²² | 0.000 | 92.14 |
© 2017 by the authors. Licensee MDPI, Basel, Switzerland. This article is an open access article distributed under the terms and conditions of the Creative Commons Attribution (CC BY) license (http://creativecommons.org/licenses/by/4.0/).
Share and Cite
MDPI and ACS Style
Partopour, B.; Dixon, A.G. Resolved-Pore Simulation of CO Oxidation on Rh/Al2O3 in a Catalyst Layer. ChemEngineering 2018, 2, 2. https://doi.org/10.3390/chemengineering2010002
AMA Style
Partopour B, Dixon AG. Resolved-Pore Simulation of CO Oxidation on Rh/Al2O3 in a Catalyst Layer. ChemEngineering. 2018; 2(1):2. https://doi.org/10.3390/chemengineering2010002
Chicago/Turabian StylePartopour, Behnam, and Anthony G. Dixon. 2018. "Resolved-Pore Simulation of CO Oxidation on Rh/Al2O3 in a Catalyst Layer" ChemEngineering 2, no. 1: 2. https://doi.org/10.3390/chemengineering2010002