
Groundwater Contamination by Uranium and Mercury at the Ridaura Aquifer (Girona, NE Spain)


Abstract
:1. Introduction
- Evaluate the concentration and possible anomalies of Uranium and Mercury in rocks, mineralizations and sediments.
- Characterize the geochemical behavior of Uranium and Mercury along the groundwater flow in the Ridaura aquifers.
- Evaluate the possible controls of their geochemical behavior.
2. Materials and Methods
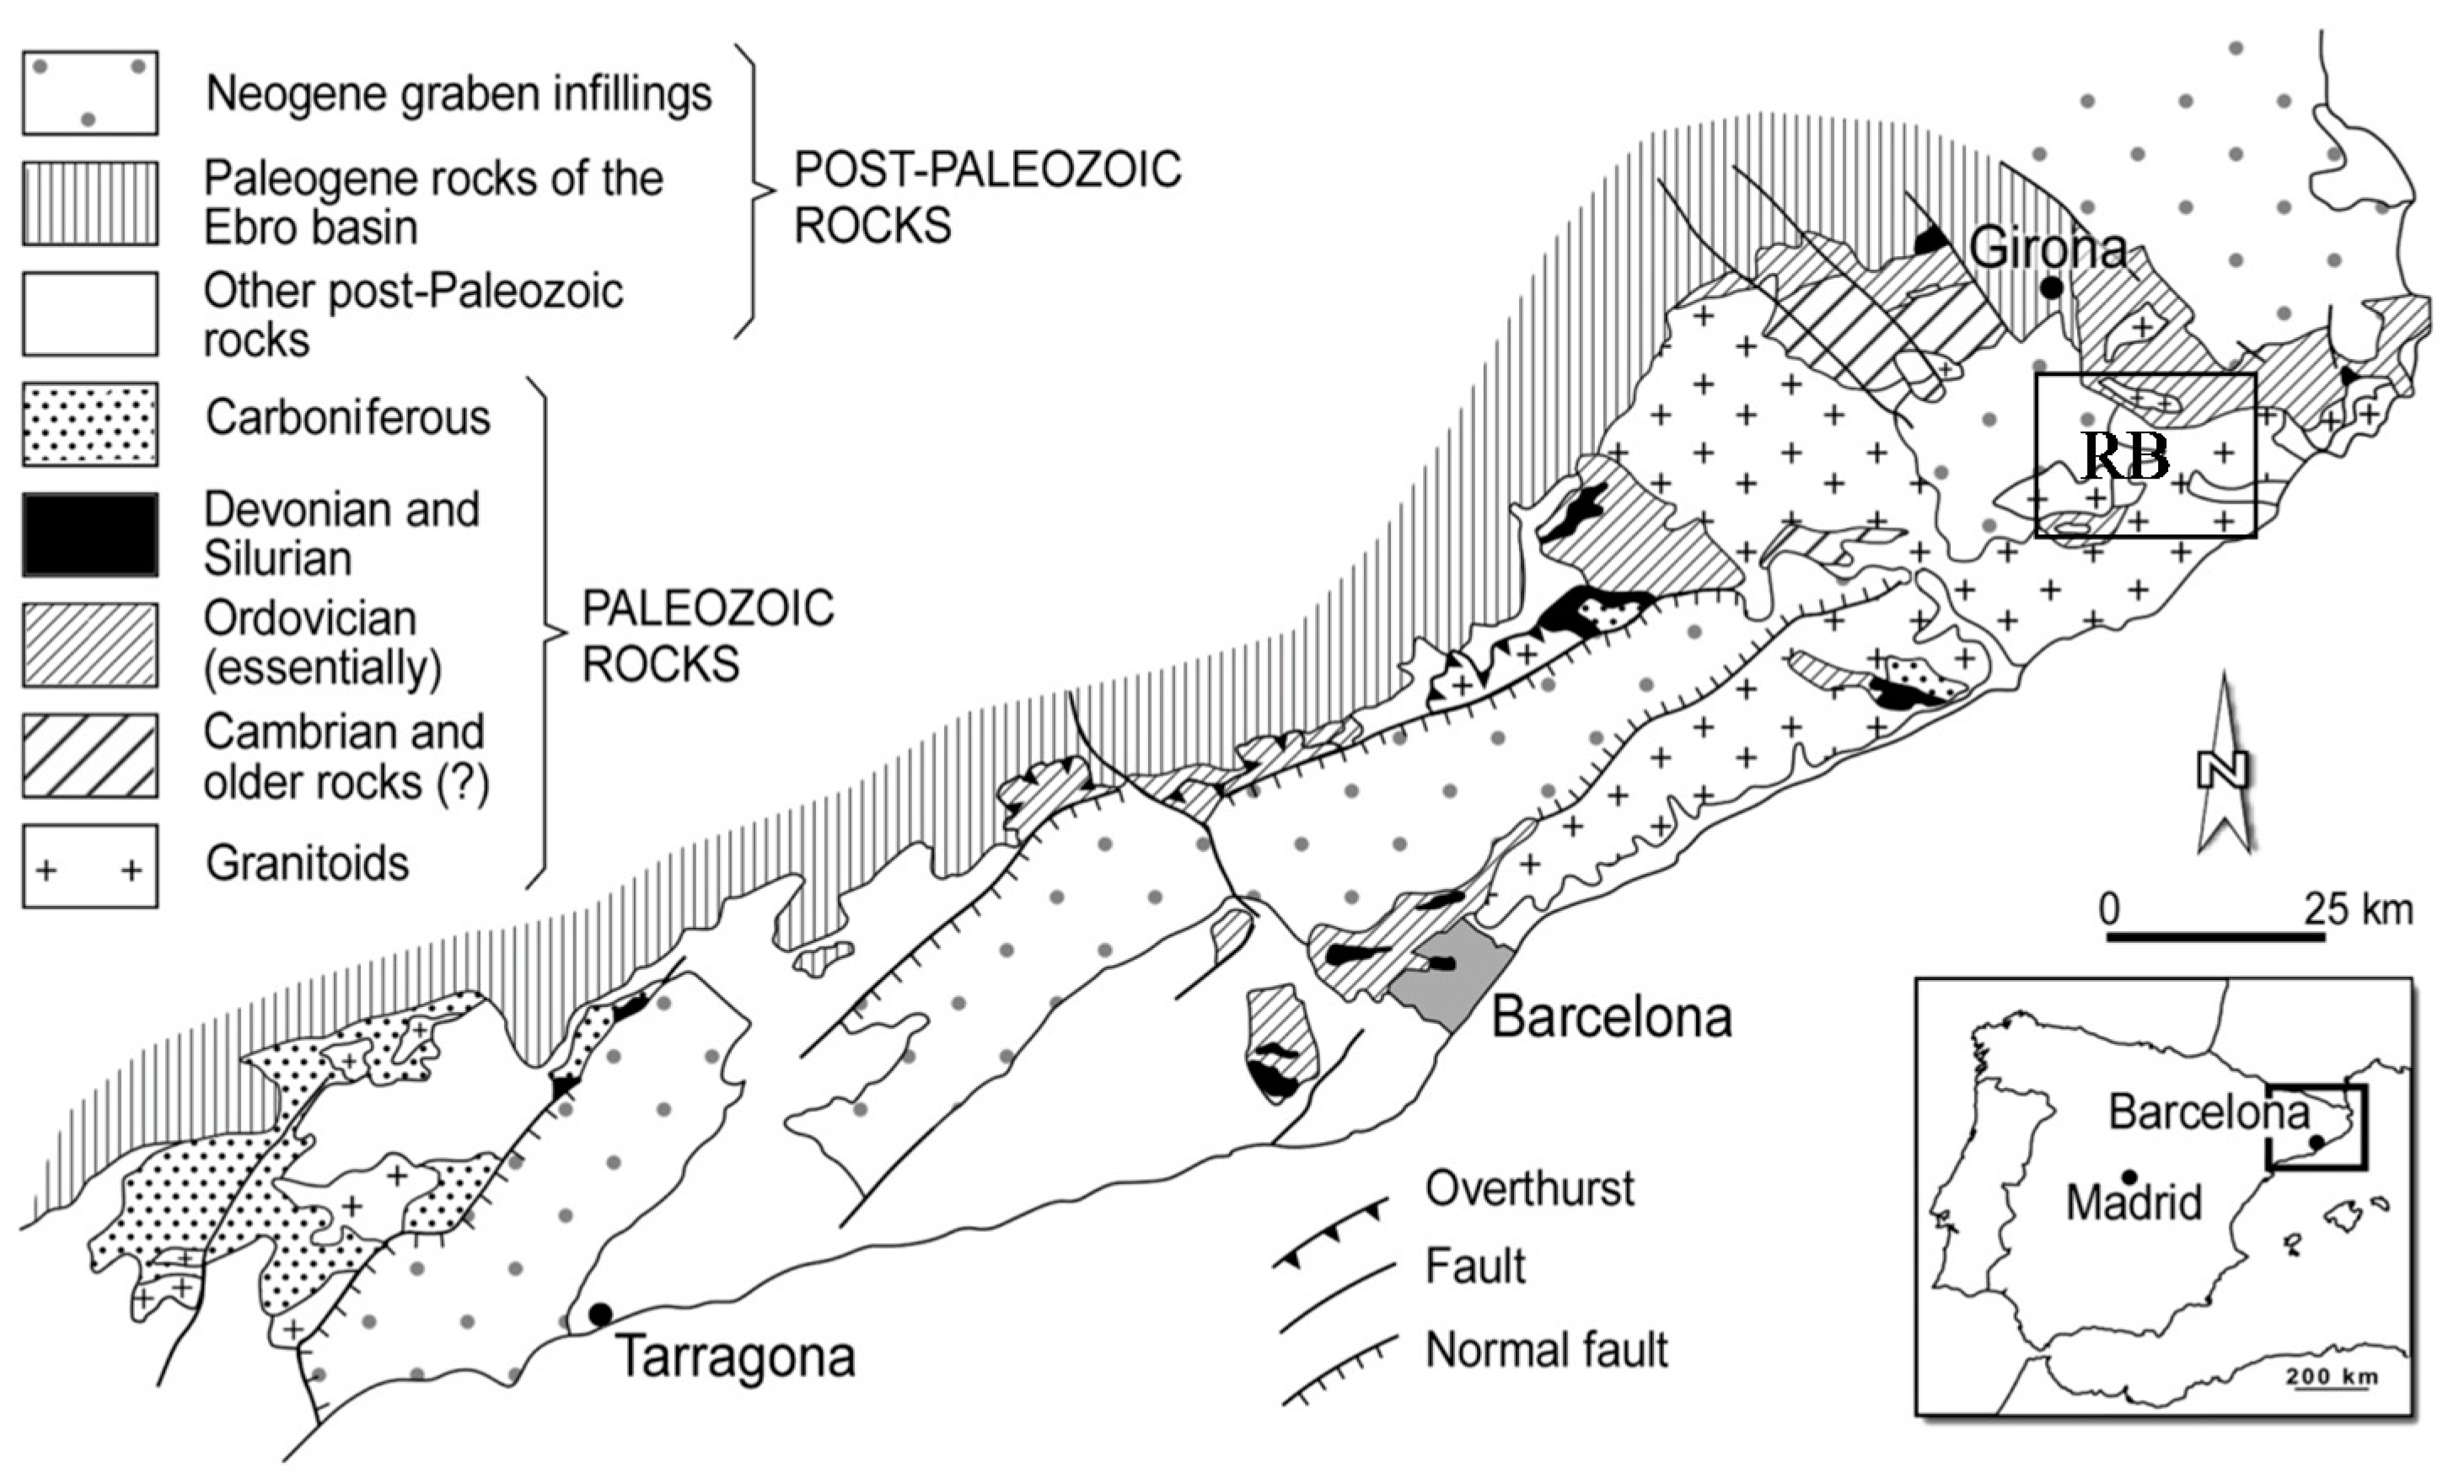
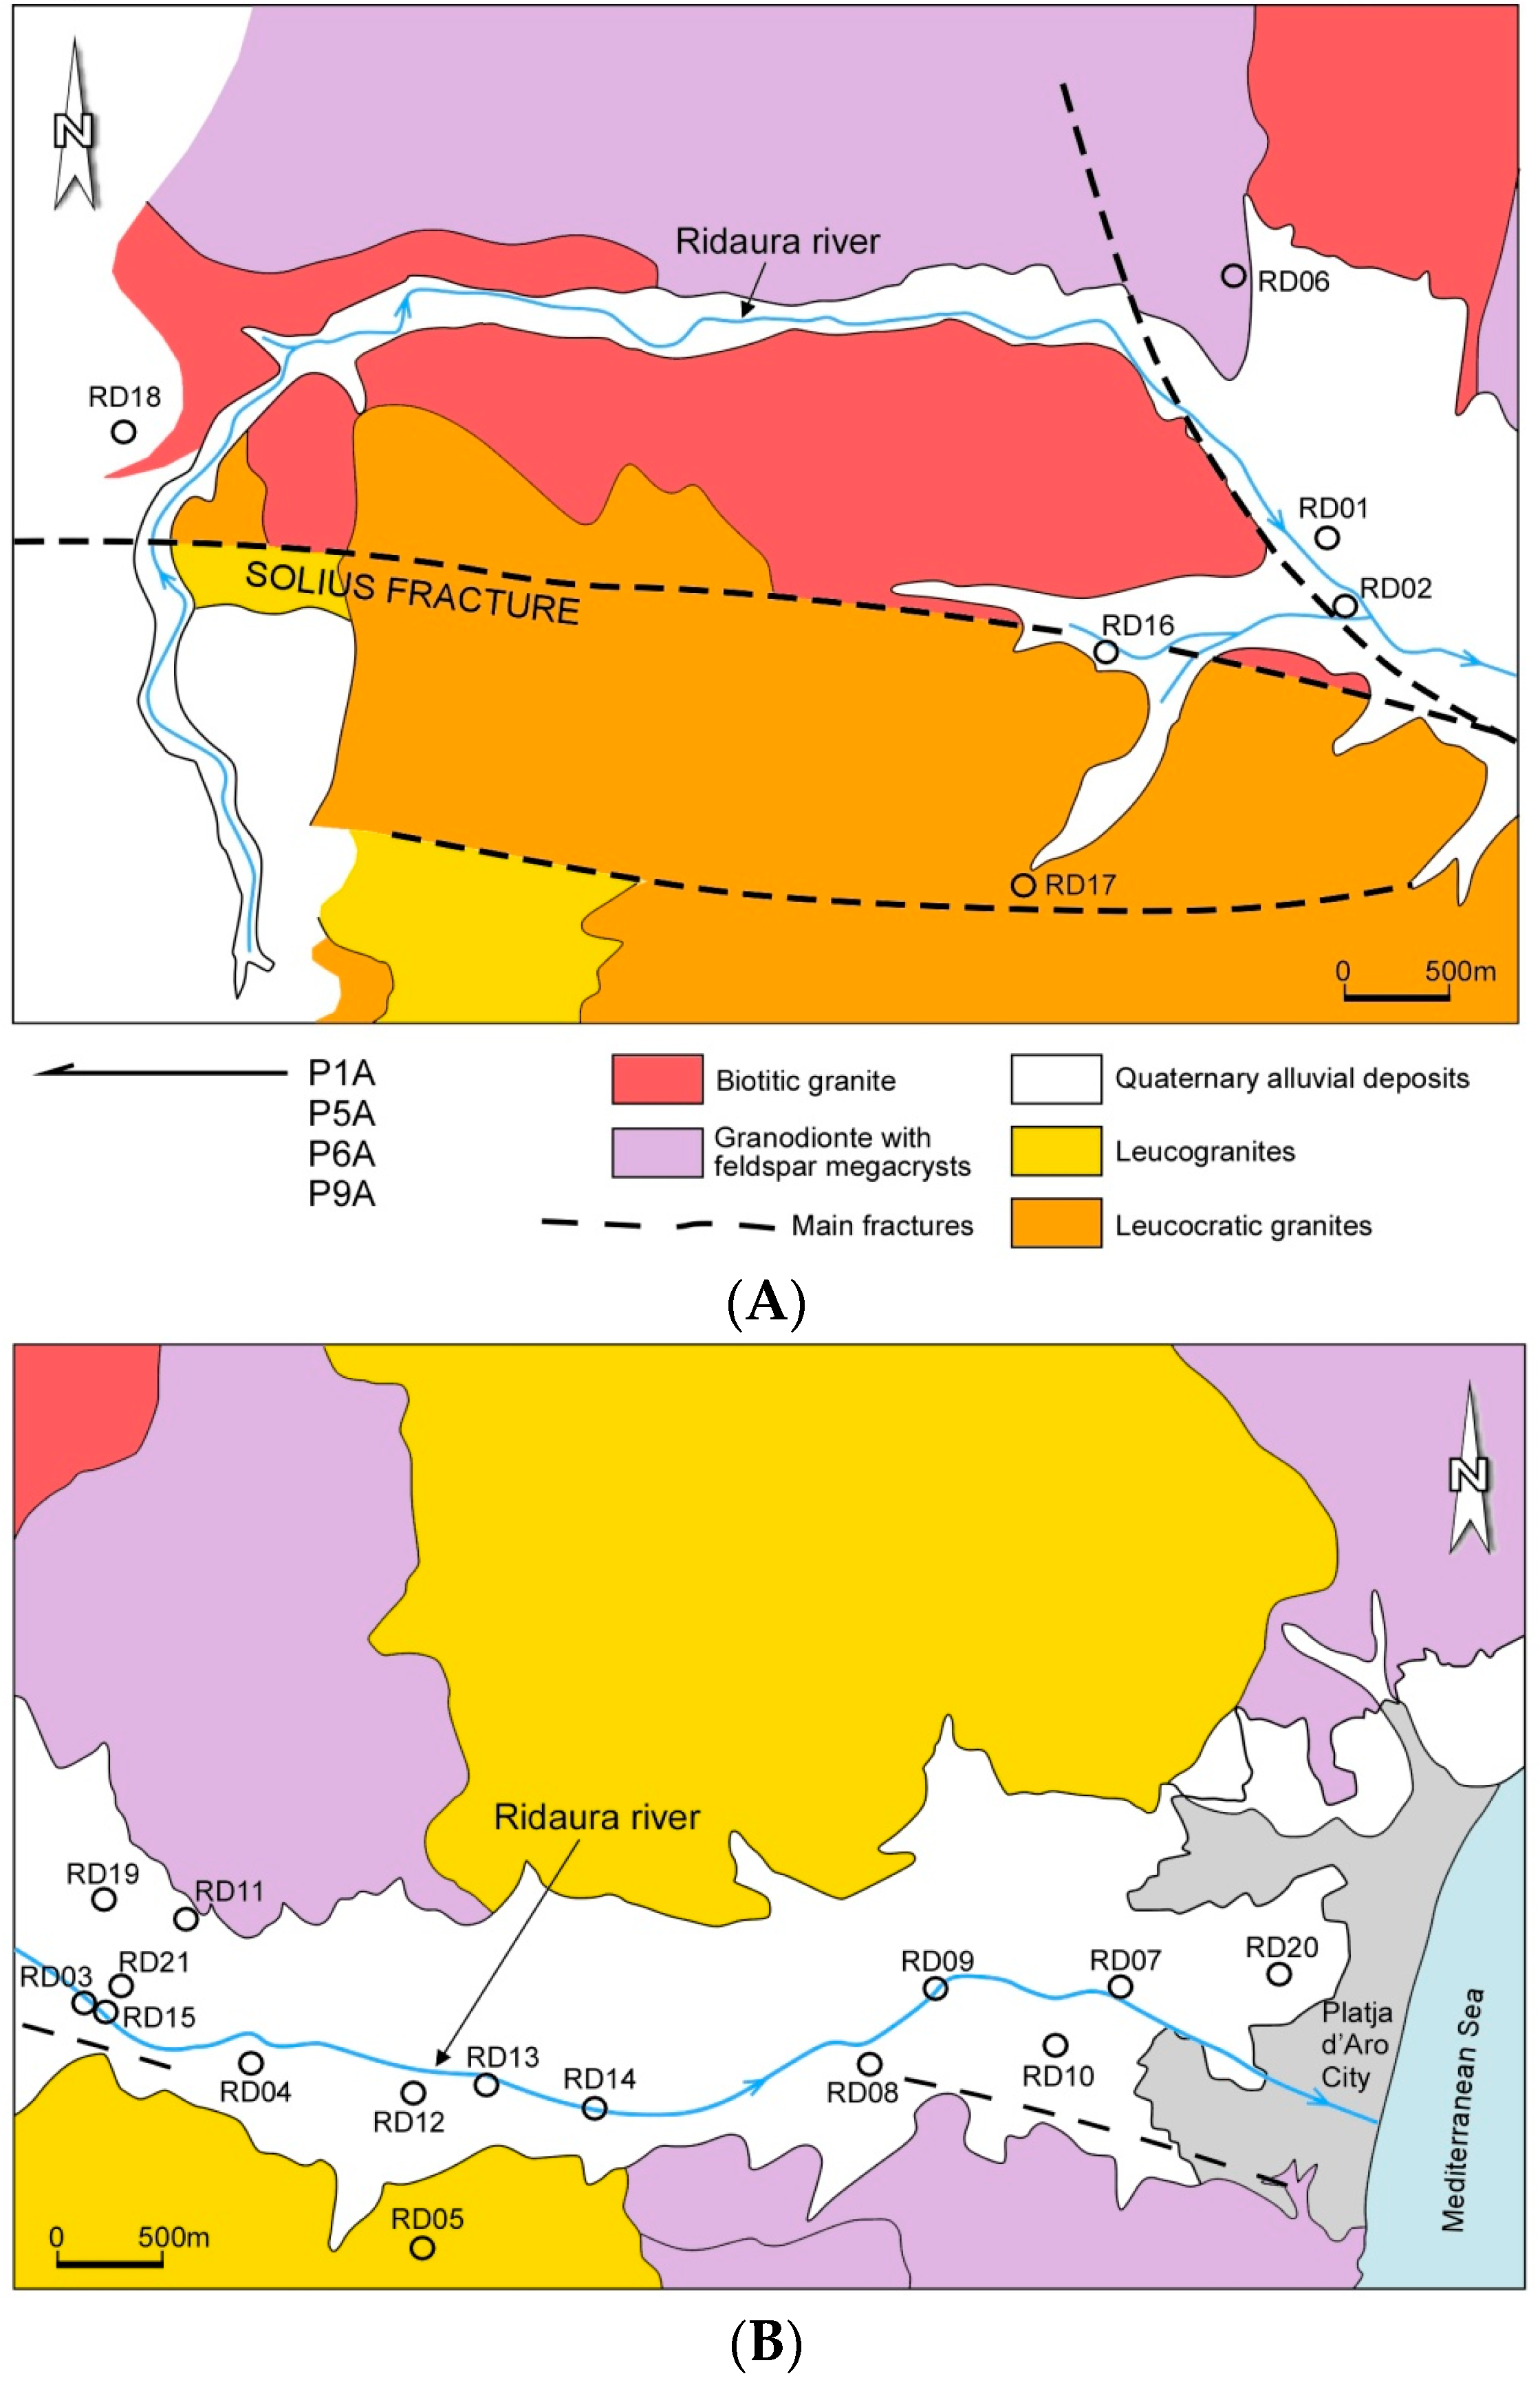
2.1. Study Area
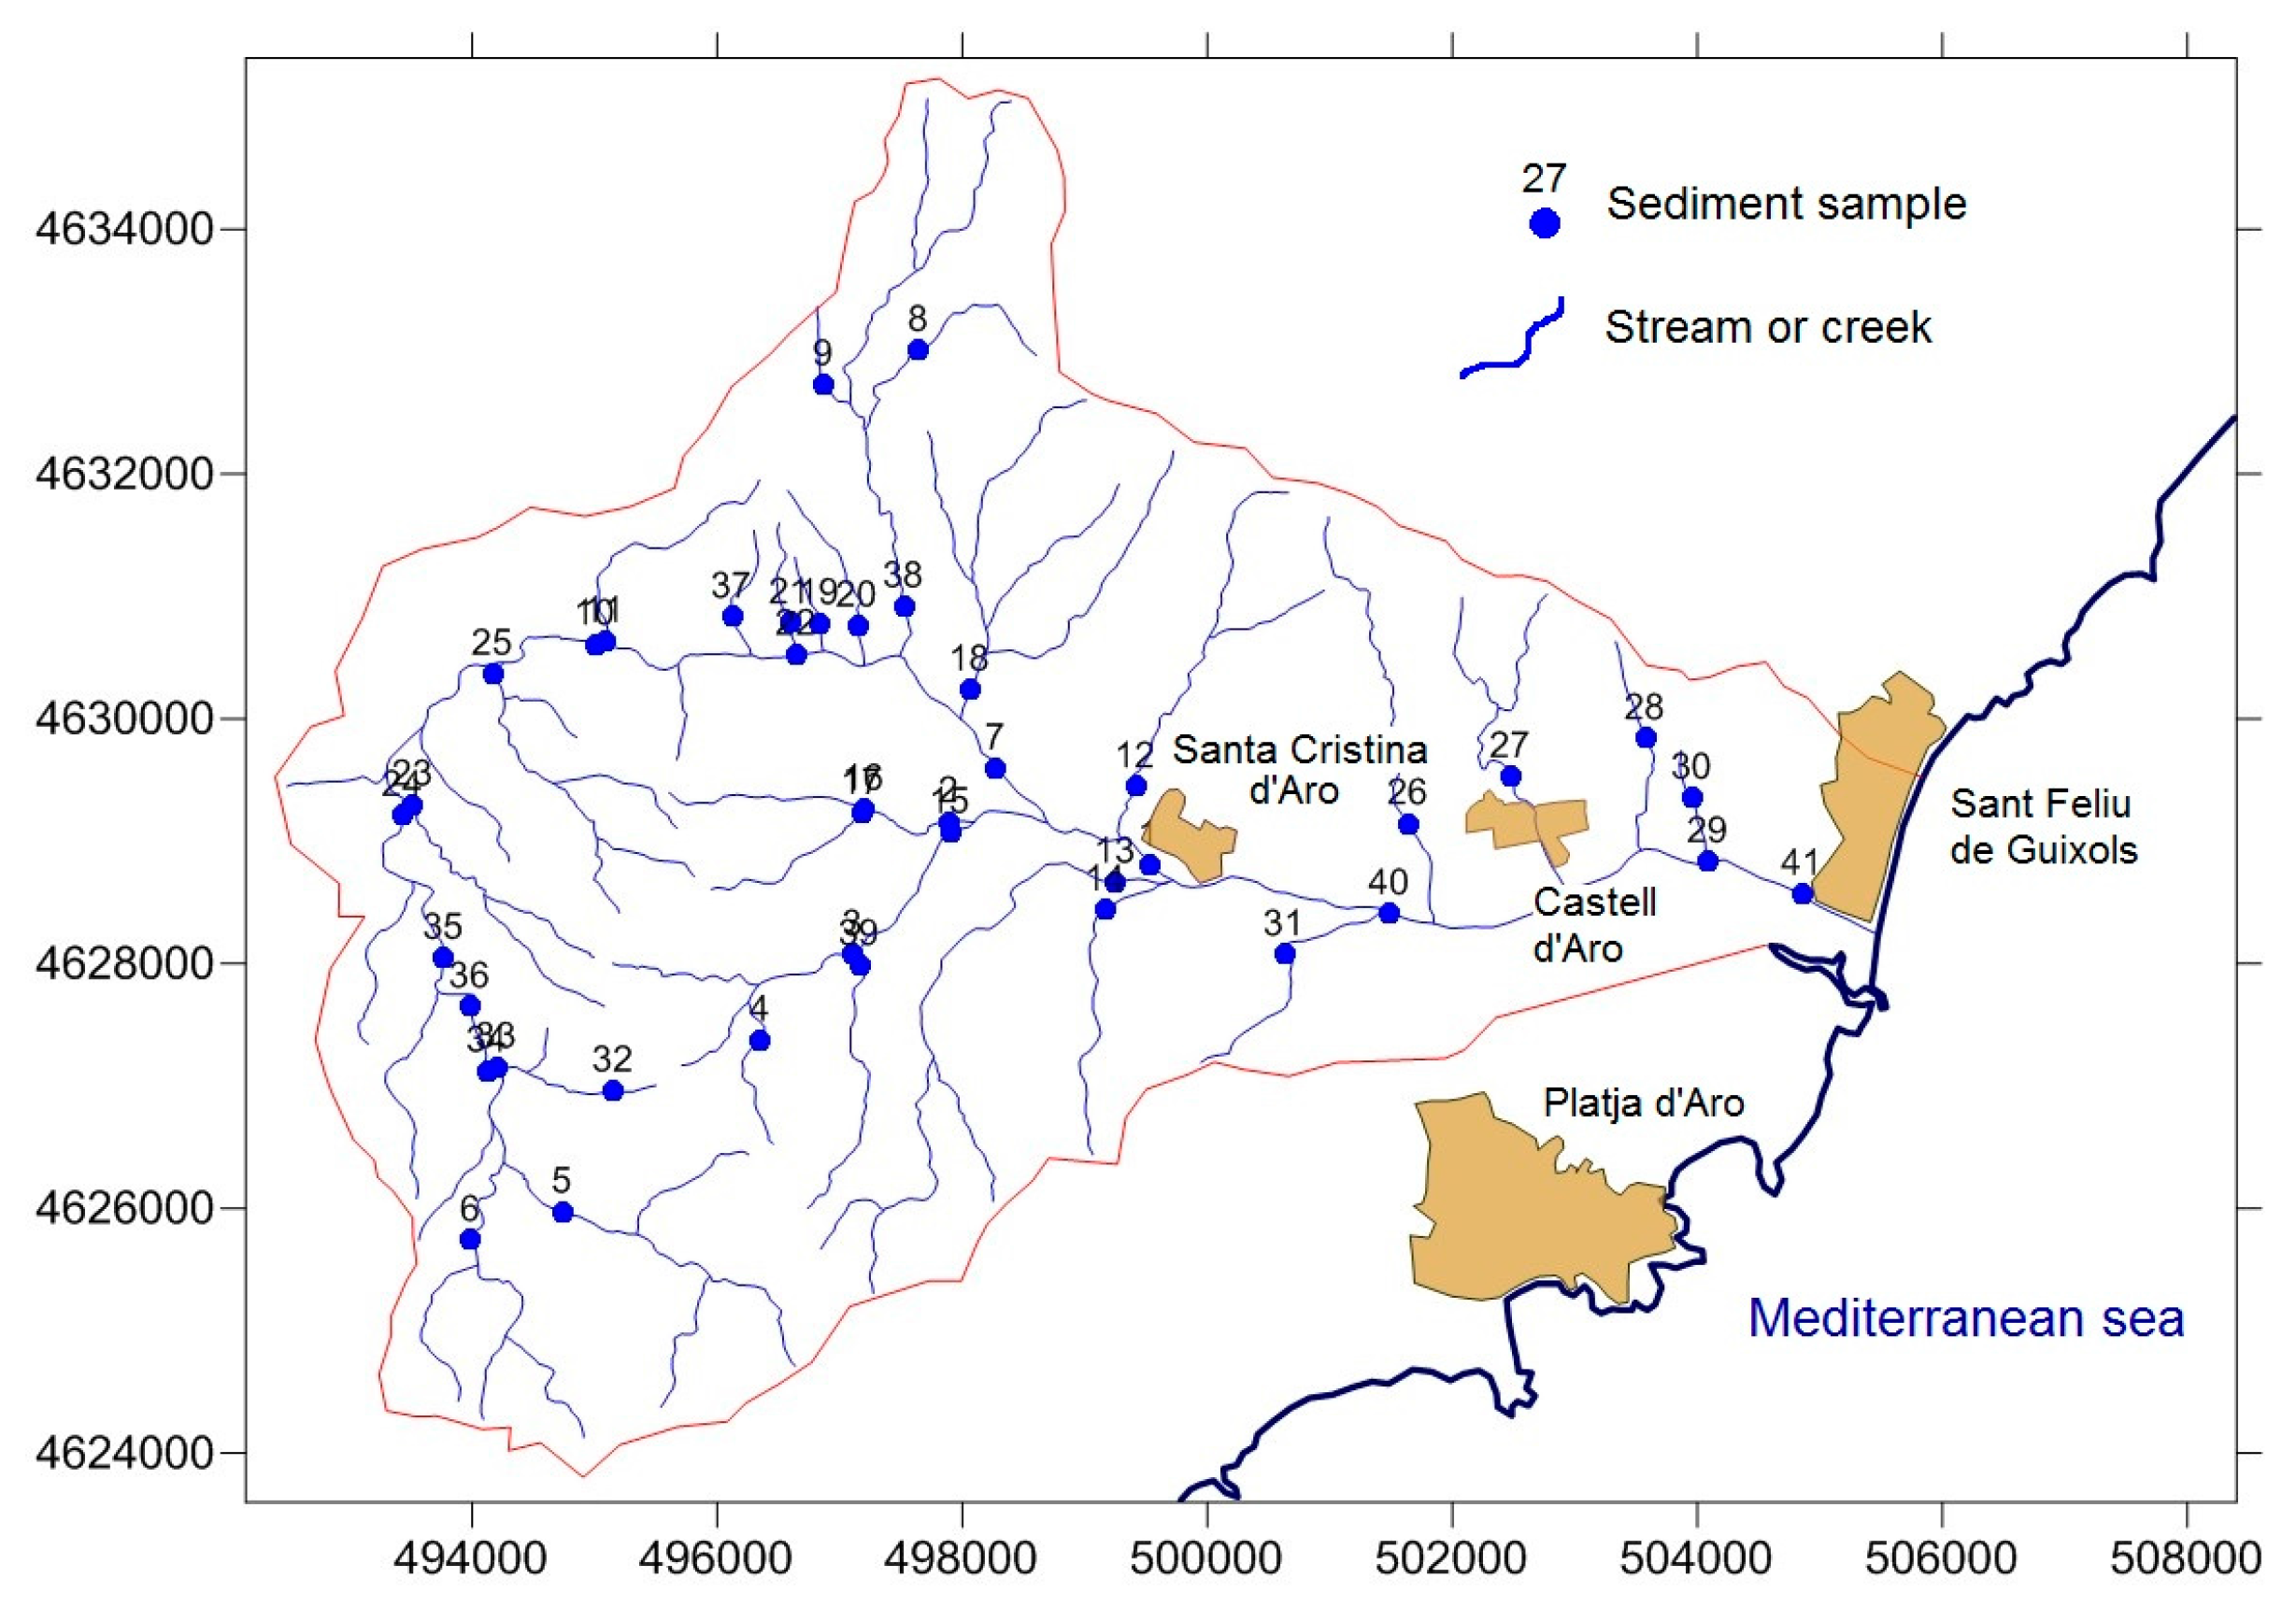
2.2. Sampling and Analysis
3. Results
3.1. Geochemistry of Rocks, Mineralizations and Sediments
3.2. Hydrogeochemistry
3.3. Geochemical Modeling
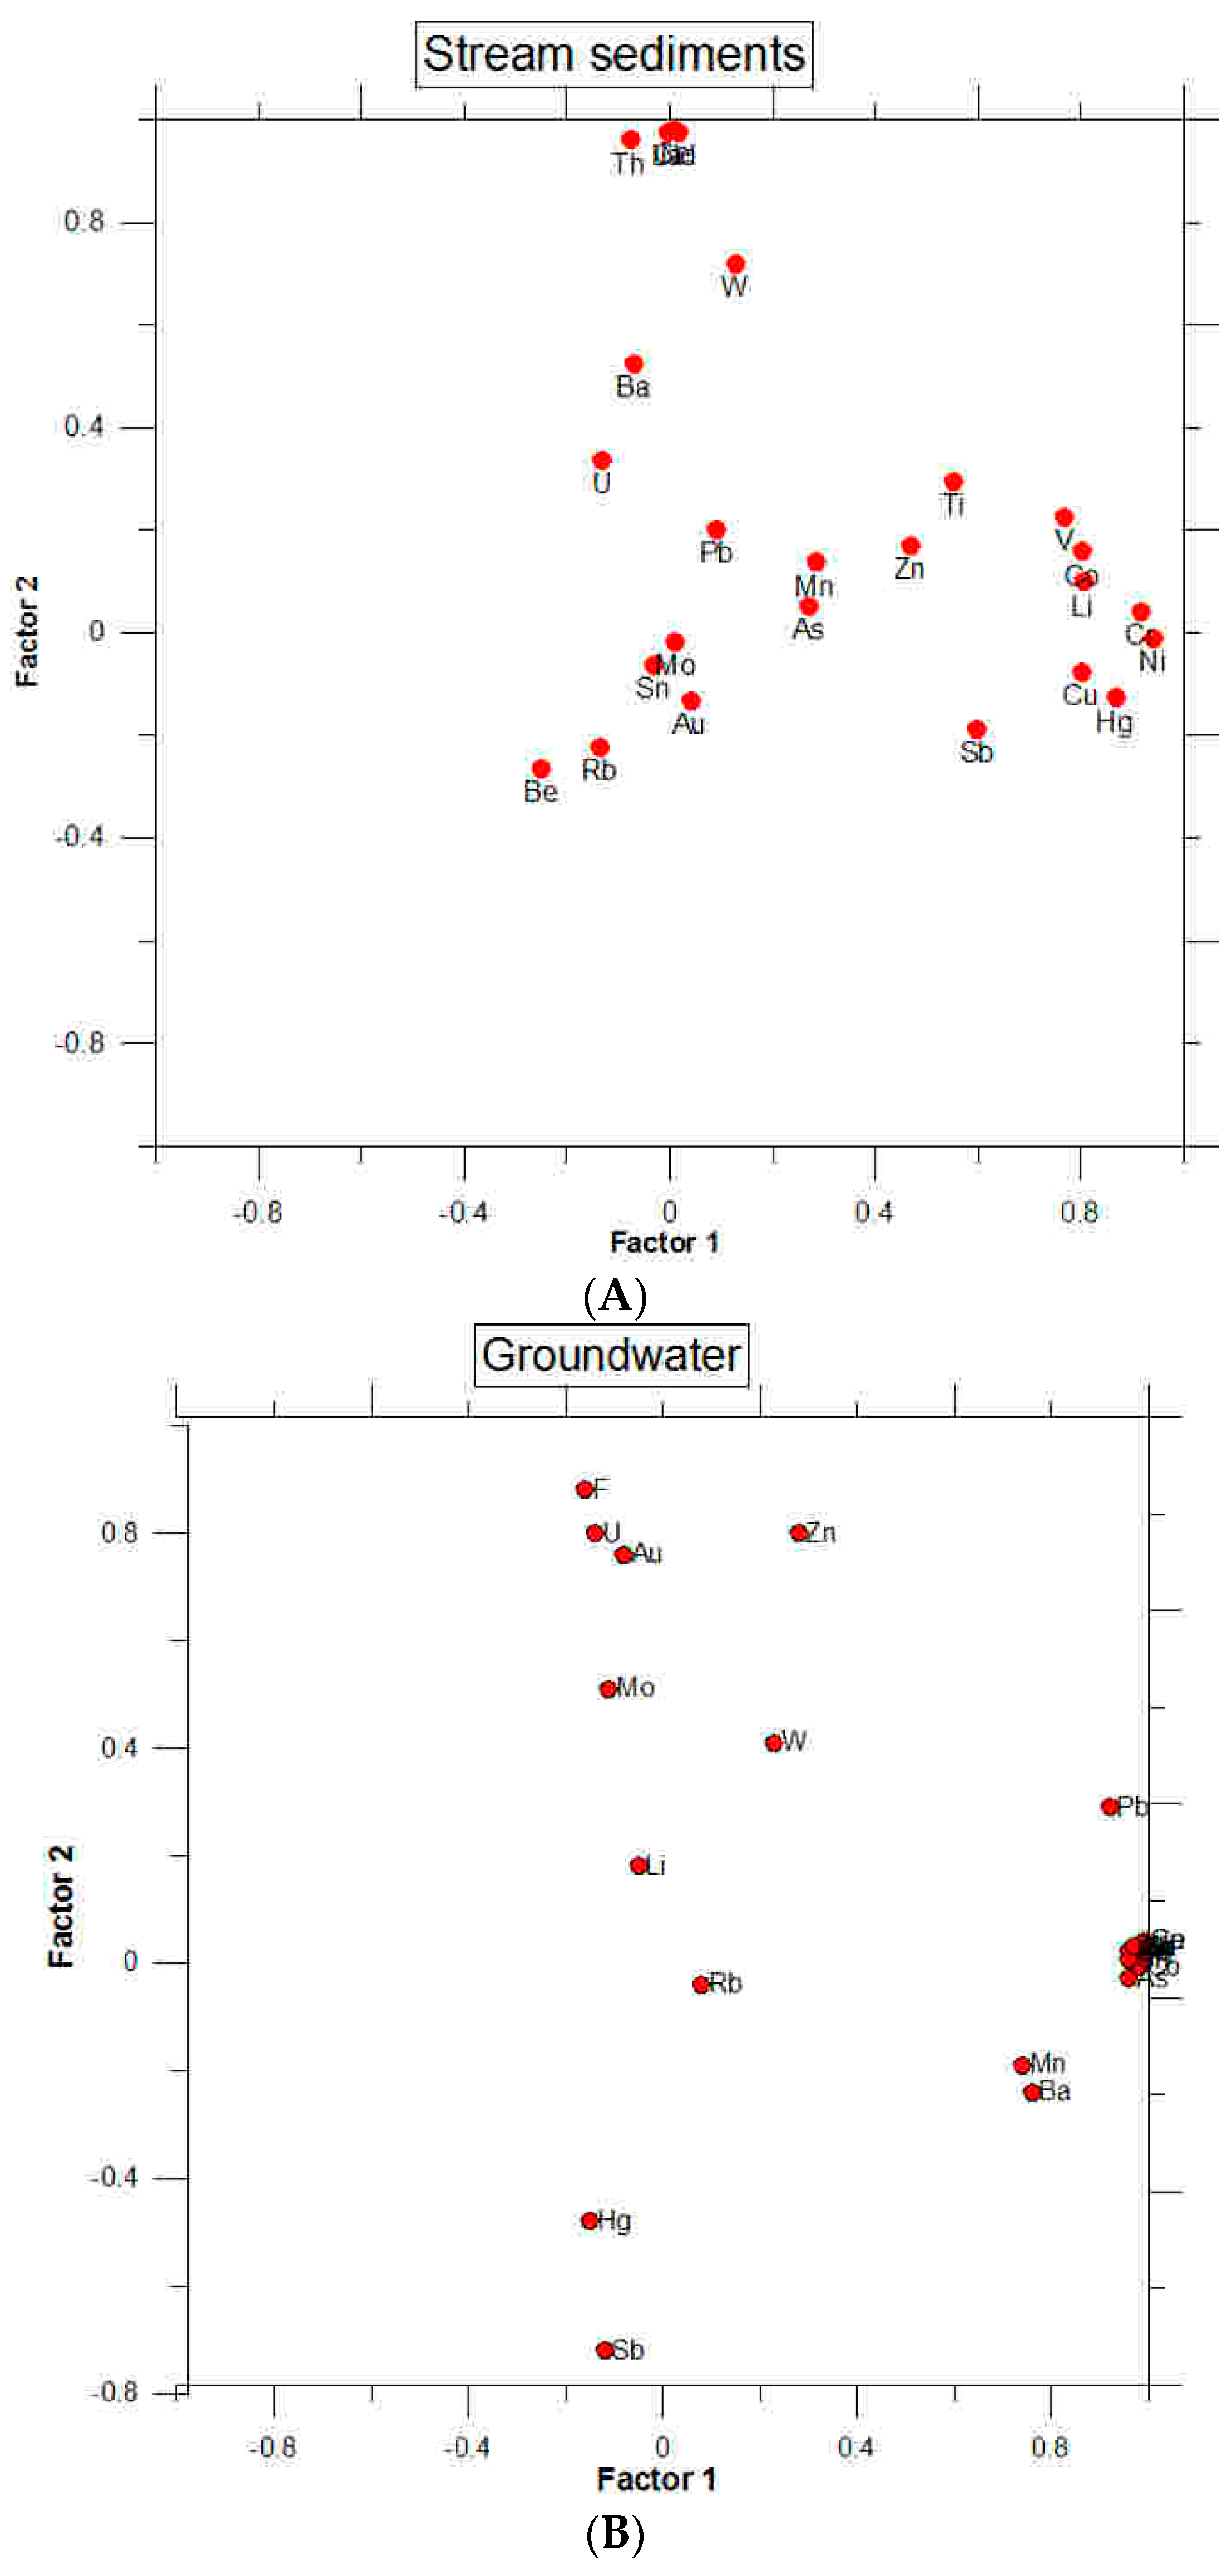
3.4. Multivariate Analysis
4. Conclusions
Acknowledgments
Author Contributions
Conflicts of Interest
References
- Norrström, A.C.; Löv, A. Uranium theoretical speciation for drinking water from private drilled wells in Sweden—Implications for choice of removal method. Appl. Geochem. 2014, 51, 148–154. [Google Scholar] [CrossRef]
- National Primary Drinking Water Standards; U.S. EPA 816-F-03-016; US EPA: Washington, DC, USA, 2003.
- World Health Organization (WHO). Guidelines for Drinking-water Quality, 4th ed.; World Health Association: Geneva, Switzerland, 2011. [Google Scholar]
- Real Decreto 140/2003 de 7 de Febrero por el que se Establecen los Criterios Sanitarios de la Calidad de Agua de Consume Humano, 2003. Available online: https://www.boe.es/diario_boe/txt.php?id=BOE-A-2003-3596 (accessed on 8 August 2016).
- Langmuir, D.L. Aqueous Environmental Geochemistry; Prentice Hall: Upper Saddle River, NJ, USA, 1997. [Google Scholar]
- Kabatia-Pendias, A.; Mukherjee, A. Trace Elements from Soil to Human; Springer: Berlin/Heidelberg, Germany, 2007. [Google Scholar]
- Dekkers, M.J.; Vriend, S.P.; van der Weijden, C.H.; van Gaans, P.F.M. Uranium anomaly in groundwaters: A hydrogeochemical study in the Nisa region, Portugal. Appl. Geochem. 1989, 4, 375–394. [Google Scholar] [CrossRef]
- Warner, R.; Meadows, J.; Sojda, S.; Price, V.; Temples, T.; Arai, Y.; Fleisher, C.; Crawford, B.; Stone, P. Mineralogic investigation into occurrence of high uranium well waters in upstate South Carolina, USA. Appl. Geochem. 2011, 26, 777–788. [Google Scholar] [CrossRef]
- Frengstad, B.; Skrede, A.K.M.; Banks, D.; Krog, J.R.; Siewers, U. The chemistry of Norwegian groundwaters: III. The distribution of trace elements in 476 crystalline bedrock groundwaters, as analysed by ICP-MS techniques. Sci. Total Environ. 2000, 246, 21–40. [Google Scholar] [CrossRef]
- Biehler, D.; Falck, W.E. Simulation of the effects of geochemical reactions on groundwater quality during planned flooding of the Königstein uranium mine, Saxony, Germany. Hydrogeol. J. 1999, 7, 284–293. [Google Scholar] [CrossRef]
- Sherman, H.; Gierke, J.S.; Anderson, C. Controls on spatial variability of uranium in sandstone aquifers. Ground Water Monit. Remediat. 2007, 27, 106–118. [Google Scholar] [CrossRef]
- Schneider, P.; Neitzel, P.L.; Osenbrück, K.; Noubacteb, C.; Merkel, B.; Hurst, S. In-situ treatment of radioactive mine water using reactive materials—Results of laboratory and field experiments in uranium ore mines in Germany. Acta Hydrochim. Hydrobiol. 2001, 29, 129–138. [Google Scholar] [CrossRef]
- Gómez, P. Impacto de la Mina Ratones (Albalá, Cáceres) Sobre las Aguas Superficiales y Subterráneas: Modelización Hidrogeoquímica; Publicación Técnica 06/2002; Enresa: Madrid, Spain, 2002. (In Spanish) [Google Scholar]
- Gómez, P.; Garralón, A.; Buil, B.; Turrero, M.J.; Sánchez, L.; de la Cruz, B. Modeling of geochemical processes related to uranium mobilization in the groundwater of a uranium mine. Sci. Total Environ. 2006, 366, 295–309. [Google Scholar] [CrossRef] [PubMed]
- Marcuello, A.; Gómez, P.; Carrera, J.; Ayora, C. Multicomponent reactive transport modeling at the ratones uranium mine, Cáceres (Spain). J. Iber. Geol. 2006, 32, 133–146. [Google Scholar]
- Birke, M.; Rauch, U.; Lorenz, H.; Kringel, R. Distribution of uranium in German bottled and tap water. J. Geochem. Explor. 2010, 107, 272–282. [Google Scholar] [CrossRef]
- Smedley, P.L. A survey of the inorganic chemistry of bottled mineral waters from the British Isles. Appl. Geochem. 2010, 25, 1872–1888. [Google Scholar] [CrossRef] [Green Version]
- Frengstad, B.; Lax, K.; Tarvainen, T.; Jaeger, O.; Wigum, B.J. The chemistry of bottled mineral and spring waters from Norway, Sweden, Finland and Iceland. J. Geochem. Explor. 2010, 107, 350–361. [Google Scholar] [CrossRef]
- Langmuir, D.L. Uranium solution-mineral equilibria at low temperatures with applications to sedimentary ore deposits. Geochim. Cosmochim. Acta 1978, 42, 547–569. [Google Scholar] [CrossRef]
- Parkhurst, D.L.; Appelo, C.A.J. User’s Guide to PHREEQC (Version 2)—A Computer Program for Speciation, Batch-Reaction, One-Dimensional Transport, and Inverse Geochemical Calculations; Water-Resources Investigations Report 99-4259; U.S. Geological Survey: Reston, VA, USA, 1999.
- Echevarría, G.; Sheppard, M.I.; Morel, J.L. Effect of pH on the sorption of uranium in soils. J. Environ. Radioact. 2001, 53, 257–264. [Google Scholar] [CrossRef]
- Curtis, G.P.; Fox, P.; Kohler, M.; Davis, J.A. Comparison of in situ uranium KD values with a laboratory determined surface complexation model. Appl. Geochem. 2004, 19, 1643–1653. [Google Scholar] [CrossRef]
- Logue, B.A.; Smith, R.W.; Westall, J.C. U(VI) adsorption on natural iron-coated sands: Comparisson of approaches for modeling adsorption on heterogeneous environmental materials. Appl. Geochem. 2004, 19, 1937–1951. [Google Scholar] [CrossRef]
- Missana, T.; García-Gutiérrez, M.; Fernández, V. Uranium (VI) sorption on colloidal magnetite under anoxic environment: Experimental study and surface complexation modeling. Geochim. Cosmochim. Acta 2003, 67, 2543–2550. [Google Scholar] [CrossRef]
- Tricca, A.; Wasserburg, G.J.; Porcell, D.; Baskaran, M. The transport of U—and Th—series nuclides in a sandy unconfined aquifer. Geochim. Cosmochim. Acta 2001, 65, 1187–1210. [Google Scholar] [CrossRef]
- Bollen, A.; Wenke, A.; Biester, H. Mercury speciation analyses in HgCl2-contaminated soils and groundwater-implications for risk assessment and remediation strategies. Water Res. 2008, 42, 91–100. [Google Scholar] [CrossRef] [PubMed]
- Barringer, J.L.; Szabo, Z.; Reilly, P.A.; Riskin, M.L. Variable contributions of mercury from groundwater to a first-orden coastal plain stream in New Jersey, USA. Water Air Soil Pollut. 2013, 224, 1–25. [Google Scholar] [CrossRef]
- Barringer, J.L.; Szabo, Z.; Reilly, P.A. Occurrence and mobility of mercury in groundwater. In Current Perspectives in Contaminant Hydrology and Water Resources Sustainability; INTECH: Rijeka, Croatia, 2013; pp. 117–149. [Google Scholar]
- Fitzgerald, W.F.; Lamborg, C.H. Geochemistry of mercury in the environment. In Environmental Geochemistry, Treatise on Geochemistry; Lollar, B.S., Ed.; Elsevier-Pergamon: Oxford, UK, 2005; pp. 107–148. [Google Scholar]
- Fairbridge, R.W. The Encyclopedia of Geochemistry and Environmental Sciences; Van Nostrand Reinhold Co.: New York, NY, USA, 1972. [Google Scholar]
- McLean, J.E.; Bledsoe, B.E. Behavior of Metals in Soils. Ground Water Issue; EPA/540/S-92/018; U.S. EPA: Washington, DC, USA, 1992.
- Morel, F.M.M.; Kraepiel, A.M.L.; Amyot, M. The chemical cycle and bioaccumulation of Mercury. Ann. Rev. Ecol. Syst. 1998, 29, 543–566. [Google Scholar] [CrossRef]
- Davis, A.; Bloom, N.S.; Que Hee, S.S. The environmental geochemistry and bioaccessibility of mercury in soils and sediments: A review. Risk Anal. 1997, 17, 557–569. [Google Scholar] [CrossRef] [PubMed]
- Sanei, H.; Goodarzi, F. Relationship between organic matter and mercury in recent lake sediments. The physical-geochemical aspects. Appl. Geochem. 2006, 21, 1900–1912. [Google Scholar] [CrossRef]
- Ying, Y.; Allen, H.; Li, Y.; Huang, C.P.; Sanders, P.I. Adsorption of mercury (II) by soil: Effects of pH, chloride, and organic matter. J. Environ. Qual. 1996, 25, 837–844. [Google Scholar]
- Navarro, A. Review of characteristics of mercury specaition and mobility from areas of mercury mining in semi-arid environments. Rev. Environ. Sci. Biotechnol. 2008, 7, 287–306. [Google Scholar] [CrossRef]
- Navarro, A.; Cardellach, E.; Corbella, M. Mercury mobility in mine waste from Hg-mining areas in Almería. Andalusia (SE, Spain). J. Geochem. Explor. 2009, 101, 236–246. [Google Scholar] [CrossRef]
- IGME. Mapa Geológico de España, Escala 1:50000, San Feliu de Guixols; Instituto Geológico y Minero de España: Madrid, Spain, 1983. (In Spanish) [Google Scholar]
- Juez-Larré, J.; Andriessen, P.A.M. Tectonothermal evolution of the northeastern margin of Iberia since the break-up of Pangea to present, revealed by low-temperature fission-track and (U-Th)/He thermochronology. A case history of the Catalonian Coastal Ranges. Earth Planet. Sci. Lett. 2006, 243, 159–180. [Google Scholar] [CrossRef]
- Folch, A.; Más-Pla, J. Modelling the influence of fractures on the recharge in range-and basin areas. Application to the selva basin (NE Spain). In Jornadas Internacionales: De la Toma de Datos y la Realización de Modelos de Agua Subterránea a la Gestión Integrada; Sánchez-Vila, X., Cabrera, M.C., Valverde, M., Eds.; AIH-GE: Alicante, Spain, 2005; pp. 303–308. [Google Scholar]
- Vilanova, E. Anàlisi dels Sistemes de Flux a l’àrea Gavarres-Selva-Baix Empordà. Ph.D. Thesis, Barcelona, Spain, July 2004. [Google Scholar]
- Enrique, P. The hercynian intrusive rocks of the Catalonian Coastal Ranges (NE Spain). Acta Geol. Hisp. 1990, 25, 39–64. [Google Scholar]
- Bethke, C.M.; Yeakel, S. The Geochemist’s Workbench; Version 9.0; LLC & Aqueous Solutions: Champaign, IL, USA, 2011. [Google Scholar]
- US EPA. MinteqA2: Metal Speciation Equilibrium Model for Surface and Ground Water; U.S. EPA Release: Athens, GA, USA, 2006.
- Navarro, A.; Font, X. Discriminating different sources of groundwater contamination caused by industrial wastes in the Besós River Basin, Barcelona. Appl. Geochem. 1993, 2, 277–279. [Google Scholar] [CrossRef]
- Davis, J.C. Statistics and Data Analysis in Geology; John Wiley & Sons: New York, NY, USA, 2005. [Google Scholar]
- Levinson, A.A. Introduction to Exploration Geochemistry; Applied Publishing Ltd.: Wilmette, IL, USA, 1980. [Google Scholar]
- Nacic, Z.; Posavec, K.; Bacani, A. A visual basic spreadsheet macro for geochemical background analysis. Ground Water 2007, 45, 642–647. [Google Scholar]
- Barringer, J.L.; Szabo, Z.; Reilly, P. Mercury in Waters, Soils, and Sediments of the New Jersey Coastal Plain: A Comparison of Regional Distribution and Mobility with the Mercury Contamination at the William J. Hugues Technical Center, Atlantic County, New Jersey; Scientific Investigations Report 2012-5115; USGS: Reston, VA, USA, 2012.
- Tartèse, R.; Boulvais, P.; Poujol, M.; Gloaguen, E.; Cuney, M. Uranium mobilization from the Variscan Questembert syntectonic granite during fluid-rock interactions at depth. Econ. Geol. 2012, 108, 379–386. [Google Scholar] [CrossRef]


| Sample | Au | Ag | Cu | Cd | Mo | Pb | Ni | Zn | As | Ba | Be | Bi | Ca | Co | Cr | Eu | Fe | Hg | Mn | Rb | Sb | Se | Ta | Th | U |
|---|---|---|---|---|---|---|---|---|---|---|---|---|---|---|---|---|---|---|---|---|---|---|---|---|---|
| Unit | ppb | ppm | ppm | ppm | ppm | ppm | ppm | ppm | ppm | ppm | ppm | ppm | % | ppm | ppm | ppm | % | ppm | ppm | ppm | ppm | ppm | ppm | ppm | ppm |
| DL | 2 | 0.3 | 1 | 0.3 | 1 | 3 | 1 | 1 | 0.5 | 50 | 1 | 2 | 0.01 | 1 | 2 | 0.2 | 0.01 | 1 | 1 | 15 | 0.1 | 3 | 0.5 | 0.2 | 0.5 |
| GB | <2 | <0.3 | 57 | <0.3 | <1 | 7 | 201 | 90 | <0.5 | 280 | 3 | <2 | 3.07 | 11 | 89 | 1.2 | 3.79 | <1 | 508 | 112 | 2.1 | <3 | <0.5 | 6.5 | <0.5 |
| UVQ-1 | <2 | <0.3 | 16 | 0.3 | 29 | 30 | 228 | 155 | 10.3 | 210 | 7 | <2 | 0.05 | 4 | 120 | 0.4 | 7.86 | <1 | 3860 | 230 | 2.3 | <3 | 2.3 | 40.4 | 23.3 |
| UVQ-2 | <2 | <0.3 | 13 | 0.5 | 19 | 33 | 581 | 125 | 7 | 280 | 5 | <2 | 0.06 | 3 | 226 | 0.2 | 5.48 | <1 | 2300 | 244 | 2.9 | <3 | 2.9 | 42.4 | 17.1 |
| EPIS | <2 | <0.3 | 3 | <0.3 | 1 | 12 | 248 | 70 | 2.4 | <50 | 4 | <2 | 3.55 | 7 | 97 | 1.2 | 2.41 | <1 | 436 | 151 | 1.4 | <3 | <0.5 | 12.6 | 2.2 |
| VQB-1 | <2 | <0.3 | 10 | <0.3 | 4 | <3 | 790 | 17 | 3.4 | <50 | <1 | <2 | 0.02 | 1 | 333 | <0.2 | 0.47 | <1 | 39 | <15 | 6 | <3 | <0.5 | 1.7 | 0.8 |
| VQB-2 | <2 | <0.3 | 4 | 0.4 | 6 | <3 | 841 | 10 | 2.3 | <50 | <1 | <2 | 0.02 | 1 | 411 | <0.2 | 0.26 | <1 | 28 | <15 | 3.9 | <3 | <0.5 | 0.5 | <0.5 |
| VQB-3 | <2 | <0.3 | 5 | <0.3 | 5 | 5 | 705 | 8 | 0.8 | <50 | <1 | <2 | 0.01 | 2 | 369 | <0.2 | 0.35 | <1 | 64 | <15 | 0.1 | <3 | 2.2 | 12.6 | 2.5 |
| K-F | 2 | 3.5 | 262 | 1.4 | 7 | 2270 | 63 | 113 | 59.2 | 1360 | 2 | <2 | 2.3 | 3 | 192 | 1.4 | 1.59 | <1 | 324 | 144 | 10.4 | <3 | <0.05 | 7.7 | 1.6 |
| VQCC | <2 | 1.1 | 208 | 0.4 | 7 | 632 | 127 | 98 | 24.8 | 390 | 2 | 29 | 0.52 | 14 | 472 | 0.2 | 4.66 | <1 | 736 | 136 | 5.5 | <3 | <0.05 | 2.9 | 1.0 |
| GMKC | <2 | <0.3 | 5 | <0.3 | <1 | 41 | 9 | 84 | 5.7 | 770 | 4 | <2 | 1.5 | 11 | 19 | 0.9 | 2.24 | <1 | 3500 | 182 | 1.1 | <3 | <0.5 | 13.7 | 3.1 |
| APL | <2 | <0.3 | 6 | <0.3 | 1 | 8 | 3 | 22 | 6.1 | 580 | 2 | <2 | 0.31 | 3 | <2 | 0.7 | 0.98 | <1 | 1600 | 98 | 1.1 | <3 | 1.5 | 8.0 | 2.8 |
| G | <2 | <0.3 | 8 | 0.5 | <1 | 38 | 70 | 116 | 4.8 | 710 | 3 | <2 | 1.32 | 19 | 155 | 2.3 | 5.03 | <1 | 1050 | 121 | 2.1 | <3 | 3.4 | 14.7 | 5.9 |
| CMV-1 | 3 | <0.3 | 134 | 1.3 | 41 | 77 | 131 | 97 | 5.8 | 3100 | 2 | <2 | 1.3 | 40 | 110 | 0.9 | 6.88 | <1 | 236 | 250 | 4.3 | <3 | 1.1 | 11.3 | 6.0 |
| CMV-2 | <2 | 0.5 | 17 | 0.8 | <1 | 5 | 78 | 72 | 19.6 | 1850 | 2 | 4 | 26.8 | 20 | 42 | 0.8 | 2.13 | <1 | 795 | 81 | 4.3 | <3 | <0.5 | 5.8 | 0.8 |
| CM | 14 | 1 | 60 | 0.7 | 57 | 22276 | 29 | 61 | 32.6 | 185 | <1 | <2 | 0.29 | 2 | 96 | 0.8 | 0.96 | <1 | 145 | 19 | 4.0 | <3 | <0.5 | 0.7 | 6.8 |
| AGR | 4 | 0.04 | 10 | 0.2 | 2 | 20 | 0.5 | 40–100 * | 1.5 | 600 | 5 | 0.1 | --- | 1 | 4 | 1–2 * | 1.4–2.7 * | 0.08 | 500 | 150 | 0.2 | 0.05 | 3.5 | 17 | 2.5–6 * |
| Sample | Hg | Au | Cu | Mo | Pb | Ni | Zn | As | Ba | Be | Co | Cr | Li | Mn | Rb | Sb | Ti (%) | Th | U | V | W | La | Ce | Nd | Sn (%) |
|---|---|---|---|---|---|---|---|---|---|---|---|---|---|---|---|---|---|---|---|---|---|---|---|---|---|
| 1 | 48 | 39 | 23 | 5 | 23 | 11 | 65 | 2.10 | 500 | 3 | 7 | 41 | 30 | 581 | 153 | 0.40 | 0.25 | 22.50 | 3.10 | 38 | 1.00 | 50 | 99 | 25 | 0.01 |
| 2 | 103 | 1 | 41 | 2 | 30 | 46 | 115 | 7.00 | 530 | 3 | 18 | 180 | 64 | 1000 | 162 | 1.20 | 0.41 | 27.90 | 3.50 | 91 | 15.00 | 67 | 135 | 37 | 0.01 |
| 3 | 37 | 1 | 22 | 4 | 26 | 13 | 46 | 4.90 | 390 | 4 | 5 | 41 | 41 | 473 | 297 | 0.60 | 0.53 | 29.70 | 7.60 | 63 | 1.00 | 35 | 80 | 22 | 0.01 |
| 4 | 47 | 1 | 6 | 1 | 38 | 5 | 41 | 3.60 | 350 | 6 | 4 | 20 | 23 | 421 | 360 | 0.60 | 0.10 | 36.90 | 8.70 | 15 | 1.00 | 38 | 90 | 33 | 0.01 |
| 5 | 23 | 1 | 4 | 1 | 23 | 4 | 25 | 2.40 | 50 | 6 | 4 | 16 | 21 | 349 | 288 | 0.40 | 0.10 | 22.50 | 6.00 | 12 | 1.00 | 17 | 43 | 7 | 0.01 |
| 6 | 23 | 1 | 4 | 2 | 32 | 3 | 31 | 0.50 | 330 | 6 | 1 | 1 | 21 | 612 | 279 | 0.10 | 0.06 | 18.90 | 5.00 | 7 | 1.00 | 14 | 42 | 5 | 0.01 |
| 7 | 41 | 1 | 12 | 6 | 33 | 11 | 85 | 4.80 | 50 | 3 | 9 | 39 | 37 | 953 | 153 | 0.70 | 0.38 | 45.00 | 6.40 | 52 | 32.00 | 108 | 198 | 74 | 0.01 |
| 8 | 37 | 8 | 15 | 6 | 34 | 9 | 79 | 3.50 | 630 | 5 | 9 | 30 | 45 | 640 | 90 | 0.50 | 0.29 | 39.60 | 3.30 | 46 | 1.00 | 117 | 207 | 68 | 0.01 |
| 9 | 34 | 1 | 11 | 4 | 30 | 24 | 84 | 3.20 | 640 | 4 | 11 | 36 | 48 | 840 | 180 | 0.60 | 0.45 | 28.80 | 4.10 | 64 | 1.00 | 68 | 135 | 46 | 0.01 |
| 10 | 26 | 1 | 11 | 3 | 28 | 9 | 71 | 4.60 | 530 | 4 | 5 | 24 | 34 | 570 | 162 | 0.40 | 0.26 | 33.30 | 3.90 | 42 | 1.00 | 70 | 135 | 38 | 0.01 |
| 11 | 14 | 1 | 13 | 1 | 27 | 7 | 116 | 2.70 | 610 | 3 | 5 | 23 | 31 | 597 | 189 | 0.10 | 0.35 | 82.80 | 7.80 | 41 | 1.00 | 171 | 306 | 90 | 0.01 |
| 12 | 28 | 5 | 7 | 1 | 26 | 5 | 48 | 2.00 | 50 | 3 | 5 | 1 | 28 | 674 | 144 | 0.40 | 0.22 | 28.80 | 3.80 | 28 | 1.00 | 55 | 117 | 33 | 0.01 |
| 13 | 24 | 9 | 9 | 1 | 27 | 8 | 32 | 4.10 | 320 | 4 | 3 | 31 | 23 | 314 | 225 | 0.60 | 0.14 | 20.70 | 5.80 | 21 | 6.00 | 26 | 59 | 14 | 0.01 |
| 14 | 45 | 1 | 12 | 2 | 28 | 10 | 49 | 4.70 | 280 | 4 | 6 | 24 | 29 | 402 | 189 | 0.60 | 0.16 | 31.50 | 8.40 | 25 | 1.00 | 34 | 88 | 28 | 0.01 |
| 15 | 33 | 1 | 12 | 1 | 30 | 11 | 44 | 4.10 | 270 | 5 | 5 | 24 | 37 | 292 | 234 | 0.50 | 0.16 | 32.40 | 8.30 | 27 | 1.00 | 37 | 90 | 32 | 0.01 |
| 16 | 103 | 6 | 119 | 1 | 34 | 45 | 114 | 2.90 | 50 | 3 | 16 | 180 | 74 | 1110 | 171 | 1.00 | 0.43 | 23.40 | 3.20 | 93 | 1.00 | 51 | 108 | 34 | 0.01 |
| 17 | 84 | 15 | 14 | 3 | 57 | 18 | 64 | 4.40 | 320 | 4 | 8 | 69 | 56 | 425 | 261 | 0.50 | 0.27 | 22.50 | 6.00 | 52 | 9.00 | 37 | 82 | 35 | 0.01 |
| 18 | 39 | 1 | 12 | 2 | 27 | 13 | 62 | 4.60 | 450 | 3 | 8 | 24 | 40 | 2070 | 108 | 0.50 | 0.32 | 33.30 | 4.40 | 46 | 9.00 | 71 | 135 | 41 | 0.01 |
| 19 | 47 | 1 | 20 | 7 | 33 | 12 | 90 | 0.50 | 560 | 4 | 11 | 28 | 55 | 981 | 153 | 0.80 | 0.45 | 31.50 | 5.70 | 65 | 1.00 | 77 | 153 | 43 | 0.01 |
| 20 | 19 | 1 | 14 | 1 | 29 | 7 | 59 | 2.40 | 420 | 3 | 5 | 14 | 35 | 551 | 171 | 0.50 | 0.13 | 31.50 | 4.10 | 19 | 1.00 | 63 | 117 | 42 | 0.01 |
| 21 | 19 | 1 | 25 | 1 | 35 | 11 | 92 | 2.30 | 610 | 3 | 7 | 19 | 43 | 1050 | 162 | 0.40 | 0.16 | 48.60 | 6.40 | 32 | 1.00 | 99 | 198 | 59 | 0.01 |
| 22 | 15 | 1 | 12 | 1 | 102 | 11 | 70 | 4.30 | 460 | 3 | 8 | 55 | 36 | 867 | 180 | 0.40 | 0.23 | 73.80 | 6.40 | 39 | 1.00 | 171 | 315 | 99 | 0.01 |
| 23 | 18 | 5 | 32 | 15 | 36 | 19 | 150 | 13.5 | 540 | 5 | 12 | 44 | 54 | 812 | 180 | 0.10 | 0.44 | 29.70 | 2.90 | 76 | 16.00 | 89 | 171 | 50 | 0.01 |
| 24 | 18 | 5 | 12 | 3 | 36 | 10 | 74 | 4.80 | 480 | 5 | 6 | 18 | 33 | 634 | 198 | 0.40 | 0.23 | 19.80 | 4.30 | 39 | 11.00 | 36 | 73 | 22 | 0.01 |
| 25 | 28 | 14 | 15 | 9 | 37 | 14 | 103 | 6.30 | 430 | 4 | 9 | 37 | 49 | 795 | 171 | 0.60 | 0.28 | 35.10 | 6.40 | 51 | 1.00 | 61 | 126 | 44 | 0.01 |
| 26 | 19 | 1 | 14 | 1 | 30 | 10 | 64 | 2.70 | 410 | 4 | 4 | 15 | 38 | 416 | 234 | 1.40 | 0.20 | 16.20 | 6.50 | 25 | 1.00 | 30 | 64 | 16 | 0.01 |
| 27 | 46 | 1 | 12 | 1 | 35 | 7 | 76 | 2.60 | 360 | 4 | 3 | 11 | 50 | 583 | 252 | 0.70 | 0.16 | 11.70 | 5.70 | 21 | 1.00 | 23 | 47 | 18 | 0.01 |
| 28 | 17 | 1 | 9 | 8 | 22 | 12 | 66 | 0.50 | 350 | 3 | 6 | 23 | 41 | 526 | 198 | 0.60 | 0.33 | 15.30 | 3.40 | 56 | 1.00 | 32 | 68 | 23 | 0.01 |
| 29 | 28 | 1 | 11 | 2 | 26 | 7 | 56 | 0.50 | 650 | 3 | 5 | 35 | 29 | 571 | 180 | 0.60 | 0.27 | 30.60 | 5.40 | 36 | 10.00 | 73 | 144 | 41 | 0.01 |
| 30 | 63 | 1 | 82 | 1 | 40 | 16 | 76 | 6.00 | 430 | 4 | 6 | 34 | 46 | 470 | 225 | 1.00 | 0.31 | 12.60 | 3.60 | 54 | 1.00 | 33 | 67 | 14 | 0.01 |
| 31 | 26 | 1 | 13 | 1 | 30 | 11 | 63 | 4.70 | 400 | 4 | 5 | 20 | 41 | 367 | 171 | 0.90 | 0.16 | 27.00 | 6.80 | 23 | 19.00 | 38 | 90 | 29 | 0.01 |
| 32 | 35 | 1 | 10 | 2 | 30 | 15 | 48 | 6.80 | 50 | 5 | 7 | 27 | 33 | 402 | 207 | 0.90 | 0.25 | 24.30 | 7.70 | 42 | 10.00 | 35 | 85 | 30 | 0.01 |
| 33 | 36 | 64 | 25 | 1 | 59 | 19 | 157 | 7.80 | 470 | 5 | 6 | 51 | 40 | 810 | 230 | 1.20 | 0.23 | 45.00 | 10.00 | 35 | 8.00 | 41 | 94 | 30 | 0.01 |
| 34 | 13 | 1 | 2 | 1 | 23 | 4 | 23 | 2.60 | 50 | 6 | 3 | 1 | 20 | 348 | 310 | 0.10 | 0.07 | 25.00 | 8.70 | 10 | 1.00 | 13 | 38 | 11 | 0.01 |
| 35 | 56 | 1 | 15 | 2 | 31 | 14 | 87 | 4.10 | 460 | 6 | 6 | 38 | 41 | 1270 | 260 | 0.60 | 0.23 | 48.00 | 12.00 | 35 | 10.00 | 49 | 120 | 30 | 0.11 |
| 36 | 41 | 54 | 15 | 2 | 48 | 15 | 96 | 7.00 | 430 | 6 | 7 | 50 | 35 | 1120 | 240 | 0.80 | 0.21 | 44.00 | 10.00 | 36 | 1.00 | 38 | 93 | 24 | 0.01 |
| 37 | 58 | 1 | 29 | 6 | 31 | 12 | 84 | 5.50 | 500 | 4 | 9 | 20 | 51 | 868 | 150 | 0.60 | 0.19 | 52.00 | 14.00 | 41 | 1.00 | 100 | 180 | 66 | 0.01 |
| 38 | 24 | 1 | 13 | 1 | 32 | 11 | 70 | 3.50 | 880 | 3 | 7 | 33 | 41 | 628 | 190 | 0.40 | 0.39 | 170.00 | 11.00 | 58 | 51.00 | 390 | 700 | 200 | 0.01 |
| 39 | 38 | 1 | 9 | 1 | 38 | 10 | 47 | 3.10 | 350 | 7 | 5 | 23 | 38 | 958 | 250 | 0.10 | 0.16 | 59.00 | 16.00 | 22 | 1.00 | 55 | 110 | 45 | 0.01 |
| 40 | 27 | 1 | 11 | 1 | 30 | 9 | 64 | 2.20 | 410 | 3 | 5 | 24 | 31 | 701 | 160 | 0.30 | 0.22 | 24.00 | 3.10 | 37 | 1.00 | 42 | 84 | 22 | 0.09 |
| 41 | 43 | 1 | 25 | 4 | 27 | 21 | 118 | 5.20 | 450 | 4 | 10 | 37 | 53 | 572 | 220 | 0.80 | 0.39 | 27.00 | 3.10 | 61 | 1.00 | 48 | 100 | 34 | 0.01 |
| M | 37.1 | 6.1 | 18.8 | 2.8 | 33.9 | 12.9 | 73.2 | 4.0 | 402 | 4 | 6.8 | 35.6 | 39 | 698 | 203 | 0.58 | 0.25 | 36.1 | 6.4 | 40 | 5.7 | 65 | 131 | 40 | 0.01 |
| FSSB | 180 | --- | 31.6 | --- | 35.8 | 22.7 | 121 | 9.8 | --- | --- | 50 | 43.4 | --- | 460 | --- | 2 | --- | --- | --- | --- | --- | --- | --- | --- | --- |
| Symbol | pH | Eh | EC | Cl | Br | NO3 | SO4 |
|---|---|---|---|---|---|---|---|
| Unit | pH Unit | mV | μS/cm | mg/L | mg/L | mg/L | mg/L |
| RD01 | 7.02 | 180 | 680 | 31.3 | 0.06 | 11.0 | 29.1 |
| RD02 | 6.97 | 128 | 684 | 32.3 | 0.08 | 17.9 | 30.9 |
| RD03 | 6.85 | 123 | 641 | 33 | 0.08 | 14.7 | 36.5 |
| RD04 | 6.87 | 96 | 671 | 30.1 | 0.07 | 4.9 | 35.1 |
| RD05 | 6.47 | ND | 464 | 27.8 | 0.06 | 16.6 | 29.4 |
| RD06 | 6.66 | 378 | 690 | 33.8 | 0.07 | 12.7 | 47.5 |
| RD07 | 6.72 | 156 | 1691 | 60.5 | 0.09 | 5.3 | 33.4 |
| RD08 | 6.15 | 125 | 1033 | 54.5 | 0.14 | 4.7 | 50.9 |
| RD09 | 6.62 | 100 | 1220 | 48.1 | 0.14 | 12.7 | 73.2 |
| RD10 | 6.4 | 24 | 1154 | 51.3 | 0.12 | 1.3 | 42.1 |
| RD11 | ND | ND | ND | 36.2 | 0.08 | 17.9 | 58.9 |
| RD12 | 6.18 | 116 | 547 | 31.5 | 0.07 | 4.6 | 71.8 |
| RD13 | 6.14 | 120 | 581 | 32.1 | 0.08 | 8.4 | 51.2 |
| RD14 | 5.74 | 144 | 598 | 27.1 | 0.08 | 0.04 | 20.9 |
| RD15 | 8.18 | 40 | 581 | 36 | 0.07 | 10.2 | 27.4 |
| RD16 | 6.71 | 274 | 1093 | 41.5 | 0.07 | 5.8 | 48.9 |
| RD17 | 7.7 | 235 | 140 | 19.5 | 0.05 | 8.0 | 14 |
| RD18 | 7.85 | 263 | 833 | 18.6 | 0.07 | 7.1 | 19.8 |
| RD19 | 7.13 | 247 | 912 | 3.81 | <0.03 | 1.2 | 40.8 |
| RD20 | 6.95 | -105 | 850 | 7.47 | 0.05 | 3.6 | 94.8 |
| RD21 | 6.76 | 17.8 | 632 | 28 | 0.07 | 6.0 | 31.9 |
| P-1A | 7.7 | 100 | 1000 | 53.4 | 0.2 | 0.08 | 76.8 |
| P-5A | 7.06 | 116 | 1060 | 119 | 0.41 | 13.4 | 58.2 |
| P-6A | 7.5 | 101 | 1020 | 149 | 0.65 | 0.6 | 24.3 |
| P-9A | 7.42 | 18 | 1150 | 162 | 0.71 | 0.1 | 19.4 |
| OS-13 | 7.7 | 200 | 187 | 6.33 | <0.03 | 0.1 | 10.2 |
| OS-12 | 7.6 | 200 | 177 | 5.75 | <0.03 | 0.1 | 9.87 |
| EMLD | --- | --- | 2500 | 250 | --- | 50 | 250 |
| Sample | Li | Be | Ti | V | Cr | Mn | Co | Ni | Cu | Zn | As | Rb | Mo | Sn | Sb | Ba | La | Ce | Nd | W | Au | Hg | Pb | Th | U | F |
|---|---|---|---|---|---|---|---|---|---|---|---|---|---|---|---|---|---|---|---|---|---|---|---|---|---|---|
| RD01 | 61 | 0.1 | 4.9 | 0.3 | 0.5 | 1.2 | 0.005 | 2.9 | 3.8 | 38 | 0.28 | 0.276 | 1.6 | 0.3 | 1.33 | 42.2 | 0.033 | 0.014 | 0.028 | 0.02 | 0.002 | 0.2 | 1.17 | 0.001 | 5.92 | 0.18 |
| RD02 | 20 | 0.1 | 3 | 0.2 | 0.5 | 0.8 | 0.005 | 4.3 | 0.8 | 27.7 | 0.22 | 0.131 | 2 | 0.1 | 0.96 | 34.7 | 0.007 | 0.007 | 0.001 | 0.02 | 0.002 | 0.7 | 0.46 | 0.001 | 6.57 | 0.43 |
| RD03 | 10 | 0.1 | 4.4 | 0.2 | 0.5 | 9.9 | 0.005 | 0.7 | 2.7 | 35.2 | 0.3 | 0.268 | 0.5 | 0.1 | 1.33 | 31.2 | 0.027 | 0.032 | 0.024 | 0.02 | 0.002 | 0.3 | 0.55 | 0.002 | 0.737 | 0.16 |
| RD04 | 9 | 0.1 | 2.2 | 0.3 | 0.5 | 2.2 | 0.005 | 0.6 | 1.5 | 9.3 | 0.17 | 0.28 | 1.1 | 0.1 | 1.39 | 32.4 | 0.018 | 0.023 | 0.013 | 0.02 | 0.002 | 0.2 | 0.95 | 0.001 | 1.13 | 0.13 |
| RD05 | 31 | 0.3 | 4.4 | 0.1 | 0.5 | 1.5 | 0.005 | 0.3 | 0.8 | 17.6 | 0.09 | 4.1 | 0.1 | 0.1 | 1.19 | 5.8 | 1.23 | 0.02 | 1.87 | 0.03 | 0.002 | 1.4 | 0.3 | 0.002 | 2.45 | 0.2 |
| RD06 | 11 | 0.1 | 2.3 | 0.4 | 0.7 | 1.5 | 0.005 | 0.5 | 0.8 | 6.7 | 0.23 | 0.118 | 2 | 0.1 | 1.34 | 51.7 | 0.038 | 0.016 | 0.028 | 0.05 | 0.002 | 1.5 | 1.55 | 0.001 | 12.6 | 0.18 |
| RD07 | 15 | 0.1 | 3.6 | 0.2 | 0.9 | 434 | 1.47 | 4.6 | 2.1 | 21.1 | 0.58 | 0.974 | 1.1 | 0.1 | 1.2 | 81.8 | 0.013 | 0.02 | 0.002 | 0.02 | 0.002 | 1.8 | 0.86 | 0.001 | 5.8 | 0.05 |
| RD08 | 15 | 0.1 | 4.9 | 0.5 | 0.7 | 1260 | 0.671 | 5.1 | 6.1 | 33.8 | 1.11 | 1.02 | 3.3 | 0.2 | 1.42 | 120 | 0.073 | 0.12 | 0.058 | 0.05 | 0.002 | 0.5 | 1.54 | 0.005 | 1.35 | 0.09 |
| RD09 | 19 | 0.1 | 5 | 1.1 | 0.8 | 620 | 0.086 | 2.1 | 1.8 | 28.1 | 0.71 | 1.17 | 1.5 | 0.1 | 1.43 | 106 | 0.027 | 0.029 | 0.01 | 0.03 | 0.002 | 1.8 | 0.7 | 0.001 | 2.73 | 0.08 |
| RD10 | 26 | 0.9 | 66.1 | 16.3 | 8.8 | 1640 | 8.62 | 46 | 132 | 158 | 3.75 | 9.86 | 1.2 | 0.9 | 1.03 | 195 | 9.06 | 20.7 | 10.5 | 0.06 | 0.002 | 0.2 | 32.7 | 1.15 | 2.73 | 0.11 |
| RD11 | 26 | 0.1 | 3.2 | 0.6 | 0.8 | 0.7 | 0.005 | 0.3 | 0.5 | 6.7 | 0.19 | 0.158 | 0.4 | 0.1 | 1.23 | 28.1 | 0.119 | 0.117 | 0.054 | 0.03 | 0.002 | 4.2 | 0.28 | 0.002 | 11 | 0.26 |
| RD12 | 12 | 0.1 | 1.9 | 0.8 | 0.5 | 15.8 | 0.059 | 1 | 1.2 | 6.6 | 0.46 | 0.354 | 1.4 | 0.1 | 1.33 | 51.2 | 0.03 | 0.05 | 0.02 | 0.02 | 0.002 | 1.2 | 0.38 | 0.005 | 2.34 | 0.15 |
| RD13 | 12 | 0.1 | 1 | 0.4 | 0.5 | 95.6 | 0.799 | 1 | 1.1 | 7.2 | 0.54 | 0.819 | 2.3 | 0.1 | 1.26 | 46.2 | 0.017 | 0.023 | 0.001 | 0.02 | 0.002 | 0.3 | 0.3 | 0.001 | 2.18 | 0.15 |
| RD14 | 31 | 0.1 | 2 | 0.1 | 0.5 | 823 | 0.224 | 2.4 | 0.8 | 4.6 | 0.51 | 3.46 | 4.7 | 0.1 | 1.89 | 30.3 | 0.004 | 0.008 | 0.001 | 0.03 | 0.002 | 3 | 0.25 | 0.001 | 6.35 | 0.23 |
| RD15 | 12 | 0.1 | 0.2 | 0.2 | 0.5 | 4.5 | 0.005 | 0.3 | 0.7 | 4.6 | 0.18 | 0.373 | 1 | 0.1 | 1.28 | 37.8 | 0.022 | 0.013 | 0.01 | 0.02 | 0.002 | 1.1 | 0.23 | 0.001 | 2.13 | 0.15 |
| RD16 | 16 | 0.1 | 1 | 0.4 | 0.5 | 5.9 | 0.005 | 1.7 | 1.1 | 30.2 | 0.45 | 0.896 | 0.7 | 0.1 | 1.28 | 69 | 0.017 | 0.004 | 0.001 | 0.02 | 0.002 | 1.7 | 0.04 | 0.001 | 5.53 | 0.07 |
| RD17 | 3 | 0.1 | 7.2 | 0.4 | 0.6 | 3.7 | 0.05 | 0.8 | 2 | 8.4 | 0.22 | 1.43 | 0.4 | 0.1 | 1.39 | 6.4 | 0.13 | 0.425 | 0.163 | 0.02 | 0.002 | 0.3 | 0.99 | 0.245 | 0.258 | 0.34 |
| RD18 | 155 | 0.1 | 1.1 | 0.3 | 0.5 | 0.1 | 0.005 | 0.4 | 0.8 | 26.3 | 0.13 | 10.7 | 3.7 | 0.1 | 1.08 | 52.3 | 0.004 | 0.005 | 0.001 | 0.09 | 0.002 | 0.9 | 0.05 | 0.001 | 9.06 | 0.1 |
| RD19 | 13 | 0.1 | 0.5 | 0.1 | 0.5 | 2.1 | 0.005 | 1.4 | 1.7 | 8.7 | 0.13 | 66.9 | 7.1 | 0.1 | 1.35 | 90.8 | 0.01 | 0.016 | 0.001 | 0.02 | 0.002 | 2 | 0.39 | 0.001 | 7.29 | 0.08 |
| RD20 | 6 | 0.1 | 0.1 | 0.2 | 2.2 | 510 | 0.005 | 1.5 | 1.3 | 16.8 | 0.62 | 0.252 | 1.6 | 0.1 | 0.87 | 33.3 | 0.005 | 0.002 | 0.001 | 0.02 | 0.002 | 0.2 | 0.01 | 0.001 | 25.5 | 0.04 |
| RD21 | 12 | 0.1 | 1.4 | 0.3 | 0.9 | 0.2 | 0.005 | 0.3 | 0.2 | 0.6 | 0.16 | 0.101 | 0.9 | 0.1 | 0.97 | 33.2 | 0.002 | 0.001 | 0.001 | 0.02 | 0.002 | 0.2 | 0.01 | 0.001 | 0.528 | 0.15 |
| P-1A | 50 | 0.1 | 1.5 | 0.1 | 0.5 | 2.1 | 0.005 | 0.8 | 4 | 200 | 0.53 | 5.29 | 2.9 | 0.1 | 1.02 | 33.7 | 0.007 | 0.012 | 0.007 | 0.04 | 0.002 | 0.2 | 1.8 | 0.001 | 8.87 | 0.34 |
| P-5A | 50 | 0.1 | 2.3 | 0.1 | 0.5 | 129 | 0.005 | 0.4 | 1.5 | 201 | 0.19 | 2.38 | 6.9 | 0.1 | 0.96 | 73.5 | 0.026 | 0.024 | 0.022 | 0.05 | 0.002 | 0.2 | 1.74 | 0.001 | 10.3 | 0.49 |
| P-6A | 52 | 0.1 | 1.9 | 0.3 | 0.5 | 33.1 | 0.005 | 1.1 | 1.8 | 196 | 0.39 | 9.84 | 8.6 | 0.1 | 0.88 | 18.5 | 0.047 | 0.084 | 0.066 | 0.04 | 0.003 | 0.2 | 11.9 | 0.001 | 37.7 | 0.88 |
| P-9A | 46 | 0.1 | 1.7 | 0.5 | 0.5 | 6.5 | 0.005 | 3 | 1.9 | 205 | 0.15 | 0.9 | 4.4 | 0.1 | 0.88 | 20.4 | 0.02 | 0.01 | 0.019 | 0.09 | 0.005 | 0.2 | 3.08 | 0.001 | 30.4 | 0.76 |
| OS-13 | 19 | <0.1 | 1.1 | <1 | <5 | <1 | <0.05 | <3 | <2 | 6 | 0.55 | 3.44 | 8.9 | <1 | <0.1 | 29.7 | 0.03 | 0.017 | 0.029 | 0.72 | <0.02 | <2 | 0.51 | <0.01 | 152 | 0.38 |
| OS-12 | 19 | <0.1 | 2 | <0.1 | <0.5 | 2.1 | <0.005 | <0.3 | 2.4 | 20.4 | 0.6 | 3.1 | 8.5 | <0.1 | 1.49 | 28.1 | 0.02 | 0.033 | 0.034 | 0.88 | 0.011 | <0.2 | 31.3 | <0.001 | 132 | 0.32 |
| EMLD | -- | -- | -- | -- | 50 | 50 | -- | 20 | 2000 | -- | 10 | -- | -- | -- | 5 | 700 * | -- | -- | -- | -- | -- | 1 | 10 | -- | 30 * | 1.5 |
| Variables | Factor | Factor | Factor | Factor |
|---|---|---|---|---|
| 1 | 2 | 3 | 4 | |
| Hg | 0.86 | −0.12 | 0.12 | −0.11 |
| Au | 0.04 | −0.13 | 0.07 | 0.10 |
| Cu | 0.80 | −0.07 | −0.11 | −0.01 |
| Mo | 0.01 | −0.01 | −0.16 | 0.90 |
| Pb | 0.09 | 0.20 | 0.06 | −0.08 |
| Ni | 0.94 | −0.01 | −0.05 | 0.15 |
| Zn | 0.46 | 0.17 | −0.18 | 0.52 |
| As | 0.27 | 0.05 | 0.29 | 0.65 |
| Ba | −0.06 | 0.52 | −0.30 | 0.22 |
| Be | −0.25 | −0.26 | 0.81 | 0.13 |
| Co | 0.80 | 0.15 | −0.23 | 0.37 |
| Cr | 0.91 | 0.04 | −0.05 | −0.007 |
| Li | 0.80 | 0.09 | −0.16 | 0.31 |
| Mn | 0.28 | 0.13 | −0.18 | 0.13 |
| Rb | −0.13 | −0.22 | 0.77 | −0.19 |
| Sb | 0.59 | −0.18 | −0.04 | −0.14 |
| Ti | 0.55 | 0.29 | −0.31 | 0.49 |
| Th | −0.07 | 0.96 | 0.11 | −0.07 |
| U | −0.13 | 0.33 | 0.72 | −0.12 |
| V | 0.76 | 0.22 | −0.28 | 0.45 |
| W | 0.12 | 0.72 | 0.10 | 0.12 |
| La | −0.002 | 0.97 | −0.16 | 0.02 |
| Ce | 0.005 | 0.98 | −0.13 | 0.01 |
| Nd | 0.01 | 0.97 | −0.12 | 0.04 |
| Sn | −0.03 | −0.06 | 0.15 | −0.09 |
| Variables | Factor | Factor | Factor | Factor |
|---|---|---|---|---|
| 1 | 2 | 3 | 4 | |
| Li | −0.05 | 0.18 | −0.03 | 0.90 |
| Be | 0.96 | 0.02 | 0.06 | 0.01 |
| Ti | 0.99 | 0.01 | 0.06 | 0.01 |
| V | 0.99 | 0.03 | 0.03 | 0.02 |
| Cr | 0.97 | 0.03 | 0.05 | −0.02 |
| Mn | 0.74 | −0.19 | −0.13 | 0.08 |
| Co | 0.98 | −0.007 | 0.02 | 0.01 |
| Ni | 0.99 | 0.03 | 0.008 | 0.02 |
| Cu | 0.99 | 0.04 | 0.02 | 0.02 |
| Zn | 0.28 | 0.80 | −0.09 | 0.22 |
| As | 0.96 | −0.03 | 0.003 | 0.004 |
| Rb | 0.08 | −0.04 | −0.84 | −0.04 |
| Mo | −0.11 | 0.51 | −0.73 | 0.22 |
| Sn | 0.96 | 0.005 | 0.04 | 0.05 |
| Sb | −0.12 | −0.72 | −0.23 | −0.07 |
| Ba | 0.76 | −0.24 | −0.28 | 0.12 |
| La | 0.98 | 0.03 | 0.05 | 0.01 |
| Ce | 0.99 | 0.04 | 0.02 | 0.01 |
| Nd | 0.97 | 0.03 | 0.05 | 0.01 |
| W | 0.23 | 0.41 | −0.04 | 0.80 |
| Au | −0.08 | 0.76 | −0.04 | 0.16 |
| Hg | −0.15 | −0.48 | −0.37 | 0.04 |
| Pb | 0.92 | 0.29 | −0.05 | 0.01 |
| Th | 0.97 | 0.03 | 0.06 | −0.02 |
| U | −0.14 | 0.80 | −0.22 | 0.11 |
| F | −0.16 | 0.88 | −0.08 | 0.04 |
© 2016 by the authors; licensee MDPI, Basel, Switzerland. This article is an open access article distributed under the terms and conditions of the Creative Commons Attribution (CC-BY) license (http://creativecommons.org/licenses/by/4.0/).
Share and Cite
Navarro, A.; Font, X.; Viladevall, M. Groundwater Contamination by Uranium and Mercury at the Ridaura Aquifer (Girona, NE Spain). Toxics 2016, 4, 16. https://doi.org/10.3390/toxics4030016
Navarro A, Font X, Viladevall M. Groundwater Contamination by Uranium and Mercury at the Ridaura Aquifer (Girona, NE Spain). Toxics. 2016; 4(3):16. https://doi.org/10.3390/toxics4030016
Chicago/Turabian StyleNavarro, Andrés, Xavier Font, and Manuel Viladevall. 2016. "Groundwater Contamination by Uranium and Mercury at the Ridaura Aquifer (Girona, NE Spain)" Toxics 4, no. 3: 16. https://doi.org/10.3390/toxics4030016