Detection of Lard in Cocoa Butter—Its Fatty Acid Composition, Triacylglycerol Profiles, and Thermal Characteristics

Abstract
:1. Introduction
2. Materials and Methods
2.1. Sample Preparation and Supplies
2.2. Extraction of Oil from Lard
2.3. Blend Preparation of Adulterated Cocoa Butter
2.4. Determination of Triacylglycerol Composition of Lard, Cocoa Butter, and Their Admixture
2.5. Determination of Fatty Acid Composition of Lard, Cocoa Butter, and Their Admixture
2.6. Thermal Analysis of Lard, Cocoa Butter, and Their Admixture Using Differential Scanning Calorimetry
2.7. Statistical Analysis
3. Results and Discussion
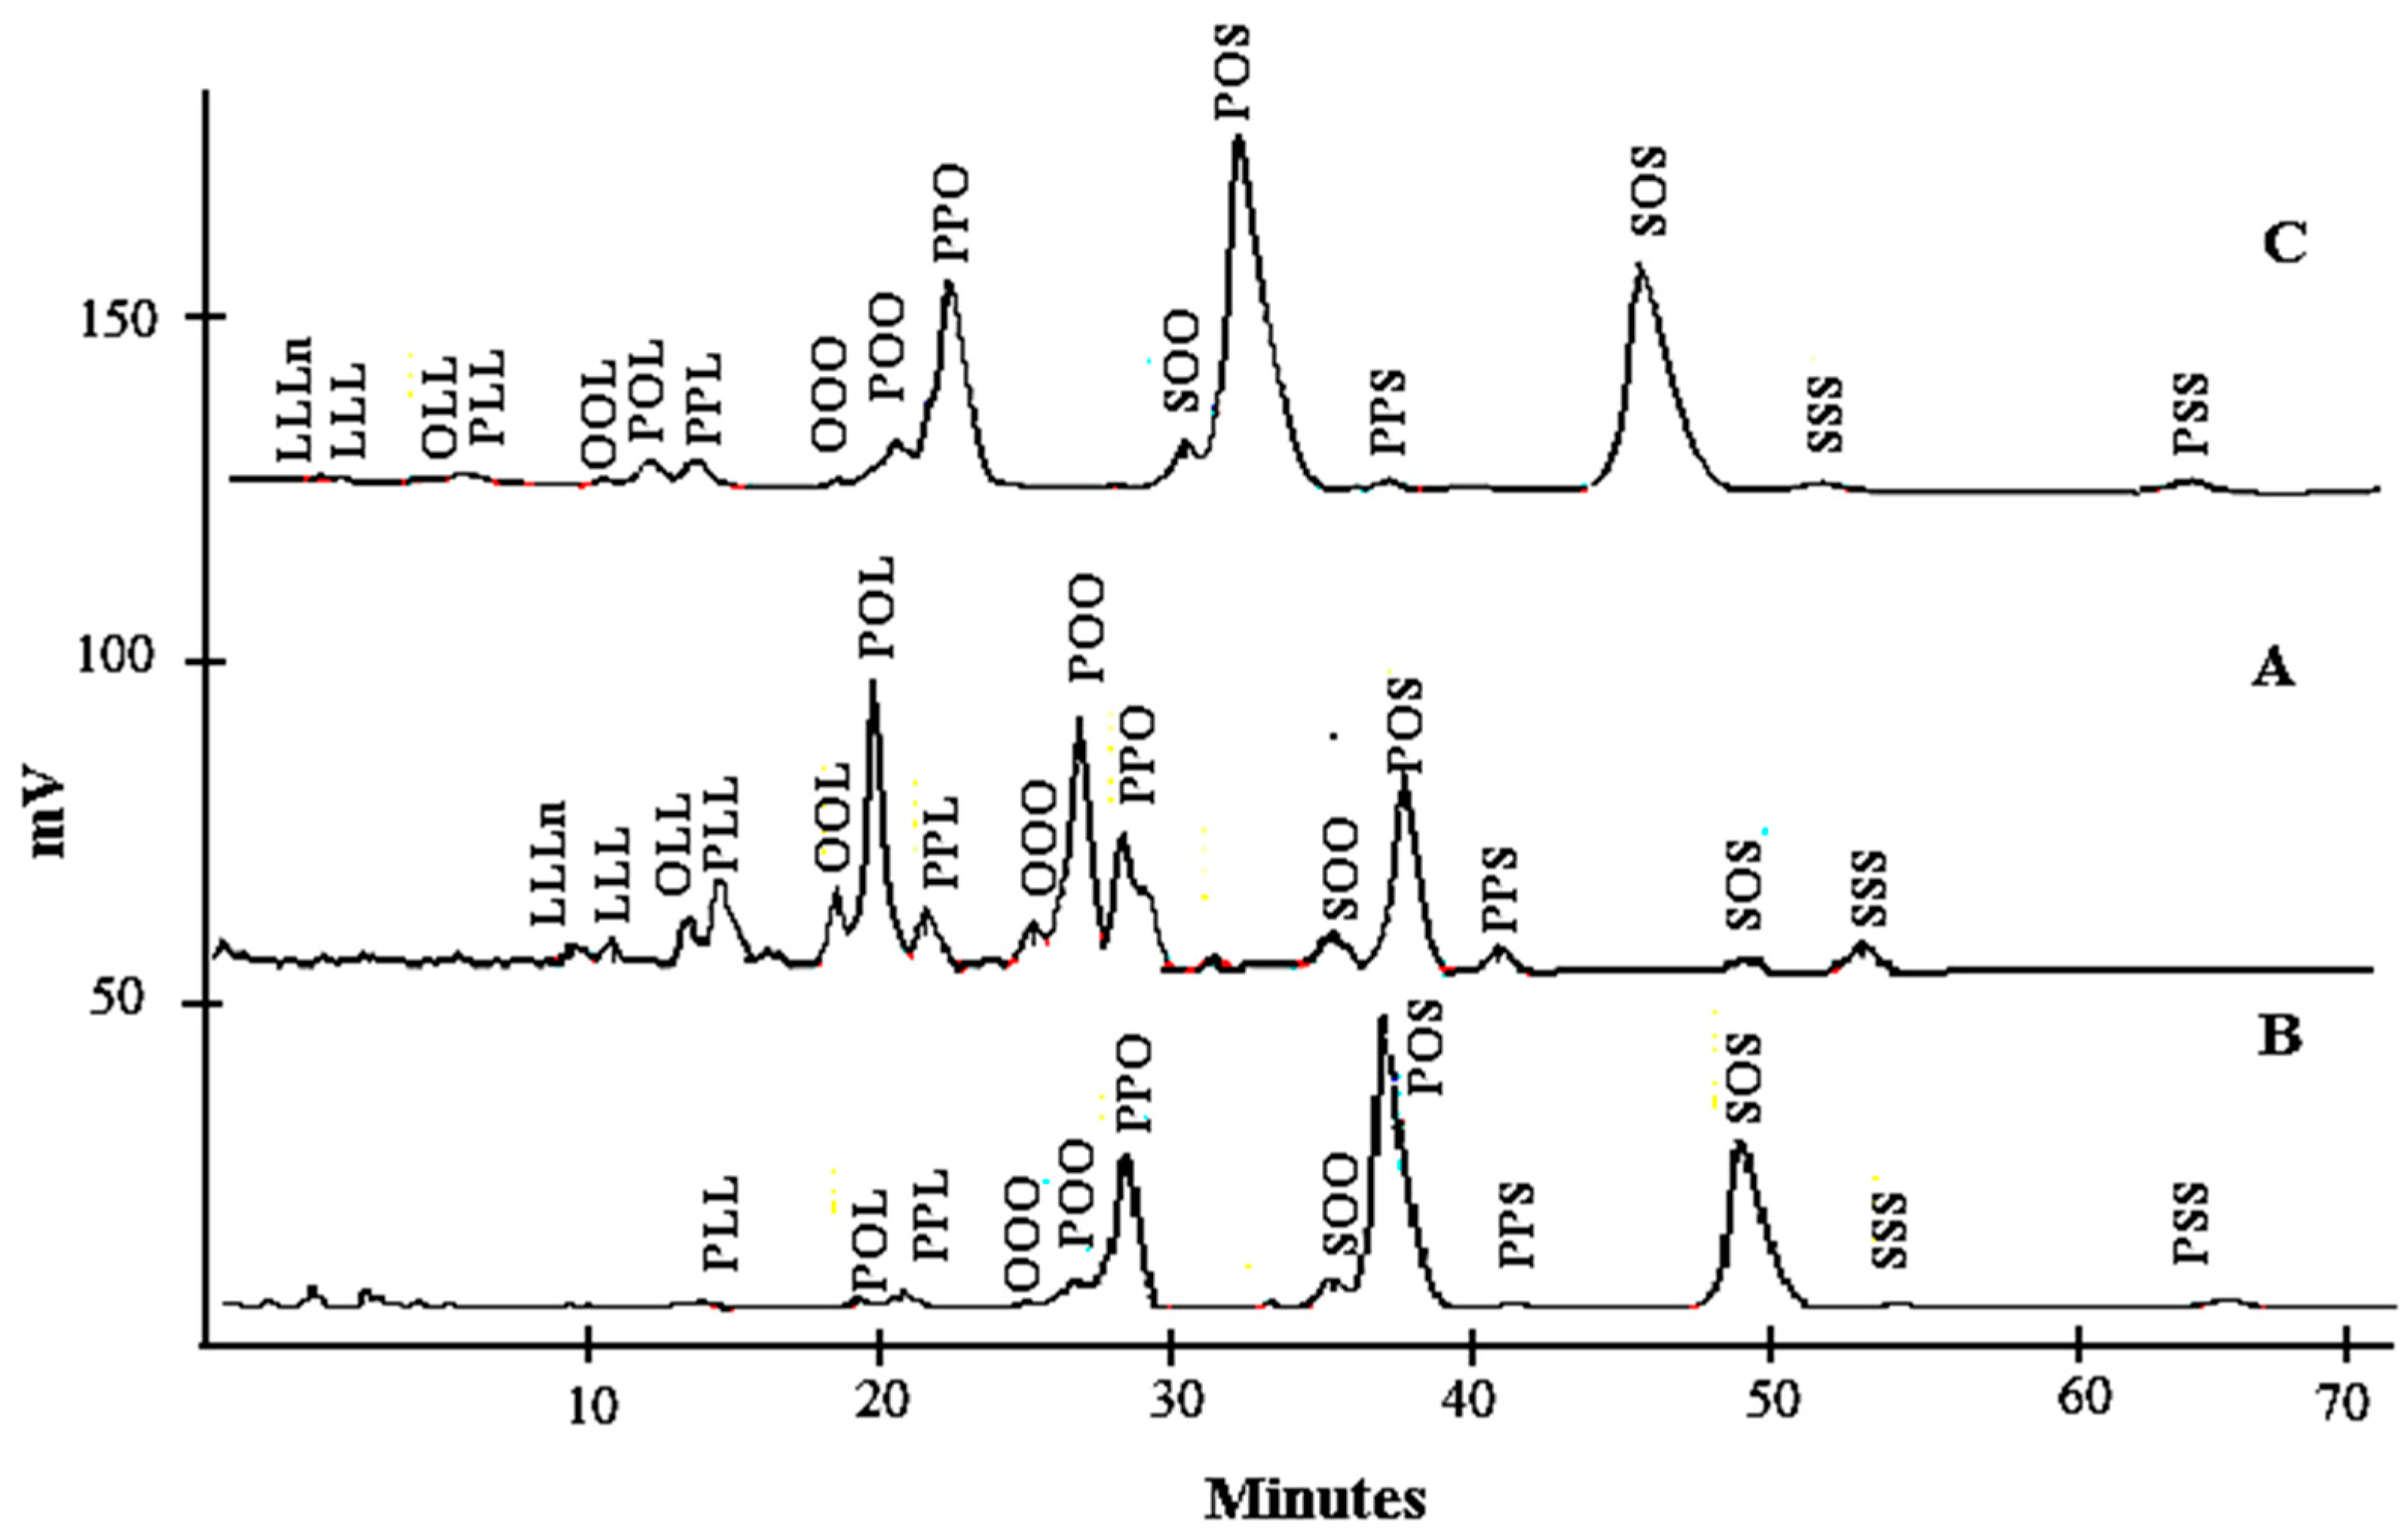
3.1. Triacylglycerol Composition of Lard, Cocoa Butter, and Their Admixture
3.2. Fatty Acid Methyl Ester Composition of Lard, Cocoa Butter, and Their Admixtures
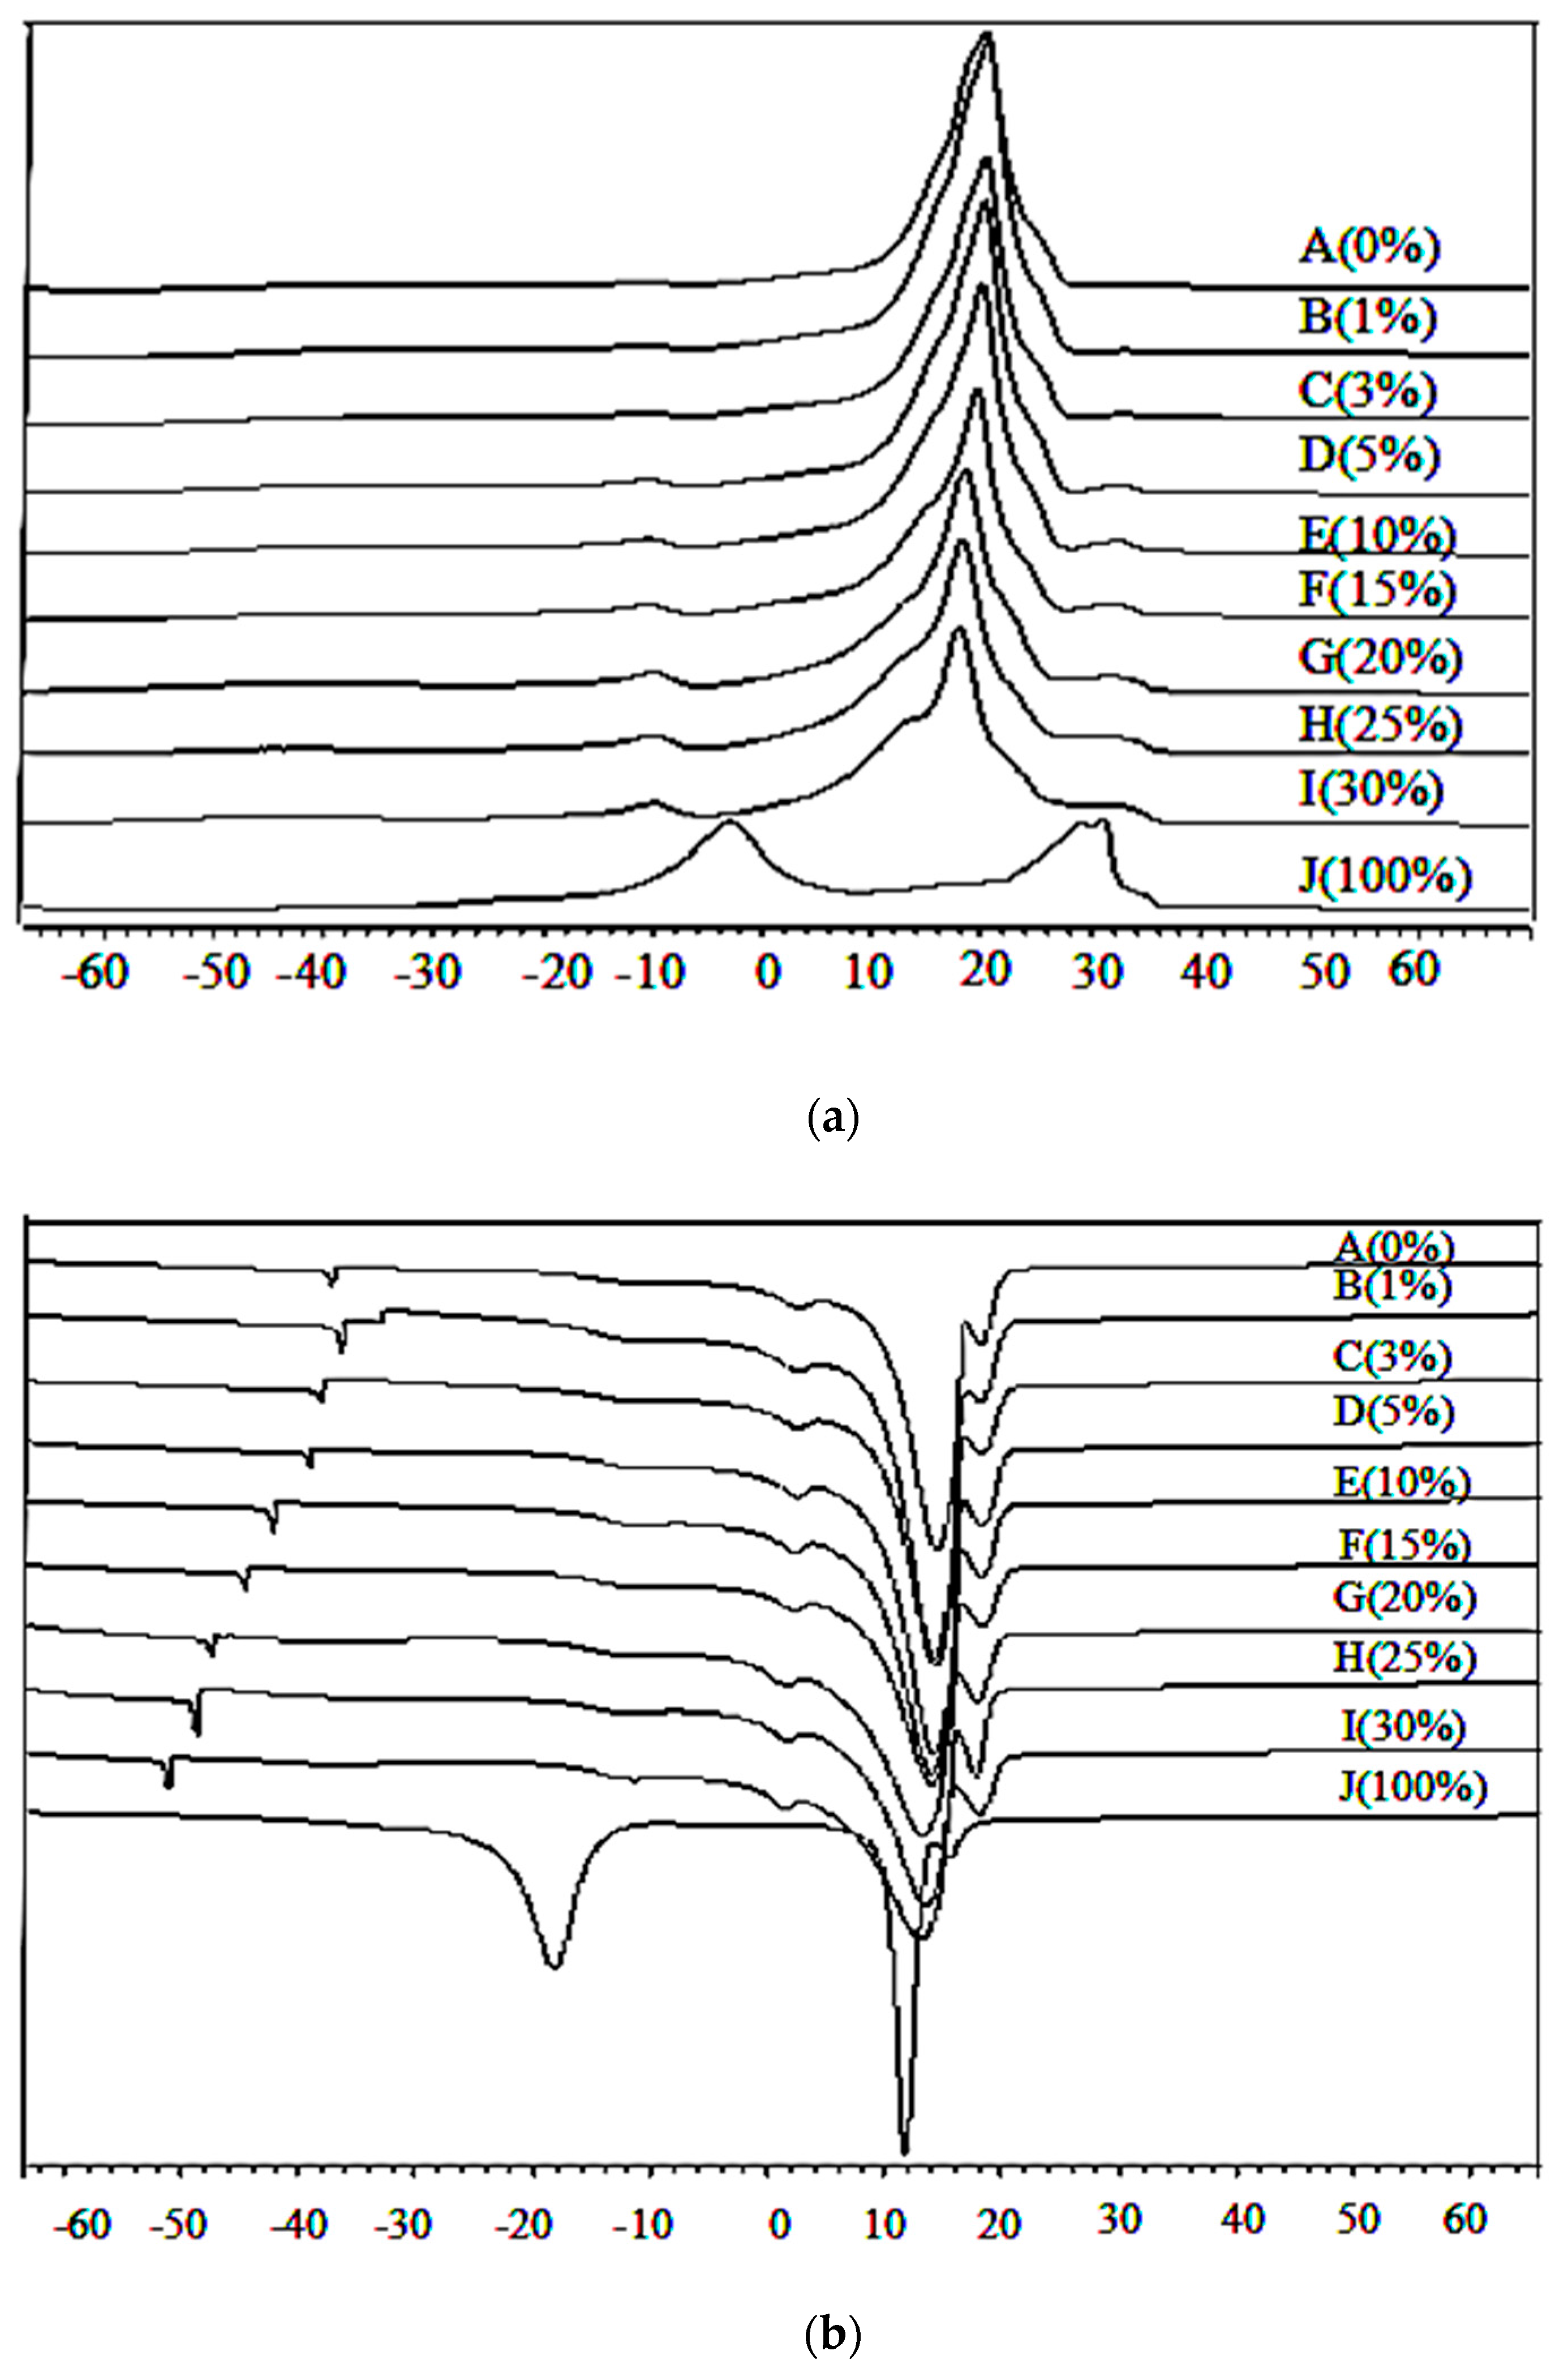
3.3. Thermal Analysis of Lard, Cocoa Butter, and Their Admixtures during Heating and Cooling Temperatures
4. Conclusions
Acknowledgments
Author Contributions
Conflicts of Interest
References
- Food and Agriculture Organization (FAO). Assuring Food Safety and Quality; Agriculture and Consumer Protection: Rome, Italy, 2014. [Google Scholar]
- Che Man, Y.B.; Syaharizaa, Z.A.; Mirghania, M.E.S.; Jinapb, S.; Bakara, J. Analysis of potential lard adulteration in chocolate and chocolate products using Fourier transform infrared spectroscopy. Food Chem. 2005, 90, 815–819. [Google Scholar] [CrossRef]
- Kamal, M.; Karoui, R. Analytical methods coupled with chemometric tools for determining the authenticity and detecting the adulteration of dairy products: A review. Trends Food Sci. Technol. 2015, 46, 27–48. [Google Scholar] [CrossRef]
- Aida, A.A.; Che Man, Y.B.; Wong, C.M.V.L.; Raha, A.R.; Son, R. Analysis of raw meats and fats of pigs using polymerase chain reaction for Halal authentication. Meat Sci. 2005, 69, 47–52. [Google Scholar] [CrossRef] [PubMed]
- Aida, A.A.; Che Man, Y.B.; Raha, A.R.; Son, R. Detection of pig derivatives in food products for Halal authentication by polymerase chain reaction—Restriction fragment length polymorphism. J. Sci. Food Agric. 2007, 87, 569–572. [Google Scholar] [CrossRef]
- Rosman, N.; Mokhtar, N.F.K.; Ali, M.E.; Mustafa, S. Inhibitory effect of chocolate components toward lard detection in chocolate using real time PCR. Int. J. Food Prop. 2016, 19, 2587–2595. [Google Scholar] [CrossRef]
- Che Man, Y.; Mirghani, M. Detection of lard mixed with body fats of chicken,lamb, and cow by fourier transform infrared spectroscopy. J.Am. Oil Chem. Soc. 2001, 78, 753–761. [Google Scholar] [CrossRef]
- Jaswir, I.; Mirghani, M.E.S.; Hassan, T.H.; Mohd Said, M.Z. Determination of lard in mixtures of body fats of mutton and cow by Fourier transform-infra red (FTIR) spectroscopy. J. Oleo Sci. 2003, 52, 633–638. [Google Scholar] [CrossRef]
- Syahariza, Z.A.; Che Man, Y.B.; Selamat, J.; Bakar, J. Detection of lard adulteration in cake formulation by Fourier transform infrared (FTIR) spectroscopy. Food Chem. 2005, 92, 365–370. [Google Scholar] [CrossRef]
- Syahariza, Z.A. Detection of Lard in Selected Food Model Systems Using Fourier Transform Infrared (FTIR) Spectroscopy. Master’s Thesis, Universiti Putra Malaysia, Selangor, Malaysia, 2006. [Google Scholar]
- Rohman, A.; Che Man, Y.B. FTIR spectroscopy combined with chemometrics for analysis of lard in the mixtures with body fats of lamb, cow, and chicken. Int. Food Res. J. 2010, 17, 519–526. [Google Scholar]
- Rohman, A.; Che Man, Y.B. Analysis of cod-liver oil adulteration using fourier transform infrared (FTIR) spectroscopy. J. Am. Oil Chem. Soc. 2009, 86, 1149–1153. [Google Scholar] [CrossRef]
- Mansor, T.S.T.; Che Man, Y.B.; Rohman, A. Application of fast chromatography and Fourier transform infrared spectroscopy for analysis of lard adulteration in virgin coconut oil. Food Anal. Methods 2011, 4, 365–372. [Google Scholar] [CrossRef]
- Rohman, A.; Che Man, Y.B. Authentication analysis of cod liver oil from beef fat using fatty acid composition and FTIR spectra. Food Addit. Contam. Part A 2011, 28, 1469–1474. [Google Scholar] [CrossRef] [PubMed]
- Che Man, Y.B.; Rohman, A. Differentiation of lard from other edible fats and oils by means of fourier transform infrared spectroscopy and chemometrics. J. Am. Oil Chem. Soc. 2011, 88, 187–192. [Google Scholar] [CrossRef]
- Rohman, A.; Gupitasari, I.; Purwanto, P.; Triyana, K.; Rosman, A.S.; Ahmad, S.A.S.; Yusof, F.M. Quantification of lard in the mixture with olive oil in cream cosmetics based on FTIR spectra and chemometrics. J. Teknol. 2014, 69, 113–119. [Google Scholar] [CrossRef]
- Che Man, Y.B.; Marina, A.M.; Rohman, A.; Al-Kahtani, H.A.; Norazura, O. A FTIR spectroscopy method for analysis of palm oil adulterated with lard in prefried French fries. Int. J. Food Prop. 2014, 17, 354–362. [Google Scholar] [CrossRef]
- Suparman, S.; Rahayu, W.S.; Sundhani, E.; Saputri, S.D. The use of Fourier transform infrared spectroscopy (FTIR) and gas chromatography mass spectroscopy (GCMS) for Halal authentication in imported chocolate with various variants. J. Food Pharm. Sci. 2015, 2, 6–11. [Google Scholar]
- Ramli, S.; Talib, R.A.; Rahman, R.A.; Zainuddin, N.; Othman, S.H.; Rashid, N.M. Detection of lard in ink extracted from printed food packaging using fourier transform infrared spectroscopy and multivariate analysis. J. Spectrosc. 2015, 2015, 1–6. [Google Scholar] [CrossRef]
- Che Man, Y.B.; Gan, H.L.; Nor Aini, I.; Nazimah, S.A.H.; Tan, C.P. Detection of lard adulteration in RBD palm olein using an electronic nose. Food Chem. 2005, 90, 829–835. [Google Scholar] [CrossRef]
- Marikkar, J.M.N.; Lai, O.M.; Ghazali, H.M.; CheMan, Y.B. Detection of lard and randomized lard as adulterants in refined-bleached-deodorized palm oil by differential scanning calorimetry. J. Am. Oil Chem. Soc. 2001, 78, 1113–1119. [Google Scholar] [CrossRef]
- Marikkar, J.M.N.; Ghazali, H.M.; Che Man, Y.B.; Lai, O.M. The use of cooling and heating thermograms for monitoring of tallow, lard and chicken fat adulterations in canola oil. Food Res. Int. 2002, 35, 1007–1014. [Google Scholar] [CrossRef]
- Mansor, T.S.T.; Che Man, Y.B.; Shuhaimi, M. Employment of differential scanning calorimetry in detecting lard adulteration in virgin coconut oil. J. Am. Oil Chem.Soc. 2012, 89, 485–496. [Google Scholar] [CrossRef]
- Marikkar, J.M.N.; Dzulkifly, M.H.; Nadiha, M.Z.N.; Man, Y.B.C. Detection of animal fat contaminations in sunflower oil by differential scanning calorimetry. Int. J. Food Prop. 2012, 15, 683–690. [Google Scholar] [CrossRef]
- Marikkar, J.M.N.; Rana, S. Use of differential scanning calorimetry to detect canola oil (Brassica napus L.) adulterated with lard stearin. J. Oleo Sci. 2014, 63, 867–873. [Google Scholar] [CrossRef] [PubMed]
- Nurrulhidayah, A.F.; Arieff, S.R.; Rohman, A.; Amin, I.; Shuhaimi, M.; Khatib, A. Detection of butter adulteration with lard using differential scanning calorimetry. Int. Food Res. J. 2015, 22, 832–839. [Google Scholar]
- Rashood, K.A.; Shaaban, R.R.A.; Moety, E.M.A.; Rauf, A. Compositional and thermal characterization of genuine and randomized lard: A comparative study. J. Am. Oil Chem. Soc. 1996, 73, 303–309. [Google Scholar] [CrossRef]
- Marikkar, J.M.N.; Ghazali, H.M.; Che Man, Y.B.; Peiris, T.S.G.; Lai, O.M. Distinguishing lard from other animal fats in admixtures of some vegetable oils using liquid chromatographic data coupled with multivariate data analysis. Food Chem. 2005, 91, 5–14. [Google Scholar] [CrossRef] [Green Version]
- Marikkar, J.M.N.; Ghazali, H.M.; Long, K.; Lai, O.M. Lard uptake and its detection in selected food products deep-fried in lard. Food Res. Int. 2003, 36, 1047–1060. [Google Scholar] [CrossRef]
- Saeed, T.; Ali, S.C.; Rahman, H.A.; Saway, W.N. Detection of pork and lard as adulterants in processed meat: Liquid chromatographic analysis of derivatized triglycerides. J. Assoc. Off. Anal. Chem. 1989, 72, 921–925. [Google Scholar] [PubMed]
- Farag, R.S.; Abo-raya, S.H.; Ahmed, F.A.; Hewedi, F.M.; Khalifa, H.H. Fractional crystallization and gas chromatographic analysis of fatty acids as a means of detecting butterfat adulteration. J. Am. Oil Chem. Soc. 1983, 60, 1665–1669. [Google Scholar] [CrossRef]
- Farag, R.S.; Ahmed, F.A.; Shihata, J.A.A.; Aboraya, S.H.; Abdalla, A.F. Use of unsaponifiable matter for detection of ghee adulteration with other fats. J. Am. Oil Chem. Soc. 1982, 59, 557–560. [Google Scholar] [CrossRef]
- Dugo, P.; Kumm, T.; Fazio, A.; Dugo, G.; Mondello, L. Determination of beef tallow in lard through a multidimensional off-line non-aqueous reversed phase-argentation LC method coupled to mass spectrometry. J. Sep. Sci. 2006, 29, 567–575. [Google Scholar] [CrossRef] [PubMed]
- Goudjil, H.; Fontecha, J.; Fraga, M.J.; Juarez, M. TAG composition of ewe’s milk fat, Detection of foreign fats. J. Am.Oil Chem. Soc. 2003, 80, 219–222. [Google Scholar] [CrossRef]
- Indrasti, D.; Che Man, Y.B.; Mustafa, S.; Hashim, D.M. Lard detection based on fatty acids profile using comprehensive gas chromatography hyphenated with time-of-flight mass spectrometry. Food Chem. 2010, 122, 1273–1277. [Google Scholar] [CrossRef]
- Chin, S.T.; Che Man, Y.B.; Tan, C.P.; Hashim, D.M. Rapid profiling of animal-derived fatty acids using fast GC 3 GC coupled to time-of-flight mass spectrometry. J. Am. Oil Chem. Soc. 2009, 86, 949–958. [Google Scholar] [CrossRef]
- Hoffmann, G. The Chemistry and Technology of Edible Oils and Fats and Their High Fat Products; Academic press INC: San Diego, CA, USA, 1989; pp. 1–384. [Google Scholar]
- Sionek, B.; Krygier, K.; Ukalski, K.; Ukalska, J.; Amarowicz, R. The influence of nitrogen and carbon dioxide on the oxidative stability of fully refined rapeseed oil. Eur. J. Lipid Sci. Technol. 2013, 115, 1426–1433. [Google Scholar] [CrossRef]
- Haryati, T.; Che Man, Y.B.; Ghazali, H.M.; Asbi, B.A.; Buana, L. Determination of iodine value of palm oil based on triglyceride composition. J. Am. Oil Chem. Soc. 1998, 75, 789–792. [Google Scholar] [CrossRef]
- Marina, A.M.; Che Man, Y.B.; Nazimah, S.A.H.; Amin, I. Monitoring adulteration of virgin coconut oil by selected vegetable oils using differential scanning calorimetry. J. Food Lipids 2009, 16, 50–61. [Google Scholar] [CrossRef]
- Tan, C.P.; Che Man, Y.B. Comparative differential scanning calorimetric analysis of vegetable oils: I. Effects of heating rate variation. Phytochem. Anal. 2002, 13, 129–141. [Google Scholar] [CrossRef] [PubMed]
- Shukla, V.K.L. Cocoa butter properties and quality. Lipid Technol. 1995, 7, 54–57. [Google Scholar]
- Kallio, H.; Yli-Jokipli, K.; Kurvinen, J.P.; Sjovall, O.; Tahvonen, R. Regioisomerism of triacylglycerols in lard, tallow, yolk, chicken skin, palm oil, palm olein, palm stearin, and transesterified blend of palm stearin and coconut oil analyzed by tandem mass spectrometry. J. Agric. Food Chem. 2001, 49, 3363–3369. [Google Scholar] [CrossRef] [PubMed]
- Nizar, N.N.A.; Marikkar, J.M.N.; Hashim, D.M. Differentiation of lard, chicken fat, beef fat and mutton fat by GCMS and EA-IRMS techniques. J. Oleo Sci. 2013, 62, 459–464. [Google Scholar] [CrossRef]
- Cheong, L.Z.; Hong, Z.; Lise, N.; Jensen, K.; Haagensen, J.A.; Xuebing, X. Physical and sensory characteristics of pork sausages from enzymatically modified blends of lard and rapeseed oil during storage. Meat Sci. 2010, 85, 691–699. [Google Scholar] [CrossRef] [PubMed]
- Nurjuliana, M.; Che Man, Y.B.; Hashim, D.M. Analysis of lard’s aroma by an electronic nose for rapid halal authentication. J. Am. Oil Chem. Soc. 2011, 88, 75–82. [Google Scholar] [CrossRef]
- Edwards, H.M.J.; Denman, F. Carcass composition studies. 2. Influence of breed, sex and diet on gross composition of the carcass and fatty acid composition of adipose tissue. Poult. Sci. 1975, 54, 1230–1238. [Google Scholar] [CrossRef] [PubMed]
- Yanty, N.A.M.; Marikkar, J.M.N.; Che Man, Y.B.; Long, K. Composition and thermal analysis of lard stearin and lard olein. J. Oleo Sci. 2011, 60, 333–338. [Google Scholar] [CrossRef] [PubMed]
- Fredrick, E.; Foubert, I.; Van De Sype, J.; Dewettinck, K. Influence of monoglycerides on the crystallization behavior of palm oil. Cryst. Growth Des. 2008, 8, 1833–1839. [Google Scholar] [CrossRef]
- Che Man, Y.B.; Hariyati, T.; Ghazali, H.M.; Asbi, B.A. Compositional and thermal profile of crude palm oil and its products. J. Am. Oil Chem. Soc. 1999, 76, 237–242. [Google Scholar] [CrossRef]
- Chiavaro, E.; Vettadini, E.; Estrada, M.T.R.; Cerretani, L.; Bendini, A. Differential scanning calorimeter application to the detectionof refined hazelnut oil in extra virgin olive oil. Food Chem. 2008, 110, 248–256. [Google Scholar] [CrossRef] [PubMed]
- Dahimi, O.; Rahim, A.A.; Abdulkarim, S.M.; Hassan, M.S.; Hashari, S.B.; Mashitoh, A.S. Multivariate statistical analysis treatment of DSC thermal properties for animal fat adulteration. Food Chem. 2014, 158, 132–138. [Google Scholar] [CrossRef] [PubMed]
- Jacobsberg, B.; Ho, O.C. Studies in palm crystallization. J. Am. Oil Chem. Soc. 1976, 53, 609–617. [Google Scholar] [CrossRef]
- Fasina, O.O.; Craig-Schmidt, M.; Colley, Z.; Hallman, H. Predicting melting characteristics of vegetable oils from fatty acid composition. LWT Food Sci. Technol. 2008, 41, 1501–1505. [Google Scholar] [CrossRef]


| Issues in Food Sample | Method of Detection | References |
|---|---|---|
| DNA-based PCR method | ||
| Pork and lard in food products | cyt b PCR-RFLP | [4] |
| Lard in food products (sausages and casings, bread and biscuits) | cyt b PCR-RFLP | [5] |
| Lard detection in chocolate | Porcine-specific real-time PCR | [6] |
| Fourier transform infrared spectroscopy | ||
| Lard mixed with other animal fats | FTIR with PLS | [7] |
| Lard mixed with animal fats | FTIR with PLS | [8] |
| Lard in cake formulation | FTIR with PLS | [9] |
| Lard in chocolate and chocolate products | FTIR with PLS | [2] |
| Lard in biscuit | FTIR with PLS | [10] |
| Lard mixed with lamb, cow and chicken body fats | FTIR with PLS and DA | [11] |
| Lard mixed with cod liver oil | FTIR with PLS and DA | [12] |
| Lard in other animal fats | FTIR with PLS and DA | [11] |
| Lard in virgin coconut oil (VCO) | FTIR with PLS and DA | [13] |
| Lard in vegetable oils | FTIR with PLS, PCR and DA | [14] |
| Lard in edible fats and oil | FTIR with PCA and CA | [15] |
| Lard in cream cosmetics | FTIR with PLS and PCR | [16] |
| Lard in frying oil | FTIR with PLS and DA | [17] |
| Lard in chocolate | FTIR with PLS and PCA | [18] |
| Lard in ink extracted from printed food packaging | FTIR with PCA and SIMCA | [19] |
| Electronic nose technology | ||
| Lard in edible oil | E-nose | [20] |
| Differential scanning calorimetry | ||
| Lard and randomized lard in RBD palm oil | DSC | [21] |
| Monitoring lard in canola oil | DSC | [22] |
| Lard adulteration | DSC | [22] |
| Lard in cooking oil | DSC | [23] |
| Lard in sunflower oil | DSC | [24] |
| Lard in canola oil | DSC | [25] |
| Lard in virgin coconut oil | DSC | [13] |
| Lard in butter | DSC | [26] |
| Chromatographic-based techniques | ||
| Lard in meat products | HPLC | [27] |
| Lard in meat lipids | HPLC | [28] |
| Lard in animal fats and vegetable oils | HPLC | [28] |
| Lard in fried oils | HPLC | [29] |
| Lard in meat lipids | GLC (FID detector) | [30] |
| Lard in milk lipids | GLC (FID detector) | [31] |
| Lard in milk lipids | GLC (FID detector) | [32] |
| Lard in fried oils | GLC (FID detector) | [29] |
| Lard in animal fats | LC-MS | [33] |
| Lard in animal fats | GC-FID | [31] |
| Lard in vegetable oils | GC-FID | [28] |
| Lard in milk fat | GC | [34] |
| Lard in vegetable oils | GC (FID detector) | [28] |
| Lard in animal fats | GC×GC–TOF-MS | [35] |
| Lard in animal fats | GC×GC–TOF-MS | [36] |
| TAGs | Lard Concentration (%) | ||||||||||
|---|---|---|---|---|---|---|---|---|---|---|---|
| 0 (CB) | 1 | 3 | 5 | 10 | 15 | 20 | 25 | 30 | 100 (LD) | ||
| Unsaturated | |||||||||||
| Tri-unsaturated | LLLn | nd < 0.04 | 0.04 (0.00) f | 0.05 (0.00) e,f | 0.05 (0.00) e,f | 0.06 (0.00) e | 0.07 (0.00) d | 0.11 (0.00) c | 0.35 (0.00) b | 0.36 (0.01) a | 0.88 (0.00) g |
| LLL | nd < 0.04 | 0.05 (0.00) h | 0.06 (0.00) g | 0.10 (0.00) f | 0.11 (0.00) e | 0.13 (0.00) d | 0.13 (0.00) c | 0.15 (0.00) b | 0.17 (0.00) a | 1.24 (0.01) h | |
| OLL | nd < 0.04 | 0.05 (0.00) h | 0.08 (0.00) g | 0.15 (0.00) f | 0.25 (0.00) e | 0.35 (0.00) d | 0.51 (0.00) c | 0.52 (0.00) b | 0.85 (0.01) a | 2.94 (0.01) i | |
| OOL | nd < 0.04 | 0.19 (0.00) h | 0.21 (0.01) g | 0.37 (0.00) f | 0.45 (0.00) e | 0.58 (0.00) d | 0.87 (0.00) c | 1.17 (0.00) b | 1.29 (0.00) a | 4.38 (0.01) i | |
| OOO | 0.24 (0.00) h | 0.30 (0.00) g | 0.32 (0.00) g | 0.35 (0.01) f | 0.42 (0.00) e | 0.58 (0.00) d | 0.73 (0.00) c | 0.93 (0.00) b | 0.98 (0.00) a | 2.28 (0.01) i | |
| Sub total | 0.24 (0.11) | 0.63 (0.12) | 0.72 (0.12) | 1.02 (0.15) | 1.29 (0.18) | 1.71 (0.24) | 2.35 (0.34) | 3.12 (0.42) | 3.65 (0.46) | 11.72 (1.40) | |
| Di-unsaturated | PLL | 0.22 (0.01) g | 0.10 (0.00) i | 0.16 (0.00) h | 0.35 (0.00) f | 0.69 (0.00) e | 1.01 (0.00) d | 1.68 (0.01) c | 2.19 (0.01) b | 2.57 (0.02) a | 7.36 (0.08) j |
| POL | 0.66 (0.00) i | 1.28 (0.00) h | 1.49 (0.00) g | 1.69 (0.00) f | 2.39 (0.01) e | 4.00 (0.00) d | 4.29 (0.01) c | 5.68 (0.01) b | 6.18 (0.00) a | 20.21 (0.01) j | |
| POO | 3.12 (0.01) i | 3.30 (0.00) h | 3.43 (0.01) g | 3.65 (0.01) f | 4.08 (0.01) e | 4.76 (0.01) d | 5.75 (0.01) c | 6.98 (0.01) b | 7.13 (0.03) a | 17.25 (0.01) j | |
| SOO | 3.46 (0.05) a | 3.40 (0.00) a | 3.32 (0.00) b | 3.21 (0.01) c | 3.19 (0.01) c | 3.14 (0.00) c,d | 3.11 (0.00)d,e | 3.09 (0.01)d,e | 3.05 (0.03) e | 3.21 (0.00) c | |
| Sub total | 7.46 (1.66) | 8.08 (1.61) | 8.40 (1.57) | 8.90 (1.51) | 10.35 (1.44) | 12.91 (1.62) | 14.83 (1.73) | 17.94 (2.23) | 18.93 (2.26) | 48.03 (8.04) | |
| Total unsaturated | 7.70 (5.11) | 8.71 (5.27) | 9.12 (5.43) | 9.92 (5.57) | 11.64 (6.41) | 14.62 (7.92) | 17.18 (8.82) | 21.06 (10.48) | 22.58 (10.80) | 59.75 (25.68) | |
| Saturated | |||||||||||
| Di-saturated | POP | 19.13 (0.02) a | 18.77 (0.01) b | 18.64 (0.00) c | 18.56 (0.01) d | 18.47 (0.01) e | 18.31 (0.01) f | 18.01 (0.00) g | 17.64 (0.01) h | 17.29 (0.01) i | 3.21 (0.00) j |
| PPL | 1.28 (0.00) g | 1.76 (0.00) f | 1.80 (0.01) f | 1.81 (0.01) f | 1.93 (0.02) e | 2.02 (0.00) d | 2.13 (0.04) c | 2.30 (0.00) b | 2.39 (0.01) a | 4.35 (0.00) h | |
| POS | 41.67 (0.01) a | 41.21 (0.01) b | 40.90 (0.01) c | 40.32 (0.01) d | 39.41 (0.01) e | 37.79 (0.01) f | 36.57 (0.04) g | 34.91 (0.01) h | 34.01 (0.01) i | 18.58 (0.01) j | |
| SOS | 28.47 (0.02) a | 27.67 (0.01) b | 27.55 (0.01) c | 27.37 (0.01) d | 26.51 (0.00) e | 25.15 (0.01) f | 23.87 (0.01) g | 21.71 (0.02) h | 20.96 (0.01) i | 1.32 (0.00) j | |
| Sub total | 90.55 (16.98) | 89.41 (16.54) | 88.89 (16.40) | 88.06 (16.17) | 86.32 (15.68) | 83.27 (14.90) | 80.58 (14.29) | 76.56 (13.43) | 74.65 (13.01) | 27.46 (7.91) | |
| Tri-saturated | PPS | 0.27 (0.00) i | 0.32 (0.00) h | 0.40 (0.00) g | 0.46 (0.00) f | 0.51 (0.00) e | 0.58 (0.00) d | 0.68 (0.00) c | 0.74 (0.00) b | 1.09 (0.00) a | 1.99 (0.00) j |
| SSS | 0.31 (0.00) i | 0.41 (0.01) h | 0.48 (0.00) g | 0.50 (0.00) f | 0.52 (0.00) e | 0.59 (0.00) d | 0.67 (0.00) c | 0.87 (0.00) b | 0.99 (0.00) a | 2.89 (0.01) j | |
| PSS | 1.17 (0.01) a | 1.15 (0.00) b | 1.11 (0.01) c | 1.06 (0.00) d | 1.01 (0.00) e | 0.93 (0.00) f | 0.90 (0.00) g | 0.79 (0.00) h | 0.69 (0.00) i | nd <0.04 | |
| Sub total | 1.75 (0.51) | 1.88 (0.46) | 1.99 (0.39) | 2.02 (0.34) | 2.04 (0.29) | 2.10 (0.20) | 2.25 (0.13) | 2.40 (0.07) | 2.77 (0.21) | 4.88 (1.46) | |
| Total saturated | 92.30 (62.79) | 91.29 (61.89) | 90.88 (61.45) | 90.08 (60.84) | 88.36 (59.59) | 88.36 (59.59) | 82.83 (55.39) | 78.96 (52.44) | 77.42 (50.83) | 32.34 (15.97) | |
| FAs | Lard Concentration (%) | |||||||||
|---|---|---|---|---|---|---|---|---|---|---|
| 0 (CB) | 1 | 3 | 5 | 10 | 15 | 20 | 25 | 30 | 100 (LD) | |
| C10:0 | 0 | 0 | 0 | 0 | 0.01 (0.01) c | 0.02 (0.03) b,c | 0.06 (0.00) a,b | 0.06 (0.00) a,b | 0.08 (0.01) a | 0.17 (0.00) d |
| C12:0 | 0 | 0.12 (0.00) e | 0.14 (0.01) d,e | 0.16 (0.00) d,e | 0.21 (0.00) c,d | 0.28 (0.01) c | 0.36 (0.06) b | 0.40 (0.00) a,b | 0.47 (0.01) a | 1.44 (0.00) f |
| C15:0 | 0 | 0 | 0 | 0 | 0 | 0 | 0 | 0 | 0 | 0.09 (0.00) b |
| C16:0 | 27.27 (0.07) a | 26.63 (0.08) b | 26.40 (0.00) c | 26.32 (0.02) c | 26.11 (0.07) d | 25.98 (0.04) d | 25.55 (0.03) e | 25.43 (0.02) e | 24.75 (0.04) f | 22.55 (0.00) g |
| C16:1 | 0 | 0.25 (0.00) e | 0.26 (0.00) e | 0.28 (0.01) d,e | 0.30 (0.00) d | 0.36 (0.02) c | 0.40 (0.01) b | 0.42 (0.01) a,b | 0.44 (0.01) a | 1.22 (0.00) f |
| C17:0 | 0 | 0.24 (0.00) e | 0.25 (0.01) e | 0.25 (0.00) d,e | 0.26 (0.00) d | 0.26 (0.00) d | 0.29 (0.00) c | 0.31 (0.01) b | 0.32 (0.00) a | 0.58 (0.00) f |
| C18:0 | 37.75 (0.05) a | 37.45 (0.28) a,b | 37.09 (0.01) b,c | 36.74 (0.01) c | 36.03 (0.01) d | 35.24 (0.13) e | 34.10 (0.04) f | 33.66 (0.01) g | 32.75 (0.00) h | 0.36 (0.00) i |
| C18:1 | 30.92 (0.06) e | 31.03 (0.21) e | 31.37 (0.00) d | 31.51 (0.00) c,d | 31.73 (0.07) b,c | 31.86 (0.00) a,b | 31.87 (0.01) a,b | 31.92 (0.02) a,b | 32.13 (0.01) a | 19.29 (0.09) f |
| C18:2 | 2.82 (0.03) h | 2.88 (0.00) h | 3.10 (0.00) g | 3.36 (0.00) f | 3.96 (0.00) e | 4.67 (0.03) d | 6.04 (0.04) c | 6.48 (0.00) b | 7.83 (0.00) a | 32.41 (0.08) i |
| C18:3 | 0 | 0.19 (0.00) e | 0.20 (0.00) d,e | 0.20 (0.00) d,e | 0.24 (0.00) c,d | 0.26 (0.01) c | 0.32 (0.03) b | 0.35 (0.00) a,b | 0.39 (0.01) a | 1.09 (0.00) f |
| C20:0 | 1.25 (0.01) a | 1.22 (0.01) a,b | 1.21 (0.01) a,b | 1.19 (0.00) a,b | 1.16 (0.00) b | 1.09 (0.04) c | 1.03 (0.01) d | 1.00 (0.00) d | 0.86 (0.00) e | 0.82 (0.00) e |
| Total SFA | 66.27 (18.79) | 65.66 (17.68) | 65.09 (17.51) | 64.66 (17.38) | 63.78 (16.15) | 62.87 (15.87) | 61.39 (15.42) | 60.86 (15.26) | 59.23 (14.84) | 44.94 (9.96) |
| Total USFA | 33.74 (19.87) | 34.35 (15.01) | 34.93 (15.15) | 35.35 (15.19) | 36.23 (15.21) | 37.15 (15.19) | 38.63 (15.05) | 39.17 (15.03) | 40.79 (15.03) | 53.86 (15.23) |
| Adulterated Samples (%) | Cooling Properties | Heating Properties | ||||||
|---|---|---|---|---|---|---|---|---|
| Onset (°C) | Offset (°C) | Enthalphy (J/g) | Peak (°C) | Onset (°C) | Offset (°C) | Enthalphy (J/g) | Peak (°C) | |
| 0 (CB) | 16.94 | 9.49 | −85.60 | 14.58 | 14.19 | 23.38 | 86.81 | 20.16 |
| 1 | 16.83 | 9.37 | −85.41 | 14.41 | 13.78 | 23.36 | 84.53 | 20.11 |
| 3 | 16.71 | 9.18 | −84.53 | 14.38 | 13.60 | 23.34 | 78.87 | 20.09 |
| 5 | 16.64 | 9.09 | −83.55 | 14.27 | 13.53 | 23.21 | 77.04 | 20.06 |
| 10 | 16.55 | 8.47 | −82.98 | 14.08 | 13.50 | 23.01 | 76.41 | 19.83 |
| 15 | 16.42 | 7.77 | −82.31 | 14.05 | 13.48 | 22.33 | 75.01 | 19.43 |
| 20 | 16.26 | 6.65 | −80.64 | 13.62 | 13.45 | 22.26 | 74.65 | 18.85 |
| 25 | 15.97 | 5.73 | −79.70 | 13.30 | 13.40 | 21.95 | 74.15 | 18.10 |
| 30 | 15.70 | 5.08 | −78.67 | 13.12 | 13.37 | 21.64 | 72.63 | 17.78 |
| 100 (LD) | −15.00 | −22.16 | −32.51 | 11.98 | −10.30 | 2.38 | 29.86 | −4.00 |
© 2017 by the authors. Licensee MDPI, Basel, Switzerland. This article is an open access article distributed under the terms and conditions of the Creative Commons Attribution (CC BY) license (http://creativecommons.org/licenses/by/4.0/).
Share and Cite
Azir, M.; Abbasiliasi, S.; Tengku Ibrahim, T.A.; Manaf, Y.N.A.; Sazili, A.Q.; Mustafa, S. Detection of Lard in Cocoa Butter—Its Fatty Acid Composition, Triacylglycerol Profiles, and Thermal Characteristics. Foods 2017, 6, 98. https://doi.org/10.3390/foods6110098
Azir M, Abbasiliasi S, Tengku Ibrahim TA, Manaf YNA, Sazili AQ, Mustafa S. Detection of Lard in Cocoa Butter—Its Fatty Acid Composition, Triacylglycerol Profiles, and Thermal Characteristics. Foods. 2017; 6(11):98. https://doi.org/10.3390/foods6110098
Chicago/Turabian StyleAzir, Marliana, Sahar Abbasiliasi, Tengku Azmi Tengku Ibrahim, Yanty Noorzianna Abdul Manaf, Awis Qurni Sazili, and Shuhaimi Mustafa. 2017. "Detection of Lard in Cocoa Butter—Its Fatty Acid Composition, Triacylglycerol Profiles, and Thermal Characteristics" Foods 6, no. 11: 98. https://doi.org/10.3390/foods6110098