Article

Comprehensive and Comparative Metabolomic Profiling of Wheat, Barley, Oat and Rye Using Gas Chromatography-Mass Spectrometry and Advanced Chemometrics

by
Bekzod Khakimov
*,
Birthe Møller Jespersen
and
Søren Balling Engelsen
Department of Food Science, Faculty of Science, University of Copenhagen, Rolighedsvej 30, Frederiksberg C, 1958 Copenhagen, Denmark
*
Author to whom correspondence should be addressed.
Foods 2014, 3(4), 569-585; https://doi.org/10.3390/foods3040569
Submission received: 11 May 2014 / Revised: 20 August 2014 / Accepted: 13 October 2014 / Published: 31 October 2014
(This article belongs to the Special Issue Foodomics 2013)

Abstract

:
Beyond the main bulk components of cereals such as the polysaccharides and proteins, lower concentration secondary metabolites largely contribute to the nutritional value. This paper outlines a comprehensive protocol for GC-MS metabolomic profiling of phenolics and organic acids in grains, the performance of which is demonstrated through a comparison of the metabolite profiles of the main northern European cereal crops: wheat, barley, oat and rye. Phenolics and organic acids were extracted using acidic hydrolysis, trimethylsilylated using a new method based on trimethylsilyl cyanide and analyzed by GC-MS. In order to extract pure metabolite peaks, the raw chromatographic data were processed by a multi-way decomposition method, Parallel Factor Analysis 2. This approach lead to the semi-quantitative detection of a total of 247 analytes, out of which 89 were identified based on RI and EI-MS library match. The cereal metabolome included 32 phenolics, 30 organic acids, 10 fatty acids, 11 carbohydrates and 6 sterols. The metabolome of the four cereals were compared in detail, including low concentration phenolics and organic acids. Rye and oat displayed higher total concentration of phenolic acids, but ferulic, caffeic and sinapinic acids and their esters were found to be the main phenolics in all four cereals. Compared to the previously reported methods, the outlined protocol provided an efficient and high throughput analysis of the cereal metabolome and the acidic hydrolysis improved the detection of conjugated phenolics.

1. Introduction

Cereals such as wheat, barley, rye and oat are amongst the mostly grown agricultural food products worldwide and the most important cereal crops for human consumption in northern Europe. The detailed chemical and functional composition of these crops is defining their use for food and feed as well as their prices. Cereals are the most important study objects in foodomics studies seeking to optimize their health beneficial factors and/or reducing deleterious metabolites. While the gross chemical composition, such as carbohydrates, proteins, dietary fibers and micronutrient contents, are important characteristics of cereal products, recent studies showed that relatively low concentration secondary metabolites such as antioxidant phenolics, organic acids and phytosterols have a significant influence on the health and nutritional values of cereals [1,2]. The beneficial health effects associated with the consumption of cereals have been attributed to dietary fiber content [3] as well as phenolics that possess antioxidant, radical scavenging and cholesterol lowering properties [4,5,6,7]. Whole grain barley intake has proven to decrease the low-density lipoprotein (LDL) cholesterol in an intervention study involving hypercholesterolemic patients [8]. Moreover, phenolic acids were found to be important texturizing agents in cooking-extrusion of cereals [9] and recognized as the main antioxidant constituents of cereals [10].
Quantitative and qualitative analysis of both, secondary and primary metabolites (with molecular weight of up to 1500 Da) of grains are studied within cereal metabolomics. Cereal metabolomics offers an insight into the metabolic fluctuations of cereal cultivars that may reveal effects of genetic modifications as well as of biotic and abiotic stresses [11]. Recent studies have illustrated the power of cereal metabolomics to reveal effects of growth temperature [12], salt stress [13], drought stress [14], and biotic stress [15]. Cereal metabolomics is also a promising approach to reveal biochemical and genetic backgrounds of quality traits and may open new possibilities towards targeted breeding [16,17].
Comprehensive metabolomic profiling of cereals requires a reliable protocol that enables extraction of maximum metabolic information in a high-throughput and reproducible manner. Metabolomics studies performed for uncovering single and/or multiple internal and/or external effects on cereals aim to cover as broad range of metabolites as possible. However, due to the great physico-chemical diversity of cereal metabolites, it is in practice impossible to cover the whole cereal metabolome using a single protocol. The phytochemical composition, including phenolics of wheat [18,19,20], barley [21], oat [22] and rye [23] have been investigated in a number of studies within the HEALTHGRAIN diversity-screening program [24].
This study demonstrates the development of comprehensive GC-MS metabolomics protocol for profiling a broad range of phenolics and organic acids from whole grain flour samples, and applied on wheat, barley, rye and oat. Phenolics of cereals are primarily present in conjugated and bonded forms with carbohydrates, lipids and other cell membrane components that alter their solubility and thus bioavailability [21]. Analysis of phenolic content of cereals is mainly performed by basic hydrolysis of cereal extracts [18], which can only cleave ester bonds and stabilize de-esterification reactions. However, a substantial part of phenolics and other organic acids of cereals are conjugated through glycosidic and/or ether bonds to carbohydrates and other molecules. In contrast to basic hydrolysis, acidic hydrolysis allows the cleavage of not only ester bonds, but also glycosidic and ether bonds at an elevated temperature. The advantages of this approach have been demonstrated in polyphenol analysis of the wheat and rice grains [25,26].
In this study, a standardized, high-throughput and unbiased protocol was developed for GC-MS metabolomic profiling of free and conjugated phenolics and organic acids of whole-grain cereals using hydrochloric acid based hydrolysis followed by trimethylsilyl derivatization. The study demonstrates the first application of a novel trimethylsilylation method based on trimethylsilyl cyanide (TMSCN) for derivatization of cereal metabolites. When compared to other frequently used derivatization methods, the new protocol provides a more unbiased and broad-spectrum derivatization of metabolites and is able to provide reproducible metabolomics profiles of complex biological samples [27]. The obtained raw GC-MS data of cereals were processed by a semi-automated multi-way decomposition method, PARAFAC2 [28]. The PARAFAC2 processing of the raw GC-MS data lead to unambiguous deconvolution of elusive peaks such as, overlapped, retention time shifted and low s/n peaks and enable an automatic estimation of relative concentrations of detected peaks [29,30]. Metabolite extraction and GC-MS analysis of the cereal samples were performed within a bigger study, which involved a larger set of barley samples (manuscript in preparation). The main aim of this study was to demonstrate the performance of the protocol, using new technologies within metabolomics, and to show first results of a comparative application to the four major north European cereals: wheat, barley, rye and oat. To the best of our knowledge, this is the first study illustrating a comprehensive GC-MS profiling of phenolics and organic acids of cereals using exactly the same protocol across different cereals.

2. Experimental Section

Whole grain samples of wheat (Tr. aestivum, variety Bussard), barley (H. vulgare, variety Bomi), rye (S. cereal, variety Petkus) and oat (A. sativa, variety Sang) were purchased in Sepetember 2012 from the Danish bread cereal producing company Aurion (Hjørring, Denmark). All four cereals were grown under biodynamical conditions in Jutland during the season 2011/12.

2.1. Metabolite Extraction and Sample Derivatization

Cereal metabolites were extracted from 50 mg of milled grains that were soaked into 600 μL 85% methanol and vortexed for 20 s at 3000 rpm followed by 20 min incubation at 30 °C using a Thermomixer (Model 5436, Eppendorf, Hamburg, Germany) at 1400 rpm. After 3 min of centrifugation at 16,000× g, the supernatant was transferred to a fresh 2 mL Eppendorf tube (Hamburg, Germany) and the remaining flour sample was extracted a second time using the same extraction procedure. Then, the combined extracts were completely dried under nitrogen gas flow at 40 °C and hydrolyzed by using 240 µL of 6 M hydrochloric acid at 96 °C for 1 h by stirring at 1400 rpm. The hydrolyzed extracts were transferred into a fresh 2 mL glass vials and phenolics and organic acids were extracted into diethyl ether. Ether-based extraction of phenolics and organic acids was performed twice, by addition of 800 μL diethyl ether and vortexing for 25 s. The obtained ether fractions were completely dried using nitrogen gas flow and re-solubilized in 200 μL 100% methanol. Aliquots, 90 microliter, of the final extracts were transferred into 200 µL glass inserts and completely dried under nitrogen gas flow, sealed and stored at −20 °C until GC-MS analysis. Each sample was spiked with an internal standard (IS) (5 μL of 0.2 mg mL−1 solution of ribitol). In order to avoid any moisture, the samples stored in the freezer were dried under reduced pressure before derivatization. Sample derivatization and injection were fully automated by using a Multi-Purpose Sampler (MPS, GERSTEL, Mülheim, Germany) with DualRait WorkStation integrated to a GC-MS system from Agilent (CA, USA). Each sample was individually derivatized by addition of 40 µL trimethylsilyl cyanide (TMSCN) and incubated for 40 min at 40 °C. Two replicate samples per cereal were analyzed in randomized order and the MPS autosampler allowed a sequential derivatization of all samples in the same manner by keeping the derivatization time constant, throughout the analysis.

2.2. GC-MS Data Acquisition

The GC-MS consisted of an Agilent 7890A GC and an Agilent 5975C series MSD. GC separation was performed on a Phenomenex ZB 5MSi column (30 m × 250 μm × 0.25 μm). A derivatized sample volume of 1 µL was injected into a cooled injection system (CIS port) using Solvent Vent mode at the vent pressure of 7 kPa until 0.3 min after injection at the vent flow of 100 mL min−1. Detailed information on CIS and MPS parameters are described in Khakimov et al. 2013 [27]. Hydrogen was used as carrier gas, at a constant flow rate of 1.2 mL min−1, and the initial temperature of CIS was set to 120 °C for 0.3 min followed by heating at 5 °C s−1 until reaching 320 °C and then held for 10 min. The GC oven program was as follows: initial temperature 40 °C, equilibration time 3.0 min, heating rate 12.0 °C min−1, end temperature 300 °C, hold time 8.0 min and post run time 5 min at 40 °C. Mass spectra were recorded in the range of 50–500 m/z with a scanning frequency of 3.2 scans s−1, and the MS detector was switched off during the 8.5 min of solvent delay time and after 25.5 min of the run time. The transfer line, ion source and quadrupole temperatures were set to 290, 230 and 150 °C, respectively. The mass spectrometer was tuned according to manufacturer’s recommendation by using perfluorotributylamine (PFTBA).

2.3. Data Analysis

Initial analysis and visualization of the GC-MS data was performed using ChemStation software (Agilent, Germany). Retention indices of detected metabolites were calculated using the Van den Dool and Kratz equation and retention times of C10-C40 alkanes that were analyzed using the same GC-MS protocol [31]. The raw GC-MS data was imported from netCDF format to .mat files into Matlab® ver. R2012b (8.0.0.783) and data was manually divided into 121 smaller baseline separated intervals in retention time dimension. Each interval was modeled separately by PARAFAC2 as described previously [30]. PARAFAC2 modeled the three-way raw GC-MS data (elution time × mass spectra × samples) without any prior data pre-processing. The PARAFAC2 model outcomes: the elution profiles, which represent the TIC in the raw data, and spectral profiles, which represent the experimental EI-MS of deconvoluted peaks, were used for metabolite identification. The PARAFAC2 resolved mass spectrum of each peak was extracted and compared against NIST05 library (NIST, USA), Golm Metabolite Database [32]. Finally, PARAFAC2 concentration profiles, which represented relative concentrations of detected peaks were extracted and normalized according to the peak area of the internal standard (ribitol). The obtained metabolite table was used for exploring variations of phenolics in cereals and for principal component analysis (PCA) [33] after autoscaling of the data.

3. Results and Discussion

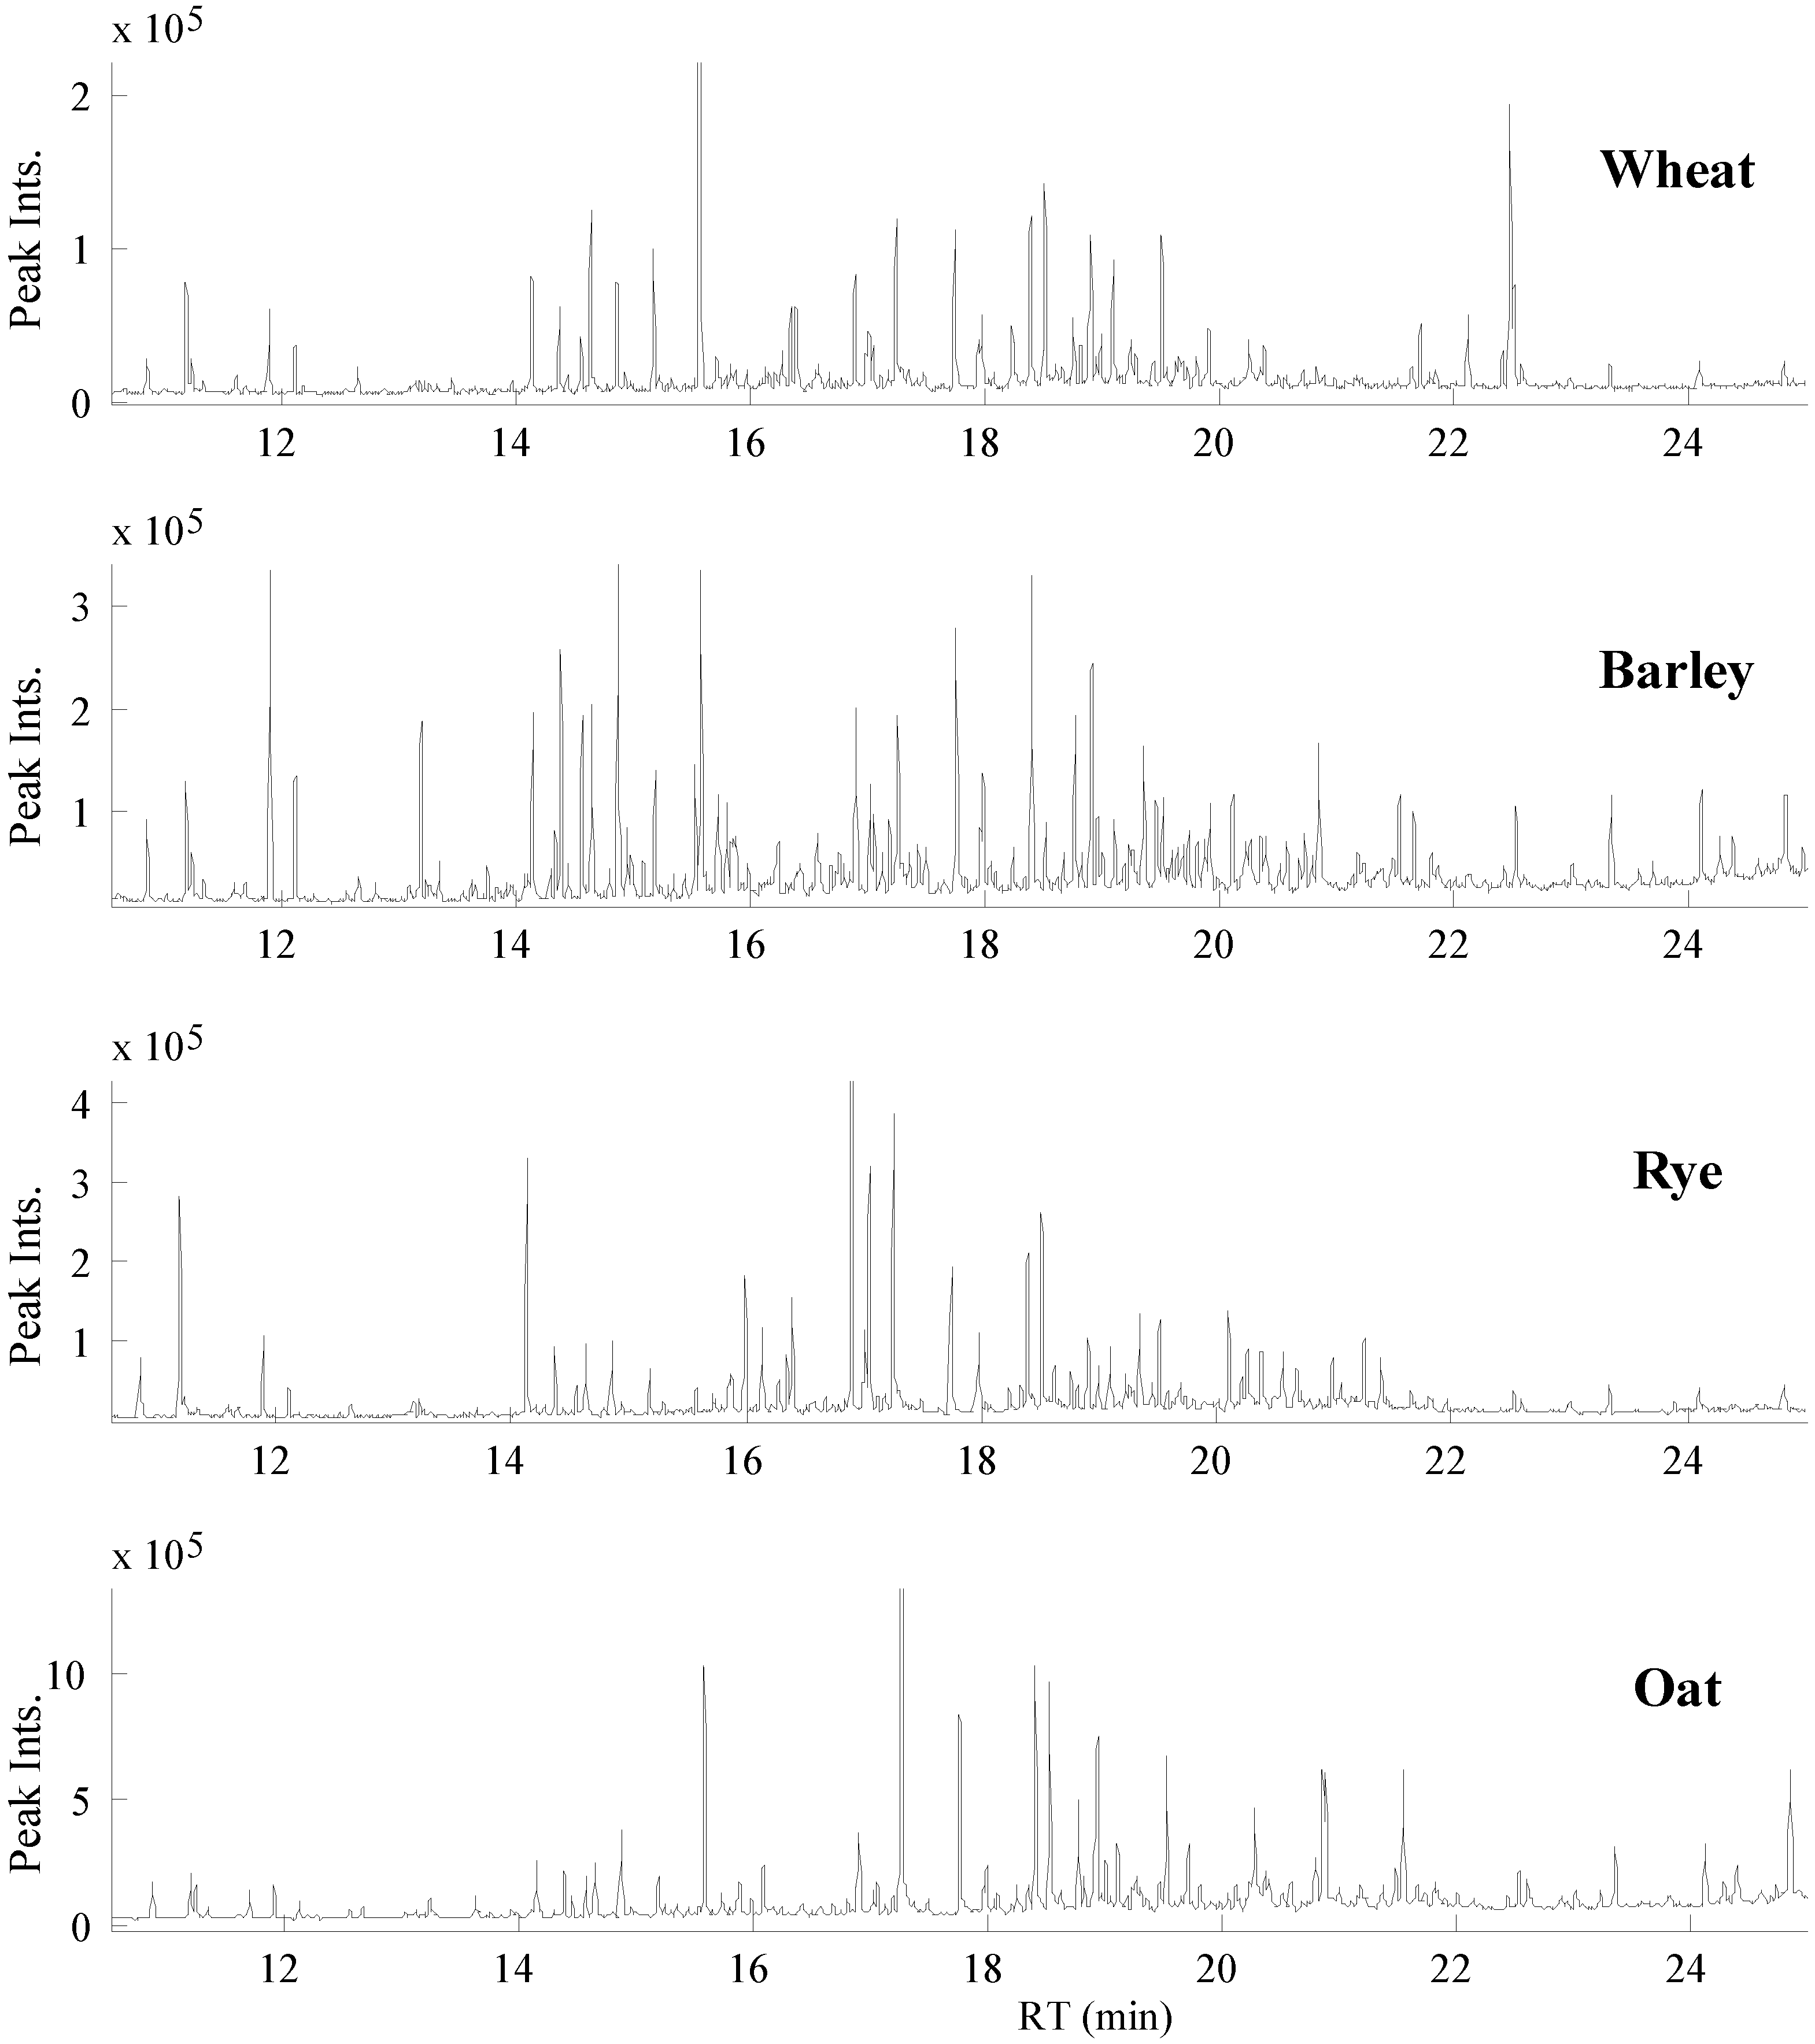
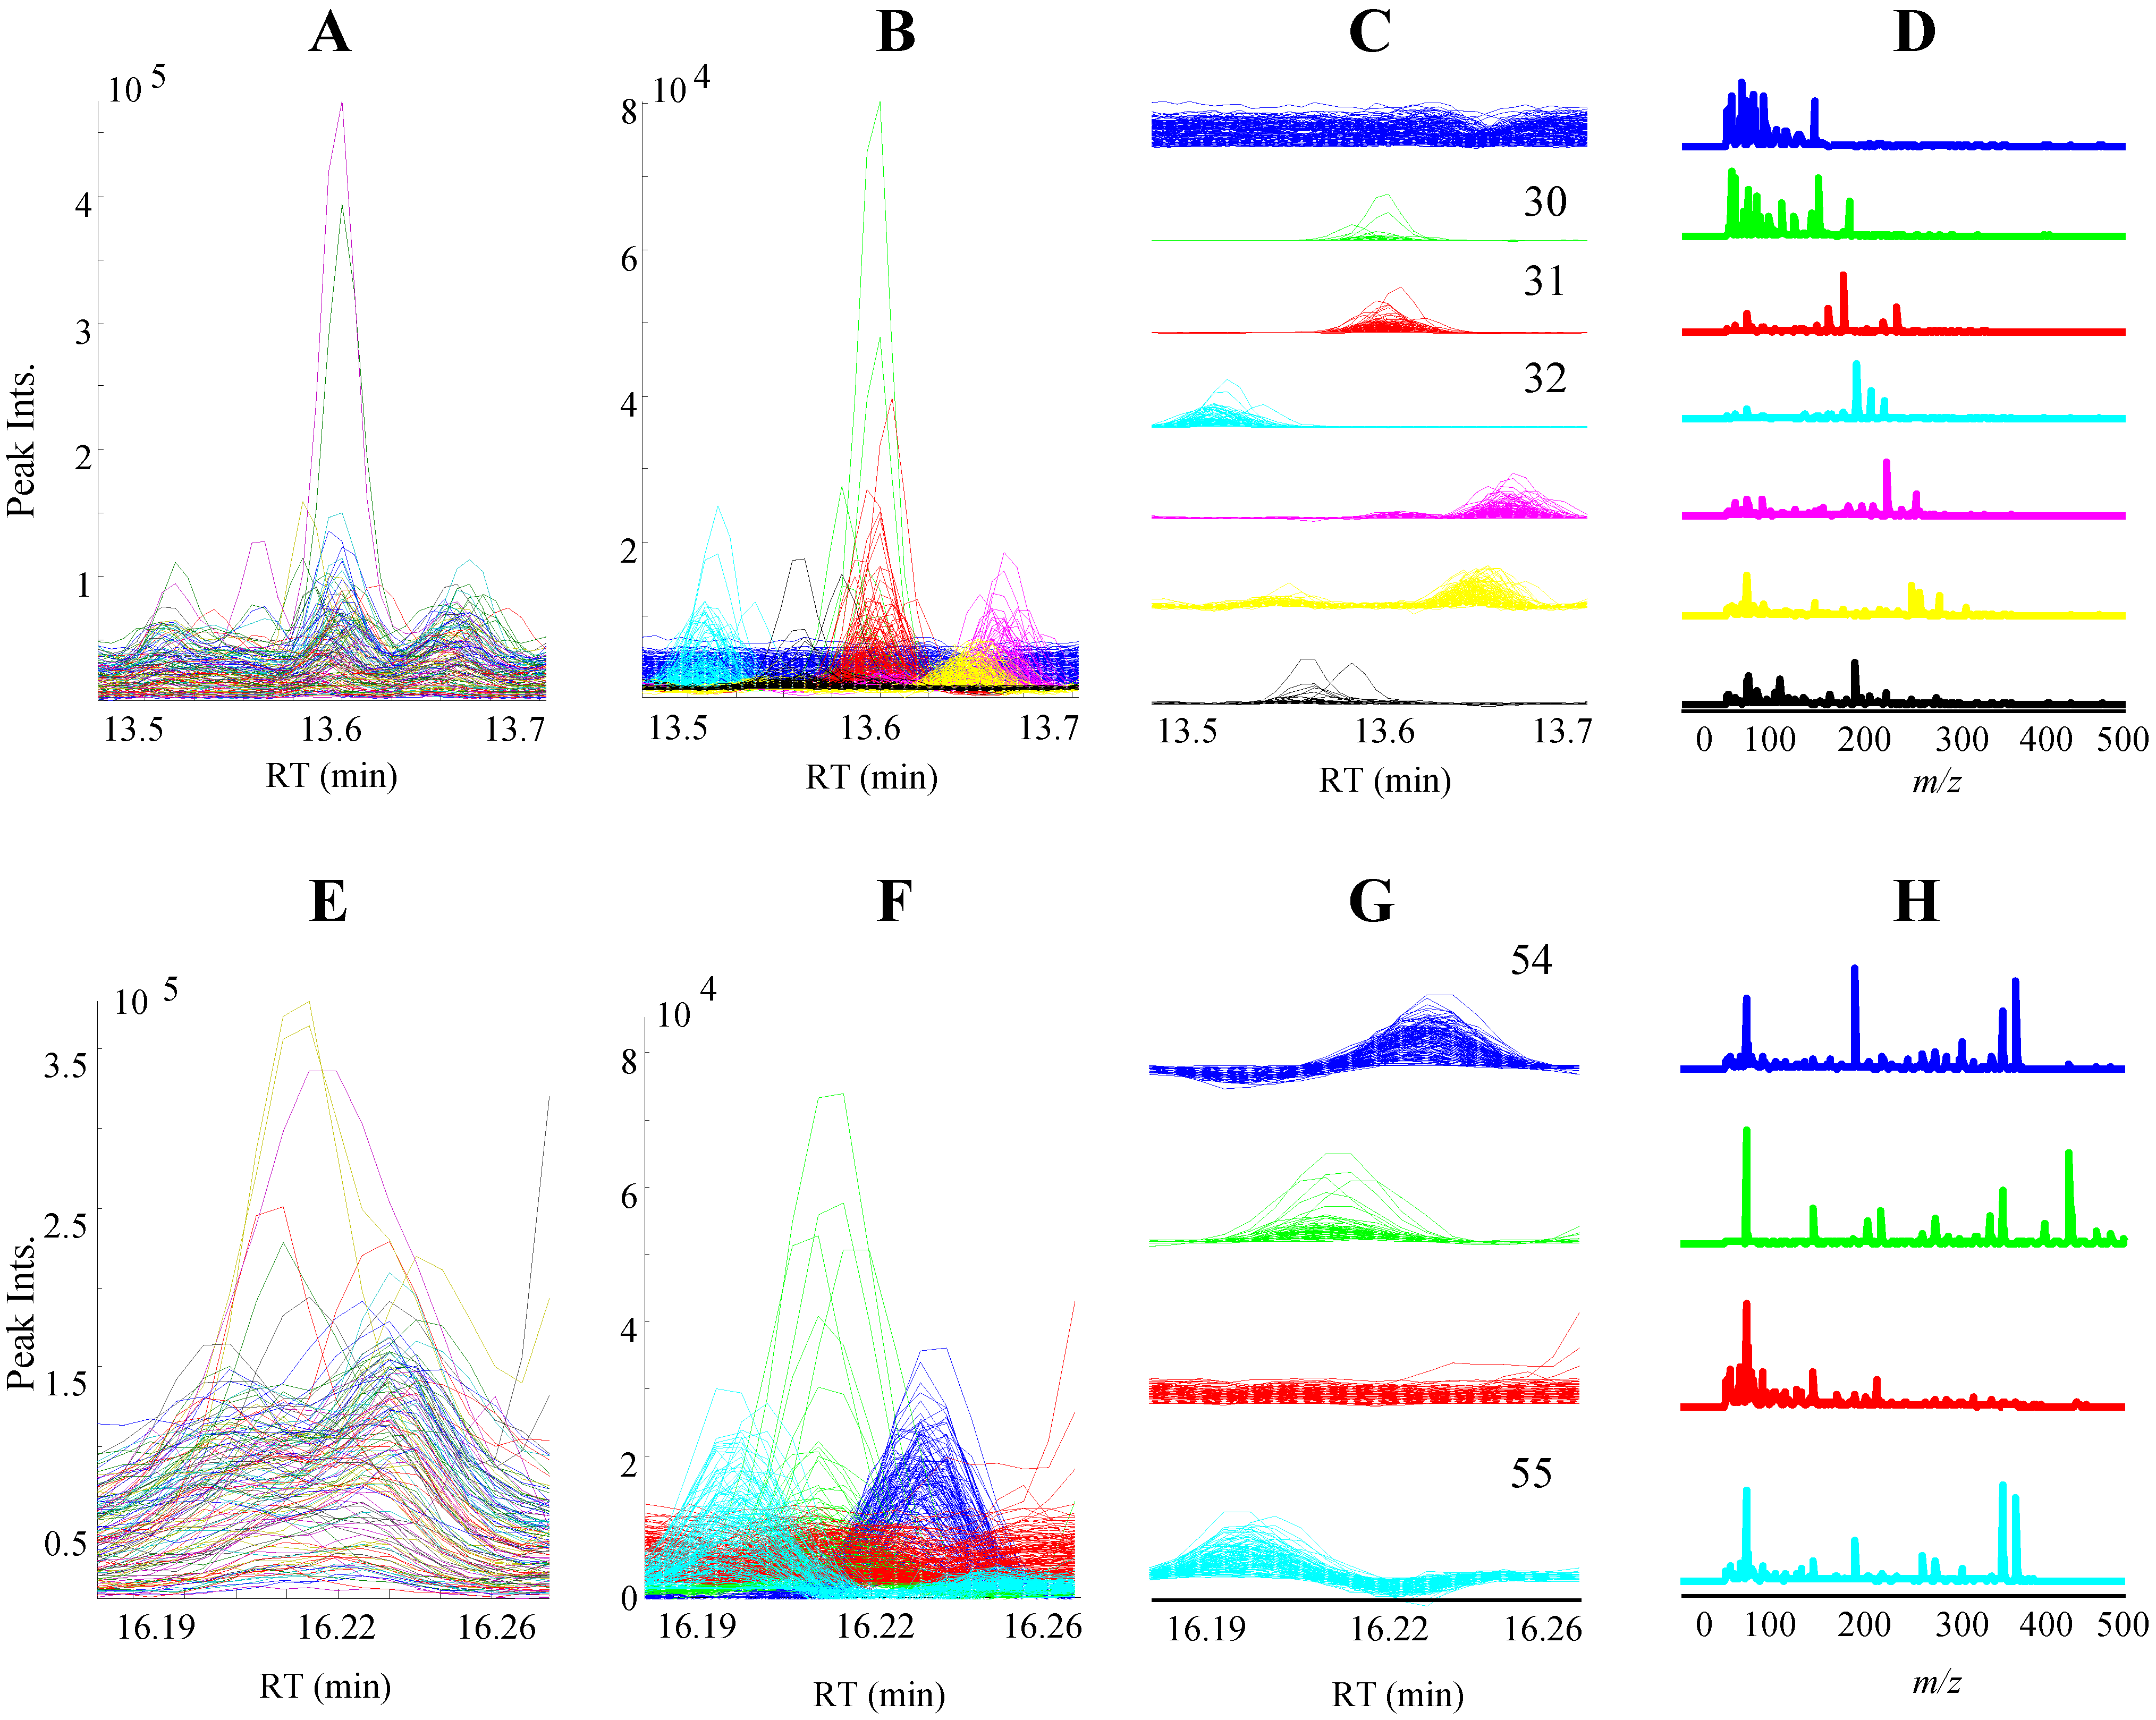
3.1. GC-MS Metabolomic Profiling and PARAFAC2 Based Data Processing

The total ion current (TIC) chromatograms of the GC-MS data obtained from hydrolyzed extracts of the four cereals are illustrated in Figure 1. Just over 300 peaks with a s/n ratio >10 were detected from GC-MS profiles. Validated PARAFAC2 models of 121 intervals of the raw GC-MS data revealed 389 components including resolved peaks, shoulders of neighbor peaks and baseline. Then, each PARAFAC2 model was individually evaluated and components that represent baseline, artifact peaks such as column bleed and reagent derived peaks and shoulders of neighbor peaks were eliminated, resulting in 247 chromatographic peaks with unique retention indices and mass spectra. The PARAFAC2 modeling of GC-MS intervals representing vanillin, protocatechuic acid and β-resorcylic acid are demonstrated in Figure 2.
Figure 1. The total ion current (TIC) chromatograms of GC-MS data obtained on wheat, barley, rye and oat metabolite extracts.
Foods 03 00569 g001
Figure 2. PARAFAC2 based processing of raw GC-MS data intervals. (A) and (E) are the TIC of raw GC-MS data intervals. (B) and (F) are the superimposed PARAFAC2 elution profiles of the raw GC-MS data intervals with seven and four components, respectively. (C) and (G) are subplots of (B) and (F), respectively. * Numbers of elution profiles correspond to the metabolites represented in Table 1. (D) and (H) are subplots of PARAFAC2 mass spectral profiles.
Foods 03 00569 g002
Comparison of RIs and PARAFAC2 resolved mass spectra of 247 resolved peaks against the NIST05 and Golm Metabolite Database resulted in the identification of 89 metabolites (Table 1) at level 2 as described in Metabolomics Standards Initiative report [34]. A total of 32 out of 89 identified metabolites were trimethylsilyl (TMS) derivatives of phenolic acids, their esters and aldehydes. In addition to the previously found phenolic acids from different barley genotypes [21], several other phenolics such as p-salicylic, gallic, gentisic, homovanillic and α-resorcylic acids and methyl esters of ferulic, caffeic, protocatechuic and sinapinic acids were identified. Small molecular organic acids, alcohols and their esters constituted 30 out of 89 identified metabolites. These included succinic, glyceric, maleic, fumaric, malic, pyroglutamic, azelaic acids and methyl esters of aconitic and citric acids that are part of the same or different metabolic pathways, and in addition, TMS-derivatives of 10 fatty acids and their esters, 6 sterols and a flavonoid, catechin-nTMS.
Table 1. A list of identified metabolites from wheat, barley, rye and oat flour samples by GC-MS. Metabolite identification was performed at level 2 as described in Metabolomics Standards Initiative report [34] and was based on RI and EI-MS library match (>80). a Metabolites with more than one isomers and/or TMS-derivatives; b tentatively identified.
NoMetabolitesRT minRI (r)RI (c)
1.Laevulic acid-1TMS9.0410301070
2.Sorbic acid-1TMS9.0610091071
3.Hepta-2,4-dienoic acid, methyl ester9.2810001080
4.Octanol-1-1TMS9.5111011090
5.Malonic acid-2TMS9.9912051207
6.(3,3-Dimethyl-1-cyclohexen-1-yl)oxy]-1TMS9.9711101206
7.Benzoic acid-1TMS10.4212281226
8.3-Methyl-2-furoic acid-1TMS10.3811071224
9.Glycerol-3TMS10.8812821246
10.1,3-Dihydroxypropanone-2-2TMS11.03 1249
11.Succinic acid-2TMS11.2412921262
12.Glyceric acid-3TMS11.5111991274
13.Maleic acid-2TMS11.5512861275
14.Fumaric acid-2TMS11.6011781278
15.p-Hydroxybenzaldehyde-1TMS11.8512801289
16.2-Hydroxyheptanoic acid-2TMS11.8313121288
17.3-Hydroxybutanoic acid-2TMS12.1214031401
18.Resorcinol-2TMS12.213781404
19.Trimethyl aconitate12.5014281419
20.Citric acid, trimethyl ester12.8214421435
21.3-Hydroxyanthranilic acid, methyl ester-1TMS12.8 1434
22.2,4-Dihydroxy-5-methylpyrimidine-2TMS12.8914031439
23.5-Hydroxy-2-(hydroxymethyl)-4H-pyran-4-one-2TMS13.0814921448
24.Maseptol-1TMS13.1213581450
25.Malic acid-2TMS13.1914941453
26.2-Hydroxycyclohexanecarboxylic acid-2TMS13.2314021456
27.3-Hydroxyoctanoic acid-2TMS13.3514521462
28.Pyroglutamic acid-2TMS13.4614661467
29.Erythritol-4TMS13.47 1467
30.Dimethyl azelate13.6114851474
31.4-Hydroxybenzeneacetic acid, methyl ester-1TMS13.6214581475
32.Vanillin-1TMS13.5514691471
33.Citric acid, trimethyl ester-1TMS13.76 1482
34.2-Furancarboxylic acid, 5-[(oxy)methyl]-1TMS13.7215401480
35.4-Hydroxyphenylethanol-2TMS13.9214751490
36.Anozol14.1516031601
37.2-Ketoglutaric acid-3TMS14.3416221612
38.3-Methyl-3-hydroxypentanedioic acid-3TMS14.316101609
39.Dodecane-6-hydroxy-1TMS14.4016311615
40.4-Hydroxybenzoic acid-2TMS14.4516181618
41.Methyl Isovanillate-1TMS14.6615471629
42.Suberic acid-2TMS15.1116821654
43.Syringaldehyde -1TMS15.1516581656
44.β-d-Arabinopyranose-4TMS a15.2316921660
45.β-d-Xylopyranose-4TMS15.3016941664
46.3,5-Dihydroxybenzoic ac. met.est.-2TMS15.3516561667
47.2,5-Dimethoxymandelic acid-2TMS15.3818671669
48.Vanillic acid-2TMS15.7216561687
49.4-Hydroxycinnamic acid, methyl ester -1TMS15.8815651696
50.Azelaic acid-2TMS15.9818001802
51.2,3-Dihydroxyphosphoric acid, propyl ester-4TMS15.8617081695
52.Methyl 2-(oxy)-2-(4-(oxy)phenyl)propanoate-2TMS16.1417571811
53.α-d-Galactofuranoside, methyl-2,3,5,6-tetrakis-4TMS a16.1118451810
54.3,5-Dihydroxy benzoic ac.-3TMS16.2418261818
55.3,4-Dihydroxy benzoic ac.-3TMS16.2018261815
56.d-Fructose-5TMS16.4118671828
57.Isocitric acid-4TMS16.3418351823
58.Catechin-nTMS a16.44 1830
59.Homovanilic acid-2TMS16.418671827
60.β-d-Galactopyranoside, methyl 2,3,4,6-tetrakis-4TMS a16.6819001844
61.Catechin-nTMS a16.77 1849
62.2,5-Dihydroxy benzoic ac.-3TMS16.7817961850
63.α-d-Glucopyranoside, methyl 2,3,4,6-tetrakis-4TMS a16.9019281857
64.Syringic acid-2TMS16.8818451856
65.β-d-Glucopyranoside, methyl 2,3,4,6-tetrakis-4TMS a17.0519281866
66.α-d-Glucopyranose, 1,2,3,4,6-pentakis-5TMS a17.0219241864
67.Palmitic acid, methyl ester17.0118701864
68.d-Galactose, 2,3,4,5,6-pentakis-5TMS a17.1219701871
69.p-Coumaric acid-2TMS17.1819241874
70.Ferulic acid, methyl ester-1TMS17.2517651878
71.3,4,5-Trihydrozy benzoic ac.-4TMS17.4519761890
72.2-Hydroxymandelic acid, ethyl ester-2TMS17.3417771884
73.4’-Cyclohexylacetophenone17.5817031898
74.Caffeic acid methyl ester-2TMS17.7618632010
75.β-d-Glucopyranose-5TMS a17.7519702009
76.2-Hydroxysebacic acid-3TMS18.1320592034
77.Ferulic acid-2TMS18.4020762052
78.8,11-Octadecadienoic acid, methyl ester18.3520932049
79.Sinapinic acid methyl ester-1TMS18.5119432059
80.Methyl vanillactate-2TMS18.5520302062
81.Caffeic acid-3TMS18.7621142076
82.9-Methoxy-4α-methyl-2,3,7-trihydroxy-4,4a-dihydro-2H-benzo[c]chromen-6(3H)-one b18.85 2082
83.Linoleic acid-1TMS19.2322022207
84.4,8-Dihydroxy-2-quinolinecarboxylic acid-3TMS19.4622652224
85.Sinapinic acid-2TMS19.5222212228
86.Androsterone type plant sterol b19.89 2254
87.3-Hydroxyandrostan-17-one-1TMS19.9821862261
88.19-Norandrosterone-3-TMS b20.3621982288
89.9,10-Dihydroxystearic acid-3TMS20.8725172426
90.3,7-di-Hydroxy-androstan-17-one-2TMS21.0924322443
91.9,10-Dihydroxystearic acid, dimethyl ester-2TMS21.4927842474
92.2,3-Dihydroxypalmitic acid, propyl ester-2TMS21.8425812601
93.2-Deoxy-6-phosphogluconolactone-5TMS23.26 2820
94.2-Hydroxytetracosanoic acid, methyl ester-1TMS23.6928942858
95.3,7-Dihydroxycholest-5-ene-2TMS23.9529002881

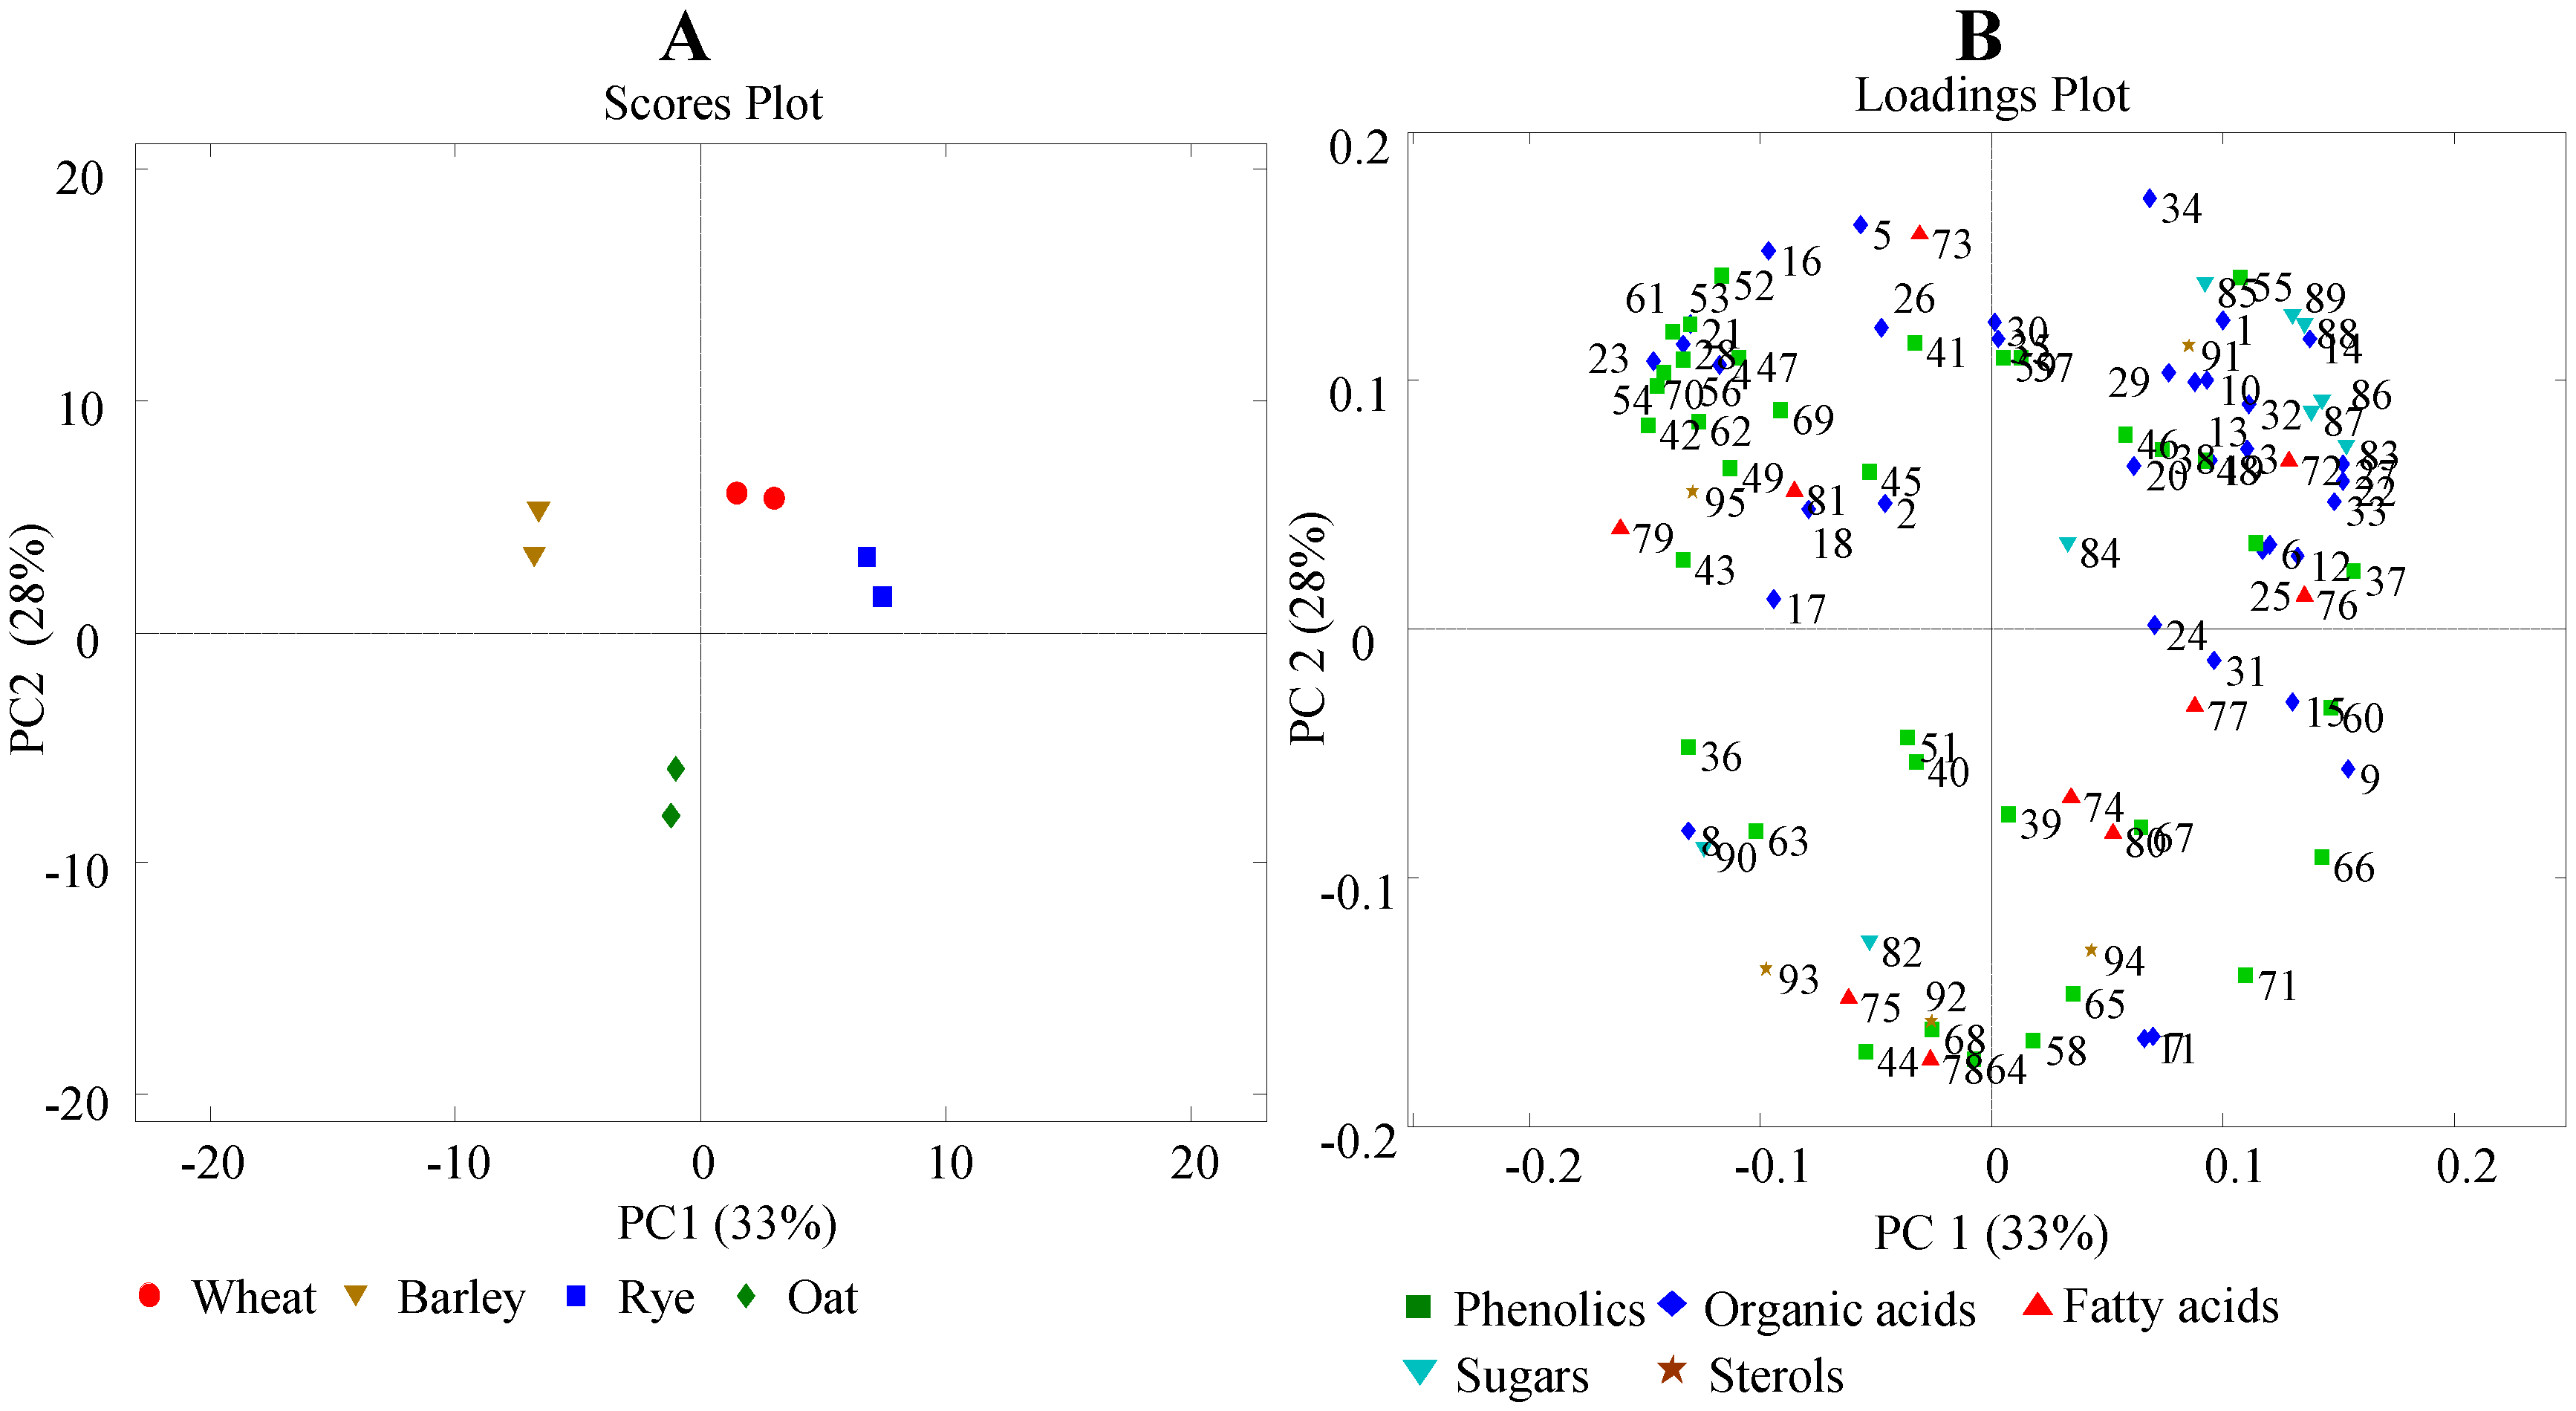
3.2. Principal Component Analysis (PCA)

In order to explore the metabolomics data, PCA was performed on the metabolite table, including eight cereal samples in duplicates and 89 identified metabolites. PC1 versus PC2 scores plot of the PCA model (Figure 3A) show a clear separation of four different cereals explaining more than 60% variation of the data. The loadings plot of the corresponding model (Figure 3B) demonstrates a large spread of the 89 metabolites and revealed no clear groupings of metabolites classes. However, major part of the benzoic acid derived phenolics such as 3,5-dihydroxybenzoic, 3,4-dihydroxybenzoic and 3,4,5-trihydroxybenzoic acids are grouped on the upper left part of the loadings plot showing greater abundance in barley compared to the other cereals. In contrast to this, cinnamic acid derived phenolics such as ferulic, sinapinic and syringic acids are located on the bottom right corner showing greater concentrations in rye and wheat. Phenolics such as caffeic and 4-hydroxybenzoic acids have the highest concentrations in oat and significantly contribute to its separation from other cereals. However, detailed variations of phenolics and organic acids within and between cereal cultivars require a closer investigation of the data. In the following section, univariate comparisons of some metabolites are represented and the findings are compared to previous results reported in the literature.
Figure 3. (A) scores and (B) loading plots of the three component PCA model developed using identified metabolite table. * Numbers in loadings plot correspond to the metabolites represented in Table 1.
Foods 03 00569 g003

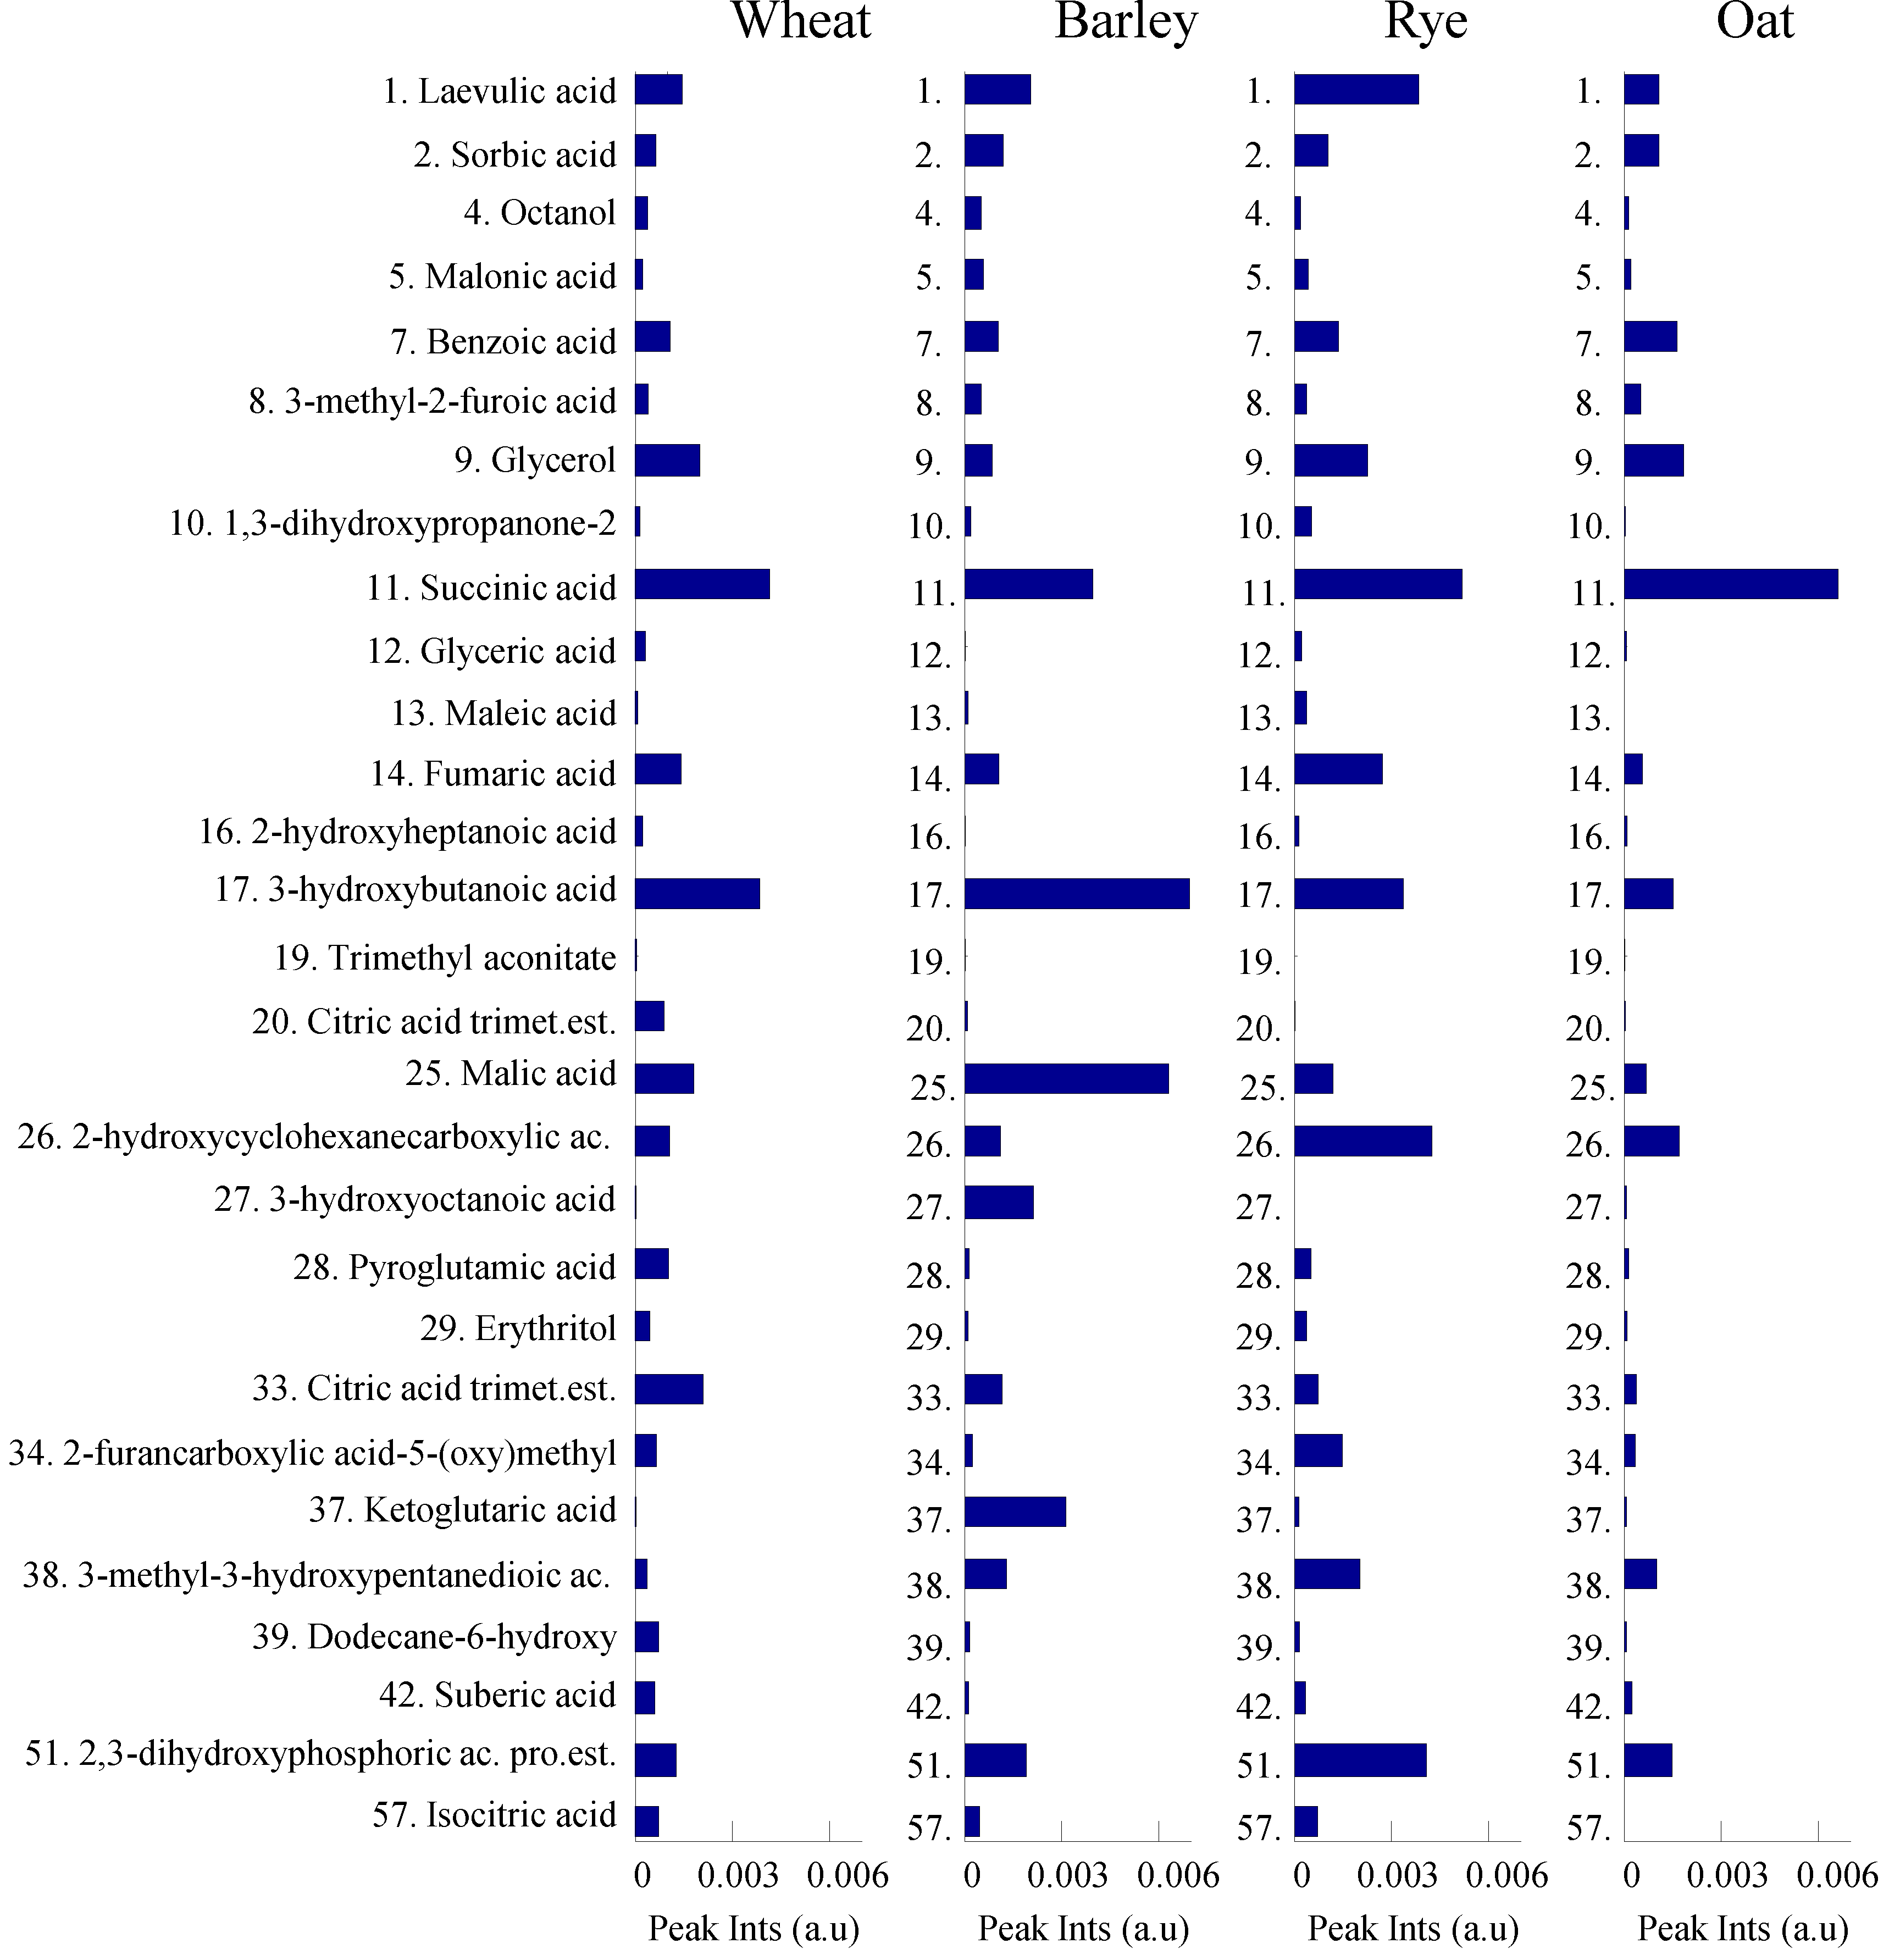
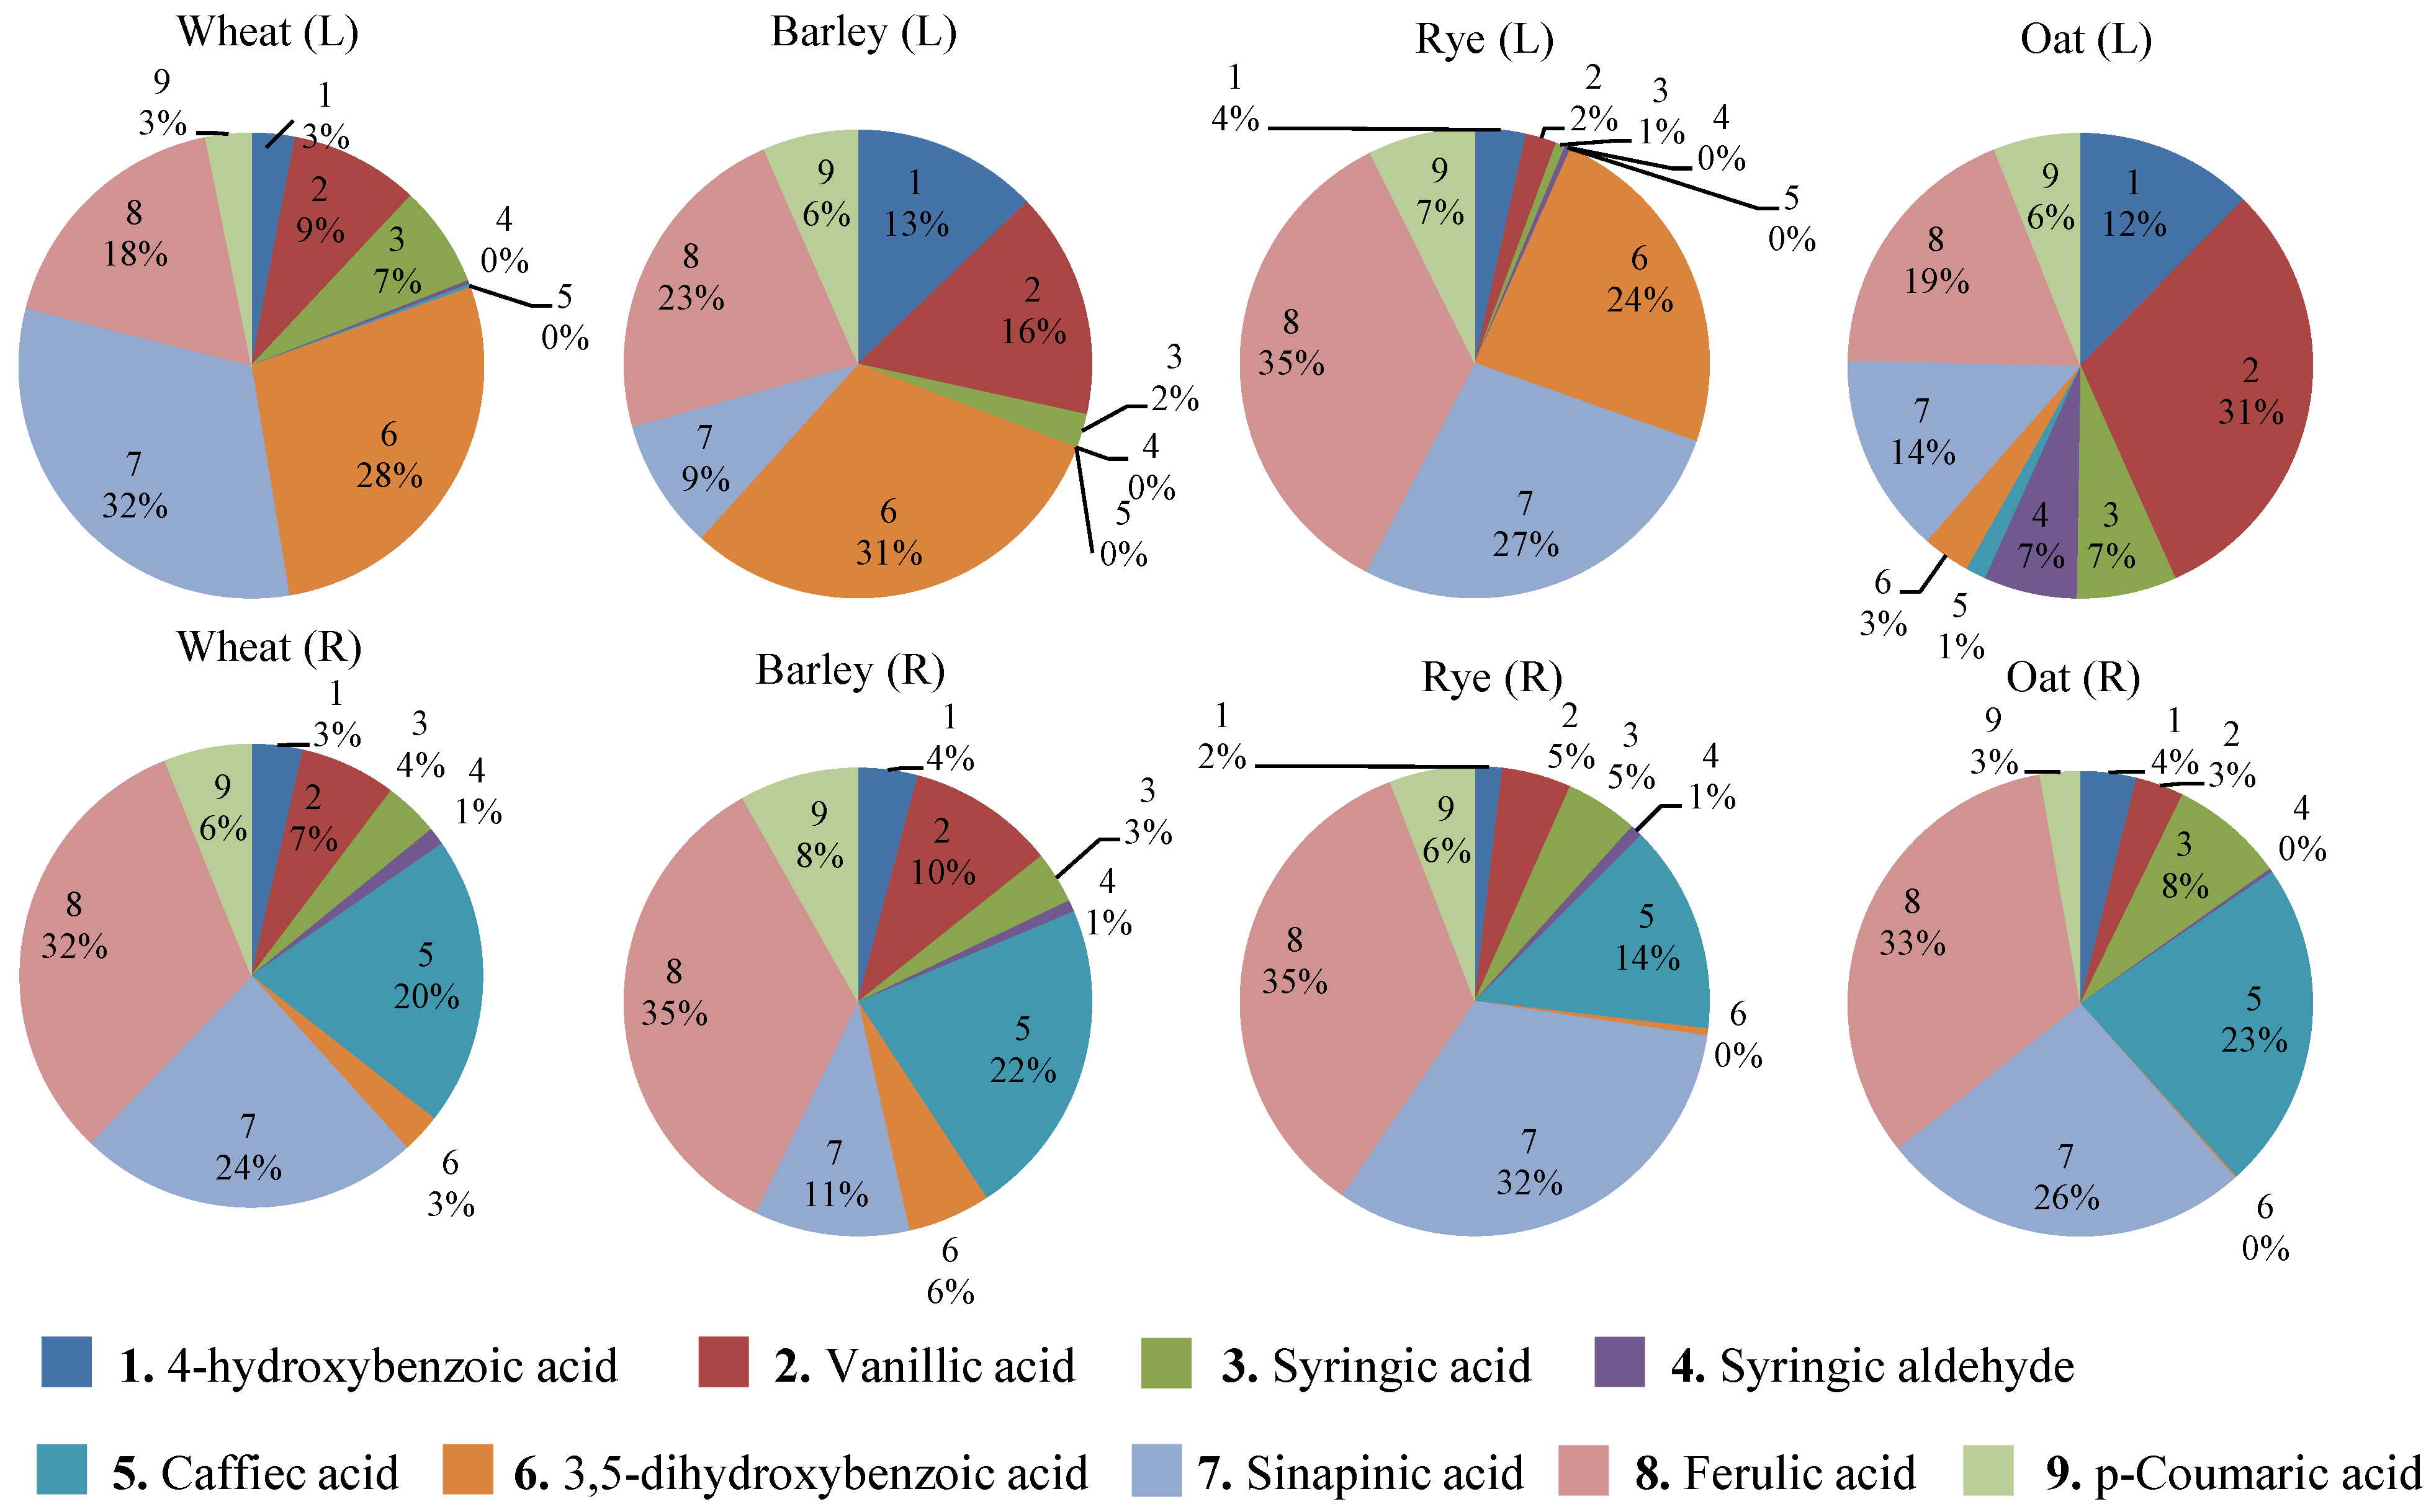
3.3. Variation of Phenolics and Organic Acids in Cereals

Phenolic acid composition of wheat, barley, rye and oat were compared to previously reported data [18,21,22,23]. Figure 4 shows relative percentages of the nine most abundant, free and conjugated phenolic acids of cereals reported in previous studies and makes comparisons with the data obtained in the current study. In previous studies, the phenolic acids of cereals were extracted using 80% ethanol followed by hydrolysis of conjugated phenolics in 2 M sodium hydroxide solution and analyzed by LC-DAD. In the current study, free and conjugated phenolics were extracted using 85% methanol, hydrolyzed in 2 M solution of hydrochloric acid followed by GC-MS analysis and PARAFAC2 based data processing. These two methodologies in phenolic profiling of cereals result in several apparent compositional differences. However, it should be underlined that the compared cereal genotypes are different in the two studies and the goal of this study is not a comprehensive comparison of phenolics of cereal varieties, but to demonstrate the power of the standardized cereal metabolomics protocol developed.
Nine major phenolics of the cereals investigated in this study were compared with winter wheat (Triticum aestivum var. aestivum) [18], Dicktoo barley (USA) [21], Grandrieu rye (France) [23] and Bajka oat (Poland) [22] varieties (Figure 4). Figure 4 shows that the relative concentrations of caffeic acid consistently increased (14%–23%) in all cereal cultivars compared to the previous studies where its abundance was below 1%. Similarly, for wheat, barley and oat, concentrations of ferulic acid increased from approximately 20% to 33%, while the comparison is more consistent for the two rye varieties. These results suggest that in grains, a significant amount of caffeic and ferulic acids are present in conjugated forms that cannot be cleaved by alkaline hydrolysis. Thus, the most abundant phenolic acids in previous cereal metabolomics studies were ferulic, sinapinic and 3,5-dihydroxybenzoic acids, while in this study, ferulic, sinapinic and caffeic acids were the most abundant ones.
Figure 4. Comparison of relative percentages of the nine most abundant phenolic acids of cereals reported in the literature (L) with the results of the current study (R). In literature the following genotypes were studied: winter wheat (Triticum aestivum var. aestivum) [18], Dicktoo barley (USA) [21], Grandrieu rye (France) [23] and Bajka oat (Poland) [22].
Foods 03 00569 g004
Figure 5 and Figure 6 demonstrate relative concentrations of phenolics and organic acids/alcohols of wheat, barley, rye and oat genotypes investigated in this study. Figure 5 show that ferulic, caffeic and sinapic acids and their methyl esters are the most abundant metabolites among all other phenolics in the cereal samples. Moreover, the relative concentrations of the most abundant phenolics are found to be up to three times greater in rye and oat than in wheat and barley. Succinic and 3-hydroxybutanoic acids were the most abundant metabolites among all organic acids detected in the four different cereals (Figure 5). Relative concentrations of fumaric and 2-hydroxycyclohexanecarboxylic acids were significantly higher in rye, while concentrations of malic and ketoglutaric acids were highest in barley.
Figure 5. Relative concentrations of 32 phenolics detected from wheat, barley, rye and oat. Metabolites are numbered according to the Table 1.
Foods 03 00569 g005
Figure 6. Relative concentrations of 29 organic acids/alcohols detected from wheat, barley, rye and oat. Metabolites are numbered according to the Table 1.
Foods 03 00569 g006

4. Conclusions

This paper outlines and demonstrates an optimized, relatively unbiased, comprehensive and high-throughput metabolomic profiling of whole-grain cereals based on new technologies developed within GC-MS metabolomics and chemometrics. A metabolite extraction protocol optimized towards phenolics and organic acids of whole-grains, and an unbiased and high-throughput protocol, was developed that allow processing of up to 60 samples per day. The hydrochloric acid based hydrolysis allowed extraction of all major cereal phenolics, free and conjugated, and enabled the detection of 32 phenolic and 30 organic acids from 50 mg of flour. A novel trimethylsilylation method based on TMSCN allowed the detection of up to 300 metabolites from the GC-MS profiles. The multi-way decomposition method PARAFAC2 facilitated deconvolution of overlapping, retention time shifted and low s/n ratio peaks with high precision and in a semi-automated manner. The resolved mass spectra of deconvoluted peaks allowed the identification of 89 metabolites using NIST and Golm metabolite databases. Multivariate and univariate analysis of phenolic profiles of cereals revealed that ferulic, caffeic and sinapinic acids and their esters were the main phenolics of whole-grain samples across the four cereals studied. Rye and oat showed higher concentrations of the most abundant phenolics acids compared to wheat and barley. Comparison of the relative concentrations of the nine most abundant phenolics of cereals with previously reported data showed that the acidic hydrolysis significantly improved detection of caffeic acid. However, metabolite profiles of cereals highly depend on several factors such as genotype, growth conditions, harvest time and storage. Thus, essential secondary metabolite profile comparisons of different cereals as well as different varieties require a strictly controlled experimental design. This paper has demonstrated a new methodology that is ready to be applied in a larger metabolomic profiling studies that may reveal biological information related to phenolic and organic acids of whole-grain cereals. Moreover, the protocol developed can easily be modified for polar metabolite fractions, including mono- and di-saccharides and amino acids, of cereals by altering metabolite extraction method and the additional of a methoximation step in GC-MS derivatization.

Acknowledgements

Faculty of Science is acknowledged for support to the elite-research area “metabolomics and bioactive compounds” with a PhD stipendium to B. Khakimov and The Ministry of Science and Technology is acknowledged for a grant to University of Copenhagen (S.B. Engelsen) with the title “metabolomics infrastructure” under which the GC-MS was acquired.

Author Contributions

B.K. B.M.J. and S.B.E. designed the study; B.K. conducted the GC-MS analysis. B.K. and S.B.E. performed the chemometric analysis and drafted the manuscript. All authors contributed to, read and approved the final manuscript.

Conflicts of Interest

The authors declare no conflict of interest.

References

  1. Zilic, S.; Sukalovic, V.H.T.; Dodig, D.; Maksimovic, V.; Maksimovic, M.; Basic, Z. Antioxidant activity of small grain cereals caused by phenolics and lipid soluble antioxidants. J. Cereal Sci 2011, 54, 417–424. [Google Scholar] [CrossRef]
  2. Björck, I.; Östman, E.; Kristensen, M.; Anson, N.M.; Price, R.K.; Haenen, G.R.M.M.; Havenaar, R.; Knudsen, K.E.B.; Frid, A.; Mykkänen, H.; et al. Cereal grains for nutrition and health benefits: Overview of results from in vitro, animal and human studies in the HEALTHGRAIN project. Trends Food Sci. Technol. 2012, 25, 87–100. [Google Scholar] [CrossRef]
  3. Andersson, A.A.M.; Andersson, R.; Piironen, V.; Lampi, A.M.; Nystrom, L.; Boros, D.; Fras, A.; Gebruers, K.; Courtin, C.M.; Delcour, J.A.; et al. Contents of dietary fibre components and their relation to associated bioactive components in whole grain wheat samples from the HEALTHGRAIN diversity screen. Food Chem. 2013, 136, 1243–1248. [Google Scholar] [CrossRef]
  4. Amarowicz, R.; Zegarska, Z.; Pegg, R.B.; Karamac, M.; Kosinska, A. Antioxidant and radical scavenging activities of a barley crude extract and its fractions. Czech J. Food Sci. 2007, 25, 73–80. [Google Scholar]
  5. Wood, P.J. Cereal beta-glucans in diet and health. J. Cereal Sci. 2007, 46, 230–238. [Google Scholar] [CrossRef]
  6. Mcintosh, G.H.; Whyte, J.; Mcarthur, R.; Nestel, P.J. Barley and wheat foods—Influence on plasma-cholesterol concentrations in hypercholesterolemic men. Am. J. Clin. Nutr. 1991, 53, 1205–1209. [Google Scholar]
  7. Madhujith, T.; Shahidi, F. Antioxidative and antiproliferative properties of selected barley (Hordeum vulgarae L.) cultivars and their potential for inhibition of low-density lipoprotein (LDL) cholesterol oxidation. J. Agric. Food Chem. 2007, 55, 5018–5024. [Google Scholar] [CrossRef]
  8. Behall, K.M.; Scholfield, D.J.; Hallfrisch, J. Diets containing barley significantly reduce lipids in mildly hypercholesterolemic men and women. Am. J. Clin. Nutr. 2004, 80, 1185–1193. [Google Scholar]
  9. Gibson, S.M.; Strauss, G. Implication of phenolic-acids as texturizing agents during cooking-extrusion cereals. Abstr. Pap. Am. Chem. Soc. 1991, 202, 150. [Google Scholar]
  10. Vinson, J.A.; Erk, K.M.; Wang, S.Y.; Marchegiani, J.Z.; Rose, M.F. Total polyphenol antioxidants in whole grain cereals and snacks: Surprising sources of antioxidants in the US diet. Abstr. Pap. Am. Chem. Soc. 2009, 238, 246. [Google Scholar]
  11. Khakimov, B.; Bak, S.; Engelsen, S.B. High-throughput cereal metabolomics: Current analytical technologies, challenges and perspectives. J. Cereal Sci. 2014, 59, 393–418. [Google Scholar] [CrossRef]
  12. Soltesz, A.; Smedley, M.; Vashegyi, I.; Galiba, G.; Harwood, W.; Vagujfalvi, A. Transgenic barley lines prove the involvement of TaCBF14 and TaCBF15 in the cold acclimation process and in frost tolerance. J. Exp. Bot. 2013, 64, 1849–1862. [Google Scholar] [CrossRef]
  13. Widodo; Patterson, J.H.; Newbigin, E.; Tester, M.; Bacic, A.; Roessner, U. Metabolic responses to salt stress of barley (Hordeum vulgare L.) cultivars, Sahara and Clipper, which differ in salinity tolerance. J. Exp. Bot. 2009, 60, 4089–4103. [Google Scholar] [CrossRef]
  14. Manavalan, L.P.; Chen, X.; Clarke, J.; Salmeron, J.; Nguyen, H.T. RNAi-mediated disruption of squalene synthase improves drought tolerance and yield in rice. J. Exp. Bot. 2012, 63, 163–175. [Google Scholar] [CrossRef]
  15. Balmer, D.; Flors, V.; Glauser, G.; Mauch-Mani, B. Metabolomics of cereals under biotic stress: Current knowledge and techniques. Front. Plant Sci. 2013, 4, 82. [Google Scholar]
  16. Fernie, A.R.; Schauer, N. Metabolomics-assisted breeding: A viable option for crop improvement? Trends Genet. 2009, 25, 39–48. [Google Scholar] [CrossRef]
  17. Bino, R.J.; Hall, R.D.; Fiehn, O.; Kopka, J.; Saito, K.; Draper, J.; Nikolau, B.J.; Mendes, P.; Roessner-Tunali, U.; Beale, M.H.; et al. Potential of metabolomics as a functional genomics tool. Trends Plant Sci. 2004, 9, 418–425. [Google Scholar] [CrossRef]
  18. Li, L.; Shewry, P.R.; Ward, J.L. Phenolic acids in wheat varieties in the HEALTHGRAIN diversity screen. J. Agric. Food Chem. 2008, 56, 9732–9739. [Google Scholar] [CrossRef]
  19. Fernandez-Orozco, R.; Li, L.; Harflett, C.; Shewry, P.R.; Ward, J.L. Effects of environment and genotype on phenolic acids in wheat in the HEALTHGRAIN diversity screen. J. Agric. Food Chem. 2010, 58, 9341–9352. [Google Scholar] [CrossRef]
  20. Shewry, P.R.; Piironen, V.; Lampi, A.M.; Edelmann, M.; Kariluoto, S.; Nurmi, T.; Fernandez-Orozco, R.; Ravel, C.; Charmet, G.; Andersson, A.A.M.; et al. The HEALTHGRAIN wheat diversity screen: Effects of genotype and environment on phytochemicals and dietary fiber components. J. Agric. Food Chem. 2010, 58, 9291–9298. [Google Scholar] [CrossRef]
  21. Andersson, A.A.M.; Lampi, A.M.; Nystrom, L.; Piironen, V.; Li, L.; Ward, J.L.; Gebruers, K.; Courtin, C.M.; Delcour, J.A.; Boros, D.; et al. Phytochemical and dietary fiber components in barley varieties in the HEALTHGRAIN diversity screen. J. Agric. Food Chem. 2008, 56, 9767–9776. [Google Scholar] [CrossRef]
  22. Shewry, P.R.; Piironen, V.; Lampi, A.M.; Nystrom, L.; Li, L.; Rakszegi, M.; Fras, A.; Boros, D.; Gebruers, K.; Courtin, C.M.; et al. Phytochemical and fiber components in oat varieties in the HEALTHGRAIN diversity screen. J. Agric. Food Chem. 2008, 56, 9777–9784. [Google Scholar] [CrossRef]
  23. Nyström, L.; Lampi, A.M.; Andersson, A.A.M.; Kamal-Eldin, A.; Gebruers, K.; Courtin, C.M.; Delcour, J.A.; Li, L.; Ward, J.L.; Fras, A.; et al. Phytochemicals and dietary fiber components in rye varieties in the HEALTHGRAIN diversity screen. J. Agric. Food Chem. 2008, 56, 9758–9766. [Google Scholar] [CrossRef]
  24. Ward, J.L.; Poutanen, K.; Gebruers, K.; Piironen, V.; Lampi, A.M.; Nystrom, L.; Andersson, A.A.M.; Aman, P.; Boros, D.; Rakszegi, M.; et al. The HEALTHGRAIN cereal diversity screen: Concept, results, and prospects. J. Agric. Food Chem. 2008, 56, 9699–9709. [Google Scholar] [CrossRef]
  25. Arranz, S.; Calixto, F.S. Analysis of polyphenols in cereals may be improved performing acidic hydrolysis: A study in wheat flour and wheat bran and cereals of the diet. J. Cereal Sci. 2010, 51, 313–318. [Google Scholar] [CrossRef]
  26. Sani, I.M.; Iqbal, S.; Chan, K.W.; Ismail, M. Effect of acid and base catalyzed hydrolysis on the yield of phenolics and antioxidant activity of extracts from germinated brown rice (GBR). Molecules 2012, 17, 7584–7594. [Google Scholar] [CrossRef]
  27. Khakimov, B.; Motawia, M.S.; Bak, S.; Engelsen, S.B. The use of trimethylsilyl cyanide derivatization for robust and broad-spectrum high-throughput gas chromatography-mass spectrometry based metabolomics. Anal. Bioanal. Chem. 2013, 405, 9193–9205. [Google Scholar] [CrossRef]
  28. Bro, R.; Andersson, C.A.; Kiers, H.A.L. PARAFAC2—Part II. Modeling chromatographic data with retention time shifts. J. Chemom. 1999, 13, 295–309. [Google Scholar] [CrossRef]
  29. Amigo, J.M.; Skov, T.; Coello, J.; Maspoch, S.; Bro, R. Solving GC-MS problems with PARAFAC2. Trac-Trends Anal. Chem. 2008, 27, 714–725. [Google Scholar] [CrossRef]
  30. Khakimov, B.; Amigo, J.M.; Bak, S.; Engelsen, S.B. Plant metabolomics: Resolution and quantification of elusive peaks in liquid chromatography-mass spectrometry profiles of complex plant extracts using multi-way decomposition methods. J. Chromatogr. A 2012, 1266, 84–94. [Google Scholar] [CrossRef]
  31. Vandendool, H.; Kratz, P.D. A generalization of retention index system including linear temperature programmed gas-liquid partition chromatography. J. Chromatogr. 1963, 11, 463. [Google Scholar] [CrossRef]
  32. Golm Metabolome Database. Available online: http://gmd.mpimp-golm.mpg.de/ (accessed on 5 November 2013).
  33. Hotelling, H. Analysis of a complex of statistical variables into principal components. J. Educ. Psychol. 1933, 24, 417–441. [Google Scholar] [CrossRef]
  34. Sumner, L.; Amberg, A.; Barrett, D.; Beale, M.; Beger, R.; Daykin, C.; Fan, T.; Fiehn, O.; Goodacre, R.; Griffin, J.; et al. Proposed minimum reporting standards for chemical analysis. Metabolomics 2007, 3, 211–221. [Google Scholar] [CrossRef]

