Dielectric and Bioimpedance Research Studies: A Scientometric Approach Using the Scopus Database


Department Engineering, University of Almeria, La Cañada, 04120 Almeria, Spain
*
Author to whom correspondence should be addressed.
Publications 2018, 6(1), 6; https://doi.org/10.3390/publications6010006
Submission received: 18 November 2017
/
Revised: 16 December 2017
/
Accepted: 19 January 2018
/
Published: 23 January 2018
Abstract
:This work describes the worldwide applications of dielectric and bioimpedance measurements techniques in various fields. Dielectric and bioimpedance spectroscopy are major non-destructive measurement systems with great potential in the technology field. All results produced by the Scopus database were used as the core of the study in hand, with different items from journals, papers and conference proceedings being taken into account. The results of this analysis show that the interest in electrical properties has risen in the last years due to the advanced technological measurements offered on the scientific level. Results show that bioimpedance studies are considerably more recent compared to dielectric studies, and are more directed towards medical purposes while dielectric spectroscopy focuses on physical aspects, and is used mostly in engineering and material science. It can be stated that bioimpendance and dielectric spectroscopy are being increasingly applied and that they have the capacity to deepen and enhance research investigation.

1. Introduction
Electrical measurement is considered a simple tool for material characterization [1]. Throughout the past decades, researchers have shown tremendous interest in electric detection techniques [2]. Bioimpedance, which consists of measuring the intensity of electrical current passing through the investigated system of electrolytes, was widely used in various applications due to the simplicity of measurements [3]. Electrical impedance, as a complex resistance in the presence of alternating current, is considered to be a very useful tool to investigate the structural characteristics of plant tissues [4]. Its measurements have provided valuable data on the characterization of living tissues, such as cell size and shape, and the state of cell membranes, the status of intra and extra cellular media [5]. Moreover, it provides useful physiological insights on fruit ripening [6] as well as other horticultural quality parameters. At low frequency ranges (10 Hz to 10 MHz), various circuit models have been described to represent the electrical impedance spectrum, where elements represent the electrical resistance and capacitance of different cellular structures [7,8,9]. However, the success of this electrical measurement is highly dependent on the material under test, where frequency range and methods should be optimized according to the application [1]. Moreover, many factors may influence the resistance during the measurements and increase the percentage of experimental errors. Among these are electrode oxidation and polarization, the tissue browning and perturbing effect of the skin [10]. For 100% testing applications, speed is a very important factor in contrast to sample measurement where speed is not really important. Using the time domain spectroscopy could be a good approach [1]. Bioimpedance is seen as a good technique for assessment due to the advanced mathematical modeling that has facilitated bioimpedance measurement. Nevertheless, it can highly assess changes in tissues under high voltages since it is quite sensitive to the permittivity of cell membranes [11].
Permittivity is another effective electrical measurement that has been extensively used as a non-destructive method for detecting biomaterials. Permittivity measures how an electric field affects and is affected by a dielectric medium. It relates to a material’s ability to permit electrostatic lines of flux within that material’s ability. Relative permittivity is most often used to define the dielectric properties of materials [12]. Among the several techniques used for measuring dielectric properties, the open-ended coaxial probe regarded as a popular non-destructive method for liquids, semi-solid and solid samples. An open-ended coaxial line is inserted into the sample, and the phase and amplitude of the reflected signal are calculated [13]. Various experiments have shown different levels of success where dielectric theory can be applied for a wide range of electromagnetic waves frequencies [14]. For example, manganese and vanadium mixed oxide were tested for their dielectric properties [15]. Also, among the most recent publications, a study on micro/nanocellulose oxide composites investigated their dielectric relaxation parameters [16].
Bioimpedance and dielectric spectroscopy are the core of future electric material investigations; thus examining the evolution of these techniques from an objective point of analysis, is a valid step towards amplifying the efforts in particular areas in order to get the maximum benefits from the available technologies. A scientometric approach can offer valuable guidance to future areas of investigation by identifying gaps in the available data. By enabling comparison of universities’ research performance [17,18,19], a bibliometric study provides a realistic spatiotemporal analysis of each of the proposed techniques [20].
Measurements of dielectric and bioimpedance spectroscopy today hold the potential for a true evolution in various technological areas. Considerable information on multiple physiological parameters of the human body and vital systems can be provided by electric impedance measurements [21]. In fact, electrical impedance spectroscopy was assessed to be effective for detection of bladder abnormalities, such as a bladder biopsy [22], a useful technique for the characterization of muscles’ electrical properties [23], as well as for the possible development of an in vivo myocardial model for cardiovascular and respiratory systems [24]. Additionally, a genuine digital algorithm was developed, characterized and showed efficacy for online measurement of the dielectric loss factor of electronic transformers [25]. In the microwave frequency region, dielectric constant and loss of high-K thin film dielectric was determined [26], for tropical wood [27] and characterization of different vegetable oils are realized by Cataldo et al. to confirm the potential of dielectric spectroscopy for quality purposes [28].
The main objective of this work is to analyze the research state of the bioimpedance and dielectric applications in different fields and in the light of these results, to build a generic perspective on the standing of these techniques in their technological application in our world today. The core benefit of bioimpedance and dielectric spectroscopy resides in the possibility of applying these advanced measurement systems to a variety of scientific areas. This work can be achieved through the extraction of terms relevant to the research, the analysis of growth in prevalence of these terms and the identification of interrelationships [29]. Research is the primary motivating factor for advances in the bioimpedance and dielectric fields [30].
2. Materials and Methods
Worldwide, Scopus and Web of Science (WOS) are the most used databases to search scientific literature [31]. The Web of Science (WOS) was created in 1960 as the Science Citation Index of the Clarivate Analytics Institute of Scientific Information (ISI), while Scopus was introduced by Elsevier in 2004, but its citation period coverage starts earlier, in 1996 [32]. The competition between Scopus and WOS databases was intense and helped to improve both databases [33]. Several researchers have compared the coverage, features and citation analysis capabilities of Scopus and WOS. These comparative studies of Scopus and of WOS conclude that the coverage of journals in WOS (13,605 journals) is less than Scopus (20,346 journals) [34], and the correlations are extremely high (R2 ≈ 0.99) between the measures obtained for both databases for: the number of papers, the number of citations received by countries, and for their ranks [35]. The advantage of selecting one of them depends on the specific scientific or geographical area [36,37]. The advantages of Scopus are shown in several research papers and therefore the database is also used for numerous bibliometric analyses [38,39,40,41].
A deep search in the Scopus database has been performed using sub-fields, “subjarea” and “affilcountry” to identify all the publications that have been concerned with measuring the electric properties of materials in various fields, using bioimpedance or dielectric spectroscopy. The search is based on “dielectric”, and “bioimpedance”. The search dates are from1893 to 2016 and from 1966 to 2016 for dielectric and bioimpedance, respectively. An examination of the indexed scientific journals can guide in performing the analysis of research endeavors and tendencies [42,43,44,45,46,47]. The different electrical research sub-fields comprise all the types of measurements related to both bioimpedance and dielectric spectroscopy. Spreadsheets have been used to handle the retrieved records. Each of the publications from Scopus follows a systematic database recording [48]. For the record, each document is identified by its authors, title, year of publication, source title with the volume, issue number, starting and ending pages (where available). Often, this information is accompanied with the digital object identifier (DOI) for articles dating back to the 21st century and the international standard serial numbers ISSN (where applicable). Moreover, Scopus records are always updated with the exact affiliation details and the number of citations. Much information has been derived according to publications available online. Thus, rates and statistics about this particular field have been computed. It has been shown that many fields of interest can be analyzed for both bioimpedance and dielectric spectroscopy techniques on available studies.
3. Results
3.1. Types and Languages of Publications
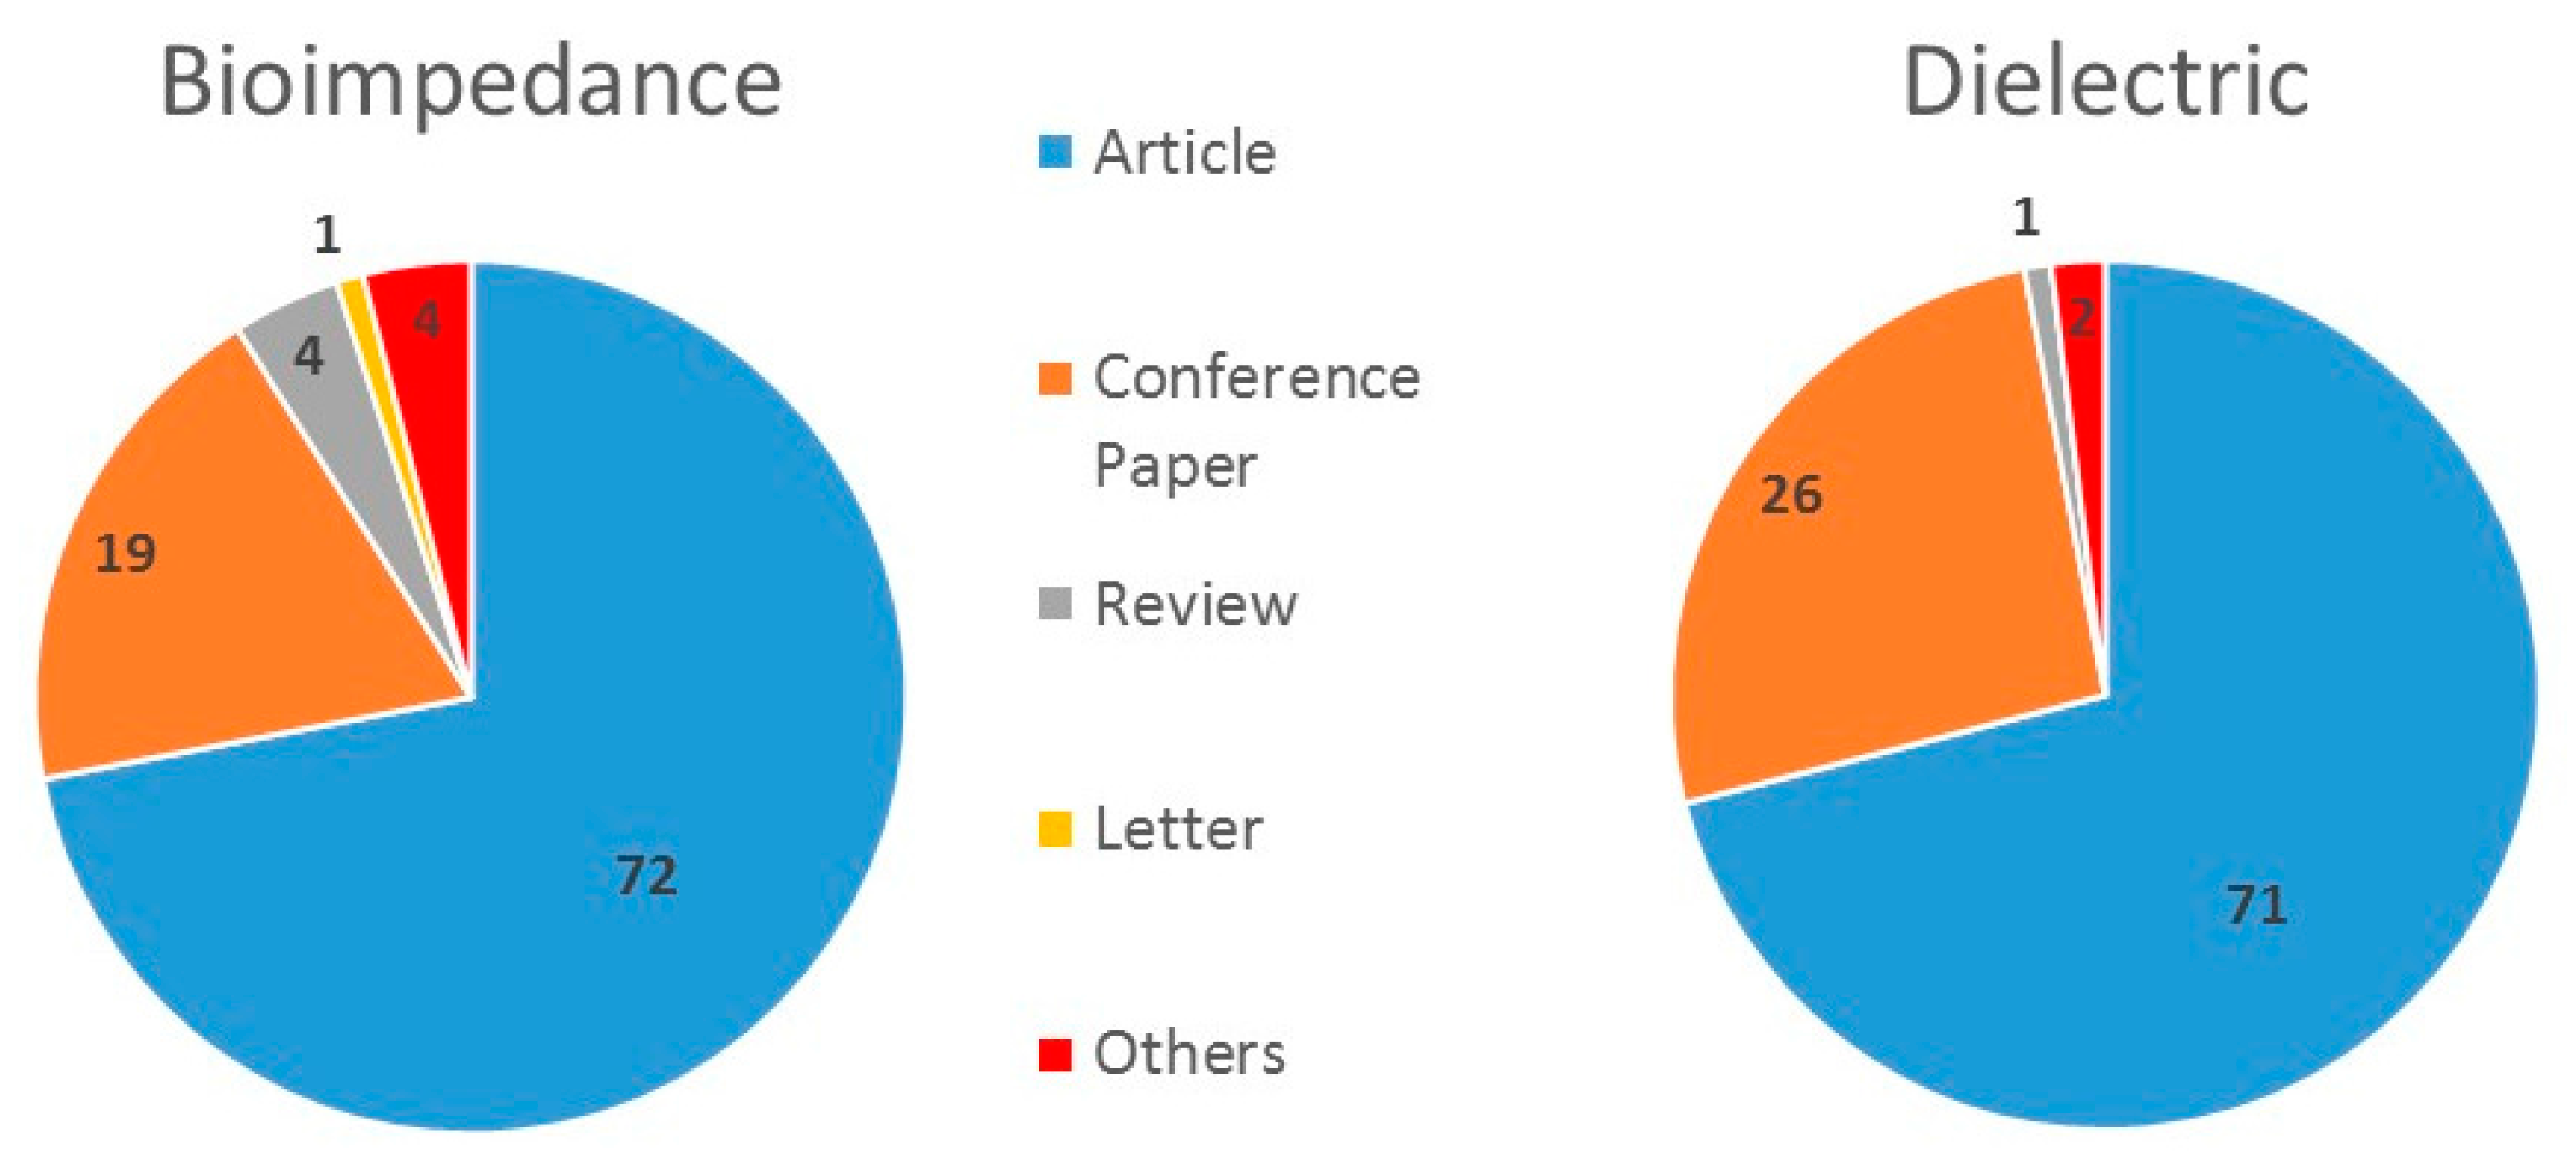
Figure 1 shows the distribution of 349,315 documents published between 1893 and 2016 on dielectric where the majority is recorded as 245,740 articles, that is, about 70.3% of the total publications. In the chart, it is shown that 91,725 conference papers make up 26.3%, and 3695 reviews are only 1% of the total. The small, remaining percentage is divided between press articles, book chapters, letters, notes and Erratum. Due to the fact that the majority of published works are journal articles, it is evident that 328,053 documents are written in English (93.94%). While the second language of publication is Chinese (8250, that is, 2.36%), the other three languages among the top 5 are Russian, Japanese and German. As well, Figure 1 shows the distribution of 4343 results obtained on bioimpedance dating from 1966 to 2016. Again, articles (3110) are the majority of these publications, about 71.6% of the total, while 824 conference papers and 173 reviews are recorded, which constitute 19% and 4% of the total publications, respectively. The remaining, less important documents divided among letters, articles in the press, conference reviews, editorials and book chapters. About 90.54% of the documents are published in English which is a considerable number, that is, 3954 publications. Remarkably, Spanish and Portuguese come next in terms of languages with 129 and 59 documents respectively (about 3%).
In this regard, it is interesting to compare these numbers with documents obtained on a dual search with bioimpedance and dielectric combined together; this search resulted in only 184 documents with the first one published in 1987 and the last in 2007.
3.2. Evolution of Scientific Output
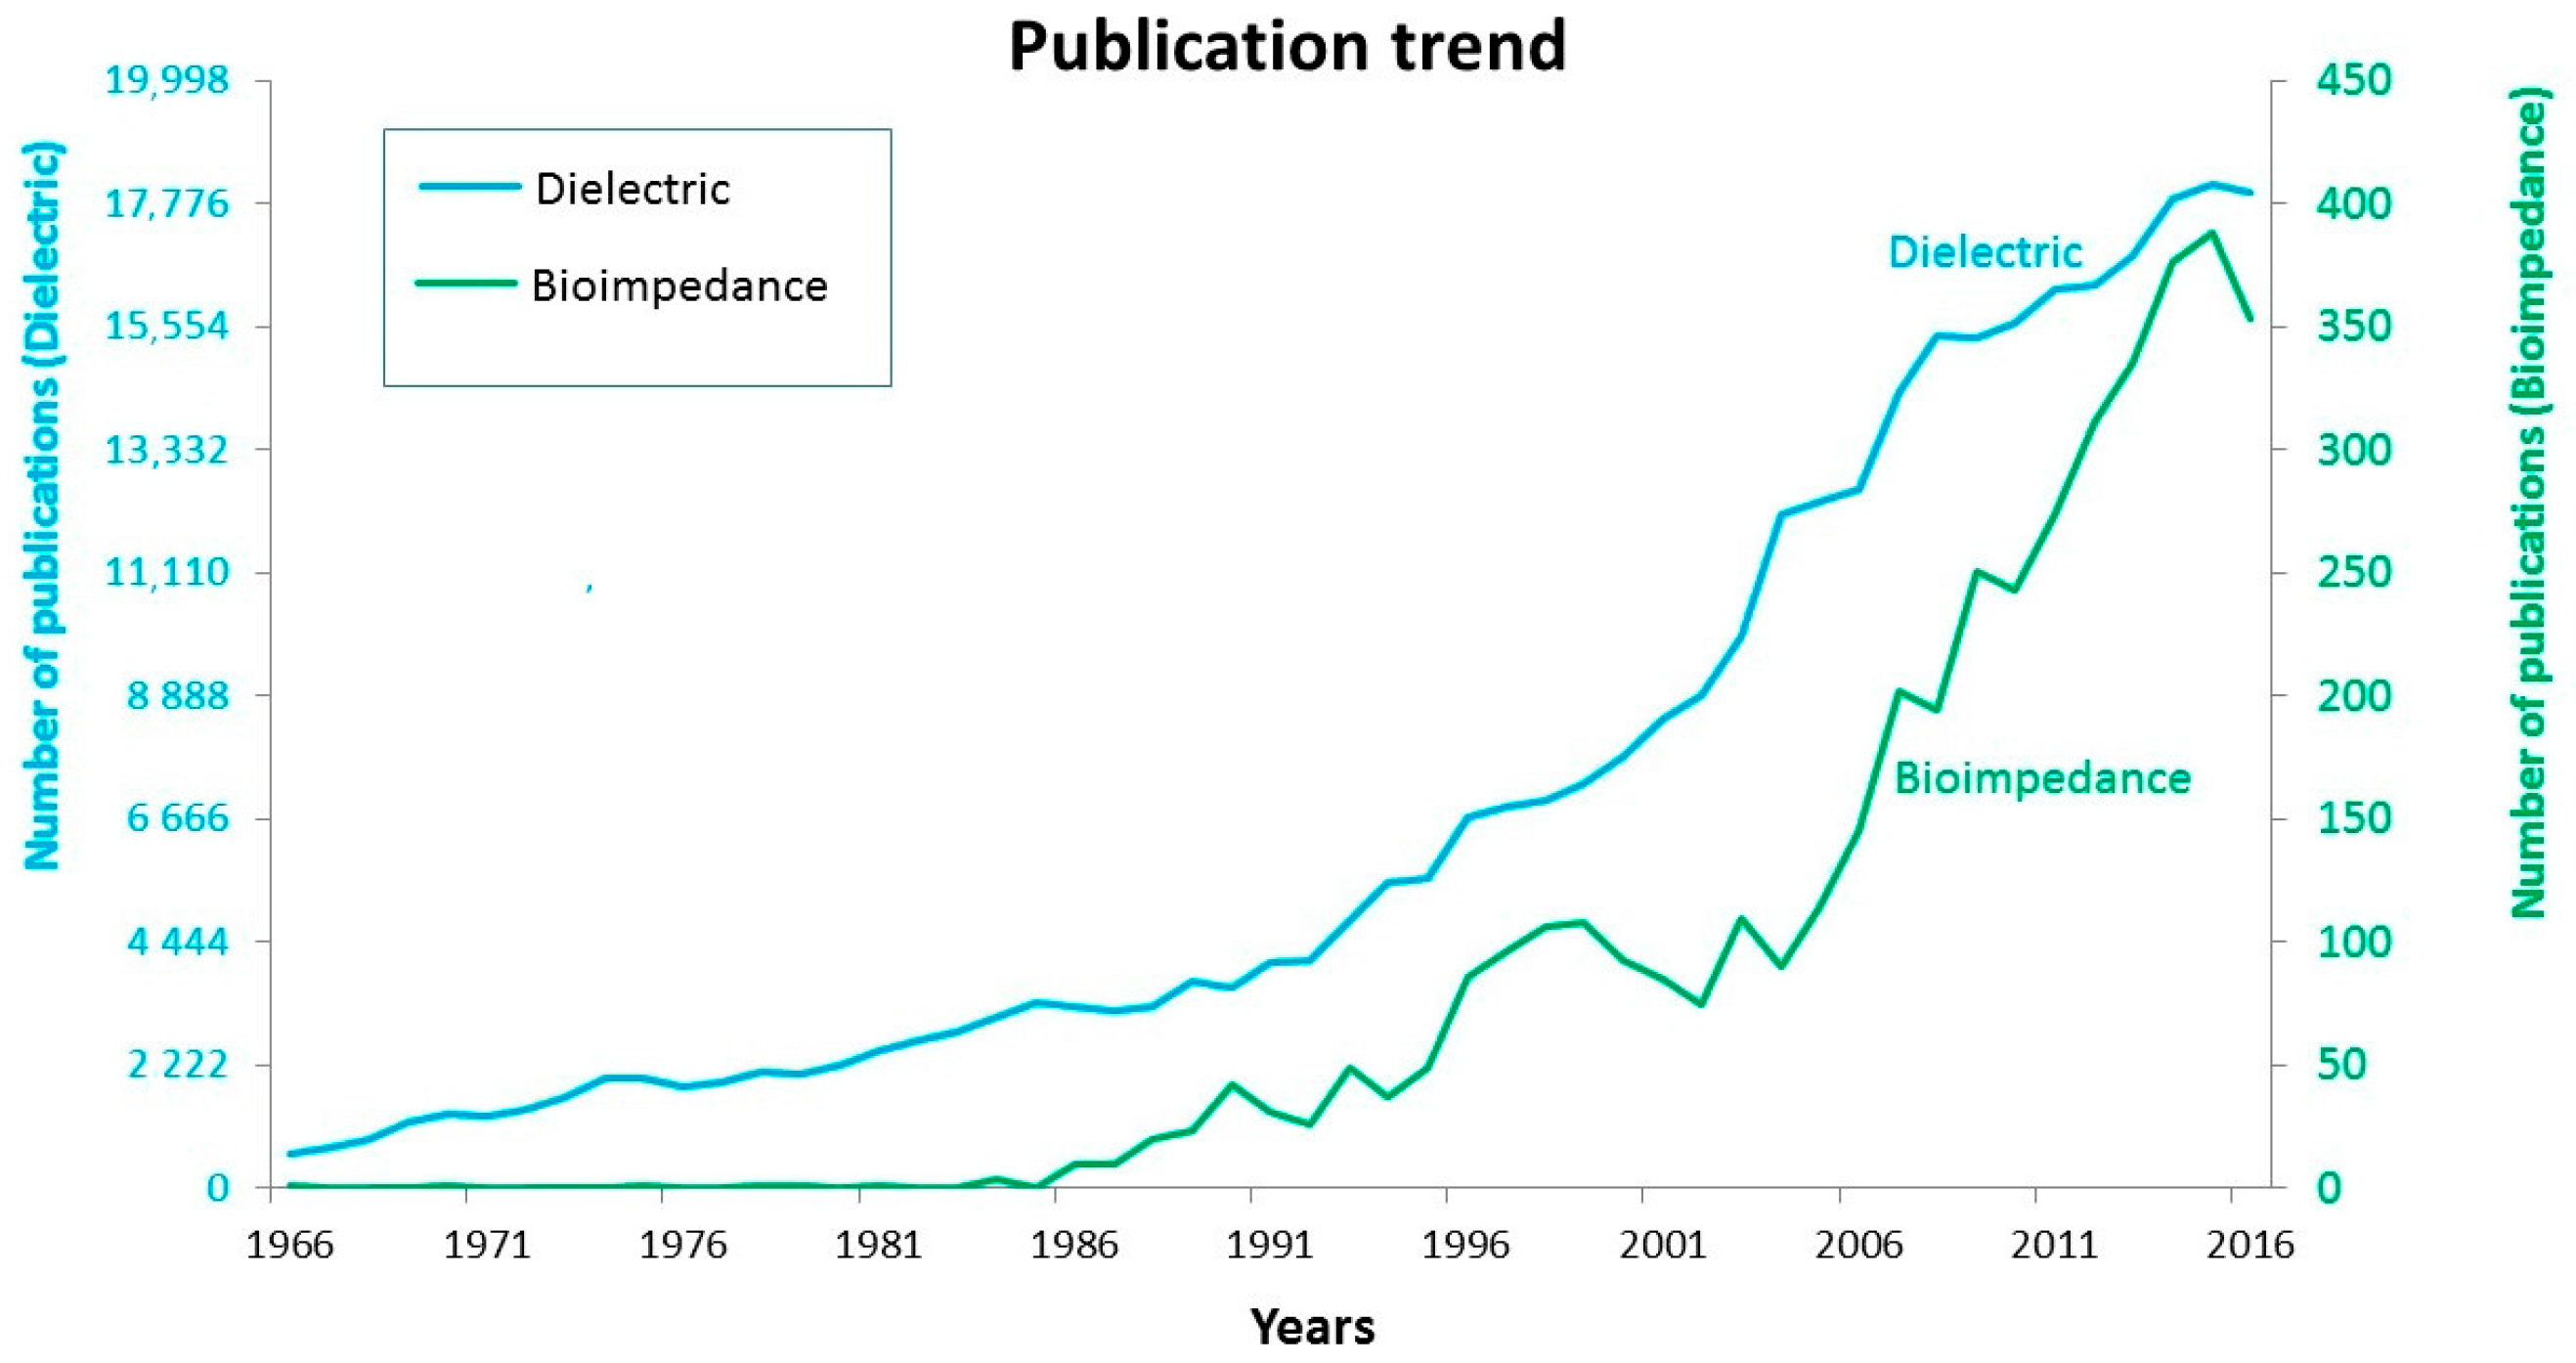
In dielectric spectroscopy, the earliest available publication dating to 1893 reflects the significant interest in this field since that time. Similarly, for bioimpedance, the same pattern is observed where only a very few publications were produced in the early years A transient phase can be detected up until 1921 with 11 publications, and since then the numbers have risen continuously every year to reach 100 in 1949, 1201 in 1969, 7815 in 2000 and 17,979 in 2016.
For bioimpedance, although the first publication was in 1966, the years following this show few recorded documents on this topic. A considerable increase is noted in 1986 with 10 documents and the numbers kept doubling from year to year to reach about 353 in 2016. The rate of growth can be seen in a graph using logarithmic scale.
The analyzed documents, in terms of time evolution perspective are shown in Figure 2; for comparison purposes, the graph restricts results to the common publication years. Thus, the starting year considered is 1966 when the first bioimpedance publication took place and it can be clearly seen that both techniques are follow a similar increasing publication pattern. However, there is an interesting difference in numbers as dielectric spectroscopy keeps realizing higher values every year. For instance in year 2006, 146 publications are recorded for bioimpedance comparing to 12,608 for dielectric, the graph has different scale for dielectric on the left and bioimpedance on right. Year 2015 witnessed the maximum number of publications for both techniques with 388 and 18135 publications for bioimpedance and dielectric terms, respectively. This reveals that there is large discrepancy between both trends which cannot be reduced easily, while both have very similar increasing patterns.
3.3. Publication Distribution by Countries and Institutions
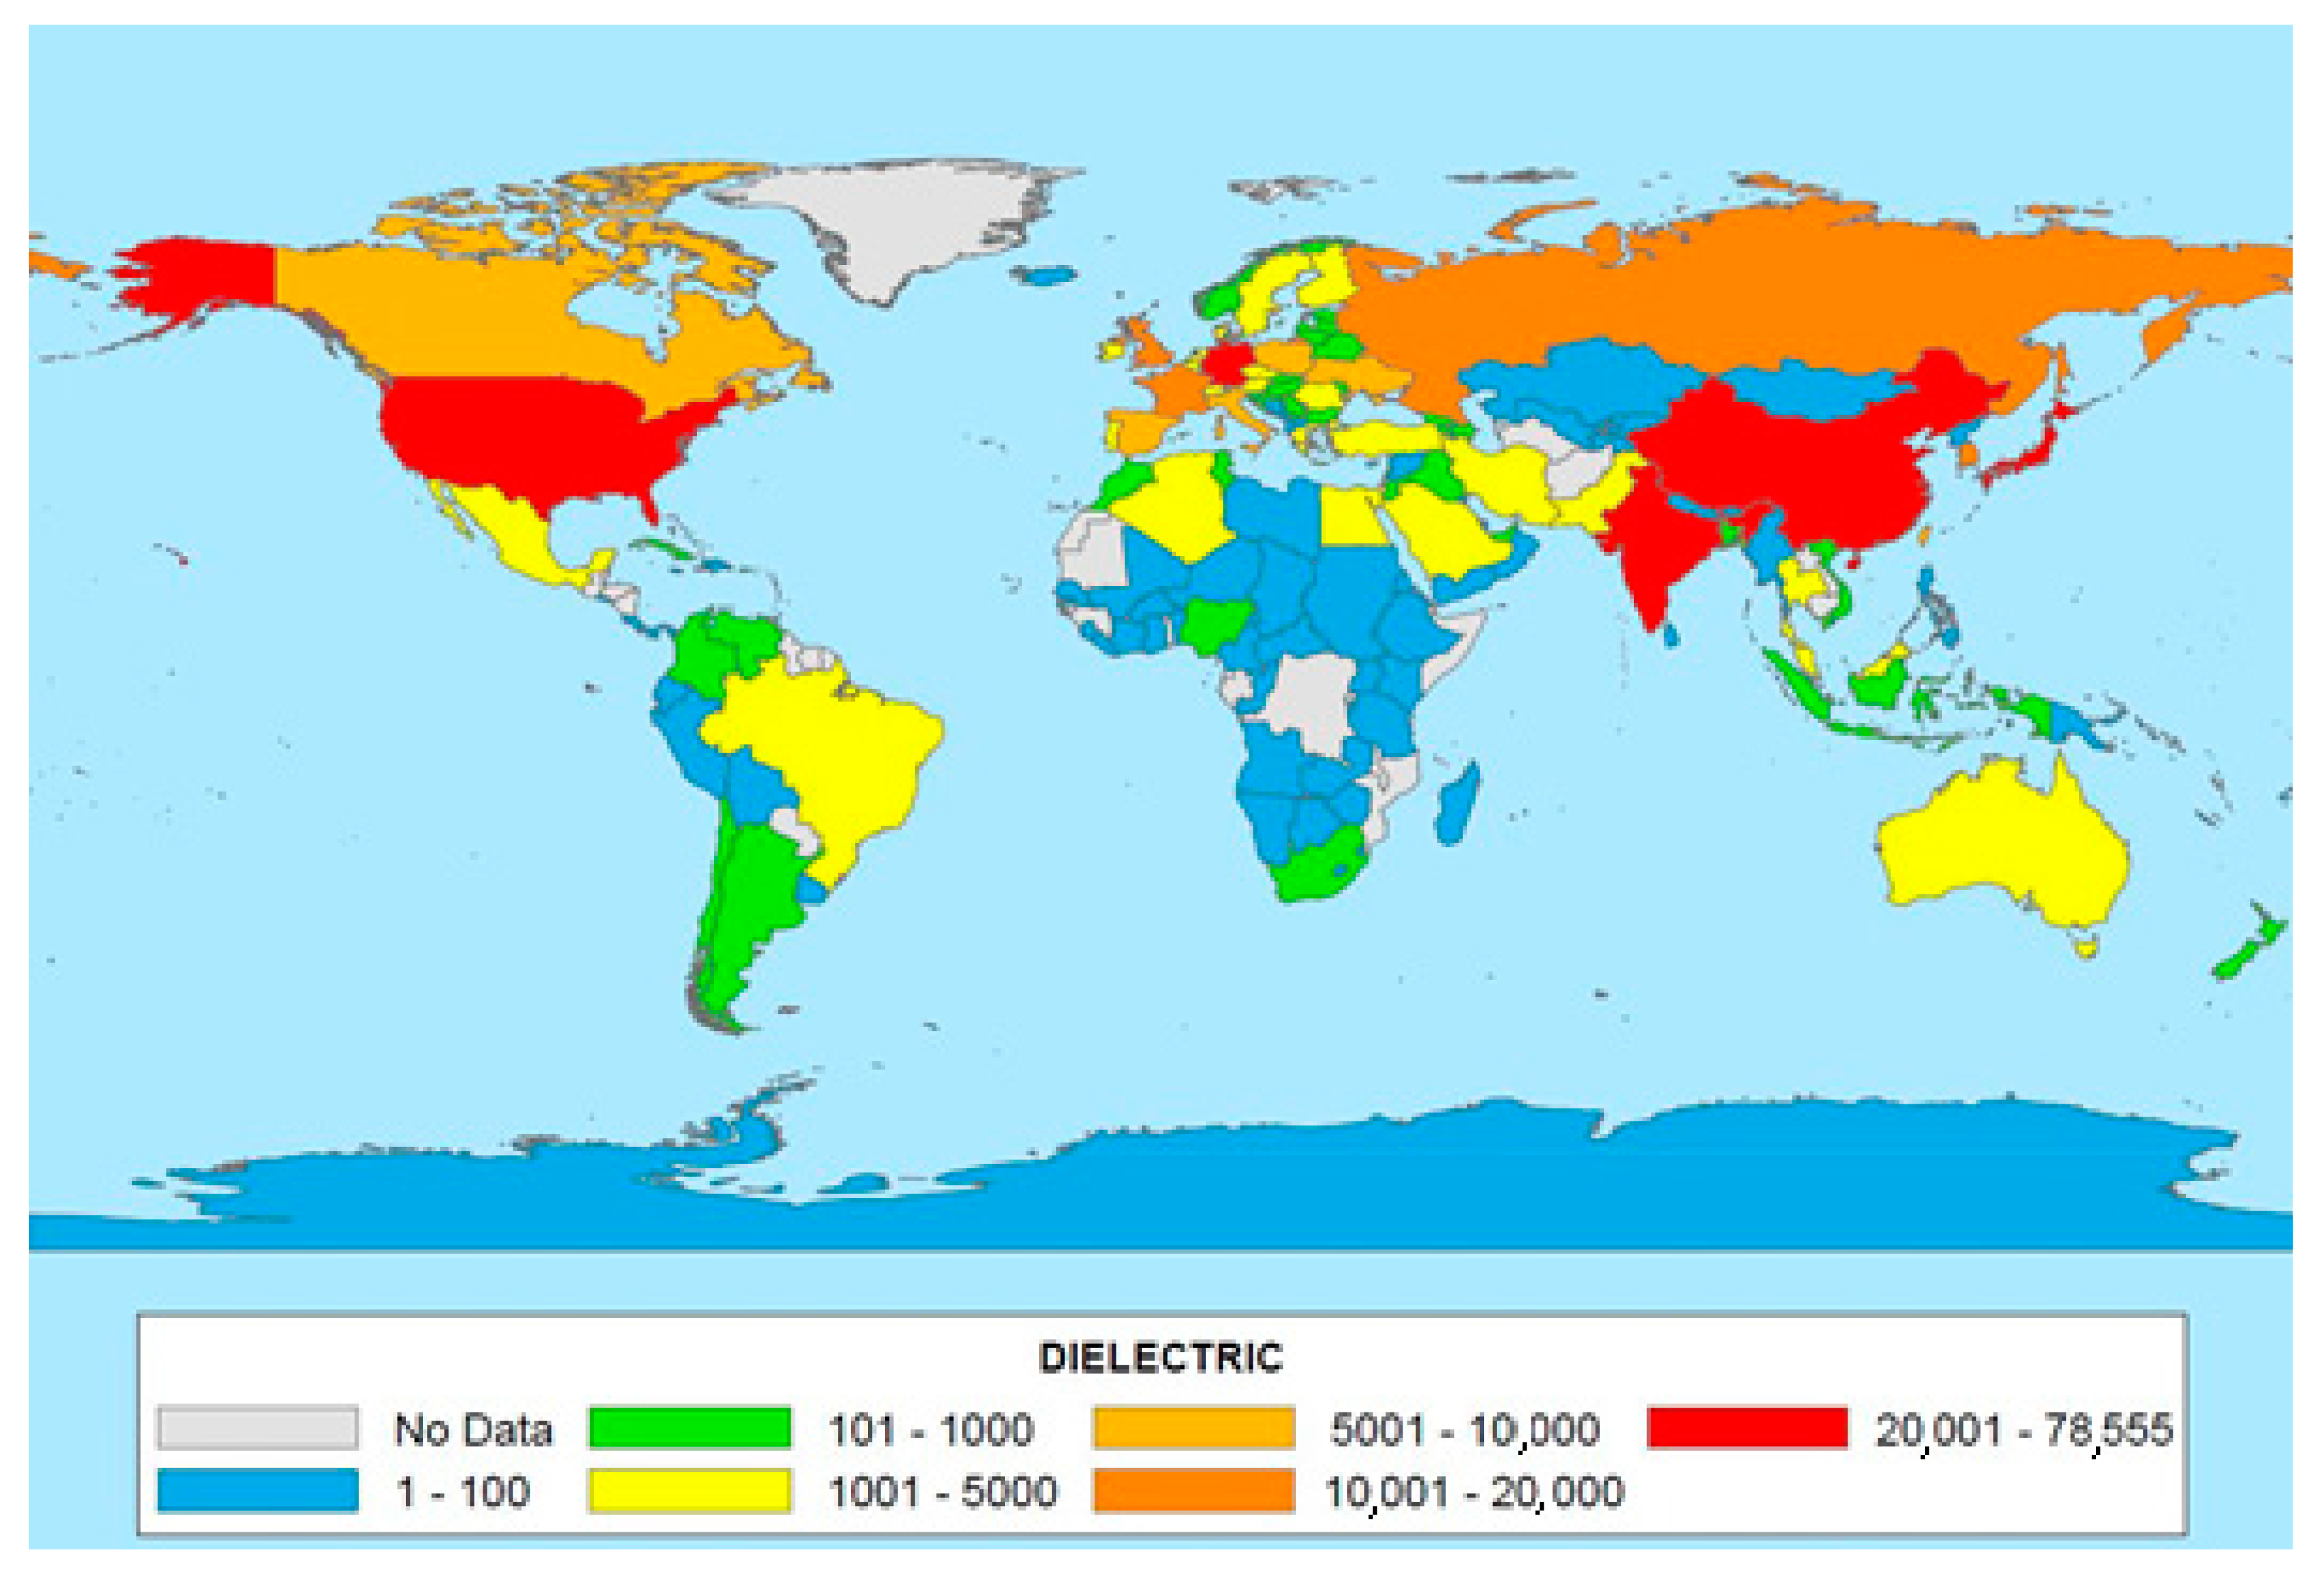
Worldwide development in dielectric spectroscopy research is mainly centered in the United States; where about 78,631 total publications concerned with dielectric studies are recorded. It is evident that all the necessary technological techniques and measurements systems are available in such a developed country, which helps in conducting the various experiments and funding research laboratories to produce a considerable amount of results. Notably, China seems to have great interest in dielectric spectroscopy as well, and is making appreciable efforts to improve dielectric research; it recorded 44,255 publications up until 2016. Among the top 5 countries, are Japan, India and Germany with 28,831, 22,302 and 20,386 publications, respectively. Some other countries such as France (16,762), the Russian Federation (15,177), United Kingdom (15,043), South Korea (13,866) and Taiwan (9327) have made significant contributions to the field of dielectric spectroscopy as well, see Figure 3.
Regarding bioimpedance spectroscopy, the United States also leads in this area. It is clear that this country leads the international research in this field with 850 published documents, while United Kingdom and Spain come next with approximately less than half of this number (336 and 326, respectively). Germany and Italy with 319 and 315 published documents respectively, reside among the top 5 publishing countries as well. Brazil, Australia, France, Sweden and Poland are next with 326, 180, 175, 141 and 131 publications, respectively. Figure 4 is a graphic representation of the distribution of studies worldwide.
When looking at the affiliations of the publications, it should be noted that Scopus will direct us to each of the categories we are looking for, and it automatically, takes into consideration, and calculates all the different authors publishing in a particular institution. Thus, any publication will be counted appropriately when comes to authorship and affiliations.
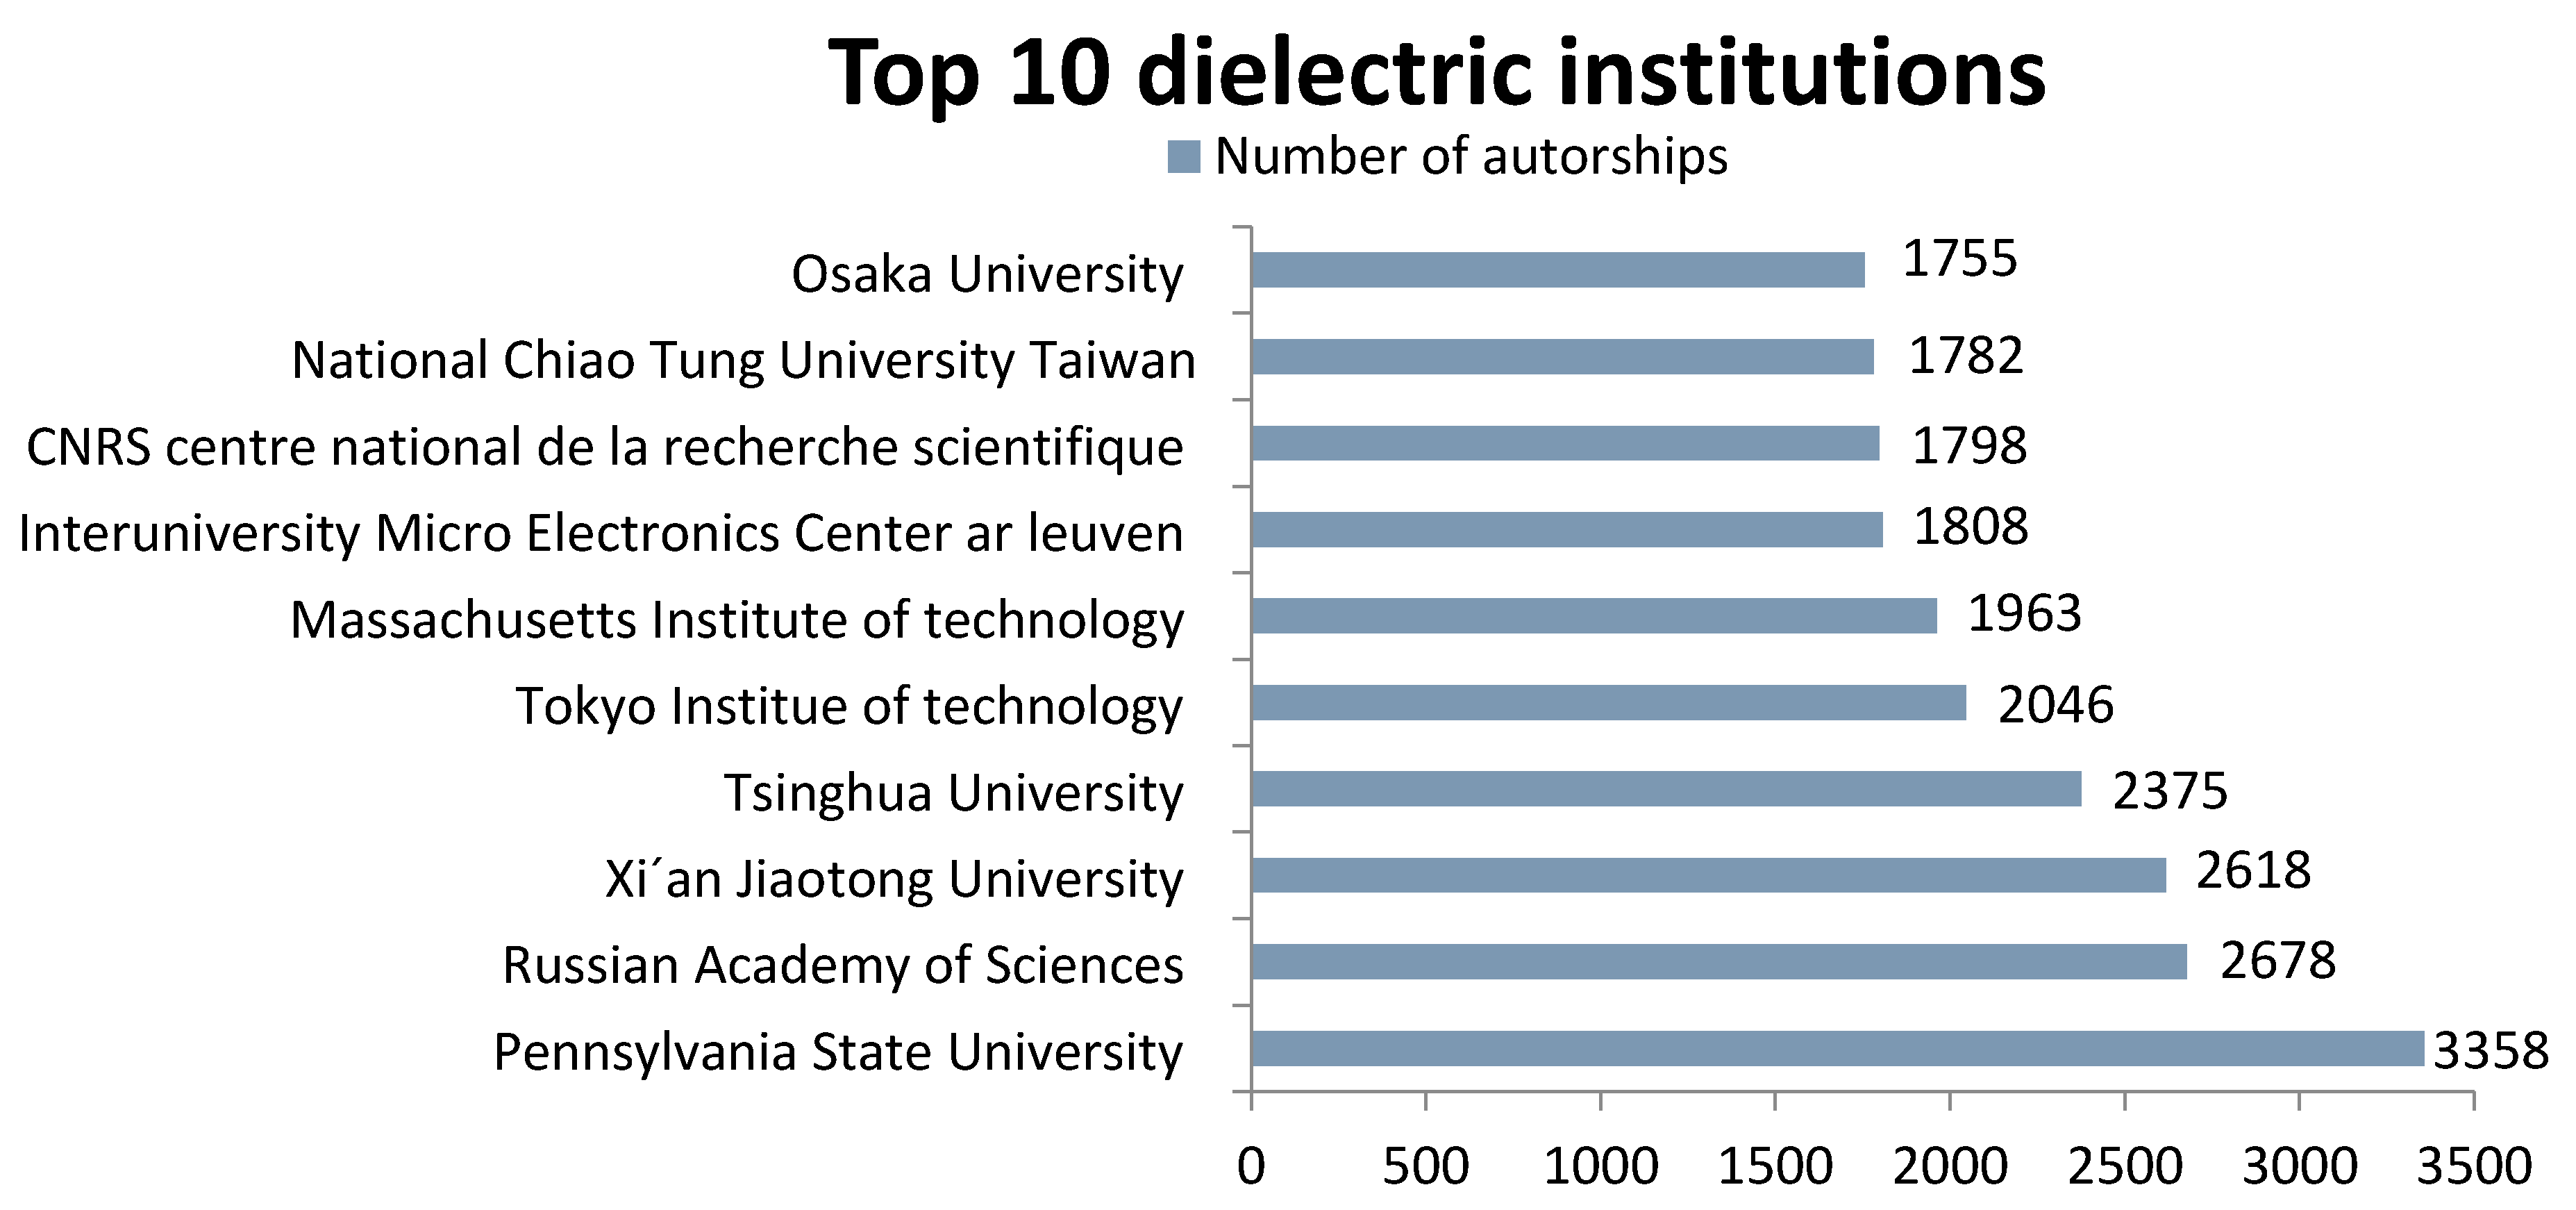
The results show that the most yielding institutions in dielectric studies are Pennsylvania State University with approximately 3358 documents followed by the Russian Academy of Sciences which also plays a dominant role in the dielectric spectroscopy scene with 2678 publications. Next, o significant numbers are displayed by Xi’an Jiaotong University (2618), Tsinghua University (2375) and the Tokyo Institute of Technology (2046) (Figure 5).
On the other hand, the most prolific institutions in bioimpedance publishing are the University of Queensland that scores 89 publications, Universitat Politecnica de Catalunya (83), Tallinn University of Technology (71), Universidad de Sao Paulo USP (58), and Rheinisch-Westfalische Technische Hochschule Aachen (52) (Figure 6).
In looking at the evolution in publication trends for these universities (Figure 7), results show that institutions recorded with top scores 10 years ago have not been consistent. Although the first published document on bioimpedance refers to Beckman Coulter University in California, this has remained the only document produced in this area. The top-ranking universities have changed in the past years, but in the last ten years the universities with the most active, ongoing research and publications have been consistent. For instance, the Russian Academy of Sciences did not initiate its first publication in dielectric research study until 1992, with 5 documents, but has boosted its research to achieve about 120 documents in 2015. The same applies for the University of Sao Paolo which was not among the top universities until last five to six years ago when it witnessed a significant boost.
It is interesting to have a look at the international collaborations between these institutions and other laboratories and investigational centers. According to the results, the University of Queensland, the top-ranking publishing university collaborates with the University of Sydney (about 32%) and the Queensland University of Technology QUR (27%). Pennsylvania State University has collaborated with Harbin Institute of Technology, Xi’an Jiatong University, the University of Edinburgh, the University of Puerto Rico, North Carolina State University, TRS Technologies and Intel Corporation.
3.4. Distribution of Output in Subject Categories and Journals
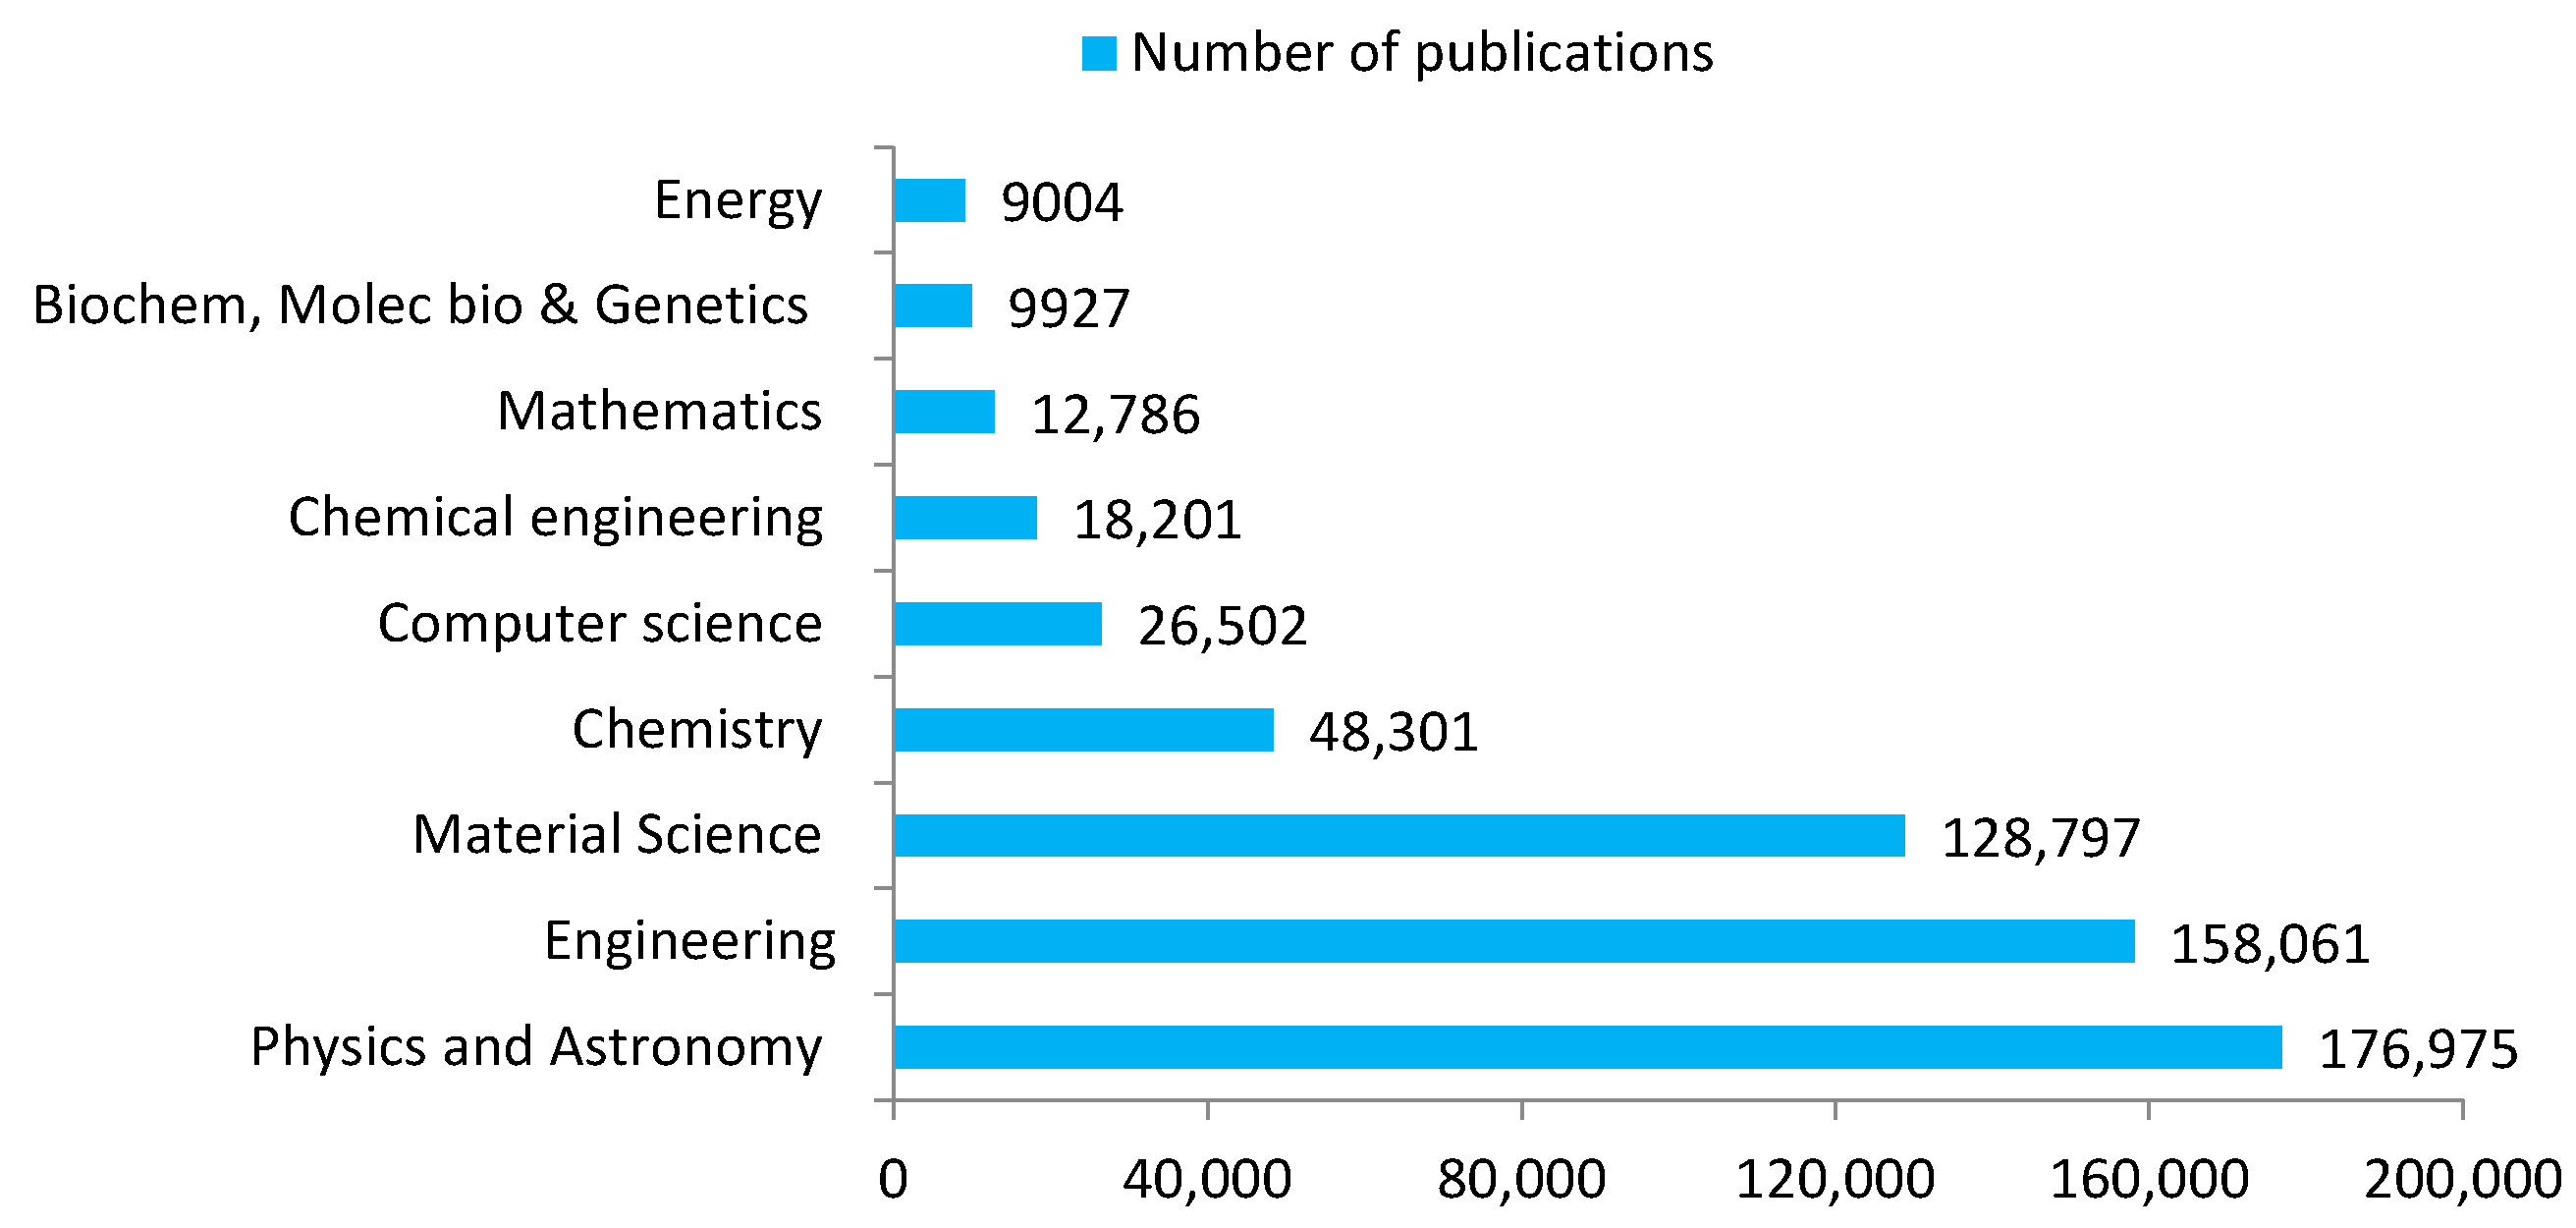
A classification depending on subjects that coexist with dielectric subjects is presented in Figure 8. Concerning dielectric spectroscopy, physics and astronomy account for approximately half of the published work in this area, that is, 50.7% corresponding to 176,975 documents. Engineering and material science subjects are close with 45.2% and 36.9% (158,061 and 128,797), respectively. Other relevant subjects are chemistry (13.8%), computer science (7.6%), chemical engineering (5.2%), mathematics (3.7%) and energy (2.6%). Agricultural and biological sciences account for less than 1%. Clearly, t physics is consistently at the first level until engineering comes to put the theory into practice.
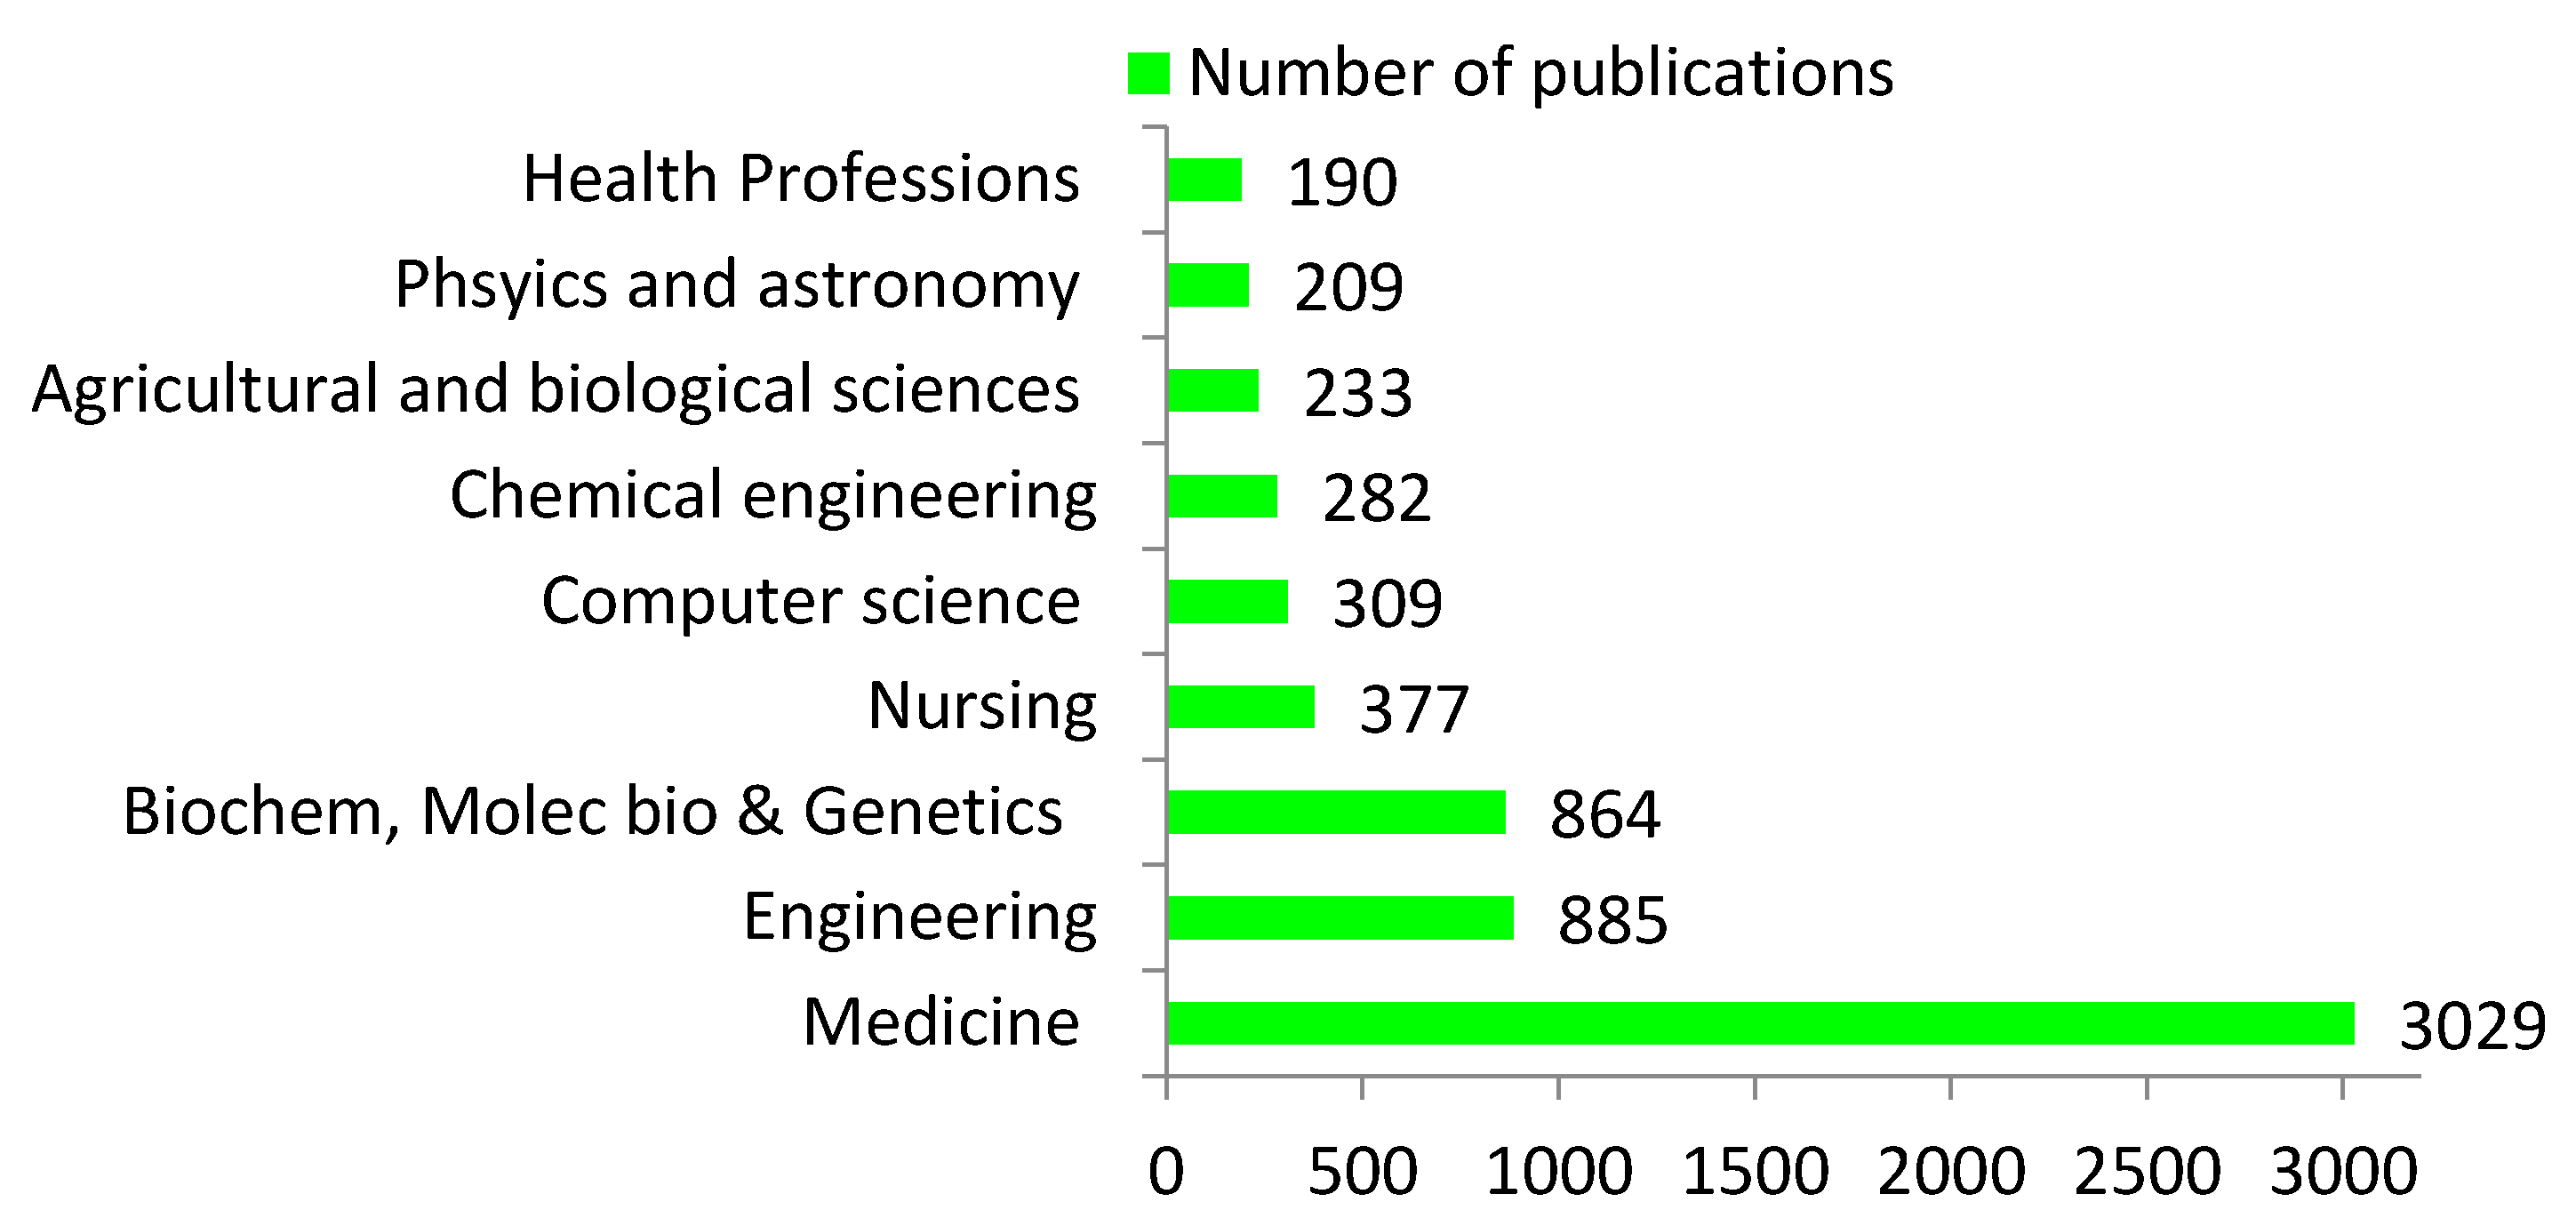
Figure 9 presents a similar classification for bioimpedance spectroscopy. Not surprisingly, medicine accounts for 69.8% of the subjects related to bioimpedance; hence, it appears in 3029 documents and reflects the historical commitment of bioimpedance spectroscopy to several medical diagnoses and cures. The second predominant group is engineering which covers 20.37% (885 documents). A very approximate value is recorded for biochemistry, genetics and molecular biology (864 documents, 19.89%). Other relevant subjects are nursing with8.7% (377 documents), computer science with 7.1% (309) and chemical engineering with 6.5% (282). The agricultural and biological science subject relevant to our study objective, records only 5.4% (233). The other subject areas are a small minority and not worthy of further considerations. It is important to mention here, that a document on Scopus might fall under more than one subject category which explains that the total number of documents in the distribution of subject area is greater than the real total publication. A quick analysis of the number relates to the aim of the manuscript. It is evident that engineering fields have taken much advantage of both dielectric and bioimpedance techniques, thus much engineering research areas has been developed based upon these approaches. Engineering is ranked second in both area, with 45.2% and 20.37%, respectively which implies that considerable research is conducted. These applications can be applied into biomedical engineering for bioimpedance, as well as electronic and industrial engineering for dielectric spectroscopy.
The list of the top 10 journals where studies on dielectric and bioimepdance were published is listed in Table 1 and Table 2, respectively. The Journal of Applied Physics leads the publication list with more than 8070 documents published since 1931. It shows a continuous, increasing publication trend (it reached its peak in 2009 with 433 articles). As well, the United States shows an obvious record of 3168 (39.26%). The Journal of Applied Physics Letters ranks second with 7199 documents and shows a similar incremental pattern as well. It reached its peak between 2007 and 2008 with 541 and 549 publications respectively. The third rank is occupied by Physical Review B Condensed Matter and Materials Physics with 3846 documents in physics and astronomy and material sciences.
For bioimpedance publications, the Journal of Physiological Measurement appears on the top of the list with 114 documents. The Journal of Physiological Measurement covers quantitative assessment of physiological functions in clinical research. Its publications started k to 1998 with only 2 studies and reached its peak within 10 years in 1998 with 17 publications. This journal publishes in the areas of biochemistry, genetics and molecular biology and partially in medicine. With 77 documents, the Journal of Physics Conference Series commenced in 2010 with an extensive output of 32 publications that declined two years later but increased again in 2013, totally in physics and astronomy. The Journal of Critical Care Medicine is ranked third with 58 publications and has trended up and down since 1986.
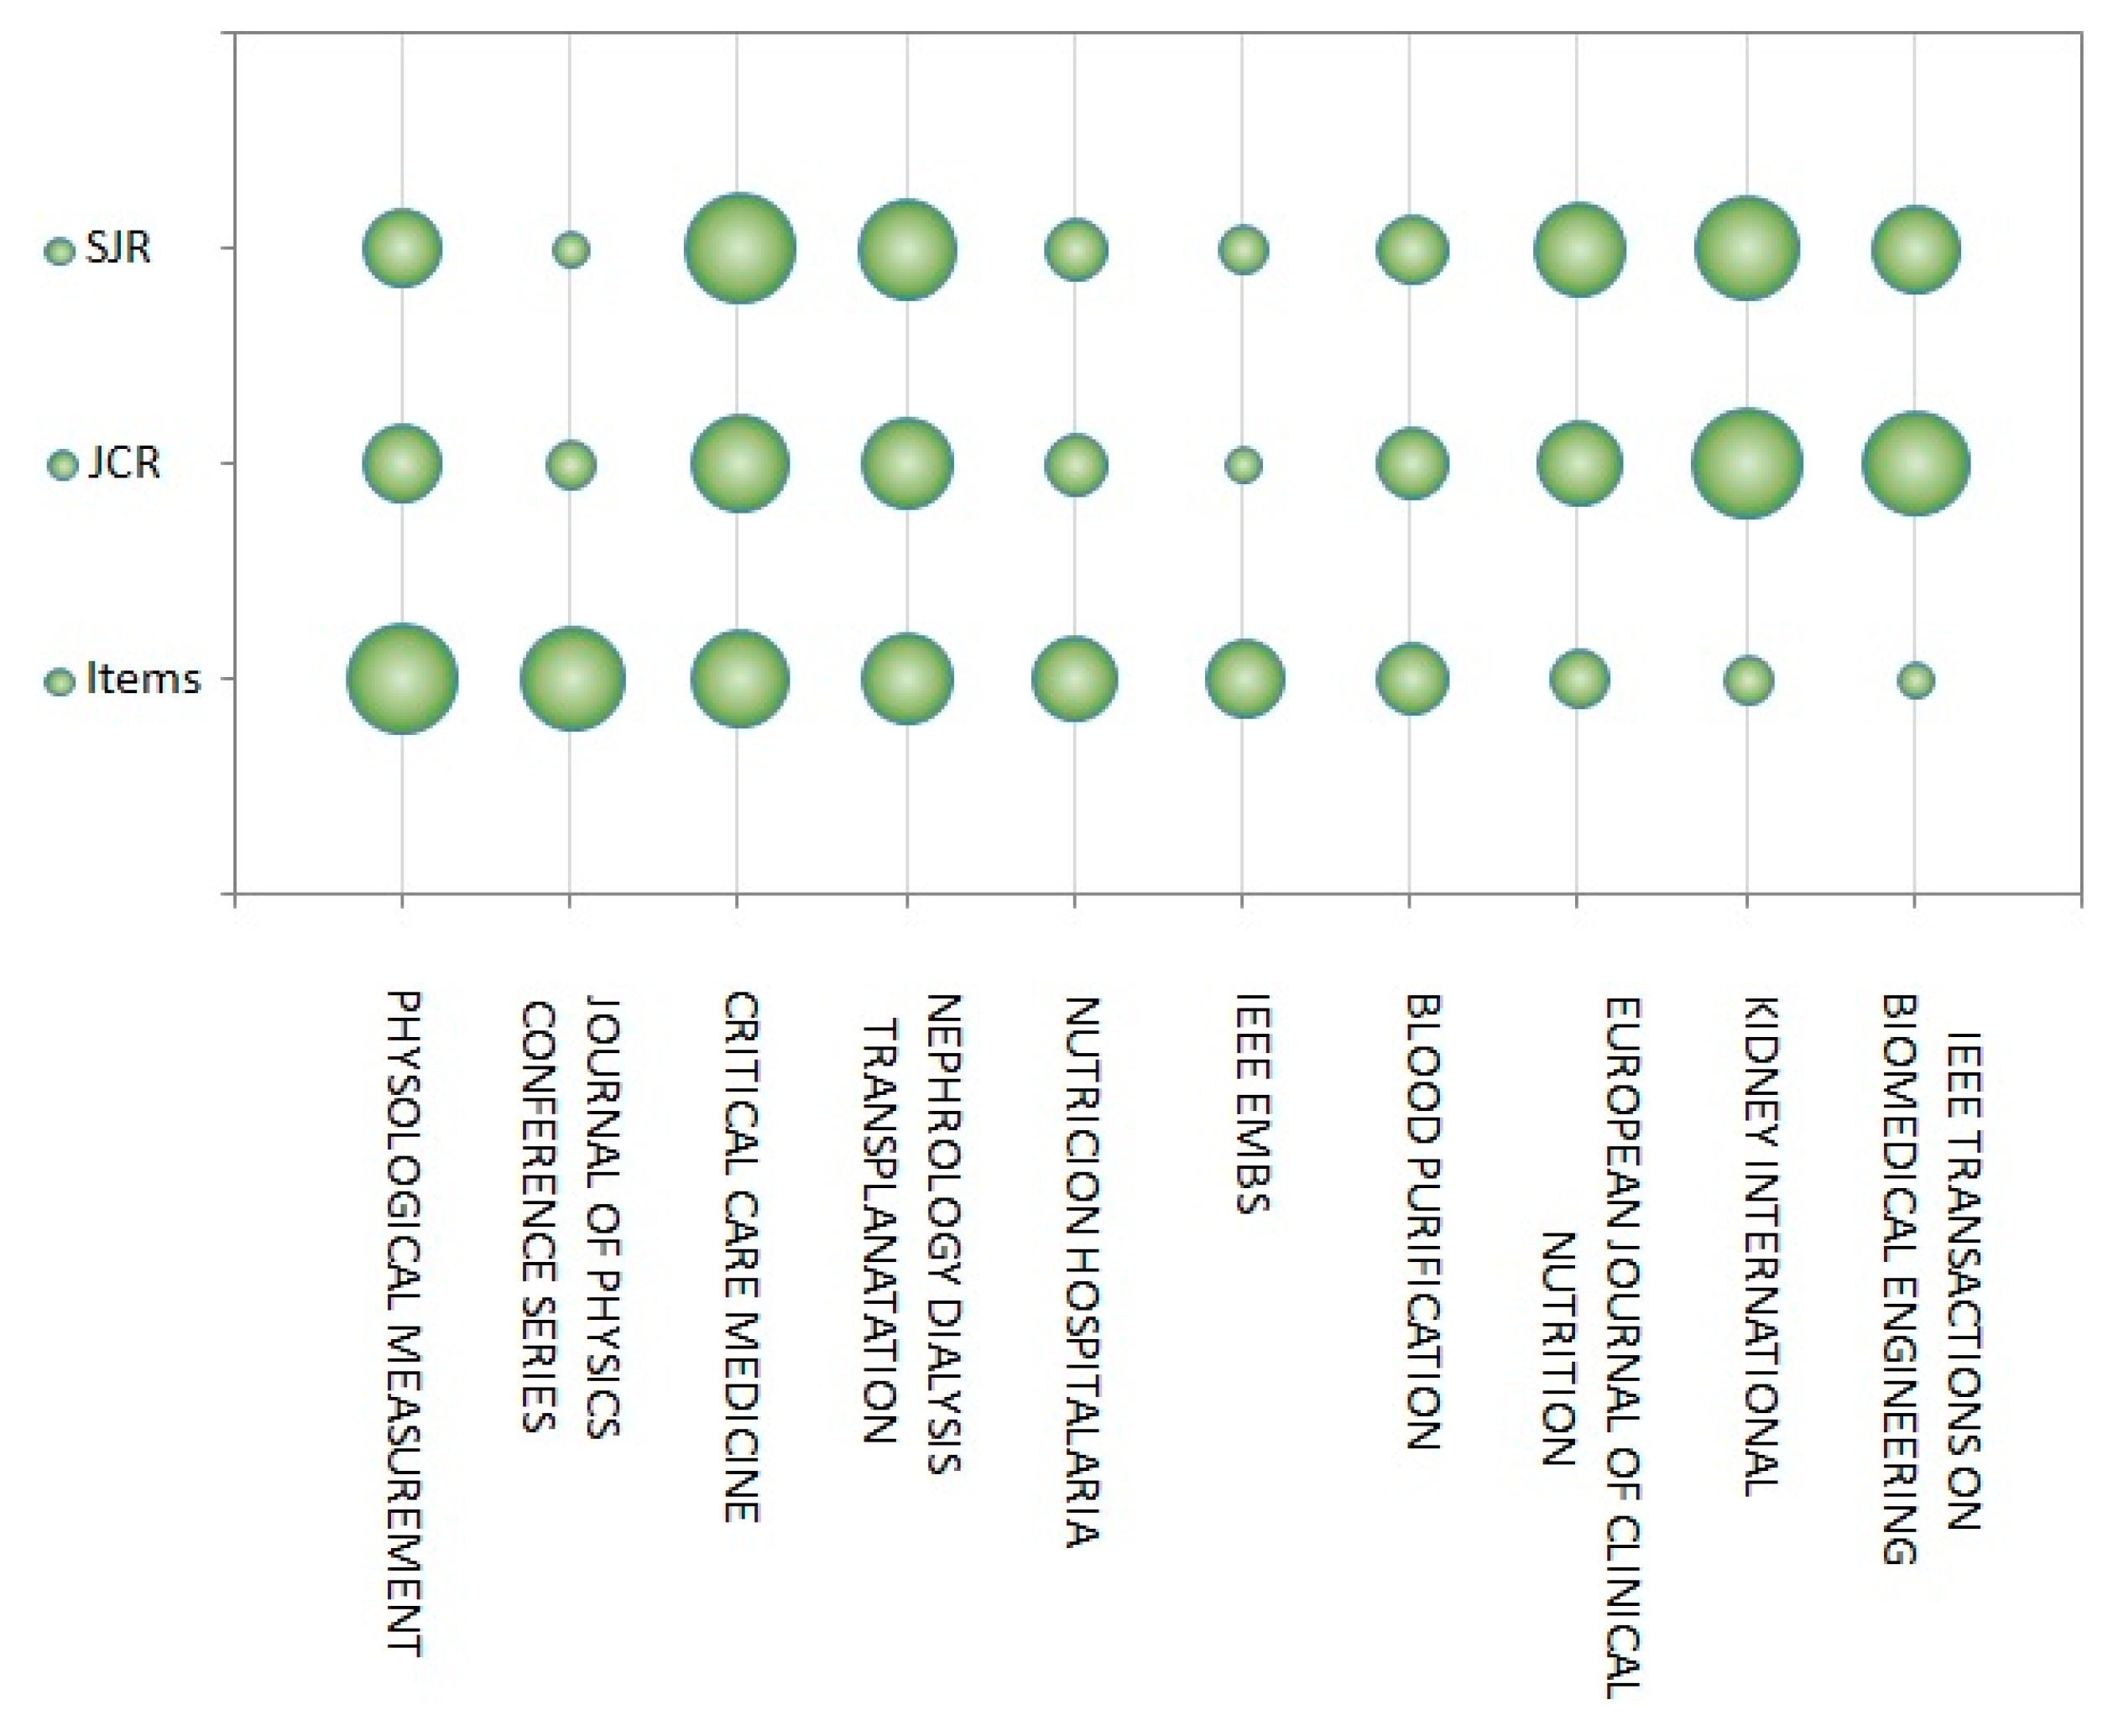
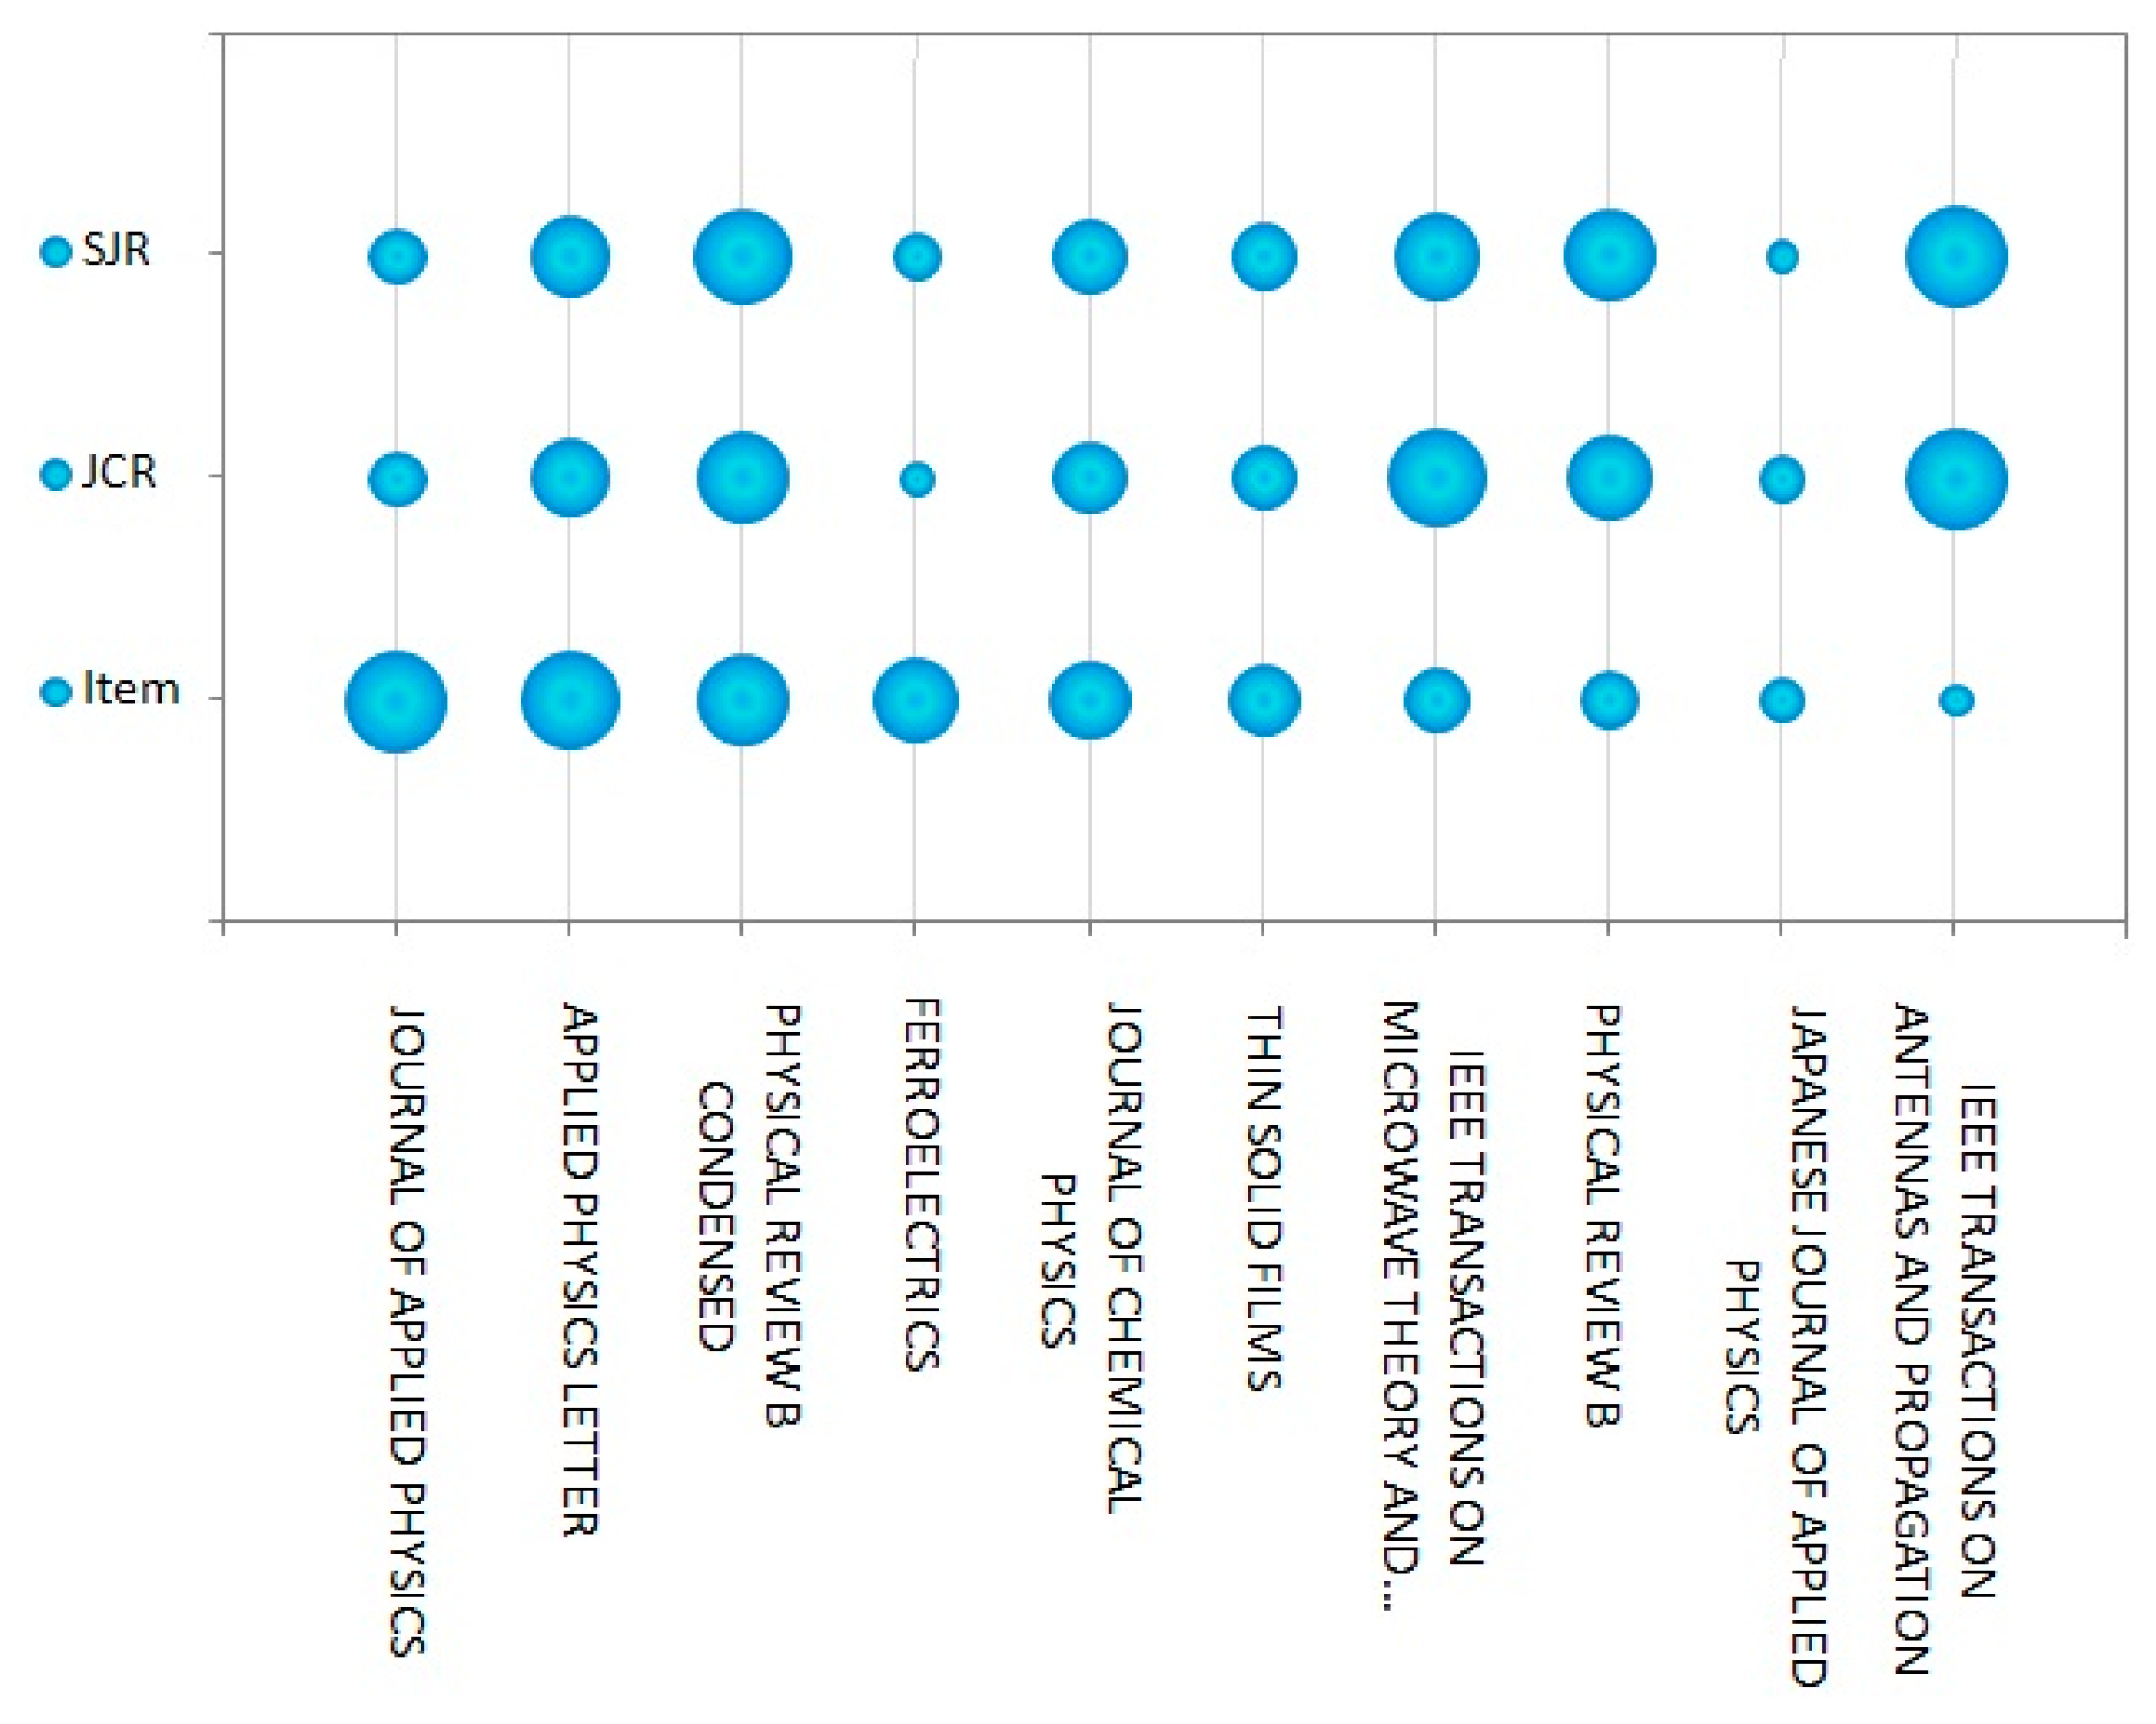
The journals’ details in terms of cite score, Scimago Journal Rank (SJR), Source Normalized Impact per Paper (SNIP) and publisher are listed in the Table 1 and Table 2. For further analysis, an illustrative dissection of these journals according to 3 parameters is presented in Figure 10 and Figure 11 for dielectric and bioimpedance, respectively. The numbers of publications of these journals, their Journal Citation Report (JCR) set by Thomson Reuters and the SJR by Elsevier define their position.
3.5. Analysis of Author Keywords and Index Keywords
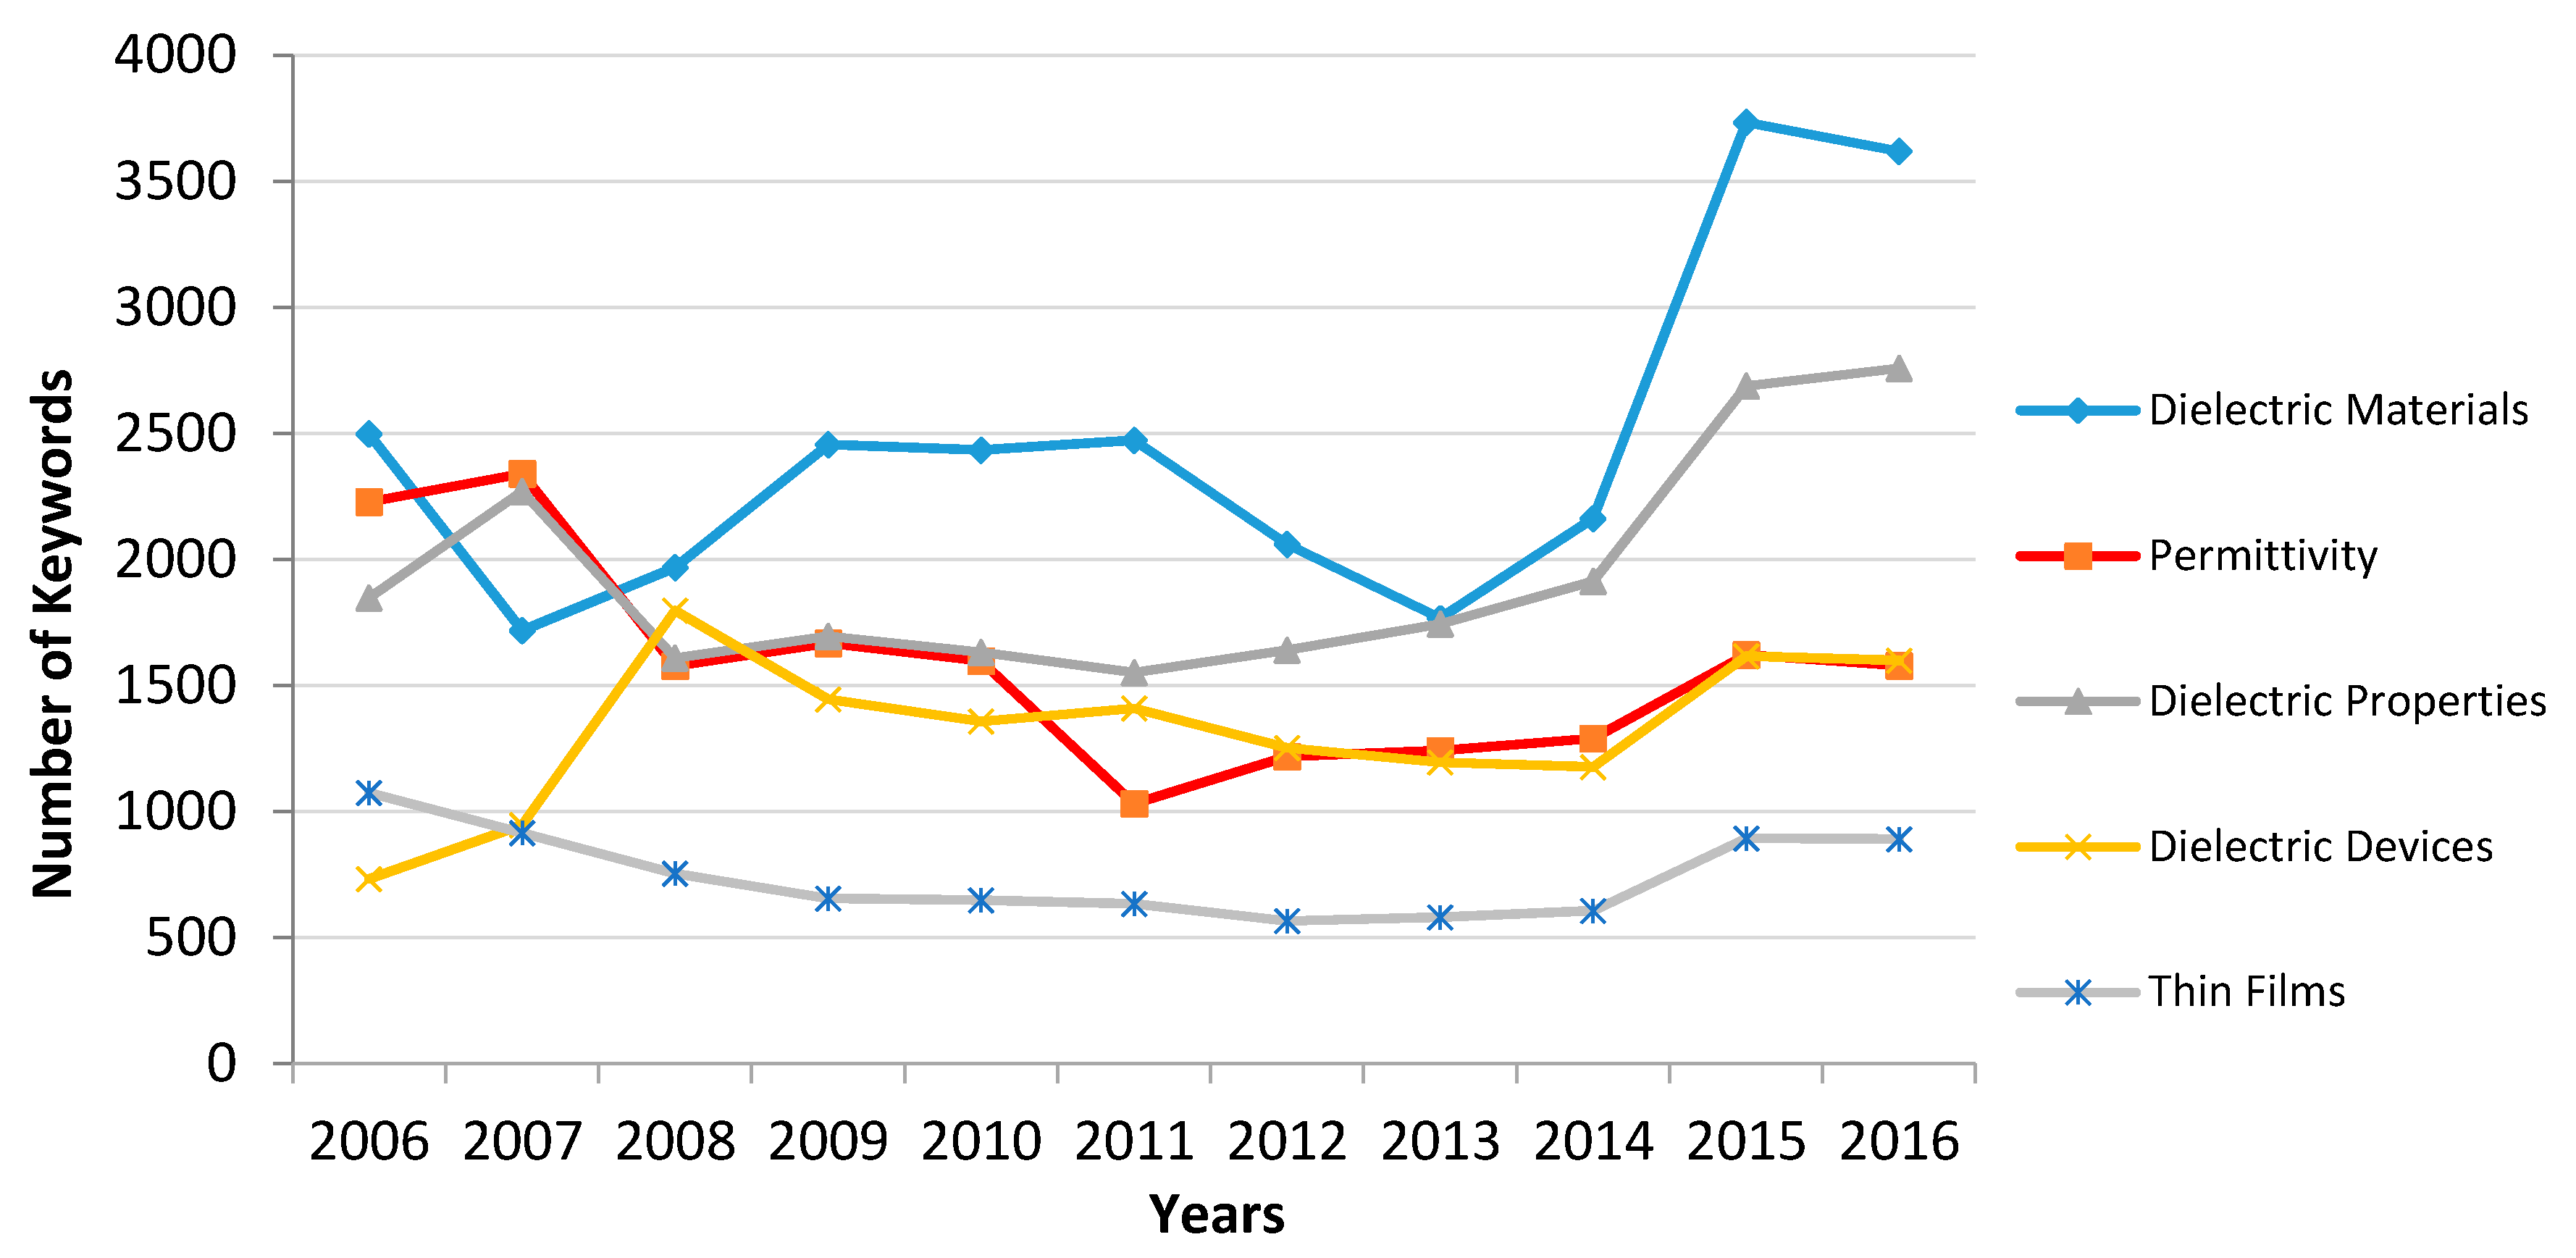
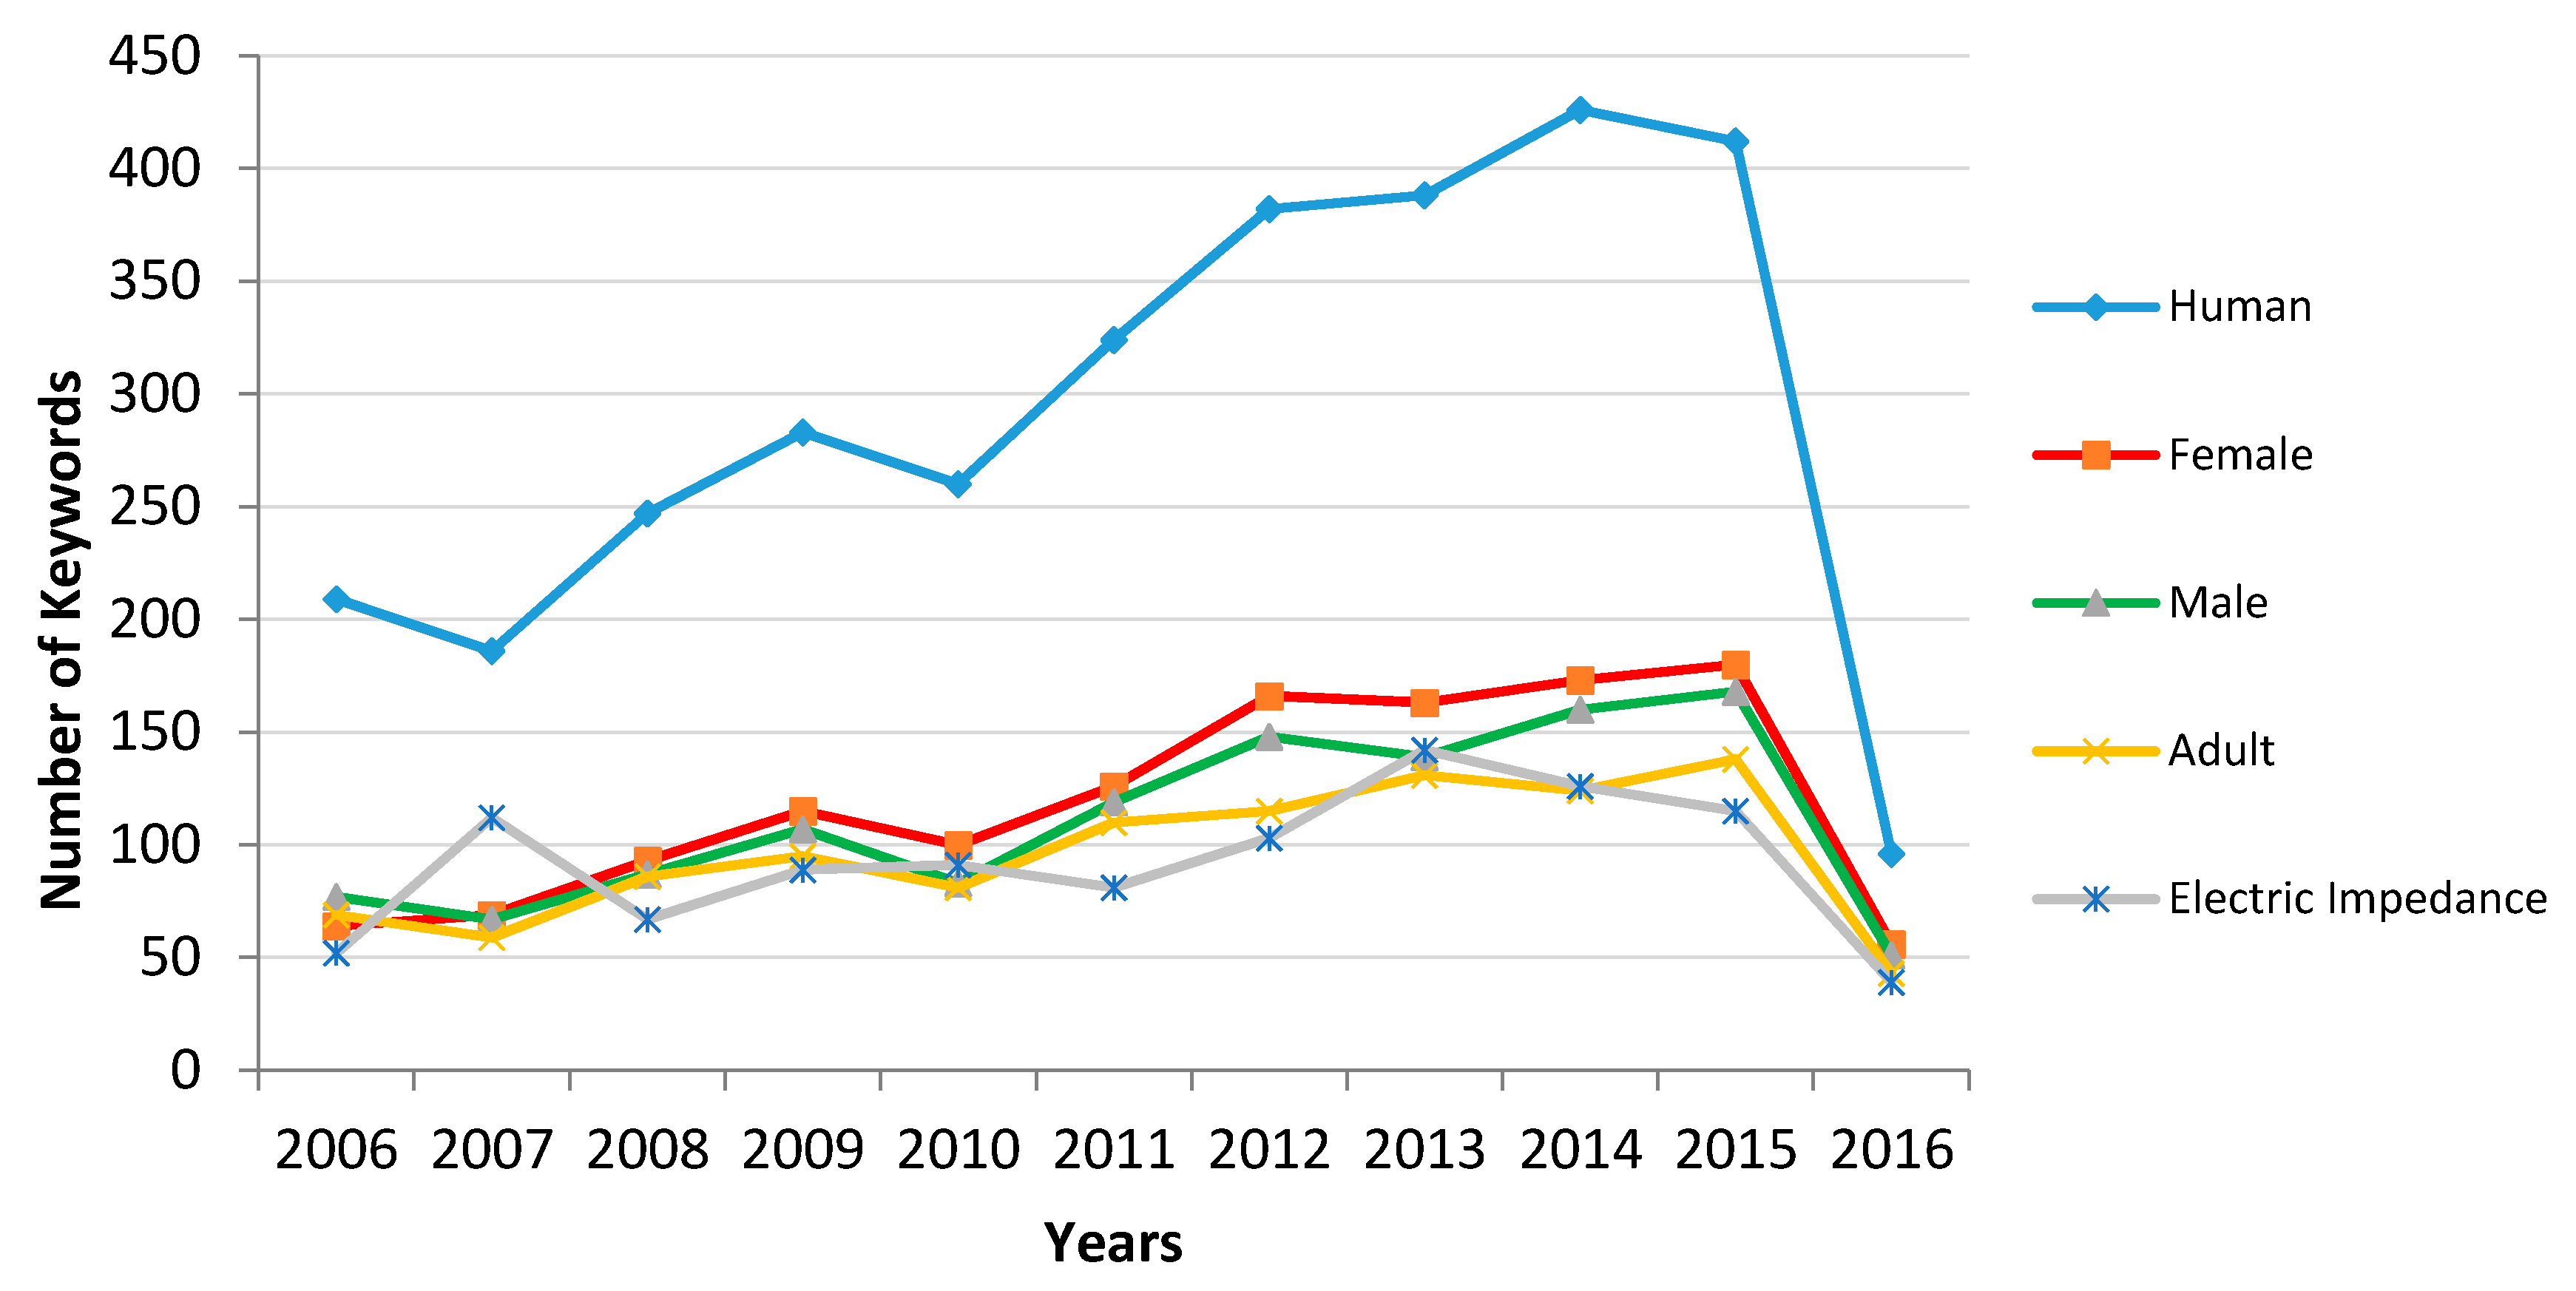
Following the research trend in the engineering and science areas and seeking updates in the evolution of investigation in these fields required keyword analysis in published research papers [49,50]. For the objective of finding the total number of keywords used, a refined process is applied in the Scopus exported data. The top 30 keywords used in dielectric are listed in Table 3. “Dielectric material”, “permittivity” and “dielectric properties” are ranked as the first three items with 50,033, 36,469 and 31,383 items, respectively. Table 4 shows the first 30 keywords most used in publications. The fact that a keyword such as “human” or “humans” is detected as different versions of the same word raises the issue of different versions of the same concept word. Among the 4344 publications, and throughout the whole period being investigated, “human” appeared to be the highest ranking keyword with 2722 appearances, the word “article” appears 2365 times. Graphs in Figure 12 and Figure 13 show a perspective of the evolution of the most dominant keywords throughout the last 10 years for dielectric and bioimpedance studies, respectively.
4. Discussion and Conclusions
This work examines data pertaining to electrical characterization using dielectric and bioimpedance spectroscopy from 1893 to 2016, and 1966 to 2016, respectively. The total contributions reached 349,315 in dielectric and 4343 in bioimpedance under more than 20 categories. The non-destructive aspect of bioimpedance measurements using advanced techniques, and for dielectric spectroscopy as well, has pushed research further in the last decades and this is reflected in the exponential rise in publication for both spectroscopy techniques, in particular, in the fields of medicine for bioimpedance and engineering science for dielectric. Most of the work was published in international journals and conferences proceedings, English being the dominant language. The majority of publications comes from the United States and China. This might be due to their large geographical area, and thus, the abundance in available universities in these countries. The United Kingdom has a relevant role next to other European countries such as, Germany, Spain and France.
Regarding the document type, both techniques are most published in journals, in articles (more than 70%) and conferences papers come next with 19% and 26% for bioimpedance and dielectric, respectively. Convincingly, English is the most used language in more than 90% of the total publications; today English is the universal language of conducted scientific studies in various fields and a decent level of English is required in most international journals.
Results showed that dielectric spectroscopy dates 73 years earlier than bioimpedance. While the first technique was first described in publications in 1893, bioimpedance studies were first written about in 1966 with very a small number of publications until 20 years later when the number of documents increased to around 4–5 dozen. Meanwhile, dielectric publications are increasing non-stop with more than 600 publications in 1966 which is more than bioimpedance in its peak year of publication (388 in 2015). Not surprisingly, in both fields, the United States ranks number one in publications as this country holds an immense capacity for conducting research experiments and investigation studies of technological techniques. Hence, top ranking universities are the ones in the United States, providing all the financial and scientific requirements for technological improvement. Clearly, the United States is working in parallel to progress the investigational process through its research and developments centers and providing improved technological techniques. Notably, the top-ranking universities in both fields are not listed consistently in the primary ranks throughout the years; some universities that started their research on bioimpedance and dielectric have not pursued this research area while the opposite pattern is evident in the behavior of other institutions.
Regarding subject categories, the term bioimpedance has been mostly related to medical concerns, where bioimpedance spectroscopy has been used practically in diagnoses, treatments and cures for a variety of illnesses. Correspondingly, physics and astronomy is the most used subject for dielectric studies and engineering occupies the second rank for both topics with 20.37% and 45.2% for bioimpedance and dielectric spectroscopy, respectively. A quick analysis of the data revealed the relevance of engineering practices in both applications, which supports our interest in evaluating these topics. The International Federation for Medical and Biological Engineering (IFMBE) Proceedings carries the highest repository of bioimpedance publications while the Proceedings of the SPIE, the International Society for Optical Engineering holds this honor for dielectric studies.
In short, a solid investigation was undertaken to examine the state of such studies worldwide, how they started, when, where and what are the common fields of study. Also, it was helpful to conduct a comparable study for bioimpedance studies since most of the materials under test are executed by both techniques. In fact, both techniques rely in the use of electrical properties to assess the properties of materials and we considered this approach as relevant in a bibliometric study as no similar work has been published yet.
The final conclusion of the present work shows that bioimpedance and dielectric spectroscopy are non-destructive techniques that can be advanced by taking advantage of the maturation of technology and expansion of measurement instruments. Engineering research in electronics can benefit from this to realize significant progress in biomaterials characterization and quality detection. It is not surprising that engineering has taken over the physical research for dielectric studies; engineering is a realistic application of physical theories. Both techniques have proven to be relevant measurement techniques with significant future potential in various areas of investigation. Other engineering practices benefit from the evolution of these techniques that deserve investment to enhance engineering research in the future.
Acknowledgments
The authors would like to thank to the CIAIMBITAL (University of Almeria, Ceia3) for its support.
Author Contributions
All authors conceived, designed the search and wrote the paper.
Conflicts of Interest
The authors declare no conflict of interest.
References
- Pliquett, U. Bioimpedance: A review for food processing. Food Eng. Rev. 2010, 2, 74–94. [Google Scholar] [CrossRef]
- El Khaled, D.; Castellano, N.N.; Gázquez, J.A.; Perea-Moreno, A.J.; Manzano-Agugliaro, F. Dielectric Spectroscopy in Biomaterials: Agrophysics. Materials 2016, 9, 310. [Google Scholar] [CrossRef] [PubMed]
- Żywica, R.; Pierzynowska-Korniak, G.; Wójcik, J. Application of food products electrical model parameters for evaluation of apple purée dilution. J. Food Eng. 2005, 67, 413–418. [Google Scholar] [CrossRef]
- Vozáry, E.; Jócsák, I.; Droppa, M.; Bóka, K. Connection between Structural Changes and Electrical Parameters of Pea Root Tissue under Anoxia; Padilla, P., Ed.; World’s Largest Science, Technology & Medicine Open Access Book Publisher: London, UK, 2011; p. 131. [Google Scholar]
- Sanchez, B.; Bandarenka, A.S.; Vandersteen, G.; Schoukens, J.; Bragos, R. Novel approach of processing electrical bioimpedance data using differential impedance analysis. Med. Eng. Phys. 2013, 35, 1349–1357. [Google Scholar] [CrossRef] [PubMed]
- Harker, F.R.; Forbes, S.K. Ripening and development of chilling injury in persimmon fruit: An electrical impedance study. N. Z. J. Crop Hortic. Sci. 1997, 25, 149–157. [Google Scholar] [CrossRef]
- Hayden, R.I.; Moyse, C.A.; Calder, F.W.; Crawford, D.P.; Fensom, D.S. Electrical impedance studies on potato and alfalfa tissue. J. Exp. Bot. 1969, 20, 177–200. [Google Scholar] [CrossRef]
- Privé, J.P.; Zhang, M.I.N. Estimating cold stress inBeautiful Arcade’apple roots using electrical impedance analysis. HortTechnology 1996, 6, 54–58. [Google Scholar]
- Zhang, M.I.N.; Willison, J.H.M. Electrical Impedance Analysis in Plant Tissues11. J. Exp. Bot. 1991, 42, 1465–1475. [Google Scholar] [CrossRef]
- Montoya, M.M.; Lopez-Rodriguez, V.; De La Plaza, J.L. An improved technique for measuring the electrical conductivity of intact fruits. LWT Food Sci. Technol. 1994, 27, 29–33. [Google Scholar] [CrossRef]
- El Khaled, D.; Castellano, N.N.; Gazquez, J.A.; Salvador, R.G.; Manzano-Agugliaro, F. Cleaner quality control system using bioimpedance methods: A review for fruits and vegetables. J. Clean. Prod. 2017, 140, 1749–1762. [Google Scholar] [CrossRef]
- Khaled, D.E.; Novas, N.; Gazquez, J.A.; Garcia, R.M.; Manzano-Agugliaro, F. Fruit and vegetable quality assessment via dielectric sensing. Sensors 2015, 15, 15363–15397. [Google Scholar] [CrossRef] [PubMed]
- Kundu, A.; Gupta, B. Broadband dielectric properties measurement of some vegetables and fruits using open ended coaxial probe technique. In Proceedings of the International Conference on Control, Instrumentation, Energy and Communication (CIEC), Calcutta, India, 31 January–2 February 2014; pp. 480–484. [Google Scholar]
- Wharmby, A.W. The application of the fractional calculus model for dispersion and absorption in dielectrics II. Infrared waves. Int. J. Eng. Sci. 2016, 104, 62–74. [Google Scholar] [CrossRef]
- Tan, F.K.; Hassan, J.; Wahab, Z.A. Electrical conductivity and dielectric behaviour of manganese and vanadium mixed oxide prepared by conventional solid state method. Eng. Sci. Technol. Int. J. 2016, 19, 2081–2087. [Google Scholar] [CrossRef]
- Nedielko, M.; Hamamda, S.; Alekseev, O.; Chornii, V.; Dashevskii, M.; Lazarenko, M.; Scherbatskyi, V. Mechanical, Dielectric, and Spectroscopic Characteristics of “Micro/Nanocellulose + Oxide” Composites. Nanoscale Res. Lett. 2017, 12, 98. [Google Scholar] [CrossRef] [PubMed]
- Subramanyam, K. Bibliometric studies of research collaboration: A review. J. Inf. Sci. 1983, 6, 33–38. [Google Scholar] [CrossRef]
- Moed, H.F.; Burger, W.J.M.; Frankfort, J.G.; Van Raan, A.F. The use of bibliometric data for the measurement of university research performance. Res. Policy 1985, 14, 131–149. [Google Scholar] [CrossRef]
- Glänzel, W.; Schubert, A.; Czerwon, H.J. A bibliometric analysis of international scientific cooperation of the European Union (1985–1995). Scientometrics 1999, 45, 185–202. [Google Scholar] [CrossRef]
- Montoya, F.G.; Baños, R.; Meroño, J.E.; Manzano-Agugliaro, F. The research of water use in Spain. J. Clean. Prod. 2016, 112, 4719–4732. [Google Scholar] [CrossRef]
- Min, M.; Märtens, O.; Parve, T. Lock-in measurement of bio-impedance variations. Measurement 2000, 27, 21–28. [Google Scholar] [CrossRef]
- Keshtkar, A. Virtual bladder biopsy using bio-impedance spectroscopy at 62.500 Hz–1.024 MHz. Measurement 2007, 40, 585–590. [Google Scholar] [CrossRef]
- Clemente, F.; Romano, M.; Bifulco, P.; Cesarelli, M. EIS measurements for characterization of muscular tissue by means of equivalent electrical parameters. Measurement 2014, 58, 476–482. [Google Scholar] [CrossRef]
- Sanchez, B.; Louarroudi, E.; Pintelon, R. Time–frequency analysis of time-varying in vivo myocardial impedance. Measurement 2014, 56, 19–29. [Google Scholar] [CrossRef]
- Zhang, Z.; Li, H.B.; Li, Z.H. A novelty digital algorithm for online measurement of dielectric loss factor of electronic transformers. Measurement 2013, 46, 1200–1207. [Google Scholar] [CrossRef]
- Sudheendran, K.; Pamu, D.; Krishna, M.G.; Raju, K.J. Determination of dielectric constant and loss of high-K thin films in the microwave frequencies. Measurement 2010, 43, 556–562. [Google Scholar] [CrossRef]
- Bossou, O.V.; Mosig, J.R.; Zurcher, J.F. Dielectric measurements of tropical wood. Measurement 2010, 43, 400–405. [Google Scholar] [CrossRef]
- Cataldo, A.; Piuzzi, E.; Cannazza, G.; De Benedetto, E.; Tarricone, L. Quality and anti-adulteration control of vegetable oils through microwave dielectric spectroscopy. Measurement 2010, 43, 1031–1039. [Google Scholar] [CrossRef]
- Ziegler, B.E. Methods for Bibliometric Analysis of Research: Renewable Energy Case Study. Ph.D. Thesis, Massachusetts Institute of Technology, Cambridge, MA, USA, 2009. [Google Scholar]
- Manzano-Agugliaro, F.; Alcayde, A.; Montoya, F.G.; Zapata-Sierra, A.; Gil, C. Scientific production of renewable energies worldwide: An overview. Renew. Sustain. Energy Rev. 2013, 18, 134–143. [Google Scholar] [CrossRef]
- Salmerón-Manzano, E.; Manzano-Agugliaro, F. Worldwide scientific production indexed by Scopus on Labour Relations. Publications 2017, 5, 25. [Google Scholar] [CrossRef]
- Bar-Ilan, J. Citations to the “Introduction to informetrics” indexed by WOS, Scopus and Google Scholar. Scientometrics 2010, 82, 495–506. [Google Scholar] [CrossRef]
- Mongeon, P.; Paul-Hus, A. The journal coverage of Web of Science and Scopus: A comparative analysis. Scientometrics 2016, 106, 213–228. [Google Scholar] [CrossRef]
- Aghaei Chadegani, A.; Salehi, H.; Yunus, M.M.; Farhadi, H.; Fooladi, M.; Farhadi, M.; Ale Ebrahim, N. A comparison between two main academic literature collections: Web of Science and Scopus databases. Asian Soc. Sci. 2013, 9, 18–26. [Google Scholar] [CrossRef]
- Archambault, É.; Campbell, D.; Gingras, Y.; Larivière, V. Comparing bibliometric statistics obtained from the Web of Science and Scopus. J. Am. Soc. Inf. Sci. Technol. 2009, 60, 1320–1326. [Google Scholar] [CrossRef]
- Rodrigues, R.S.; Taga, V.; Passos, M.F.D. Research Articles about Open Access Indexed by Scopus: A Content Analysis. Publications 2016, 4, 31. [Google Scholar] [CrossRef]
- Solomon, D. Types of open access publishers in Scopus. Publications 2013, 1, 16–26. [Google Scholar] [CrossRef]
- Vuong, Q.H.; Ho, T.M.; Vuong, T.T.; Nguyen, H.V.; Napier, N.K.; Pham, H.H. Nemo Solus Satis Sapit: Trends of Research Collaborations in the Vietnamese Social Sciences, Observing 2008–2017 Scopus Data. Publications 2017, 5, 24. [Google Scholar] [CrossRef]
- Montoya, F.G.; Alcayde, A.; Baños, R.; Manzano-Agugliaro, F. A fast method for identifying worldwide scientific collaborations using the Scopus database. Telemat. Inform. 2017. [Google Scholar] [CrossRef]
- Miguel, S.; Tannuri de Oliveira, E.F.; Cabrini Grácio, M.C. Scientific production on open access: A worldwide bibliometric analysis in the academic and scientific context. Publications 2016, 4, 1. [Google Scholar] [CrossRef]
- Gimenez, E.; Manzano-Agugliaro, F. DNA Damage Repair System in Plants: A Worldwide Research Update. Genes 2017, 8, 299. [Google Scholar] [CrossRef] [PubMed]
- Garrido-Cardenas, J.A.; Mesa-Valle, C.; Manzano-Agugliaro, F. Human parasitology worldwide research. Parasitology 2017, 1–14. [Google Scholar] [CrossRef] [PubMed]
- De la Cruz-Lovera, C.; Perea-Moreno, A.J.; de la Cruz-Fernández, J.L.; Alvarez-Bermejo, J.A.; Manzano-Agugliaro, F. Worldwide Research on Energy Efficiency and Sustainability in Public Buildings. Sustainability 2017, 9, 1294. [Google Scholar] [CrossRef]
- Garrido-Cardenas, J.A.; Manzano-Agugliaro, F. The metagenomics worldwide research. Curr. Genet. 2017, 63, 819–829. [Google Scholar] [CrossRef] [PubMed]
- Tsay, M.Y. A bibliometric analysis of hydrogen energy literature, 1965–2005. Scientometrics 2008, 75, 421–438. [Google Scholar] [CrossRef]
- Celiktas, M.S.; Sevgili, T.; Kocar, G. A snapshot of renewable energy research in Turkey. Renew. Energy 2009, 34, 1479–1486. [Google Scholar] [CrossRef]
- Montoya, F.G.; Montoya, M.G.; Gómez, J.; Manzano-Agugliaro, F.; Alameda-Hernández, E. The research on energy in Spain: A scientometric approach. Renew. Sustain. Energy Rev. 2014, 29, 173–183. [Google Scholar] [CrossRef]
- Choi, J.; Yi, S.; Lee, K.C. Analysis of keyword networks in MIS research and implications for predicting knowledge evolution. Inf. Manag. 2011, 48, 371–381. [Google Scholar] [CrossRef]
- Li, L.L.; Ding, G.; Feng, N.; Wang, M.H.; Ho, Y.S. Global stem cell research trend: Bibliometric analysis as a tool for mapping of trends from 1991 to 2006. Scientometrics 2009, 80, 39–58. [Google Scholar] [CrossRef]
- Garrido-Cardenas, J.A.; Mesa-Valle, C.; Manzano-Agugliaro, F. Trends in plant research using molecular markers. Planta 2017, 1–15. [Google Scholar] [CrossRef] [PubMed]
Figure 1.
Chart presentation of document type distribution (%): Bioimpedance (1893–2016) and Dielectric (1966–2016).
Figure 1.
Chart presentation of document type distribution (%): Bioimpedance (1893–2016) and Dielectric (1966–2016).

Figure 2.
Comparison between evolution of bioimpedance and dielectric publication trends from 1966 till 2016.
Figure 2.
Comparison between evolution of bioimpedance and dielectric publication trends from 1966 till 2016.

Figure 3.
Map with worldwide distribution of dielectric publications.

Figure 4.
Map with worldwide distribution of bioimpedance spectroscopy.
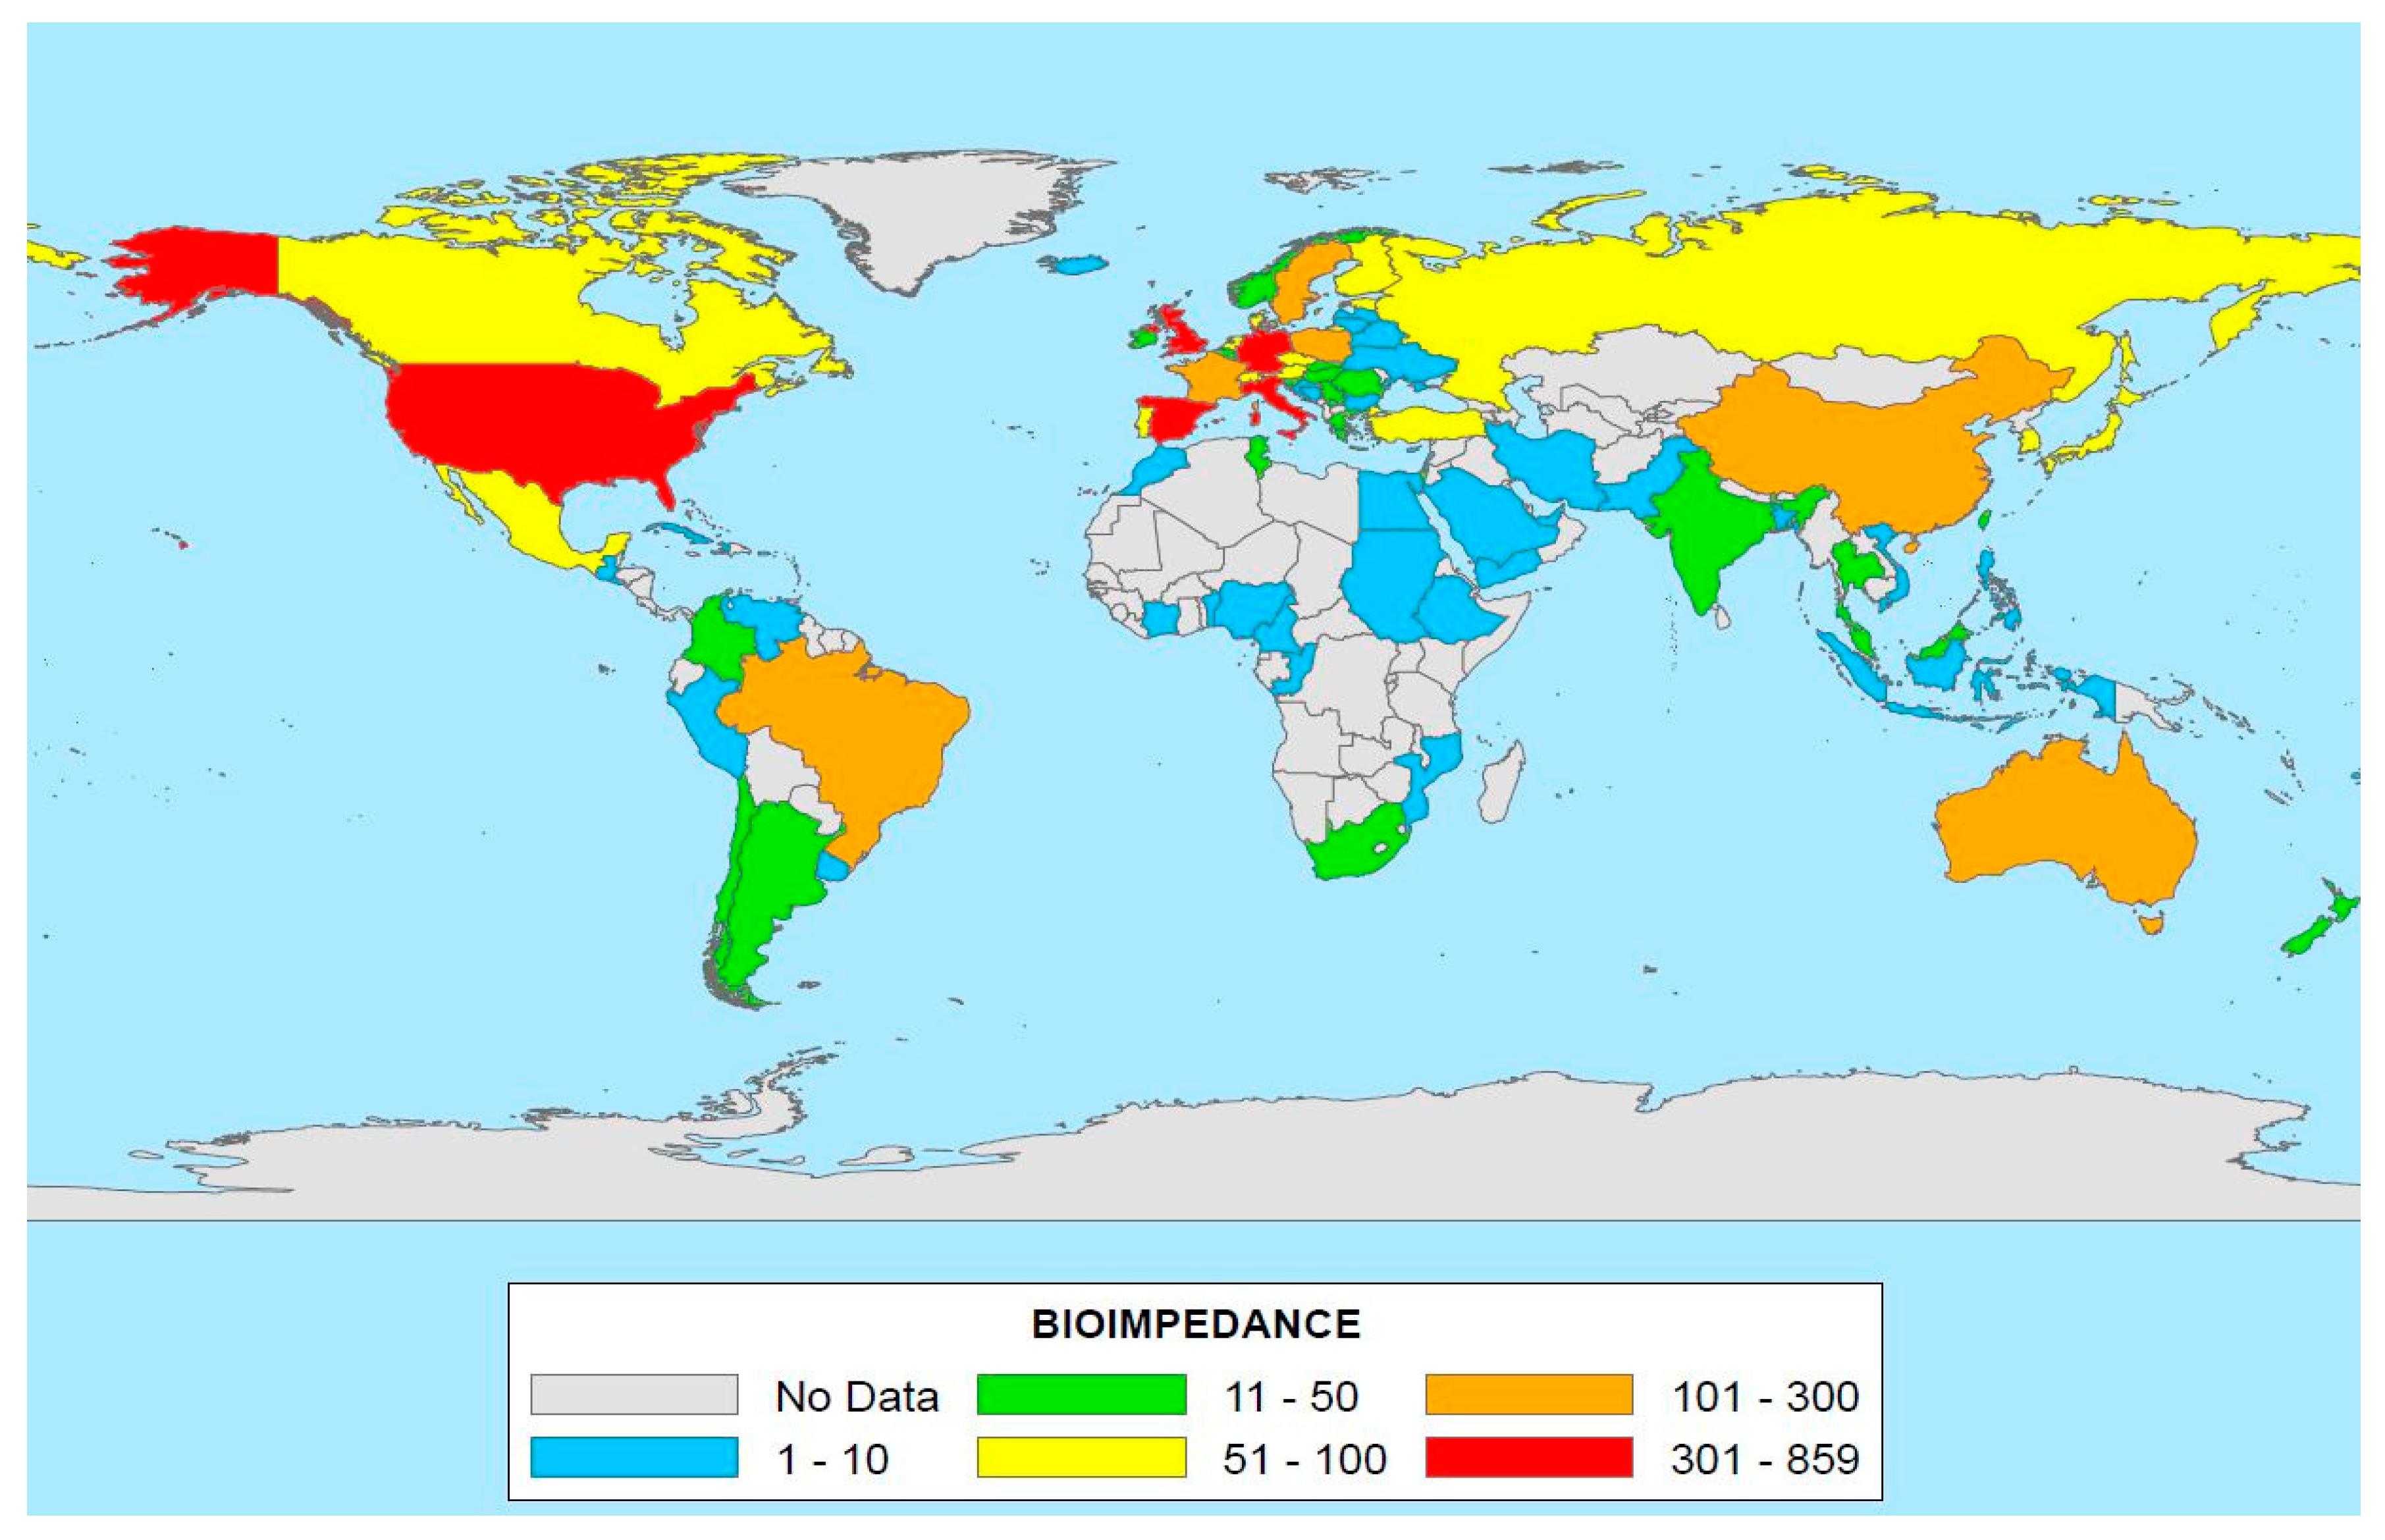
Figure 5.
Ranking of the top 10 institutions publishing on dielectric.

Figure 6.
Ranking of the top 10 institutions publishing on bioimpendance.
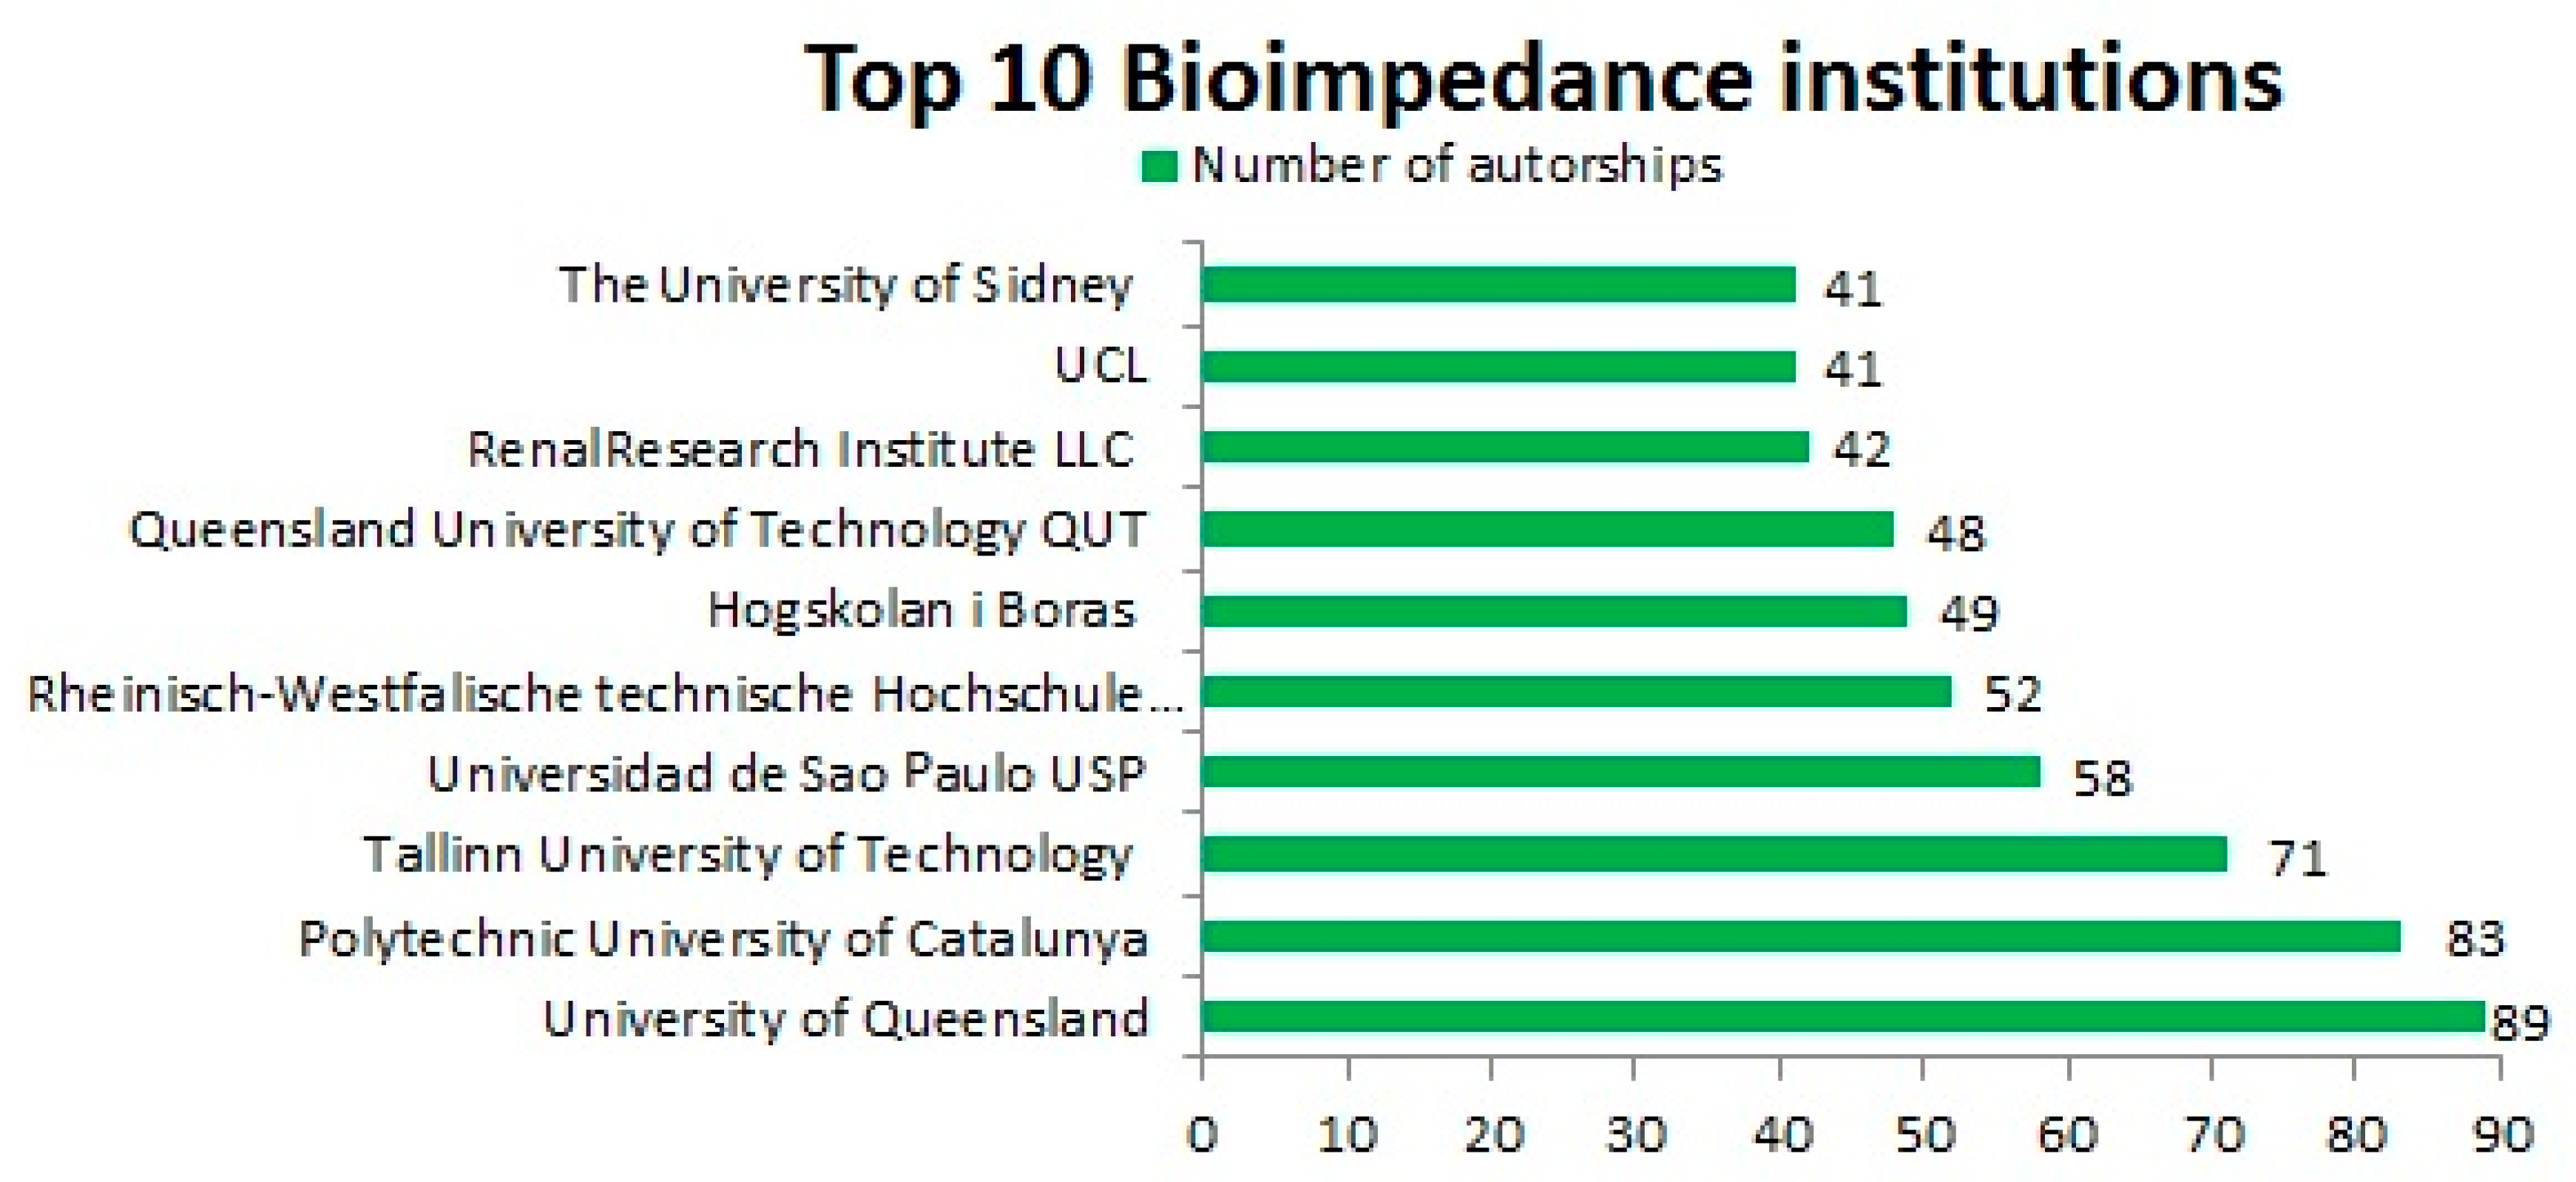
Figure 7.
Time evolution for the recent 10 year period for the 10 most prolific institutions.
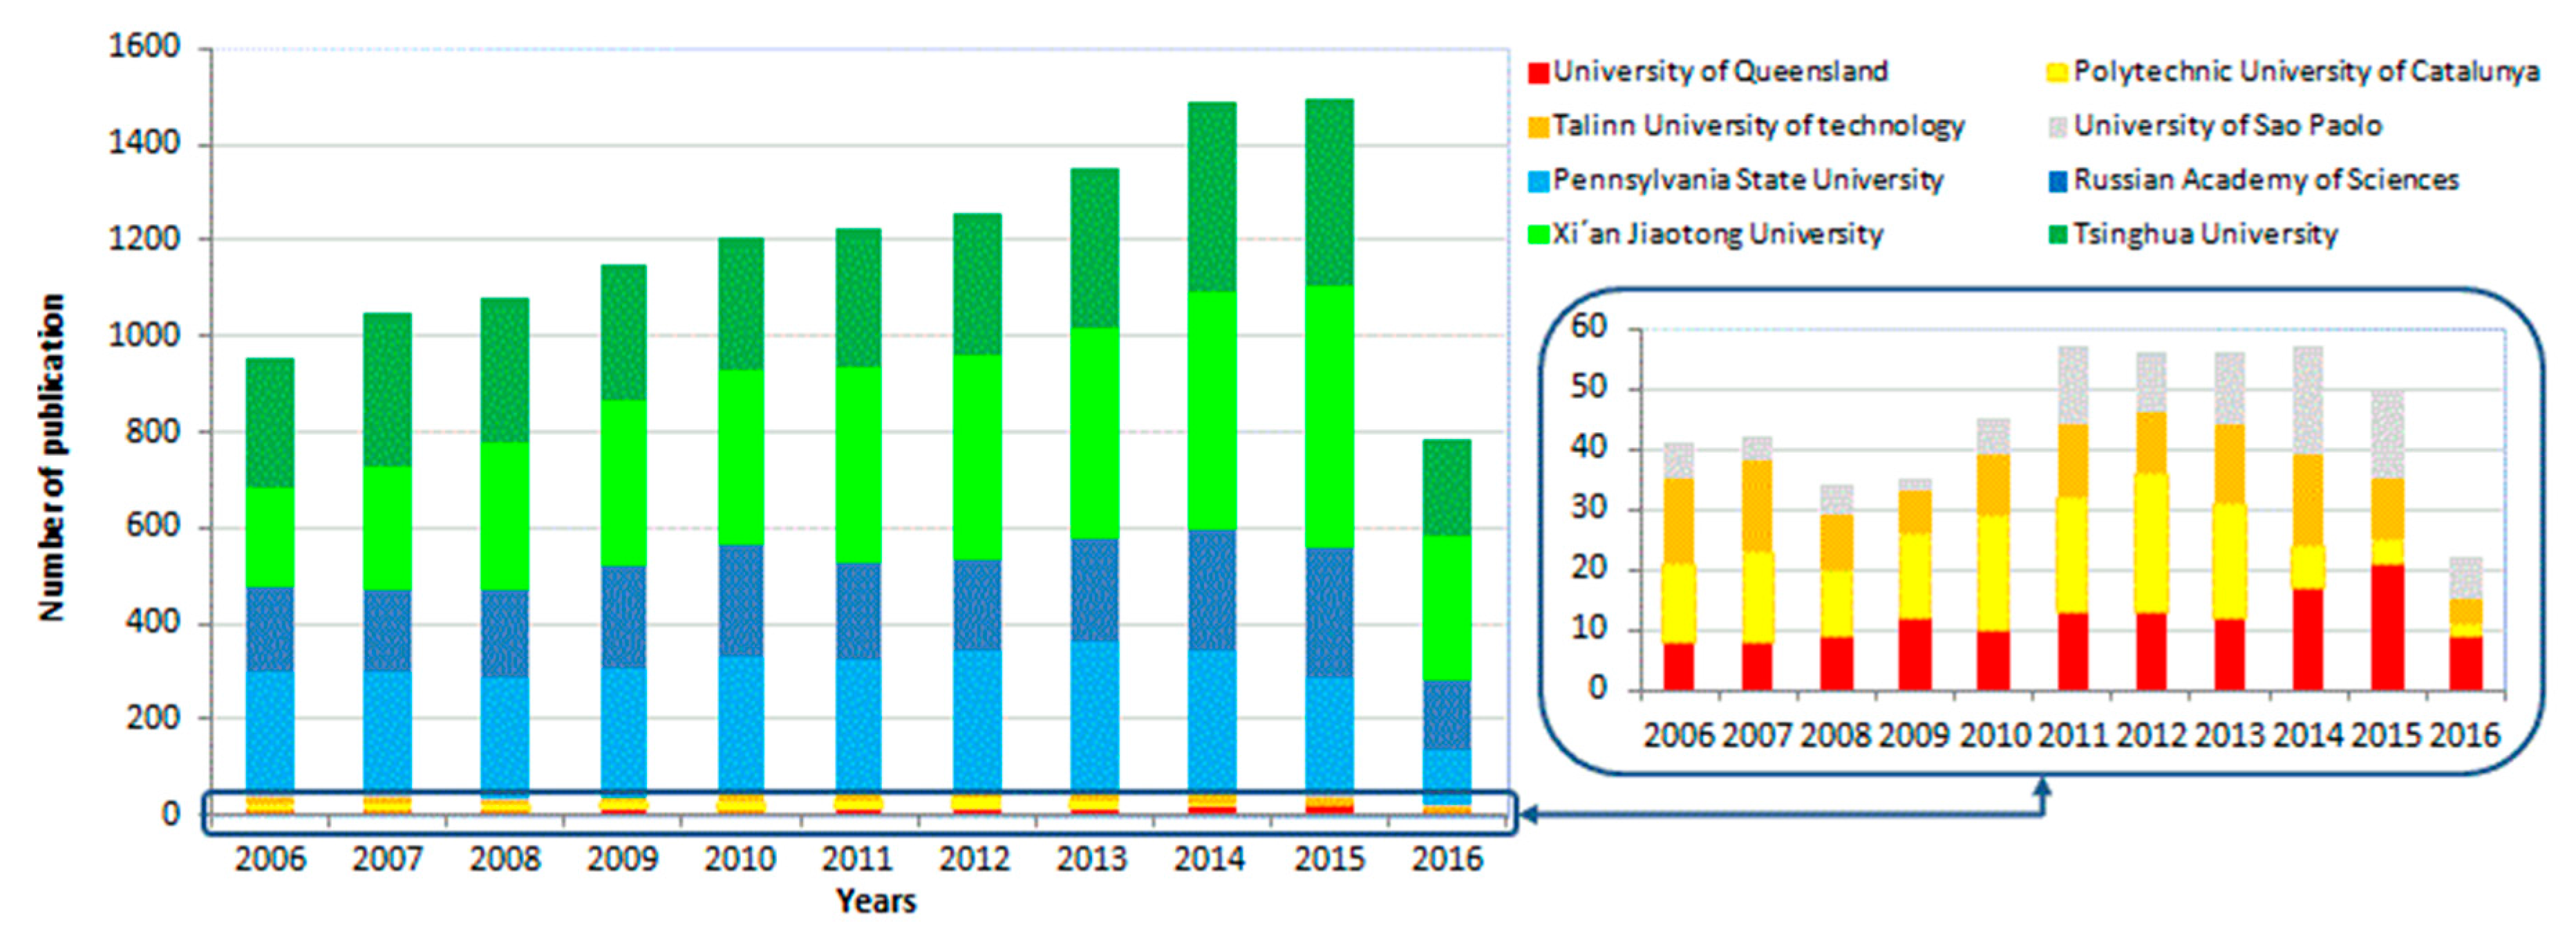
Figure 8.
Dielectric publication distribution according to the subject area.

Figure 9.
Bioimpedance publication distribution according to the subject area.

Figure 10.
Ranking of top 10 dielectric journals according to items, JCR (Journal Citation Reports) and SJR (Scientific Journal Rankings) criteria.
Figure 10.
Ranking of top 10 dielectric journals according to items, JCR (Journal Citation Reports) and SJR (Scientific Journal Rankings) criteria.

Figure 11.
Ranking of top 10 bioimpedance journals according to items, JCR and SJR criteria.

Figure 12.
Evolution of the top 5 keywords in “dielectric” in the last 10 years.

Figure 13.
Evolution of the top 5 keywords in bioimpedance in the last 10 years.


Table 1.
Top 10 ranking journals in dielectric.
| Journal | Items | % | JCR | SJR | SNIP | Publisher | Ranking | ||
|---|---|---|---|---|---|---|---|---|---|
| Item | JCR | SJR | |||||||
| Journal of Applied Physics | 8070 | 20.44 | 1.66 | 0.603 | 0.755 | American Institute of Physics Publishing LLC | 1 | 8 | 8 |
| Applied Physics Letters | 7199 | 18.23 | 2.60 | 1.105 | 0.914 | American Institute of Physics Publishing LLC | 2 | 5 | 5 |
| Physical Reviewer B Condensed Matter and Materials | 3846 | 9.74 | 3.12 | 1.933 | 0.940 | American Physical Society | 3 | 3 | 2 |
| Ferroelectrics | 3446 | 8.73 | 0.56 | 0.264 | 0.433 | Taylor and Francis Ltd. | 4 | 10 | 9 |
| Journal of Chemical Physics | 3435 | 8.70 | 2.09 | 0.959 | 0.727 | American Institute of Physics Publishing LLC | 5 | 6 | 6 |
| Thin Solid Films | 3014 | 7.63 | 1.77 | 0.726 | 0.942 | Elsevier | 6 | 7 | 7 |
| IEEE Transactions on Microwave Theory and Techniques | 2758 | 6.99 | 3.16 | 1.346 | 2.029 | IEEE | 7 | 2 | 4 |
| Physical Review B | 2647 | 6.70 | 2.80 | 1.933 | 0.940 | American Physical Society | 8 | 4 | 3 |
| Japanese Journal of Applied Physics | 2601 | 6.59 | 0.64 | 0.258 | 0.467 | Japan Society of Applied Physics | 9 | 9 | 10 |
| IEEE Transactions on Antennas and Propagation | 2464 | 6.24 | 3.88 | 2.130 | 2.509 | IEEE | 10 | 1 | 1 |
Table 2.
Top 10 ranking journals in bioimpedance.
| Journal | Items | % | JCR | SJR | SNIP | Publisher | Ranking | ||
|---|---|---|---|---|---|---|---|---|---|
| Item | JCR | SJR | |||||||
| Physiological Measurement | 114 | 20.28 | 2.09 | 0.795 | 1.263 | IOP Publishing Ltd. | 1 | 6 | 6 |
| Journal of Physics Conference Series | 77 | 13.70 | 0.39 | 0.211 | 0.247 | IOP Publishing Ltd. | 2 | 9 | 10 |
| Critical Care Medicine | 58 | 10.32 | 3.61 | 3.748 | 2.651 | Lippincott Williams and Wilkins | 3 | 4 | 1 |
| Nephrology Dialysis Transpalantation | 49 | 8.72 | 3.57 | 1.780 | 1.433 | Oxford University Press | 4 | 3 | 3 |
| Nutricion Hospitalaria | 49 | 8.72 | 1.39 | 0.386 | 0.746 | Grupo Aula Medica S.A. | 5 | 8 | 8 |
| IEEE EMBS | 48 | 8.54 | 0.38 | 0.215 | 0.319 | IEEE | 6 | 10 | 9 |
| Blood Purification | 43 | 7.65 | 1.40 | 0.609 | 0.677 | S. Karger AG | 7 | 7 | 7 |
| European Journal of Clinical Nutrition | 43 | 7.65 | 2.72 | 1.488 | 1.167 | Nature Publishing Group | 8 | 5 | 4 |
| Kidney International | 43 | 7.65 | 4.22 | 3.181 | 1.945 | Nature Publishing Group | 9 | 1 | 2 |
| IEEE transactions on Biomedical Engineering | 38 | 6.76 | 4.02 | 1.201 | 1.939 | IEEE Computer Society | 10 | 2 | 5 |
Table 3.
Top 10 ranking journals in bioimpedance.
| Keywords | Items | % | Keywords | Items | % |
|---|---|---|---|---|---|
| Dielectric Materials | 50,033 | 12.77 | Refractive Index | 8610 | 2.20 |
| Permittivity | 36,469 | 9.31 | Electric Conductivity | 8538 | 2.18 |
| Dielectric Properties | 31,383 | 8.01 | Dielectric Relaxation | 8411 | 2.15 |
| Dielectric Devices | 18,138 | 4.63 | Dielectric Films | 8371 | 2.14 |
| Thin Films | 16,823 | 4.30 | Microwaves | 8235 | 2.10 |
| Ceramic Materials | 15,634 | 3.99 | Scanning Electron Microscopy | 8072 | 2.06 |
| Electric Fields | 14,021 | 3.58 | Capacitance | 7988 | 2.04 |
| Dielectric Constant | 12,898 | 3.29 | Ferroelectric Materials | 7967 | 2.03 |
| Dielectric Losses | 11,300 | 2.89 | Gate Dielectrics | 7908 | 2.02 |
| Conputer Simulation | 10,526 | 2.69 | Electrodes | 7892 | 2.01 |
| Mathematical Models | 10,507 | 2.68 | Electric Properties | 7811 | 1.99 |
| Polarization | 10,070 | 2.57 | Capacitors | 7372 | 1.88 |
| X Rat Diffraction | 9265 | 2.37 | Ferroelectricity | 7171 | 1.83 |
| Substrates | 8973 | 2.29 | Optical Properties | 6803 | 1.74 |
| Sintering | 8713 | 2.22 | Silicon | 6660 | 1.70 |
Table 4.
Top 30 keywords used in bioimpedance.
| Keywords | Items | % | Keywords | Items | % |
|---|---|---|---|---|---|
| Human | 4928 | 16.46 | Body Weight | 544 | 1.82 |
| Female | 1981 | 6.62 | Obesity | 543 | 1.81 |
| Male | 1906 | 6.36 | Bio-impedance | 476 | 1.59 |
| Adult | 1766 | 5.90 | Body Mass Index | 454 | 1.52 |
| Electric Impedance | 1515 | 5.06 | Anthropmetry | 411 | 1.37 |
| Impedance | 1486 | 4.96 | Body Fat | 401 | 1.34 |
| Priority Journal | 1307 | 4.36 | Adolescent | 396 | 1.32 |
| Body Composition | 1181 | 3.94 | Physiology | 378 | 1.26 |
| Middle Aged | 1152 | 3.85 | Body Water | 358 | 1.20 |
| Controlled Study | 1148 | 3.83 | Blood Pressure | 352 | 1.18 |
| Aged | 978 | 3.27 | Cardiac Output | 351 | 1.17 |
| Bioimpedance | 815 | 2.72 | Renal Dialysis | 350 | 1.17 |
| Clinical Article | 692 | 2.31 | Heart Output | 334 | 1.12 |
| Body Mass | 691 | 2.31 | Hemodialysis | 325 | 1.09 |
| Major Clinical Study | 688 | 2.30 | Hemdynamics | 315 | 1.05 |
© 2018 by the authors. Licensee MDPI, Basel, Switzerland. This article is an open access article distributed under the terms and conditions of the Creative Commons Attribution (CC BY) license (http://creativecommons.org/licenses/by/4.0/).
Share and Cite
MDPI and ACS Style
El Khaled, D.; Novas, N.; Gazquez, J.-A.; Manzano-Agugliaro, F. Dielectric and Bioimpedance Research Studies: A Scientometric Approach Using the Scopus Database. Publications 2018, 6, 6. https://doi.org/10.3390/publications6010006
AMA Style
El Khaled D, Novas N, Gazquez J-A, Manzano-Agugliaro F. Dielectric and Bioimpedance Research Studies: A Scientometric Approach Using the Scopus Database. Publications. 2018; 6(1):6. https://doi.org/10.3390/publications6010006
Chicago/Turabian StyleEl Khaled, Dalia, Nuria Novas, Jose-Antonio Gazquez, and Francisco Manzano-Agugliaro. 2018. "Dielectric and Bioimpedance Research Studies: A Scientometric Approach Using the Scopus Database" Publications 6, no. 1: 6. https://doi.org/10.3390/publications6010006
Note that from the first issue of 2016, this journal uses article numbers instead of page numbers. See further details here.