
Computer Science Papers in Web of Science: A Bibliometric Analysis


1
Department of Computer Science and Engineering, University of West Bohemia, Pilsen 301 00, Czech Republic
2
Department of Cybernetics and Artificial Intelligence, Technical University of Košice, Košice 040 01, Slovakia
*
Author to whom correspondence should be addressed.
Publications 2017, 5(4), 23; https://doi.org/10.3390/publications5040023
Submission received: 10 August 2017
/
Revised: 15 September 2017
/
Accepted: 27 September 2017
/
Published: 29 September 2017
Abstract
:In this article we present a bibliometric study of 1.9 million computer science papers published from 1945 to 2014 and indexed in Web of Science. We analyze both the quantity and the impact of these publications according to document types, languages, disciplines, countries, institutions, and publication sources. The most frequent author keywords, cited references, and cited papers as well as the distribution of the number of references and citations per paper and of the age of cited references are also explored. Since conference proceedings play a tremendous role in this scientific field, we investigate the time and place of computer science conferences in terms of the most prolific months and locations. And, last but not least, the production of journal articles and conference papers over the whole time period and the level of collaboration in different computer science disciplines are inspected. One of the main results is the finding that “Artificial Intelligence” is the most productive subfield of computer science, but “Interdisciplinary Applications” has the highest relative impact.
1. Introduction
Computer science is a well-established, dynamic, and still relatively new research field that made its major breakthrough only some fifty years ago. Nowadays, it is a highly interdisciplinary scientific domain having significant overlaps with mathematics, physics, and even biology. Surprisingly, there have not been a large number of bibliometric studies measuring the published research outputs of computer science. Some of them have focused on individual countries or groups of countries: China [1], Malaysia [2], India [3], Brazil [4], India and China [5], Eastern Europe [6], BRIC and a few other countries [7], or China, India, Japan, and three major Western nations [8]. The research performance of global universities in computer science has been explored too [9]. Other investigations have been more concerned with the role of computer science conferences and their lower impact compared to journals [10,11,12,13] while some research has also been devoted to the study of the citedness of computer science journals [14,15]. Some works have been very specific and have inspected the evolution of the number of authors [16] or of the age of cited references [17] in computer science publications. However, unlike this article, none of the above analyses has dealt with the whole field of computer science covering a 70-year-long period of time. As far as bibliometric analyses themselves are concerned, they have been regularly conducted in the past in a wide variety of areas, including a recent one published in this journal [18].
The present study would like to extend and complement the existing analyses mentioned above in investigating almost two million computer science papers from the period 1945–2014 that are indexed in the well-known Web of Science database. The research questions we wanted to answer can be summarized as follows: (1) What is the production and impact of computer science papers according to their document types, languages used, research areas, countries and institutions of their authors, and publication sources (venues)? (2) What are the most frequent author keywords, cited references, and cited papers and what do the distributions of the number of references and citations per paper and of the age of cited references look like? (3) Which are the most productive months of the year of computer science conferences and what are their most popular destinations? And (4) How did the production of journal articles and conference proceedings papers evolve over time in the period under study and how collaborative are the different computer science subfields? The topics deliberately not touched upon in this paper is an author-level analysis of any kind (for the reasons explained below) and a detailed investigation into collaboration patterns.
2. Data and Methods
In August 2015, we acquired 1,922,652 bibliographic records (in plain text) on computer science papers indexed in Web of Science (by Thomson Reuters, now Clarivate Analytics) that were published from 1945 to 2014. These were all the records classified as “Computer Science”, i.e., our search query included the term “SU = (Computer Science)”. We will sometimes refer to these data as the “core collection”. We were primarily interested in documents of type “Article”, “Proceedings Paper”, and “Review”, but our data set also contained other document types as will be shown below. The data originated from these two databases: “Science Citation Index Expanded” and “Conference Proceedings Citation Index—Science”. These almost two million papers (or, more precisely, paper records) included 32,137,613 cited references, the most frequent of which will be disclosed later in this article. These references were most often in the form of the first author name (surname plus given and middle name initials), publication year, and publication source. There often was some additional information too, such as the volume, pagination, or even a DOI (Digital Object Identifier). Of course, many references cited items outside of the core collection (all non-computing publications, for instance) and thus form the basis of what we may call the “non-core collection”. However, disambiguation and matching of references was not part of the research described in this article. To start the analysis whose results will be presented in the next sections, we just imported the data set text files into a relational database and began submitting queries to it.
3. Results and Discussion
3.1. Document Types and Languages
3.1.1. Document Types in the Data Set
Table 1 shows the distribution of document types in our data collection as defined by Web of Science. In total, there are six distinct document types with the most frequent ones being “Proceedings Paper” (over 56%), “Article” (almost 35%), and “Article; Proceedings Paper” (nearly 9%). The other document types have negligible shares, with the exception of “Review” (0.4%), which can be considered as a special sort of journal articles. (There were also other document types, not shown in Table 1, which were mistakenly included in the core data set. Their number was 1399, i.e., less than 1‰ of all records.) The type “Article; Proceedings Paper” is somewhat particular too, representing conference papers reprinted (often in an extended version) as journal articles, which is currently on a decline as we will see later on. However, journal articles account for more than 75% of all 11.8 million citations received by the 1.9 million documents under study. The other two document types (conference papers and reprinted conference papers) only accrue almost 11% of all citations each. This big difference in impact is even more dramatic in terms of citations per paper (CPP), which is 13.4 for journal articles, 7.7 for conference papers reprinted in journals, and merely 1.2 for conference papers.
3.1.2. Production of Articles and Proceedings Papers over Time
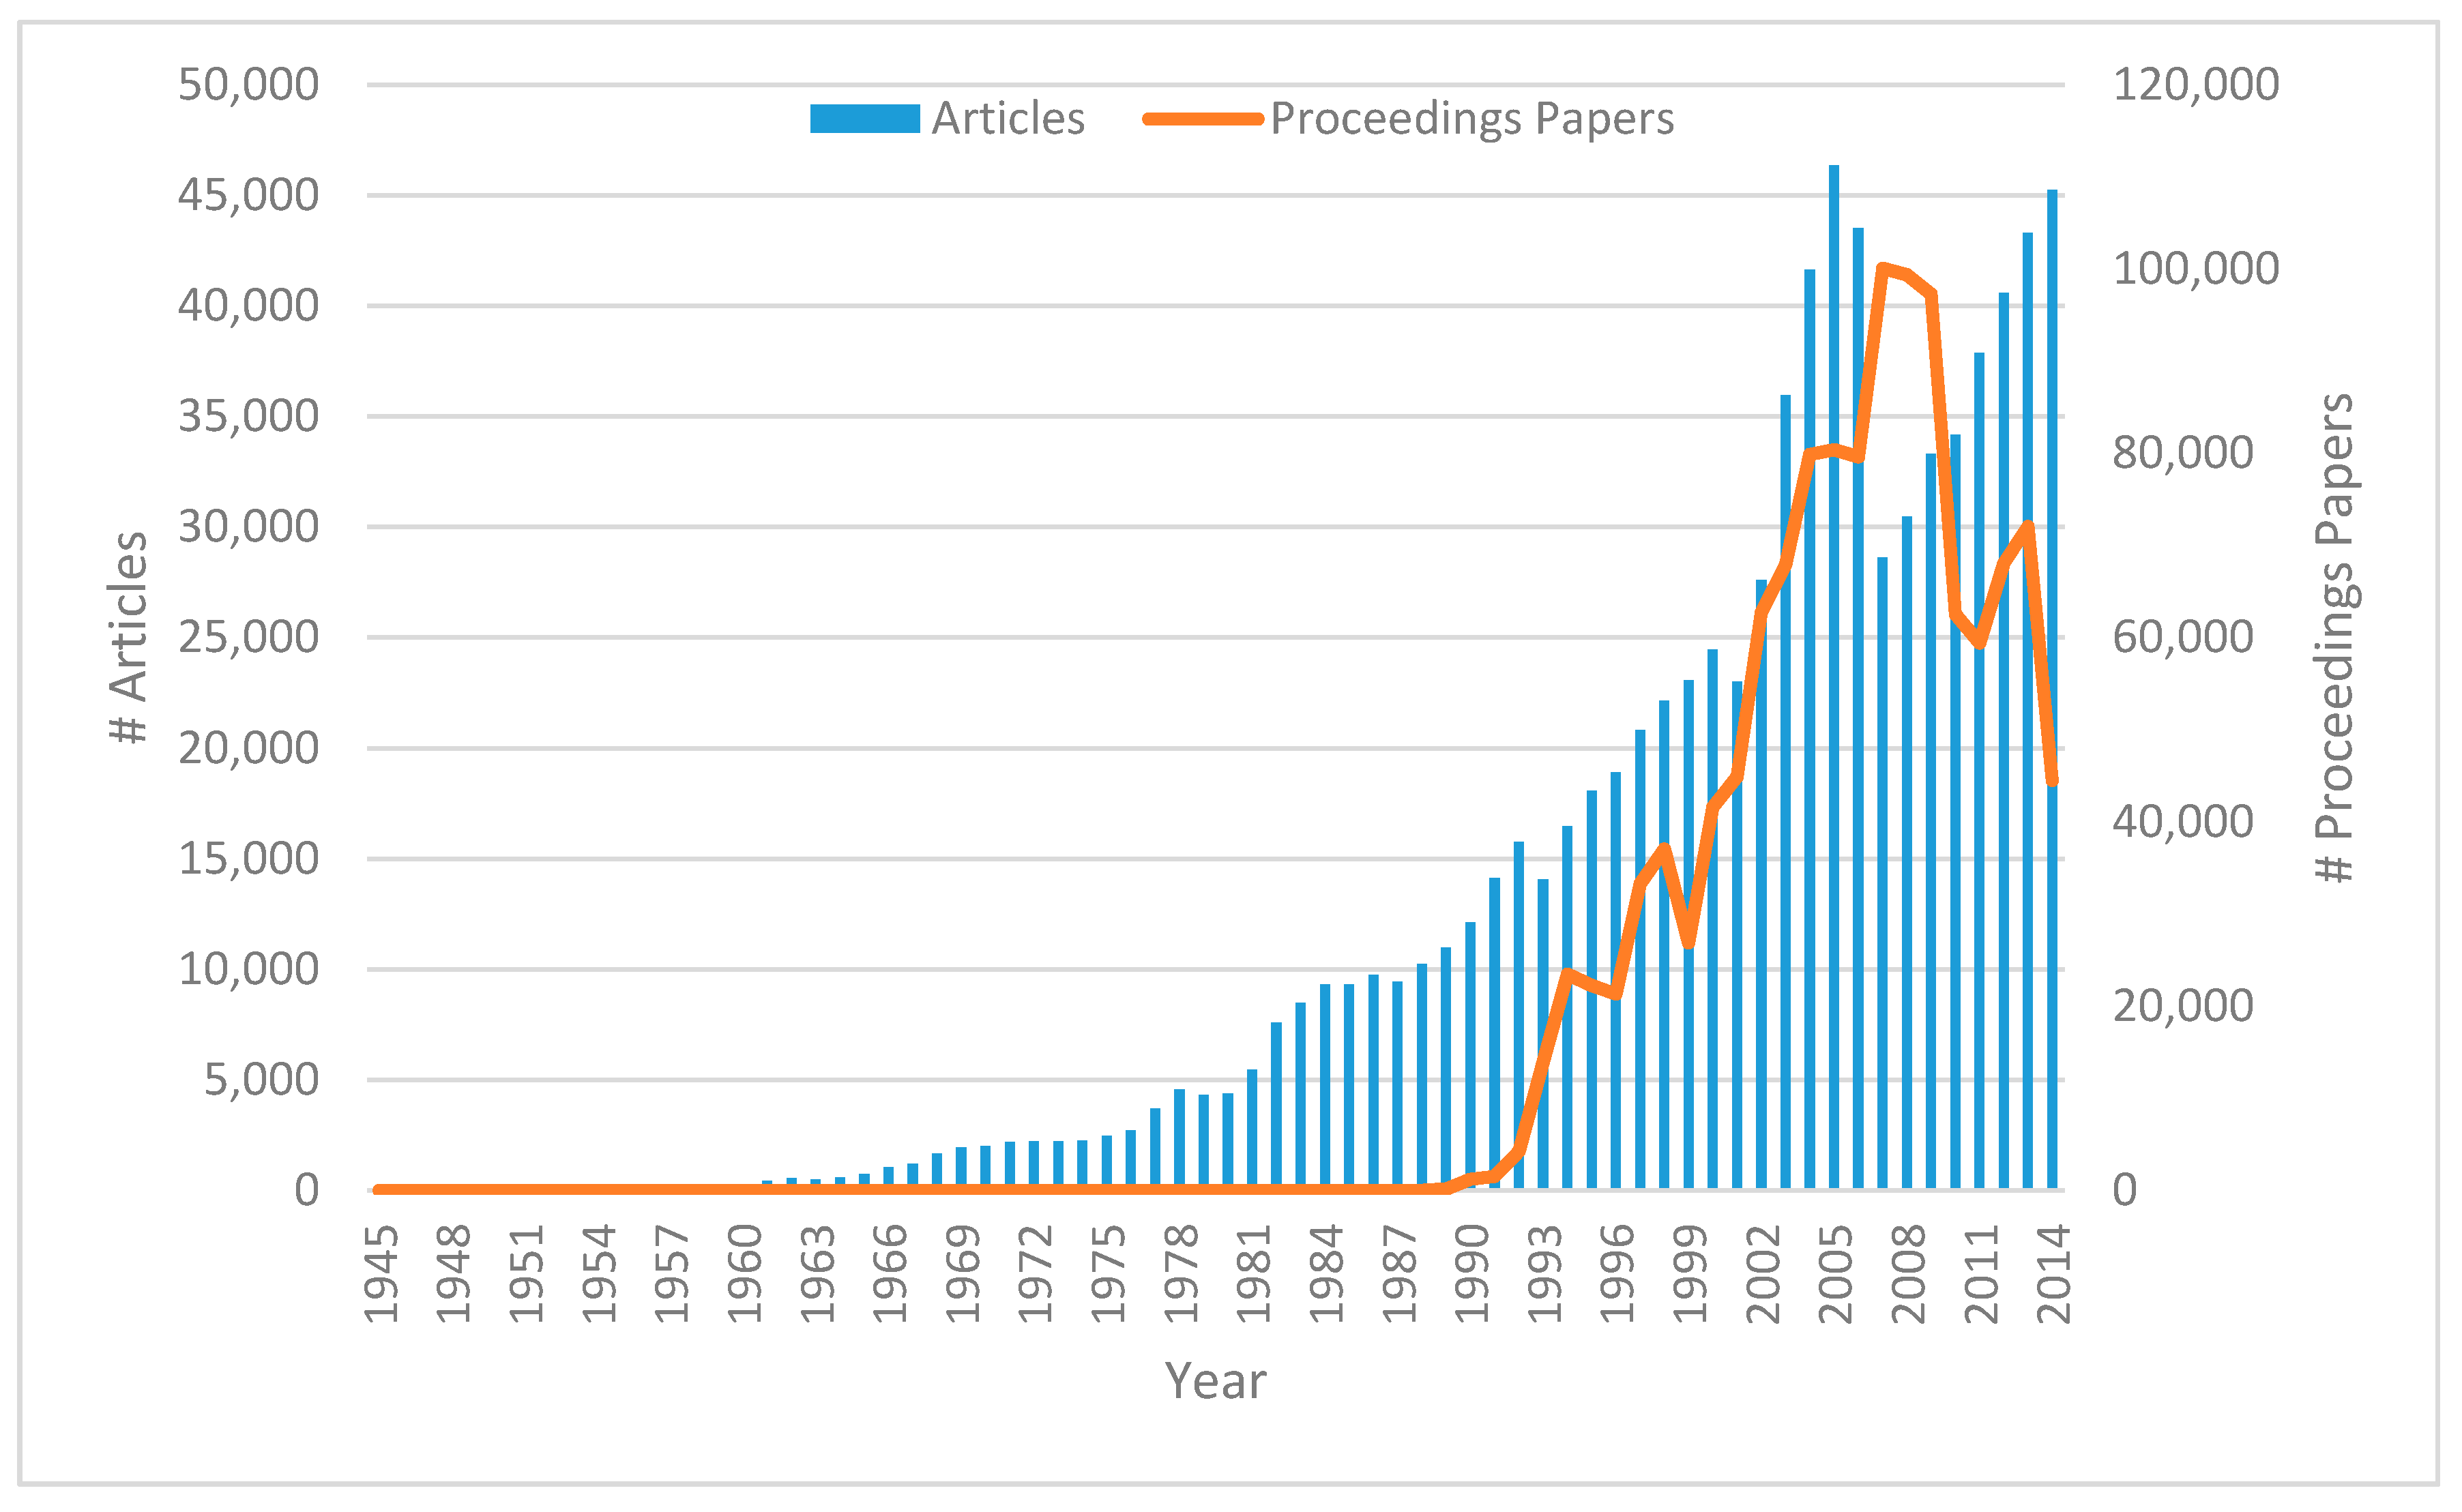
Figure 1 displays the evolution of the number of the journal articles and conference proceedings papers (which first appeared in 1989) published in the individual years of the period 1945–2014. (Documents of the type “Article; Proceedings Paper” were counted as both.) There is almost a steady rise for both journal articles and conference papers until 2005 and 2007, respectively, with the peak figures being 46,332 journal articles and 100,071 proceedings papers. However, the peaks are followed by a sharp decline in both cases, which culminated with just 28,604 journal articles in 2007 and 59,384 proceedings papers in 2011. The low number of conference papers in 2014 cannot be taken into account yet because the indexation of conference proceedings may take up to a few years in Web of Science. In any case, what was the cause of the decrease between 2007 and 2011? After inspecting the data, we may conclude that the main cause is a change in the indexation policy of Web of Science: from 2007 onward the papers published in the two well-known book series Lecture Notes in Computer Science and Lecture Notes in Artificial Intelligence were no more indexed as “Article; Proceedings Paper” but rather as “Proceedings Paper”. This caused the sudden drop of journal articles in 2007, which has since been overcome by the natural growth with 45,226 articles in 2014. However, the reason for the small number of proceedings papers in 2010–2011 is less clear. It simply appears that many conferences indexed before 2010 were not covered in those years. Either they were deliberately not indexed by Web of Science in that period, which seems to be less likely given the coverage before and after this time range, or the conferences did not take place at all, for instance due to some delayed consequences of the world economic crisis in 2008–2009. A further analysis would be needed to explore this aspect in detail.
3.1.3. Languages Used
The situation is quite clear as far as the usage of languages is concerned. It is well known that Web of Science is almost exclusively focused on sources published in English and this is documented in Table 2 where both the share of papers and the share of citations of papers written in English reach above 99%. In fact, the impact of English papers in terms of citations per paper (6.2) is about three times higher than that of French (2.1) or German (1.9) papers and roughly six times as big as the impact of Russian publications (1.0). The influence of research published in other languages is infinitesimal, with most notably the impact of Chinese literature (with the second largest number of papers) being merely 0.1 CPP.
3.2. Research Areas of Computer Science
3.2.1. Papers and Citations in Different Subfields
Computer science in Web of Science is categorized into seven non-exclusive thematic groups whose shares in the total amount of papers and citations are shown in Table 3. “Artificial Intelligence” is the most prolific topic with nearly 32% of papers and 28% of citations. (Note that the percentage shares will not add up to 100% due to the overlaps of categories.) The second and the third most abundant categories are “Theory & Methods” and “Information Systems” with more than half a million papers each. Compared to their size, the influence of these disciplines seems to be smaller, though, with 30.3% of papers and 23.4% of citations for the former and 26.6% and 20.4% for the latter. The most influential field in terms of CPP, however, is “Interdisciplinary Applications” with eight citations per paper whereas the average of the other categories is 5.3. This confirms once again that interdisciplinary research is usually rewarded with a higher impact.
3.2.2. Authors per Paper in Different Subfields
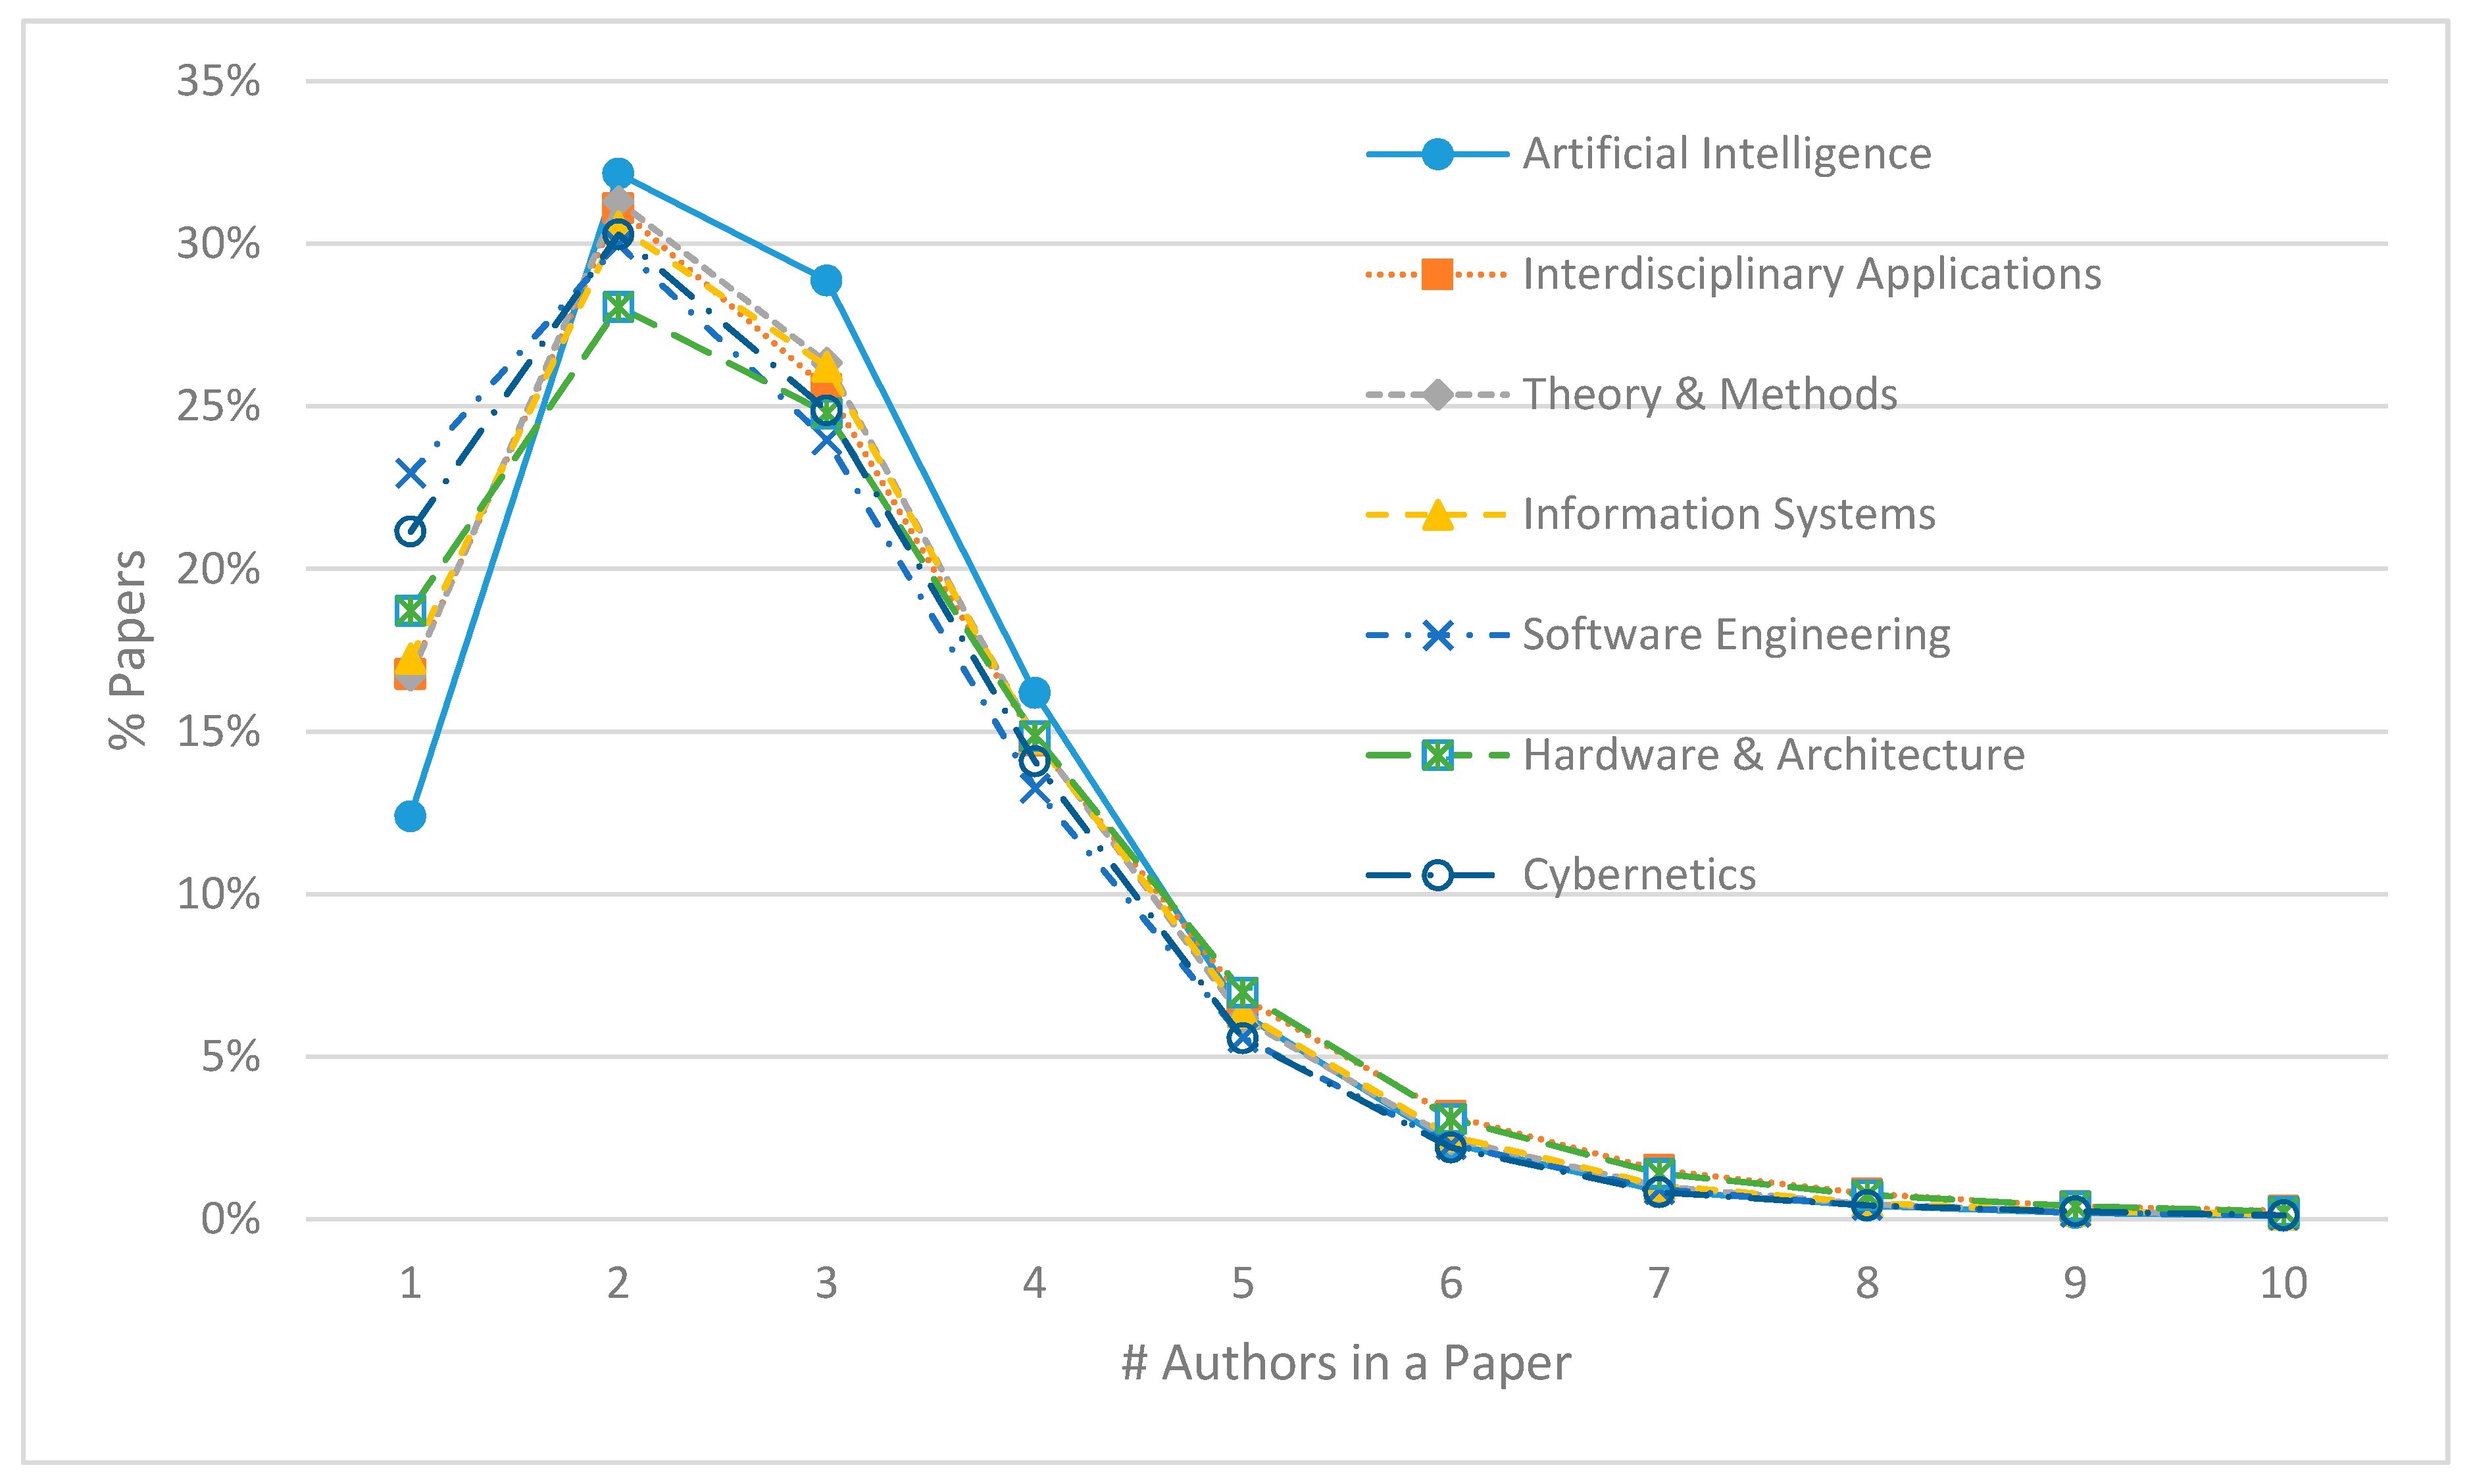
Furthermore, the most frequent number of authors in the articles under investigation was 2 (around 30% in all computer science categories), followed by 3 and 1, except for “Artificial Intelligence” where 4 was yet more frequent than 1 (see Figure 2). The largest share span exists for solo publications (with one author only): from 12.4% in “Artificial Intelligence” to 22.9% in “Software Engineering”, which can thus be proclaimed the most individual computer science discipline. This is corroborated by the mean number of authors per paper which varied from 2.67 in “Software Engineering” to 2.94 in “Hardware & Architecture”. The percentage of papers authored by 10 or more researchers was found to be minuscule in all fields of computer science.
3.3. Production and Impact of Countries, Institutions and Publication Sources
3.3.1. Countries
The country of origin of computer science, the USA, is by far the primary source of computing publications with 24.8% of all papers, followed by China (13.7%), the United Kingdom (5.7%), Japan (5.4%), and Germany (5.2%) as shown in Table 4. However, the impact of U.S. computer science research is even more outstanding with 46% of all citations referencing papers from that country. No other nation exceeds 10% of citations, with the second best United Kingdom (UK) reaching 8.4%. (England, Scotland, Wales, and Northern Ireland are merged into the UK for the purpose of this study.) In terms of relative impact (CPP), the UK is actually quite close to the USA with 9.1 vs. 11.4 CPP while the three large Far-Eastern nations are clearly underperforming: China, Japan, and South Korea have 2.6, 3.9, and 3.6 citations per paper, respectively. A similarly low impact can be seen for the isolated “giants” India and Brazil (both 3.5). In contrast, two “dwarfs” have a higher relative citation impact than the USA (Israel with 13.1 and Switzerland with 11.8) and one country (Netherlands) is relatively more influential than the UK with 9.8 citations per paper.
3.3.2. Institutions
At the level of institutions (see Table 5), “Chinese Acad Sci” is the leading body in terms of the number of papers produced, closely followed by “Univ Illinois”, “IBM Corp”, “Carnegie Mellon Univ”, and “MIT” with at least 0.6% of papers each. The Massachussetts Institutte of Technology (MIT) has, at the same time, the largest proportion of citations received (2.5%). This means that on average every 40th citation to a computer science publication refers to a paper co-authored by MIT researchers. MIT is also the institution with the second highest relative citation impact of 27.3 citations per paper, after the University of California Berkeley (29.7) and before Stanford University (25.1). Not surprisingly, Chinese universities display the least impact, both absolute and relative, from the top 20 institutions: “Zhejiang Univ” and “Shanghai Jiao Tong Univ” have both a 0.2% share in citations and 3.0 and 3.4 CPP, respectively.
3.3.3. Publication Sources
As far as the publication sources are concerned (see Table 6), the most papers appeared in the well-known book series Lecture Notes in Computer Science with about 0.6% of all papers published, followed by the respected journals Journal of Computational Physics, IEEE Transactions on Information Theory, Theoretical Computer Science, Computers & Structures, Bioinformatics, and Expert Systems with Applications that have a share of 0.5% each. At the same time, Bioinformatics also received the most citations (3.8%) and has the largest number of citations per paper (49.4). The other two extraordinarily well cited sources are IEEE Transactions on Information Theory (39.5 CPP) and Journal of Computational Physics (37.5 CPP). On the other hand, the most prolific publication venue, Lecture Notes in Computer Science, is relatively rarely cited (3.6 CPP), which is certainly due to its focus on reprinted conference papers that are themselves scarcely cited as discussed above. However, in the top 20 publication sources there are two journals with an even lower citedness: IEICE Transactions on Fundamentals of Electronics Communications and Computer Sciences with 2.6 citations per paper and IEICE Transactions on Information and Systems with 2.1. One of the flagship publications of the Association for Computing Machinery (ACM), which has played a crucial role in the advancement of computer science in the world, Communications of the ACM, ranks fourth in the top 20 in terms of both papers and citations.
3.4. Computer Science Conferences
3.4.1. Time
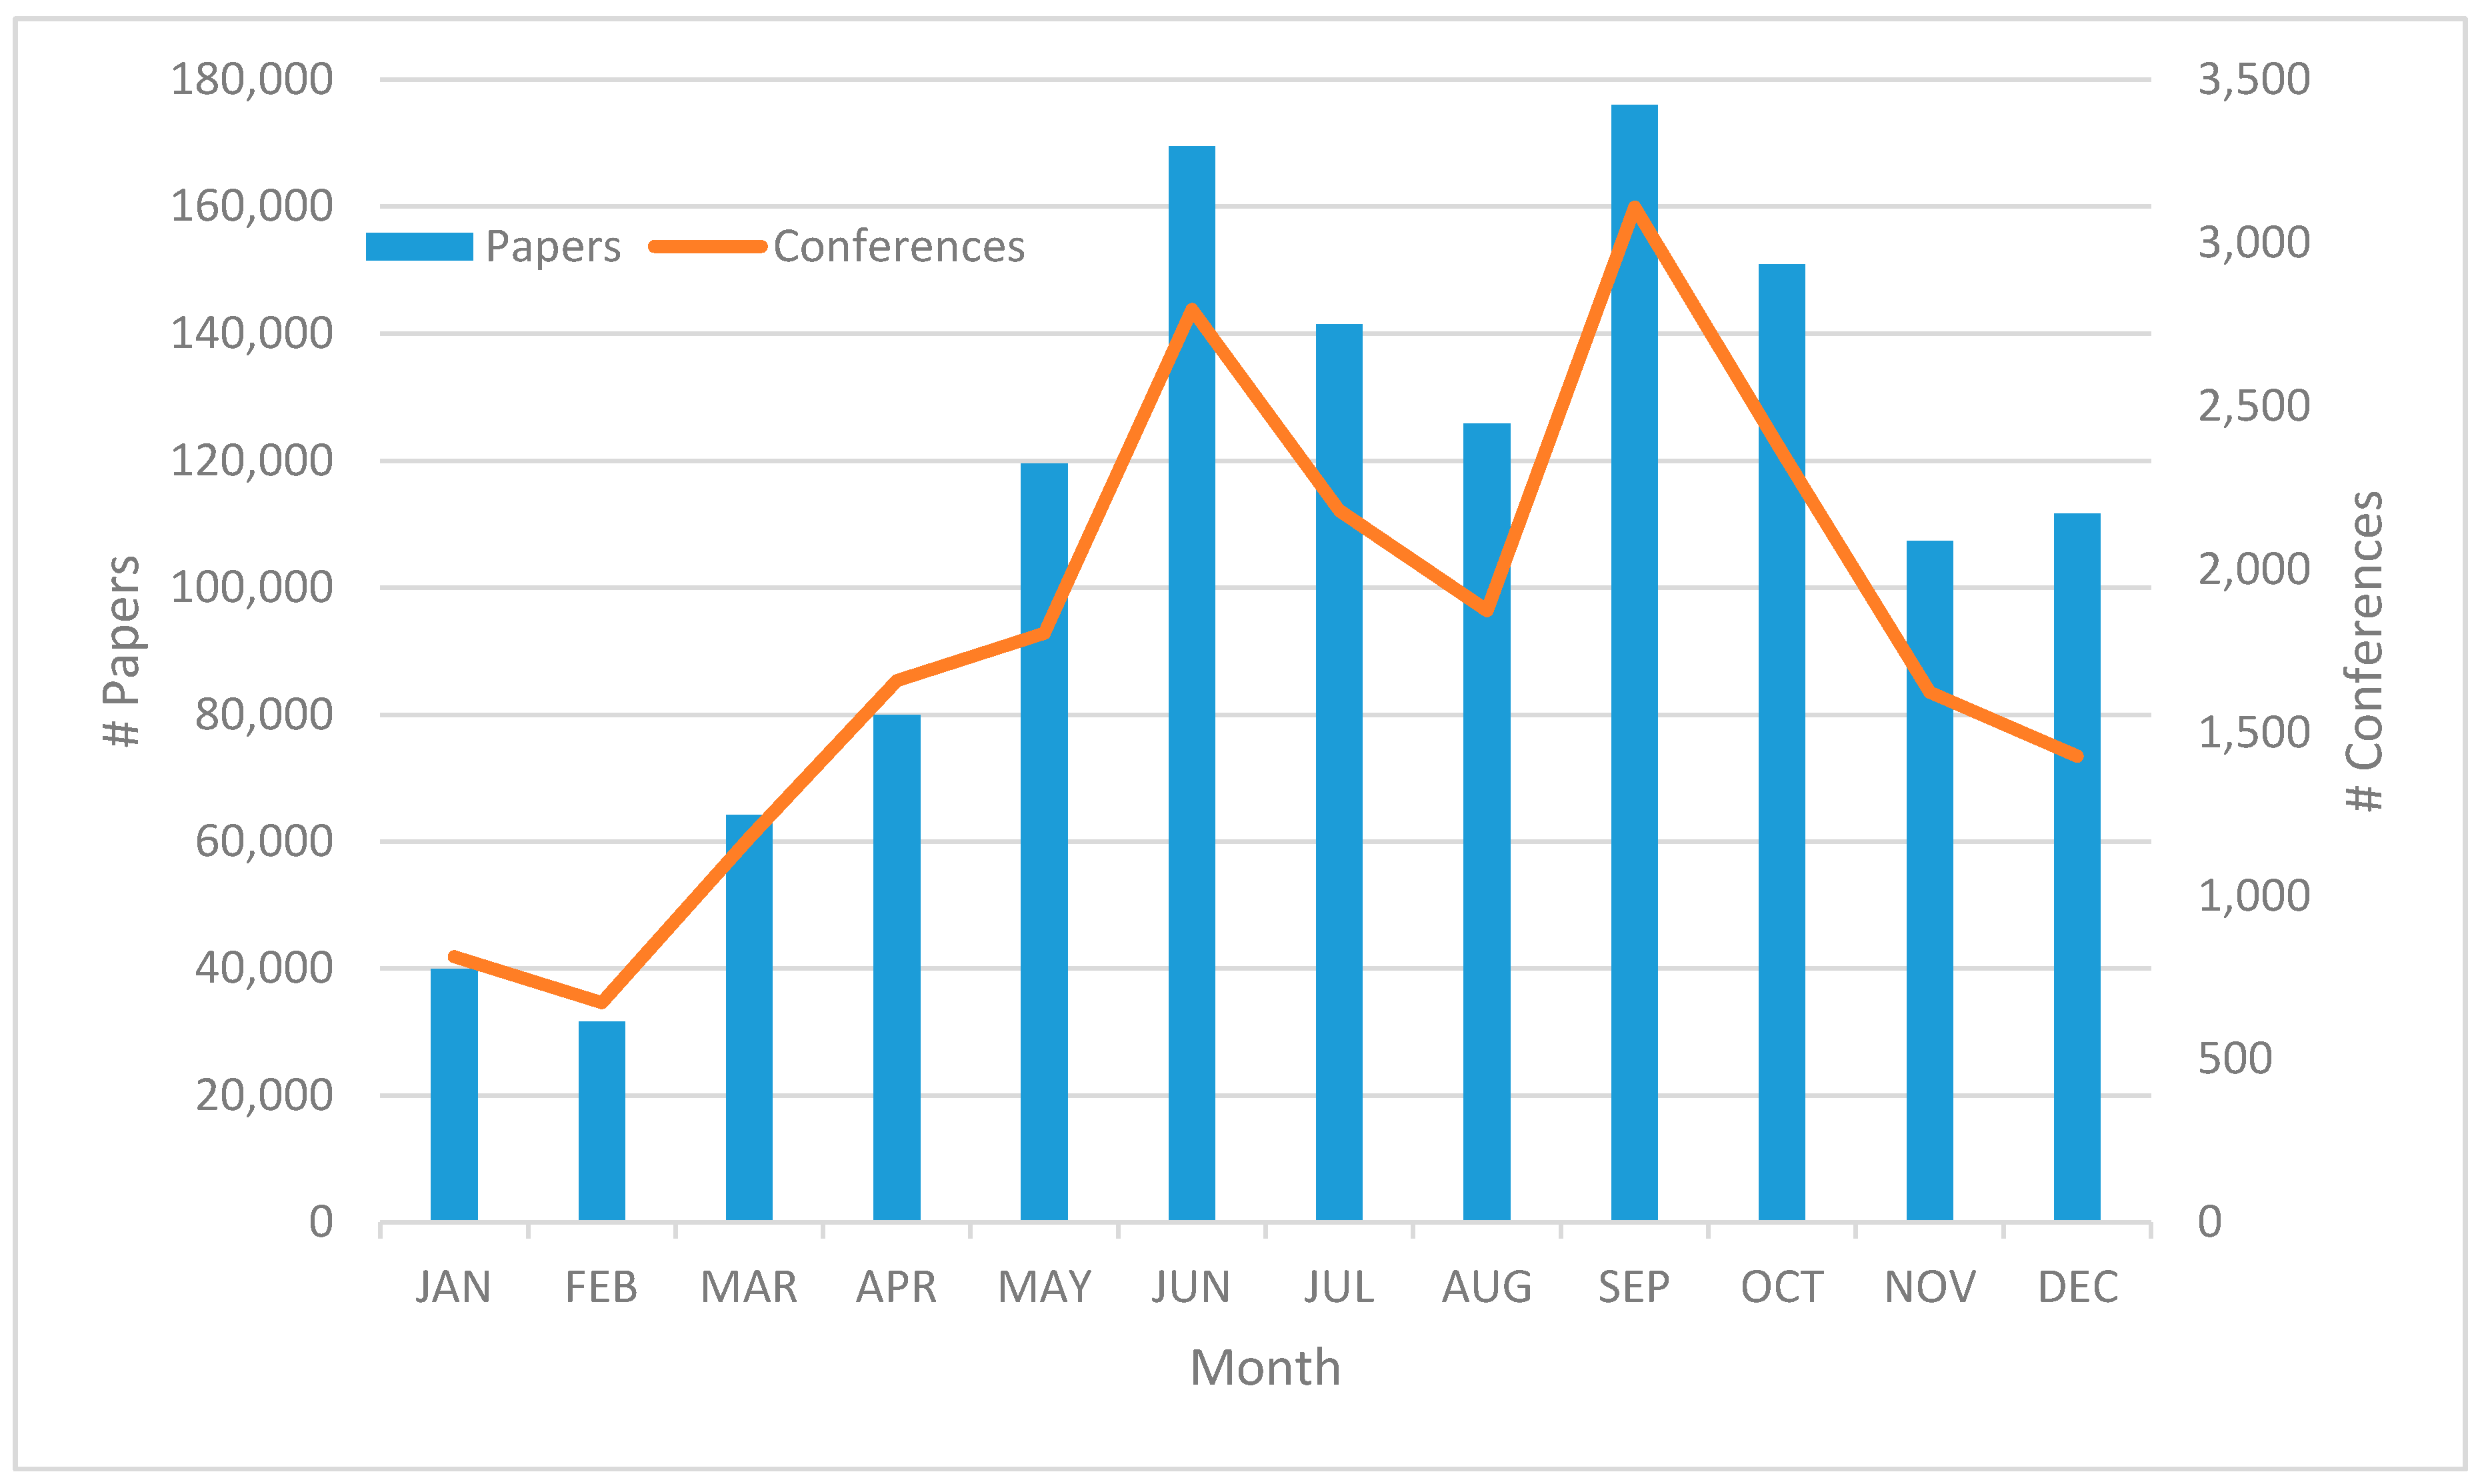
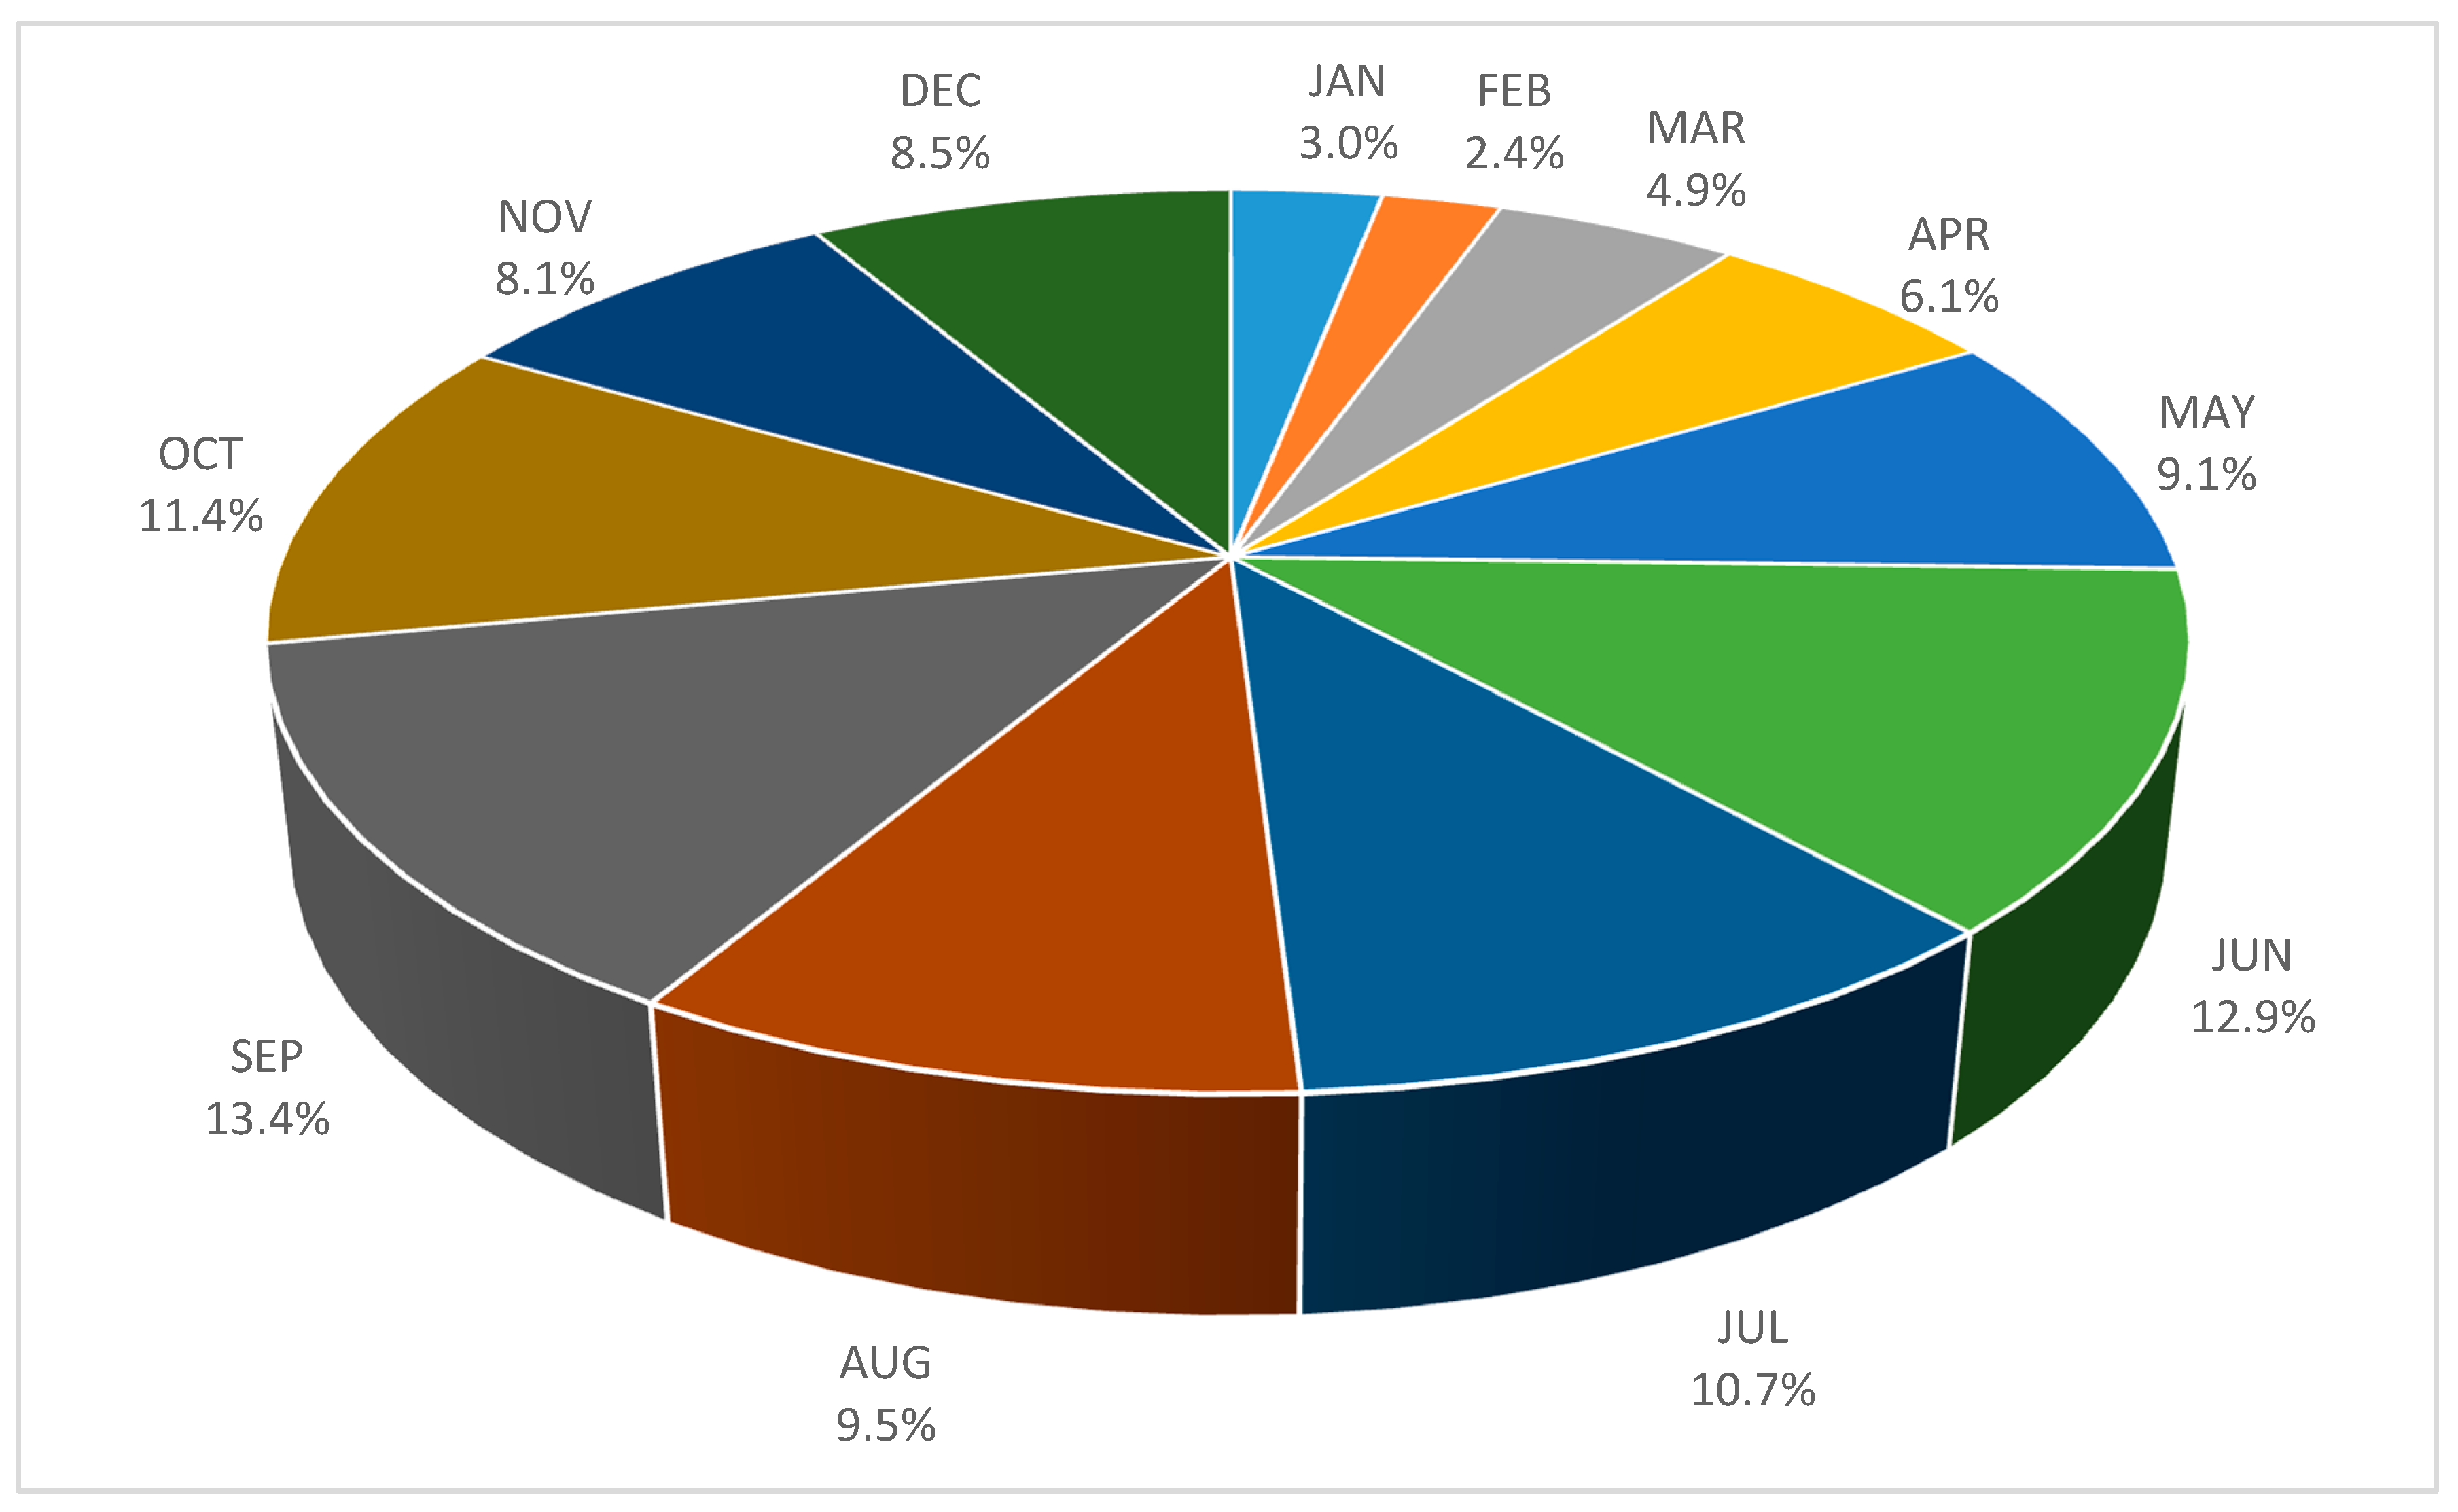
Having mentioned the role of proceedings papers in computer science, in Figure 3 we can see how the individual months of the year were attractive for conferences to be held. The red line represent the number of conferences taking place in a specific month and the blue bars stand for the number of papers published at those conferences. (If a conference spans over two months, both are counted in.) It is clearly visible in the chart that the conference “high season” starts in May and ends in October, with November and particularly December being also strong months. The weakest month is February with 673 conferences at which 31,613 papers were presented, compared to the most productive September with 3110 conferences and about 176,020 papers. The average number of papers per conference thus changes from 47.0 in February (the all-month low) to 56.6 in September. However, the largest conferences were held in December with an average of 78.2 papers per conference. The percentage shares of papers published at conferences in various months range from 2.4% in February to 13.4% in May (see Figure 4). Altogether, two thirds of computer science conference papers were presented in the high season from May to October.
3.4.2. Location
As far as the location of computer science conferences is concerned, Figure 5 shows the top 20 most popular destinations in terms of the number of conferences taking place there and the number of papers presented at them. Beijing, Orlando, Shanghai, San Diego, and Singapore are the most sought-after places for conference organizers and participants. Beijing alone hosted 312 conferences with 36,284 papers, but the most conferences (370) were held in Orlando, albeit with fewer papers (29,633). In general, we can notice that Chinese conferences tend to be larger with more papers per conference (Beijing 116.3, Shanghai 147.3, and Wuhan 157.3) than the North American or European ones (San Jose 45.7, London 45.5, and Paris 41.5). The only two other venues approaching the size of Chinese conferences are Las Vegas (103.2) and Istanbul (109.6).
3.5. Author Keywords
To get a clue how the topics of computer science papers evolved over the whole period 1945–2004, Table 7 shows the 20 most frequent author keywords associated with the papers in the whole period and in several subperiods. There were very few keywords for papers published before 1990 so we decided to start our 5-year subintervals with the year 1995. The most frequent keywords in the whole period under investigation were “simulation”, “neural networks”, “data mining”, “optimization”, and “genetic algorithm” which mostly all appeared in the subperiods, albeit not with the same frequency. Whereas “simulation”, “optimization”, and “neural networks” always were in the top 20 (although the last one with a seemingly declining popularity after 2005), “genetic algorithm” appeared there only after 1995 and “data mining” even only after 2000. Morever, some keywords were popular solely in a certain subperiod and not in the others (highlighted in bold intalics in Table 7): “expert systems”, “parallel algorithms”, “computational geometry”, “theory”, “computational complexity”, and “analysis of algorithms” before 1995, “multimedia”, “ATM”, and “segmentation” in 1995–1999, “XML” and “Java” in 2000–2004, and “cloud computing”, “component”, and “particle swarm optimization” in 2010–2014. There were no unique keywords in the top 20 in 2005–2009, which may indicate a kind of “innovation break” in that time range.
3.6. Citations and References
3.6.1. Cited References
An important part of our investigation was an analysis of the more than 32 million cited references found in our data collection of over 1.9 million bibliographic records. The top 20 cited references sorted by their frequency (count) are shown in Table 8. Where available, their DOI is also displayed along with them. For instance, the reference to Zadeh’s 1965 Information Control paper appeared 9961 times, i.e., in about 0.5% of the papers in our data set. At the same time, this paper (or more precisely, its bibliographic record) is also part of our “core” data collection and, therefore, it is possible to determine its “Times Cited” (the number of citations in Web of Science terminology) figure, which is 20,069, approximately 0.2% of all citations to the papers in our data set. On the other hand, however, the second most frequently appearing reference is to a 1989 genetic algorithms book by Goldberg, which is not present in the data set under study, and its “Times Cited” information is thus unavailable. In addition to books, there are also references to journals outside of computer science such as Science or Proceedings of the IEEE whose citations cannot be retrieved from our data either. As to Zadeh himself, there is another quite frequently appearing reference to his 1975 Information Sciences paper with almost 3000 occurrences.
3.6.2. The Most Cited Papers
An interesting question in the context of citations is whether there is a discrepancy between highly cited references and highly cited papers (in the core collection). To explore this, let us have a look at Table 9 with a list of top 20 papers by their citation counts. The most frequently cited paper is the 1965 Zadeh’s article that we already know as the most highly cited reference. Thus, the top cited reference and the top cited paper are identical. However, in Table 9 there follow two Bioinformatics papers that do not appear as highly cited references in Table 8. What does this mean? It simply tells us that these papers are more frequently cited from outside of computer science than from within. Their contributions are more appreciated in other scientific fields than in computing itself. In fact, there are more such papers in Table 9: six Bioinformatics papers in total, two Journal of Computational Physics articles, one Computer Journal paper, one Journal of Molecular Graphics and Modelling paper, and others. All of these articles were thus apparently of high interest for the non-computing scientific community.
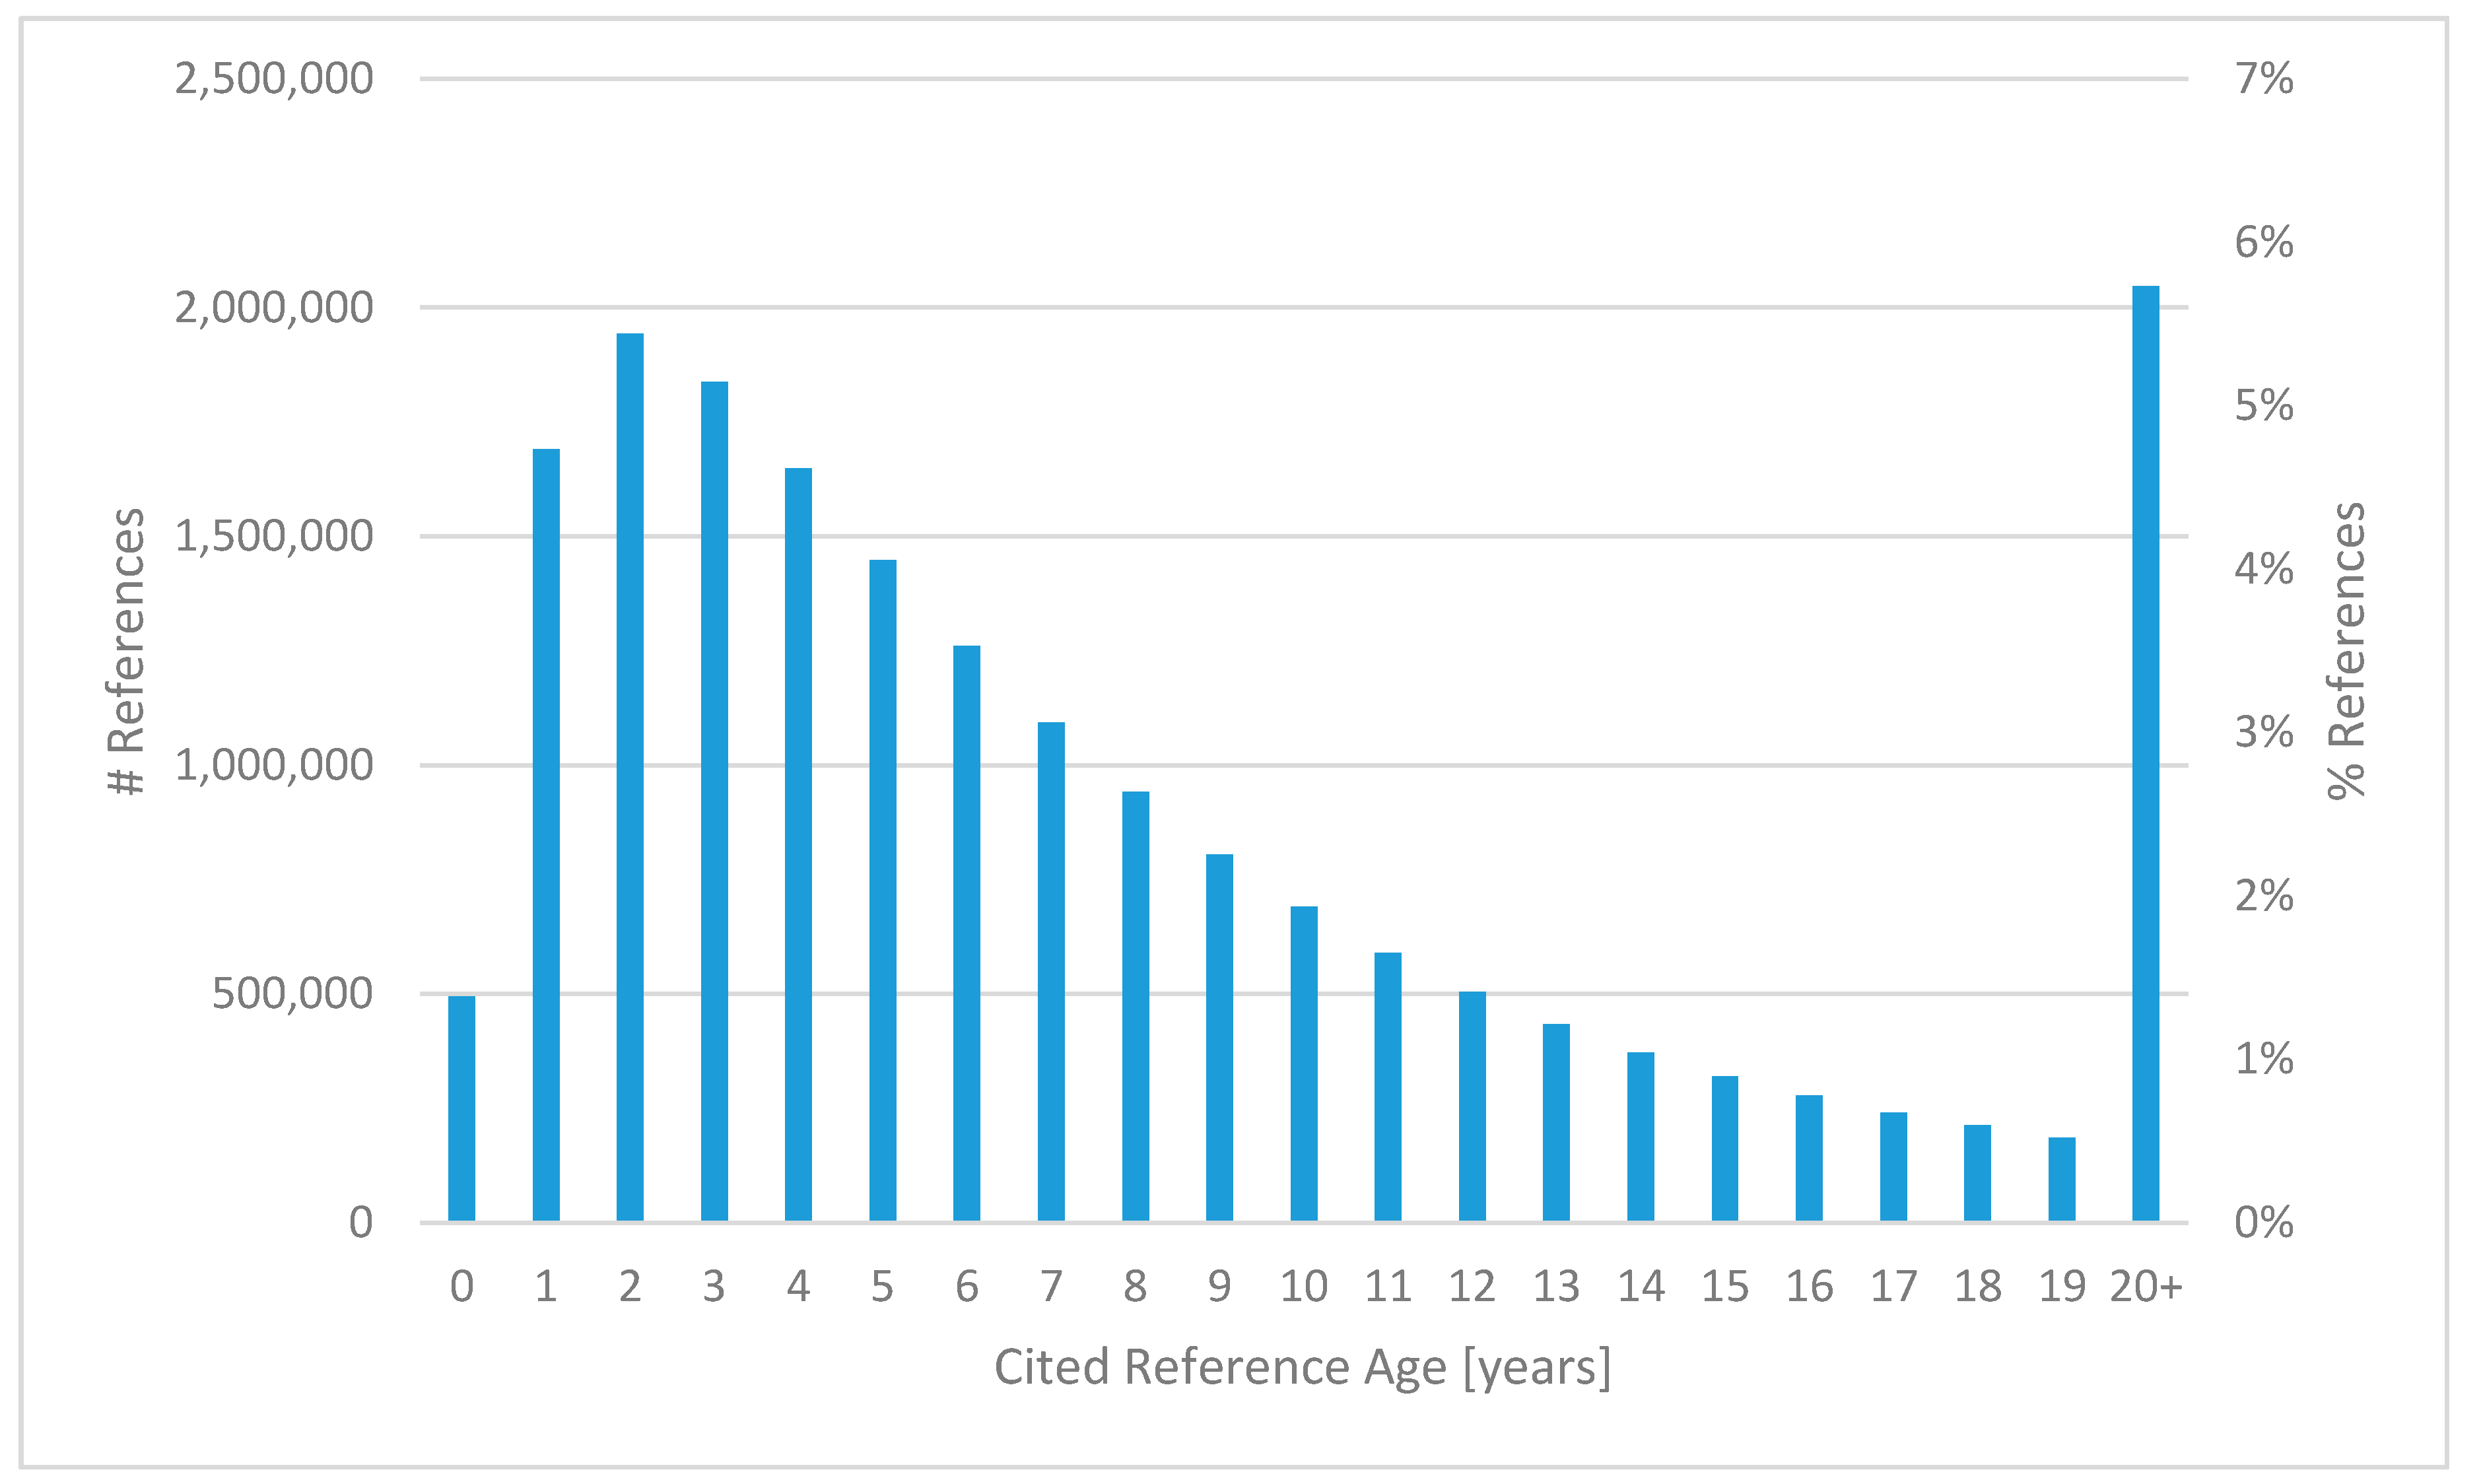
3.6.3. Age of Cited References
The distribution of the age in years of the cited references is depicted in Figure 6. The most frequent age of cited references is two years (6.0%), followed by three years (5.7%), one year (5.3%), and four years (5.1%). 1.5% of references were made to a paper published in the same year (of age 0), but still 6.4% of references cited publications of age 20 or older. For a more detailed analysis of the age of references in computer science, we refer the reader to a recent study [17].
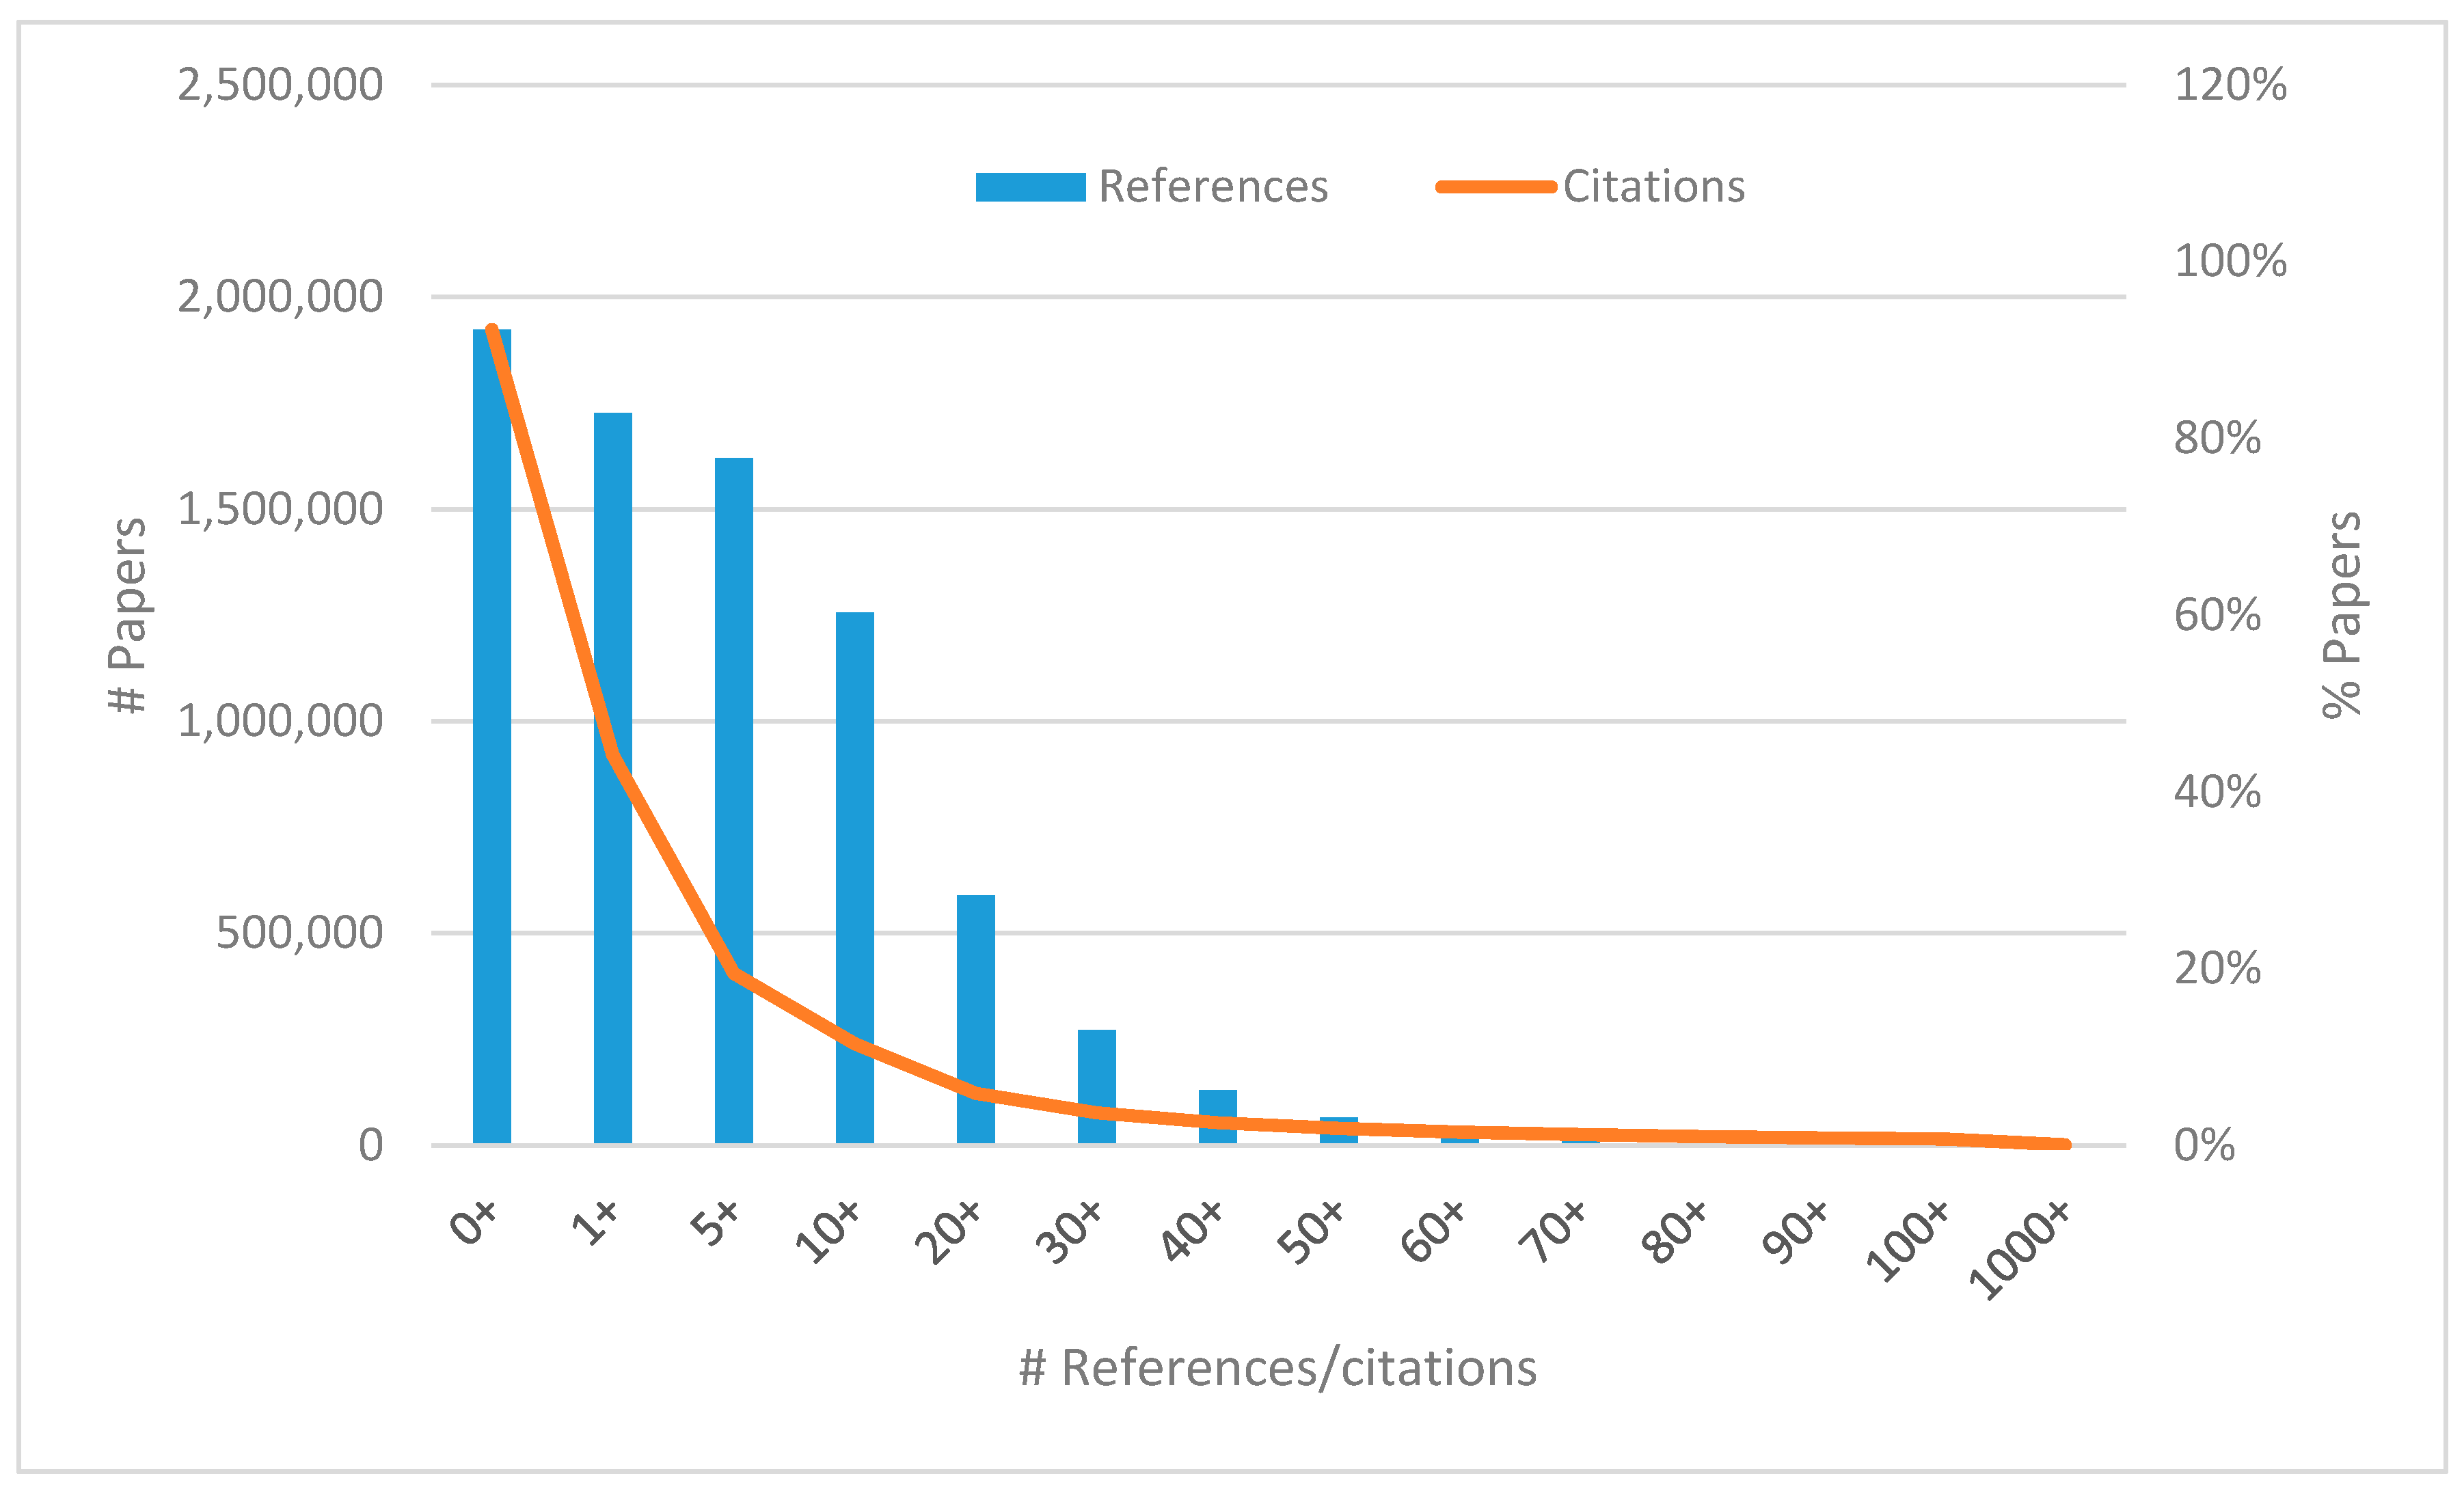
3.6.4. Number of Citations and References per Paper
In Figure 7 we can see that the share of papers having five or more references is still over 80% while that of papers being cited five or more times is close to 20%. In fact, most papers (52.2%) remain uncited, which is a well-known fact in scientometrics. Less than one percent of papers are cited 100 or more times, but these papers receive about one third of overall citations. Seven papers (see Table 9) exceeded 10,000 citations. There were also papers with an extremely high number of references (with 11 of them having 1000 or more references), but generally one in three papers cited between 10 (including) and 20 (excluding) other publications.
5. Conclusions
Computer science is one of the many research fields indexed in the Web of Science database by Thomson Reuters (now Clarivate Analytics). A distinctive feature of this discipline is its greater reliance on conference publications than it is the rule in other fields of science. However, conference proceedings papers are, to some extent, also indexed in Web of Science: namely in the Conference Proceedings Citation Index. Thus, it is possible to carry out bibliometric studies of computer science based on the data from Web of Science and this is precisely what we do in the present analysis. We investigated 1.9 million bibliographic records on computer science papers published from 1945 to 2014. We acquired the data in August 2015 and used them for the following main contributions:
- We inspected the number of papers and citations according to document types, languages, computer science subfields, countries, institutions, and publication sources.
- We explored the most frequent author keywords, cited references, and cited papers and the distribution of the number of references and citations per paper and of the age of cited references.
- We investigated the time and place of computer science conferences in terms of the months of the year and locations where the most conferences took place and the most papers were published.
- We analyzed the production of journal articles and conference papers over time and the collaborativeness in different computer science disciplines.
Some of the most interesting findings are as follows:
- The most productive computing subfield is “Artificial Intelligence” with almost 32% of all papers, but the biggest relative impact is associated with “Interdisciplinary Applications”. The most collaborative discipline is “Hardware & Architecture” with an average of 2.94 authors per publication and the least collaborative is “Software Engineering” with 2.67 authors per paper.
- The popularity of “neural networks” seems to be declining lately whereas “cloud computing” has been trending in the most recent period and “XML” and “Java”, so fashionable at the beginning of the 2000s, have disappeared from the top 20 most frequent keywords since then.
- Two thirds of all conference proceedings papers were published at conferences taking place in the “high season” of the year from May to October with the most popular destinations being Beijing, Orlando, Shanghai, and San Diego. Also, it turns out that Chinese conferences tend to be much larger (with a higher number of papers presented) than the North American or European ones.
A limitation of this study is the lack of author identifiers that prevents us from disambiguating author names properly. The presence of ResearcherID or OrcID in the bibliographic data was so scarce (only for several percent of authors) that we decided to discard any author-related analysis completely. If the problem with the missing author IDs is resolved in the future (as Web of Science is known to continually update its records), we would like to complement our study with the production and impact information about authors too. Another missing aspect in this study is the analysis of the collaboration of countries and institutions in computer science and thus production and impact indicators thereof. We believe that this should be a concern of some follow-up research.
Acknowledgments
This work was supported in part by the Ministry of Education, Youth and Sports of the Czech Republic under grant No. LO1506 and by the Slovak Grant Agency of the Ministry of Education and Academy of Science of the Slovak Republic under grant No. 1/0493/16. Thanks are also due to Thomson Reuters for providing us with access to the data. Finally, we would like to thank Ján Paralič for the many useful discussions.
Author Contributions
D.F. conceived and designed the experiments; D.F. and G.T. performed the experiments; D.F. analyzed the data; D.F. contributed analysis tools; D.F. and G.T. wrote the paper.
Conflicts of Interest
The authors declare no conflict of interest.
References
- Xie, Z.; Willett, P. The development of computer science research in the People’s Republic of China 2000–2009: A bibliometric study. Inf. Dev. 2013, 29, 251–264. [Google Scholar] [CrossRef]
- Bakri, A.; Willett, P. Computer science research in Malaysia: A bibliometric analysis. Aslib. Proc. 2011, 63, 321–335. [Google Scholar] [CrossRef]
- Gupta, B.M.; Kshitij, A.; Verma, C. Mapping of Indian computer science research output, 1999–2008. Scientometrics 2011, 86, 261–283. [Google Scholar] [CrossRef]
- Arruda, D.; Bezerra, F.; Neris, V.A.; de Toro, P.R.; Wainera, J. Brazilian computer science research: Gender and regional distributions. Scientometrics 2009, 79, 651–665. [Google Scholar] [CrossRef]
- Kumar, S.; Garg, K.C. Scientometrics of computer science research in India and China. Scientometrics 2005, 64, 121–132. [Google Scholar] [CrossRef]
- Fiala, D.; Willett, P. Computer science in Eastern Europe 1989–2014: A bibliometric study. Aslib. J. Inf. Manag. 2015, 67, 526–541. [Google Scholar] [CrossRef]
- Wainer, J.; Xavier, E.C.; Bezerra, F. Scientific production in computer science: A comparative study of Brazil and other countries. Scientometrics 2009, 81, 535–547. [Google Scholar] [CrossRef]
- Guan, J.; Ma, N. A comparative study of research performance in computer science. Scientometrics 2004, 61, 339–359. [Google Scholar] [CrossRef]
- Ma, R.; Ni, C.; Qiu, J. Scientific research competitiveness of world universities in computer science. Scientometrics 2008, 76, 245–260. [Google Scholar] [CrossRef]
- Bar-Ilan, J. Web of Science with the Conference Proceedings Citation Indexes: The case of computer science. Scientometrics 2010, 83, 809–824. [Google Scholar] [CrossRef]
- Franceschet, M. The role of conference publications in CS. Commun. ACM 2010, 53, 129–132. [Google Scholar] [CrossRef]
- Franceschet, M. The skewness of computer science. Inf. Process. Manag. 2011, 47, 117–124. [Google Scholar] [CrossRef]
- Vrettas, G.; Sanderson, M. Conferences versus journals in computer science. J. Assoc. Inf. Sci. Technol. 2015, 66, 2674–2684. [Google Scholar] [CrossRef]
- Tsai, C.-F. Citation impact analysis of top ranked computer science journals and their rankings. J. Informetr. 2014, 8, 318–328. [Google Scholar] [CrossRef]
- Sicilia, M.-A.; Sánchez-Alonso, S.; García-Barriocanal, E. Comparing impact factors from two different citation databases: The case of Computer Science. J. Informetr. 2011, 5, 698–704. [Google Scholar] [CrossRef]
- Fernandes, J.; Monteiro, M.P. Evolution in the number of authors of computer science publications. Scientometrics 2017, 110, 529–539. [Google Scholar] [CrossRef]
- Šubelj, L.; Fiala, D. Publication boost in Web of Science journals and its effect on citation distributions. J. Assoc. Inf. Sci. Technol. 2017, 68, 1018–1023. [Google Scholar] [CrossRef]
- Arik, B.T.; Arik, E. “Second Language Writing” Publications in Web of Science: A Bibliometric Analysis. Publications 2017, 5, 4. [Google Scholar] [CrossRef]
Figure 1.
Number of articles (Left) and proceedings papers (Right) published in individual years.

Figure 2.
Distribution of the number of authors in papers in different subject categories.

Figure 3.
Number of papers published (Left) and conferences being held (Right) in individual months.
Figure 3.
Number of papers published (Left) and conferences being held (Right) in individual months.

Figure 4.
Shares of conference papers published in the individual months of the year.

Figure 5.
Number of papers published at conferences (Left) and conferences being held (Right) in specific locations.
Figure 5.
Number of papers published at conferences (Left) and conferences being held (Right) in specific locations.

Figure 6.
Distribution of the age (in years) of cited references.

Figure 7.
Distribution of the number of references and citations per paper.


Table 1.
Document types and their counts, citations, and citations per paper (CPP).
| Document Type | Count | % | Citations | % | CPP |
|---|---|---|---|---|---|
| Proceedings Paper | 1,079,007 | 56.1% | 1,263,644 | 10.7% | 1.2 |
| Article | 668,603 | 34.8% | 8,940,949 | 75.6% | 13.4 |
| Article; Proceedings Paper | 166,435 | 8.7% | 1,286,063 | 10.9% | 7.7 |
| Review | 7007 | 0.4% | 326,397 | 2.8% | 46.6 |
| Article; Book Chapter | 185 | 0.0% | 386 | 0.0% | 2.1 |
| Review; Book Chapter | 16 | 0.0% | 149 | 0.0% | 9.3 |
Table 2.
Document languages (n > 500) and their papers, citations, and citations per paper (CPP).
| Language | Papers | % | Citations | % | CPP |
|---|---|---|---|---|---|
| English | 1,903,112 | 99.0% | 11,801,846 | 99.9% | 6.2 |
| Chinese | 5621 | 0.3% | 602 | 0.0% | 0.1 |
| Russian | 4290 | 0.2% | 4326 | 0.0% | 1.0 |
| German | 4183 | 0.2% | 7853 | 0.1% | 1.9 |
| French | 1675 | 0.1% | 3519 | 0.0% | 2.1 |
| Portuguese | 1265 | 0.1% | 326 | 0.0% | 0.3 |
| Turkish | 950 | 0.0% | 61 | 0.0% | 0.1 |
| Spanish | 885 | 0.0% | 147 | 0.0% | 0.2 |
| Japanese | 558 | 0.0% | 30 | 0.0% | 0.1 |
Table 3.
Subject categories and their papers, citations, and citations per paper (CPP).
| Subject Category | Papers | % | Citations | % | CPP |
|---|---|---|---|---|---|
| Artificial Intelligence | 611,366 | 31.8% | 3,298,853 | 27.9% | 5.4 |
| Theory & Methods | 581,521 | 30.3% | 2,767,757 | 23.4% | 4.8 |
| Information Systems | 511,748 | 26.6% | 2,410,503 | 20.4% | 4.7 |
| Interdisciplinary Applications | 402,172 | 20.9% | 3,230,262 | 27.3% | 8.0 |
| Software Engineering | 341,637 | 17.8% | 2,015,377 | 17.1% | 5.9 |
| Hardware & Architecture | 282,581 | 14.7% | 1,598,521 | 13.5% | 5.7 |
| Cybernetics | 89,433 | 4.7% | 491,307 | 4.2% | 5.5 |
Table 4.
Top 20 countries and their papers, citations, and citations per paper (CPP).
| Country | Papers | % | Citations | % | CPP |
|---|---|---|---|---|---|
| USA | 477,760 | 24.8% | 5,430,958 | 46.0% | 11.4 |
| China | 262,613 | 13.7% | 669,698 | 5.7% | 2.6 |
| United Kingdom | 108,781 | 5.7% | 989,967 | 8.4% | 9.1 |
| Japan | 104,310 | 5.4% | 404,102 | 3.4% | 3.9 |
| Germany | 100,717 | 5.2% | 670,436 | 5.7% | 6.7 |
| France | 82,662 | 4.3% | 615,970 | 5.2% | 7.5 |
| Canada | 74,803 | 3.9% | 606,422 | 5.1% | 8.1 |
| Italy | 64,304 | 3.3% | 400,985 | 3.4% | 6.2 |
| South Korea | 55,676 | 2.9% | 198,198 | 1.7% | 3.6 |
| Spain | 55,336 | 2.9% | 312,639 | 2.6% | 5.6 |
| Taiwan | 53,903 | 2.8% | 287,067 | 2.4% | 5.3 |
| India | 47,830 | 2.5% | 168,522 | 1.4% | 3.5 |
| Australia | 46,369 | 2.4% | 302,303 | 2.6% | 6.5 |
| Netherlands | 33,387 | 1.7% | 328,508 | 2.8% | 9.8 |
| Brazil | 23,446 | 1.2% | 81,266 | 0.7% | 3.5 |
| Singapore | 22,040 | 1.1% | 149,271 | 1.3% | 6.8 |
| Poland | 21,904 | 1.1% | 104,936 | 0.9% | 4.8 |
| Switzerland | 21,446 | 1.1% | 252,230 | 2.1% | 11.8 |
| Israel | 19,838 | 1.0% | 259,866 | 2.2% | 13.1 |
| Greece | 19,138 | 1.0% | 102,949 | 0.9% | 5.4 |
Table 5.
Top 20 institutions and their papers, citations, and citations per paper (CPP).
| Institution | Papers | % | Citations | % | CPP |
|---|---|---|---|---|---|
| Chinese Acad Sci | 13,816 | 0.7% | 63,745 | 0.5% | 4.6 |
| Univ Illinois | 12,404 | 0.6% | 185,659 | 1.6% | 15.0 |
| IBM Corp | 12,210 | 0.6% | 216,376 | 1.8% | 17.7 |
| Carnegie Mellon Univ | 10,942 | 0.6% | 182,021 | 1.5% | 16.6 |
| MIT | 10,887 | 0.6% | 297,672 | 2.5% | 27.3 |
| Stanford Univ | 9528 | 0.5% | 238,820 | 2.0% | 25.1 |
| Nanyang Technol Univ | 9350 | 0.5% | 63,115 | 0.5% | 6.8 |
| Indian Inst Technol | 8702 | 0.5% | 56,667 | 0.5% | 6.5 |
| Natl Univ Singapore | 8671 | 0.5% | 71,850 | 0.6% | 8.3 |
| Univ Calif Berkeley | 8322 | 0.4% | 247,343 | 2.1% | 29.7 |
| Univ Maryland | 8260 | 0.4% | 129,641 | 1.1% | 15.7 |
| Georgia Inst Technol | 8252 | 0.4% | 87,131 | 0.7% | 10.6 |
| Univ Texas | 8116 | 0.4% | 116,438 | 1.0% | 14.3 |
| Univ So Calif | 7488 | 0.4% | 110,609 | 0.9% | 14.8 |
| Purdue Univ | 7428 | 0.4% | 83,221 | 0.7% | 11.2 |
| Zhejiang Univ | 7269 | 0.4% | 22,046 | 0.2% | 3.0 |
| Univ Tokyo | 7107 | 0.4% | 43,407 | 0.4% | 6.1 |
| Univ Waterloo | 6864 | 0.4% | 63,152 | 0.5% | 9.2 |
| Shanghai Jiao Tong Univ | 6803 | 0.4% | 23,110 | 0.2% | 3.4 |
| Univ Michigan | 6495 | 0.3% | 99,018 | 0.8% | 15.2 |
Table 6.
Top 20 sources and their papers, citations, and citations per paper (CPP).
| Source | Papers | % | Citations | % | CPP |
|---|---|---|---|---|---|
| Lecture Notes in Computer Science | 11,259 | 0.6% | 41,035 | 0.3% | 3.6 |
| Journal of Computational Physics | 9952 | 0.5% | 373,580 | 3.2% | 37.5 |
| IEEE Transactions on Information Theory | 9399 | 0.5% | 371,002 | 3.1% | 39.5 |
| Theoretical Computer Science | 9337 | 0.5% | 95,350 | 0.8% | 10.2 |
| Computers & Structures | 9001 | 0.5% | 105,860 | 0.9% | 11.8 |
| Bioinformatics | 8995 | 0.5% | 444,093 | 3.8% | 49.4 |
| Expert Systems with Applications | 8987 | 0.5% | 96,905 | 0.8% | 10.8 |
| IEICE Transactions on Fundamentals of Electronics Communications and Computer Sciences | 7830 | 0.4% | 20,270 | 0.2% | 2.6 |
| Computer Physics Communications | 7648 | 0.4% | 168,903 | 1.4% | 22.1 |
| Pattern Recognition | 6584 | 0.3% | 143,449 | 1.2% | 21.8 |
| Fuzzy Sets and Systems | 6566 | 0.3% | 147,330 | 1.2% | 22.4 |
| Mathematical and Computer Modelling | 6445 | 0.3% | 46,066 | 0.4% | 7.1 |
| Information Sciences | 6377 | 0.3% | 98,612 | 0.8% | 15.5 |
| Information Processing Letters | 6375 | 0.3% | 52,380 | 0.4% | 8.2 |
| Communications of the ACM | 6266 | 0.3% | 204,955 | 1.7% | 32.7 |
| Neurocomputing | 6161 | 0.3% | 54,390 | 0.5% | 8.8 |
| Computers & Chemical Engineering | 5877 | 0.3% | 96,392 | 0.8% | 16.4 |
| IEICE Transactions on Information and Systems | 5809 | 0.3% | 12,208 | 0.1% | 2.1 |
| International Journal of Systems Science | 5607 | 0.3% | 31,563 | 0.3% | 5.6 |
| IEEE Transactions on Computers | 5537 | 0.3% | 121,900 | 1.0% | 22.0 |
Table 7.
Top 20 keywords in the whole period 1945–2014 and in different subperiods with unique keywords highlighted.
Table 7.
Top 20 keywords in the whole period 1945–2014 and in different subperiods with unique keywords highlighted.
| 1945–2014 | Before 1995 | 1995–1999 | 2000–2004 | 2005–2009 | 2010–2014 |
|---|---|---|---|---|---|
| simulation | algorithms | neural networks | neural networks | data mining | cloud computing |
| neural networks | neural networks | simulation | simulation | simulation | optimization |
| data mining | simulation | optimization | data mining | genetic algorithm | security |
| optimization | distributed systems | image processing | optimization | optimization | data mining |
| genetic algorithm | design | genetic algorithms | genetic algorithms | security | performance |
| algorithms | parallel processing | neural network | genetic algorithm | neural networks | simulation |
| classification | pattern recognition | algorithms | neural network | algorithms | algorithms |
| security | expert systems | pattern recognition | Internet | classification | genetic algorithm |
| performance | optimization | Internet | algorithms | performance | classification |
| design | parallel algorithms | multimedia | classification | clustering | design |
| clustering | modeling | scheduling | image processing | design | clustering |
| neural network | image processing | fuzzy logic | scheduling | neural network | wireless sensor networks |
| genetic algorithms | artificial intelligence | parallel processing | fuzzy logic | genetic algorithms | machine learning |
| scheduling | computational geometry | performance evaluation | modeling | ontology | ontology |
| machine learning | performance evaluation | classification | XML | scheduling | component |
| image processing | performance | ATM | security | machine learning | scheduling |
| ontology | theory | genetic algorithm | clustering | wireless sensor networks | particle swarm optimization |
| modeling | computational complexity | distributed systems | pattern recognition | image processing | reliability |
| fuzzy logic | neural network | artificial intelligence | performance | modeling | neural networks |
| wireless sensor networks | analysis of algorithms | segmentation | Java | reliability | neural network |
Table 8.
Top 20 cited references.
| Cited Reference | Count | % | Citations | % |
|---|---|---|---|---|
| Zadeh, L.A., 1965, INFORM CONTROL, V8, P338. doi 10.1016/S0019-9958(65)90241-X | 9961 | 0.5% | 20,069 | 0.2% |
| Goldberg, D.E., 1989, GENETIC ALGORITHMS S | 7941 | 0.4% | NA | NA |
| Garey, M.R., 1979, COMPUTERS INTRACTABI | 6646 | 0.3% | NA | NA |
| Lowe, D.G., 2004, INT J COMPUT VISION, V60, P91. doi 10.1023/B:VISI.0000029664.99615.94 | 6311 | 0.3% | 11,010 | 0.1% |
| Dempster, A.P., 1977, J ROY STAT SOC B MET, V39, P1 | 5954 | 0.3% | NA | NA |
| Holland, J.H., 1975, ADAPTATION NATURAL A | 5099 | 0.3% | NA | NA |
| Kirkpatrick, S., 1983, SCIENCE, V220, P671. doi 10.1126/SCIENCE.220.4598.671 | 4525 | 0.2% | NA | NA |
| Takagi, T., 1985, IEEE T SYST MAN CYB, V15, P116 | 3848 | 0.2% | 7027 | 0.1% |
| Vapnik, V.N., 1995, NATURE STAT LEARNING | 3723 | 0.2% | NA | NA |
| Rabiner, L.R., 1989, P IEEE, V77, P257. doi 10.1109/5.18626 | 3433 | 0.2% | NA | NA |
| Cortes, C., 1995, MACH LEARN, V20, P273. doi 10.1023/A:1022627411411 | 3272 | 0.2% | 6933 | 0.1% |
| Canny, J., 1986, IEEE T PATTERN ANAL, V8, P679 | 3207 | 0.2% | 6725 | 0.1% |
| Turk, M., 1991, J COGNITIVE NEUROSCI, V3, P71. doi 10.1162/JOCN.1991.3.1.71 | 3171 | 0.2% | NA | NA |
| Breiman, L., 1996, MACH LEARN, V24, P123. doi 10.1023/A:1018054314350 | 3169 | 0.2% | 5593 | 0.0% |
| Pawlak, Z., 1982, INT J COMPUT INF SCI, V11, P341. doi 10.1007/BF01001956 | 3118 | 0.2% | NA | NA |
| Vapnik, V., 1998, STAT LEARNING THEORY | 3009 | 0.2% | NA | NA |
| Zadeh, L.A., 1975, INFORM SCIENCES, V8, P199. doi 10.1016/0020-0255(75)90036-5 | 2977 | 0.2% | 4633 | 0.0% |
| Belhumeur, P.N., 1997, IEEE T PATTERN ANAL, V19, P711. doi 10.1109/34.598228 | 2890 | 0.2% | 4007 | 0.0% |
| Deb, K., 2002, IEEE T EVOLUT COMPUT, V6, P182. doi 10.1109/4235.996017 | 2884 | 0.2% | 6490 | 0.1% |
| Geman, S., 1984, IEEE T PATTERN ANAL, V6, P721 | 2882 | 0.1% | 7228 | 0.1% |
Table 9.
Top 20 papers by citations.
| First Author | Year | Article Title | Source | Citations | % |
|---|---|---|---|---|---|
| Zadeh, L.A. | 1965 | Fuzzy sets | INFORM CONTROL | 20,069 | 0.2% |
| Posada, D. | 1998 | Modeltest: testing the model of DNA substitution | BIOINFORMATICS | 14,727 | 0.1% |
| Ronquist, F. | 2003 | MrBayes 3: Bayesian phylogenetic inference under mixed models | BIOINFORMATICS | 13,772 | 0.1% |
| Nelder, J.A. | 1965 | A simplex-method for function minimization | COMPUT J | 12,727 | 0.1% |
| Humphrey, W. | 1996 | VMD: Visual molecular dynamics | J MOL GRAPH MODEL | 12,447 | 0.1% |
| Huelsenbeck, J.P. | 2001 | MrBayes: Bayesian inference of phylogenetic trees | BIOINFORMATICS | 11,976 | 0.1% |
| Lowe, D.G. | 2004 | Distinctive image features from scale-invariant keypoints | INT J COMPUT VISION | 11,010 | 0.1% |
| Larkin, M.A. | 2007 | Clustal W and Clustal X version 2.0 | BIOINFORMATICS | 9978 | 0.1% |
| Ryckaert, J.P. | 1977 | Numerical-integration of Cartesian equations of motion of a system with constraints—molecular-dynamics of n-alkanes | J COMPUT PHYS | 9648 | 0.1% |
| Breiman, L. | 2001 | Random forests | MACH LEARN | 7867 | 0.1% |
| Barrett, J.C. | 2005 | Haploview: analysis and visualization of LD and haplotype maps | BIOINFORMATICS | 7726 | 0.1% |
| Mallat, S.G. | 1989 | A theory for multiresolution signal decomposition—the wavelet representation | IEEE T PATTERN ANAL | 7333 | 0.1% |
| Geman, S. | 1984 | Stochastic relaxation, Gibbs distributions, and the Bayesian restoration of images | IEEE T PATTERN ANAL | 7228 | 0.1% |
| Takagi, T. | 1985 | Fuzzy identification of systems and its applications to modeling and control | IEEE T SYST MAN CYB | 7027 | 0.1% |
| Cortes, C. | 1995 | Support-vector networks | MACH LEARN | 6933 | 0.1% |
| Canny, J. | 1986 | A computational approach to edge-detection | IEEE T PATTERN ANAL | 6725 | 0.1% |
| Deb, K. | 2002 | A fast and elitist multiobjective genetic algorithm: NSGA-II | IEEE T EVOLUT COMPUT | 6490 | 0.1% |
| Plimpton, S. | 1995 | Fast parallel algorithms for short-range molecular-dynamics | J COMPUT PHYS | 6007 | 0.1% |
| Donoho, D.L. | 2006 | Compressed sensing | IEEE T INFORM THEORY | 5832 | 0.0% |
| Stamatakis, A. | 2006 | RAxML-VI-HPC: Maximum likelihood-based phylogenetic analyses with thousands of taxa and mixed models | BIOINFORMATICS | 5778 | 0.0% |
© 2017 by the authors. Licensee MDPI, Basel, Switzerland. This article is an open access article distributed under the terms and conditions of the Creative Commons Attribution (CC BY) license (http://creativecommons.org/licenses/by/4.0/).
Share and Cite
MDPI and ACS Style
Fiala, D.; Tutoky, G. Computer Science Papers in Web of Science: A Bibliometric Analysis. Publications 2017, 5, 23. https://doi.org/10.3390/publications5040023
AMA Style
Fiala D, Tutoky G. Computer Science Papers in Web of Science: A Bibliometric Analysis. Publications. 2017; 5(4):23. https://doi.org/10.3390/publications5040023
Chicago/Turabian StyleFiala, Dalibor, and Gabriel Tutoky. 2017. "Computer Science Papers in Web of Science: A Bibliometric Analysis" Publications 5, no. 4: 23. https://doi.org/10.3390/publications5040023
Note that from the first issue of 2016, this journal uses article numbers instead of page numbers. See further details here.