Color Parameters of the Chromascop Shade Guide

1
Dept of Biologic & Materials Sciences, University of Michigan School of Dentistry, 1011 North University, Ann Arbor, MI 48109, USA
2
Private Practice, 335 E State St Traverse City, MI 49684, USA
*
Author to whom correspondence should be addressed.
Dent. J. 2013, 1(1), 3-11; https://doi.org/10.3390/dj1010003
Submission received: 21 November 2012
/
Revised: 12 December 2012
/
Accepted: 17 December 2012
/
Published: 21 December 2012
Abstract
:The purposes of this study are: (1) determine the color of the twenty shades in the Ivoclar’s Chromascop shade guide, (2) determine the color representation of the shade guide described as coverage error (CE), and (3) compare this shade guide with the Vita Classical and Bioform shade guides. The spectral data was collected using Beckman model DU reflectance spectrophotometer equipped with an integrating sphere. Commission International de l’Eclairage (CIE) chromaticity coordinates were calculated using CIE illuminant C and 1931 observer data, then converted to CIE L*a*b* and Munsell notation. Each shade was spectrophotometrically compared to the published colors of 335 human teeth. The minimum CIE L*a*b* color difference was calculated for each tooth and the average of these color differences was defined as the CE. The measured colors of the Chromascop guide had a CIE L* range of 79.67 to 65.61, an a* range of -0.71 to 3.85, and a b* range of 14.58 to 27.69. The average CE of the Chromascop shade guide was 3.38. The Chromascop shade guide has similar colors and a CE compared with the Bioform and Vita Classical shade guides, but with some shades of higher red and yellow components.
1. Introduction
Dental shade guides are used in determining the color of natural teeth so that artificial substitute restorations will possess similar color and esthetics [1,2]. Preferred properties in a shade guide include logical arrangements and adequate distribution in color space, matching natural teeth, inherent consistency among shade guides, and matching between shade guides and dental materials of porcelains, composite resins, and denture teeth [3,4,5,6,7].
The Chromascop shade guide is a shade guide comprised of five detachable color groups, each arranged in four gradations of intensity: group 100 for white, group 200 for yellow, group 300 for light brown, group 400 for gray, group 500 for dark brown. Each one of these five groups is a separate mini-shade guide that together makes up the complete shade guide.
The equation coverage error, CE, was introduced by O’Brien et al [6] as a measure of how well specific shade guides will represent the colors of a sample of human teeth. It indicates the average color difference of a shade guide with color range and distribution in comparison with human teeth. The importance of the CE is that a shade guide may not have a sufficient distribution of colors to include the patient’s tooth color. Therefore the shades selected for a match, will introduce a mismatch, or error. In a previous study, O’Brien et al [6] determined the CE values of the Vita Classical and Bioform shade guides and reported values of 3.02 and 2.99, respectively.
Recently, Bayindir et al [8] have reported high and unacceptable CE values for the Vita conventional and Chromoscop shade guides. They measured the color parameters of the Vita Classical and Chromascop shade guides along with the tooth color parameters of a group of their clinical subjects. Using their data, they calculated CE values using the O’Brien et al [6] equation, but with their own tooth color parameters.
Therefore, the purposes of this study were to (1) determine the color parameters of the twenty shades in a master Chromascop shade guide, (2) determine the CE of this shade guide using the method described by O’Brien et al [6], (3) compare this shade guide with the Vita Classical and Bioform shade guides, and (4) compare this CE with that reported by Bayindir et al [8].
2. Results and Discussion
The Munsell notation, the chromaticity coordinates, the Commission International de l’Eclairage (CIE) L*a*b* color coordinates for master Chromascop shade guide teeth are presented in Table 1. An additional set of measurements was made to determine the precision of the method described here. An estimate of precision was obtained by measuring a single shade guide tooth (Bioform shade 62) 20 times. The means for L*, a*, and b* were calculated for the 20 measurements and the △E calculated between each measurement and the mean values. The precision of the 20 measurements was 0.50 with a standard deviation of 0.29 [4,5].

| Munsell Notation | Chromaticity Coordinates | L*a*b* | |||||||||||
|---|---|---|---|---|---|---|---|---|---|---|---|---|---|
| Shade | Hue | Value/Chroma | Y | x | y | L* | a* | b* | |||||
| 110 | 2.8 Y | 7.80 / 1.9 | 56.10 | 0.3401 | 0.3483 | 79.67 | -0.58 | 14.58 | |||||
| 120 | 2.4 Y | 7.70 / 2.2 | 54.10 | 0.344 | 0.3518 | 78.52 | -0.33 | 16.08 | |||||
| 130 | 3.1 Y | 7.50 / 2.3 | 50.93 | 0.3461 | 0.3549 | 76.64 | -0.71 | 17.01 | |||||
| 140 | 2.2 Y | 7.55 / 2.7 | 51.50 | 0.3527 | 0.3593 | 76.98 | 0.17 | 19.44 | |||||
| 210 | 2.4 Y | 7.40 / 3.0 | 48.96 | 0.3566 | 0.3634 | 75.43 | 0.1 | 20.91 | |||||
| 220 | 1.2 Y | 7.35 / 2.8 | 48.13 | 0.3552 | 0.3583 | 74.91 | 1.45 | 19.12 | |||||
| 230 | 1.4 Y | 7.15 / 3.1 | 45.13 | 0.3614 | 0.3637 | 72.98 | 1.73 | 21.19 | |||||
| 240 | 0.7Y | 7.10 / 3.5 | 44.35 | 0.3676 | 0.3666 | 72.46 | 2.86 | 22.89 | |||||
| 310 | 3.0 Y | 7.15 / 3.3 | 45.24 | 0.3622 | 0.3700 | 73.05 | -0.11 | 23.05 | |||||
| 320 | 2.7 Y | 6.95 / 3.4 | 41.91 | 0.3668 | 0.3721 | 70.81 | 0.67 | 23.84 | |||||
| 330 | 2.5 Y | 7.05 / 4.0 | 43.52 | 0.3758 | 0.3795 | 71.91 | 1.28 | 27.69 | |||||
| 340 | 1.5 Y | 6.70 / 3.9 | 38.78 | 0.3771 | 0.3771 | 68.59 | 2.4 | 26.21 | |||||
| 410 | 1.8 Y | 7.05 / 2.4 | 43.97 | 0.3498 | 0.3549 | 72.21 | 0.67 | 16.77 | |||||
| 420 | 2.0 Y | 7.15 / 2.7 | 45.24 | 0.3543 | 0.3595 | 73.05 | 0.66 | 18.91 | |||||
| 430 | 2.7 Y | 7.15 / 2.7 | 44.90 | 0.3546 | 0.3617 | 72.83 | -0.01 | 19.54 | |||||
| 440 | 2.7 Y | 6.95 / 2.7 | 42.19 | 0.3534 | 0.3606 | 71 | -0.06 | 18.64 | |||||
| 510 | 2.4 Y | 6.85 / 2.9 | 40.88 | 0.3587 | 0.3642 | 70.09 | 0.54 | 20.24 | |||||
| 520 | 1.9 Y | 6.70 / 3.3 | 38.93 | 0.3661 | 0.3695 | 68.7 | 1.28 | 22.45 | |||||
| 530 | 2.1 Y | 6.70 / 3.6 | 39.09 | 0.3719 | 0.3745 | 68.82 | 1.56 | 24.75 | |||||
| 540 | 0.4 Y | 6.40 / 3.6 | 34.82 | 0.3745 | 0.3698 | 65.61 | 3.85 | 22.99 | |||||
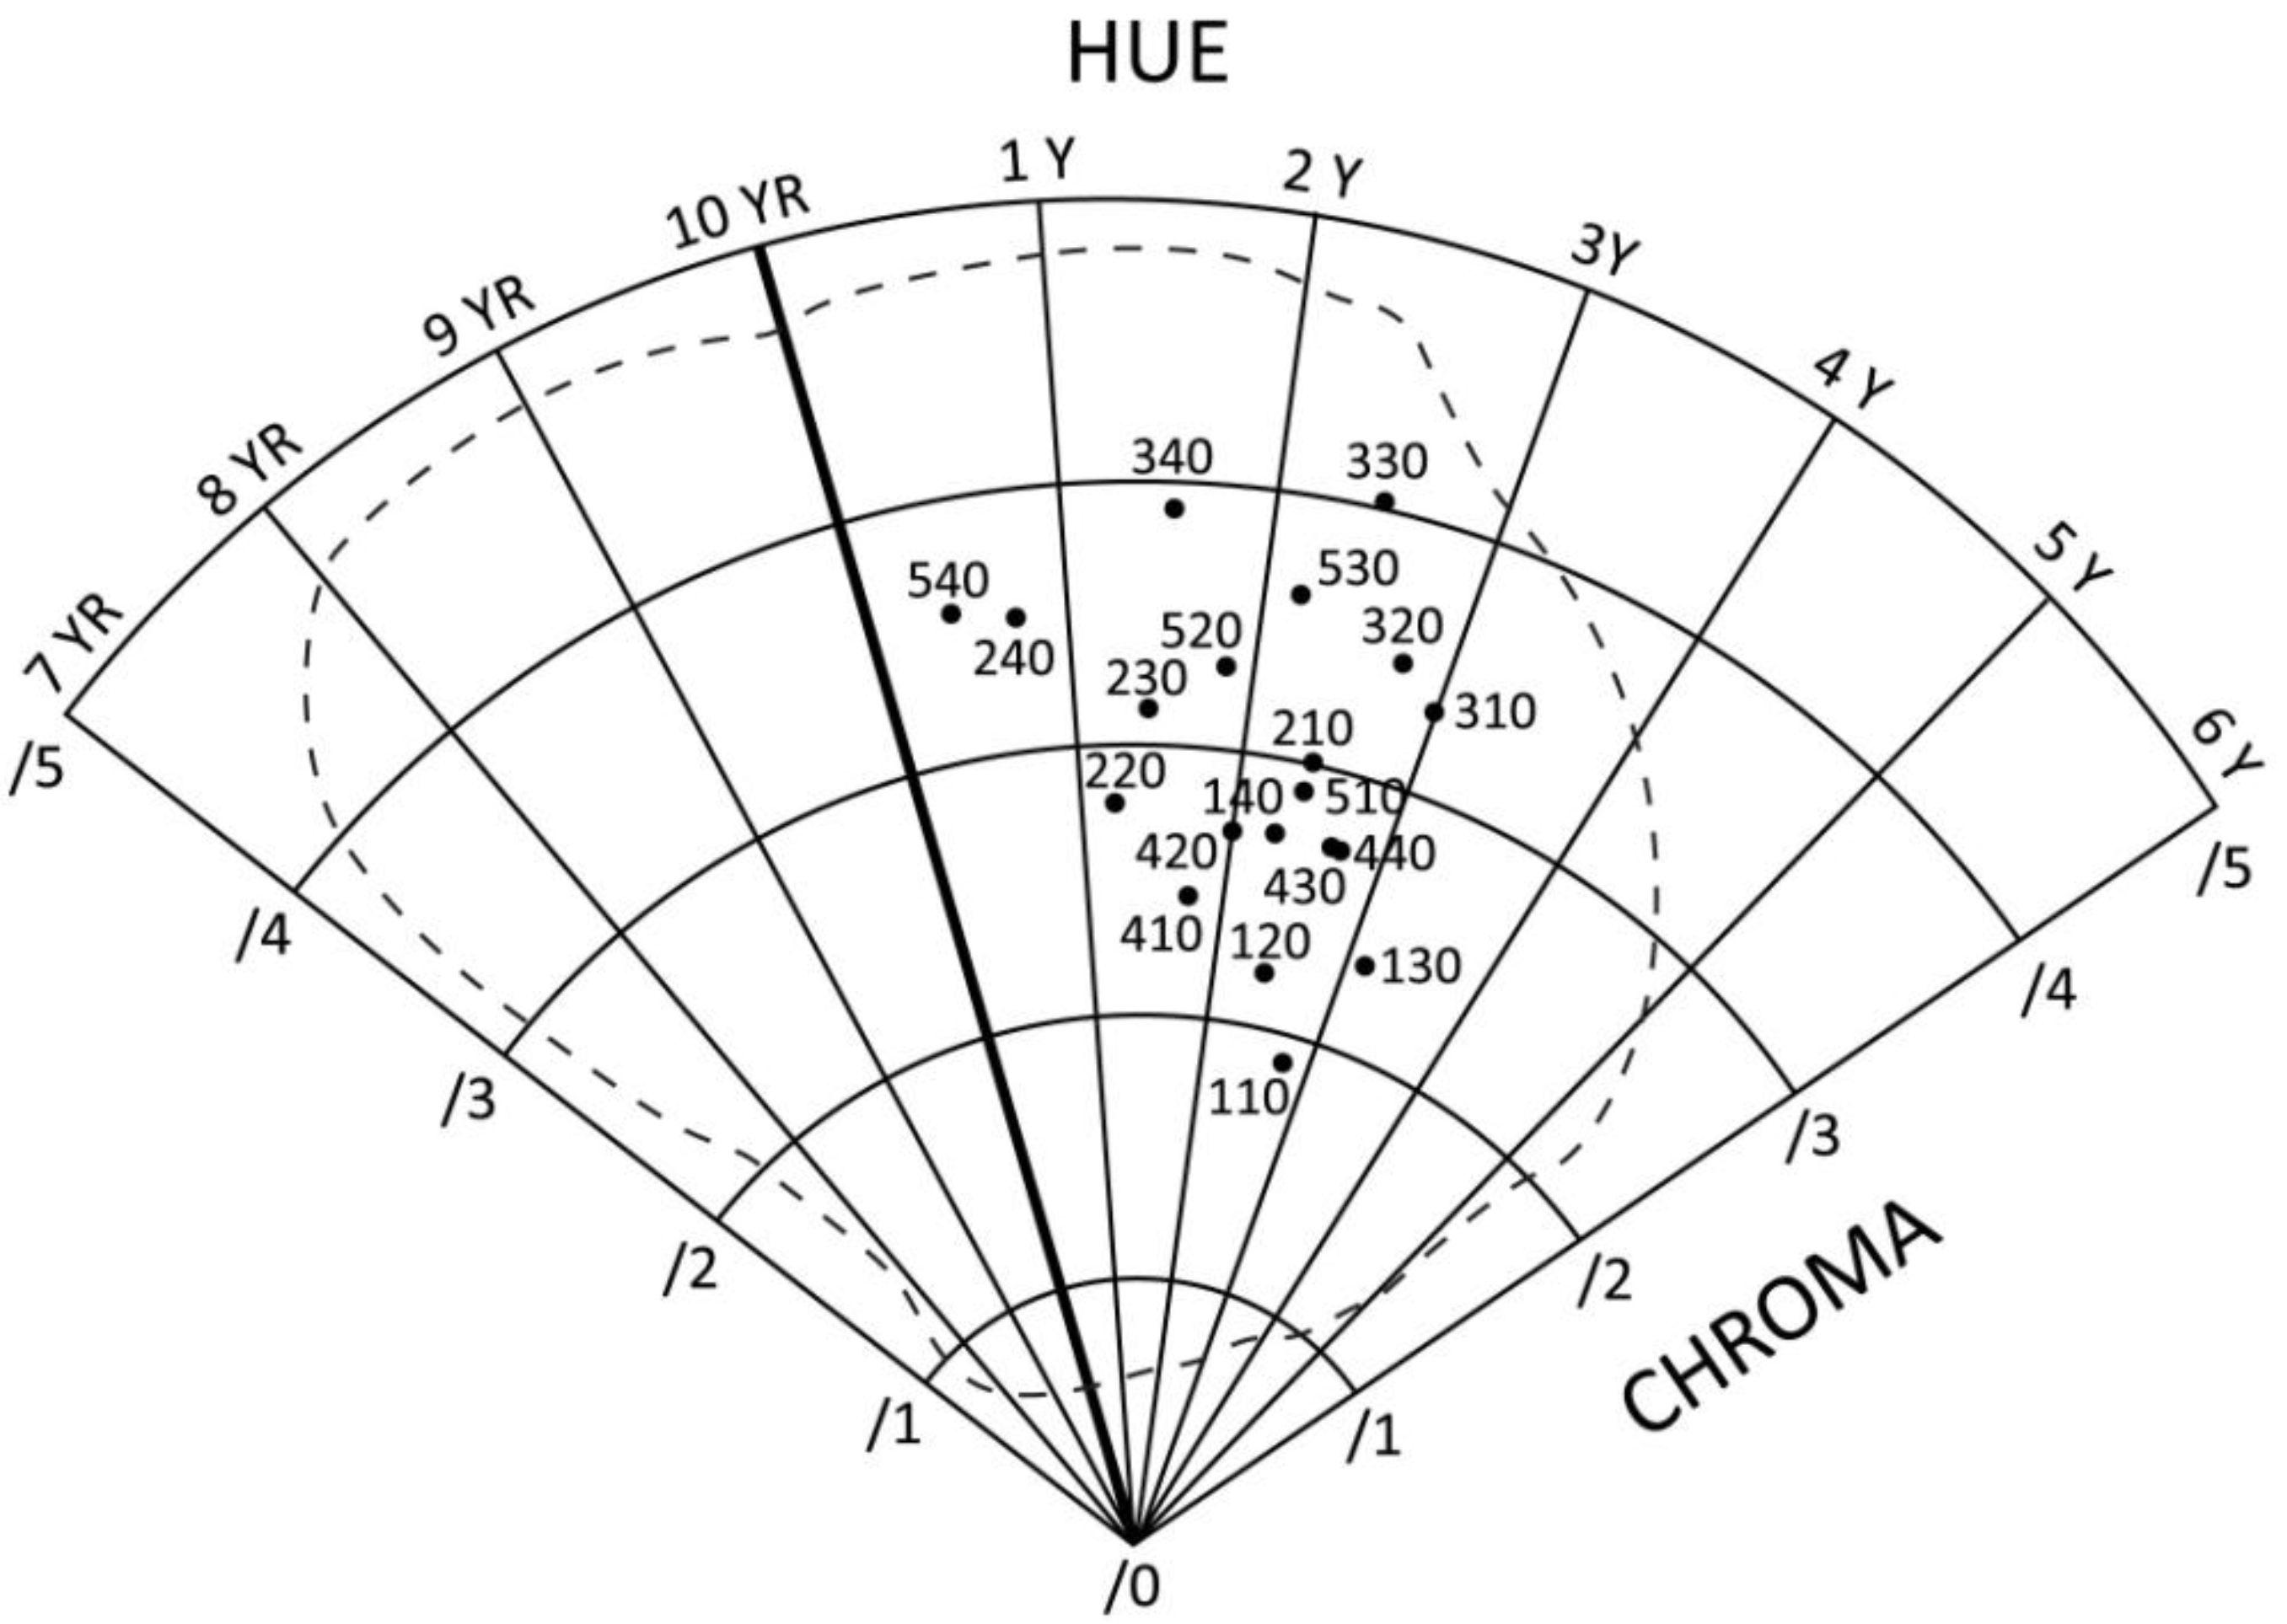
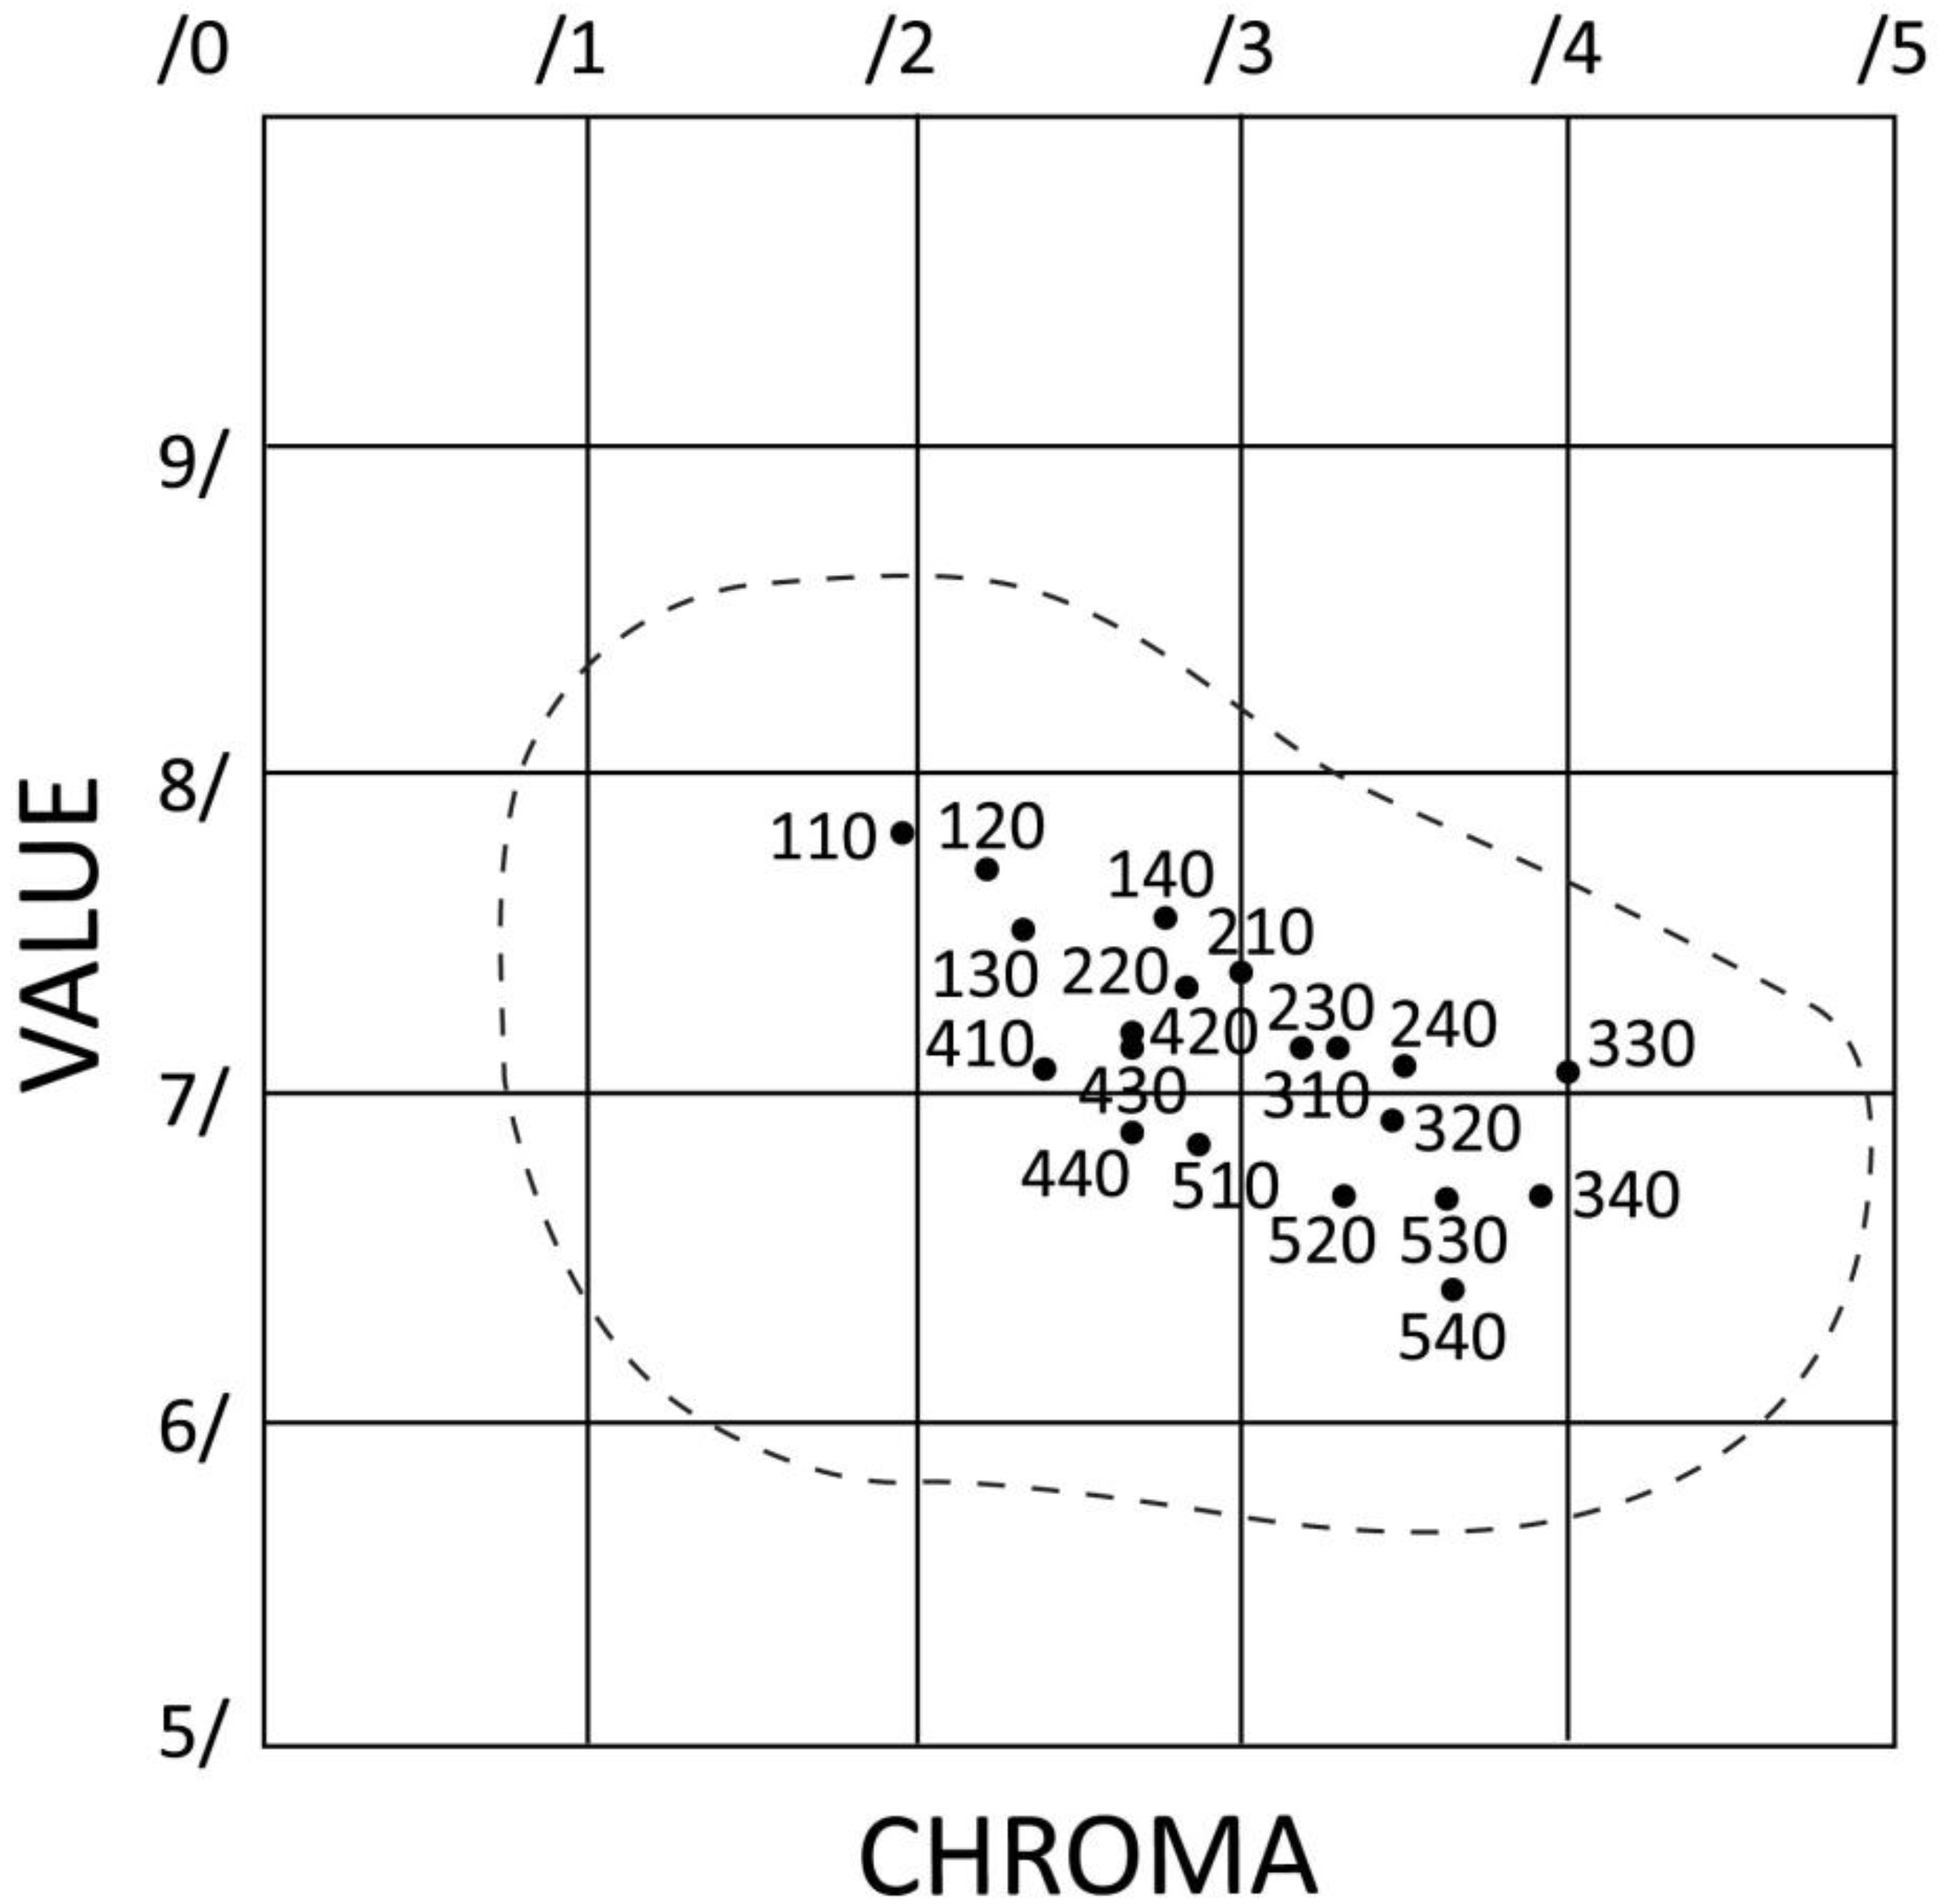
A plot of the Munsell hue and chroma for the shade tabs is shown in Figure 1. The hues range from 0.4 Y (shade 540) to 3.1 Y (shade 130). The chromas range from 1.9 (shade 110) to 4.0 (shade 330). Also a plot of value and chroma is shown in Figure 2. The shade tabs of Chromascop are not equally distributed through the color space; however, the shade guide was found to match well with human teeth colors [6], for hues of 10YR to 3Y, for chromas of /2 to /4, and for values of 6/ to 8/, as was shown graphically in Figure 1 and Figure 2. The values range from 6.40 (shade 540) to 7.80 (shade 110). A comparison was made of the master Chromascop shades to the master Bioform [4] and Vita Classical shades [5] and the closest match for each Chromascop shade along with the △E* values is given in Table 2.
Figure 1.
A plot of the Munsell hue and chroma for the master Chromascop shade guide. Note the dotted outline of color distribution of human teeth as plotted in a previous study [6].
Figure 1.
A plot of the Munsell hue and chroma for the master Chromascop shade guide. Note the dotted outline of color distribution of human teeth as plotted in a previous study [6].

Figure 2.
A plot of the Munsell value and chroma for the master Chromascop shade guide. Note the dotted outline of color distribution of human teeth as plotted in a previous study [6].
Figure 2.
A plot of the Munsell value and chroma for the master Chromascop shade guide. Note the dotted outline of color distribution of human teeth as plotted in a previous study [6].

| Chromascop Shades | Bioform | (∆E*) | Vita | (∆E*) | ||
|---|---|---|---|---|---|---|
| 110 | B-59 | (0.9) | A1 | (1.8) | ||
| 120 | B-51 | (1.0) | B2 | (2.3) | ||
| 130 | B-52 | (0.6) | A2 | (0.9) | ||
| 140 | B-66 | (1.0) | A3 | (2.0) | ||
| 210 | B-56 | (0.9) | A3 | (1.8) | ||
| 220 | B-54 | (1.2) | A3 | (0.7) | ||
| 230 | B-77 | (1.7) | A3.5 | (0.9) | ||
| 240 | B-83 | (1.5) | A3.5 | (1.8) | ||
| 310 | B-67 | (0.8) | B3 | (1.4) | ||
| 320 | B-83 | (1.7) | B4 | (2.0) | ||
| 330 | B-83 | (3.9) | B4 | (5.6) | ||
| 340 | B-85 | (1.3) | A4 | (5.3) | ||
| 410 | B-93 | (1.7) | D3 | (0.7) | ||
| 420 | B-93 | (0.6) | D4 | (2.4) | ||
| 430 | B-77 | (1.0) | D4 | (2.3) | ||
| 440 | B-69 | (0.5) | D4 | (1.6) | ||
| 510 | B-94 | (1.5) | A4 | (2.0) | ||
| 520 | B-84 | (2.0) | A4 | (1.5) | ||
| 530 | B-83 | (2.9) | A4 | (3.8) | ||
| 540 | B-84 | (3.2) | A4 | (4.2) | ||
| Means | 2.2 | 2.3 |
The Chromascop L* (value) color parameters were determined to be similar to the Bioform and Vita Classical values [6]. But the Chromascop guide demonstrated higher red component (a*) than both the Bioform and Vita Classical, and higher yellow (b*) values than the Vita Classical guide. The shade 540 was more yellow-red than the Bioform and Vita Classical guides, with Munsell hue, value, and chroma parameters of 0.4 Y, 6.40, 3.6, respectively. The Chromascop shade guide was also found to present a greater proportion (50%) of its shades with a Munsell chroma of 3 or greater than Bioform (21%) than Vita Classical (25%).
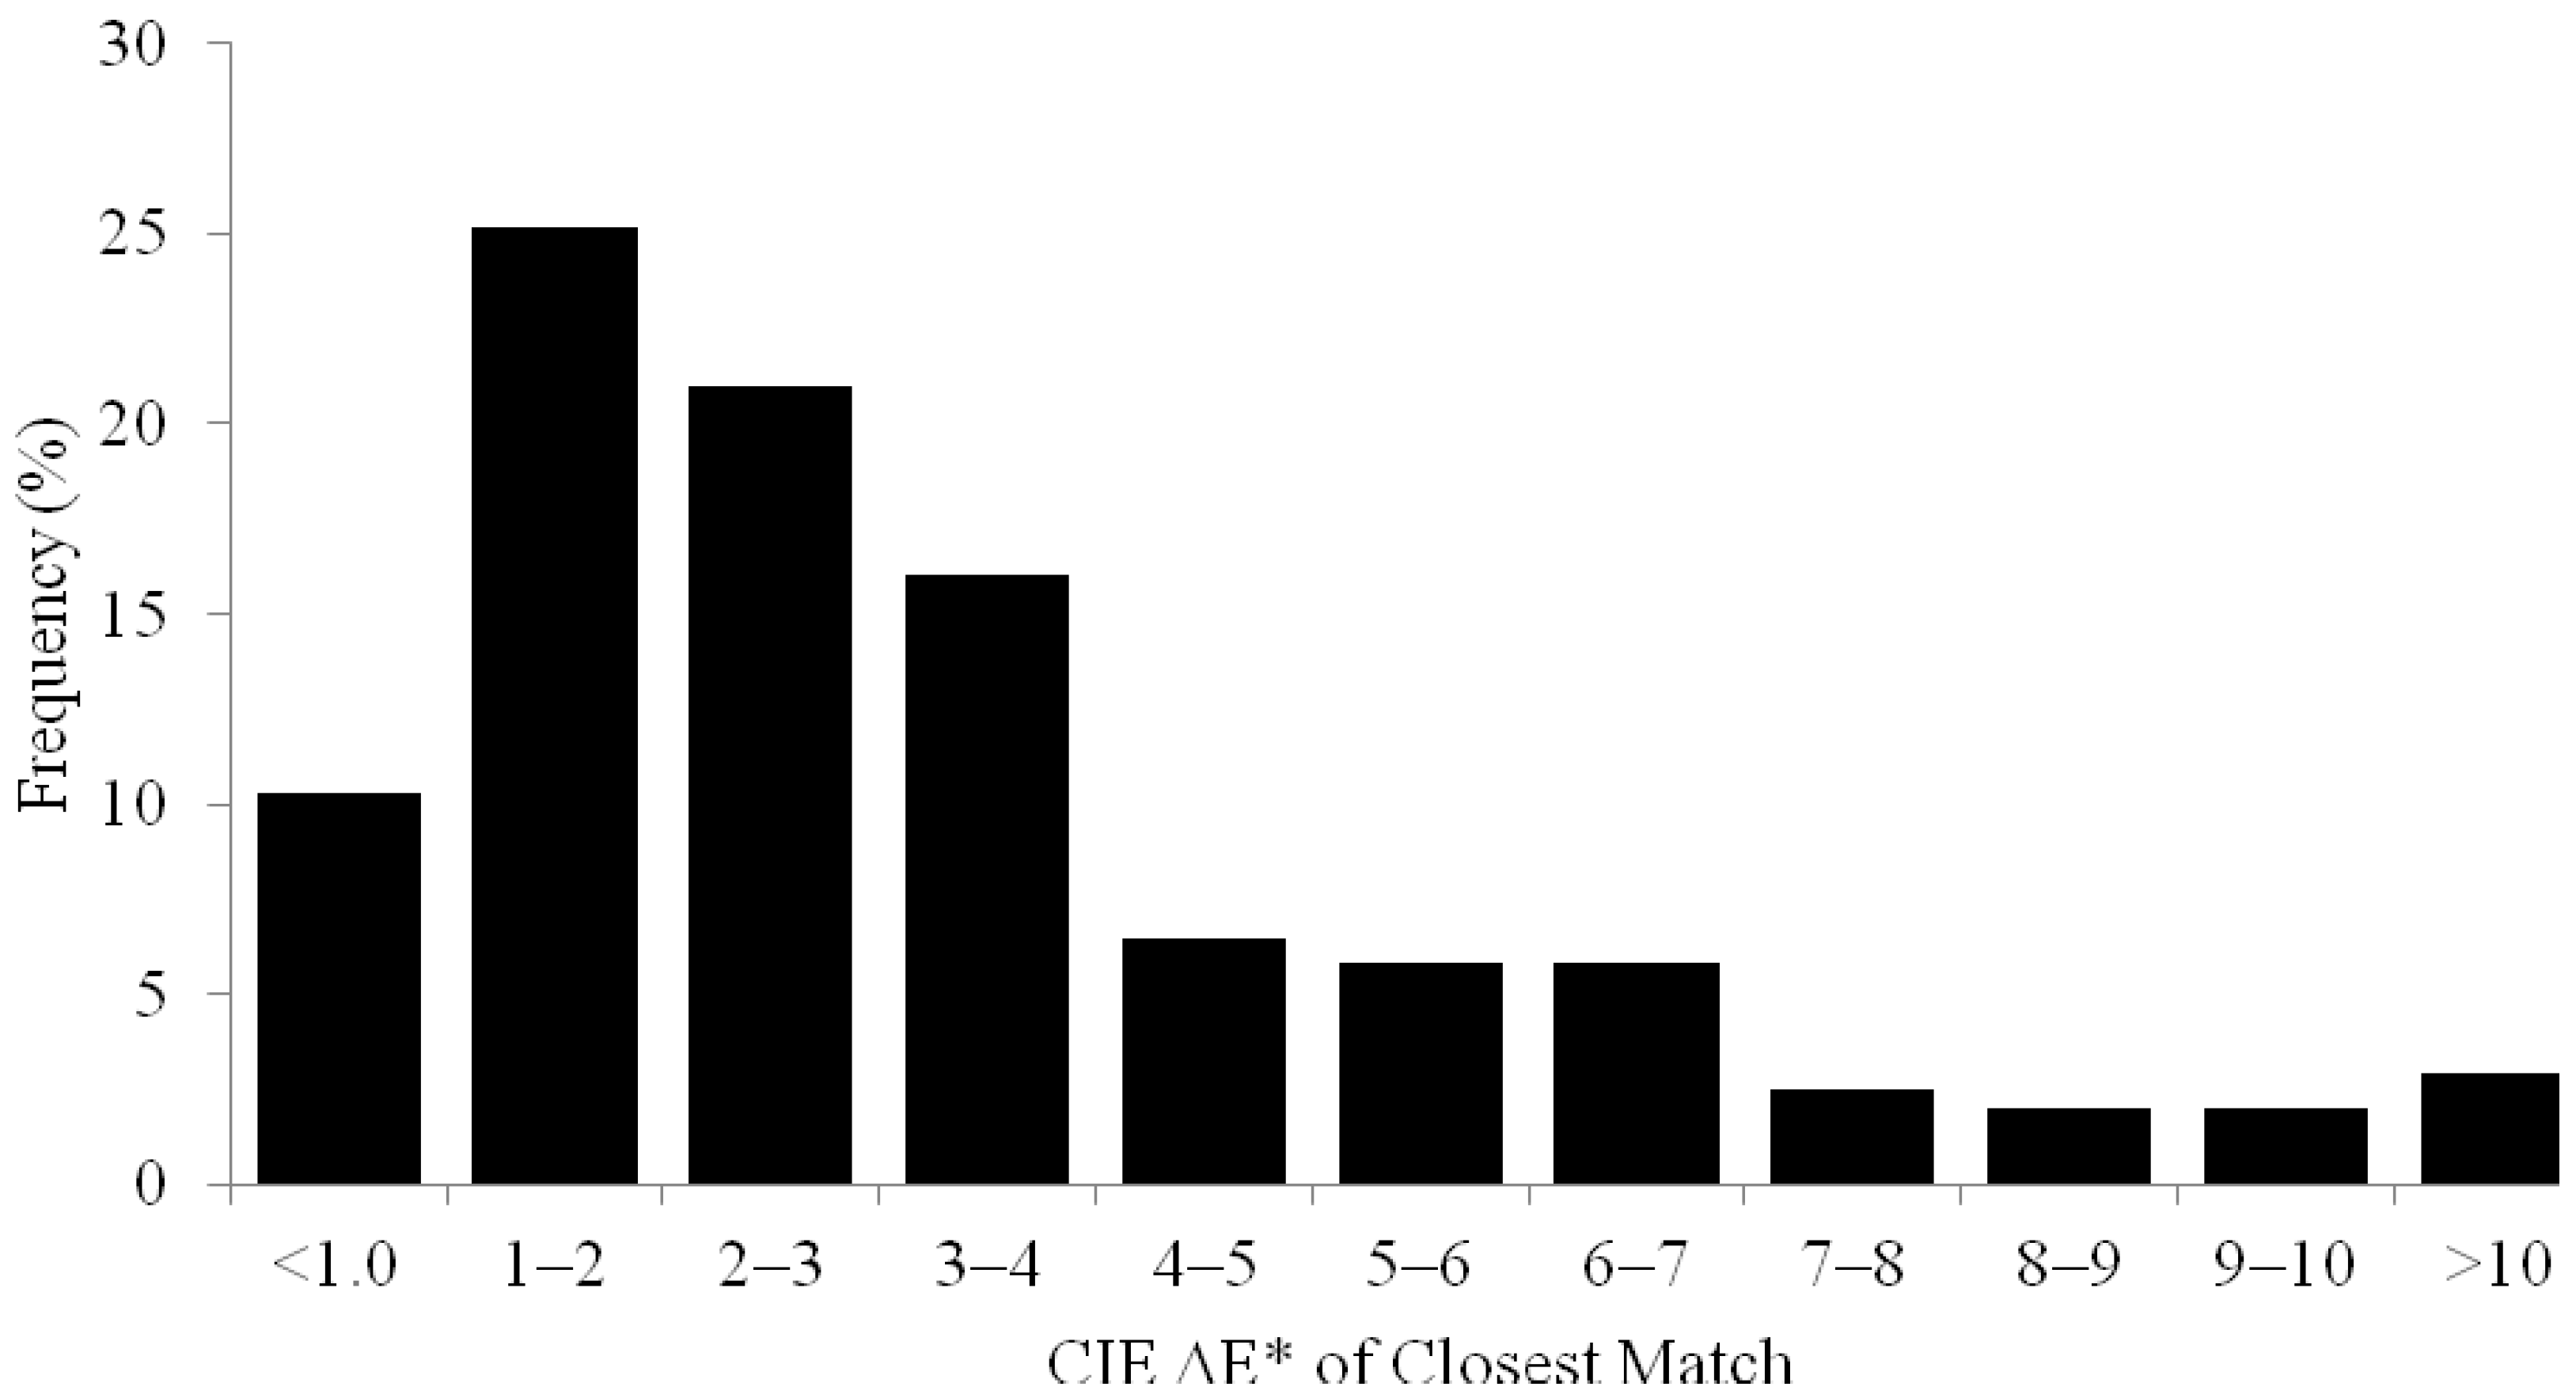
The CE of the Chromascop master shade guide was calculated to be 3.38 (SD 2.48), and Figure 3 shows the distribution of error.
Figure 3.
Frequency distribution of the minimum ΔE* using the master Chromascop shade guide for the pooled sample of teeth (n=335). The mean of ΔE*, ΔEcov, is 3.38.
Figure 3.
Frequency distribution of the minimum ΔE* using the master Chromascop shade guide for the pooled sample of teeth (n=335). The mean of ΔE*, ΔEcov, is 3.38.

The color parameters for the Chromascop shade guide were determined using the method developed in our laboratory for the measurement of translucent shade guide teeth [4,5,6]. These values describe the distribution of the shades of this guide in color space and provide data for a comparison to the published shades of extracted human teeth. Also, since the same methodology was employed in this study as was used in previous studies, direct comparisons can be made to the values reported for the Bioform [4] and Vita Classical shade guides [5,6].
In this study, the CE of the Chromascop shade guide was 3.38 (SD 2.48), indicating no significant difference with Bioform [2.99 (SD 2.31)] [6] and Vita Classical [3.02 (SD 2.26)] [6] shade guides using Tukey procedure (α = 0.05). These values of average error can be interpreted as acceptable based on the criteria published in the dental literature [9,10]. Ruyter et al [9] have reported that color differences with corresponding △E* lower than approximately 3.3 were acceptable. Johnston and Kao [10] found that the average △E* of ratings judged to be a match by the United States Public Health Service criteria was 3.7.
The different and unacceptable higher CE values reported by Bayindir et al [8] for the CE values of the Vita Classical (5.39) and Chromoscop (5.28) shade guides are most likely due to their use of their own patient tooth color parameters rather than the tooth color parameter from published source used in the original O’Brien et al [6] paper. The O’Brien equation [6] compares the CIE L*a*b* color parameters of a given shade guide with those of a sample of human tooth color parameters. Since Bayindir et al [8] used color parameters from tooth colors from their own subject samples, their calculated CE values for the Chromascop shade guide cannot be compared with those calculated in their study which used the original O’Brien et al [6] tooth color data.
Bayindir et al [8] also raised the question of the accuracy of the color measurement method using an integrated sphere reported by O’Brien et al [6] which was used also in this study. The edge loss was greatly reduced by the use of a filter slit that narrowed the incident beam to a width of about only 1 mm for a total tooth width of about 8 mm [5]. The barium sulfate coating of the lingual surfaces of the shade guide teeth was done to reduce the variability in the opacity among different shade colors. This method was suggested by H. Hemmerdinger, in his study published in Lemire and Burk [11] in order to reduce errors due to opacity differences among shades [12]. Although Bayindir et al [8] used a different color measurement method, their data for the Chromascop shade guide parameters were very close.
Ideally, shade guides should have a range of shades that cover a larger area of the color space of human teeth. The selection of samples of human tooth color parameters should include age and racial grouping. A preliminary study of the range of differences in tooth color parameters using subjects with strong distinctively different skin color would help. Paravina et al [7] has reported better CE values (around 2) with an optimized selection of 24 shade guide colors based upon human tooth color parameters. This new design would provide a new direction for shade guides along with the development of reliable chairside color measuring instruments.
3. Experimental Section
The spectral reflectance of master Chromascop shade guide teeth (Ivoclar North America) was determined by use of a dual-beam spectrophotometer (Beckman Model ACTA CIII, Beckman Instruments) as previously described by O’Brien et al [4,5,6].
The Munsell color system is a popular system for the visual determination of color and is based upon polar coordinates. In 1976, the Commission International de l’Eclairage (CIE) adopted a uniform color space system based upon rectangular coordinates and designated it a L*a*b*. The corresponding color difference (△E*) formula is as follows [5]:
where △L*, △a*, and △b* are differences in the CIE uniform color space parameters of the two colors.
△E* = [(△L*)2 + (△a*)2 + (△b*)2]1/2
The tooth color data were from surveys made by Marui [13], Sproull [14], and Lemire and Burk [11]. The Marui survey had a sample size of 72 and was conducted using visual matching with Munsell color standards [13]. The Sproull (33 teeth) and Lemire and Burk (230 teeth) surveys were based upon spectrophotometric measurements made on extracted teeth [11,14]. The color parameter distributions from these three published sources are given in the O’Brien et al [6] paper. These were considered the best published data available at that time. The Munsell notation of the three published studies of the colors of human teeth were also converted to CIE L*a*b* parameters.
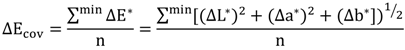
A computer program that compares each tooth color with each shade guide color and calculates the minimum CIE L*a*b* color difference was written. The average of these color differences is an index of the coverage error (CE or △Ecov) of the shade guide and was calculated using the following equation [6]:
![Dentistry 01 00003 i001]() The total sample size, n, was 335 for the pooled data. The CE, therefore, is the average difference between the tooth colors and the nearest shade guide match.
The total sample size, n, was 335 for the pooled data. The CE, therefore, is the average difference between the tooth colors and the nearest shade guide match.
4. Conclusions
The Chromascop shade guide has similar colors and a CE compared with the Bioform and Vita Classical shade guides, but with some shades of higher red and yellow components.
Acknowledgements
This investigation was supported by grants DE-05423 and DE-09296 from the National Institute of Dental Research, National Institutes of Health, Bethesda, Maryland, 20892. The authors wish to thank Drs. CL Groh and KM Boenke for preparation of the specimens for this study.
Conflict of Interest
The authors declare no conflict of interest.
References Notes
- Preston, J.D. Current status of shade selection and color matching. Quintessence Int. 1985, 16, 47–58. [Google Scholar]
- Oh, W.S.; Koh, I.W.; O'Brien, W.J. Estimation of visual shade matching errors with 2 shade guides. Quintessence Int. 2009, 40, 833–836. [Google Scholar]
- Shotwell, J.L.; Johnston, W.M.; Swarts, R.G. Color comparisons of denture teeth and shade guides. J. Prosthet. Dent. 1986, 56, 31–34. [Google Scholar] [CrossRef]
- O'Brien, W.J.; Groh, C.L.; Boenke, K.M. One-dimensional color order system for dental shade guides. Dent. Mater. 1989, 5, 371–374. [Google Scholar] [CrossRef]
- O'Brien, W.J.; Groh, C.L.; Boenke, K.M. A new, small-color-difference equation for dental shades. J. Dent. Res. 1990, 69, 1762–1764. [Google Scholar] [CrossRef]
- O'Brien, W.J.; Boenke, K.M.; Groh, C.L. Coverage errors of two shade guides. Int. J. Prosthodont. 1991, 4, 45–50. [Google Scholar]
- Paravina, R.D.; Majkic, G.; Imai, F.H.; Powers, J.M. Optimization of tooth color and shade guide design. J. Prosthodont. 2007, 16, 269–276. [Google Scholar] [CrossRef]
- Bayindir, F.; Kuo, S.; Johnston, W.M.; Wee, A.G. Coverage error of three conceptually different shade guide systems to vital unrestored dentition. J. Prosthet. Dent. 2007, 98, 175–185. [Google Scholar] [CrossRef]
- Ruyter, I.E.; Nilner, K.; Moller, B. Color stability of dental composite resin materials for crown and bridge veneers. Dent. Mater. 1987, 3, 246–251. [Google Scholar] [CrossRef]
- Johnston, W.M.; Kao, E.C. Assessment of appearance match by visual observation and clinical colorimetry. J. Dent. Res. 1989, 68, 819–822. [Google Scholar] [CrossRef]
- Lemire, P.A.; Burk, B. Color in Dentistry. J.M. Ney Co: Hartford, CT, USA, 1975; pp. 66–74. [Google Scholar]
- O'Brien, W.J.; Hemmendinger, H.; Boenke, K.M.; Linger, J.B.; Groh, C.L. Color distribution of three regions of extracted human teeth. Dent. Mater. 1997, 13, 179–185. [Google Scholar] [CrossRef]
- Marui, M. Color of the Tooth Crown. I. Crown Standards for Tooth Crown and Skin. Kokubyo Gakkai Zasshi. 1968, 35, 412–421. [Google Scholar]
- Sproull, R.C. Color matching in dentistry. Part II. Practical applications of the organization of color. J. Prosthet. Dent. 1973, 29, 556–566. [Google Scholar] [CrossRef]
© 2013 by the authors; licensee MDPI, Basel, Switzerland. This article is an open-access article distributed under the terms and conditions of the Creative Commons Attribution license (http://creativecommons.org/licenses/by/3.0/).
Share and Cite
MDPI and ACS Style
O'Brien, W.J.; Oh, W.-S.; Piché, P.W. Color Parameters of the Chromascop Shade Guide. Dent. J. 2013, 1, 3-11. https://doi.org/10.3390/dj1010003
AMA Style
O'Brien WJ, Oh W-S, Piché PW. Color Parameters of the Chromascop Shade Guide. Dentistry Journal. 2013; 1(1):3-11. https://doi.org/10.3390/dj1010003
Chicago/Turabian StyleO'Brien, William J., Won-Suk Oh, and Peter W. Piché. 2013. "Color Parameters of the Chromascop Shade Guide" Dentistry Journal 1, no. 1: 3-11. https://doi.org/10.3390/dj1010003