Article

Water-Soluble Cellulose Derivatives Are Sustainable Additives for Biomimetic Calcium Phosphate Mineralization

1
Institute of Chemistry, University of Potsdam, Potsdam D-14476, Germany
2
Institute for Organic Chemistry and Macromolecular Chemistry, Center of Excellence for Polysaccharide Research, Friedrich Schiller University of Jena, Jena D-07743, Germany
3
Institute of Earth and Environmental Sciences, University of Potsdam, Potsdam D-14476, Germany
*
Author to whom correspondence should be addressed.
Inorganics 2016, 4(4), 33; https://doi.org/10.3390/inorganics4040033
Submission received: 23 August 2016 / Revised: 27 September 2016 / Accepted: 6 October 2016 / Published: 24 October 2016

Abstract

:
The effect of cellulose-based polyelectrolytes on biomimetic calcium phosphate mineralization is described. Three cellulose derivatives, a polyanion, a polycation, and a polyzwitterion were used as additives. Scanning electron microscopy, X-ray diffraction, IR and Raman spectroscopy show that, depending on the composition of the starting solution, hydroxyapatite or brushite precipitates form. Infrared and Raman spectroscopy also show that significant amounts of nitrate ions are incorporated in the precipitates. Energy dispersive X-ray spectroscopy shows that the Ca/P ratio varies throughout the samples and resembles that of other bioinspired calcium phosphate hybrid materials. Elemental analysis shows that the carbon (i.e., polymer) contents reach 10% in some samples, clearly illustrating the formation of a true hybrid material. Overall, the data indicate that a higher polymer concentration in the reaction mixture favors the formation of polymer-enriched materials, while lower polymer concentrations or high precursor concentrations favor the formation of products that are closely related to the control samples precipitated in the absence of polymer. The results thus highlight the potential of (water-soluble) cellulose derivatives for the synthesis and design of bioinspired and bio-based hybrid materials.

Graphical Abstract

1. Introduction

Biomimetic hybrid materials composed of a polymer and an inorganic component like calcium phosphate (CP) are—among others—highly attractive for application as biomaterials [1,2,3,4]. One of the key challenges in hybrid biomaterials development is the fact that there is an increasing need for such materials, yet most polymers available today are based on fossil feedstocks with limited availability. As a result, the development of biomineralization-inspired (bio)materials based on renewable resources and via sustainable processes is of ever growing importance. Interestingly, however, although a large number of publications on bioinspired mineralization of calcium phosphate is available (see refs [5,6] for extensive reviews of the field), the number of studies on mineralization additives based on renewable raw materials is still rather limited.
Carbohydrates are particularly interesting for hybrid (bio)materials development because they are available in large amounts and numerous protocols for their chemical modification exist [7]. For example, Falini, et al. precipitated octacalcium phosphate (OCP) and hydroxyapatite (HAP) into a β-chitin matrix from a Loligo sp. squid pen [8]. Chitin offers carboxyl-, hydroxyl-, and amide groups as possible nucleation sites and OCP grew as oriented plate-like crystals with the a-axis almost normal to the chitin fiber. A recent study has also found calcium phosphate deposits in crustacean claws [9]. Other studies have focused on the synthesis of chitin/calcium phosphate composites [10,11,12,13,14]. One of the key issues with chitin scaffolds, however, is their very limited solubility in most solvents, making their processing difficult [2,15].
As a result, chitosan (deacetylated chitin), which is water-soluble especially at low pH, has been studied as an alternative to chitin. Schweizer, et al. prepared hybrid films from chitosan/heparin multilayers and calcium phosphate and demonstrated that the specific composition of these hybrid films strongly affects their water contact angle [16]. Fratzl and coworkers used a coprecipitation process for the synthesis of chitosan-based hybrids [17]. Chiono, et al [18] used fluorescein-grafted chitosan to locally trigger calcium phosphate deposition upon irradiation with UV/Vis light. Other groups have also studied the mineralization of chitosan; these developments have recently been reviewed [14].
Besides, only a few studies on other carbohydrates for calcium phosphate mineralization exist. Yamane, et al. showed that cholesterol-bearing pullulan and mannan nanogels favor the formation of amorphous calcium phosphate (ACP) or HAP, depending on the calcium precursor concentration initially present in the reaction mixture [19]. Dogan and Öner [20] and Thula, et al. [21] found strong effects of carboxylmethyl inulin (CMI), a biodegradable and non-toxic polysaccharide-based polycarboxylate, on the nucleation and growth of HAP.
Finally, cellulose—the most abundant biopolymer available—would also be interesting as a polymer component, but the low solubility of cellulose in essentially all conventional solvents severely limits the use and application of cellulose in bioinspired hybrid materials. As a result, numerous studies have explored the direct mineralization of insoluble or slightly swollen cellulose scaffolds. Joshi, et al. investigated the mineralization of cellulose foams [22]. Moreover, several research groups studied the mineralization of different types of cellulose [23,24,25,26,27,28,29], but the overarching problem in these approaches is the limited solubility of the cellulose, which leads to materials that are mostly surface-mineralized but not throughout the cellulose matrix. There is thus a need to develop protocols for a more intimate connection between the cellulose matrix and the calcium phosphate formed during mineralization. Two obvious strategies are available: (i) modify the cellulose such that it becomes water soluble (the strategy chosen in this study) or (ii) use solvents that provide a molecular dissolution of cellulose, such as ionic liquids.
Indeed, Salama, et al. [30] exploited the potential of ionic liquids (ILs) to dissolve native cellulose for the synthesis of cellulose/CP hybrid materials. The authors dissolved cellulose in the IL 1-butyl-3-methylimidazolium chloride using glacial acetic acid (GAA) and NaOH as additives for the mineralization process. The precipitates showed a strong dependence on the additive: while in the case of NaOH only heterogeneous materials with large mineral-free domains were obtained, the addition of GAA led to the formation of well-defined cellulose/CP hybrid materials with high order and homogeneity. Ma and colleagues have used hydrothermal treatments to synthesize apatite/cellulose composites [31,32,33].
Carboxymethyl cellulose (CMC), which has a higher water-solubility than native cellulose, has been used for the synthesis of calcium phosphate nanoparticle/CMC composites for dental repair [34]. Salama, et al. studied the mineralization of CMC/silica hybrids [35]. However, besides a few water-soluble cellulose derivatives that are available on a commercial scale [26], the number of specific and tailor-made additives for calcium phosphate precipitation is still rather limited. This is interesting because calcium phosphate mineralization control or delivery of (polymer stabilized) calcium phosphate nanoparticles are interesting for e.g., dental repair (remineralization), toothpastes, or drug or gene delivery [5,36,37,38,39]. As a result, although the amounts of polymeric additive needed for an individual application are not very large, the overall need for a special polymer may still be rather large, considering that toothpastes and mouthwash products for dental protection are an ever growing market [40,41].
The current article therefore focuses on the effects of a set of cellulose-based polyelectrolytes on the formation of calcium phosphate from bulk aqueous solution to evaluate the potential of cellulose-based polycations, polyanions, and polyzwitterions as green and sustainable yet specifically tailored mineralization additives.

2. Results

All mineralization experiments were done using identical procedures (see experimental part for details). The following variables were studied: polymer composition, polymer concentration, and precursor concentration. Calcium and phosphate precursor concentration was 10 or 100 mM after mixing the two starting solutions (calcium nitrate tetrahydrate and diammonium hydrogen phosphate) solutions and polymer concentrations were 0.1 or 1 mg/mL after mixing the calcium and the phosphate solutions, see experimental part for details.
The polymers used in this study are based on cellulose; one is an anionic derivative, (2-Carboxyethyl)(N-boc-2-aminoethyl)-cellulose carbamate (termed “anion” in the remainder of the text), one is a cationic derivative (3-Ethoxy-3-oxopropyl)(2-aminoethyl)-cellulose carbamate (termed “cation” in the remainder of the text), and one derivative is a zwitterion, (2-Carboxyethyl)(2-aminoethyl)-cellulose carbamate, termed “zwitterion” throughout the text. All polymer structures are shown in Scheme 1; their synthesis and pKa values have been described before [42]. The polymers have pKa values of 4.0 (carboxylic acid group) and 8.6 to 9.7 (amino group).
Scanning electron microscopy (SEM) images of all precipitates show that all sample morphologies and sizes follow a general trend: samples grown at low precursor concentrations (10 mM) always (in the control samples and samples grown with the different polymer additives) contain large, micrometer-sized, and rather dense blocks that appear to break upon sample preparation for the SEM. Higher magnification SEM images reveal, however, that these fairly large blocks are likely composed of small nanoparticles in the 10 to 100 nm size range. As all samples, regardless of the polymer additive, tend to charge very rapidly in the SEM, a more accurate size determination of these presumed primary particles is not easily possible. Moreover, some of the samples grown from 10 mM precursor solutions show “blob-” or “droplet-like” features (middle row in Figure 1). These features are only observed at 10 mM and have never been observed in the samples made with 100 mM precursor solutions.
In contrast, samples grown at higher precursor concentrations of 100 mM always form large platelets in the micrometer size range with a broad size distribution. Occasionally, particles with sizes in the 100 μm range are also observed. Quite some of these plates have morphologies that resemble the well-known brushite plates, but clearly, SEM alone cannot resolve this question. In contrast to samples known from the literature, most of the plates are broken and real sizes are therefore difficult to determine.
Figure 2 shows representative X-ray diffraction (XRD) patterns of the samples shown in Figure 1. XRD clearly shows that there are differences between the different sample preparation protocols. XRD data of the samples grown at the lower precursor salt concentration of 10 mM show reflections that can be assigned to hydroxyapatite (ICDD 00-001-1008) at 25.9° (002), 28.9° (210), 32.2° (112), 34.0° (202), 39.4° (212/310), 43.9° (113), 46.5° (222), 49.6° (213), and 53.5° (004) 2θ. In most cases the reflections are rather weak and broad. In addition to the reflections assigned to HAP, two reflections are reproducibly observed at 14.5° and 16.4° 2θ. These reflections can be assigned to ammonium nitrate (ICDD 00-008-0452), a side product from the mineralization reaction.
Samples grown from 100 mM reaction mixtures show different XRD patterns. Here, rather sharp and intense reflections that can be assigned to brushite (dicalcium phosphate dihydrate, DCPD, ICDD 00-009-0077) are observed at 11.6° (020), 20.9° (021), 23.4° (040), 29.3° (041), 30.5° (−221), 34.1° (−220) 2θ along a large number of less intense reflections at higher angles. Two additional reflections at 32.7° and 39.7° 2θ can again be assigned to ammonium nitrate (ICDD 00-008-0452).
Figure 3 shows the corresponding infrared (IR) spectra. Consistent with XRD, the samples grown at 10 mM essentially exhibit identical IR spectra as far as the band positions are concerned. The spectra exhibit a strong band at 1018 cm−1, which can be assigned to the P–O stretching vibration of the phosphate (PO43−) ion. Bands at 602 and 555 cm−1 can also be assigned to the phosphate ion (O–P–O triply degenerate bending mode, v ˜ 4a/c); these three bands are characteristic for HAP [43]. Further bands at 1697 and 1560 cm−1 are rather broad and may originate from overlapping signals caused by O–H deformation vibrations of the hydrogen phosphate ion, C=O stretching vibration of the cellulose, and asymmetric NO2 stretching vibrations of nitrate [44]. A very broad band at 3000 to 3500 cm−1 can be assigned to O–H stretching vibrations of water and hydroxyl groups of cellulose. Finally, some samples also show rather sharp bands in the region 3000 to 2800 cm−1; these signals can be assigned to C–H stretching vibrations of the polymer.
However, it has to be pointed out that, although the band positions are comparable between the control samples and the samples grown with the polymeric additives, the bands of the latter samples show a significant broadening. This indicates that the samples grown in the presence of the polymers are likely less crystalline, may contain nanocrystalline particles, or at least have a lower overall order than the control sample. Possibly, there are also amorphous sections of the material, but, as there is no clear indication from XRD, this is difficult to rule in or out. Nonetheless, while the data indicate that the same general material forms with or without polymer, IR spectroscopy also proves that there are subtle differences induced by the addition of the polymer.
Also consistent with the XRD data, samples grown at higher precursor concentrations of 100 mM show intense bands at 1207, 1110, 1049, and 981 cm−1, which can be assigned to different P=O stretching vibrations. Further bands at 875, 781, 572, and 518 cm−1, can also be assigned to phosphate [45]. These bands are indicative of DCPD. A further set of three strong bands at 3540, 3475, and 3261 cm−1 can be assigned to O–H stretching vibrations of DCPD. Finally, a strong band at 1643 cm−1 may be due to O–H deformation vibrations in hydrogen phosphate, O–H stretching vibrations in the cellulose polymer, or an asymmetric NO2 stretching vibration of the nitrate ion [44].
Figure 4 shows complementary Raman spectra obtained from the same materials. All samples made from 10 mM precursor solution exhibit a strong band at 961 cm−1; this signal can be assigned to the symmetric P–O stretching vibration of the phosphate ion [46,47,48,49]. Bands at 428 and 588 cm−1 are due to O–P–O bending vibrations of the phosphate ion [47,48,49,50,51]. A band at 1047 cm−1 is likely due to overlapping signals from an asymmetric P–O stretching vibration and a symmetric N–O stretching vibration from the nitrate ion [52,53]. The presence of nitrate is further confirmed by very broad and noisy signals ca. 1450 cm−1, which can assigned to symmetric stretching vibration of nitrate or nitrite [53]. Finally, a band at 764 cm−1 (not always observed) is due to a deformation vibration of the nitrate ion [54].
Spectra obtained from samples precipitated from 100 mM solution show strong bands at 991 and 887 cm−1; these bands can be assigned to P–O stretching vibrations of the phosphate ion [45,50,51,55,56,57,58]. Somewhat weaker bands at 382, 415 and 525 cm−1 are due to O–P–O bending vibrations of the HPO42− ion [45,50,58]. A band at 584 cm−1 is from P–O– and O–P–O stretching and bending vibrations of the PO43− ion [45,51,56,57,58]. These bands are characteristic for DCPD and thus confirm the XRD data shown above. An additional band at 1060 cm−1 is most likely due to overlapping bands caused by a phosphate P–O stretching vibration in DCPD [51] and a symmetric N–O stretching vibration from the nitrate ion [44,52,54]. Bands at 1081 and 1133 cm−1 are due to DCPD [51] and the band at 1288 cm−1 is due to the nitrate ion [53,54]. A band at 719 cm−1 that is not always present could again be due to a deformation vibration of the nitrate ion [54] as could a broad and noisy band at ca. 1410 cm−1, which can assigned to symmetric stretching vibration of nitrate or nitrite [53].
Figure 5 shows the Ca/P ratios obtained from energy dispersive X-ray spectroscopy (EDXS). In all cases, the samples exhibit a rather heterogeneous Ca/P ratio, if individual measurements (open black circles) taken at different sample locations or from different batches are compared. In spite of this, some generalities can be observed. Samples obtained from 10 mM reaction mixtures have average Ca/P ratios (red symbols) between ca. 1.35 and 1.50. This ratio is significantly lower than that if stoichiometric HAP (1.67) and is on the order of what would be expected for ACP (although here, literature reports Ca/P ratios between 1.20 and 2.20) [59] or OCP. However, HAP is well known to form calcium-deficient apatite, and Ca/P ratios for these materials have been as low as 1.50 [59,60].
The average Ca/P ratios obtained for the samples grown from 100 mM mixtures are significantly lower between 0.95 and 1.27 (although higher ratios have been observed in individual measurements). These values are—although they exhibit a rather broad variation—indicative of DCPD or OCP rather than HAP.
Finally, in all cases, the anionic polymer seems to favor the formation of products with lower Ca/P ratios than the other two polymers but, as the data are quite scattered, it is difficult to draw further conclusions on this subject at the moment.
Table 1 summarizes the results from elemental analysis. The control samples do not contain carbon, but some hydrogen, and, somewhat surprisingly, a significant amount of nitrogen. Nitrogen is also observed in all samples grown with the polymeric additives. The nitrogen fraction is quite significant and is much higher than what is expected, considering that the C/N ratio on the polymers is 6.0 for the anion, 5.0 for the cation, and 4.33 for the zwitterion (assuming 100% side chain functionalization, which is not entirely correct). Finally, the amounts of carbon (and hence of the polymer) in the precipitates are generally higher when a higher polymer concentration of 1 mg/mL was used. However, we do not observe a ten-fold increase of the carbon content compared to the samples grown from solutions with polymer concentrations of 0.1 mg/mL.
Figure 6 shows thermogravimetric analysis (TGA) data of the samples grown with 1 mg/mL of polymer from 100 mM precursor solutions. All TGA curves are quite similar in terms of their general shape, but there are significant differences in the weight losses between the different samples. The control sample loses 3% until 150 °C; this initial weight loss is likely due to water desorption. A second weight loss of 9% up to 240 °C can be assigned to a further water loss, likely from beginning condensation reactions between hydrogen phosphate groups and additional evaporation of more tightly bound water molecules. A third weight loss up to 550 °C is due to the more significant onset of pyrophosphate formation (further condensation of hydrogen phosphate groups). It is followed by a gradual, non-descript weight loss (1% to 2%) until the end of the experiment at 970 °C.
The same steps are observed for all polymer-containing samples, but the step heights are different and also the transition temperatures are slightly different from the control samples. All polymer-containing samples show a first weight loss of 10% (anion-based samples) or 13% (cation and zwitterion-based samples) until 140 °C. This initial loss is due to water desorption. Up to 290 °C, a further weight loss of 23% (anion-based samples) or 17% (cation and zwitterion-based samples) is likely due to a set of overlapping processes such as further weight loss due to hydrogen phosphate condensation and a rather complex multistep degradation of the cellulose-based polymer additive [61]. The last significant weight loss of 6%–7% for all polymer-containing samples up to 550 °C is due to charring of the polymer and possibly the beginning of pyrophosphate formation in the same temperature range [62]. The final weight loss to 970 °C is likely due to the formation of pyrophosphates and concurrent water elimination. Additional contributions can be assigned to decomposition of ammonium nitrate [63] and further water losses at higher temperatures up to ca. 300 °C [62,64].
The other samples generally provide analogous TGA curves, but due to the very low sample amounts available, these data are rather noisy and difficult to quantify.
Figure 7 shows representative pH data collected during the mineralization reactions. Reaction mixtures with precursor concentrations of 10 mM show a very reproducible pH behavior: upon addition of the phosphate solution to the calcium nitrate solution, the pH rapidly rises to around 7.0 and then drops to around pH 6.0 after 3–8 min. After this first increase and subsequent drop, the pH remains around 6.0 and only slight deviations are observed over the following 160 min.
Interestingly, the initial pH before addition of the phosphate solution follows the same sequence: the solution containing the zwitterionic additive has an initial pH of around 4, the solution containing the cation has an initial pH around 5.0, the control solutions have a pH of ca. 5.5, and the solutions containing the anionic additive have an initial pH of ca. 6.0.
The reactions performed in the 100 mM reaction mixtures show a different behavior. The initial pH before addition of the phosphate solution follows the same sequence zwitterion (ca. pH 4.0), cation (ca. pH 5.0), control (ca. pH 5.5). The only difference is that the solutions containing the anion have an initial pH of 5.5 in the 10 mM solutions and ca. 6.5 in the 100 mM solutions.
In contrast to the reaction mixtures prepared from the 10 mM solutions, the solutions with higher concentrations have a somewhat less controlled or at least less homogeneous pH evolution. In both cases (10 and 100 mM), after addition of the phosphate solution, the pH rapidly rises to 6.5–8 and then drops 5–5.7 after 1–2 min. After this initial rise-and-drop, the pH of the control mixtures (no polymer) remains at around 5.5 both at 10 and 100 mM. In contrast, all polymer-containing samples show additional changes. The anion-containing solutions reproducibly show oscillations around pH 5.0. The samples containing the cationic and the zwitterionic additive show a second increase of the pH over the course of 5–15 min, followed by a slow pH decrease until the end of the experiment after 160 min.

3. Discussion

It has been stated in the introduction that, although they are a very interesting class of materials, carbohydrates have only rarely been used for the synthesis of calcium phosphate/polymer composite materials. One of the key issues is the low solubility of both cellulose and chitosan in aqueous media (where mineralization reactions are typically conducted) [2,15]. In contrast, the polymers used in the current study are highly water-soluble [42] and thus provide access to a much more controlled mineralization process starting from true solutions.
A key question in polymer-controlled mineralization is the charge state of the polymer additive. Indeed, pH measurements (Figure 7) show that the solution pH during the entire reaction is between 5 and ca. 6.3. As the pKa values of the polymer are 4.0 (carboxylic acid moiety) and between 8.6 and 9.7 (amino group) [42], all groups are charged during the reaction.
XRD (Figure 2), IR (Figure 3), and Raman spectroscopy (Figure 4) show that either HAP (at low precursor precursor concentrations of 10 mM) or DCPD (at high precursor concentrations of 100 mM) form in the precipitation reactions. This is independent of the presence or absence of a polymer additive. These data are consistent with previous work demonstrating a strong dependence of the calcium phosphate phase selection vs. precursor concentration [62,65].
Moreover, IR and Raman spectroscopy provide strong evidence of the presence of nitrate ions in the samples; this is further confirmed by the fact that in some XRD patterns there is even evidence of ammonium nitrate as a contaminant. Somewhat surprisingly, this contamination could not be removed even with extended washing. This suggests that the ammonium nitrate is tightly bound or incorporated into the calcium phosphate precipitates.
SEM (Figure 1) further confirms these observations as in all cases morphologies typical of either brushite (DCPD) or HAP are observed. In contrast, the presence or absence of any of the polymers studied here does not seem to influence the size or morphology of the precipitates.
EDX data (Figure 5) are somewhat difficult to interpret, as in all cases, they show a rather large variation, even when recorded from one and the same sample but at different locations. This indicates that, although crystallographically the samples are quite homogeneous, there are local variations in Ca and P (i.e., phosphate) concentrations. Possibly, this is correlated to the inhomogeneous distribution of nitrate ions and/or ammonium nitrate. Such an observation is also consistent with previous examples of calcium phosphate/cellulose hybrid materials [30] and with many bioinspired calcium phosphate precipitates in general [5,6].
As the major purpose of this study is the evaluation of cellulose-based polymers for the formation of calcium phosphate/polymer hybrid materials, the formation of true hybrid materials (i.e., the incorporation of the polymer into the precipitate) is necessary. To that end, we have used TGA (Figure 6) and EA (Table 1). EA clearly shows that most samples precipitated with the polymer additive contain carbon, hydrogen, and nitrogen. The nitrogen contents are surprisingly high at around 4%. This is likely due to the incorporation of some nitrate into the precipitate as evidenced by IR and Raman spectroscopy along with XRD. As there are two nitrogen sources present in the system (nitrate in high concentration and polymer in lower concentration), nitrogen contents do not unambiguously prove the presence of the polymer in the precipitates. In contrast, there is no carbon in the precursor salt solution and the fact that the carbon contents reach 10% in some samples clearly shows that the polymer is incorporated into the precipitates. Moreover, there is a correlation between precursor and polymer concentration: the higher the polymer concentration in the reaction mixture, the higher the carbon content in the final product. Inversely, the higher the precursor concentration, the lower is the carbon content. These data indicate that a higher polymer concentration favors the formation of polymer-enriched materials, while lower polymer concentrations or high precursor concentrations favor the formation of products that are closely related to the control samples precipitated in the absence of polymer.
EA is further supported by TGA. All polymer-containing samples show a more pronounced weight loss than the control samples. Two major features can be observed in the TGA data: (i) the first weight loss is about four times larger in the polymer-containing samples than in the control samples (3% vs. 10%–13%) and (ii) the second weight loss is ca. twice as large in the polymer-containing samples than in the control samples (9% vs. 17%–23%). The first observation indicates that the polymer-containing samples contain ca. four times more water than the control samples. The latter point suggests that measurable amounts of polymer are incorporated into the hybrid materials.
Assuming that the weight loss of 9% between 150 and 240 °C in the control sample is caused by water desorption and the beginning of hydrogen phosphate condensation, the difference between this particular weight loss in the control samples and the much larger weight losses observed in the polymer-containing samples must be caused by the presence of the polymer. As a result, we conclude that, after subtraction of the 9% weight loss due to the inorganic component, the residual weight loss of 6%–14% is due to incorporated polymer.
A polymer weight fraction of 6%–14% matches reasonably well with EA: all polymer additives have a carbon content of ca. 45%. As a result, the overall polymer content calculated from EA is around 6%, which is comparable with TGA. The fact that EA measures slightly lower contents may be due to the high fraction of inorganic obscuring some of the data. Moreover, the still rather low polymer content in the final products may also be the reason why some of the IR spectra show rather low intensities of the C–H vibrations (Figure 3).
Overall, the current study proves that water-soluble cellulose-based polyelectrolytes lead to the formation of true calcium phosphate/polymer hybrids. The detailed composition of the precipitates depends on the relative concentrations of the precursor salt solutions and the polymer concentration. Consistent with previous studies [5], higher polymer concentrations and lower precursor concentrations lead to a material that is closer to a “real” hybrid material, while inverse conditions lead to samples that are more closely related to the control samples. Moreover, the crystal phase selection (HAP vs. DCPD in the current study) is not determined by the chemistry of the polymer additive, but by the precursor concentrations and the pH changes occurring during the mineralization process (Figure 7); this observation is also consistent with literature [5,6].

4. Materials and Methods

4.1. Materials

Diammonium hydrogen phosphate (Roth Karlsruhe, Germany, >99%) calcium nitrate tetrahydrate (Roth, >99%) were used as received. Millipore water (18.2 MΩ/cm and TOC < 2 ppb at 25 °C). Polymers were prepared as described previously [42].

4.2. Mineralization Reactions

Prior to the mineralization reaction, the starting solutions were prepared by dissolving the respective amounts (0.264 or 2.64 g, respectively) of diammonium hydrogen phosphate and calcium nitrate tetrahydrate (0.472 or 4.72 g, respectively) separately in 100 mL of water each yielding 20 or 200 mM solutions of both precursors. Subsequently, the polymer (anion, cation, zwitterion) was dissolved in the calcium nitrate solution at either 0.2 or 2 mg/mL.
Mineralization was done at 37 °C; 10 mL of either a 10 or 100 mM calcium nitrate solution were stirred in double-walled glass vessels connected to a Thermo Haake D8-L and housed in a Uniequip Unihood 550, which was also held at 37 °C. To this solution 10 mL of the corresponding phosphate solution (10 or 100 mM) were added rapidly. Upon mixing of the two solutions, the calcium and phosphate concentrations were 10 or 100 mM and the polymer concentration was 0.1 or 1 mg/mL by dilution to twice the original volume. The solution immediately became turbid and was stirred for 4 h at ca. 300 rpm. Samples were isolated by centrifugation at 10,000 rpm for 10 min and the white or off-white residues were dried at room temperature in a vacuum oven for three days.

4.3. Characterization

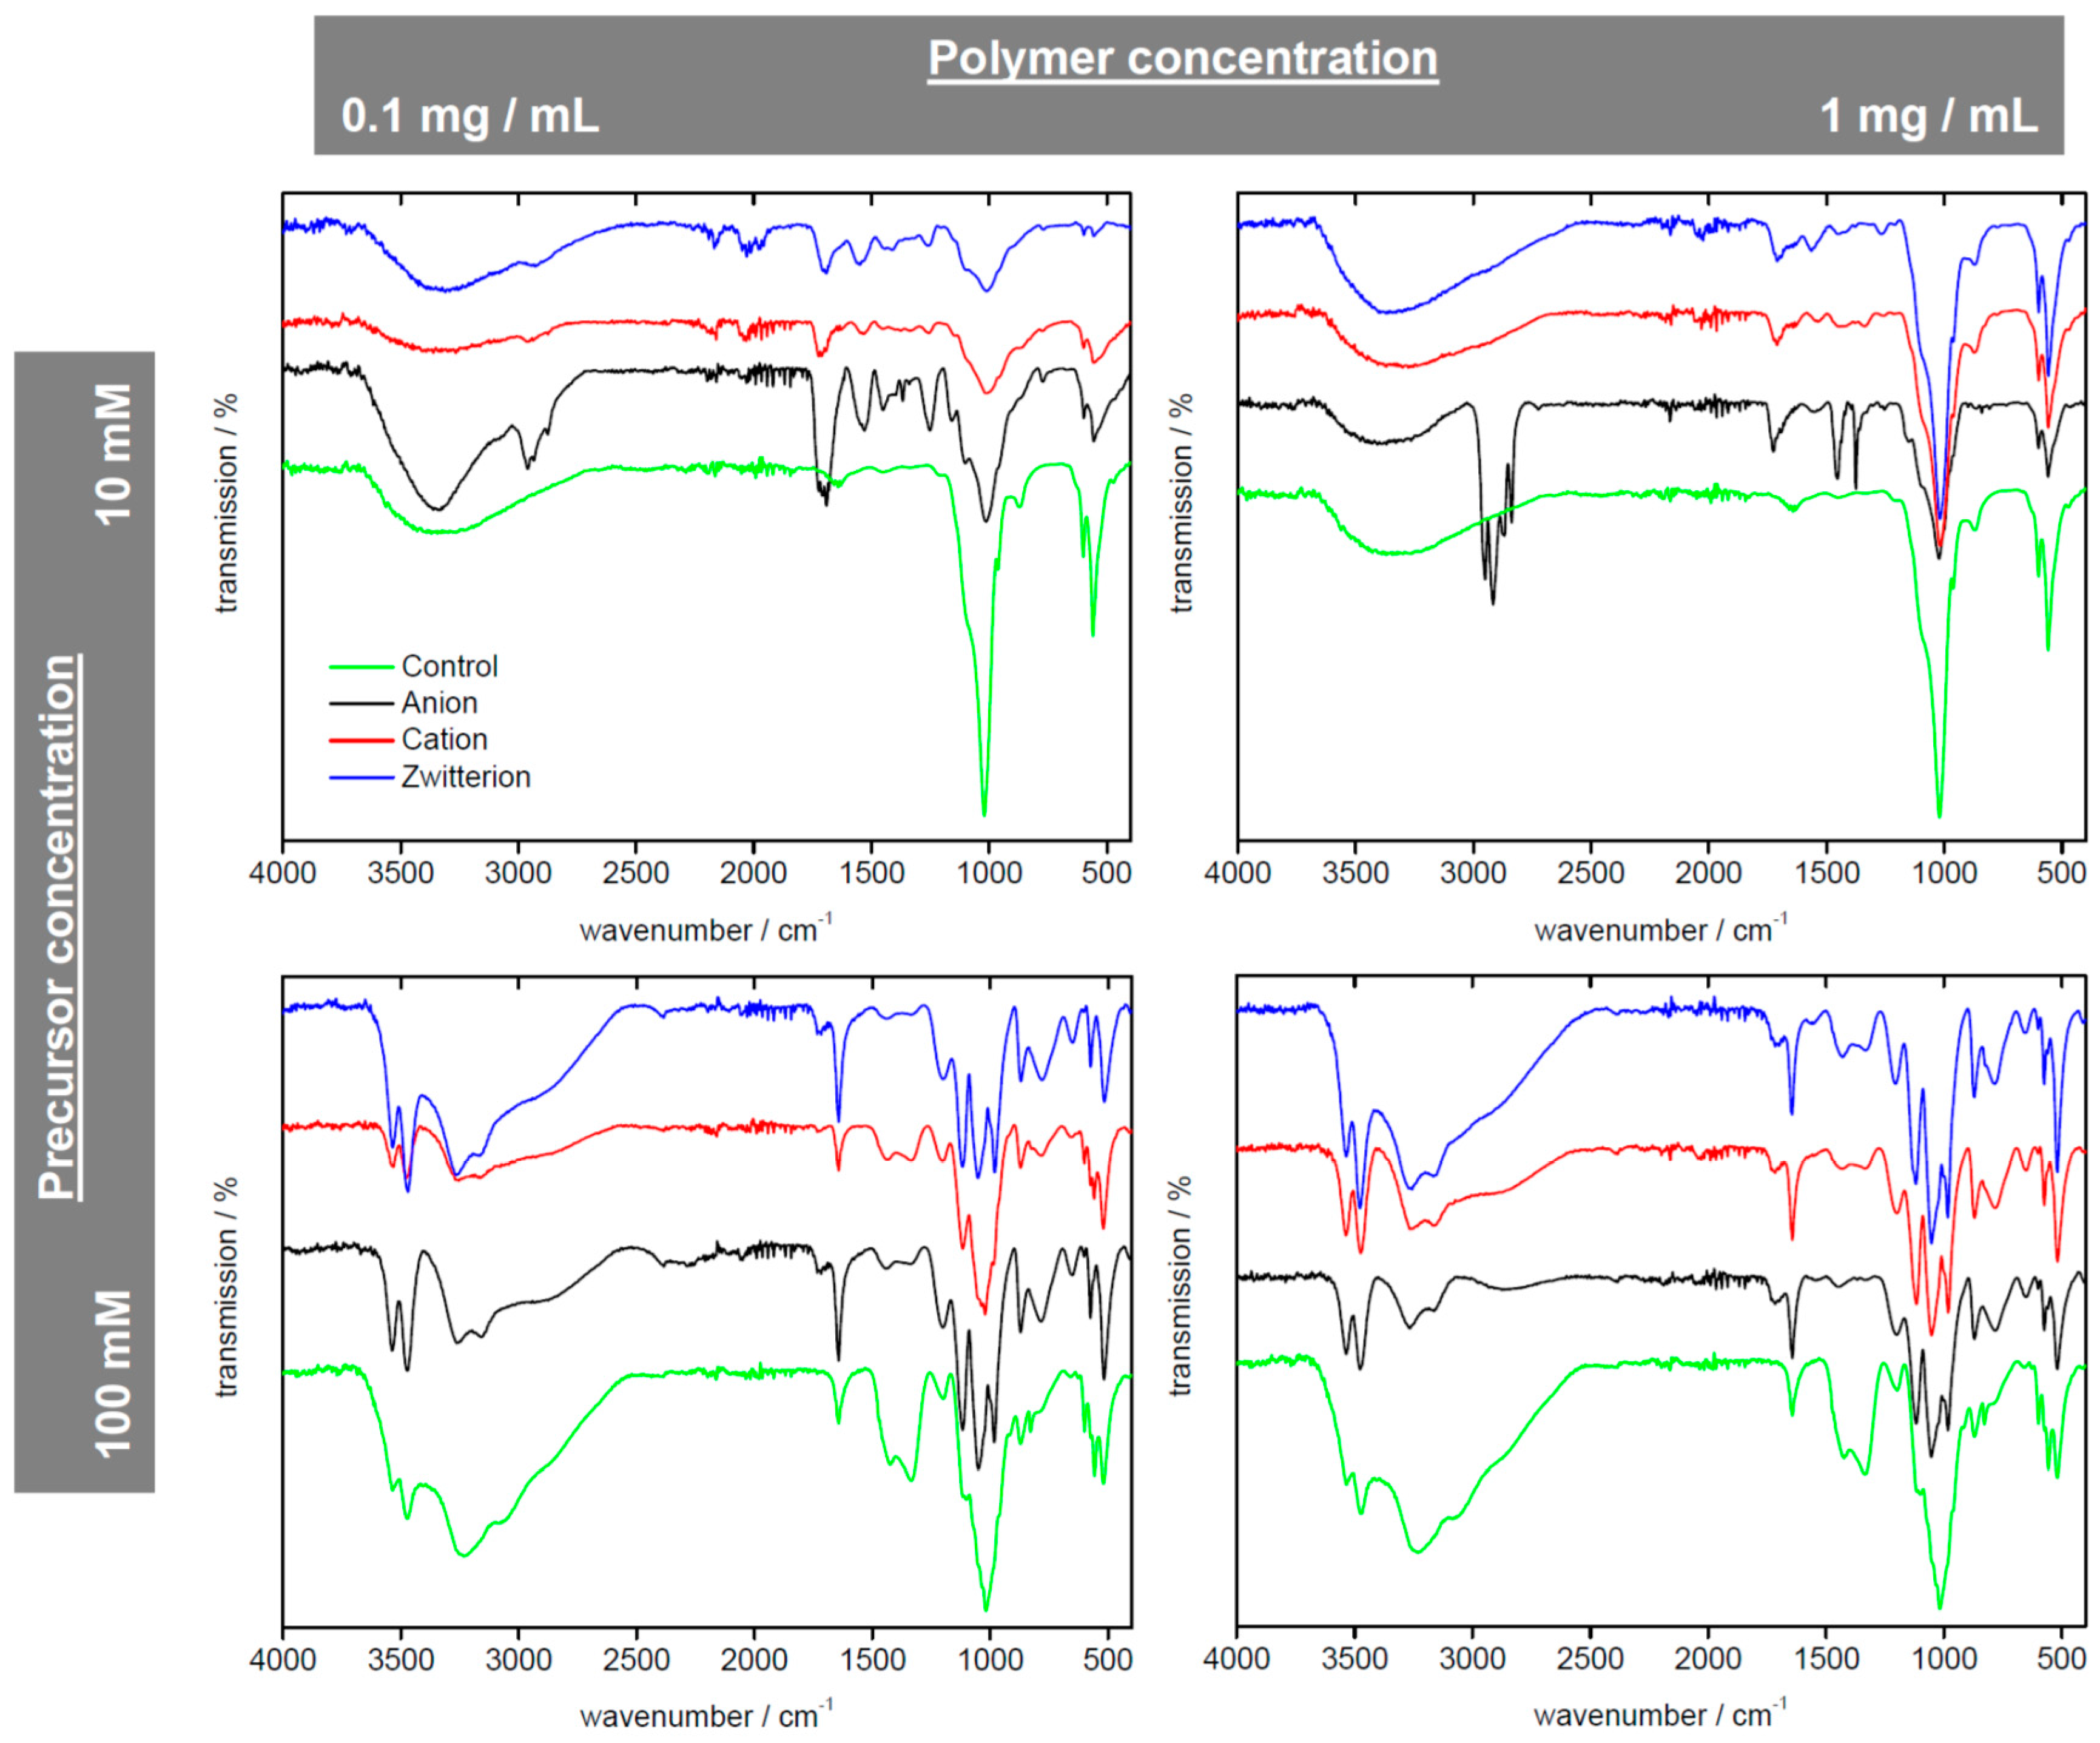
4.3.1. Infrared (IR) Spectroscopy

IR spectra were recorded via attenuated total reflection (ATR-IR) setup on a Thermo Nicolet FT-IR NEXUS 670 (Langenselbold, Germany).

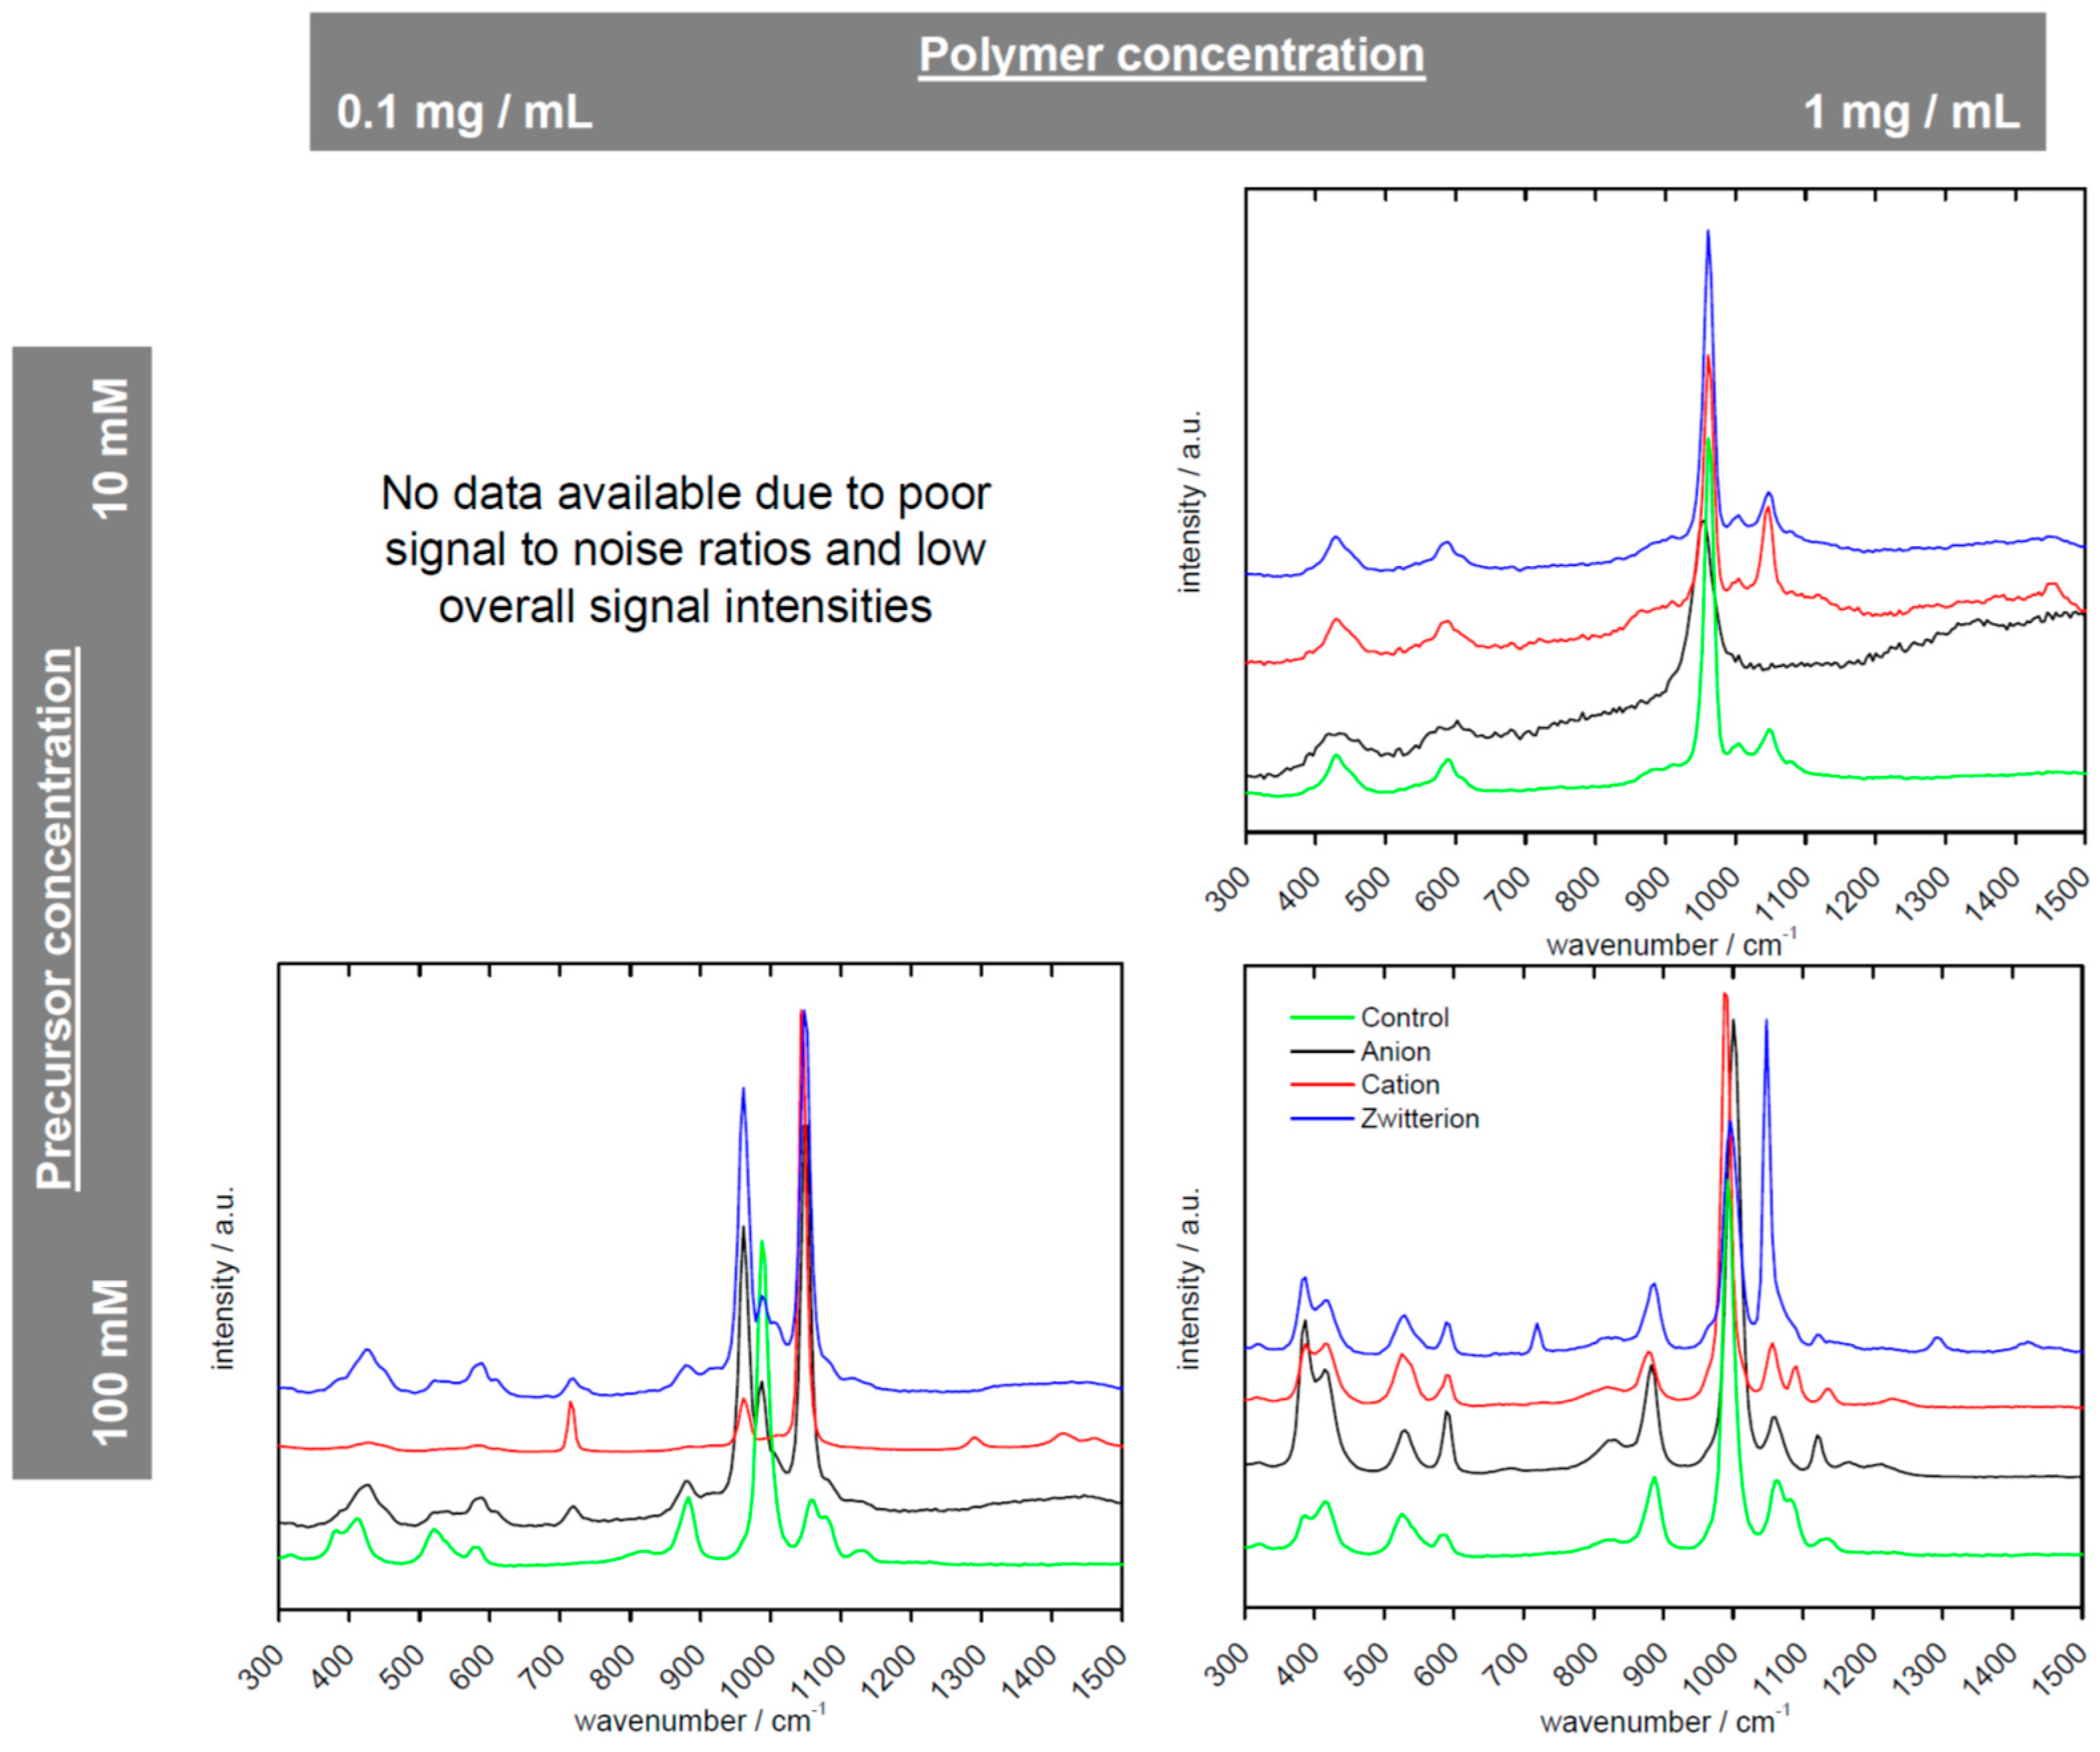
4.3.2. Raman Spectroscopy

Raman sepctra were recorded using a confocal Raman microscope (Witec alpha300 AR, Ulm, Germany). For Raman excitation a laser emitting at 532 nm was used. For a reasonable signal-to-noise ratio, for each Raman spectrum ten individual spectra (using an integration time of five seconds) were accumulated.

4.3.3. Scanning Electron Microscopy (SEM)

SEM images were obtained on a JEOLJSM-6510 (Freising, Germany) with tungsten filament at an acceleration voltage between 1 and 3 kV. It must be stated here that a number of samples were difficult to image due to rapid sample charging. We attribute this behavior to the fact that calcium phosphate is an insulator and that the solids observed here are rather thick. This implies a rather poor sample-to-substrate (sample holder) contact, which in turn results in the said rapid charging. Unfortunately, this behavior could not be improved, even when using silver paste or other aids that usually are quite successful.

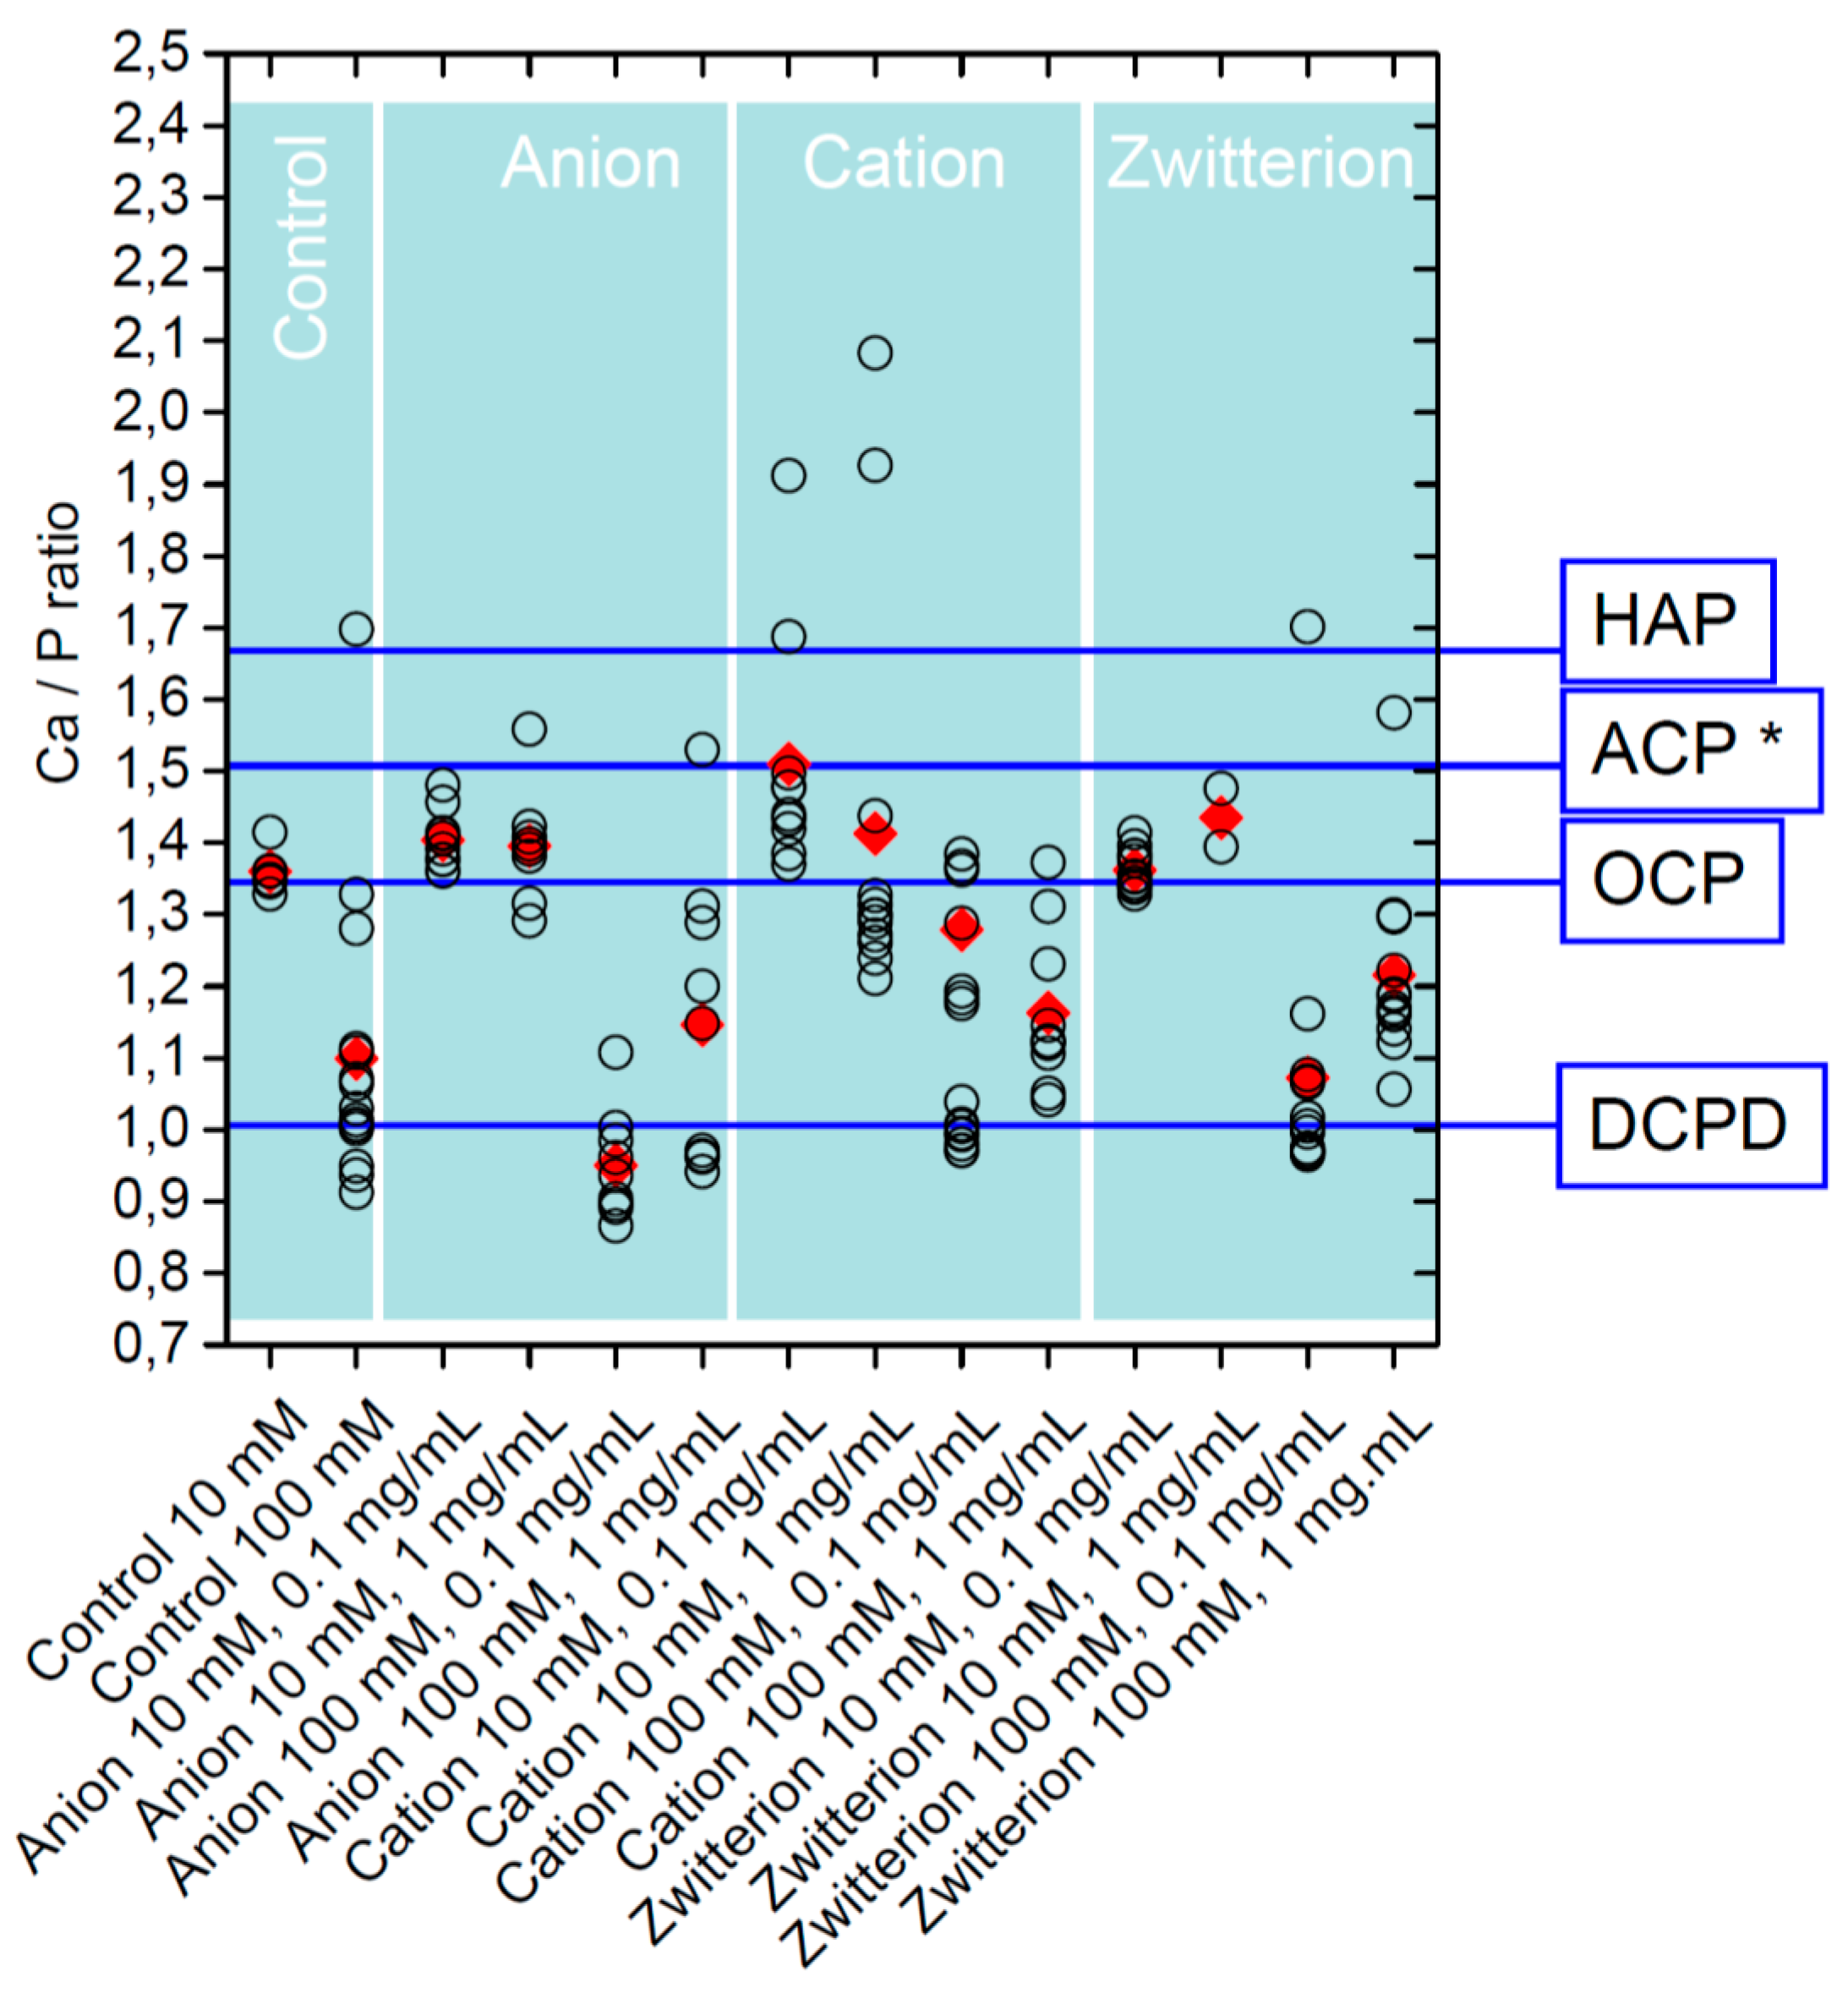
4.3.4. Energy Dispersive X-ray Spectroscopy (EDXS)

EDX spectra were recorded with an Oxford Instruments INCAx-act EDX detector (Uedem, Germany) attached to the above SEM. Acceleration voltage was 15 kV and the samples were sputter-coated with carbon and gold/palladium prior to the measurements. Calibration was done prior to each measurement. Spectrum processing was done using top hat filtering and least square fitting. INCA Energy uses the XPP matrix correction scheme developed by Pouchou and Pichoir [66,67]. The influence of coating is corrected automatically.

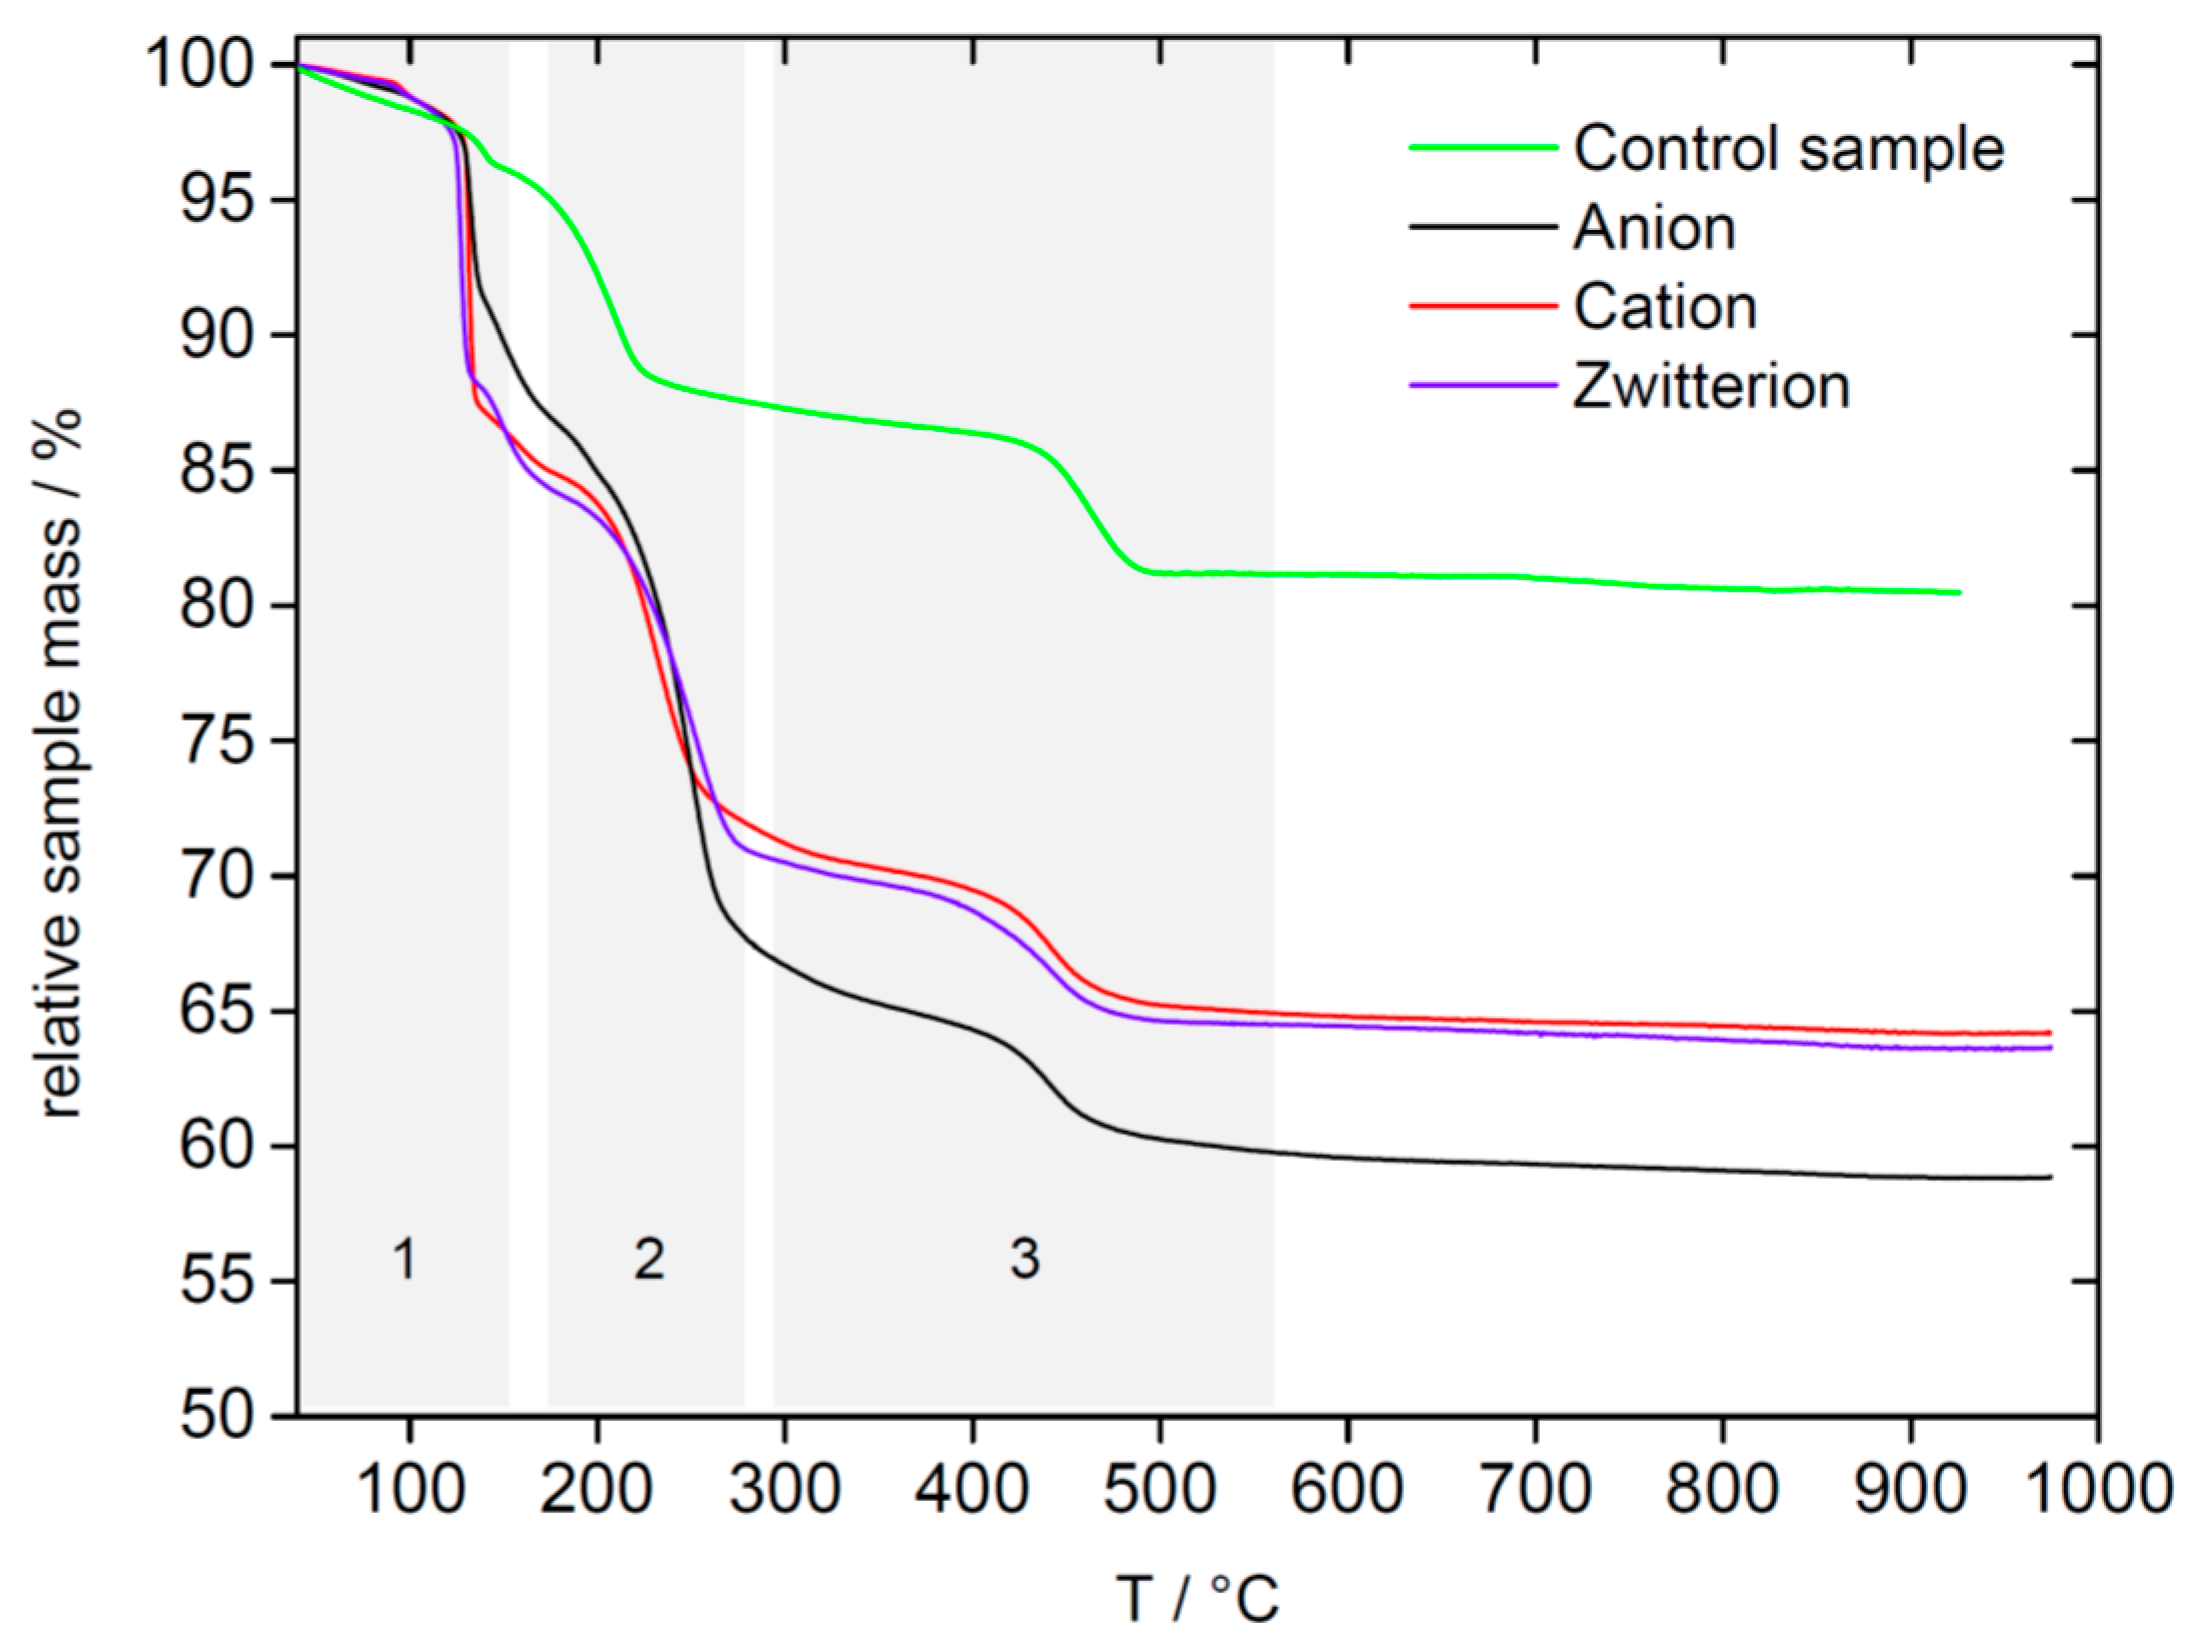
4.3.5. Thermogravimetric Analysis (TGA)

TGA data were obtained on a Perkin Elmer TGA 4000 (Rodgau, Germany) from 25 to 1000 °C at a heating rate of 10 °C/min in air.

4.3.6. X-ray Diffraction (XRD)

XRD measurements were done on a PANanalytical Empyrean Series 2 (Kassel, Germany). Sample identification was done via the DIFFRACplus and ICDD Powder Diffraction Database (PDF4). Samples were either mounted on a silicon sample holder and measured in reflection mode (Bragg-Brentano) or mounted between two Kapton windows and measured in transmission mode.

4.3.7. Elemental Analysis (EA)

EA was done on a Vario EL III Elementar (Langenselbold, Germany). Measurements were done at least in duplicate.

5. Conclusions

In conclusion, the article shows that cellulose derivatization provides access to highly water-soluble additives for calcium phosphate (bio)mineralization; these additives are potential green or sustainable alternatives to petrochemical-based mineralization additives. One of their main advantages is that the mineralization process can be initiated from true solutions containing calcium, phosphate, and the polymer. This simplifies the design of the mineralization compared to processes we only partly soluble or insoluble polymers (such as neat cellulose) are used for hybrid materials synthesis. As a result, cellulose derivatives have high potential as mineralization additives, yet their potential is still virtually unexplored for (bio)materials design. The current study, however, shows that composite materials with potential applications in the biomaterials fields can be made from these new water-soluble carbohydrate derivatives.

Acknowledgments

We thank Y. Mai-Linde for elemental analysis.

Author Contributions

Andreas Taubert conceived and designed the experiments; Thomas Elschner made and characterized the polymers; Thomas Elschner and Thomas Heinze developed the polymer synthesis; Christian Balischewski and Doreen Hentrich performed the experiments; Sascha Eidner performed the Raman experiments and aided with data analysis. Christina Günter performed the XRD analysis and performed the data analysis, Karsten Behrens did the TGA measurements and supported the analysis. Christian Balischewski, Doreen Hentrich, and Andreas Taubert analyzed the data; Andreas Taubert wrote the paper. All authors commented on the manuscript and supported data analysis.

Conflicts of Interest

The authors declare no conflict of interest.

References

  1. Qiu, K.Y.; Netravali, A.N. A review of fabrication and applications of bacterial cellulose based nanocomposites. Polym. Rev. 2014, 54, 598–626. [Google Scholar] [CrossRef]
  2. Wan, A.C.A.; Tai, B.C.U. Chitin—A promising biomaterial for tissue engineering and stem cell technologies. Biotechnol. Adv. 2013, 31, 1776–1785. [Google Scholar] [CrossRef] [PubMed]
  3. Fernandes, E.M.; Pires, R.A.; Mano, J.F.; Reis, R.L. Bionanocomposites from lignocellulosic resources: Properties, applications and future trends for their use in the biomedical field. Prog. Polym. Sci. 2013, 38, 1415–1441. [Google Scholar] [CrossRef]
  4. Czaja, W.K.; Young, D.J.; Kawecki, M.; Brown, R.M. The future prospects of microbial cellulose in biomedical applications. Biomacromolecules 2007, 8, 1–12. [Google Scholar] [CrossRef] [PubMed]
  5. Bleek, K.; Taubert, A. New developments in polymer-controlled, bio-inspired calcium phosphate mineralization from aqueous solution. Acta Biomater. 2013, 9, 6283–6321. [Google Scholar] [CrossRef] [PubMed]
  6. Schweizer, S.; Taubert, A. Polymer-controlled, bio-inspired calcium phosphate mineralization from aqueous solution. Macromol. Biosci. 2007, 7, 1085–1099. [Google Scholar] [CrossRef] [PubMed]
  7. Signe, G.H.; Skrydstrup, T. Modification of amino acids, peptides, and carbohydrates through radical chemistry. In Radicals in Synthesis II: Complex Molecules; Springer-Verlag: Berlin, Germany, 2006; Volume 264, pp. 135–162. [Google Scholar]
  8. Falini, G.; Fermani, S.; Ripamonti, A. Oriented crystallization of octacalcium phosphate into beta-chitin scaffold. J. Inorg. Biochem. 2001, 84, 255–258. [Google Scholar] [CrossRef]
  9. Vittori, M.; Srot, V.; Zagar, K.; Bussmann, B.; van Aken, P.A.; Ceh, M.; Strus, J. Axially aligned organic fibers and amorphous calcium phosphate form the claws of a terrestrial isopod (Crustacea). J. Struct. Biol. 2016, 195, 227–237. [Google Scholar] [CrossRef] [PubMed]
  10. Dumont, V.C.; Mansur, A.A.P.; Carvalho, S.M.; Borsagli, F.; Pereira, M.M.; Mansur, H.S. Chitosan and carboxymethyl-chitosan capping ligands: Effects on the nucleation and growth of hydroxyapatite nanoparticles for producing biocomposite membranes. Mater. Sci. Eng. C 2016, 59, 265–277. [Google Scholar] [CrossRef] [PubMed]
  11. Kawata, M.; Azuma, K.; Izawa, H.; Morimoto, M.; Saimoto, H.; Ifuku, S. Biomineralization of calcium phosphate crystals on chitin nanofiber hydrogel for bone regeneration material. Carbohydr. Polym. 2016, 136, 964–969. [Google Scholar] [CrossRef] [PubMed]
  12. Shavandi, A.; Bekhit, A.; Sun, Z.F.; Ali, A.; Gould, M. A novel squid pen chitosan/hydroxyapatite/β-tricalcium phosphate composite for bone tissue engineering. Mater. Sci. Eng. C 2015, 55, 373–383. [Google Scholar] [CrossRef] [PubMed]
  13. Zhang, X.; Li, Y.Q.; Sun, X.X.; Kishen, A.; Deng, X.L.; Yang, X.P.; Wang, H.J.; Cong, C.H.; Wang, Y.H.; Wu, M.Y. Biomimetic remineralization of demineralized enamel with nano-complexes of phosphorylated chitosan and amorphous calcium phosphate. J. Mater. Sci. Mater. Med. 2014, 25, 2619–2628. [Google Scholar] [CrossRef] [PubMed]
  14. Narayanan, D.; Jayakumar, R.; Chennazhi, K.P. Versatile carboxymethyl chitin and chitosan nanomaterials: A review. Wiley Interdiscip. Rev. Nanomed. Nanobiotechnol. 2014, 6, 574–598. [Google Scholar] [CrossRef] [PubMed]
  15. Ravi Kumar, M.N.V. A review of chitin and chitosan applications. React. Funct. Polym. 2000, 46, 1–27. [Google Scholar] [CrossRef]
  16. Schweizer, S.; Schuster, T.; Junginger, M.; Siekmeyer, G.; Taubert, A. Surface modification of nickel/titanium alloy and titanium surfaces via a polyelectrolyte multilayer/calcium phosphate hybrid coating. Macromol. Mater. Eng. 2010, 295, 535–543. [Google Scholar] [CrossRef]
  17. Rusu, V.M.; Ng, C.H.; Wilke, M.; Tiersch, B.; Fratzl, P.; Peter, M.G. Size-controlled hydroxyapatite nanoparticles as self-organized organic–inorganic composite materials. Biomaterials 2005, 26, 5414–5426. [Google Scholar] [CrossRef] [PubMed]
  18. Chiono, V.; Gentile, P.; Boccafoschi, F.; Carmagnola, I.; Ninov, M.; Georgieva, V.; Georgiev, G.; Ciardelli, G. Photoactive chitosan switching on bone-like apatite deposition. Biomacromolecules 2010, 11, 309–315. [Google Scholar] [CrossRef] [PubMed]
  19. Yamane, S.; Sugawara, A.; Watanabe, A.; Akiyoshi, K. Hybrid nanoapatite by polysaccharide nanogel-templated mineralization. J. Bioact. Compat. Polym. 2009, 24, 151–168. [Google Scholar] [CrossRef]
  20. Dogan, O.; Oener, M.; Cinel, O. The inhibitory effects of inulin biopolymers on the seeded growth of hydroxyapatite. J. Ceram. Soc. Jpn 2010, 1118, 579–586. [Google Scholar] [CrossRef]
  21. Thula, T.T.; Svedlund, F.; Rodriguez, D.E.; Podschun, J.; Pendi, L.; Gower, L.P. Mimicking the nanostructure of bone: Composition of polymeric process-dorecting agents. Polymers 2011, 3, 10–35. [Google Scholar] [CrossRef] [PubMed]
  22. Joshi, M.K.; Pant, H.R.; Tiwari, A.P.; Maharjan, B.; Liao, N.; Kim, H.J.; Park, C.H.; Kim, C.S. Three-dimensional cellulose sponge: Fabrication, characterization, biomimetic mineralization, and in vitro cell infiltration. Carbohydr. Polym. 2016, 136, 154–162. [Google Scholar] [CrossRef] [PubMed]
  23. Lukasheva, N.V.; Tolmachev, D.A. Cellulose nanofibrils and mechanism of their mineralization in biomimetic synthesis of hydroxyapatite/native bacterial cellulose nanocomposites: Molecular dynamics simulations. Langmuir 2016, 32, 125–134. [Google Scholar] [CrossRef] [PubMed]
  24. Luo, H.L.; Xiong, G.Y.; Zhang, C.; Li, D.Y.; Zhu, Y.; Guo, R.S.; Wan, Y.Z. Surface controlled calcium phosphate formation on three-dimensional bacterial cellulose-based nanofibers. Mater. Sci. Eng. C 2015, 49, 526–533. [Google Scholar] [CrossRef] [PubMed]
  25. Tolmachev, D.A.; Lukasheva, N.V. Study of the process of mineralization of nanofibrils of native bacterial cellulose in solutions of mineral ions: Modeling via the method of molecular dynamics. Polym. Sci. Ser. A 2014, 56, 545–557. [Google Scholar] [CrossRef]
  26. Petrauskaite, O.; Gomes, P.D.S.; Fernandes, M.H.; Juodzbalys, G.; Stumbras, A.; Maminskas, J.; Liesiene, J.; Cicciu, M. Biomimetic mineralization on a macroporous cellulose-based matrix for bone regeneration. Biomed. Res. Int. 2013, 9, 452750. [Google Scholar] [CrossRef] [PubMed]
  27. Li, K.N.; Wang, J.N.; Liu, X.Q.; Xiong, X.P.; Liu, H.Q. Biomimetic growth of hydroxyapatite on phosphorylated electrospun cellulose nanofibers. Carbohydr. Polym. 2012, 90, 1573–1581. [Google Scholar] [CrossRef] [PubMed]
  28. Tolmachev, D.A.; Lukasheva, N.V. Interactions binding mineral and organic phases in nanocomposites based on bacterial cellulose and calcium phosphates. Langmuir 2012, 28, 13473–13484. [Google Scholar] [CrossRef] [PubMed]
  29. Higashi, K.; Kondo, T. Nematic ordered cellulose templates mediating order-patterned deposition accompanied with synthesis of calcium phosphates. Cellulose 2012, 19, 81–90. [Google Scholar] [CrossRef]
  30. Salama, A.; Neumann, M.; Günter, C.; Taubert, A. Ionic liquid-assisted formation of cellulose/calcium phosphate hybrid materials. Beilstein. J. Nanotechnol. 2014, 5, 1553–1568. [Google Scholar] [CrossRef] [PubMed]
  31. Jia, N.; Li, S.M.; Zhu, J.F.; Ma, M.G.; Xu, F.; Wang, B.; Sun, R.C. Microwave-assisted synthesis and characterization of cellulose-carbonated hydroxyapatite nanocomposites in NaOH–urea aqueous solution. Mater. Lett. 2010, 64, 2223–2225. [Google Scholar] [CrossRef]
  32. Jia, N.; Li, S.M.; Ma, M.G.; Sun, R.C.; Zhu, J.F. Hydrothermal synthesis and characterization of cellulose-carbonated hydroxyapatite nanocomposites in NaOH–urea aqueous solution. Sci. Adv. Mater. 2010, 2, 210–214. [Google Scholar] [CrossRef]
  33. Ma, M.G.; Zhu, J.F.; Jia, N.; Li, S.M.; Sun, R.C.; Cao, S.W.; Chen, F. Rapid microwave-assisted synthesis and characterization of cellulose-hydroxyapatite nanocomposites in N,N-dimethylacetamide solvent. Carbohydr. Res. 2010, 345, 1046–1050. [Google Scholar] [CrossRef] [PubMed]
  34. Kovtun, A.; Kozlova, D.; Ganesan, K.; Biewald, C.; Seipold, N.; Gaengler, P.; Arnold, W.H.; Epple, M. Chlorhexidine-loaded calcium phosphate nanoparticles for dental maintenance treatment: Combination of mineralising and antibacterial effects. RSC Adv. 2012, 2, 870–875. [Google Scholar] [CrossRef]
  35. Salama, A.; Abou-Zeid, R.E.; El-Sakhawy, M.; El-Gendy, A. Carboxymethyl cellulose/silica hybrids as templates for calcium phosphate biomimetic mineralization. Int. J. Biol. Macromol. 2015, 74, 155–161. [Google Scholar] [CrossRef] [PubMed]
  36. Sokolova, V.; Kovtun, A.; Prymak, O.; Meyer-Zaika, W.; Kubareva, E.; Romanova, E.A.; Oretskaya, T.S.; Heumann, R.; Epple, M. Functionalization of calcium phosphate nanoparticles by oligonucleotides and their application for gene silencing. J. Mater. Chem. 2007, 17, 721–727. [Google Scholar] [CrossRef]
  37. Sokolova, V.; Prymak, O.; Meyer-Zaika, W.; Cölfen, H.; Rehage, H.; Shukla, A.; Epple, M. Synthesis and characterization of DNA functionalized calcium phosphate nanoparticles. Materialwiss. Werkst. 2006, 37, 441–445. [Google Scholar] [CrossRef]
  38. Sokolova, V.; Radtke, I.; Heumann, R.; Epple, M. Effective transfection of cells with multi-shell calcium phosphate-DNA nanoparticles. Biomaterials 2006, 27, 3147–3153. [Google Scholar] [CrossRef] [PubMed]
  39. Welzel, T.; Radtke, I.; Meyer-Zaika, W.; Heumann, R.; Epple, M. Transfection of cells with custom-made calcium phosphate nanoparticles coated with DNA. J. Mater. Chem. 2004, 14, 2213–2217. [Google Scholar] [CrossRef]
  40. Anonymous. Biomin bioglass toothpaste may better protect sensitive teeth and find its way into us market. Am. Ceram. Soc. Bull. 2016, 95, 22–23. [Google Scholar]
  41. Kim, J.Y.; Kim, K.O. The effects of sensory and nonsensory factors on consumer acceptability and purchase intention of commercial toothpaste. J. Sens. Stud. 2014, 29, 395–403. [Google Scholar] [CrossRef]
  42. Elschner, T.; Heinze, T. A promising cellulose-based polyzwitterion with pH-sensitive charges. Beilstein J. Org. Chem. 2014, 10, 1549–1556. [Google Scholar] [CrossRef] [PubMed]
  43. Ribeiro, C.C.; Barrias, C.C.; Barbosa, M.A. Preparation and characterisation of calcium-phosphate porous microspheres with a uniform size for biomedical applications. J. Mater. Sci. Mater. Med. 2006, 17, 455–463. [Google Scholar] [CrossRef] [PubMed]
  44. Baltrusaitis, J.; Schuttlefield, J.; Jensen, J.H.; Grassian, V.H. FTIR spectroscopy combined with quantum chemical calculations to investigate adsorbed nitrate on aluminium oxide surfaces in the presence and absence of co-adsorbed water. Phys. Chem. Chem. Phys. 2007, 9, 4970–4980. [Google Scholar] [CrossRef] [PubMed]
  45. Koutsopoulos, S. Synthesis and characterization of hydroxyapatite crystals: A review study on the analytical methods. J. Biomed. Mater. Res. 2002, 62, 600–612. [Google Scholar] [CrossRef] [PubMed]
  46. O’Shea, D.C.; Bartlett, M.L.; Young, R.A. Compositional analysis of apatites with Laser-Raman spectroscopy: (OH,F,Cl)Apatites. Arch. Oral Biol. 1974, 19, 995–1006. [Google Scholar] [CrossRef]
  47. Griffith, W.P. Raman studies on rock-forming minerals. Part II. Minerals containing MO3, MO4, and MO6 groups. J. Chem. Soc. A 1970, 286–291. [Google Scholar] [CrossRef]
  48. DeAza, P.N.; Santos, C.; Pazo, A.; deAza, S.; Cusco, R.; Artus, L. Vibrational properties of calcium phosphate compounds. 1. Raman spectrum of β-tricalcium phosphate. Chem. Mater. 1997, 9, 912–915. [Google Scholar] [CrossRef]
  49. DeAza, P.N.; Guitian, F.; Santos, C.; deAza, S.; Cusco, R.; Artus, L. Vibrational properties of calcium phosphate compounds. 2. Comparison between hydroxyapatite β-tricalcium phosphate. Chem. Mater. 1997, 9, 916–922. [Google Scholar] [CrossRef]
  50. Sauer, G.R.; Zunic, W.B.; Durig, J.R.; Wuthier, R.E. Fourier-transform Raman spectroscopy of synthetic and biological calcium phosphates. Calcif. Tissue Int. 1994, 54, 414–420. [Google Scholar] [CrossRef] [PubMed]
  51. Tsuda, H.; Arends, J. Raman-spectra of human dental calculus. J. Dent. Res. 1993, 72, 1609–1613. [Google Scholar] [CrossRef] [PubMed]
  52. Ikushima, Y.; Saito, N.; Arai, M. Raman spectral studies of aqueous zinc nitrate solution at high temperatures and at a high pressure of 30 Mpa. J. Phys. Chem. B 1998, 102, 3029–3035. [Google Scholar] [CrossRef]
  53. Ianoul, A.; Coleman, T.; Asher, S.A. UV resonance Raman spectroscopic detection of nitrate and nitrite in wastewater treatment processes. Anal. Chem. 2002, 74, 1458–1461. [Google Scholar] [CrossRef]
  54. Irish, D.E.; Davis, A.R. Interactions in aqueous alkali metal nitrate solutions. Can. J. Chem. 1968, 46, 943–951. [Google Scholar] [CrossRef]
  55. Fowler, B.O.; Markovic, M.; Brown, W.E. Octacalcium phosphate. 3. Infrared and Raman vibrational-spectra. Chem. Mater. 1993, 5, 1417–1423. [Google Scholar] [CrossRef]
  56. Penel, G.; Leroy, N.; Van Landuyt, P.; Flautre, B.; Hardouin, P.; Lemaitre, J.; Leroy, G. Raman microspectrometry studies of brushite cement: In vivo evolution in a sheep model. Bone 1999, 25, S81–S84. [Google Scholar] [CrossRef]
  57. Frost, R.L.; Xi, Y.F.; Pogson, R.E.; Millar, G.J.; Tan, K.Q.; Palmer, S.J. Raman spectroscopy of synthetic CaHPO4·2H2O– and in comparison with the cave mineral brushite. J. Raman Spectrosc. 2012, 43, 571–576. [Google Scholar] [CrossRef] [Green Version]
  58. Yilmaz, B.; Evis, Z. Raman spectroscopy investigation of nano hydroxyapatite doped with yttrium and fluoride ions. Spectr. Lett. 2014, 47, 24–29. [Google Scholar] [CrossRef]
  59. Dorozhkin, S.V. Calcium orthophosphates in nature, biology and medicine. Materials 2009, 2, 399–498. [Google Scholar] [CrossRef]
  60. Dorozhkin, S.V. Calcium orthophosphate deposits: Preparation, properties and biomedical applications. Mater. Sci. Eng. C 2015, 55, 272–326. [Google Scholar] [CrossRef] [PubMed]
  61. Li, Z.; Friedrich, A.; Taubert, A. Gold microcrystal synthesis via reduction of HAuCl4 by cellulose in the ionic liquid 1-butyl-3-methyl imidazolium chloride. J. Mater. Chem. 2008, 24, 1008. [Google Scholar] [CrossRef]
  62. Joshi, V.S.; Joshi, M.J. FTIR spectroscopic, thermal and growth morphological studies of calcium hydrogen phosphate dihydrate crystals. Cryst. Res. Technol. 2003, 38, 817–821. [Google Scholar] [CrossRef]
  63. Fujisato, K.; Habu, H.; Miyake, A.; Hori, K. Thermal decomposition of ammonium nitrate modeling of thermal dissociation in thermal analysis. Sci. Technol. Energ. Mater. 2014, 75, 28–36. [Google Scholar]
  64. Mulley, V.J.; Cavendis, C.D. A thermogravimetric method for analysis of mixtures of brushite and monetite. Analyst 1970, 95, 304–307. [Google Scholar] [CrossRef]
  65. Sugawara, A.; Yamane, S.; Akiyoshi, K. Nanogel-templated mineralization: Polymer-calcium phosphate hybrid nanomaterials. Macromol. Rapid. Commun. 2006, 27, 441–446. [Google Scholar] [CrossRef]
  66. Pouchou, J.L.; Pichoir, F.; Boivin, D. The XPP Procedure Applied to Quantitative EDS X-ray Analysis in the SEM; San Francisco Press: San Francisco, CA, USA, 1990. [Google Scholar]
  67. Pouchou, J.L.; Pichoir, F. quantitative analysis of homogeneous or stratified microvolumes applying the model “pap”. In Electron Probe Quantitation; Heinrich, K.F.J., Newbury, D.E., Eds.; Plenum Press: New York, NY, USA, 1991. [Google Scholar]
Scheme 1. Polymers used in the current study. Gray areas highlight ionic groups. Counterions are Na+ and Cl, respectively (not shown).
Inorganics 04 00033 sch001
Figure 1. Representative SEM images of sample grown under different reaction conditions. Note that some of the samples showed very high charging (in spite of carbon or gold coating) and could therefore not be imaged with publishable image quality (see experimental part for details). Live observation in the SEM however shows that the samples look identical to those made under analogous synthesis conditions. Images in middle row show the “blob-” or “droplet-like” features mentioned in the text.
Inorganics 04 00033 g001
Figure 2. Representative XRD patterns of all samples studied. Control sample refers to samples grown in the absence of polymer additive. “Precursor concentration” refers to concentrations of the precursor salts (calcium nitrate and diammonium hydrogen phosphate) in the reaction mixtures. Color scheme applies to both panels of the figure. The different background in the two datasets is due to different sample holders (see experimental section for details). The difference in the signal intensities in the left panel are due to different amounts of material used for XRD analysis; this stems from the fact that these reactions in general provide very little material. The more intense reflections in the right panel are due to the fact that (i) more material was obtained in these reactions and (ii) the brushite reflections are generally sharper and more intense than the apatite or OCP reflections; this is due to a higher order (less defects) in brushite compared to HAP or OCP.
Inorganics 04 00033 g002
Figure 3. Representative IR spectra of all samples investigated in this study. The color coding applies to all panels in the figure and also to the remainder of the article.
Inorganics 04 00033 g003
Figure 4. Representative Raman spectra of all samples investigated in this study.
Inorganics 04 00033 g004
Figure 5. Calcium phosphate ratios determined from EDXS measurements. Red symbols are average values determined from at least five measurements, open black circles are Ca/P ratios obtained from individual measurements taken at different spots on different samples prepared with the identical procedure, respectively. Horizontal blue lines are the Ca/P ratios for the different calcium phosphate phases specified at the respective line. * Note that for ACP, the Ca/P ratios in the literature vary from ca. 1.20 to 2.20 [59,60].
Inorganics 04 00033 g005
Figure 6. TGA curves obtained from samples grown with 100 mM precursor solution and 1 mg/mL of the respective polymers. Gray areas highlight the different decomposition steps. 1: water/solvent loss up to 140 °C (150 °C for the control sample); 2: overlapping further dehydration/condensation and cellulose decomposition steps up to 290 °C (240 °C for control sample); 3: final decomposition and pyrophosphate formation up to 550 °C.
Inorganics 04 00033 g006
Figure 7. Representative pH curves recorded during the mineralization reaction vs. polymer chemistry, polymer concentration, and precursor concentration.
Inorganics 04 00033 g007
Table 1. Elemental analysis data obtained from all samples. “n.d.” (not detected) indicates elements below the detection limit of the instrument (0.30%). Asterisk * indicates a sample with limited data quality due to very low sample mass available. Error has been estimated from the instrumental resolution of the instrument.
PolymerPrecursor Concentration/mMPolymer Concentration/mg/mLC (%)H (%)N (%)
Control100n.d.n.d.1.500 ± 0.530
1000n.d.2.423 ± 0.114.881 ± 0.607
Anion10110.01 ± 0.023.571 ± 0.015.094 ± 0.198
100.14.59 ± 0.081.284 ± 0.012.684 ± 0.078
10012.41 ± 0.012.522 ± 0.054.080 ± 0.15
1000.1n.d.2.511 ± 0.073.444 ± 0.09
Cation1017.47 ± 0.161.558 ± 0.013.403 ± 0.09
10 *0.13.75 ± 0.301.150 ± 0.302.481 ± 0.30
10011.43 ± 0.042.448 ± 0.094.925 ± 0.20
1000.1n.d.2.307 ± 0.024.279 ± 0.06
Zwitterion10116.94 ± 0.203.103 ± 0.054.300 ± 0.01
100.14.71 ± 0.051.164 ± 0.032.463 ± 0.07
10012.52 ± 0.012.572 ± 0.095.165 ± 0.18
1000.1n.d.2.343 ± 0.014.387 ± 0.11

