1. Introduction
The development of luminescent solar concentrators (LSC) and other types of semitransparent solar photovoltaic (PV) systems is at present rapidly transforming into a mature research field, with its origins dating back to the 1970s [
1,
2]. A large number of works have since been dedicated to achieving continued progress in enabling solar energy collection in planar window-type concentrators employing various luminescent materials, solar cell types, and device structures [
3,
4]. More recently, multiple research groups worldwide have concentrated their efforts towards demonstrating large-area luminescent concentrators and the development of advanced luminescent materials for use in window-type concentrators suitable for deployment in built environments [
5,
6,
7,
8,
9]. A notable trend in the recently-reported works is the growing shift away from using organic photoluminescent dyes (which have been used traditionally in LSC devices for several decades) towards the more chemically- and photo-stable inorganic phosphors and quantum dots [
6,
7,
8,
10,
11,
12], which can significantly reduce re-absorption losses within luminescent media. These functional materials can be incorporated into planar concentrator structures by way of forming the phosphor particle-loaded planar luminescent interlayers [
10], or phosphor films [
12]. Whilst the functional materials remain at the cutting edge of luminescent concentrator research [
13,
14], other system design features such as spectrally-selective coatings, specialty glass types, solar-cell module type and configuration, and the glazing system architecture are receiving increased attention. Of notable importance is the recent development of a new float glass type possessing significantly reduced optical absorption in the near-infrared wavelength range (TIREX by AGC Europe, [
15]). We tested experimentally several concentrator devices built using this glass type and characterised the energy harvesting performance improvements in terms of standard metrics parameters applicable to LSC-type devices.
At present, transparent solar windows and multiple other types of semi-transparent building-integrated PV (BIPV), or building-applied PV (BAPV) energy-generating modules based on different technologies are starting to be mass-produced and deployed commercially worldwide [
16,
17,
18,
19]. The growing industry of net-zero energy buildings (NZEB, [
19,
20,
21]) construction benefits from the synergy of the on-site distributed energy generation provided by BIPV (or solar window) products, and the energy-saving functionality provided by the structure of advanced glazings containing transparent heat-regulating (low-emissivity) coatings [
22,
23,
24]. The development of energy-generating window products occurs in synergy with another area of active research dedicated to optimizing the ways in which the electric output can be extracted, stored, and utilized in distributed low- and medium-power installations [
25,
26,
27]. Often, advanced solar window designs themselves combine the energy generation capabilities with significant potential for reducing the lighting, heating, and cooling expenditures in buildings [
17,
28]. Excellent recent reviews and other articles (including [
4,
7,
8,
12,
13,
14]) dedicated to the current state of the field in semi-transparent luminescent concentrators of all types and solar window development present multiple datasets related to the system performance characteristics demonstrated to date.
Embedding large-area finely-structured elements (such as diffractive optical elements [
28,
29,
30], or light diffuser films [
31]) into the glazing system of solar PV windows is a proven and fruitful approach to maximizing their energy harvesting performance. In order to maximize the number of potential industrial applications of these solar windows, of particular importance are the technologies suitable for mass-fabrication of custom-designed large-area diffractive deflectors (or diffusers), and the balance between their energy-harvesting performance and visible-range transparency. Since our original report on embedding multiple small-area transparent diffraction gratings produced by lift-off photolithography into various solar windows [
28], several alternative (and more cost-effective) technical approaches to the manufacture of microstructured diffractive elements have been trialed. We recently explored the energy-harvesting potential of transparent gratings produced by pattern replication processes based on soft lithography techniques [
32,
33,
34,
35]. In this paper, we report on the process details and the principal results achieved with diffraction-assisted glass-based solar concentrator windows, 200 mm × 200 mm in size, in the subsequent sections. The energy-collection performance of diffractive elements fabricated using different technological approaches is also discussed and compared with the energy harvesting results achieved in flat-glass solar concentrators using either the low-iron or specialty glass.
2. Energy Harvesting Potential of Diffractive Elements and Low-Absorption Specialty Glass Panels Embedded into the Structure of Solar Windows
Apart from the light trapping by the total internal reflection mechanism reliant on luminescence emissions, other possibilities exist for the coupling of a part of the incident solar energy flux into the “guided modes” which can propagate inside (and in-between) the glass panels of solar window glazings. One of the more standard ways of deflecting light rays into a number of angular directions involves the use of diffractive elements, which has been shown to improve the light collection efficiency in LSC-type concentrators, even in the case of highly transparent grating deflectors [
28,
29,
30]. During this study, we tested the suitability of semi-transparent, small-period diffraction gratings produced by soft-lithography replication process, for use in solar windows. The main differences with our previous study [
28] were related to testing, within this present work, of the suitability of small-periodicity (4 μm pitch) and relatively shallow-depth (near 0.5 μm) patterned-polymer gratings, which could be mass-replicated from master gratings initially fabricated on quartz (or glass) substrates by conventional photolithography and plasma-etching processes. Another advantage of small-periodicity diffraction gratings is related to their relatively large angular deflection (compared to ray deflection angles achievable in long-period gratings having feature sizes measured in tens of μm), even for the first-order diffracted beams. Small periodicity in grating deflectors implies invariably some visual distortions in the transmitted images (“rainbow effect”), which is why these deflector elements may be useful if installed only at around the near-perimeter areas of solar window glass panels. We also tested the potential of a specialty glass chemistry type (TIREX by AGC Europe) for improving the light collection efficiency in highly-transparent spectrally-selective concentrator windows, which favor multiple internal reflections of infrared (IR) light rays and require glass with very low absorption of light, particularly at wavelengths between 800–1300 nm.
2.1. Experiments Highlighting the Contribution of Diffractive Elements to Light Diffusion Inside Glass and Near-Edge Flux Concentration
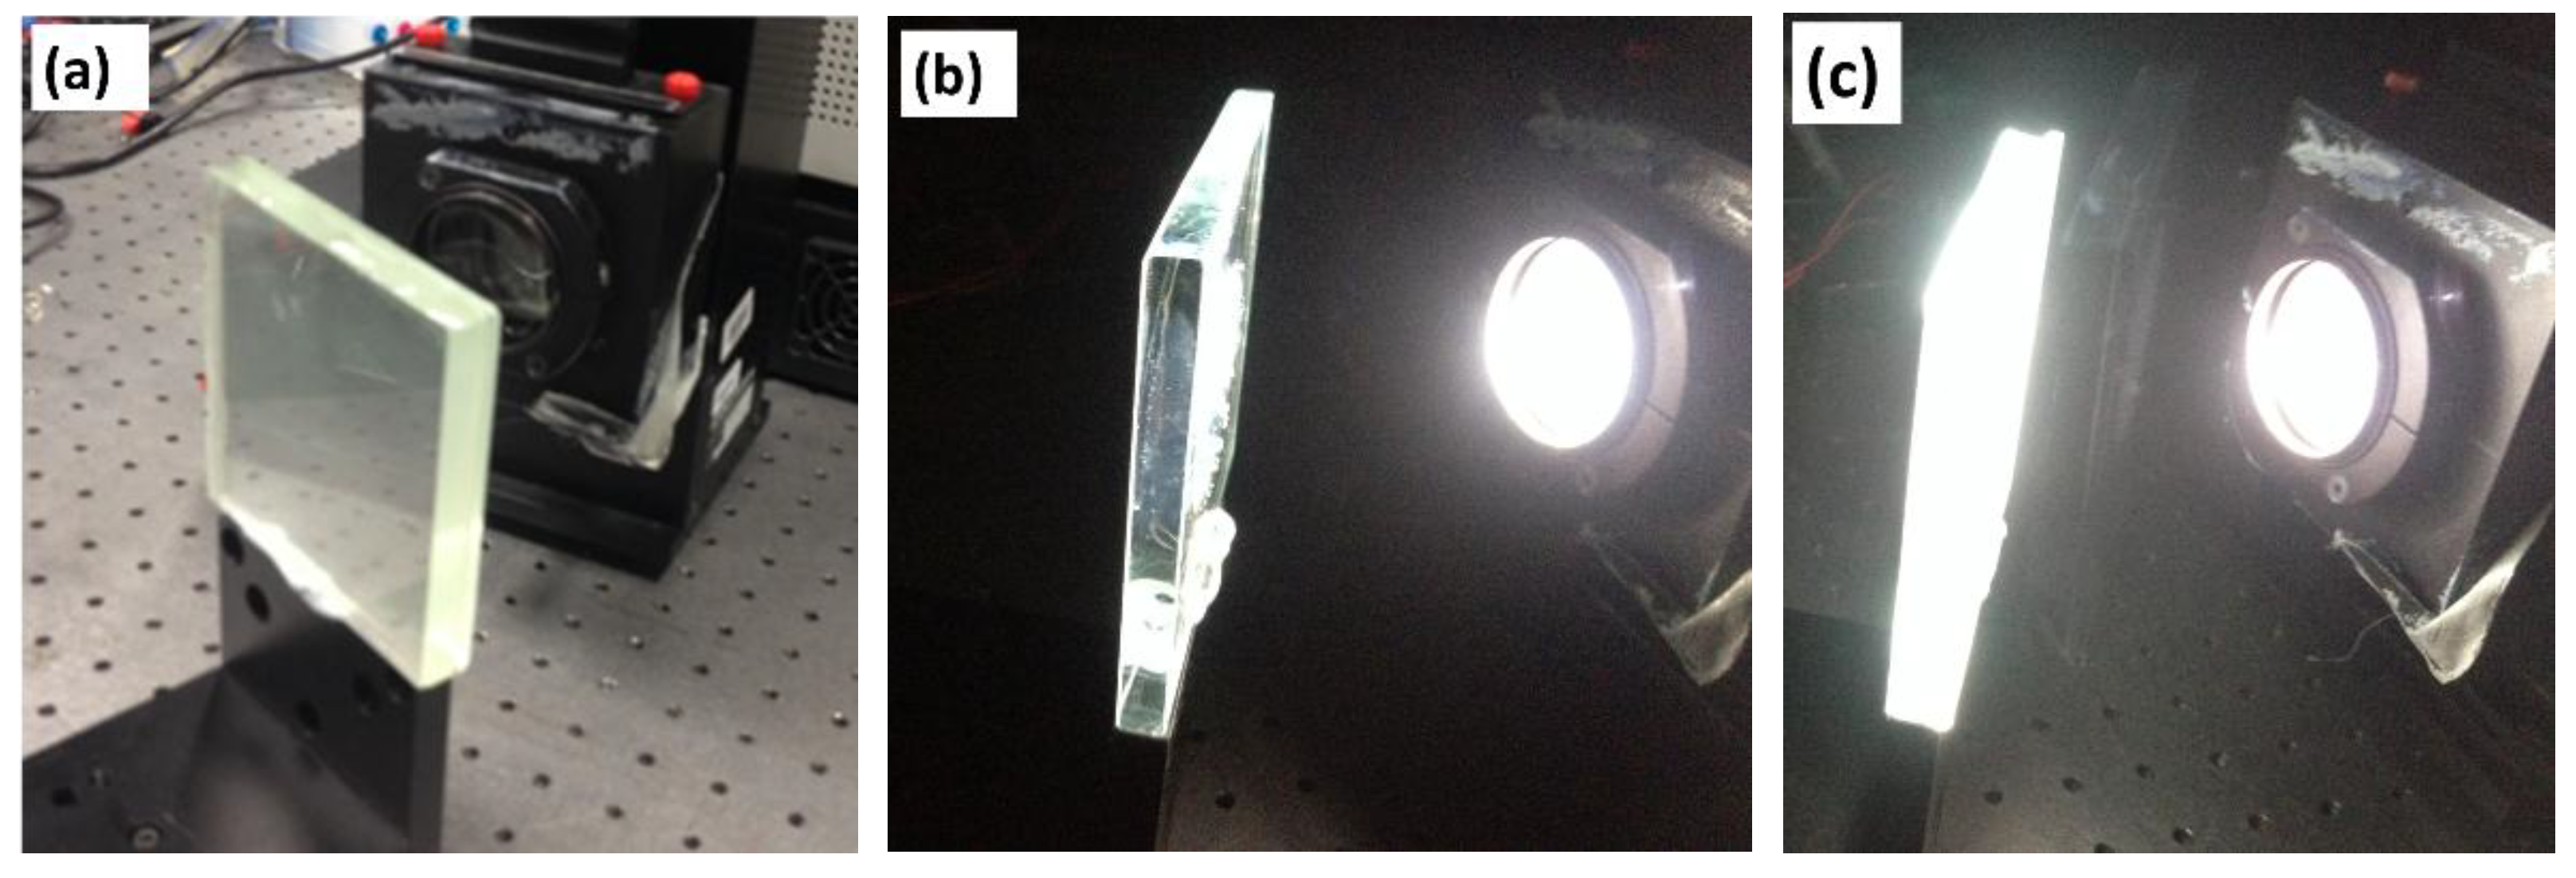
The potential usefulness of diffraction gratings for enabling the enhanced diffusion and spreading of light inside planar concentrator structures and for increasing the light intensity at sample edges can be demonstrated using a simple lab experiment with a solar simulator (
Figure 1).
The structured glass sample (
Figure 1c) contained a visible-range transparent 1D diffraction grating of period 20 μm, which generated almost no transmitted-image distortions or significant “rainbow effect” coloration. The grating structure was fabricated on a thin glass substrate by a photolithography-assisted lift-off process applied to a custom-designed optical thin-film coating. This patterned coating was designed to optimize the diffraction efficiency of the normally-incident UV-blue and also the near-IR light rays into its ±1st transmitted orders and also into higher odd-valued transmitted orders. The grating grooves were filled by a UV-curable clear optical epoxy interlayer containing inorganic luminescent particles (with their concentration being less than 0.1 wt.%) prior to attaching the grating plate to a 10 mm-thick low-iron glass plate identical to that shown in
Figure 1b. The interlayer thickness was (0.5 ± 0.1) mm, and the grating height was less than 1 μm. Despite the significant visible-range transparency of the epoxy-filled grating plate (near 80% diffraction efficiency for zero-order visible transmission) being ensured by its design features (described in [
28]), rather spectacular difference in the visual appearance (especially the edge-surface brightness) was revealed on illumination of both plates by a collimated 2’’ (5.08 cm) diameter beam from a solar simulator producing AM1.5G irradiation spectrum at 1000 W/m
2. The multiple scattering of the incident light by the luminophore particles located within or near the grating’s grooves, in conjunction with diffraction by the grating, has led to the formation of a bright halo of diffused light intensity inside the structured-glass sample. This led consequently to a partial trapping of the incident optical flux inside glass plate, and thus to the increased edge-area brightness. The irradiation flux intensities coming out of the edge areas of these two samples measured by DayStar, Inc. (Las Cruces, NM, USA) handheld solar irradiation intensity meter differed by almost one order of magnitude for near-normal beam incidence angles.
2.2. Energy Harvesting Performance of Flat-Glass Concentrators with and without Specialty Glass
Solar windows of the hybrid concentrator type (as distinct from semi-transparent solar cell panels) employ a range of internal light redistribution mechanisms such as luminescence, total internal reflections, optical coating-assisted reflections, scattering, and diffraction. These mechanisms are intended to redirect a part of the solar energy flux incident onto the glazing system towards solar cells, which are typically placed at or near the glass panel edges. Multiple reflections are usually needed to occur in sequence at either the various glass–air interfaces, or at the optical coatings, in order to propagate the incident photon flux towards solar cell surfaces. In this situation, regardless of the location or angle of incidence, the probability of photon collection by the solar cells depends strongly on the absorption of either the incident, or re-emitted photons within both the glass panel material and within any coatings. It has been known that the optical absorption of even the ultraclear types of most commercially available low-iron glass is not negligible at near-IR wavelengths near 1000 nm [
15]. This absorption reduces the direct transmission of glass plates (for normal incidence) by several percent already over the plate thicknesses near 10 mm. When occurring over the decimetre-scale internal path-lengths within the glass, these effects of near-IR absorption are therefore expected to lead to losing tens of percent of the optical power in the near-IR flux which would otherwise be reaching the edge-mounted solar cells. We tested the performance of glass-based concentrators of size 200 mm × 200 mm, in which either the conventional low-iron glass, or the specialized (TIREX) glass with low IR-range absorption was used in conjunction with a single luminophore-loaded interlayer and an IR-specific transparent heat-mirror coating. The TIREX glass had a five times lower optical absorption coefficient in the near-infrared range, compared to the best of the extra-clear low-iron float glass types, due to its special chemical composition [
15].
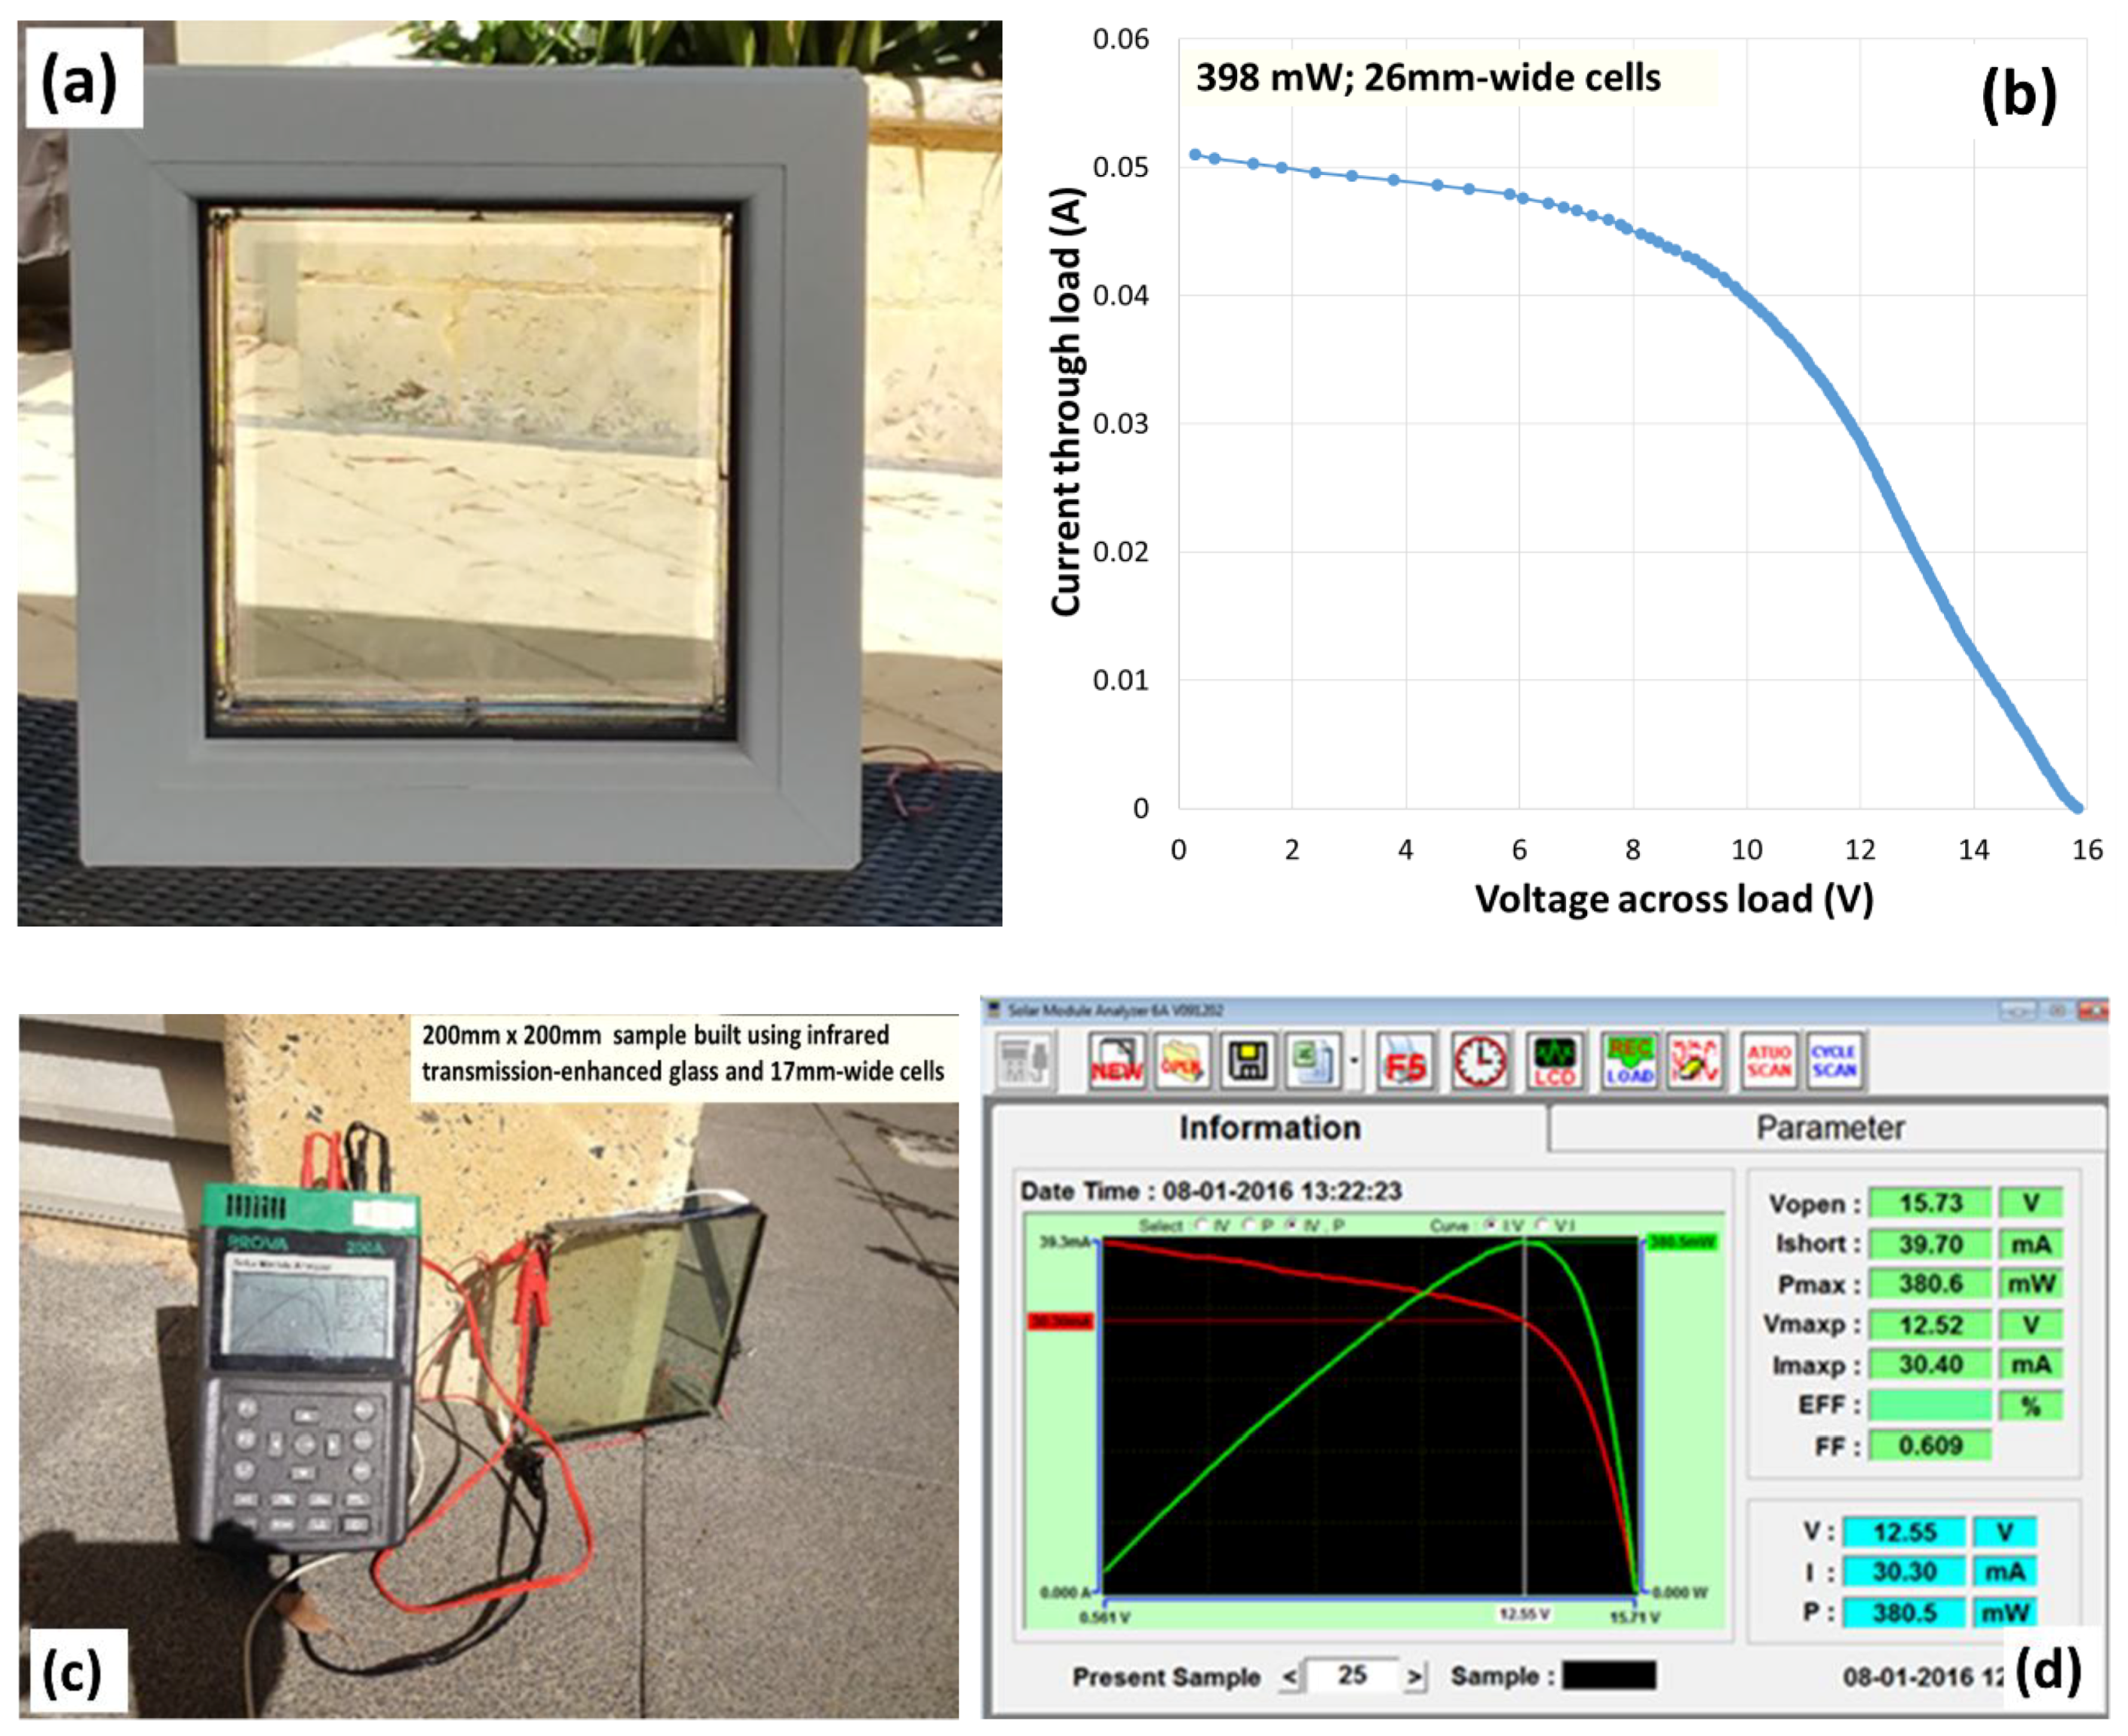
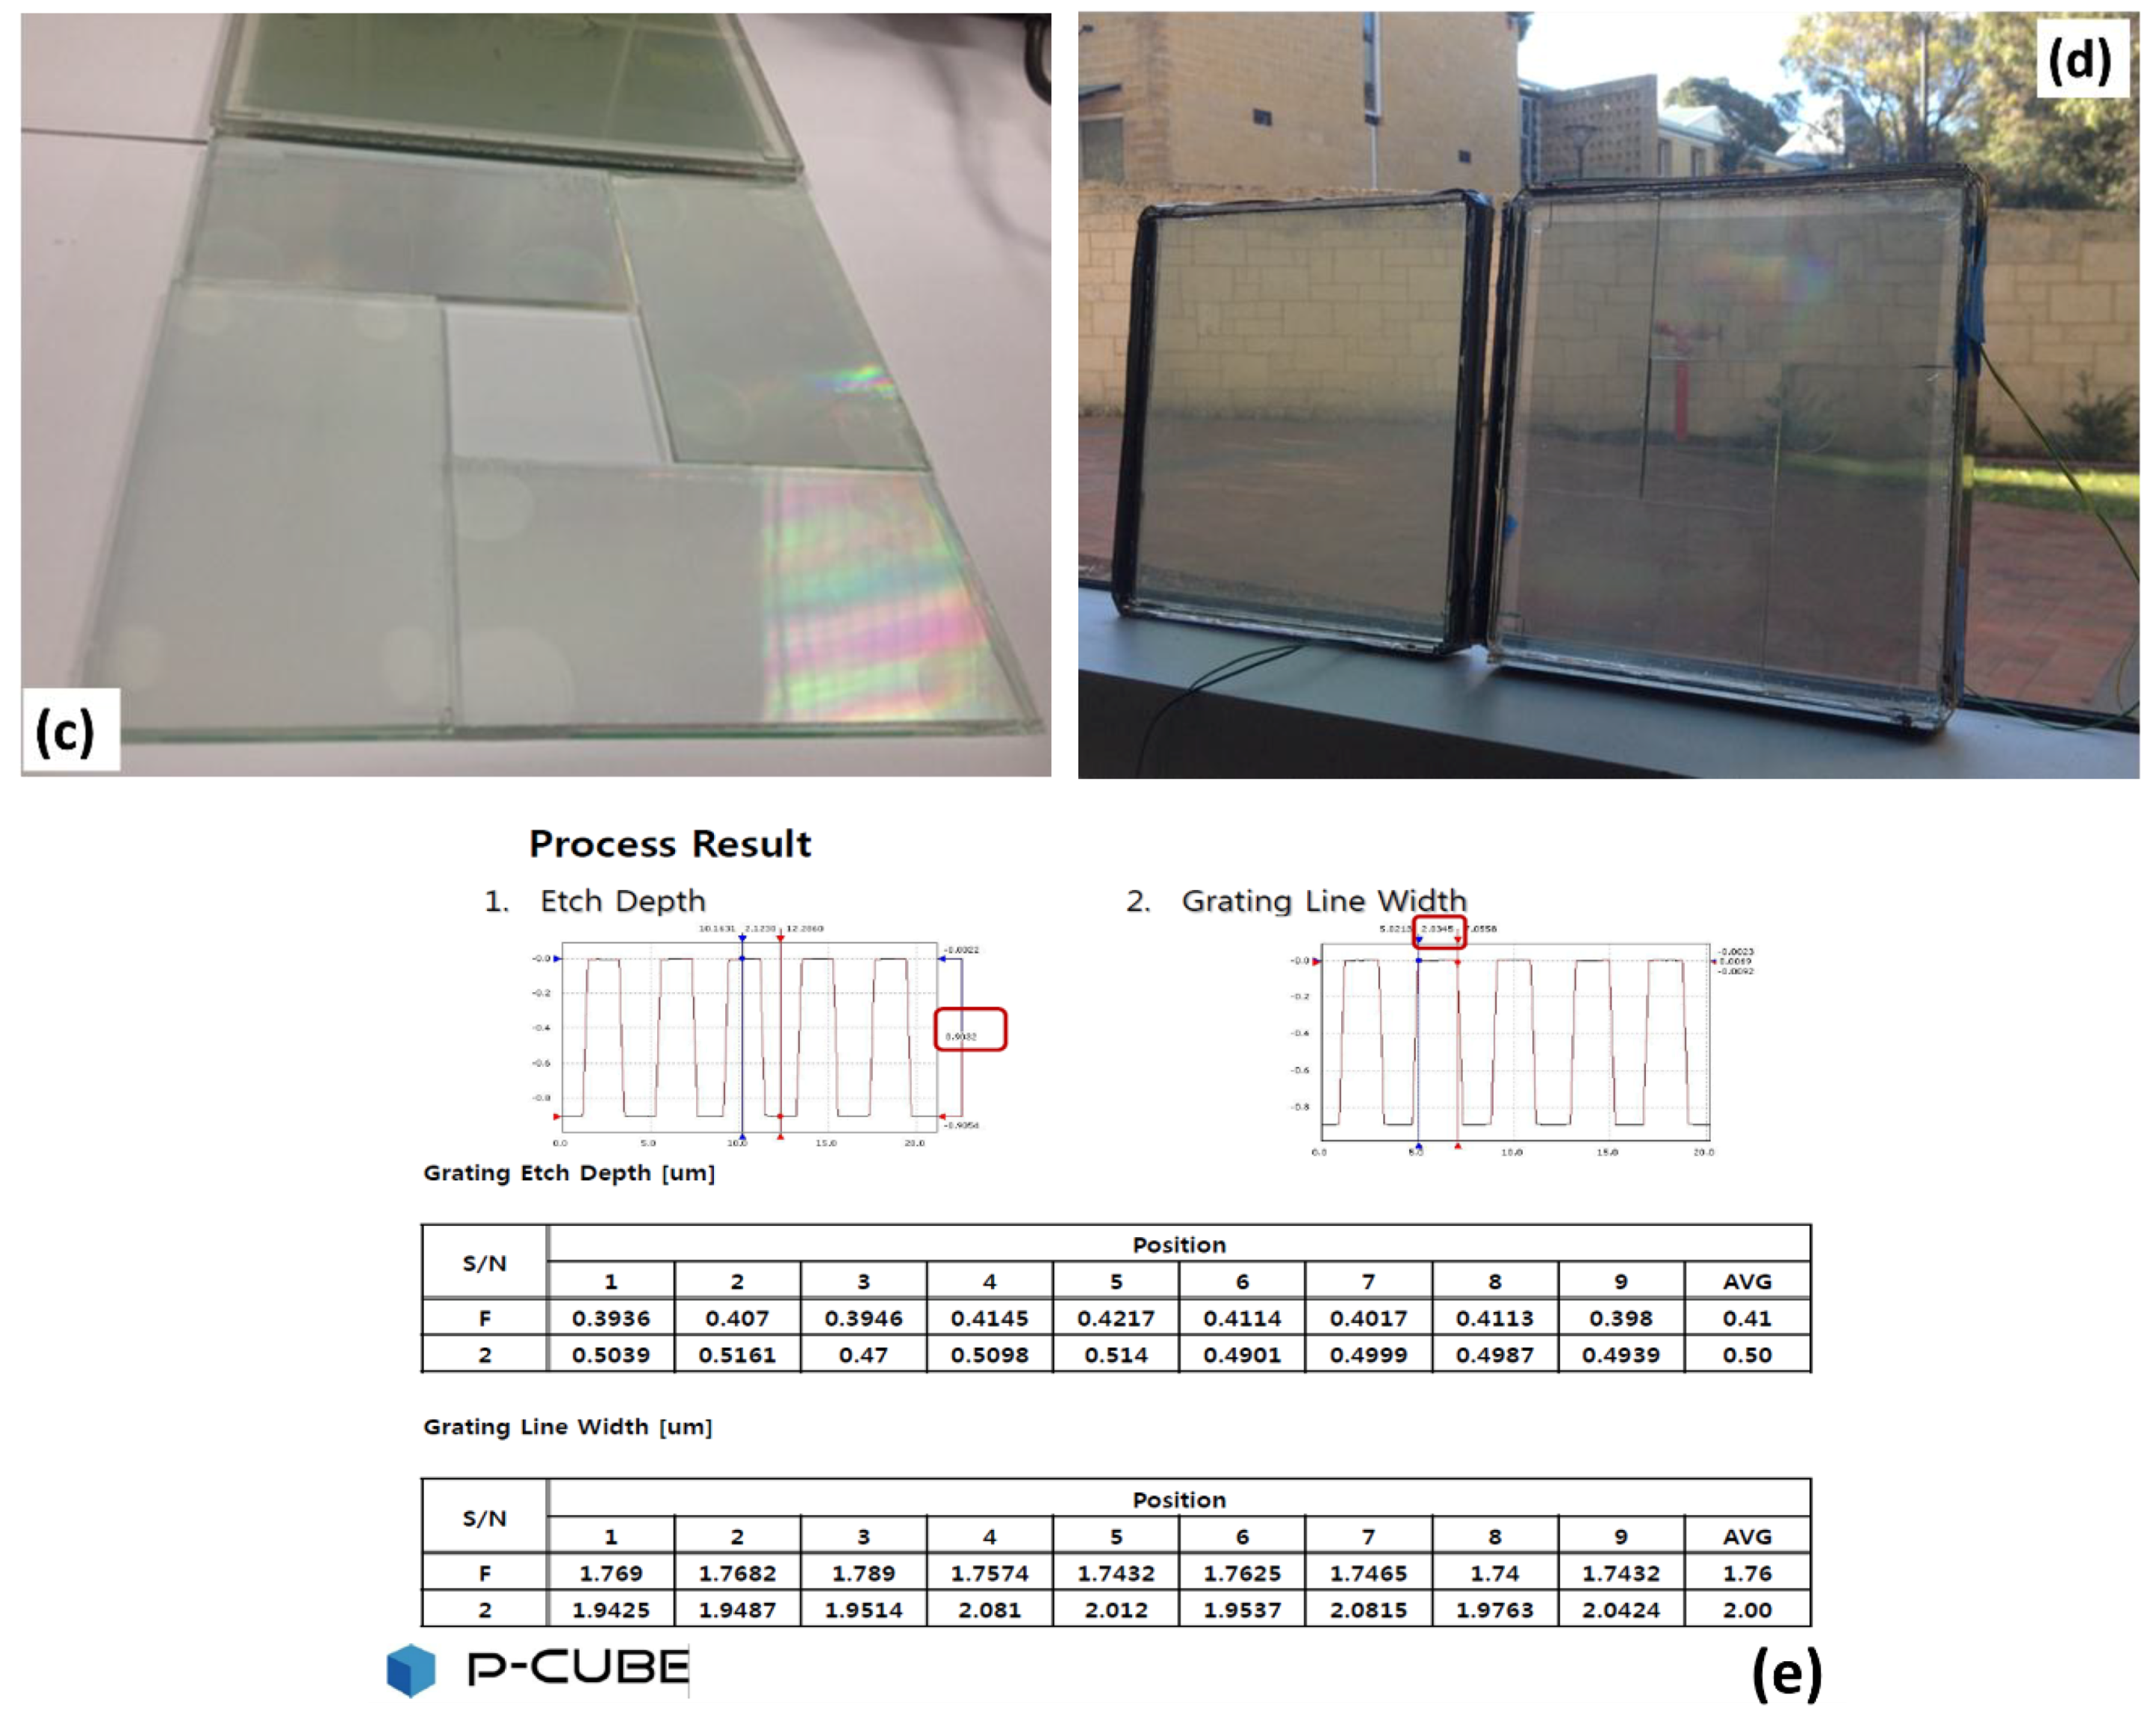
Two concentrator-type solar windows of identical glass areas have been constructed and tested to reveal the performance differences dependent on the glass type. The samples and their typical PV performance characteristics measured in outdoor conditions are shown in
Figure 2. One of the window samples (
Figure 2a) used two low-iron glass plates of total thickness 16 mm (a 10-mm plate connected through an epoxy interlayer to a 6mm plate coated by VNE 2463 low-emissivity spectrally-selective coating by Viracon Inc., Owatonna, MN, USA) and (26 ± 0.5) mm × 198 mm PV module cut-outs from the active circuit of Avancis PowerMax 3.5 130 CuInSe
2 panel product (Avancis Inc, Torgau, Germany). This solar window was placed into a standard commercial plastic framing system, which has not affected its energy-harvesting performance measurably. The second solar window sample used three 4mm-thick TIREX glass plates of size 200 mm × 200 mm, two of which were connected by a luminophore-loaded epoxy interlayer identical to that of the first window, and the other 0.5mm-thick interlayer contained only clear UV-cured epoxy. One of TIREX glass plates was coated by a low-emissivity spectrally-selective coating of our design [
10], the transmission and reflection spectra of which were almost identical to the coating used in the framed sample. The PV modules installed at the edges were cut-outs from the active circuit of Avancis PowerMax 3.5 140 CuInSe
2 panel product, of dimensions (17 ± 0.5) mm × 198 mm, and had a marginally higher nominal module efficiency compared to the PV modules used in the framed sample (13.3% vs 12.2%).
Both solar windows were tested several times in similar outdoor conditions when placed into the vertical sun-facing position, at solar irradiation flux conditions not exceeding 1000 W/m
2, and measured at the stabilized solar cell surface temperatures of above 40 °C. The summary of characterization results and the measured data are also presented in
Figure 2.
Interestingly, despite a significant difference in the width of the active PV modules installed into these solar-window samples (the total active areas of cells varying by over 50%), only a marginal difference (of less than 5%) was seen in their electric power output. It is also of notable importance that the sample built from low-absorption glass demonstrated a combined module fill factor (FF) of 0.609, which was significantly higher than that measured in the framed sample (0.489). Both windows used parallel electric connections between all four PV modules followed by a series-connected blocking diode each. The higher module FF suggests obtaining smaller electric mismatch loss caused by the open-circuit voltage (Voc) differences between the different PV modules receiving different amounts of light. These results highlight the role of low-absorption glass in the energy collection process, and have later been re-confirmed in larger-area solar window samples using TIREX glass instead of conventional low-iron glass. Another notable feature of concentrator windows built using low-absorption glass is the broader angular orientation range in which the windows generate their near-peak power, which will be reported in more quantitative detail elsewhere. The visible-range transmission of TIREX glass plates is slightly below that measured in most low-iron extra-clear glass types of identical thickness, however, due to the spectral selectivity of the coatings and luminophores targeting the preferential capture of near-IR light, this does not hinder the energy collection performance.
3. Materials and Technologies Used for the Cost-Effective Manufacture of Large-Area Semitransparent Diffractive Elements and Solar Concentrator Panels
The transparent (or semitransparent) diffractive elements contribute to the efficiency of concentrator-type solar windows by way of providing an increased probability of photon trapping and ray re-direction without adding absorption and quantum yield-related losses. The principal design features of diffraction gratings that define their potential usefulness for randomising the light-ray propagation directions (and thus keeping a fraction of propagating light energy inside the glazing system and outside the “escape cone” directions) are their periodicity and depth. In the case of gratings grown on (or applied to), any glass-substrate surfaces, for example, the gratings formed by laser-patterned optical coatings, or fabricated as lift-off lithography-patterned coatings, the optical properties of the grating material itself are of high importance and also define the functionality of the solar concentrator. Glass panel surfaces can themselves be subjected to microlithography patterning and plasma etching processes to form diffractive elements using the glass–air interfaces, or (generally in the case of patterned-coating grating formation process) the grooves of diffraction gratings can be filled with any suitable transparent optical epoxy with or without added phosphor particles or luminescent dyes. The main objective of the semi-transparent diffractive element design (for use of these components in LSC-type devices) is to achieve the maximum possible angular deflection of the incident rays to be harvested, for a large range of possible incidence angles, which necessitates minimization of the grating period and (if high transparency within any particular spectral range is required) achieving a good degree of control over the grating depth and pattern quality. Experimental techniques such as photolithography (followed by either etching or lift-off processes) are adequate for the development of proof-of-concept structures, yet are not cost-efficient for the mass production of large-area grating structures. Patterning optical coatings using laser engraver-type systems is a practical way of forming large-area diffractive elements, however the minimum feature size (and periodicity) are limited (to about 20 μm) by factors such as the focus spot size, graphics image-pattern rendering, and mechanical translation-stage resolution.
Soft lithography approaches can provide significant cost reductions for the manufacturers of large solar window devices using diffractive elements of small feature size. This is because replicated “master grating” produced by soft lithography process can be used as a single template for multiple replications with high reproducibility [
32,
33,
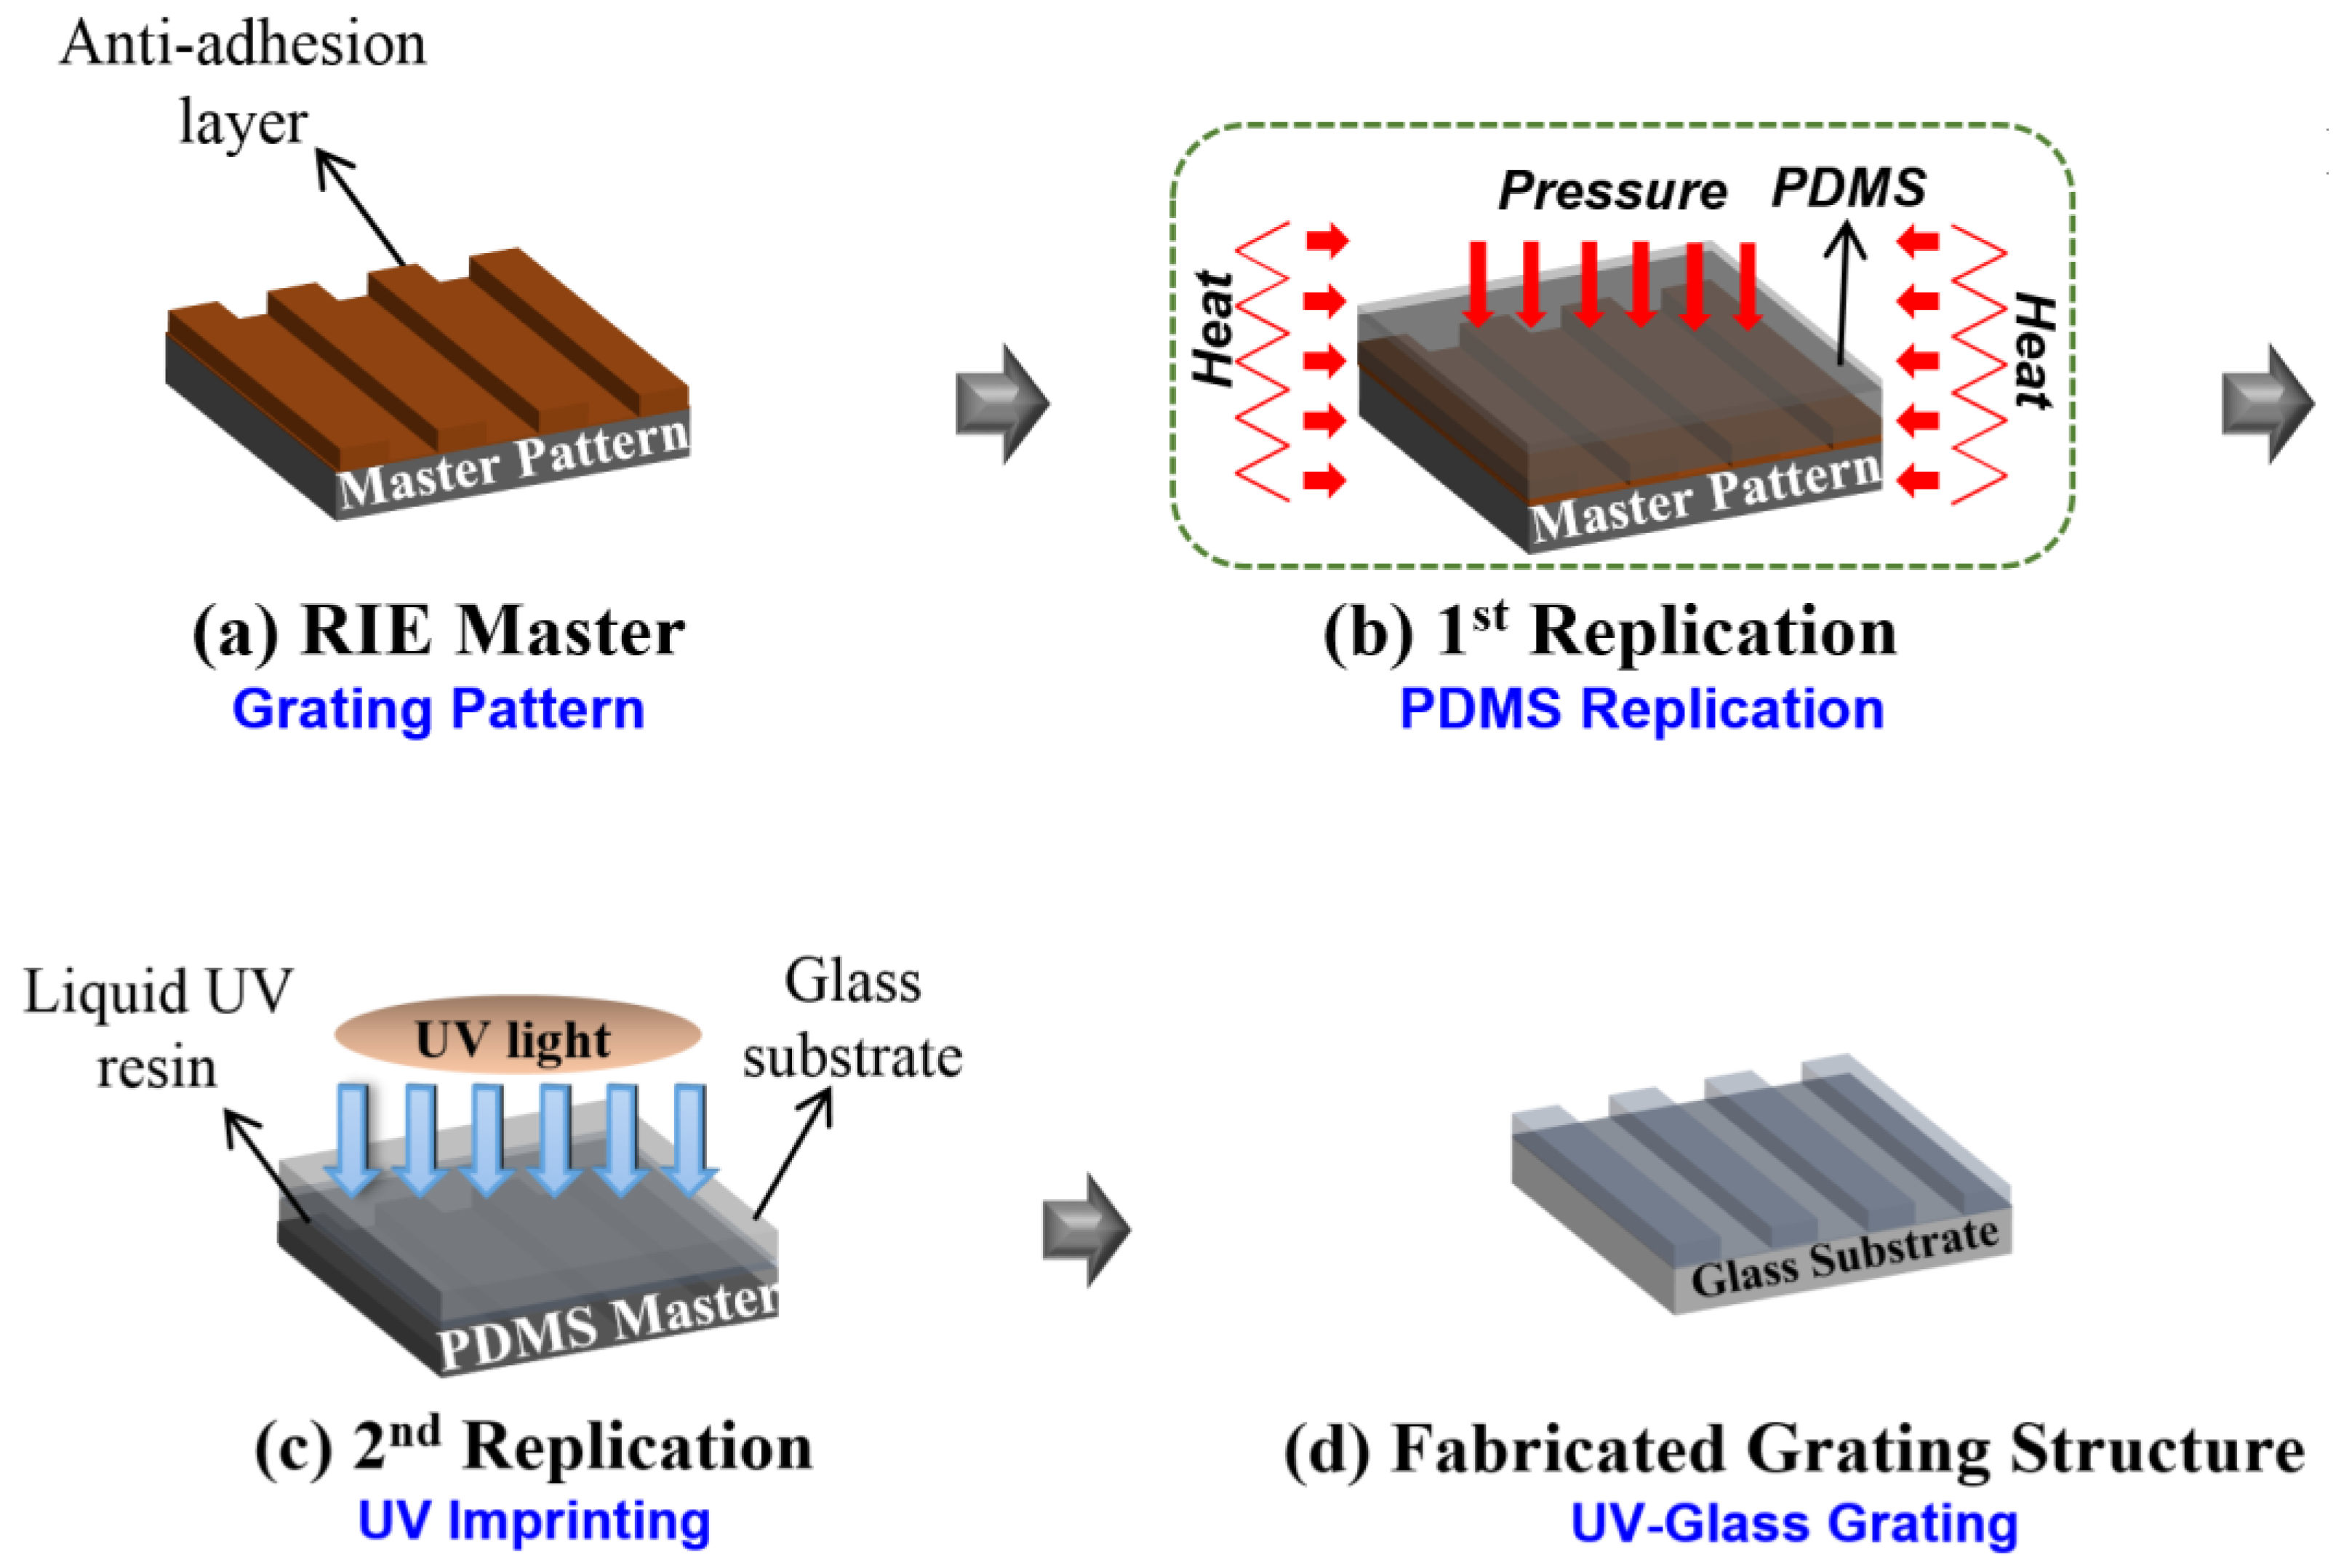
34]. The photolithography and etching techniques can provide excellent reproducibility of patterns, however, the fabrication processes have not been commercially viable in the past, especially for large-scale applications. In this study, large-area diffraction grating patterns on glass substrates were fabricated by employing a double replication process, as shown in
Figure 3. A quartz master grating of periodicity 4 μm, groove depth near 0.5 μm, and 50% duty cycle fabricated by photolithography and reactive-ion etching process, was dipped in the 2% dimethyldichlorosilane dissolved in octamethylcyclooctasilane (Repel-Silane ES, GE Healthcare Co., Ltd., Chicago, IL, USA) to apply a self-assembled monolayer as an anti-adhesion layer [
35,
36,
37]. First, a replicated polydimethylsiloxane (PDMS) master template with master grating’s structures were obtained from the quartz master by utilizing the soft lithography process [
35,
36], using a Sylgard 184 base and curing agent mixture (Dow Corning, Midland, Michigan) with 10:1 weight ratio, poured onto the master grating and cured at room temperature. In the second replication step, a UV-replication process similar to the soft-lithography step was conducted on the 130 mm × 70 mm × 3 mm low-iron glass substrates using the PDMS master template, and a UV-replicated grating pattern was formed within the cured optical epoxy layer on the glass substrate (
Figure 3c,d). This was done by placing an uncured UV-curable acrylic epoxy layer (WTS-80203, Wan Ta Shing Ltd., Hong Kong, China) between the glass substrate and PDMS master template.
Figure 3 shows the details of the complete process sequence we have developed [
35] for the mass-replication of large-area diffraction gratings inside soft polymer layers on glass substrates.
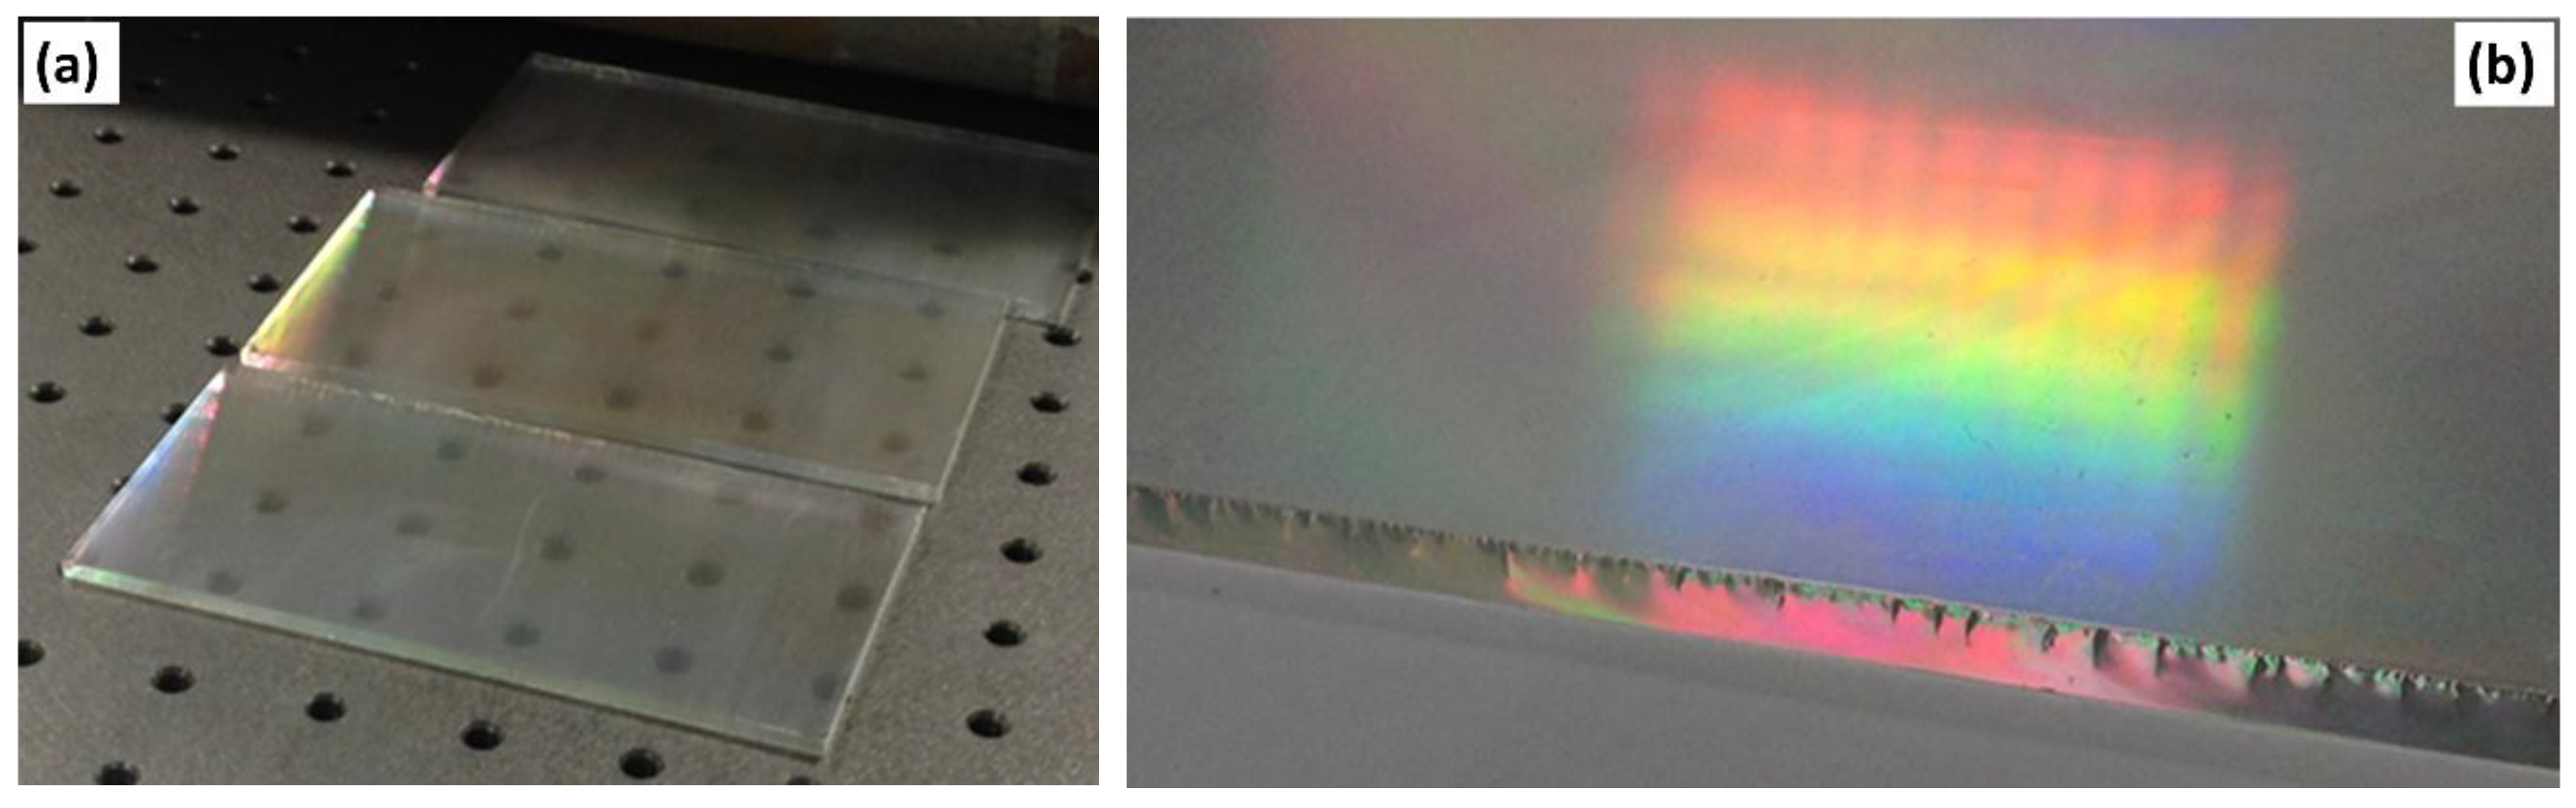
A set of four 130 mm × 70 mm diffraction gratings formed by a replicated pattern generated inside a layer of UV-curable acrylic epoxy on 3 mm-thick low-iron glass substrates were used to embed around the perimeter of solar concentrator panel. The fabricated grating patterns faced the air inside an embedded air-gap positioned just behind the front-facing glass panel (200 mm × 200 mm, TIREX).
Figure 4 shows the diffractive elements fabricated, their visual appearance with some light concentration effects observed visually at the glass edge regions, the placement of gratings around the perimeter of front-side glass panel, and the characterisation details (line width/height measurements) of the master-grating. The linear features (grooves) of gratings were arranged to run along the long sides of all substrates. The master grating of periodicity 4 μm, groove depth near 0.5 μm, and 50% duty cycle has been fabricated be a plasma-etching process on a 200 mm × 200 mm × 1 mm quartz substrate by P-Cube Ltd (Seoul, Korea). The master-grating characterization dataset obtained by optical profilometry measurements has been supplied by the manufacturer.
The solar concentrator glass-panel sample was assembled using UV-curable optical epoxy, using small 1mm-thin glass adaptor plates of about 4mm × 4mm size cut out from microscope slide glass, to form a 1mm-thick air-gap between the grating surfaces and the rest of glazing system. The latter was composed of a 6mm-thick low-iron glass plate coated by a Viracon VNE 2463 low-emissivity IR-reflector coating laminated using specialized 0.76 mm-thick luminophore-loaded polyvinylbutyral (PVB) sheet to a 4mm-thick TIREX glass plate. The PVB interlayer material contained the luminescent material powders distributed inside the polymer, with the same luminophore particles chemistry and concentrations as used in the interlayer of framed 200 mm × 200 mm sample of
Figure 2a. Four strip-shaped CuInSe
2 solar-cell modules of dimensions 198 mm × 18 mm were attached to glass panel edges using clear acrylic adhesive tapes of thickness 1 mm. The solar-module strips were produced using a proprietary process which involved cutting, connectorization, and encapsulation of Avancis PowerMax3.5 140 active PV circuits. The encapsulation of PV strips was done using a thin layer of clear UV-curable epoxy and 1.1mm-thick low-iron cover-glass plates. All PV modules were connected in parallel electrically, with each being series-connected to a Schottky blocking diode. The technical reasons for selecting CuInSe
2 over other PV module types (eg Si) for use in this application area have been discussed in some detail in [
17].
4. Custom-Shaped CuInSe2 Modules and PV Performance of Individual Encapsulated Solar-Cell Strips
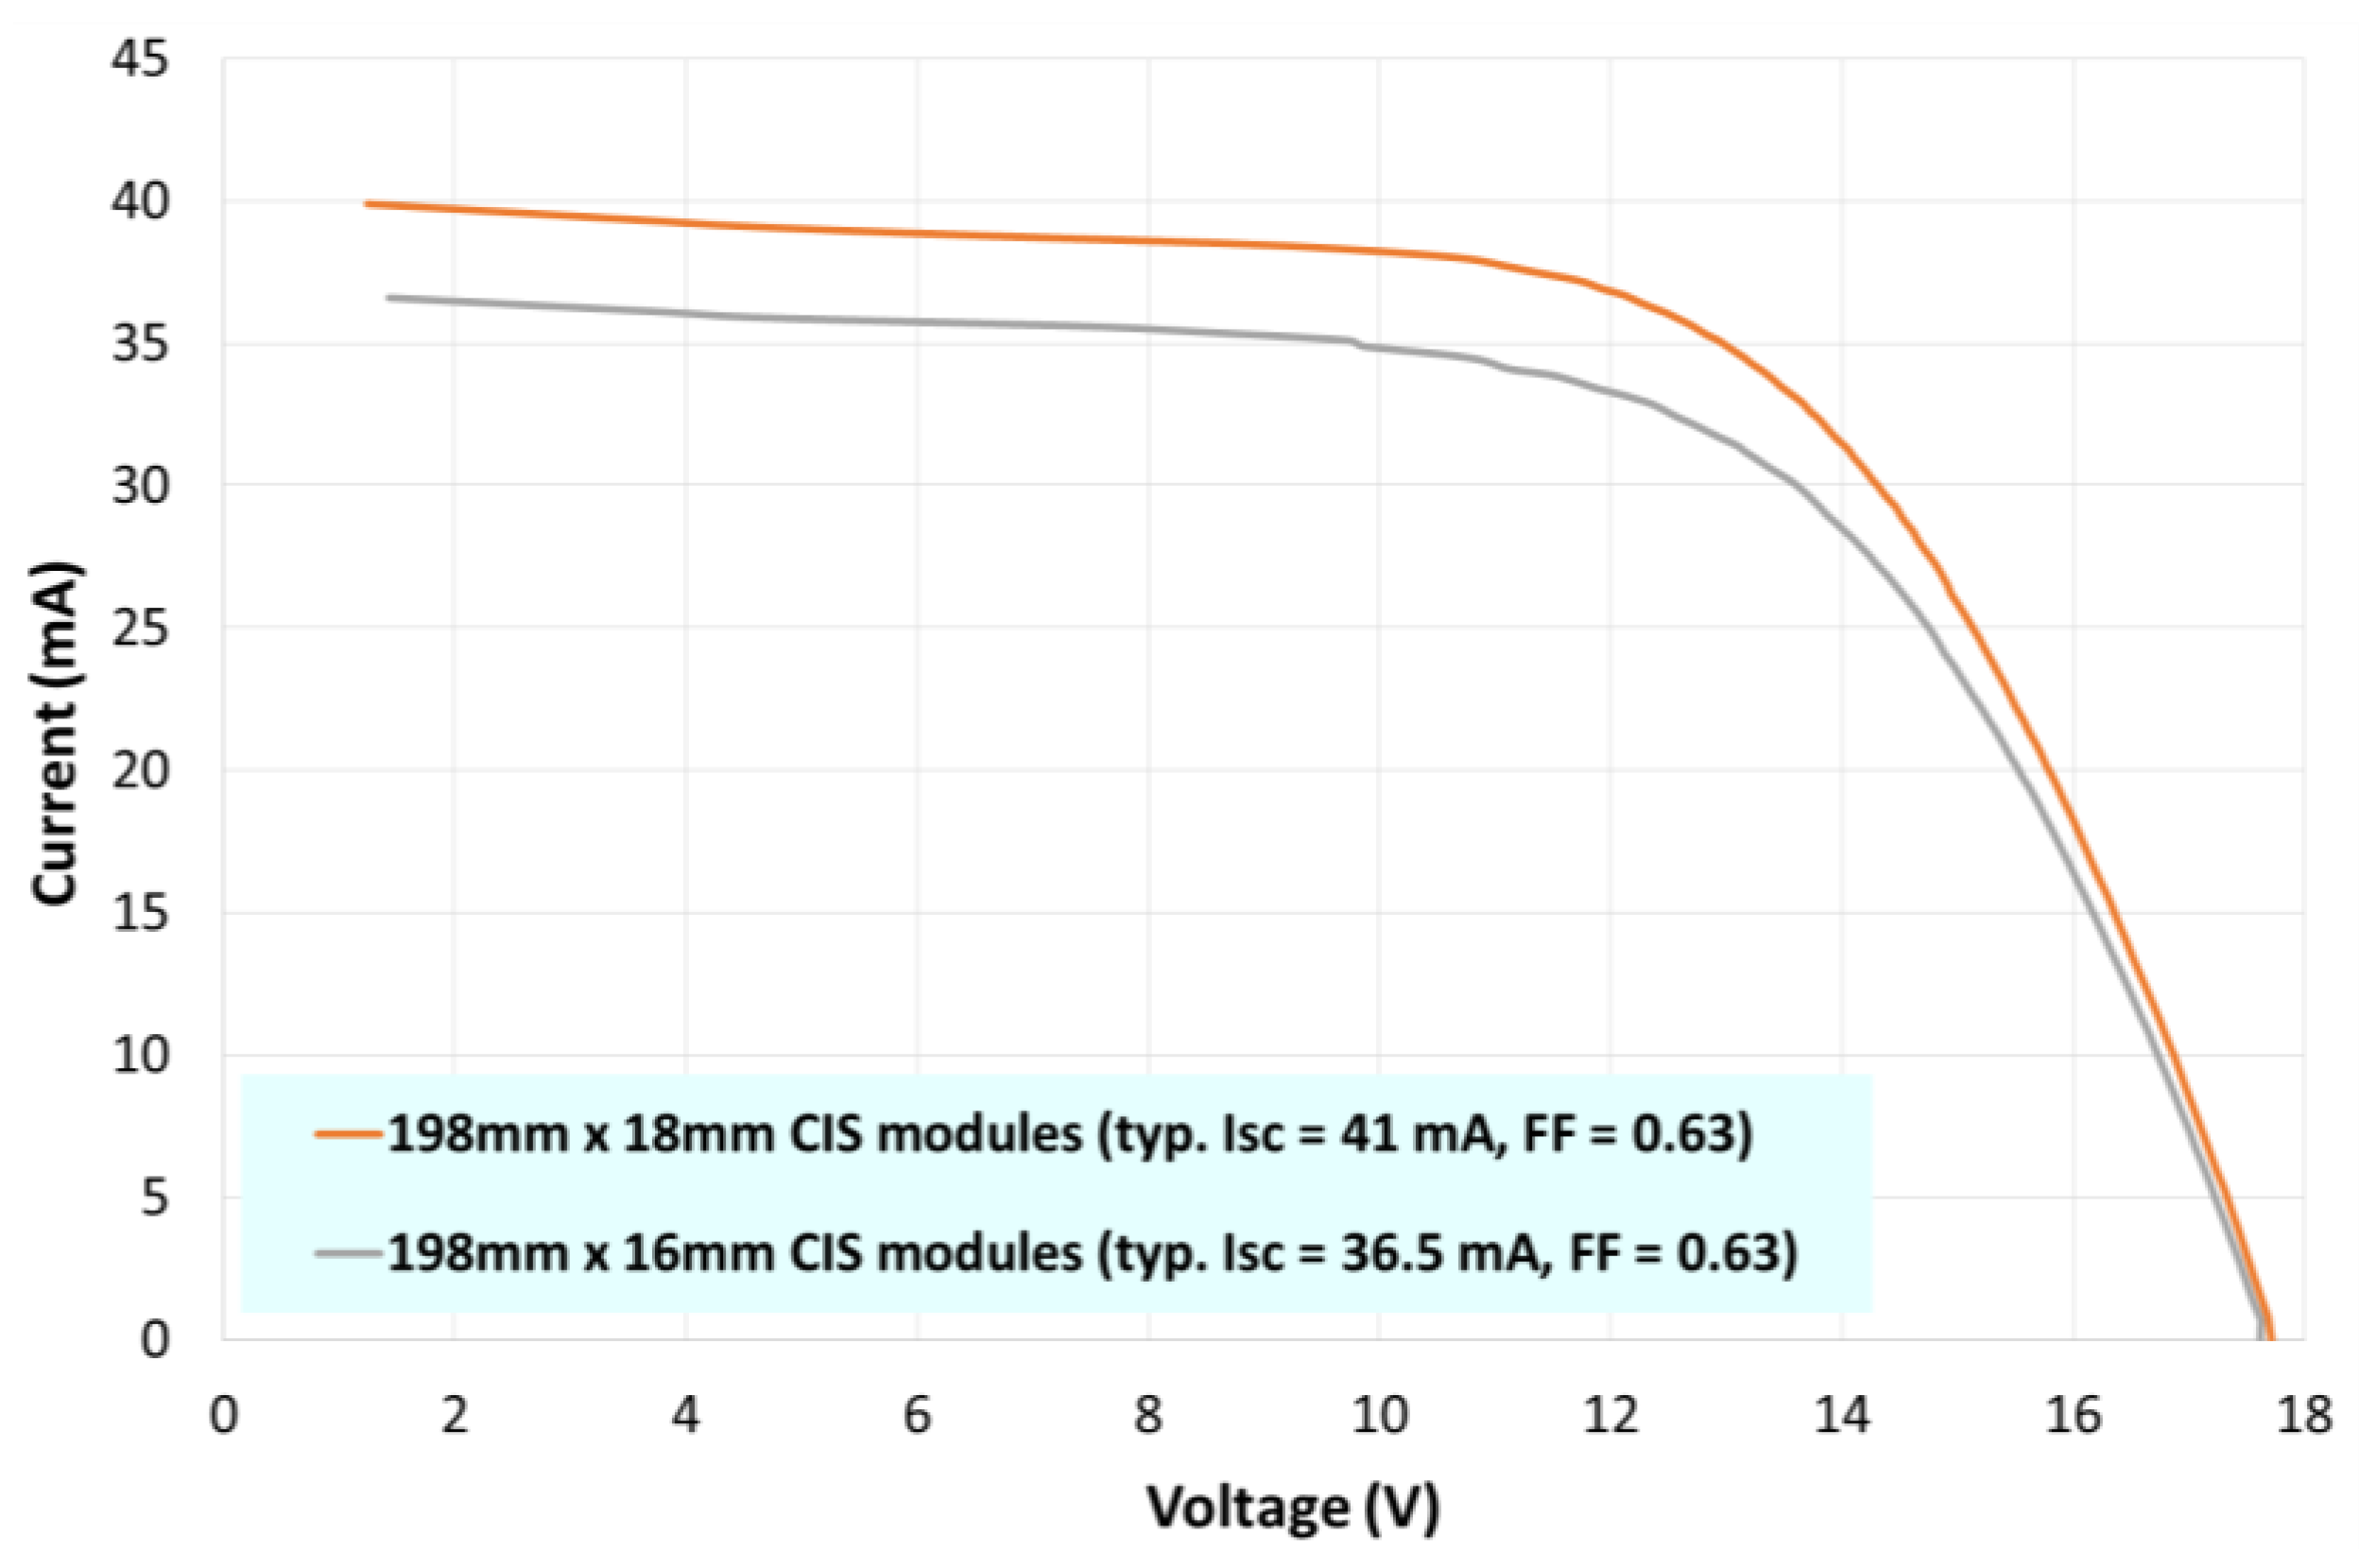
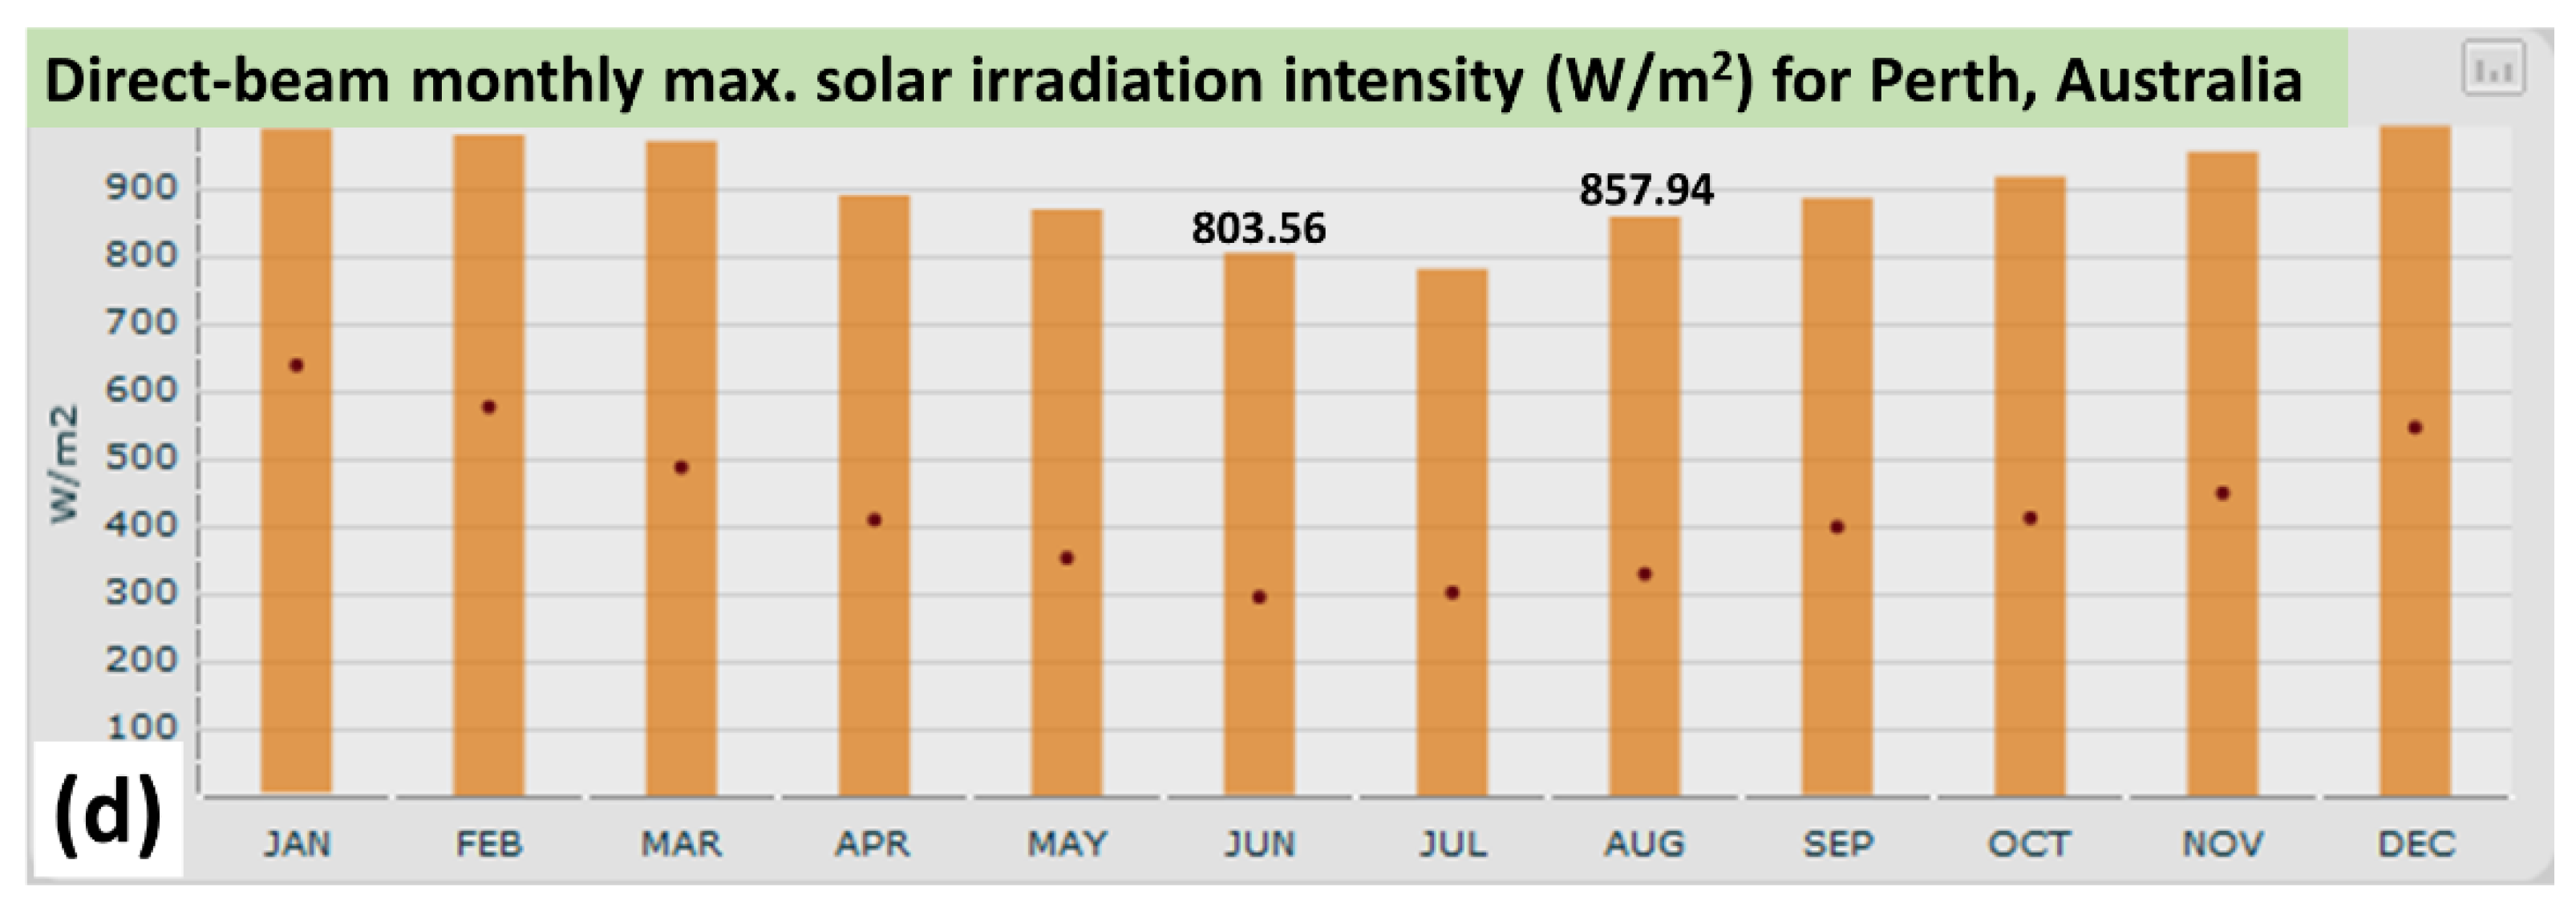
The electric output performance of the strip-shaped encapsulated PV modules of sizes 198 mm × 16 mm and also 198 mm × 18 mm was characterized in outdoor illumination conditions on May 8th, 2018 at noon. The total (sum of the direct-beam and diffused) solar irradiation intensity was at less than 1000 W/m
2; the weather conditions corresponded to a typical warm (~22 °C) sunny autumn day in Perth, Western Australia. According to the climate-related solar-irradiation datasets recorded for this location and taken from COMFEN 5 software [
38] distributed by Lawrence Berkeley National Laboratory (LBNL, Berkeley, CA, USA), the mean highest monthly direct-beam irradiation intensity during May is near 869 W/m
2, which, accounting for the typical additional 10% from the diffused irradiation intensity, would result in the total maximum irradiation intensity figure of near 956 W/m
2. A portable PROVA 200 A solar module analyzer was used to record the I-V curve datasets of peak-oriented PV modules, after allowing the cell surface temperatures to stabilize at near 30 °C. The measured I-V characterization datasets and electric output parameters of these PV strips are shown in
Figure 5.
The differences in the widths of two different module types (16 mm and 18 mm) corresponded to about 12.5% active-area difference, which resulted in the corresponding difference (of near 12.3%) in the measured short-circuit currents (Isc), and the maximum power output. The open-circuit voltages (Voc) were at near 17.66 V for all strips, and their fill factors (FF) ranged between 0.63–0.635.
The lower-limits of the power conversion efficiency (PCE) in these custom-shaped PV strips can be evaluated using their active area, the measured electric power outputs (31.68 cm2 strips generated 411.2 mW and 35.64 cm2 strips generated 453.9 mW), and a 1000 W/m2 figure for the maximum total irradiation intensity. These calculations result in the average PCE (lower-limit estimate) of about 12.85%, which is close to the nominal module efficiency of 13.3% specified for the original PV product (uncut Avancis circuits). Accounting for the effects of cell surface temperature, these data suggest that no noticeable efficiency reductions have occurred due to a combination of processes involving cutting the cells and substrates, making the soldered electrical connections, handling and encapsulating the custom-shaped PV modules.
5. Energy Harvesting Performance of Solar Concentrator Panels of Different Design Types Measured in Outdoor Experiments
In order to evaluate the contributions of the various concentrator design features to their practical energy harvesting potential in solar window application, we characterized the electric output parameters of five samples of different structure in outdoor experiments. All concentrators had an identical energy collection (glass panel) area, but the active areas of solar cells differed slightly, as well as the glass panel structure and thicknesses. The luminescent material combinations and luminophore particle concentrations distributed inside either the epoxy- or the PVB-based lamination interlayers were identical. Inorganic luminescent materials used to down-convert the UV-blue and also some of the near-infrared light into near-IR emissions whilst partially diffusing the incident flux inside the glazing systems have been described in detail in [
10,
17,
28]. The infrared-reflecting high-transparency low-emissivity coatings were also placed into principally-equivalent locations within all panel structures, at the internal (interlayer-facing) surfaces of the last glass-plate element used within each panel, in order to protect the coatings. The structure-related and component property-related technical details and data relevant to each of the samples tested are summarized in
Table 1.
To evaluate the structure-related relative performance differences between the differently-constructed solar windows in the application environment for which these systems were originally intended (distributed generation of electric energy in buildings, especially for larger-area up-scaled systems, such as curtain walls), we focussed on making outdoor characterization experiments, in which the solar-cell surface temperature and real sunlight irradiation intensity are also important factors. Testing the different systems “side by side” (after stabilizing the solar-cell temperatures) provides a valuable source of data on their relative performance, even regardless of the seasonal weather-related irradiation intensity variations, if periods of stable cloud-free illumination are used. The vertically-positioned sun-facing orientation of glass panels was also selected for making the principal data and metrics comparisons, to highlight the energy-harvesting differences expected to be observed in the most typical of future practical application settings. Some measurements were also made with horizontally-placed samples, to provide another useful performance reference characterizing the ability of systems to collect solar energy from a range of flux incidence configurations. To prevent any long-term PV module (or sample) contamination, or efficiency degradation effects biasing the comparison measurements, the characterization data collected in earlier years from the older samples (A and D; the data published previously in [
28]) were used throughout this article.
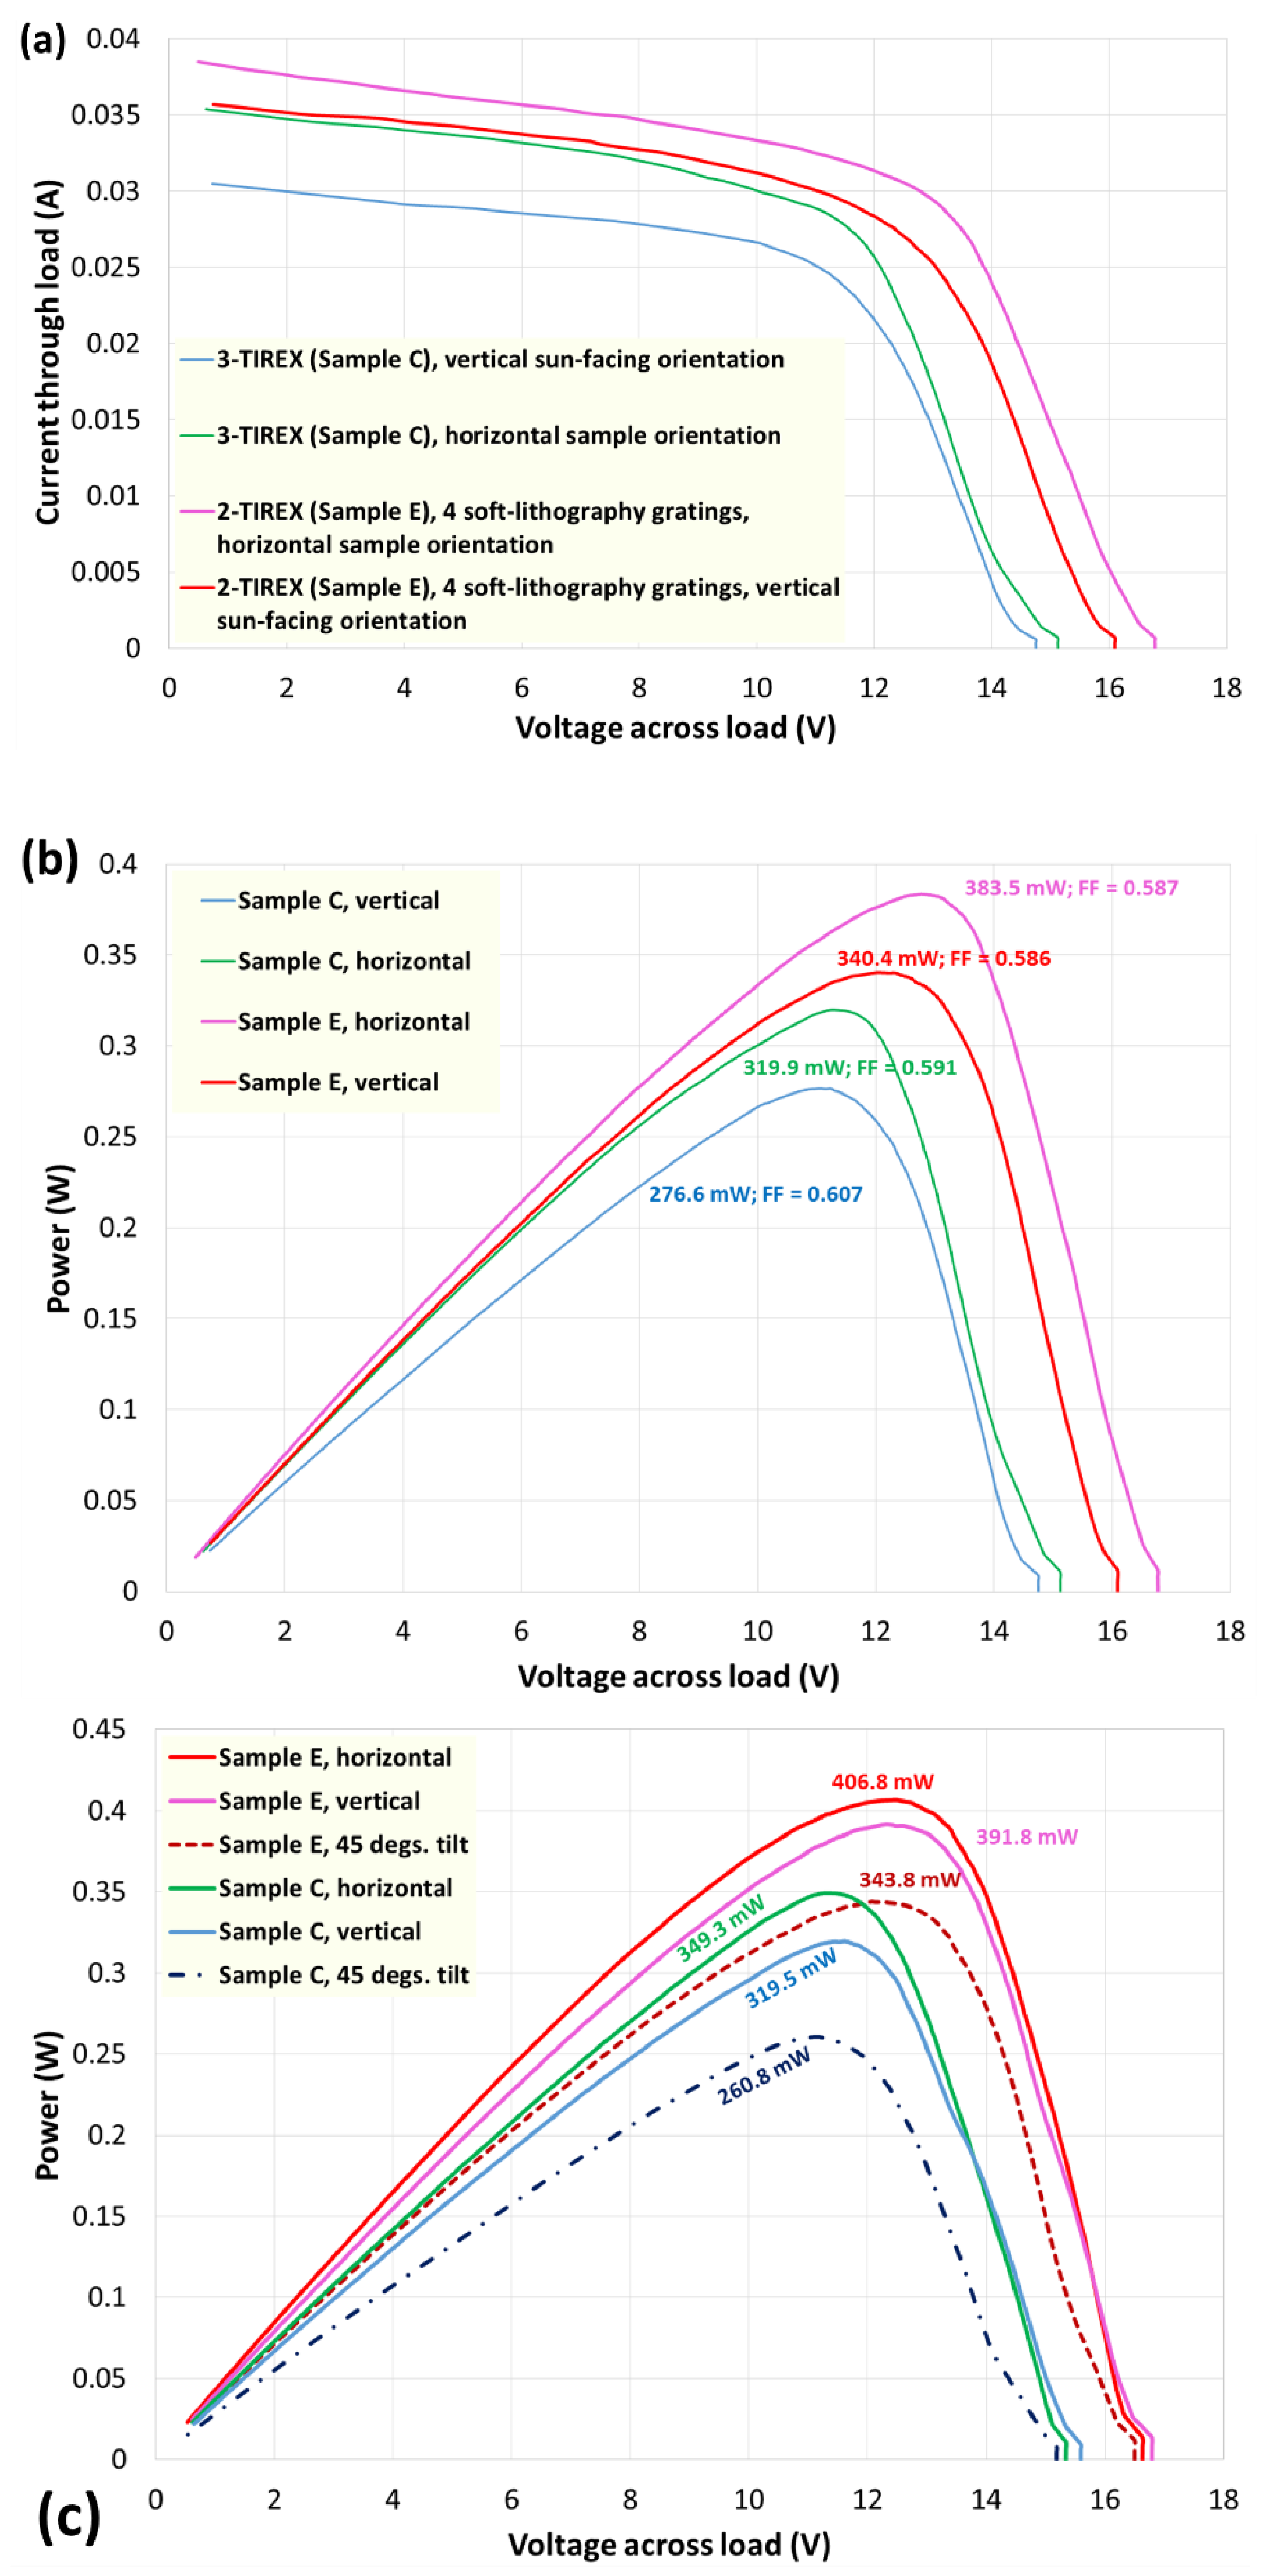
Figure 6 summarizes the winter-season energy-harvesting performance differences measured in recently-constructed samples C and E (positioned either vertically, or horizontally, or tilted 45° backwards from vertical), on two different dates (in mid-June and July 31st, 2018).
The measurements used to generate the data of
Figure 6 were performed on hazy winter days in Perth, at a low UV index and at direct-beam solar irradiation intensity not exceeding ~800 W/m
2, with the samples placed either vertically (glass-plane normal facing towards the Sun), or horizontally onto ground during June measurements. Additional measurements made at the end of July included a 45° tilted position (backwards away from vertical). According to the location-specific climate-related solar irradiation data from COMFEN 5 software, the maximum direct-beam solar irradiation intensity for June days in Perth is 803.6 W/m
2. Making comparative electric output measurements with solar windows in these “realistic” (non-peak) irradiation conditions is useful for making the conservative estimates of their year-round average energy-generation performance. Smaller diffused irradiation background and weaker UV flux characteristic of winter conditions are also suitable for rating the maximum power outputs of different samples with respect to one another, so that sufficiently conservative estimates of the peak-weather performance can be made, if either the instantaneous direct-beam radiation flux, or the actual measured peak-weather output of one of the samples are known. In outdoor experiments, the instantaneous solar irradiation flux is quite variable, even on clear days and during the I-V curve measurement durations of about 10s. On the other hand, multiple outdoor experiments conducted over a number of “near-peak” spring or summer days allow making reliable and repeatable measurements of the realistic “peak” power outputs at the real solar cell surface temperatures (which in our experience are typically near 40 °C in summer, thus leading to the peak outputs being underestimated by several % compared to the standard test conditions (STC)). It is interesting to note that for samples E and C, from the data of
Figure 6b, the fractional difference between the horizontal and vertical power outputs is smaller for sample E (12.6%), compared to sample C (15.6%), indicating better concentrator performance and smaller angular sensitivity of output in sample E. The data of
Figure 6c was obtained at stronger irradiation intensity (peak monthly direct-beam irradiation dataset for August is more appropriate for analyzing the measurements made on July 31), and also confirms the smaller angular sensitivity of output in sample E. Interestingly, from the data of
Figure 6b,c, the fractional increase in the maximum power generated by sample C in the horizontal position was near 9.2%, roughly corresponding to the maximum direct-beam irradiation intensity increasing by 6.85% from June to August. The power obtained from the vertically-placed samples C and E in both cases increased by about 15%, possibly due to the diffused irradiation reflected from ground surfaces reaching the sample, as well as slightly higher UV irradiation content crucial for exciting the luminophores. At peak irradiation conditions with strong UV content (e.g., in December) and when the Sun altitude angle is locally near zenith at midday, two different window positions lead typically to obtaining the maximized power output: one being near-horizontal, and another one being found at a slight tilt (~30°) backwards from vertical simultaneously with added similar turn in the horizontal plane, away from the precise sun-facing position. This is because the concentrator performance relies both on the effects of luminescence (maximized at the highest possible excitation flux), and also the internal reflections off a IR-mirror coating [
10], or diffraction, which are more effective at higher flux incidence angles. The horizontal window placement is also suitable for minimizing the electric mismatch losses caused by uneven shading of different PV modules. In winter conditions, when the UV index is very low and the Sun altitude angle is near 35°–39°, weaker electric output is seen at a 45° backward tilted position.
By using the previously measured near-peak power output of the vertically-positioned sun-facing sample C (380. 6 mW) in conjunction with the orientation-averaged measured ratio (1.21, from the data of
Figure 6b) of the electric power outputs between the samples E and C, an estimate of 460 mW can be made for the expected near-peak (summer conditions) output of sample E in the vertically-positioned sun-facing configuration. The orientation averaging of the relative electric outputs is needed for conservatism, and to reduce the possible errors due to the seasonal Sun altitude angle variations.
Table 2 shows the summary of electric output data and parameters obtained during outdoor testing experiments conducted with all concentrator samples.
The PV testing datasets of different solar window samples reveal significant structure-related and design-related performance differences, highlighting in particular the contributions of diffractive elements. These data need to be analyzed more in detail, by way of comparing the energy collection performance per unit active PV cell area. Samples using older PV modules of slightly smaller efficiency (A and D) had fill factors near 0.49, whilst the newer samples (B, C, and E) had higher FF values near 0.6. The variations in Voc between the different samples were mainly due to the different spectral distributions of irradiation flux intensities reaching the active areas of cells, and also depended on cell surface temperature variations.
6. Results and Discussion
It is of interest to summarize the observed structure-related concentrator performance data using a standardized approach reliant on the same metrics as is used commonly in the LSC literature. Characterization of luminescent concentrator performance usually involves parameters such as geometric gain (G, the ratio of the total energy collection area to the solar-cells area at which the PV conversion takes place), photon collection probability at solar cell surfaces (P), and optical concentration factor (C
opt). These parameters are related through a simple expression C
opt = G·P = G·(η/η
nom), where η is the concentrator PCE, and η
nom is “bare-cell conversion efficiency”—the nominal efficiency of the solar cell module of the type used [
39]. One additional metrics figure can also be proposed to characterize the electric output performance of vertically-oriented solar windows, which accounts for both the energy collection area of the glazing-system panel and the total area of PV modules installed: M = P
max (vert)/(A
glass · A
PV). A summary of measured concentrator performance data obtained from the batch of five differently-constructed solar window systems is shown in
Table 3. Within the dataset of
Table 3, all efficiency-related and P
max values shown relate to the parameters actually measured in outdoor illumination conditions, at the real (exposure-stabilized) solar cell temperatures. Due to the geometry of sunlight incidence onto the vertically-oriented glass panels, a factor of 0.7 is used to relate the system efficiency figures corresponding to the vertical and peak-tilted orientations, so that the probability of photon collection P can be calculated in a consistent way, regardless of the slight differences in the exact peak-output orientations and tilts existing between differently-constructed samples. This scaling factor is used due to the vertically-oriented glass surfaces intercepting the total solar flux of about 700 W/m
2 at peak weather conditions corresponding to the standardized AM1.5G spectrum and 1000 W/m
2 of total irradiation intensity. In all experiments conducted to obtain the metrics-related data, the solar irradiation intensity was close to the peak conditions, but at less than 1000 W/m
2. The expected peak output of sample E was evaluated within
Section 5.
The results obtained show clearly the significant contributions to energy collection performance per unit active PV area provided by both specialized glass (TIREX) and diffractive elements. Interestingly, the gratings produced by soft lithography used in this study have not been optimized in terms of groove depth for high visible transparency and spectrally-selective deflection of UV and IR light, as opposed to 2D gratings used in sample D. This was due to the etching depth limitations which applied to the quartz-based master grating manufacture process. Therefore, significant room for improvement still exists, in terms of achieving the improved grating transparency simultaneously with stronger deflection of the UV and IR light, if the soft lithography gratings are further optimized in design. The trends observed in the optical concentration factor Copt also confirm the importance of concentrator design features such as specialty glass and embedded diffractive optics.

 ,
, 

