Article

Experimental Study of Light Propagation in Apple Tissues Using a Multispectral Imaging System

by
Mohamed Lamine Askoura
1,2,*,
Fabrice Vaudelle
1 and
Jean-Pierre L’Huillier
1
1
Laboratoire Arts et Métiers ParisTech Angers (LAMPA), École Nationale Supérieure des Arts et Métiers (ENSAM), 2 Boulevard du Ronceray, BP 93525, 49035 Angers Cedex 01, France
2
Ecole Supérieure d’Agricultures (ESA)-INRA, Unité de Recherche GRAPPE, Université Bretagne Loire, 55 Rue Rabelais, BP 30748, 49007 Angers Cedex, France
*
Author to whom correspondence should be addressed.
Photonics 2016, 3(3), 50; https://doi.org/10.3390/photonics3030050
Submission received: 9 August 2016 / Revised: 12 September 2016 / Accepted: 12 September 2016 / Published: 18 September 2016

Abstract

:
This work aimed at highlighting the role played by the skin in the light propagation through the apple flesh. A multispectral Visible-Near Infrared (Vis-NIR) steady-state imaging setup based on the use of four continuous laser sources (633, 763, 784, and 852 nm) and a charge–coupled–device (CCD) camera was developed to record light diffusion inside apple tissues. Backscattering images and light reflectance profiles were studied to reveal optical features of three whole and half-cut apple varieties with and without skin. The optical absorption and scattering properties (μa, μ’s) of intact apples and peeled apples were also retrieved in reflectance mode, using an optimal sensing range of 2.8–10 mm. A relative difference for Δμa ranging from 3.4% to 24.7% was observed for intact apples with respect to peeled apples. Under the same conditions, no significant changes were noted for Δμ’s, which ranged from 0.1% to 1.7%. These findings show that the apple skin cannot be ignored when using Vis-NIR optical imaging as a non-destructive sensing means to reveal major quality attributes of fruits.

1. Introduction

Over the past two decades, the application of light-based techniques in food and agricultural products has been the subject of an important field of research [1,2,3,4], notably for investigating the quality of the products. The major goal was to replace reference methods (often destructive) by non-destructive methods, in order to classify external (appearance, flavor, defects) and internal (firmness, texture, nutritional content) qualitative indices of fruits and vegetables [5]. Like biological tissues [6], agricultural products can be considered as semi–transparent or turbid at certain wavelengths. This is the case for the Visible-Near Infrared (Vis-NIR) range of the electromagnetic spectrum, where the light passes through agro-food materials and interacts with the traveled structures. Basically, when a light beam strikes the surface of an interrogated turbid sample, only 3%–5% [7,8] of the incident light is reflected due to specular effects. This process is dependent on aspects of the skin surface, for example, its color [9]. The remaining part of light is either scattered by internal components or absorbed by chemical compounds, and then transmitted toward the air-tissue boundary. Light transmission is dependent on the reflectance, absorption, and scattering events that occur in the specific illuminated volume of the sample. The macroscopic optical parameters that characterize the light propagation in biological tissues are absorption coefficient (μa), scattering coefficient (μs), scattering anisotropy (g), and refractive index (n) [6]. In consequence of the similarity relation, a single parameter, the reduced scattering coefficient μ’s = μs·(1 – g) is also adequate to describe light propagation in highly turbid media [10]. Absorption is primarily due to the tissue components (pigments, carotenoids, chlorophylls, water, fats and proteins). It greatly depends on the wavelength, notably in the key wavelength ranges 400–700 nm, and 850–1000 nm.
Conversely, scattering depends on microscopic changes in refractive index [11] caused by membranes, pore spaces or organelles. The reduced scattering coefficient of apples and biological tissues generally decreases progressively with increasing wavelength in the range 600–1000 nm [12,13]. Mie calculations revealed that this can also be observed for homogeneous spheres with equal radius. A number of techniques devoted to the measurement of local optical properties, μa and μ’s, have been developed and then successfully tested in biomedical and food-agriculture areas. Common to most methods is the measurement of the diffuse-reflectance performed in spatially-resolved or time-resolved mode [14]. The data are then related to the optical properties by means of simulated inverse algorithms based on theoretical light-diffusion models [15,16,17]. When spatially-resolved reflectance measurements are performed, the sample is illuminated by a continuous wave (CW) light source in a spot, and the diffuse intensity is recorded at several radial distances by means of a fiber array or a charge–coupled–device (CCD) camera [18]. However, the time-resolved spectroscopy measures the temporal broadening experienced by a short light pulse when it interacts with the tissue-sample. Usually, the time-delayed pulse is recorded on the sample surface, at a fixed distance from the injection point, by a contact-optical fiber interfaced to a time-correlated single photon counting setup (TCSPC) [19].
Among different fruits and vegetable products, apple varieties have been well studied using optical spectroscopy methods and light transport models. Cubeddu et al. (2001a) [20] first explored the key features of the time-resolved approach to nondestructively assess absorption and scattering spectra of apples and other fruits and vegetables, in the wavelength range 650–1000 nm. In a second paper, Cubeddu et al. (2001b) [21] performed time-resolved measurements on three different varieties of whole intact or peeled apples, in the working wavelength range from 610 to 700 nm. They showed that the measurements can probe the optical properties of the flesh down to a depth of about 2 cm regardless of the skin, provided that an interfiber (source–detector distance) is kept at 1.5 cm. Several papers have been also addressed to confirm that time-resolved spectroscopy can be used to predict firmness, soluble solids content and acidity of apples [22,23,24,25,26,27].
Qin and Lu (2008) [22] developed a novel spatially-resolved hyperspectral diffuse reflectance imaging system for extracting the optical properties of fruits and vegetables. To account for the fruit shape effect on the scattering light intensity distortion they used a modified lambertian cosine law to get better correction than previous ones [28,29]. Other corrections that are related to the scattering profile distortion have also been analyzed by researchers who assumed the fruit shape as a sphere [28,29] showing also their usefulness during experiments.
As discussed by Qin and Lu (2008) [22], the spatially-resolved hyperspectral imaging method is noncontact, relatively simple, and more suitable for horticultural products, compared to the time-resolved method. However, spatially-resolved and time-resolved methods are both based on diffusion theory models that are derived for homogeneous semi-infinite models. Hence, the local curvature of the interrogated fruit may induce departures on the retrieved optical properties. Furthermore, most products are surrounded by a skin layer whose optical properties could be quite different from those of the flesh, as is the case for the apple [30]. As a result, CW spatially-resolved measurements reflect the optical properties of the skin and subsurface [31,32], unless the photons probe deeply in the flesh by increasing the source-detector distance. Recently, Vaudelle and L’Huillier (2015) [33] and Askoura et al. (2016) [34]; considered this question by assuming the apple as a two–layer spherical model comprising the skin and flesh tissues. Numerous simulations based on a Monte Carlo code have been performed in order to generate time-resolved and spatially-resolved reflectance measurements. Computational results suggest that the time-resolved reflectance spectroscopy may probe optical properties of the flesh up to ~15 mm regardless of the skin layer, when a sufficient source-detector distance (15 mm) is used for the measurements. This is consistent with the experiments reported by Cubeddu et al. (2001b) [21]. The curvature of the fruit boundary has a noticeable effect on the errors in the estimated optical properties of the flesh, but results from time-resolved arrangements are more influenced by the size of the apples compared with the spatially-resolved spectroscopy. To our knowledge, no systematic investigations have been reported for examining why the skin layer interferes with the measurements of the internal optical properties of apples using hyperspectral or multispectral imaging setup.
In this paper, experiments were carried out on three apple cultivars (Royal Gala, Golden Delicious, and Granny Smith) using a steady-state multispectral imaging system with different source-detector distances [0–3; 2.8–10] mm, in order to show the role played by the skin on the light propagation inside the samples. Whole and half-cut apples, unpeeled or peeled, were tested at four wavelengths, and then captured images were analyzed to display the backscattered light profiles related to each tissue arrangement. The specific objectives of this work were to:
  • Develop a multispectral optical bench devoted to steady-state backscattering imaging of food and agricultural products,
  • Characterize the image sizes, light profiles, and classify samples by means of established dimensionless parameters, and
  • Assess the optical parameters of unpeeled and peeled apples, using an appropriate fitting algorithm.

2. Materials and Methods

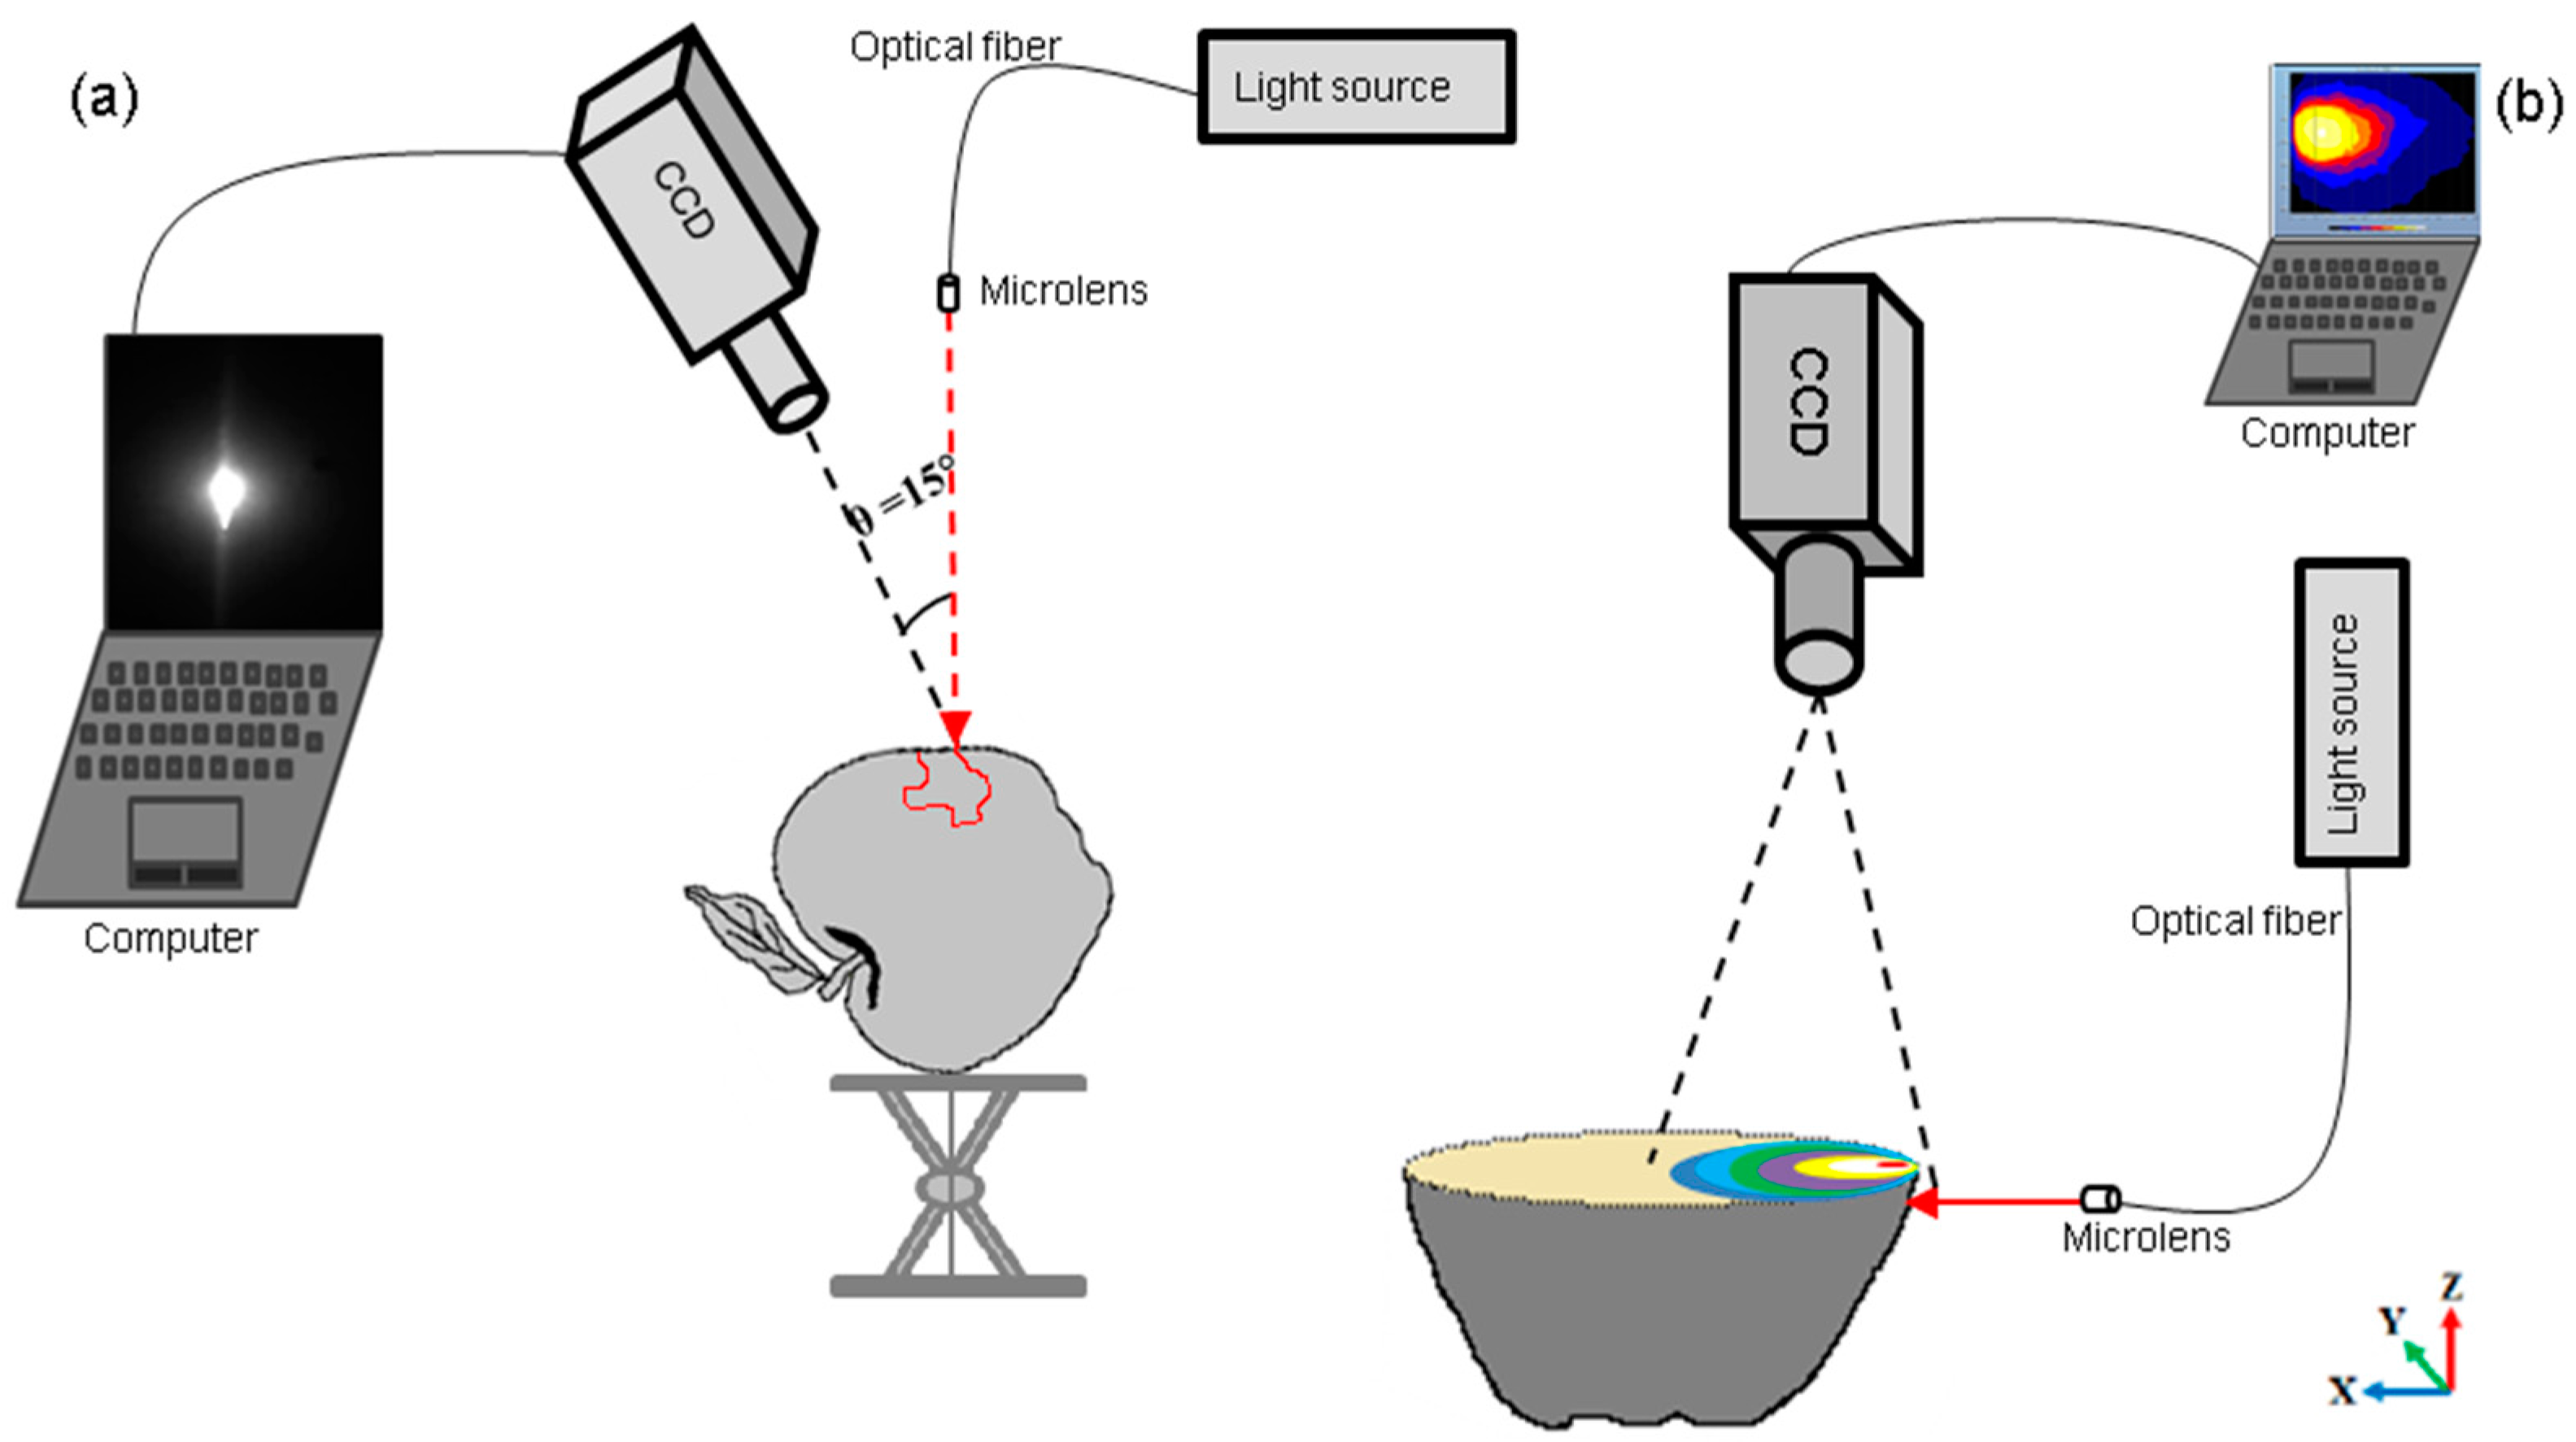
2.1. Setup and Tissue Arrangements

The experimental setup used in this work is schematically illustrated in Figure 1. Basically, it consists of light sources, illumination coupled–fiber, CCD camera, and data acquisition-control devices interfaced with a computer, for spatially resolved diffuse reflectance measurements in the range 500–1000 nm.
The light sources were alternately a He-Ne laser emitting at 633 nm with a beam power of 35 mW, or three CW laser diodes emitting at 763, 784 and 852 nm with powers of 50 mW, 100 mW, and 150 mW, respectively (DFB LD 100 Production). The light produced by each selected laser source was transported through a multimode optical fiber (Edmund Optics/core diameter 400 μm, NA = 0.23) coupled with a focusing lens (f = 80 mm), in such a way that the spot diameter over the sample surface is equal to 600–700 μm. Diffuse reflected light above mentioned wave–band components was coupled by a CCD camera 16 bits high performance 512 × 512 pixels (Model C4880-21-24A, Hamamatsu Photonics Systems, Bridgewater, NJ, USA) covering the wavelength range 200–1100 nm. To reduce the noise, the camera is cooled to −70 °C. The system is equipped with a zoom lens of focal length 11–110 (×12) mm (Hamamatsu Photonics Systems, Bridgewater, NJ, USA).
Two different tissue arrangements were used to study the optical features of whole and cut apples, in reflectance mode (Figure 1a), and combined transmittance-reflectance mode (Figure 1b). In case of whole apples in reflectance mode, the angle θ between the selected incident light beam and the camera axis was set at 15°, in order to reduce the specular part of the re-emitted light [22,35,36].
In both cases, the distance between the surface sample and the camera was adjusted by a motorized stage and set at 250 mm. The fraction of the reflected image that the camera was able to capture was estimated to 90% using the relationship reported by [37]. This corresponds to an effective detection diameter of 25 mm. For each measurement, an appropriate selection of several neutral density filters was used in order to record the maximum number of photons on the CCD chip, while avoiding saturation.

2.2. Apple Samples

In experiments, 42 fresh fruits of the three apple cultivars “Royal Gala, Golden Delicious and Granny Smith” were used. They were harvested in late 2014. Moreover, size, weight and coloration of each apple variety were equally homogeneous. For example, the mean value of the diameter related to the whole set of apples was 67.50 mm with a standard relative deviation of 13%. Before the experiments, the apples were stored in a controlled atmospheric environment (2% O2 and 3% CO2 at 0 °C) for about 15 days. After the apples were kept at room temperature (24 °C) for more than 15 h, the experiment began. As mentioned above, the apple samples were tested with and without skin. In the latter case, a large area of apple skin facing the laser source was removed using a surgical blade.

2.3. Data Processing

Because of the saturation caused by the specular reflection, noise due to black spots located on the skin of some apples, and the shape effect of the apple, original captured backscattered images need a pretreatment. This enables us to take the correct parameters of the backscattered images (Figure 2a). The spot of the image being measured is the sum of two signals which are both assumed to be the combination of Lorentzian and Gaussian profiles [38].
Due to the specular reflection of the laser on the surface of the fruit, the first signal is narrow and intense, thus causing a large distortion through the CCD zoom (Figure 2a). The second is larger and much less intense, and is related to backscattering light emerging from the apple flesh. Then, the basic idea was to use a deconvolution procedure to extract the backscattering part. The removal of the specular signal was done using an algorithm of segmentation and filtration implemented in Matlab 8a (MathWorks, Natick, MA, USA) [39]. To validate this procedure, synthetic profiles with known parameters were used. After that, a ±15% noise was added to these virtual measurement points by randomly varying their initial value. The fit demonstrated, then, its ability to find these settings only in absence of black spots. By applying this procedure of specular elimination (see Figure 2b), images were ready to be used if they don’t have black spots, caused by black points found on the skin of apples. The original color images of the backscattered light captured by the CCD camera were expressed in grayscale light intensity which ranges from black to white corresponding to I = [0,255], respectively.
Figure 2c shows the transformation of the captured image from monochrome (grayscale) images to RGB (Red-Green-Blue) images. When images are converted into RGB color, defects are visible (dark spots), and the intensity levels are separated by isoline bands distinguished by different colors, each color being associated to a level of grayscale. The dark spots lowered the reflectance intensity in the scattering profiles and hence should be removed [28]. A simple subtracting method was applied to remove pixels of the dark spots in determining the scattering profiles. Hence, the low pixel values were eliminated from each isoline band, and the average color value was calculated for the remaining pixels. The corrected backscattered images were then used to represent the reflectance profiles.
Due to the curvature of the whole apple surface, the reflectance IC captured by the CCD camera underestimates the apparent light intensity on the apple surface, which should be equal to IR [28]. The relationship between IC and IR is based on the Lambertian cosine law [40]. Hence, the apparent reflectance IR was calculated by Equation (1):
I R = I C c o s φ = I C R R 2 d 2
where R is the radius of the measured position on fruit surface, d is the maximum distance between edge and center of light scattering profile, ϕ is the angle of the measured position on fruit surface, taking into account the offset angle of 15°.
Lambertian cosine law was applied to recalculate the intensities captured by CCD camera for each position on the spherical fruit surface [36]. The signal processing was performed using the software ImageJ, Labview 2009 and Matlab 8a (MathWorks, Natick, MA, USA), while the statistical tests were carried out using Statgraphics software, version 5.1 (STSC, Inc., Rockville, MD, USA).
Two specific parameters were studied in this work: the peak value (Rmax) and the full width at half maximum (FWHM). Both are computed from the backscattered images. In this purpose, a fitting data procedure should be performed after the imaging process previously cited. Figure 2e shows a fit of the radial image profile, made from the estimated maximal location.
The modified Gauss-Lorentz function (Equation (2), with two adjustment factors ε and f) is the most suitable to perform this fitting. This equation results from a combination of models reported by [37,38]. Particularly, the fitting process requires the determination of two relevant parameters such as the peak value (Rmax) and the full width at half maximum (FWHM):
R G L ( ρ ) = o f f s e t + R m a x o f f s e t [ 1 + ε ( 2 ρ F W H M ) f ] e x p [ ( 1 ε ) 2 . ( 2 ρ F W H M ) 2 ]
where RGL(ρ) is the fitted modified Gauss-Lorentz values at the distance ρ. It has been verified that all the average profiles can be fitted using the Equation (2). A typical example is shown in Figure 2e, with ε = 0.975 and f = 1.89.

2.4. Diffusion Model

Light propagation in biological materials is governed by the light transport equation [41]. Interestingly, the diffusion approximation is valid for most fruits and vegetables because scattering is dominant over absorption (μ’sμa). For a homogeneous semi-infinite turbid medium illuminated by an infinitely small continuous wave (CW) point light source, the diffuse reflectance R(ρ) at its surface depends on the source-detector distance ρ (>1/μ’s) and the two optical parameters μa and μ’s [16]:
R ( ρ ) = 1 4 π μ t [ ( μ e f f + 1 r 1 ) e μ e f f . r 1 r 1 2 + ( 4 3 A + 1 ) ( μ e f f + 1 r 2 ) e μ e f f . r 2 r 2 2 ]
where μ t = μ s + μ a is the total optical transport coefficient, μ e f f = 3 μ a ( μ a + μ s ) is the effective attenuation coefficient. The variables r1 and r2 are given by the following two equations, r 1 ( 1 μ t ) 2 + ρ 2 and   r 2 = ( 4 3   A + 1 μ t ) 2 + ρ 2 . The coefficient A has been introduced to take into account the internal reflection. Equation (3) is the theoretical basis used to fit the normalized profiles by means of a trust-region method. A nonlinear least squares curve fitting algorithm was implemented on Matlab 8a (MathWorks, Natick, MA, USA) to extract the estimates of μa and μ’s from the spatially resolved reflectance profiles. Figure 2f depicts a fitting example based on an optimal sensing range of 2.8–10 mm.

3. Results and Discussion

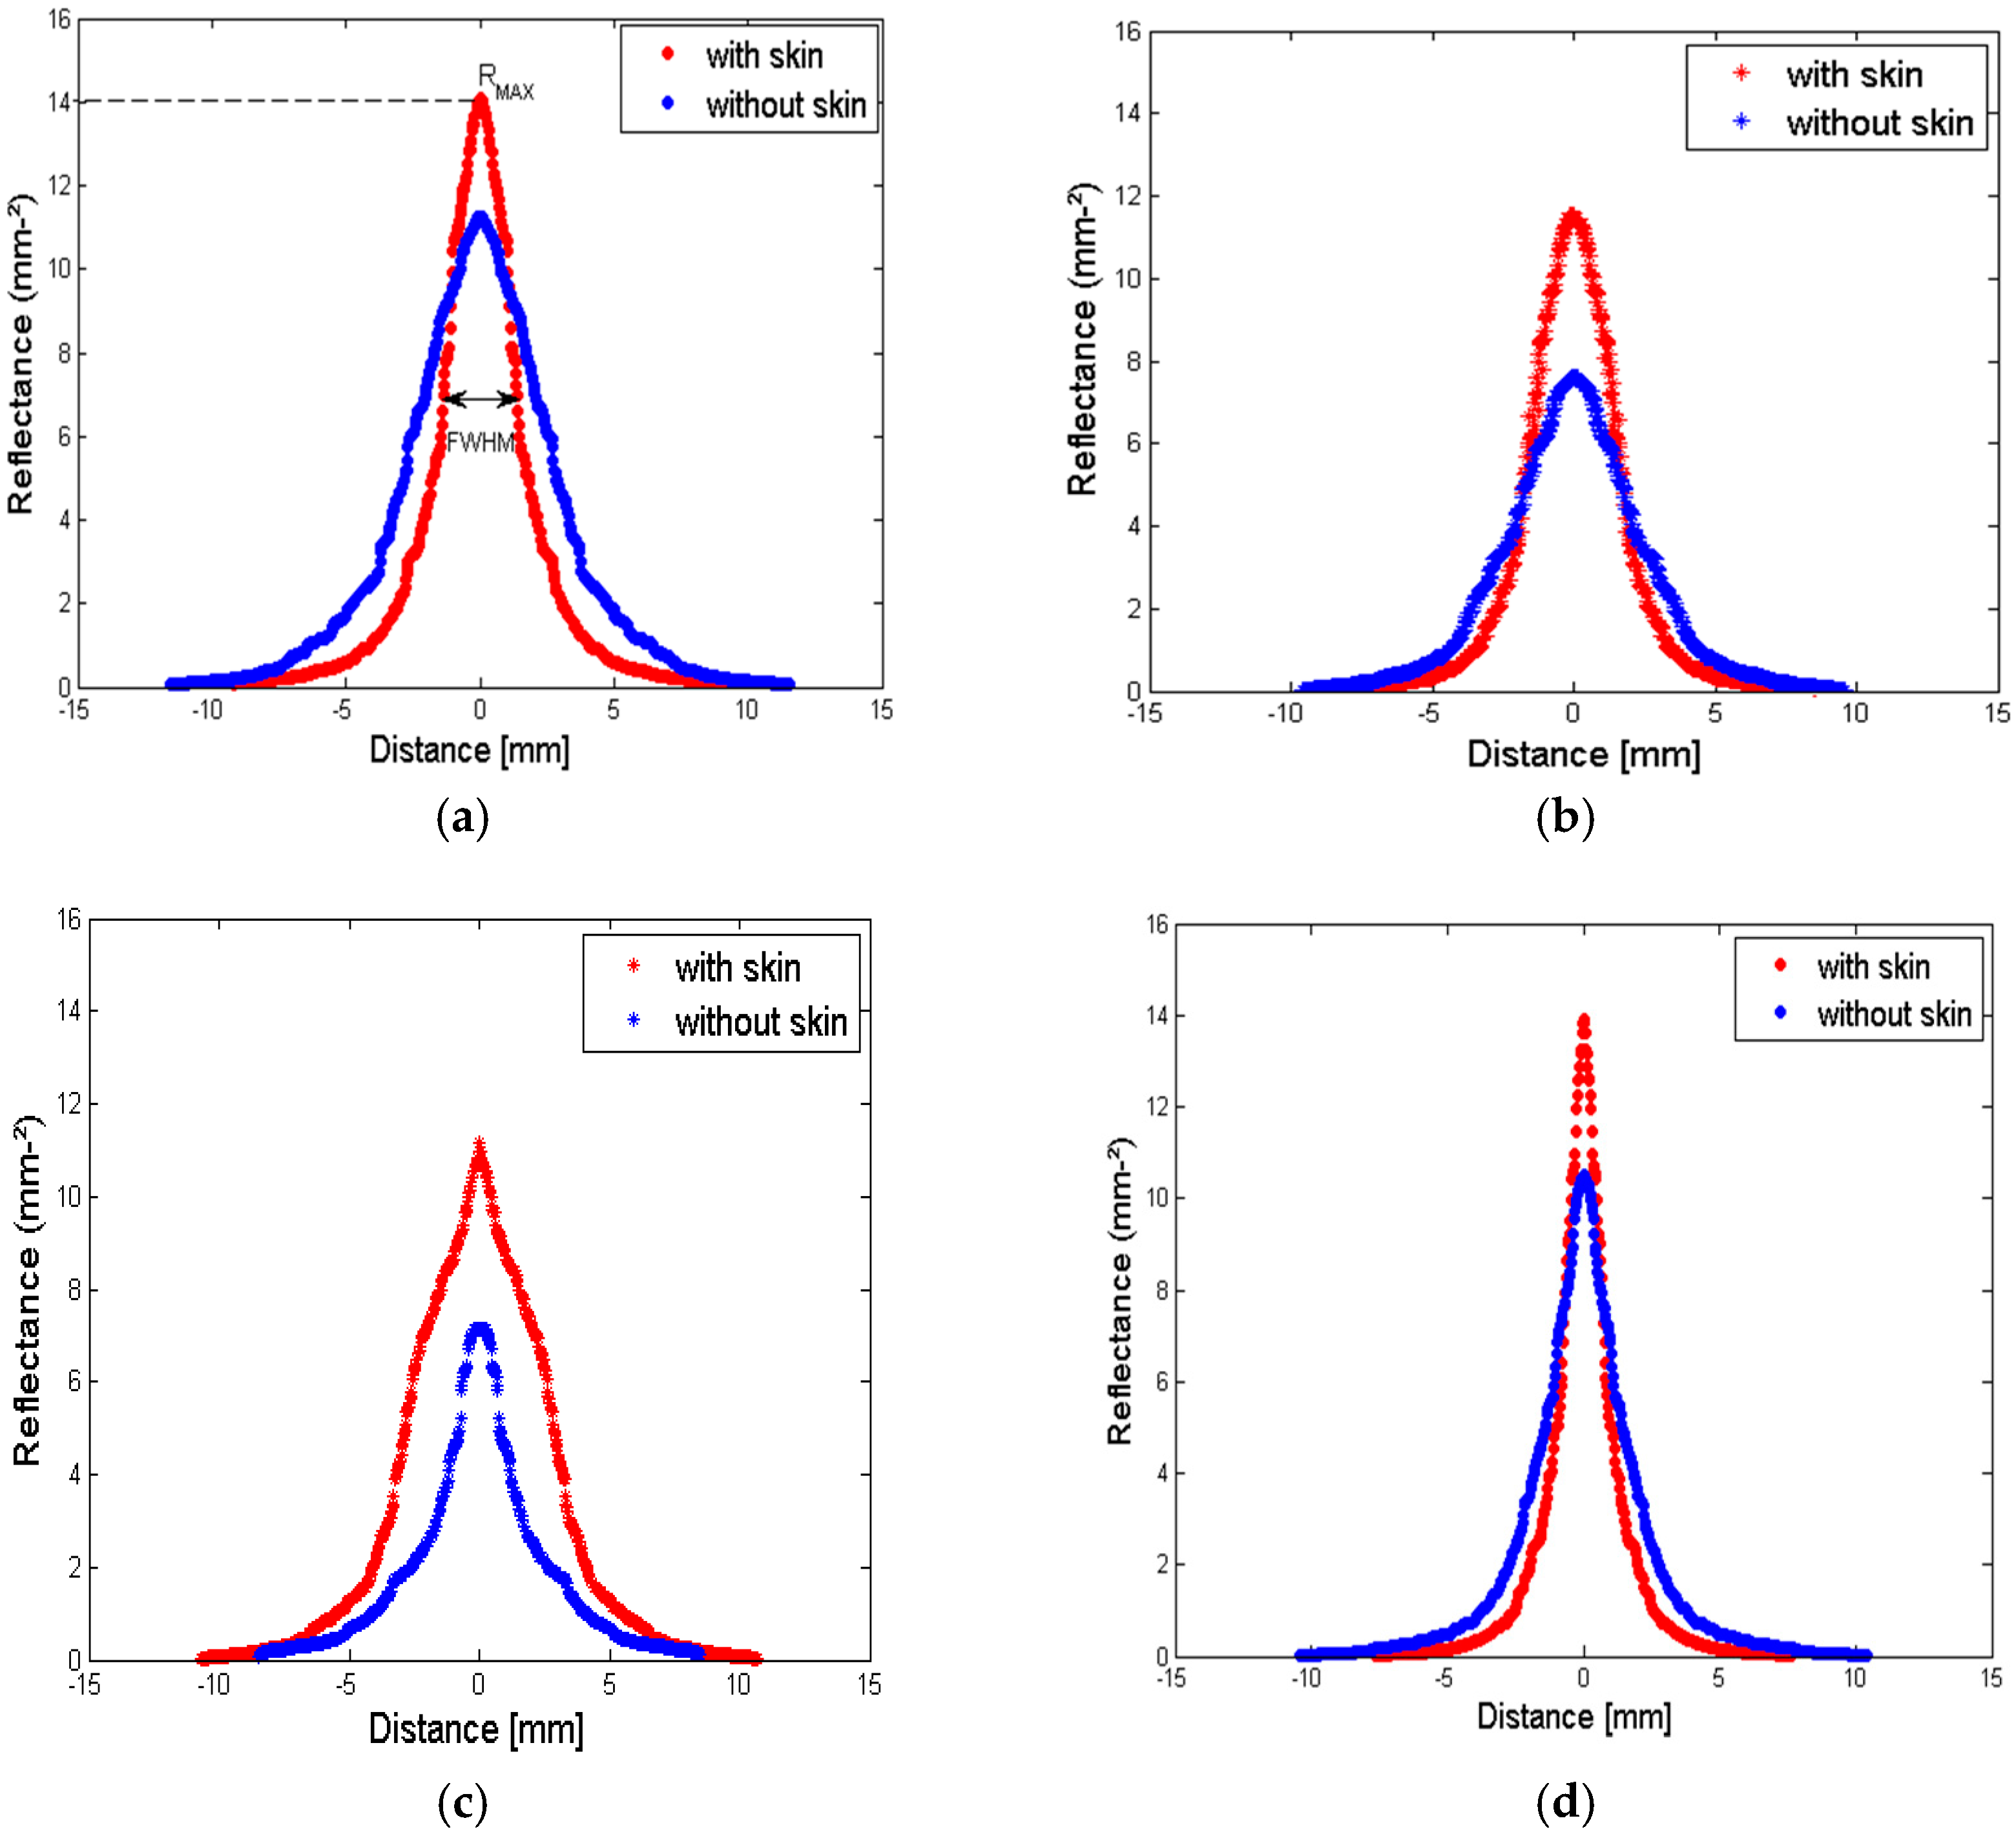
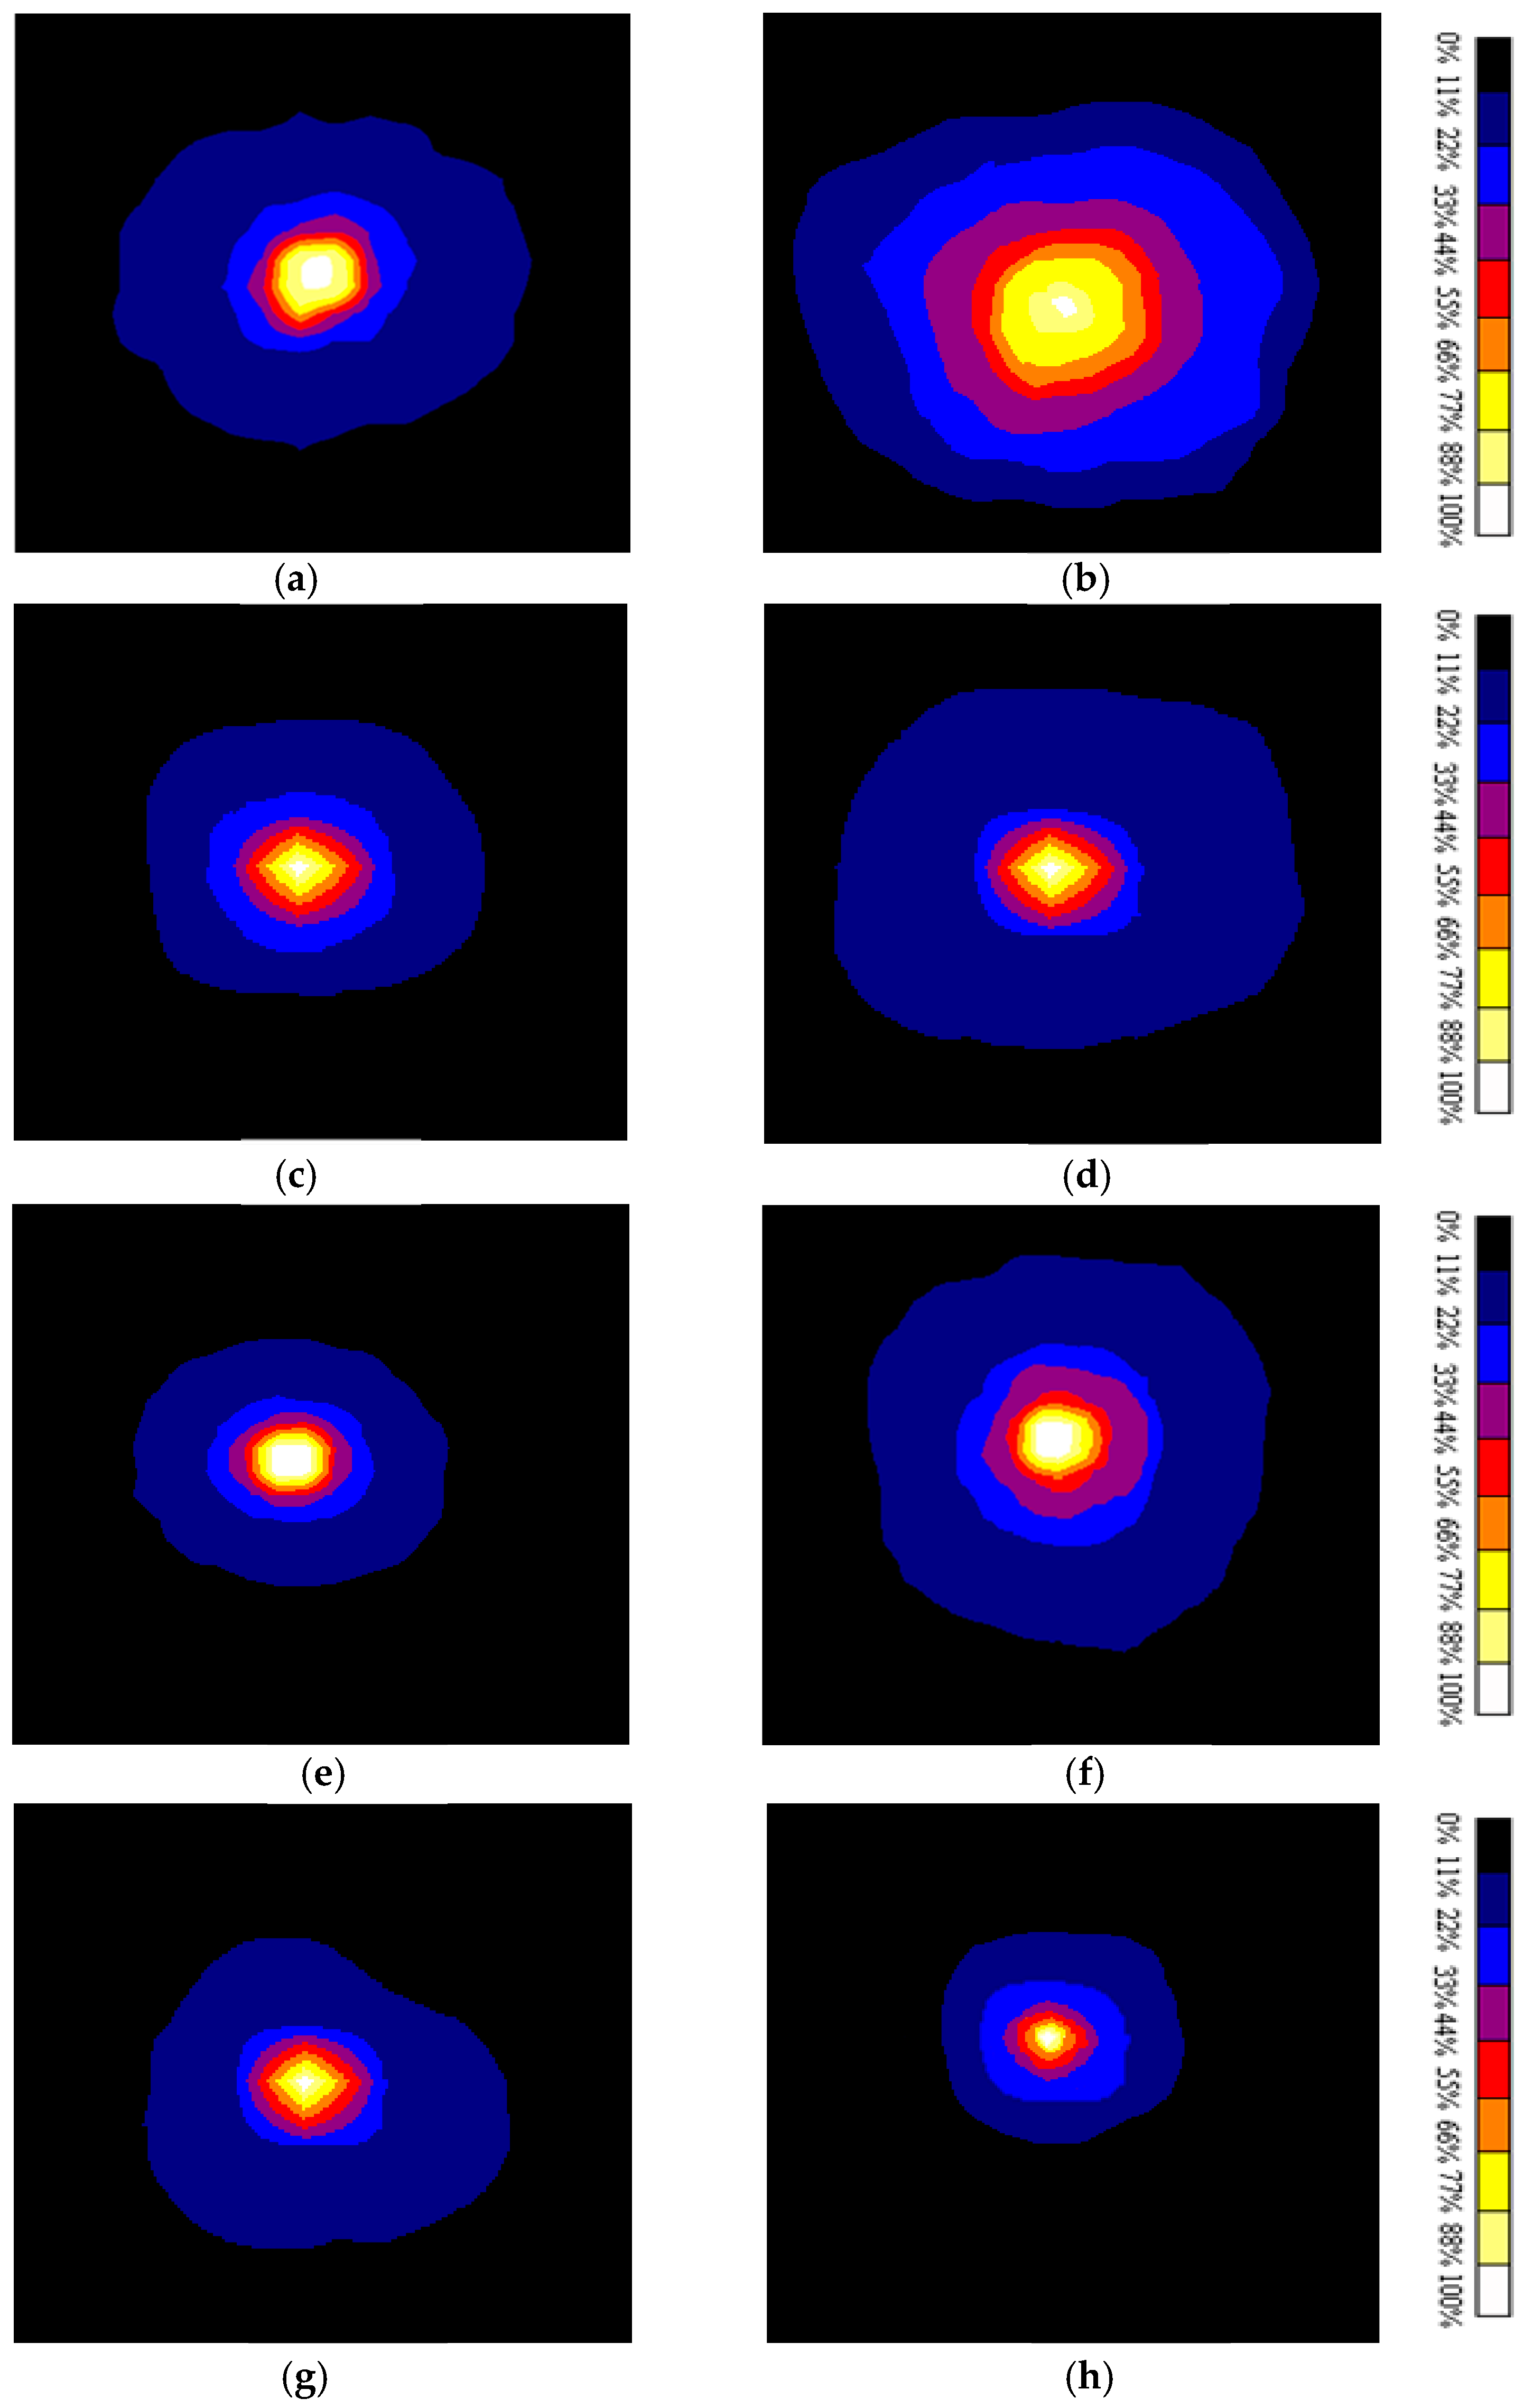
3.1. Backscattering Data

Typical backscattering images related to Granny Smith, Golden delicious, and Royal Gala apples with and without skin, respectively, acquired at 633 nm, and 763, 784 and 852 nm, are displayed in Figure 3a–h, respectively. When the Granny Smith is illuminated at the wavelengths of 633 nm, and 852 nm (Figure 3a–d), the size of backscattering images appears larger for the peeled sample than for the intact apple. The same effect can also be observed for the Golden Delicious illuminated at 763 nm (see Figure 3e,f)). In contrast, for Royal Gala at 784 nm (Figure 3g,h), the image acquired with an unpeeled sample is wider. It is noticeable that, for all varieties, the widest images were obtained at 633 nm.
To better analyze the typical backscattering images, different reflectance-scans were carried out over 18 crossing lines centered at the maximum intensity with angle step of 10°. Then, the data were averaged leading to a single average profile. The method has the advantage of producing measurements less dependent on the spatial variations of the tissue-optical properties, and to increase the Signal to Noise Ratio (SNR). Average spatially-resolved reflectance profiles derived from the images displayed in Figure 3 are shown in Figure 4a–d, respectively. It is shown that the peak intensity related to the intact apple was always higher than the one obtained in apple without skin, except for the Golden Delicious irradiated at 852 nm.
The peak value (Rmax) and the Full Width at Half Maximum (FWHM) have been computed from the fitted reflectance profiles using Equation (2). Their values were studied as a function of the wavelength, for the three apple varieties (see Table 1). For Granny Smith and Golden Delicious, the FWHM value was higher in apple without skin than in intact apple. In case of Royal Gala illuminated at wavelength ranging from 763 to 852 nm, the FWHM was smaller in apple without skin than the one for intact apple. However, it remains unchanged in both cases at 633 nm.
The reflectance obtained by summing the intensities over all pixels was also examined. Figure 5a depicts the evolution of the ratio α R = R T ( withskin ) R T ( withoutskin ) as a function of the wavelength, for the three apple cultivars. Note that Golden Delicious and Granny Smith apples exhibit the same trend with respect to the wavelength, while the behavior of Royal Gala is clearly distinct from the two others. Concerning the Royal Gala, αR increases from 633 nm to 852 nm, with a jump between 763 nm and 784 nm. In contrast, for the same wavelength range, αR decreases slightly for both Golden Delicious and Granny Smith.
Distinguishing Royal Gala from Golden Delicious and Granny Smith groups also seems relevant regarding the ratio   α F = F W H M ( withskin ) F W H M ( withoutskin ) . The plots of αF as a function of the wavelength reveal the same trend as this observed for αR (Figure 5b).
These first findings are in agreement with those reported by others [42], who showed that the total reflection measured on red skin (Royal Gala) is higher than this obtained on green skin (Granny Smith) in the NIR range.

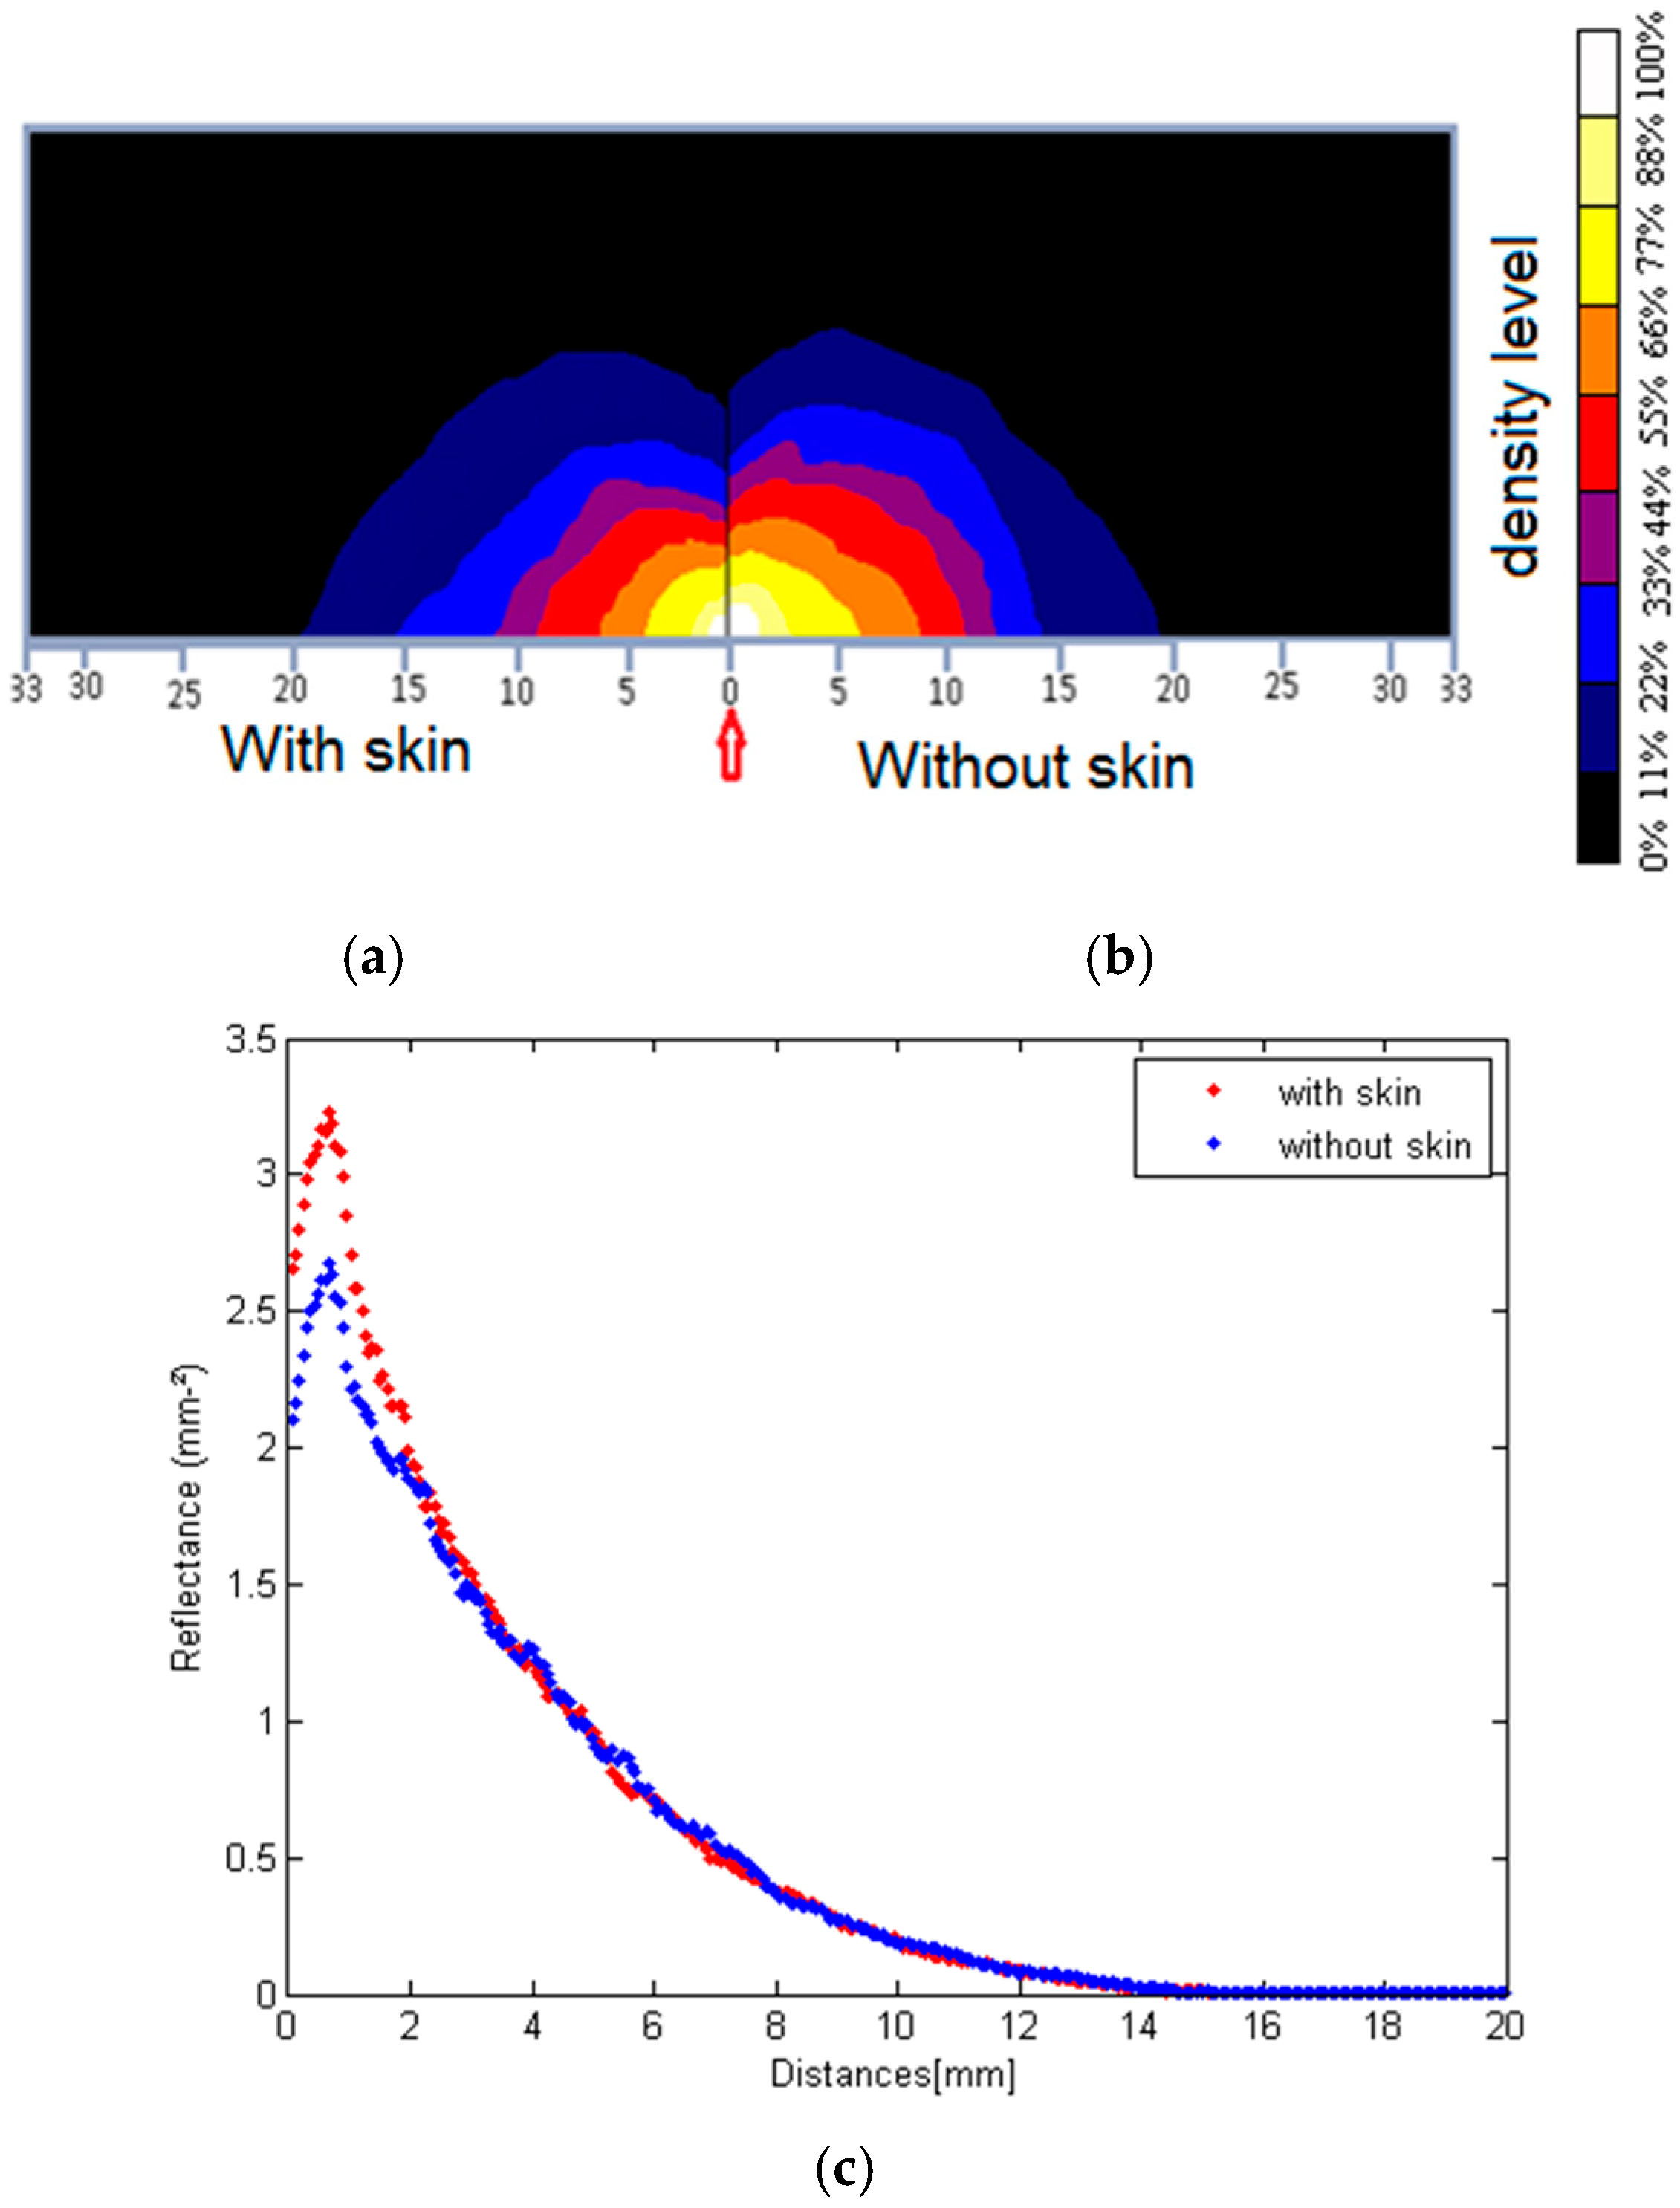
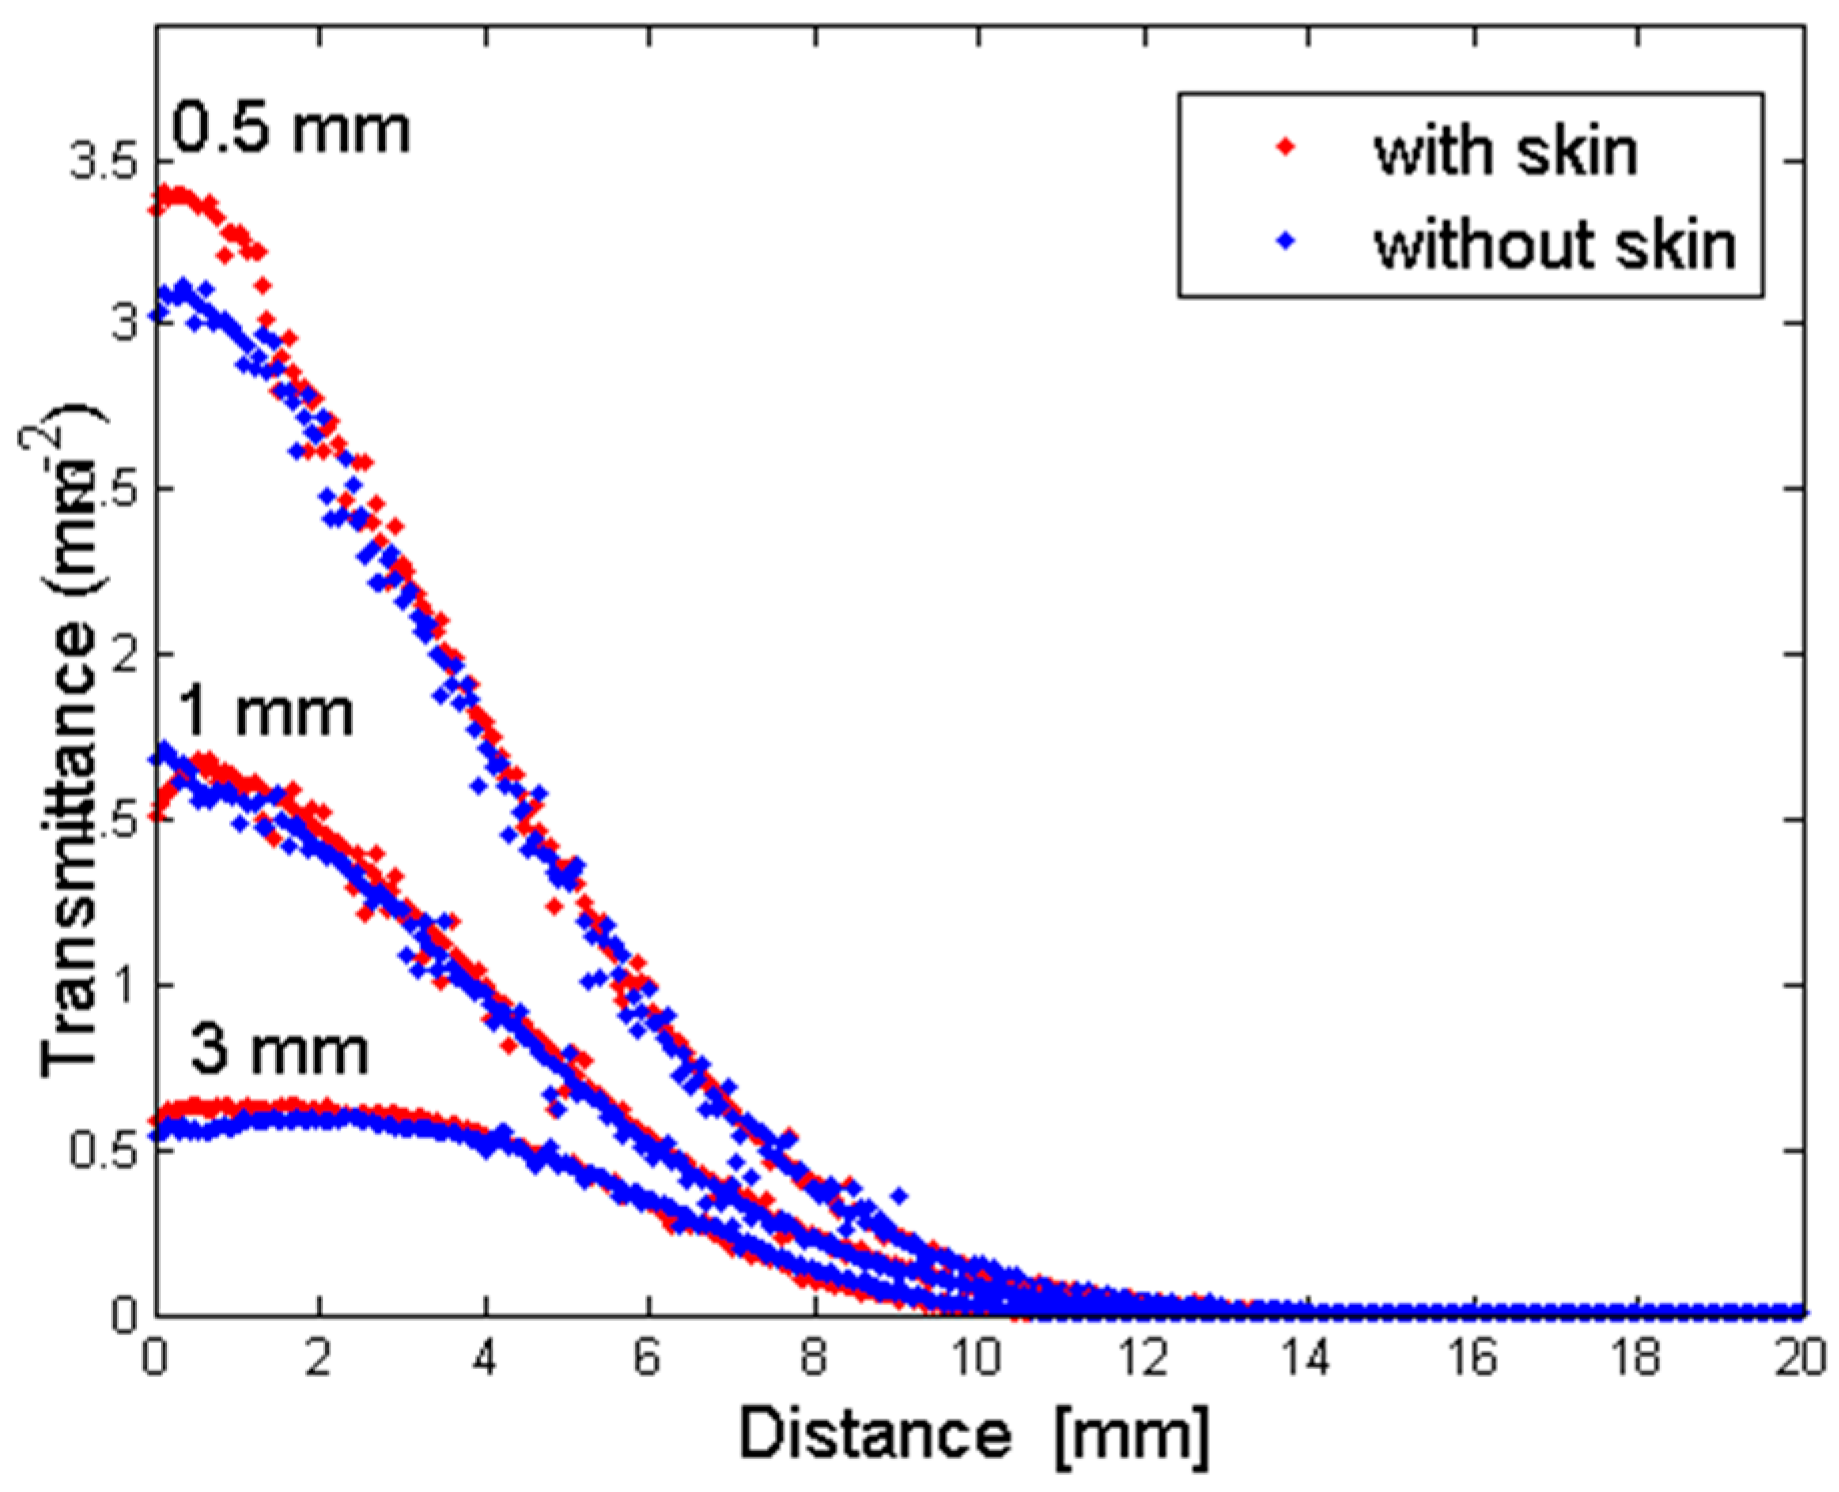
3.2. Transmittance-Reflectance Mode Data

To gain more information on the light propagation inside apple structures, unpeeled and peeled apples were cut in half and the irradiation was done perpendicularly to the equatorial line, at different locations z from the plane surface (Figure 1b). Typical backscattering images captured by the camera facing the cut surface of Royal Gala with and without skin are shown in Figure 6a,b, respectively, for the source emitting at 633 nm and located at z = −3 mm.
In both cases, the recorded photons stay close to the light source, but their area of maximum density varies from each other. Again, the record of scan profiles, along 9 lines with angle steps of 10° and around the peak position, allows us to plot both averaged photon distributions as a function of the distance (Figure 6c). The peak intensity measured with the skin exceeds the one related to the peeled apple, but the skin layer does not affect the light propagation from 3 mm in the flesh. Beyond this distance, both profiles appear as merged. Moreover, the fact that the peak position moves away slightly from the origin, still confirms that the diffusion can be considered as coming from a virtual source inside turbid media [43].
Figure 7 shows the average profiles related to Royal Gala with and without skin, illuminated at 633 nm by the light source located at three positions z = −0.5, −1, and −3 mm. It is shown that the intensity of the detected light reaches the maximum at the source position z = −0.5 mm, and significantly decreases with increasing z. Globally for each source location, the maximum intensity of recorded light in the wavelength range of 763–852 nm was always larger than the one without skin, except at 633 nm. This observation remains true for the three apple cultivars used in this study. The difference between the profiles recorded over samples with and without skin is only noticeable for spatial data close to the light source, i.e., for the co-ordinates y < 0.9 mm at z = −0.5 mm, y < 1.2 mm at z = −1 mm, and y < 2.1 mm at z = −3 mm. Even if the thickness of skin layers does not exceed hundreds of micrometers, these findings show that the skin has an influence on the photons propagation in apple fruit close to the source over a scale of 10 times the thickness of skin layers.
Figure 8 shows the ratio of the total reflectance over the cut surface   α R * = R T ( withskin ) * R T ( withoutskin ) * . The total reflectance was obtained by summing all pixels with respect to the wavelengths. In comparison to the previous section, this total account can be considered as the measurement of partial transmittance with respect to the skin. Owing to the fact that the skin contributes to absorb, diffuse and reflect the incident flux of photons, the ratio α R * cannot exceed the value limit of 1. In contrast to results obtained for whole apples (Figure 4d), the lowest transmittance ratio withskin withoutskin was noted for Royal Gala.
Although variances between apple cultivars for the transmittance were less significant than in the case of reflectance, it goes in the direction of the remarks made on the transmission relatively to the color of the skin [42]. For Granny Smith, the reflectance ratio calculated in the Section 3.1 was around 0.5, while the transmission ratio for the wavelength of 633 nm was around 0.95. This high photons loss can be attributed to the great chlorophyll absorption of green skin, as suggested by [42]. Results obtained from reflectance and partial transmittance measurements show that the presence of the skin and subsurface layers has an influence on the photons distribution in apple tissues.

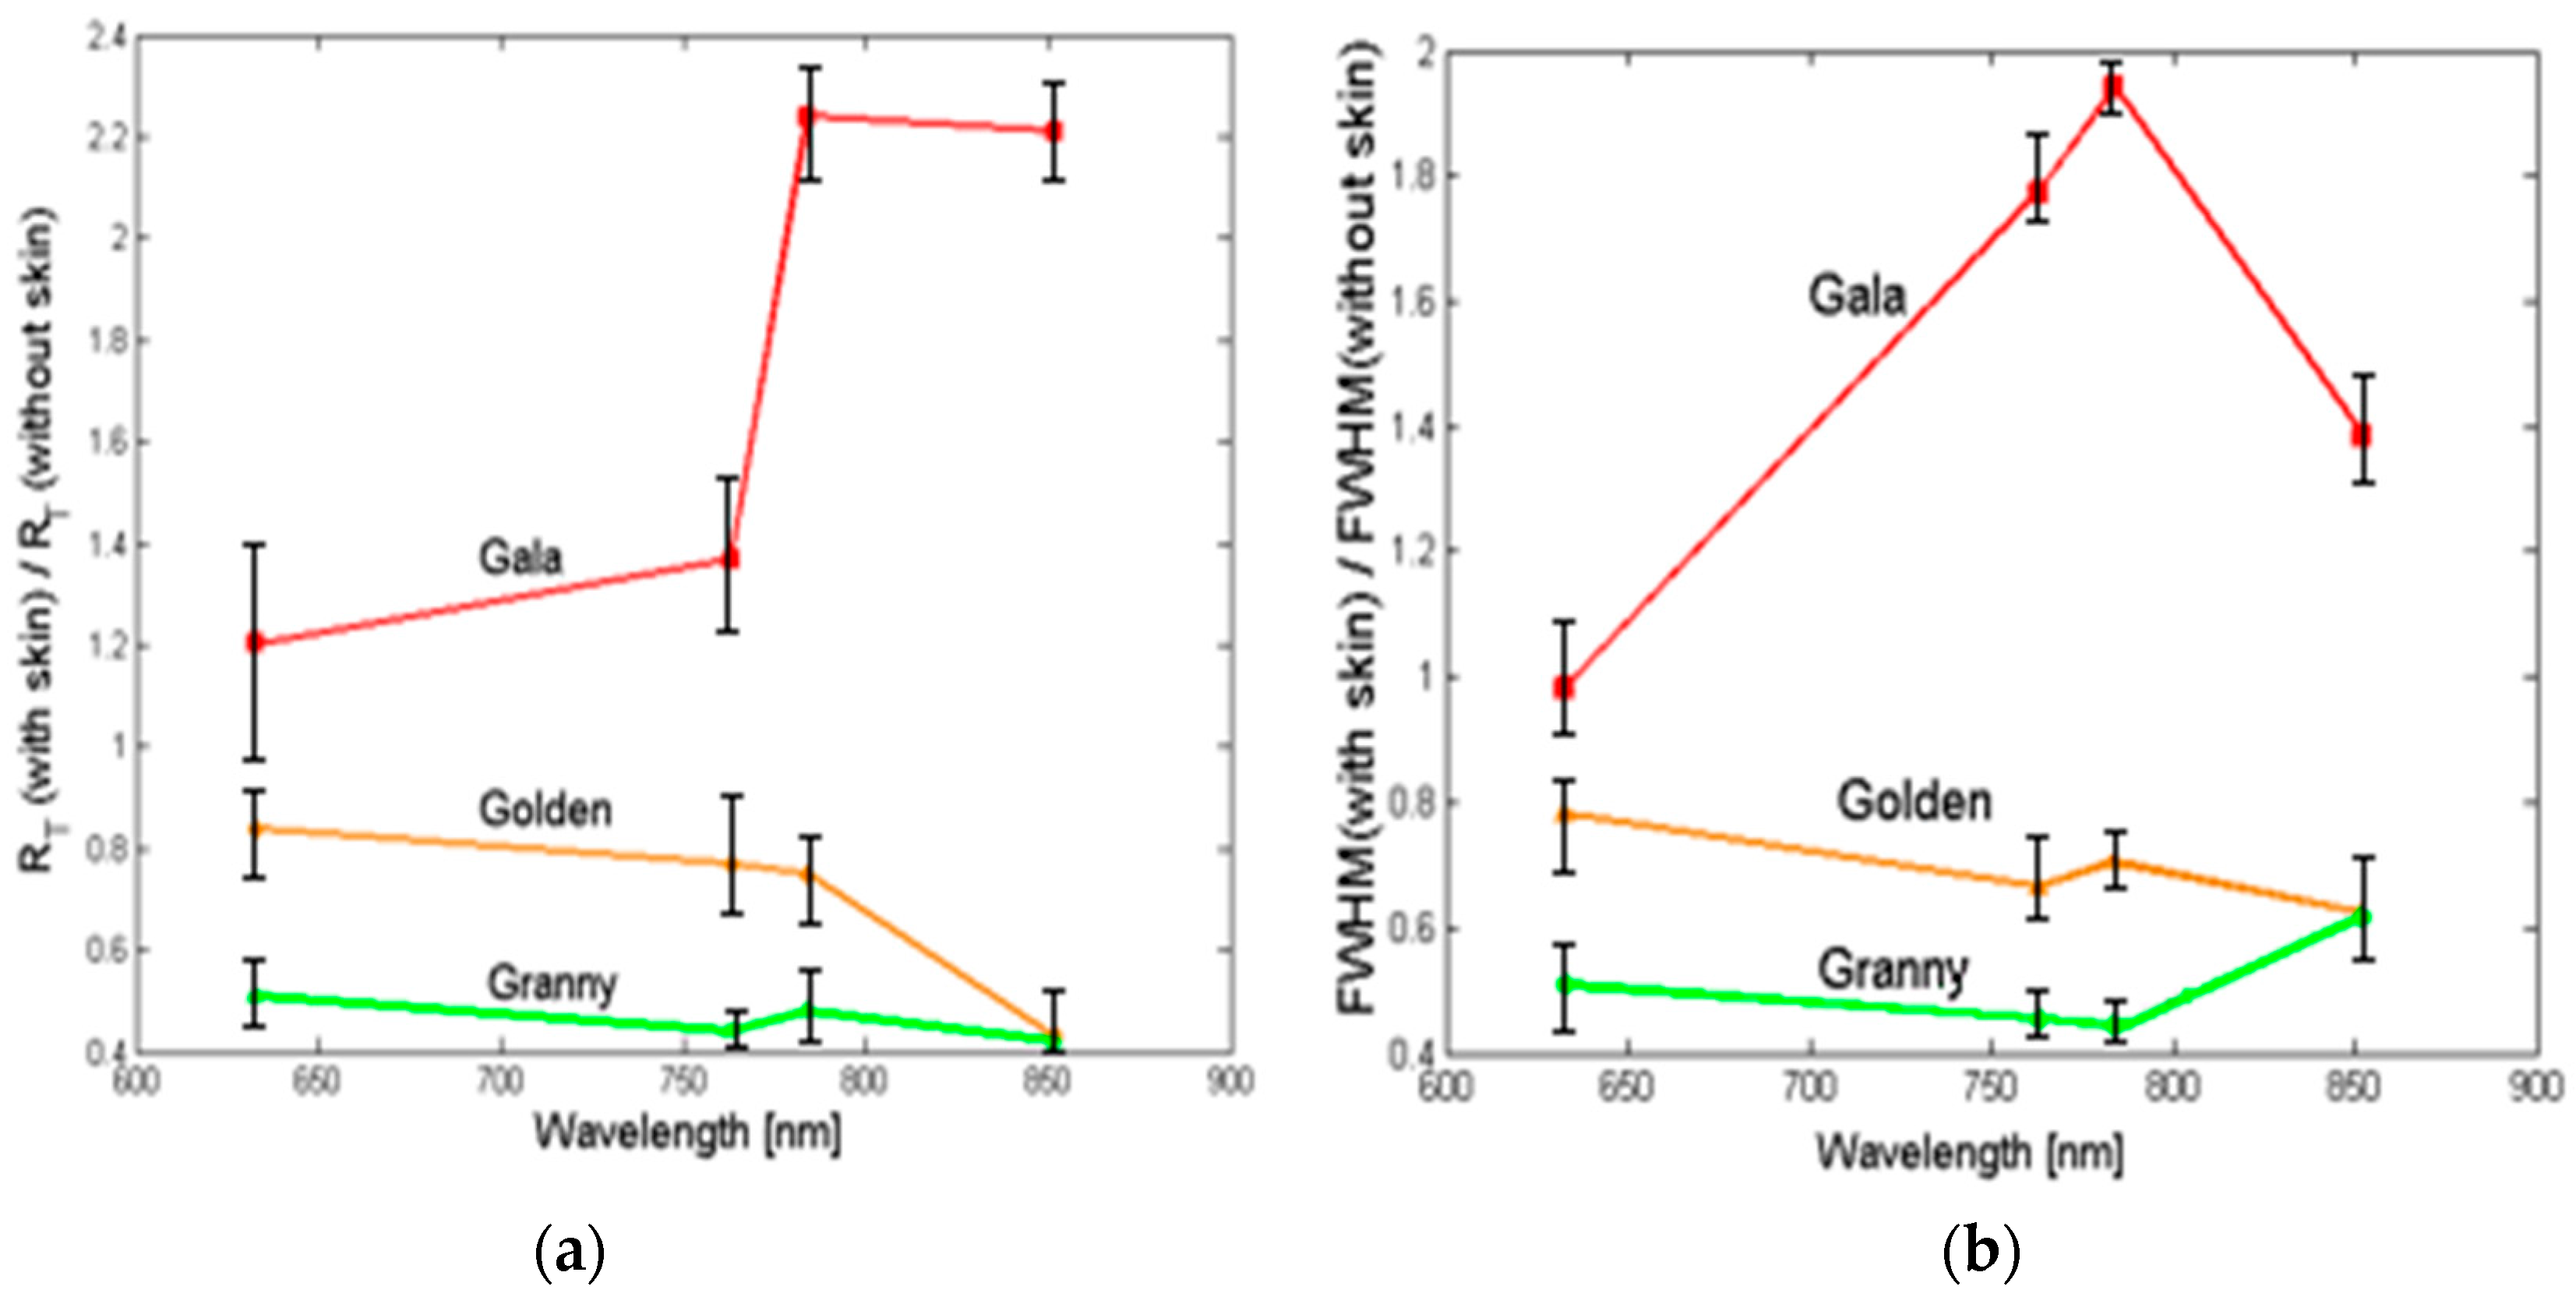
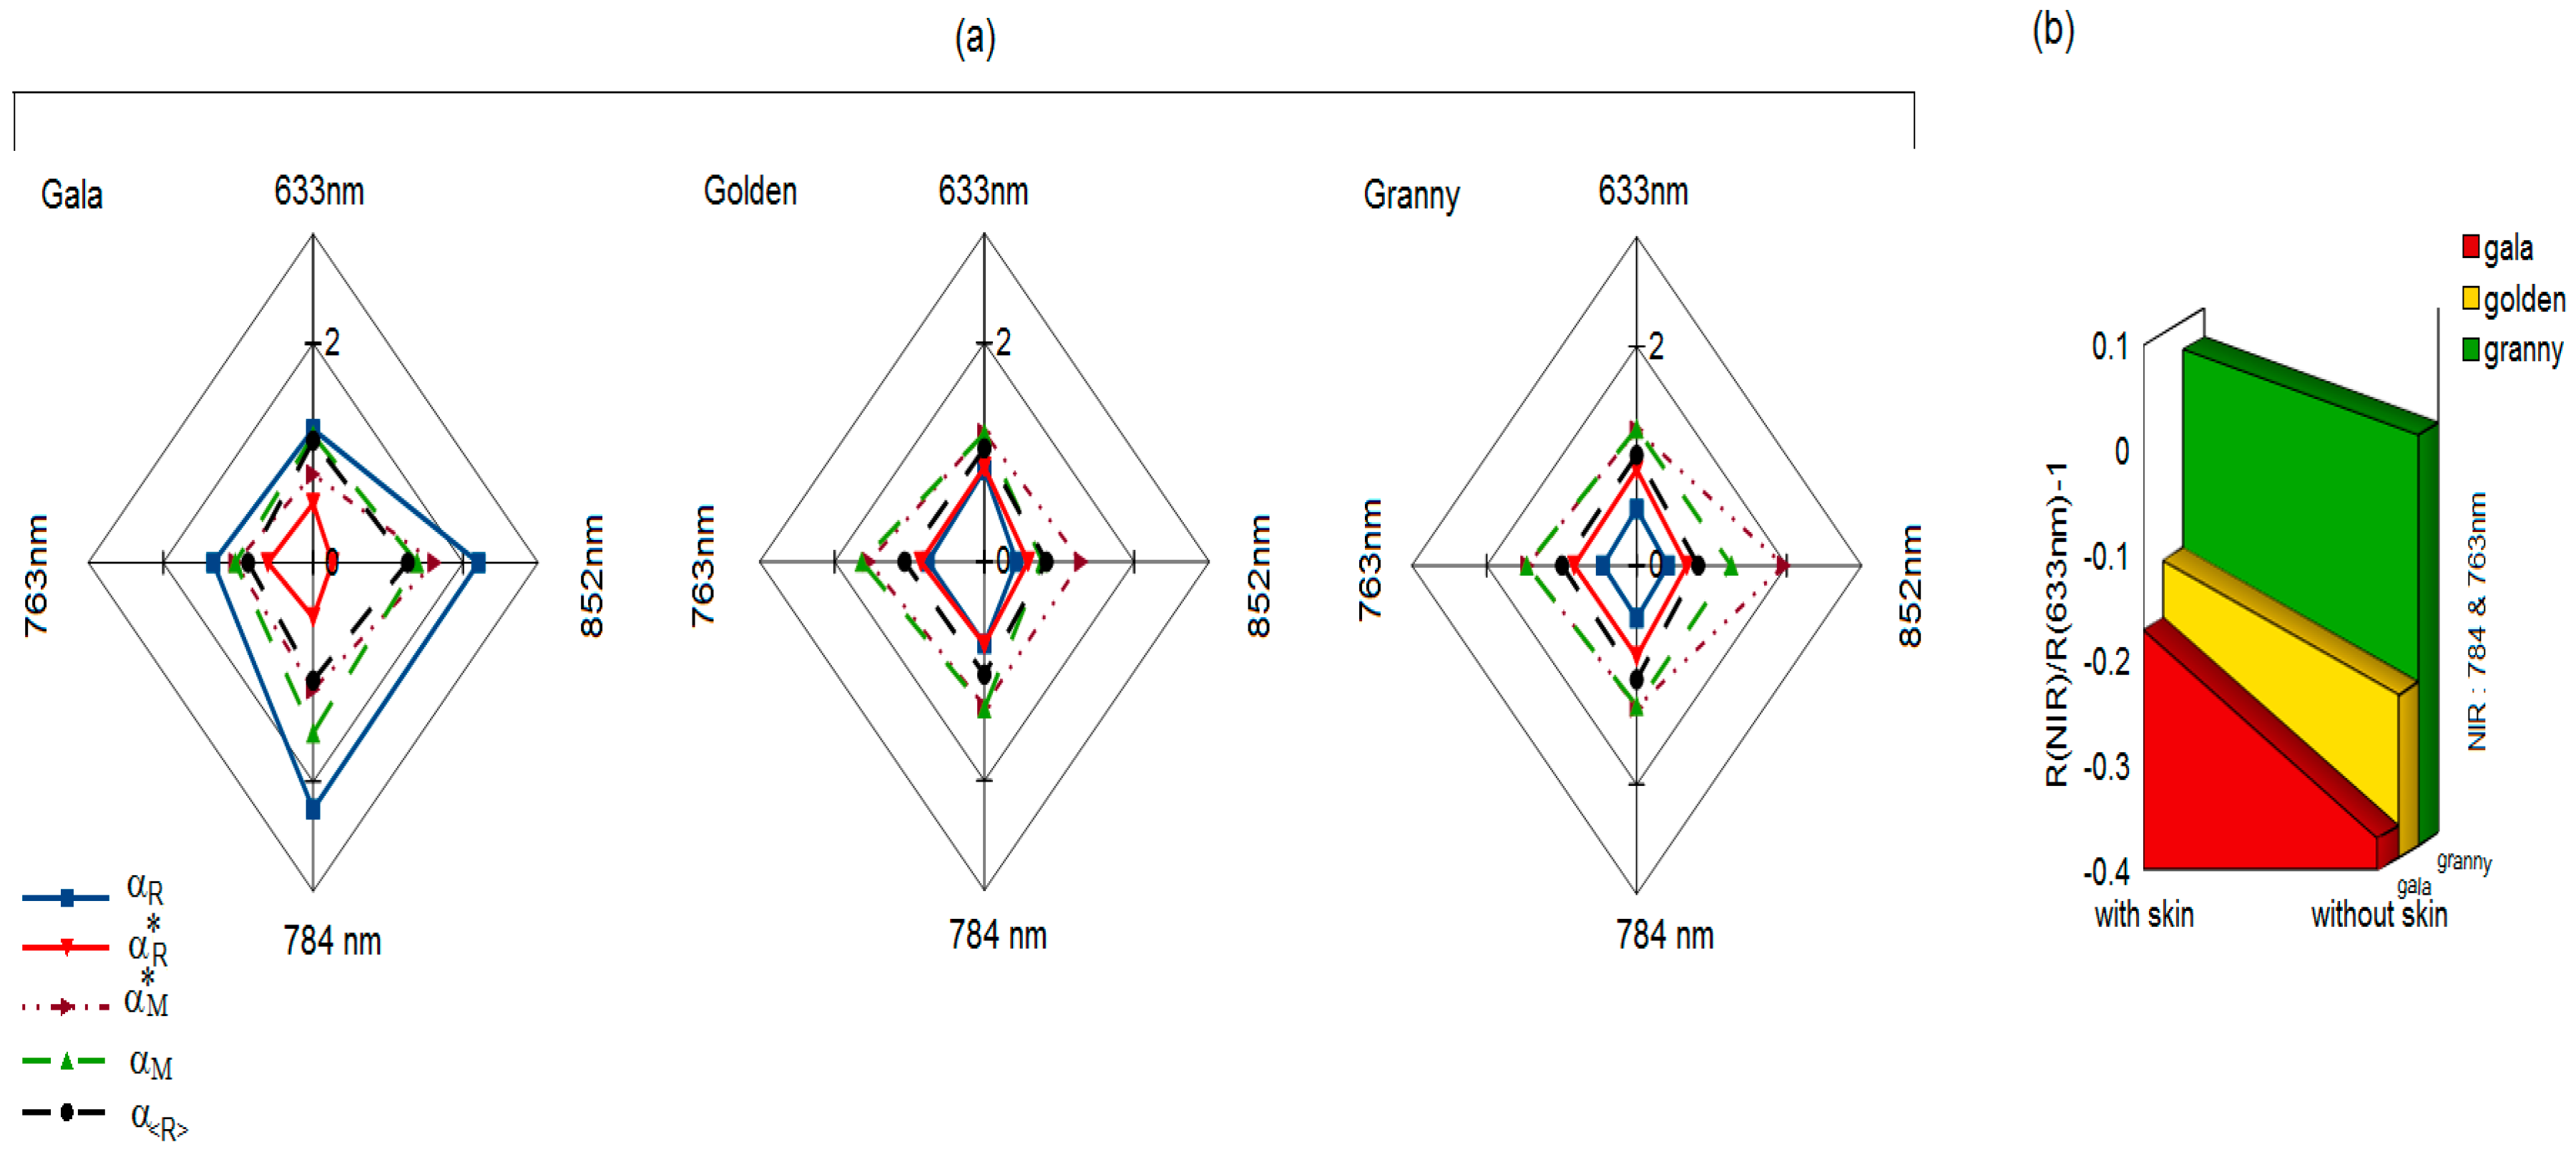
3.3. Comparative Analysis of Dimensionless Parameters

Figure 9a depicts the web diagrams related to the peak magnitude ratio α M = R m a x ( withskin ) R m a x ( withoutskin ) of the whole apple, peak magnitude ratio α M * = R m a x ( withskin ) * R m a x ( withoutskin ) * of the cut apple, the averaged intensity ratio α R = α R α F and the two above mentioned ratios (αR, α*R) calculated for the three apple cultivars (Royal Gala, Golden and Granny Smith), and tested at four wavelengths (633, 763, 784, and 852 nm). These spatially localized intensities (maximum or spatially-averaged intensity) were considered owing to the fact that they are often used to obtain correlation with physical properties of the apple, particularly the firmness [37,44,45]. For each apple cultivar, the diagram was drawn by considering the whole and the half cut apples. Interesting features may be observed on the web diagrams.
The total reflectance ratios obtained in backscattering mode on a whole apple αR, or in transmission mode over the planar surface of the cut apple αR*, give specific results for three apple cultivars irradiated at the four above mentioned wavelengths. For Royal Gala, αR has the largest value at the four wavelengths, while the greatest value of α*R was for the Granny Smith. However, the results related to the Golden Delicious are intermediate in both cases. It is also shown that αF follows the same evolution as that of αR.
Ratios of peak magnitude profiles αM, α*M corresponding to the whole and cut apples, respectively, and the one of averaged intensity α<R> do not follow a specific trend and are approximately on the same order of magnitude for the three apple cultivars. This lends credit to the idea that reflectance measurements performed in the limited area of whole apples can be useful to probe the flesh firmness without a great skin perturbation [44]. However, note that for the case of a cut apple, the maximum ratio is slightly lower at the wavelength of 633 nm, regardless of the apple cultivar. This observation is well supported by the results reported in [21], who showed that 633 nm is the wavelength threshold of apple absorption whose magnitude varies well with the chlorophyll content. It is interesting to establish a few links between physico-chemical properties and dimensionless parameters highlighted in this study. In fact, the three studied apple cultivars have different properties related to their flesh and skin tissues. The pigmentation of the skin appears as red, yellow or green. The skin thickness of apples is not uniform, but investigation based on confocal microscopy and carried out in our laboratory, showed estimates of the skin thicknesses of about 65 μm, 80 μm, and 100 μm, for Royal Gala, Golden Delicious and Granny Smith apples, respectively. These measurements are in agreement with the findings of [46], who reported apple skin thicknesses ranging from 30 to 130 μm.
A pigment index CI, that is known as being correlated to the chlorophyll content [47,48] (and slightly to the anthocyanin content [47]), was established by considering the spatially localized intensities Ri (maxima:   R m a x ,   R m a x * , averaged intensity: R T F W H M   ) according to the following relationship C I = R i ( 750   nm   <   λ N I R   <   900   nm ) R i ( λ V i s   ~   640   nm   o r   ~   700   nm ) 1 , where the considered wavelengths are λNIR = (763 nm, 784 nm, and 852 nm) and λVis = 633 nm. Figure 9b shows that the whole apples have higher absorbance than the peeled apples, this is especially due to the high concentration of the chlorophyll and/or anthocyanin pigments presents in the skin. The chlorophyll content is higher for the Granny Smith’s skin (green color), while the Royal Gala’s skin contains a lot of anthocyanin molecules (red color). All these trends are well supported with the biochemical results reported by others [49].
However, one should not judge the absorption property of skin to an apple cultivar only through the total reflectance in backscattering mode. Indeed, the reflectance in transmission mode (cut apple) shows that the non-reflected light passes through the external surface of the apple in large part throughout the skin, which consists of the waxy–cuticle, epidermis and several layers of hypodermis, without being totally absorbed. Otherwise,   α R * does not follow the opposite behavior of   α R . In contrast to the case of Royal Gala, the skin of Granny Smith does not greatly affect the light transmission through its whole structure. The skin of the Royal Gala can also be more absorbent than that of the Granny Smith. It should be noted that in the literature, only one study suggests that the skin absorption coefficient of Royal Gala is slightly greater than that of the Granny Smith in the range of 750–900 nm [30].
Finally, the diagram also shows low values for the Golden at the wavelength of 852 nm. This may be due to a rapid deterioration of the peeled Golden Delicious apple, with a noticeable water depletion, making the water absorption less observable at the wavelength of 852 nm.

3.4. Assessment of Optical Properties

Optical properties measurements were performed on three apple cultivars (Royal Gala, Golden Delicious, and Granny Smith) with and without skin layer, using a steady-state reflectance method with four selected wavelengths of 633, 763, 784, and 852 nm. Calibration step was done using a solid phantom with known optical properties at the wavelength of 633 nm [50]. The reflectance profiles covering the source-detector separations ranging from 2.8 mm to 10.0 mm were then used to extract the estimates of absorption and reduced scattering coefficients, using the Farrell model (Equation (3)). This optimal sensing range was chosen in such a way that measurements will not be disturbed by the flux close to the optical axis, and to reduce the curvature effect of the apples [33] (see Figure 2f).
In this range, the Farrell model was adequate for describing the reflectance profiles acquired on the apples. Note that the Kienle model [17] is also useful to estimate the optical properties of turbid media. The use of the two models gives practically the same results if the start of the fitting is not too close to the source (~2 mm) as reported by Askoura et al. (2015) [50]. The assessed optical properties are listed in Table 2. Measurements were carried out from seven samples of each apple variety, and they were repeated three times. The average errors related to the estimates are then of about 9% for μa and 15% for μ’s.
The values of μa for the three apples were in the range of 0.0091–0.0361 mm−1 for unpeeled apples, and 0.0082–0.0275 mm−1 for peeled apples. Higher μa values are noted for Golden Delicious and Granny Smith at 633 nm. This is due to the presence of the chlorophyll which absorbs at wavelength near to 670 nm. We have shown that for the selected fit range, intact apples absorb more the incident light than the peeled ones. However, the values of μ’s were in the range of 1.009–1.243 mm−1 for intact apples, and 0.991–1.240 mm−1 for the peeled apples. These values slightly decrease with increasing the wavelength. The absorption and reduced scattering coefficients are in agreement with those reported by different groups [20,21,22,51,52] in the same wavelength range. Particularly, for the cases of unpeeled Golden Delicious and Granny Smith, the retrieved optical parameters are close to those reported by Cen et al. (2013) [51] with an average error of 20% for μa and 1.4% for μ’s concerning the Golden Delicious, and 25% for μa and 1.5% for μ’s concerning the Granny Smith. Cen et al. (2013) [51] used the same fitting procedure than the one considered in this study. In addition, recent paper focused on the estimation of the optical properties of the Royal Gala according to its firmness, the finding listed in Table 2 are close to those obtained by Rowe et al. (2014) [52] related to the firm Royal Gala apple.
The absorption coefficients exhibit maximum values at the wavelength of 633 nm. Then, they are practically constant between 763–784 nm, and finally increase at the wavelength of 852 nm, due to the water content in apple. The maximum value of the absorption coefficient was found for Granny Smith irradiated at the wavelength of 633 nm, owing to the green pigments which absorb in this spectral band, with a peak at 670 nm [20]. It is shown that the retrieved reduced scattering coefficient decreases as the wavelength is increased, a trend which has been well confirmed by the literature [22].
A relative difference Δ μ a * = μ a ( with   skin )     μ a ( without   skin ) μ a ( with   skin ) ranging from 3.4% to 24.7% was observed, then showing the part of light absorbed by the skin. In contrast, no significant differences have been found for Δ μ s * which range from 0.1% to 1.7% (see Table 2, p < 0.05). A recent study based on Monte-Carlo simulation Askoura et al. (2016) [34] has shown that a high skin reduced scattering coefficient (μ’s(s) = 4 mm−1) barely change the flesh retrieved reduced scattering coefficient 1%–5%, but significantly influences the retrieved absorption coefficient of the flesh in the range of 5%–20%. This suggests that the light scattering in apple is less influenced by the skin compared to the absorption process. The retrieved absorption coefficients are always higher than the one without skin. One explanation may be due to the absorption of the thin skin layer surrounding the apple.
On the other hand, the values of the reduced scattering coefficient of apples irradiated with and without skin are not very different, i.e., the presence of the skin does not disturb the light diffusion inside apples, even if the skin has a high reduced scattering coefficient of ~4 mm−1 [30]. This observation remains valid for the selected fitting range, or for a starting fit far away from the optical axis. The differences on the absorption coefficients related to the whole and peeled apples, are often higher for the Granny Smith than for the Royal Gala. Saeys et al. (2008) [30] using a single integrating sphere combined with the inverse adding-doubling method showed that the skin absorption coefficient of Royal Gala is higher than the one of Granny Smith in the NIR. The method used in Ref. [30] treats isolated samples, i.e., flesh or skin, while the reflectance method takes into account the skin-flesh compound.

4. Conclusions

In this paper, the skin effect on the light propagation inside three tested apple cultivars has been investigated using a dual step method, reflectance and reflectance–transmittance arrangements at four wavelengths ranging from the visible to NIR. The experimental findings show clearly that the skin influences both the reflectance profiles and the amount of backscattered photons. For instance, the peak values (Rmax) were always higher than the one without skin, indicating that a part of light does not penetrate the flesh due to a large reflection from the skin layers according to their components. Ratios established from the measurement of FWHM and total reflectance on apples with and without skin, were similar for Golden Delicious and Granny Smith. In contrast, the skin of Royal Gala exhibits a widening of the reflectance profile, and an increase of the reflected light intensity towards the CCD camera. A possible explanation may be due to a red pigment level or the thinness of the skin layer of the Royal Gala. This suggests that the absorber concentration such as the one of chlorophyll, the colored pigments, and the various sizes of the epidermal cells, are many elements contributing to differentiation in the skins of various apples.
The observation of the light propagation over half-cut apples using a transmittance–reflectance method, allows to study by another way the skin effect. Especially, a peak was observed for the reflectance at the cut surface, of which the magnitude may be related to the properties of the skin. The dimensionless parameters highlight the role played by the skin. Particularly, it was found that the Royal Gala skin reflects more the incident light than Golden Delicious and Granny Smith. Moreover, the skin of the Granny Smith better transmits the incident light, except at the wavelength of 633 nm.
The spatially resolved steady-state multispectral imaging technique combined with an appropriate fitting algorithm based on the diffusion theory model was useful for measuring the absorption and scattering properties of intact or peeled apples. Interestingly, the intact apples absorb more incident light than the peeled ones, while the scattering parameters are less influenced by the presence of the skin.
Some authors assumed that the retrieved optical coefficients using the hyperspectral imaging are close to those of the flesh, owing to the small thickness of the skin (<0.5 mm). Nevertheless, even with a selected sensing range starting far from the optical axis, our findings show that the skin and the subsurface layers may interfere with the assessment of the absorption coefficients of the flesh. Indeed, the removal of the peel leads to a negative shift on the assessed absorption coefficient with respect to the whole apple. This indicates that the skin contributes in the measurement of the optical properties.
These findings are encouraging, but the study should be completed using an extended wavelength range from 400 to 1000 nm. Globally, the experiments confirm well the first trends computed with our previous Monte Carlo model [34], but the influence of the source-light distribution and scattering phase function should be investigated to better explain the scattering events that occur close to the source and at the subsurface.

Acknowledgments

This work was funded by the Regional Council of Pays de la Loire and supported by the AI fruit Project.

Author Contributions

M.L.A performed the experiments; M.L.A., F.V. and J.-P.L. analyzed the data; J.-P.L. devised the project; M.L.A., F.V. and J.-P.L. wrote the paper. All authors approved the final manuscript.

Conflicts of Interest

The authors declare no conflict of interest.

References

  1. Brown, G.; Segerlind, L.; Summitt, R. Near-infrared reflectance of bruised apples. Trans. Am. Soc. Agric. Eng. 1974, 17, 17–19. [Google Scholar] [CrossRef]
  2. Mollazade, K.; Omid, M.; Tab, F.A.; Mohtasebi, S.S. Principles and Applications of Light Backscattering Imaging in Quality Evaluation of Agro-food Products: A Review. Food Bioprocess Technol. 2012, 5, 1465–1485. [Google Scholar] [CrossRef]
  3. Nicolaï, B.M.; Beullens, K.; Bobelyn, E.; Peirs, A.; Saeys, W.; Theron, K.I.; Lammertyn, J. Nondestructive measurement of fruit and vegetable quality by means of NIR spectroscopy: A review. Postharvest Biol. Technol. 2007, 46, 99–118. [Google Scholar] [CrossRef]
  4. Zude, M. Optical Monitoring of Fresh and Processed Agricultural Crops; CRC: Boca Ratom, FL, USA, 2008. [Google Scholar]
  5. Cubero, S.; Aleixos, N.; Moltó, E.; Gómez-Sanchis, J.; Blasco, J. Advances in machine vision applications for automatic inspection and quality evaluation of fruits and vegetables. Food Bioprocess Technol. 2011, 4, 487–504. [Google Scholar] [CrossRef]
  6. Tuchin, V.V.; Maksimova, I.L.; Zimnyakov, D.A.; Kon, I.L.; Mavlyutov, A.H.; Mishin, A.A. Light propagation in tissues with controlled optical properties. J. Biomed. Opt. 1997, 2, 401–417. [Google Scholar] [CrossRef] [PubMed]
  7. Baranyai, L.; Zude, M. Analysis of laser light propagation in kiwifruit using backscattering imaging and Monte Carlo simulation. Comput. Electron. Agric. 2009, 69, 33–39. [Google Scholar] [CrossRef]
  8. Birth, G.S. How light interacts with foods. In Quality Detection in Foods; ASAE: St. Joseph, MI, USA, 1976. [Google Scholar]
  9. Mireei, S. Nondestructive Determination of Effective Parameters on Maturity of Mozafati & Shahani Date Fruits by NIR Spectroscopy Technique. Ph.D. Thesis, Department of Mechanical Engineering of Agricultural Machinery, University of Tehran, Tehran, Iran, 2010. [Google Scholar]
  10. Martelli, F.; Del Bianco, S.; Ismaelli, A.; Zaccanti, G. Light Propagation through Biological Tissue and Other Diffusive Media; SPIE Press: Bellingham, WA, USA, 2010. [Google Scholar]
  11. McGlone, V.; Abe, H.; Kawano, S. Kiwifruit firmness by near infrared light scattering. J. Near Infrared Spectrosc. 1997, 5, 83–90. [Google Scholar] [CrossRef]
  12. Mourant, J.R.; Fuselier, T.; Boyer, J.; Johnson, T.M.; Bigio, I.J. Predictions and measurements of scattering and absorption over broad wavelength ranges in tissue phantoms. Appl. Opt. 1997, 36, 949–957. [Google Scholar] [CrossRef] [PubMed]
  13. Taroni, P.; Pifferi, A.; Torricelli, A.; Comelli, D.; Cubeddu, R. In vivo absorption and scattering spectroscopy of biological tissues. Photochem. Photobiol. Sci. 2003, 2, 124–129. [Google Scholar] [CrossRef] [PubMed]
  14. Gibson, A.; Hebden, J.; Arridge, S.R. Recent advances in diffuse optical imaging. Phys. Med. Biol. 2005, 50. [Google Scholar] [CrossRef]
  15. Contini, D.; Martelli, F.; Zaccanti, G. Photon migration through a turbid slab described by a model based on diffusion approximation. I. Theory. Appl. Opt. 1997, 36, 4587–4599. [Google Scholar] [CrossRef] [PubMed]
  16. Farrell, T.J.; Patterson, M.S.; Wilson, B. A diffusion theory model of spatially resolved, steady-state diffuse reflectance for the noninvasive determination of tissue optical properties in vivo. Med. Phys. 1992, 19, 879–888. [Google Scholar] [CrossRef] [PubMed]
  17. Kienle, A.; Lilge, L.; Patterson, M.S.; Hibst, R.; Steiner, R.; Wilson, B.C. Spatially resolved absolute diffuse reflectance measurements for noninvasive determination of the optical scattering and absorption coefficients of biological tissue. Appl. Opt. 1996, 35, 2304–2314. [Google Scholar] [CrossRef] [PubMed]
  18. Cen, H.; Lu, R. Quantification of the optical properties of two-layer turbid materials using a hyperspectral imaging-based spatially-resolved technique. Appl. Opt. 2009, 48, 5612–5623. [Google Scholar] [CrossRef] [PubMed]
  19. Becker, W. Advanced Time-Correlated Single Photon Counting Techniques; Springer Science & Business Media: Berlin/Heidelberg, Germany, 2005. [Google Scholar]
  20. Cubeddu, R.; D’Andrea, C.; Pifferi, A.; Taroni, P.; Torricelli, A.; Valentini, G.; Dover, C.; Johnson, D.; Ruiz-Altisent, M.; Valero, C. Nondestructive quantification of chemical and physical properties of fruits by time-resolved reflectance spectroscopy in the wavelength range 650–1000 nm. Appl. Opt. 2001, 40, 538–543. [Google Scholar] [CrossRef] [PubMed]
  21. Cubeddu, R.; D’Andrea, C.; Pifferi, A.; Taroni, P.; Torricelli, A.; Valentini, G.; Ruiz-Altisent, M.; Valero, C.; Ortiz, C.; Dover, C. Time-resolved reflectance spectroscopy applied to the nondestructive monitoring of the internal optical properties in apples. Appl. Spectrosc. 2001, 55, 1368–1374. [Google Scholar] [CrossRef] [Green Version]
  22. Qin, J.; Lu, R. Measurement of the optical properties of fruits and vegetables using spatially resolved hyperspectral diffuse reflectance imaging technique. Postharvest Biol. Technol. 2008, 49, 355–365. [Google Scholar] [CrossRef]
  23. Valero, C.; Barreiro, P.; Ruiz-Altisent, M.; Cubeddu, R.; Pifferi, A.; Taroni, P.; Torricelli, A.; Valentini, G.; Johnson, D.; Dover, C. Mealiness detection in apples using time resolved reflectance spectroscopy. J. Texture Stud. 2005, 36, 439–458. [Google Scholar] [CrossRef] [Green Version]
  24. Valero, C.; Ruiz-Altisent, M.; Cubeddu, R.; Pifferi, A.; Taroni, P.; Torricelli, A.; Valentini, G.; Johnson, D.; Dover, C. Selection models for the internal quality of fruit, based on time domain laser reflectance spectroscopy. Biosyst. Eng. 2004, 88, 313–323. [Google Scholar] [CrossRef] [Green Version]
  25. Vanoli, M.; Eccher Zerbini, P.; Grassi, M.; Rizzolo, A.; Fibiani, M.; Zanella, A.; Pifferi, A.; Spinelli, S.; Torricelli, A.; Cubeddu, R. The quality and storability of apples cv.'Jonagored'selected at-harvest by time-resolved reflectance spectroscopy. Acta Hortic. 2005, 682, 1481–1488. [Google Scholar] [CrossRef]
  26. Vanoli, M.; Rizzolo, A.; Grassi, M.; Zanella, A.; Torricelli, A.; Spinelli, L.; Eccher Zerbini, P. Relationship between scattering properties as measured by Time-resolved Reflectance Spectroscopy and quality in apple fruit, 3rd CIGR Section VI. In Proceedings of the International Symposium on Food and Agricultural Products: Processing and Innovations, Naples, Italy, 24–26 September 2007; pp. 24–26.
  27. Vanoli, M.; Rizzolo, A.; Zanella, A.; Grassi, M.; Spinelli, L.; Cubeddu, R.; Torricelli, A. Apple texture in relation to optical, physical and sensory properties. In Proceedings of the InsideFood Symposium, Leuven, Belgium, 9–12 April 2013; p. 32.
  28. Peng, Y.; Lu, R. Improving apple fruit firmness predictions by effective correction of multispectral scattering images. Postharvest Biol. Technol. 2006, 41, 266–274. [Google Scholar] [CrossRef]
  29. Qing, Z.; Ji, B.; Zude, M. Predicting soluble solid content and firmness in apple fruit by means of laser light backscattering image analysis. J. Food Eng. 2007, 82, 58–67. [Google Scholar] [CrossRef]
  30. Saeys, W.; Velazco-Roa, M.A.; Thennadil, S.N.; Ramon, H.; Nicolaï, B.M. Optical properties of apple skin and flesh in the wavelength range from 350 to 2200 nm. Appl. Opt. 2008, 47, 908–919. [Google Scholar] [CrossRef] [PubMed]
  31. Nguyen Do Trong, N.; Rizzolo, A.; Herremans, E.; Vanoli, M.; Cortellino, G.; Erkinbaev, C.; Tsuta, M.; Spinelli, L.; Contini, D.; Torricelli, A. Optical properties–microstructure–texture relationships of dried apple slices: Spatially resolved diffuse reflectance spectroscopy as a novel technique for analysis and process control. Innov. Food Sci. Emerg. Technol. 2014, 21, 160–168. [Google Scholar] [CrossRef] [Green Version]
  32. Zamora-Rojas, E.; Garrido-Varo, A.; Aernouts, B.; Pérez-Marín, D.; Saeys, W.; Yamada, Y.; Guerrero-Ginel, J.E. Understanding near infrared radiation propagation in pig skin reflectance measurements. Innov. Food Sci. Emerg. Technol. 2014, 22, 137–146. [Google Scholar] [CrossRef]
  33. Vaudelle, F.; L’Huillier, J.-P. Influence of the size and skin thickness of apple varieties on the retrieval of internal optical properties using Vis/NIR spectroscopy: A Monte Carlo-based study. Comput. Electron. Agric. 2015, 116, 137–149. [Google Scholar] [CrossRef]
  34. Askoura, M.L.; Vaudelle, F.; L’Huillier, J.-P. Numerical Study of Light Transport in Apple Models Based on Monte Carlo Simulations. Photonics 2016, 3, 2. [Google Scholar] [CrossRef]
  35. Hashim, N.; Pflanz, M.; Regen, C.; Janius, R.B.; Rahman, R.A.; Osman, A.; Shitan, M.; Zude, M. An approach for monitoring the chilling injury appearance in bananas by means of backscattering imaging. J. Food Eng. 2013, 116, 28–36. [Google Scholar] [CrossRef] [Green Version]
  36. Qing, Z.; Ji, B.; Zude, M. Non-destructive analyses of apple quality parameters by means of laser-induced light backscattering imaging. Postharvest Biol. Technol. 2008, 48, 215–222. [Google Scholar] [CrossRef]
  37. Peng, Y.; Lu, R. Analysis of spatially resolved hyperspectral scattering images for assessing apple fruit firmness and soluble solids content. Postharvest Biol. Technol. 2008, 48, 52–62. [Google Scholar] [CrossRef]
  38. Lorente, D.; Zude, M.; Idler, C.; Gómez-Sanchis, J.; Blasco, J. Laser-light backscattering imaging for early decay detection in citrus fruit using both a statistical and a physical model. J. Food Eng. 2015, 154, 76–85. [Google Scholar] [CrossRef]
  39. Yousaf, S.; Qin, S.Y. Specularity Removal for Single Image Based on Inpainting and Blending with Parameter Estimation by Neural Networks over Multiple Feature Spaces. Appl. Mech. Mater. 2014, 555, 773–780. [Google Scholar] [CrossRef]
  40. Kortüm, G.; Lohr, J.E. Reflectance Spectroscopy: Principles, Methods, Applications; Springer: New York, NY, USA, 1969. [Google Scholar]
  41. Tuchin, V.V. Tissue Optics: Light Scattering Methods and Instruments for Medical Diagnosis; SPIE Press: Bellingham, WA, USA, 2000. [Google Scholar]
  42. Lammertyn, J.; Peirs, A.; De Baerdemaeker, J.; Nicolaı, B. Light penetration properties of NIR radiation in fruit with respect to non-destructive quality assessment. Postharvest Biol. Technol. 2000, 18, 121–132. [Google Scholar] [CrossRef]
  43. Deulin, X.; L’Huillier, J. Finite element approach to photon propagation modeling in semi-infinite homogeneous and multilayered tissue structures. Eur. Phys. J. Appl. Phys. 2006, 33, 133–146. [Google Scholar] [CrossRef]
  44. Van Beers, R.; Aernouts, B.; Gutiérrez, L.L.; Erkinbaev, C.; Rutten, K.; Schenk, A.; Nicolaï, B.; Saeys, W. Optimal illumination-detection distance and detector size for predicting Braeburn apple maturity from Vis/NIR laser reflectance measurements. Food Bioprocess Technol. 2015, 8, 2123–2136. [Google Scholar] [CrossRef]
  45. Wang, S.; Huang, M.; Zhu, Q. Model fusion for prediction of apple firmness using hyperspectral scattering image. Comput. Electron. Agric. 2012, 80, 1–7. [Google Scholar] [CrossRef]
  46. Homutova, I.; Blažek, J. Differences in fruit skin thickness between selected apple (Malus domestica Borkh.) cultivars assessed by histological and sensory methods. Hortic. Sci. 2006, 33, 108–113. [Google Scholar]
  47. Merzlyak, M.N.; Solovchenko, A.E.; Gitelson, A.A. Reflectance spectral features and non-destructive estimation of chlorophyll, carotenoid and anthocyanin content in apple fruit. Postharvest Biol. Technol. 2003, 27, 197–211. [Google Scholar] [CrossRef]
  48. Sadar, N.; Urbanek-Krajnc, A.; Unuk, T. Spectrophotometrically determined pigment contents of intact apple fruits and their relations with quality: A review. Zemdirbyste (Agriculture) 2013, 100, 105–111. [Google Scholar] [CrossRef]
  49. Delgado-Pelayo, R.; Gallardo-Guerrero, L.; Hornero-Méndez, D. Chlorophyll and carotenoid pigments in the peel and flesh of commercial apple fruit varieties. Food Res. Int. 2014, 65, 272–281. [Google Scholar] [CrossRef]
  50. Askoura, M.L.; Piron, V.; Vaudelle, F.; L’Huillier, J.-P.; Madieta, E.; Mehinagic, E. Experimental investigation on light propagation through apple tissue structures. In Proceedings of the SPIE 9542, Medical Laser Applications and Laser-Tissue Interactions VII, Munich, Germany, 21–25 June 2015.
  51. Cen, H.; Lu, R.; Mendoza, F.; Beaudry, R.M. Relationship of the optical absorption and scattering properties with mechanical and structural properties of apple tissue. Postharvest Biol. Technol. 2013, 85, 30–38. [Google Scholar] [CrossRef]
  52. Rowe, P.I.; Künnemeyer, R.; McGlone, A.; Talele, S.; Martinsen, P.; Seelye, R. Relationship between tissue firmness and optical properties of ‘Royal Gala’ apples from 400 to 1050 nm. Postharvest Biol. Technol. 2014, 94, 89–96. [Google Scholar] [CrossRef]
Figure 1. Experimental setup used for recording diffuse reflectance images from (a) a whole apple sample; and (b) a half-cut apple sample.
Photonics 03 00050 g001
Figure 2. (a) Original image captured from Golden Delicious irradiated at the wavelength of 852 nm; (b) specular light removed; (c) RGB color image; (d) processed image; (e) fits of the average profiles as calculated from image (d) with Equation (2); and (f) typical curve fitting using Equation (3).
Photonics 03 00050 g002
Figure 3. Processed backscattering images. (a,b) Granny Smith with and without skin at 633 nm; (c,d) Granny Smith with and without skin at 852 nm; (e,f) Golden Delicious with and without skin at 763 nm; and (g,h) Royal Gala with and without skin at 784 nm.
Photonics 03 00050 g003
Figure 4. Reflectance profiles acquired on apple samples with and without skin. (a) Granny Smith at 633 nm; (b) Golden Delicious at 763 nm; (c) Royal Gala at 784 nm; and (d) Granny Smith at 852 nm.
Photonics 03 00050 g004
Figure 5. Evolution of the ratios (a) αR and (b) αF as a function of the wavelength, for three apple cultivars with and without skin.
Photonics 03 00050 g005
Figure 6. Backscattering images acquired over the cut equatorial plane of a Granny Smith illuminated by a light source located at z = −3 mm, and emitting at 633 nm. (a) Apple with skin; (b) apple without skin; and (c) extracted reflectance profiles from the backscattering images.
Photonics 03 00050 g006
Figure 7. Effect of the source location on the reflectance profiles as measured on the equatorial plane of a half-cut Royal Gala, with and without skin and irradiated at 633 nm.
Photonics 03 00050 g007
Figure 8. Plots of the total reflection ratio α R * as a function of the wavelength, for three apple cultivars with and without skin.
Photonics 03 00050 g008
Figure 9. (a) Web diagrams related to the five ratios (αR, α*R, αM, α*M, α<R>) for the three apple cultivars Royal Gala, Golden Delicious and Granny Smith tested at four wavelengths 633, 763, 784, and 852 nm; (b) Pigment index (CI) estimated with and without skin.
Photonics 03 00050 g009
Table 1. Peak reflectance value (Rmax) and full-width at half maximum (FWHM) related to each studied apple cultivar.
Apples633 nm763 nm784 nm852 nm
Rmax (mm−2)FWHM (mm)Rmax (mm−2)FWHM (mm)Rmax (mm−2)FWHM (mm)Rmax (mm−2)FWHM (mm)
Gala_with skin12.98 ± 7 a6.52 ± 2 a09.51 ± 3 a3.28 ± 1 a11.14 ± 6 a5.38 ± 3 a13.35 ± 6 a4.41 ± 2 a
Gala_without skin11.18 ± 6 a6.64 ± 3 a09.15 ± 6 a1.85 ± 1 a07.16 ± 3 b2.77 ± 2 a08.69 ± 3 b3.18 ± 1 a
Granny_with skin14.07 ± 3 a2.75 ± 1 b14.71 ± 8 a1.84 ± 1 a13.04 ± 6 a2.14 ± 1 b13.91 ± 6 a1.5 ± 1 a
Granny_without skin11.26 ± 5 b5.41 ± 1 a10.04 ± 4 a4.05 ± 1 a10.18 ± 4 b4.84 ± 2 a11.01 ± 5 a2.43 ± 1 a
Golden_with skin11.78 ± 3 a3.23 ± 1 a12.47 ± 8 a2.87 ± 1 a11.25 ± 5 a2.61 ± 1 a08.13 ± 1 a1.69 ± 1 a
Golden_without skin10.06 ± 5 a4.13 ± 2 a7.62 ± 4 b4.32 ± 1 a08.40 ± 6 a3.70 ± 1 a10.51 ± 5 a2.71 ± 1 a
Different lowercase letters (a,b) indicate statistical difference between Rmax or FWHM values for each apple cultivar with and without skin layer at p-value < 0.05 obtained from student’s t-test.
Table 2. Retrieved optical properties of three apple cultivars (Royal Gala, Golden Delicious and Granny Smith) with and without skin, irradiated at four wavelengths (633, 763, 784 and 852 nm).
λ (nm) Cultivar
GalaGoldenGranny
μa (mm−1)μ′s (mm−1)μa (mm−1)μ′s (mm−1)μa (mm−1)μ′s (mm−1)
633With skin0.0185 a,C,11.144 a,C,10.024 a,B,11.243 a,A,10.0361 a,A,11.131 a,B,1
Without skin0.0152 b,C,21.140 a,B,10.0212 b,B,11.240 a,A,10.0275 b,A,11.125 b,B,1
763With skin0.01582 a,A,41.082 a,C,20.0113 a,B,31.139 a,A,20.0149 a,AB,31.101 a,B,2
Without skin0.01435 b,B,31.081 a,C,20.0085 b,B,31.132 b,A,20.0125 b,AB,31.098 b,B,2
784With skin0.01597 a,A,31.068 a,B,30.0091 a,B,41.125 a,A,30.0136 a,AB,41.065 a,B,3
Without skin0.01425 b,A,41.060 a,B,30.0082 b,B,31.121 a,A,30.0121 b,AB,31.061 a,B,3
852With skin0.01710 a,B,21.009 a,B,40.0150 a,C,21.120 a,A,40.0188 a,A,21.018 a,B,4
Without skin0.01652 b,B,10.991 a,C,30.0137 b,C,21.118 a,A,40.01581 b,A,21.015 a,B,4
Different lowercase letters (a,b) indicate statistical difference between apple optical properties (µa, or µ's) with and without skin for each apple cultivar and at fixed wavelength (p < 0.05 level; Student’s t-test). Different uppercase letters (A–C) indicate statistical difference between apple optical properties (µa, or µ's) for the three apple cultivars at a fixed wavelength (p < 0.05 level; Tukey multiple comparison test). The statistical difference between optical parameters (µa, or µ's) of apple cultivars (with and without skin), and studied at four wavelengths (1–4), are significant in vertical columns (p < 0.001 level; Tukey multiple comparison test).

