Communication

Photodynamic Therapy-Induced Microvascular Changes in a Nonmelanoma Skin Cancer Model Assessed by Photoacoustic Microscopy and Diffuse Correlation Spectroscopy

1
Department of Biomedical, Industrial & Human Factors Engineering, Wright State University, Dayton, OH 45432, USA
2
Department of Cell Stress Biology, Roswell Park Cancer Institute, Buffalo, NY 14263, USA
3
Department of Biomedical Engineering, Baskent University, Baglıca, Ankara 06810, Turkey
4
Department of Biomedical Engineering, University at Buffalo, Buffalo, NY 14260, USA
*
Author to whom correspondence should be addressed.
Photonics 2016, 3(3), 48; https://doi.org/10.3390/photonics3030048
Submission received: 18 July 2016 / Revised: 31 July 2016 / Accepted: 2 August 2016 / Published: 5 August 2016

Abstract

:
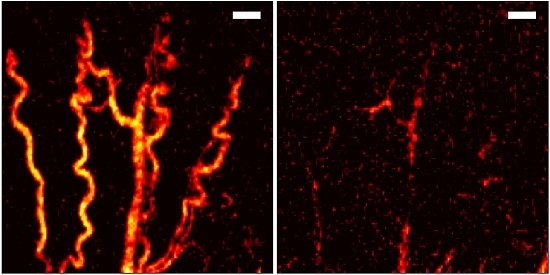
One of the main mechanisms of action for photodynamic therapy (PDT) is the destruction of tumor vasculature. We observed the PDT-induced vasculature destruction in a mouse model of skin cancer using two techniques: Photoacoustic microscopy (PAM) and diffuse correlation spectroscopy (DCS). PAM showed high-resolution images of the abnormal microvasculature near the establishing tumor area at pre-PDT, as well as the subsequent destruction of those vessels post-PDT. DCS indicated a significant blood flow decrease after PDT, confirming the vascular destruction. Noninvasive assessment of vascular changes may be indicative of therapy response.

Graphical Abstract

1. Introduction

Nonmelanoma skin cancers (NMSCs), including basal cell carcinoma (BCC) and squamous cell carcinoma (SCC), are the most common human cancer with more than five million cases treated every year [1]. Although they rarely metastasize, their management has become a real challenge to the health care system due to extensive treatment costs [2]. In a significant portion of cases, the tumors can originate in highly visible areas, such as the head and neck areas, including the face, and, thus, surgical management may not be the most attractive option. Cryotherapy, laser and photodynamic therapy (PDT) or a combination thereof may be an attractive alternative treatment option for the management of NMSCs with good to excellent cosmetic outcomes [3].
Among these treatment alternatives we have been investigating PDT at preclinical and clinical settings as a viable option for the management of NMSCs [4,5,6]. PDT is a light-based therapy for tumor destruction that requires a combination of light, photosensitizer (PS) and oxygen [7,8]. Tumor destruction can be obtained by vascular shutdown, direct cell kill, activation of host immune response, or a combination of these mechanisms [9,10]. Most PSs localize in the endothelium and can induce substantial vascular changes during PDT, making microvasculature changes a good target for monitoring the efficacy of PDT [6,11,12,13,14,15,16]. We have shown recently that blood flow changes assessed with diffuse correlation spectroscopy (DCS), a diffuse optical spectroscopy method to quantify tissue blood flow, can be indicative of PDT efficacy [17].
Photoacoustic microscopy (PAM) can provide high-resolution images of microvasculature [18,19,20,21], making it an attractive modality for monitoring PDT. Xiang et al. used photoacoustic tomography for monitoring the vascular damage caused by PDT on a chicken embryo chorioallantoic membrane (CAM) tumor model [22], although this setup does not readily translate to the clinic. Shao et al. recently used PAM for PDT monitoring [23] in both a CAM and rat ear model, although neither model involved a tumor. Here we implemented PAM for noninvasive monitoring of PDT in a transgenic mouse model of skin cancer [4,24]. We imaged the microvasculature nearby a spontaneous BCC on a mouse ear before, during and after PDT to assess the changes in the microvasculature. We also utilized diffuse correlation spectroscopy (DCS) to measure the blood flow changes caused by PDT to investigate potential correlation between microvasculature structure and function.

2. Materials and Methods

2.1. Animal and Tumor Model

All animal experiments followed protocols approved by the IACUC of Roswell Park Cancer Institute (RPCI). Transgenic K5-Gli mice, which develop spontaneous BCCs, were acquired from Dr. Andrezj Dlugosz at the University of Michigan and bred in our domestic colony [24]. Overexpression of Gli2 leads to increased activation of the Sonic hedgehog (Shh) pathway and increased activation of Shh has been associated with BCCs in both human tumors and animal models [25]. Transgenic K5-Gli mice overexpress the Gli2 transcription factor in the epidermal basal layer and outer root sheath of the hair follicles, developing spontaneous basal cell carcinomas (BCC) histologically similar to human BCCs [26].

2.2. Custom PAM Imaging Setup

Our PAM setup utilized a 2D galvo scanning mirror system for raster scanning of laser source [20,27]. A 532-nm pulsed laser (LUCE 820, Bright Solutions, Pavia, Italy) operating at 5 kHz was steered through two achromatic lenses (f = 40 mm and 200 mm; AC254-040-A-ML and AC254-200-A-ML, Thorlabs, Newton, NJ, USA) to expand and collimate the beam. A 92/8 beam splitter (CM1-BP108, Thorlabs) directed a small portion of the light to a photodiode (DET10A, Thorlabs) to measure the power of each pulse for normalization. The main beam was then directed to a 2D galvanometer scanning system (GVS002, Thorlabs) and focused onto the target using a 40-mm achromat (AC254-040-A-ML, Thorlabs) as an objective. The maximum energy density of the focused laser was 70 mJ/cm2, which is above the ANSI safety limit. A water tank was placed above the target for an unfocused transducer (10 MHz, A311S-SU, Olympus, Waltham, MA, USA). The PA signal was filtered and amplified before being digitized and saved by the computer. The water tank was positioned so that the laser spot was focused on an imaging window in the bottom, which was covered with clear plastic (Saran wrap, Johnson & Johnson, New Brunswick, NJ, USA). Ultrasound gel was applied to the target, which was in contact with the underside of the imaging window. For each scan the galvo steered the beam and at each stop multiple A-lines were acquired for averaging. The scan followed a raster pattern, scanning all points in the x direction before transferring the data for saving, returning to the initial x position and incrementing 1 step in the y direction for the next line. Each line in the x direction took approximately 1.7 s and each step in the y direction took approximately 190 ms and an entire scan took a little under 8 min. A picture of the setup is shown in Figure 1a and a schematic is shown in Figure 1b.
To determine the resolution of our system, we scanned a 1951 USAF resolution target (R1DS1P, Thorlabs). The resolution target was placed under the imaging window and gel was applied to ultrasonically couple it ultrasonically couple it to the plastic. The scan was centered on group 5 of the target with the long axis of the scan perpendicular to the line-pairs.

2.3. Custom Diffuse Correlation Spectroscopy (DCS) Setup

We used DCS to monitor changes in blood flow caused by PDT [16,28,29,30,31,32,33,34,35]. Briefly, the DCS setup consisted of a long coherence length, 785 nm laser (CrystaLaser), four photon-counting detectors (Perkin Elmer, Waltham, MA, USA) and a custom-built autocorrelator board (Correlator.com). The source was directed to the tissue by a multi-mode source fiber (400 μm core diameter) and collected with single-mode detector fibers (5 μm core diameter). The outputs from the photodetectors were sent to the correlator board to determine the intensity autocorrelation function and photon arrival times, which were then saved by the computer. The source-detector (SD) separations were 0.6, 1.0, 1.2 and 1.6 mm, providing a measure of blood flow at various depths in the tissue. Five measurements were acquired from multiple locations within the treatment area and relative blood flow (rBF) is reported as the mean and standard deviation of the change in blood flow from Pre-PDT.

2.4. PAM and DCS Measurements during PDT

A mouse from the breeding colony with a tumor at its ear was anesthetized with isoflurane and placed on a heating pad under the water tank. Ultrasound coupling gel was placed on the ear and the mouse was raised until the gel made contact with the imaging window. Pre-PDT PAM and DCS measurements were performed on the target area of the ear. The photosensitizer 2-(1-hexyloxyethyl)-2-devinyl pyropheophorbide-a (HPPH) in dextrose 5% in water (D5W), 0.47 μmol/kg [36] was injected via the tail vein. Figure 1c shows a picture of the experimental setup during PDT treatment. Pre-PDT PAM was performed before HPPH injection to minimize any photodynamic effect caused by the PAM laser. After a 1-h drug-light interval, 665 nm treatment light from a fiber-coupled argon-pumped dye laser was centered on the target area of the ear (red circle in Figure 1d). The fluence rate for the treatment light was 43 mW/cm2. After 1 min, treatment was paused while PAM and DCS measurements were performed to observe any early vascular changes. Measurements were only acquired at one time point during PDT to minimize any photodynamic effect from the PAM laser. Treatment then proceeded for nine more minutes for a total treatment time of 10 min.
After light treatment, Post-PDT PAM and DCS measurements were performed on the target area. PAM images were shown as the maximum intensity projection (MIP) of each scan and each scan imaged the same area of the ear (5 mm × 5 mm, 20 μm step size). To quantify the change in vascularity due to PDT, vascular area was calculated as the percent area of the image above a certain threshold PA signal (3× the mean of the image). Vessel diameter was determined from the PAM images by using an edge detection method (Sobel, Matlab) to visualize the vessel boundaries and calculating the average widths of the same vessels visible at all three time points.

3. Results

Our PAM scanner was capable of resolving group 5, element 6 of the 1951 USAF resolution target (Figure 2a), indicating that the system had a resolution of 8.8 μm. Figure 2b shows the MIP and Figure 2c shows the corresponding PA signal.
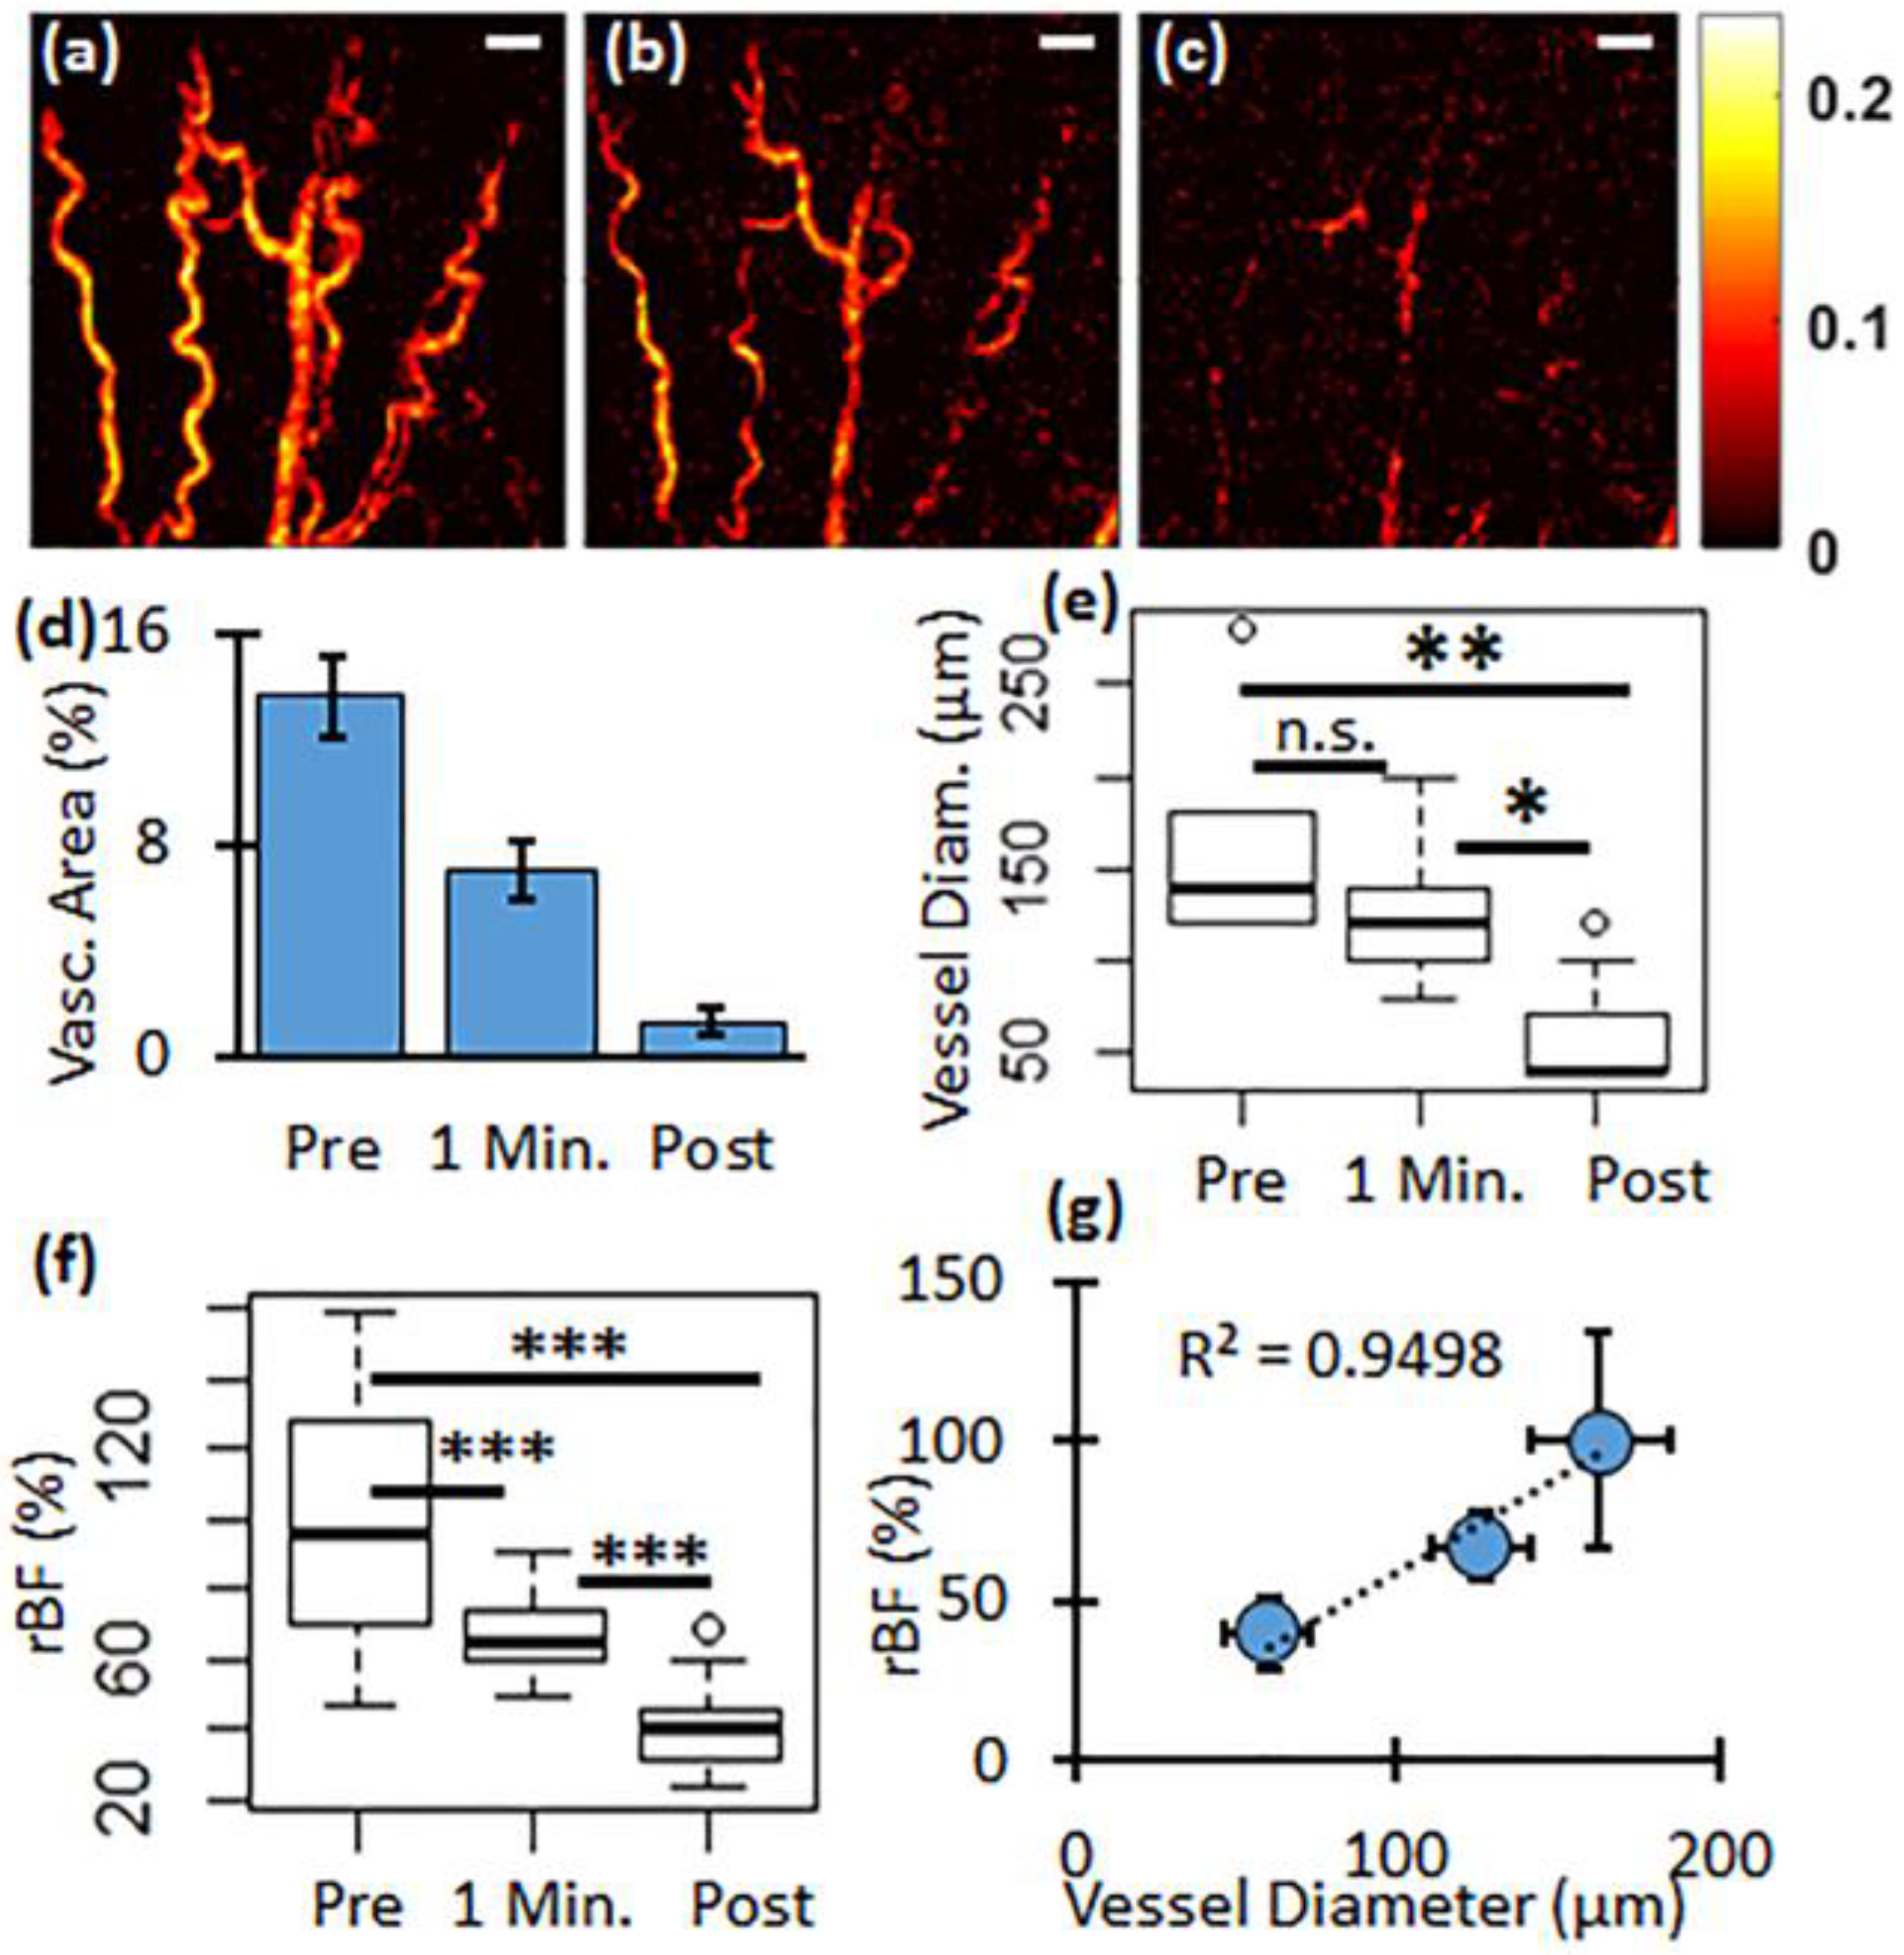
As shown in Figure 3, we observed PDT-induced vascular changes with PAM. Figure 3a shows the vascular map at pre-PDT. After one minute of treatment, there was a vascular shut-down, clearly visible in Figure 3b. The vascular area decreased 49% (from 13.60% to 6.95%, p = 0.0004) while the average vessel diameter decreased 23% (from 162.9 ± 22.0 to 125.7 ± 15.6 µm). After ten minutes of light treatment, there was a substantial vascular shutdown (Figure 3c). The vascular area decreased >90% (from 13.60% to 1.29%, p = 8.2 × 10⁻⁵) and the average vessel diameter decreased 63% (from 162.9 ± 22.0 to 60.0 ± 13.1 µm, p = 0.003). These results are shown in Figure 3d,e.
We also observed PDT-induced blood flow changes (rBF) quantified by DCS, as summarized in Figure 3f. After one minute, rBF decreased 33% (100% ± 34% to 67% ± 10%, p = 0.0007). After ten minutes of treatment rBF decreased 60% (100% ± 34% to 40% ± 11%, p = 2.8 × 10⁻⁹). We also investigated whether vascular ischemia visualized by PAM correlated with the blood flow changes. As observed before [22,23], we also measured a PDT induced vessel diameter decrease. As shown in Figure 3g, a linear relationship was observed between the changes in vessel diameter and rBF (r2 = 0.95).

4. Discussion

Qualitatively, there are few intact vessels visible in the post-PDT PAM image, while the pre-PDT PAM image has several vessels and branches visible. Quantitatively, this is seen in the >90% and 63% decrease in vascular area and vessel diameter, respectively, assessed with PAM and 60% decrease in blood flow assessed with DCS. The two techniques provided complimentary assessment of vascular destruction. There was a clear linear relationship between vascular parameters assessed with PAM and DCS.
Despite the high resolution of the PAM imaging system, we could not measure very small capillaries. There may be several reasons for this observation. First, our in vivo step size was 20 μm in order to cover a larger area with the scan, which decreased the observable resolution limit. Second, the mice overexpress the Gli2 transcription factor in the epidermal basal layer, which makes the whole mouse ear skin thicker than that in healthy mice and gives the appearance of a rash. Thus, photon diffusion is expected to dominate in deeper layer of the ear skin, resulting in lower resolution and making it harder to image smaller microvessels. Third, no optical clearing agents were used; thus, we expect the optical scattering in the ear skin was high. In addition, since the focal distance is very critical to obtain the highest resolution imaging, rough tissue surface due to diseased skin in Gli mice might have resulted in the variations in the focal length, which will affect the spot size. As Li et al. have shown, a slight difference in height caused by a tumor can make an area appear devoid of vessels and correcting the height of the scanner allows for improved visualization of microvasculature [37]. We will be adapting our system and algorithm to accommodate these types of physiological variations.

5. Conclusions

In this communication, we present results from a custom-built PAM and DCS system for monitoring vascular changes during PDT in a mouse model of spontaneous skin cancer. PAM showed vascular shutdown as seen by the decreased vessel area and vessel diameter post-PDT, while DCS indicated substantial blood flow decrease complementing this vascular shut-down.

Acknowledgments

We thank Dan Muffoletto for his help with instrument setup and Connor Walsh for help during the measurements. We also thank grant supports by P30CA16056, CA55791 and the Ohio Third Frontier to the Ohio Imaging Research and Innovation Network (OIRAIN).

Author Contributions

U.S. conceived and designed the experiments; D.R. and H.S. performed the experiments; M.A. and D.R. analyzed the data; D.R. and U.S. wrote the paper.

Conflicts of Interest

The authors declare no conflict of interest. The funding sponsors had no role in the design of the study; in the collection, analyses, or interpretation of data; in the writing of the manuscript, and in the decision to publish the results.

References

  1. Rogers, H.W.; Weinstock, M.A.; Feldman, S.R.; Coldiron, B.M. Incidence estimate of nonmelanoma skin cancer (keratinocyte carcinomas) in the U.S. Population, 2012. JAMA Dermatol. 2015, 151, 1081–1086. [Google Scholar] [CrossRef] [PubMed]
  2. Guy, G.P., Jr.; Machlin, S.R.; Ekwueme, D.U.; Yabroff, K.R. Prevalence and costs of skin cancer treatment in the U.S., 2002–2006 and 2007–2011. Am. J. Prev. Med. 2015, 48, 183–187. [Google Scholar] [CrossRef] [PubMed]
  3. Lanoue, J.; Goldenberg, G. Basal cell carcinoma: A comprehensive review of existing and emerging nonsurgical therapies. J. Clin. Aesthet. Dermatol. 2016, 9, 26–36. [Google Scholar] [PubMed]
  4. Sunar, U.; Rohrbach, D.J.; Morgan, J.; Zeitouni, N.; Henderson, B.W. Quantification of PplX concentration in basal cell carcinoma and squamous cell carcinoma models using spatial frequency domain imaging. Biomed. Opt. Express 2013, 4, 531–537. [Google Scholar] [CrossRef] [PubMed]
  5. Zeitouni, N.C.; Sunar, U.; Rohrbach, D.J.; Paquette, A.D.; Bellnier, D.A.; Shi, Y.; Wilding, G.; Foster, T.H.; Henderson, B.W. A prospective study of pain control by a 2-step irradiance schedule during topical photodynamic therapy of nonmelanoma skin cancer. Dermatol. Surg. 2014, 40, 1390–1394. [Google Scholar] [CrossRef] [PubMed]
  6. Becker, T.L.; Paquette, A.D.; Keymel, K.R.; Henderson, B.W.; Sunar, U. Monitoring blood flow responses during topical ALA-PDT. Biomed. Opt. Express 2010, 2, 123–130. [Google Scholar] [CrossRef] [PubMed]
  7. Wilson, B.C.; Patterson, M.S. The physics, biophysics and technology of photodynamic therapy. Phys. Med. Biol. 2008, 53, R61–R109. [Google Scholar] [CrossRef] [PubMed]
  8. Henderson, B.W.; Dougherty, T.J. How does photodynamic therapy work? Photochem. Photobiol. 1992, 55, 145–157. [Google Scholar] [CrossRef] [PubMed]
  9. Henderson, B.W.; Busch, T.M.; Snyder, J.W. Fluence rate as a modulator of PDT mechanisms. Lasers Surg. Med. 2006, 38, 489–493. [Google Scholar] [CrossRef] [PubMed]
  10. Henderson, B.W.; Gollnick, S.O.; Snyder, J.W.; Busch, T.M.; Kousis, P.C.; Cheney, R.T.; Morgan, J. Choice of oxygen-conserving treatment regimen determines the inflammatory response and outcome of photodynamic therapy of tumors. Cancer Res. 2004, 64, 2120–2126. [Google Scholar] [CrossRef] [PubMed]
  11. Maas, A.L.; Carter, S.L.; Wileyto, E.P.; Miller, J.; Yuan, M.; Yu, G.; Durham, A.C.; Busch, T.M. Tumor vascular microenvironment determines responsiveness to photodynamic therapy. Cancer Res. 2012, 72, 2079–2088. [Google Scholar] [CrossRef] [PubMed]
  12. Amelink, A.; Sterenborg, H.J.; Roodenburg, J.L.; Witjes, M.J. Non-invasive measurement of the microvascular properties of non-dysplastic and dysplastic oral leukoplakias by use of optical spectroscopy. Oral Oncol. 2011, 47, 1165–1170. [Google Scholar] [CrossRef] [PubMed]
  13. Chen, B.; Pogue, B.W.; Goodwin, I.A.; O’Hara, J.A.; Wilmot, C.M.; Hutchins, J.E.; Hoopes, P.J.; Hasan, T. Blood flow dynamics after photodynamic therapy with verteporfin in the RIF-1 tumor. Radiat. Res. 2003, 160, 452–459. [Google Scholar] [CrossRef] [PubMed]
  14. Yu, G.; Durduran, T.; Zhou, C.; Wang, H.W.; Putt, M.E.; Saunders, H.M.; Sehgal, C.M.; Glatstein, E.; Yodh, A.G.; Busch, T.M. Noninvasive monitoring of murine tumor blood flow during and after photodynamic therapy provides early assessment of therapeutic efficacy. Clin. Cancer Res. 2005, 11, 3543–3552. [Google Scholar] [CrossRef] [PubMed]
  15. Rohrbach, D.J.; Rigual, N.; Tracy, E.; Keymel, K.; Cooper, M.T.; Baumann, H.; Henderson, B.W.; Sunar, U. Monitoring PDT Response of Head and Neck Lesions with Diffuse Optical Spectroscopies. Proc. SPIE 2013, 8568. [Google Scholar] [CrossRef]
  16. Yu, G. Near-infrared diffuse correlation spectroscopy in cancer diagnosis and therapy monitoring. J. Biomed. Opt. 2012, 17, 010901. [Google Scholar] [CrossRef] [PubMed]
  17. Rohrbach, D.J.; Tracy, E.C.; Walker, J.; Baumann, H.; Sunar, U. Blood flow dynamics during local photoreaction in a head and neck tumor model. Front. Phys. 2015, 3. [Google Scholar] [CrossRef]
  18. Beard, P. Biomedical photoacoustic imaging. Interface Focus 2011, 1, 602–631. [Google Scholar] [CrossRef] [PubMed]
  19. Li, G.; Maslov, K.I.; Wang, L.V. Reflection-mode multifocal optical-resolution photoacoustic microscopy. J. Biomed. Opt. 2013, 18, 030501. [Google Scholar] [CrossRef] [PubMed]
  20. Xie, Z.; Jiao, S.; Zhang, H.F.; Puliafito, C.A. Laser-scanning optical-resolution photoacoustic microscopy. Opt. Lett. 2009, 34, 1771–1773. [Google Scholar] [CrossRef] [PubMed]
  21. Zhang, H.F.; Maslov, K.; Wang, L.V. In vivo imaging of subcutaneous structures using functional photoacoustic microscopy. Nat. Protoc. 2007, 2, 797–804. [Google Scholar] [CrossRef] [PubMed]
  22. Xiang, L.; Xing, D.; Gu, H.; Yang, D.; Yang, S.; Zeng, L.; Chen, W.R. Real-time optoacoustic monitoring of vascular damage during photodynamic therapy treatment of tumor. J. Biomed. Opt. 2007, 12, 014001. [Google Scholar] [CrossRef] [PubMed]
  23. Shao, P.; Chapman, D.W.; Moore, R.B.; Zemp, R.J. Monitoring photodynamic therapy with photoacoustic microscopy. J. Biomed. Opt. 2015, 20, 106012. [Google Scholar] [CrossRef] [PubMed]
  24. Grachtchouk, M.; Mo, R.; Yu, S.; Zhang, X.; Sasaki, H.; Hui, C.C.; Dlugosz, A.A. Basal cell carcinomas in mice overexpressing Gli2 in skin. Nat. Genet. 2000, 24, 216–217. [Google Scholar] [CrossRef] [PubMed]
  25. Booth, D.R. The hedgehog signalling pathway and its role in basal cell carcinoma. Cancer Metastasis Rev. 1999, 18, 261–284. [Google Scholar] [CrossRef] [PubMed]
  26. Oro, A.E.; Higgins, K.M.; Hu, Z.; Bonifas, J.M.; Epstein, E.H., Jr.; Scott, M.P. Basal cell carcinomas in mice overexpressing sonic hedgehog. Science 1997, 276, 817–821. [Google Scholar] [CrossRef] [PubMed]
  27. Zheng, F.; Zhang, X.; Chiu, C.T.; Zhou, B.L.; Shung, K.K.; Zhang, H.F.; Jiao, S. Laser-scanning photoacoustic microscopy with ultrasonic phased array transducer. Biomed. Opt. Express 2012, 3, 2694–2699. [Google Scholar] [CrossRef] [PubMed]
  28. Carp, S.A.; Dai, G.P.; Boas, D.A.; Franceschini, M.A.; Kim, Y.R. Validation of diffuse correlation spectroscopy measurements of rodent cerebral blood flow with simultaneous arterial spin labeling MRI; towards MRI-optical continuous cerebral metabolic monitoring. Biomed. Opt. Express 2010, 1, 553–565. [Google Scholar] [CrossRef] [PubMed]
  29. Cheung, C.; Culver, J.P.; Takahashi, K.; Greenberg, J.H.; Yodh, A.G. In vivo cerebrovascular measurement combining diffuse near-infrared absorption and correlation spectroscopies. Phys. Med. Biol. 2001, 46, 2053–2065. [Google Scholar] [CrossRef] [PubMed]
  30. Mesquita, R.C.; Durduran, T.; Yu, G.; Buckley, E.M.; Kim, M.N.; Zhou, C.; Choe, R.; Sunar, U.; Yodh, A.G. Direct measurement of tissue blood flow and metabolism with diffuse optics. Philos. Trans. Ser. A Math. Phys. Eng. Sci. 2011, 369, 4390–4406. [Google Scholar] [CrossRef] [PubMed]
  31. Sunar, U.; Makonnen, S.; Zhou, C.; Durduran, T.; Yu, G.; Wang, H.W.; Lee, W.M.F.; Yodh, A.G. Hemodynamic responses to antivascular therapy and ionizing radiation assessed by diffuse optical spectroscopies. Opt. Express 2007, 15, 15507–15516. [Google Scholar] [CrossRef] [PubMed]
  32. Sunar, U.; Quon, H.; Durduran, T.; Zhang, J.; Du, J.; Zhou, C.; Yu, G.; Choe, R.; Kilger, A.; Lustig, R.; et al. Noninvasive diffuse optical measurement of blood flow and blood oxygenation for monitoring radiation therapy in patients with head and neck tumors: A pilot study. J. Biomed. Opt. 2006, 11, 064021. [Google Scholar] [CrossRef] [PubMed]
  33. Boas, D.A.; Campbell, L.E.; Yodh, A.G. Scattering and imaging with diffusing temporal field correlations. Phys. Rev. Lett. 1995, 75, 1855–1858. [Google Scholar] [CrossRef] [PubMed]
  34. Rohrbach, D.J.; Rigual, N.; Tracy, E.; Kowalczewski, A.; Keymel, K.L.; Cooper, M.T.; Mo, W.; Baumann, H.; Henderson, B.W.; Sunar, U. Interlesion differences in the local photodynamic therapy response of oral cavity lesions assessed by diffuse optical spectroscopies. Biomed. Opt. Express 2012, 3, 2142–2153. [Google Scholar] [CrossRef] [PubMed]
  35. Sunar, U.; Rohrbach, D.; Rigual, N.; Tracy, E.; Keymel, K.; Cooper, M.T.; Baumann, H.; Henderson, B.H. Monitoring photobleaching and hemodynamic responses to hpph-mediated photodynamic therapy of head and neck cancer: A case report. Opt. Express 2010, 18, 14969–14978. [Google Scholar] [CrossRef] [PubMed]
  36. Shams, M.; Owczarczak, B.; Manderscheid-Kern, P.; Bellnier, D.A.; Gollnick, S.O. Development of photodynamic therapy regimens that control primary tumor growth and inhibit secondary disease. Cancer Immunol. Immunother. 2015, 64, 287–297. [Google Scholar] [CrossRef] [PubMed]
  37. Li, L.; Yeh, C.; Hu, S.; Wang, L.; Soetikno, B.T.; Chen, R.; Zhou, Q.; Shung, K.K.; Maslov, K.I.; Wang, L.V. Fully motorized optical-resolution photoacoustic microscopy. Opt. Lett. 2014, 39, 2117–2120. [Google Scholar] [CrossRef] [PubMed]
Figure 1. Instrument setup. (a) a picture of the PAM setup; (b) a schematic of the setup and; (c) a picture of PDT being performed; (d) shows a picture of the mouse ear with the red area indicating the treatment region and the black dashed line outlining the tumor.
Photonics 03 00048 g001
Figure 2. Results of the resolution test. (a) shows group 5, elements 1–6 of the 1951 USAF target; (b) shows the PAM image of elements 3–6 and (c) shows the PA signal along a representative line of the image.
Photonics 03 00048 g002
Figure 3. In vivo results. (a) Pre-PDT; (b) one minute and; (c) Post-PDT PAM images with the white bar indicating 500 µm; (d) Vascular area; (e) vessel diameter and; (f) blood flow all show a decrease with treatment time; (g) shows the relationship between vessel diameter and rBF. * p < 0.05, ** p < 0.01, *** p < 0.001.
Photonics 03 00048 g003