Article

A Recommendation System for Execution Plans Using Machine Learning

1
LRIT-CNRST (URAC No. 29), Faculty of Sciences, Mohammed V University in Rabat, Rabat 10000, Morocco
2
Team TIM, High School of Technology, Moulay Ismail University in Meknes, Meknes 50050, Morocco
*
Author to whom correspondence should be addressed.
Math. Comput. Appl. 2016, 21(2), 23; https://doi.org/10.3390/mca21020023
Submission received: 13 April 2016 / Revised: 6 June 2016 / Accepted: 7 June 2016 / Published: 15 June 2016

Abstract

:
Generating execution plans is a costly operation for the DataBase Management System (DBMS). An interesting alternative to this operation is to reuse the old execution plans, that were already generated by the optimizer for past queries, to execute new queries. In this paper, we present an approach for execution plan recommendation in two phases. We firstly propose a textual representation of our SQL queries and use it to build a Features Extractor module. Then, we present a straightforward solution to identify query similarity.This solution relies only on the comparison of the SQL statements. Next, we show how to build an improved solution enabled by machine learning techniques. The improved version takes into account the features of the queries’ execution plans. By comparing three machine learning algorithms, we find that the improved solution using Classification Based on Associative Rules (CAR) identifies similarity in 91 % of the cases.

1. Introduction

To execute a given SQL query, the query optimizer needs to choose an execution plan for it. An execution plan is a tree such that each node of the tree is a physical operator (e.g., sequential scan, sort, or hash join) [1]. Needless to say, generating execution plans is an “expensive” process for servers. Equivalent results can be obtained by considering different plans, but selecting the less resource consuming plan is crucial. Accordingly, the task of query optimizers is to generate a plan with the sequence of actions that minimizes the consumption of resources. One solution is to reuse existing plans [2], that were generated in the past for previous queries, to execute new similar queries. This solution is based on similarity identification between queries. In our context, two queries are said to be similar if the same execution plan could be used to execute both of them.
In this paper, our main objective is to present a recommendation process that uses similarity identification between SQL queries and machine learning techniques to recommend a previously generated execution plan to the optimizer. We firstly present a straightforward approach that relies only on SQL query statements, and presents an improved approach enabled by machine learning techniques afterwards.
In the improved approach, as we represent our queries in two different spaces, we want to use classification methods to try to discover relationships between these representations. Features of the first representation are derived from the SQL statement of the query, while features of the second representation are extracted from the execution plan. More specifically, we are interested in discovering association rules between the textual features of SQL queries and their execution plans’ features. These rules are then used to learn models that recommend execution plans for new queries as shown in Figure 1.
The remainder of this paper is organized as follows: In the second section, we give an overview of work related to our study. Next, we describe our approach in the third section, and the features extraction process in the fourth section. The straightforward solution and the solution improved by machine learning techniques are presented in Section 5 and Section 6, respectively. Finally, we discuss our experimental results in the last section and provide a brief conclusion afterwards.

2. Related Work

Related work falls into three categories: Machine learning, Recommender systems and Query Optimization. Machine learning techniques are a good alternative to building complex cost-based models and are often easier to adapt and use with new configurations and query types. Accordingly, machine learning methods have been used to tackle a number of issues related to query optimization [3] in general, and SQL queries specifically. These issues range from statistics estimation [4], selectivity and query size estimation [5,6], execution time prediction [7], query performance prediction [8] and execution plan recycling [9,10].
Authors of [11] provide a comprehensive survey on recommender systems and classify them into three categories: 1–content-based, 2–collaborative and 3–hybrid approaches. The concept of recommendation has also been used is the field of query optimization. The work in [12] presents a number of existing methods in the literature to recommend queries to assist the user in the exploration of databases and data warehouses. While the existing approaches using recommendation for query optimization focus on query recommendation; in our work, we are interested in execution plan recommendation.
Existing approaches in the literature perform query similarity identification based on two main phases: (i) defining a pattern for an appropriate query representation; as well as (ii) developing a similarity function. Queries can be represented at the intentional level by considering the uninterpreted SQL sentence [13] or at the extensional level by using the set of tuples resulting from the query execution [14]. Other query representations range from vectors of features [10] to a set of fragments [15]. Graphs [16] are sometimes used as a pattern for query representation as well. The similarity function varies depending on the nature of the problem. [16] uses a simple equality test of query patterns while the comparison in [17] is based on separate tests of query fragments. Other ways for establishing similarity are based on classical functions applied to the queries representation. For instance, authors of [14] use the inner product, while similarity by [14,18] is identified based on cosine distance and Jaccard similarity, respectively. Our approach for similarity identification is different as we are building two features’ datasets, not only one. The first dataset represents the textual features of the queries while the second dataset contains features extracted from their execution plan. Our goal is to find association rules between these two datasets and use them for plan recommendation.

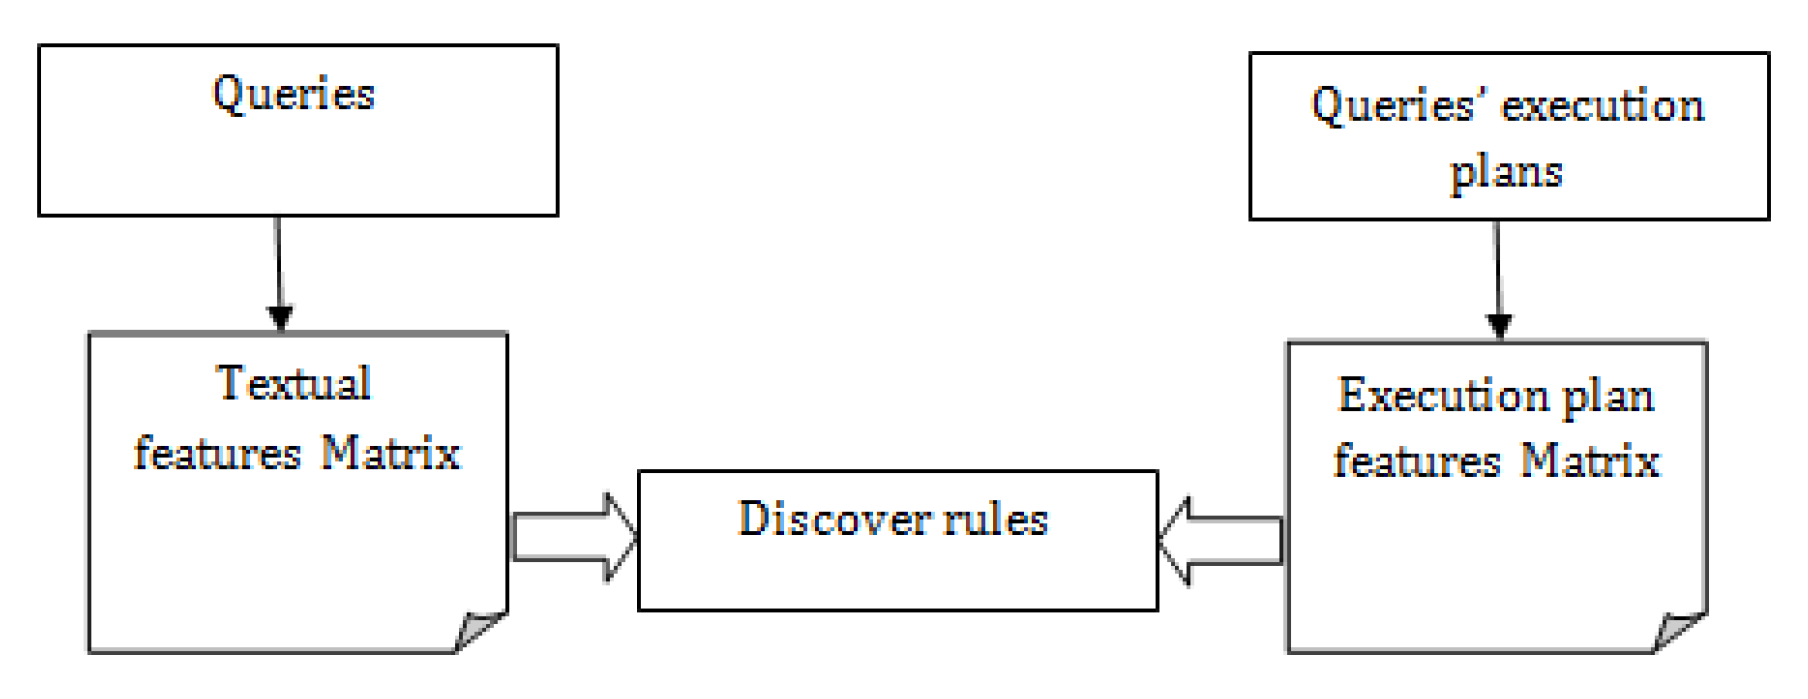
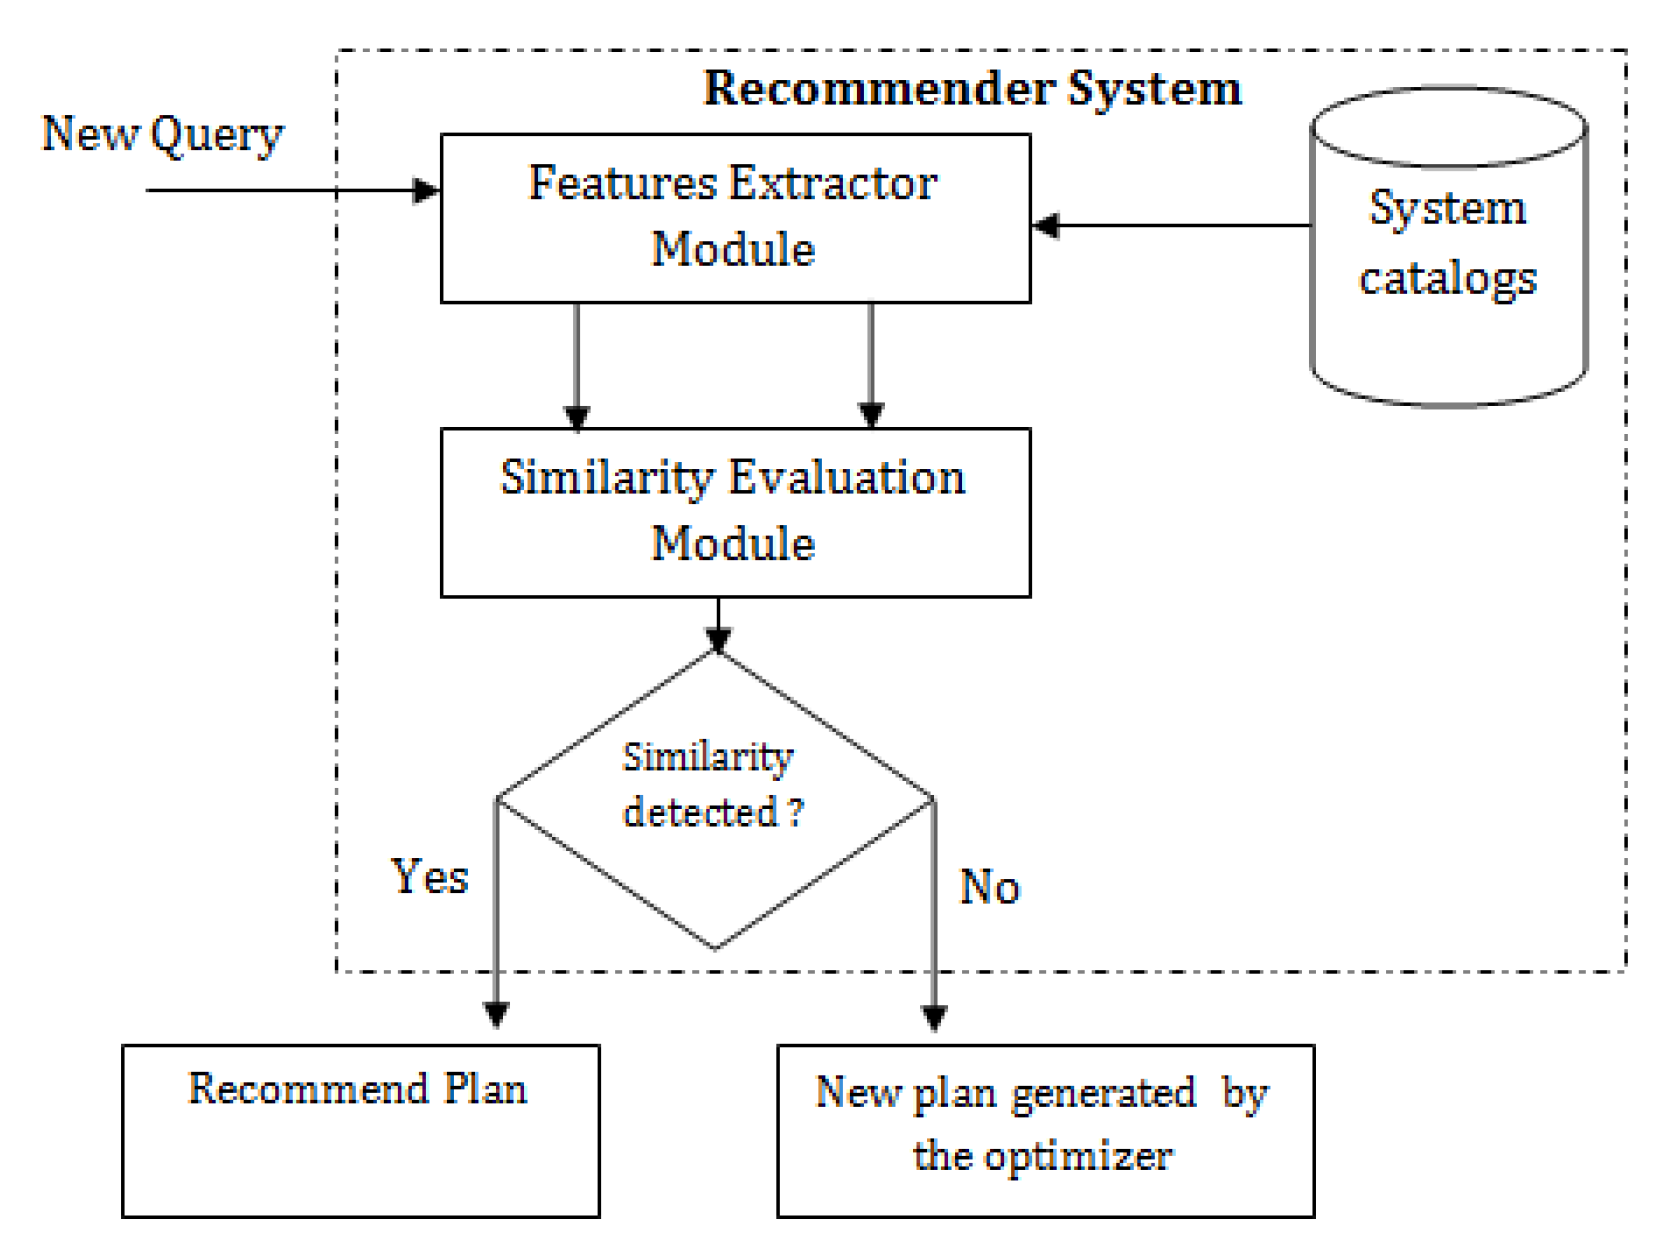
3. Approach to Execution Plan Recommendation

In this paper, we propose a mechanism to build an accurate execution plan recommendation system. Figure 2 illustrates our approach.
For a given query q n , we want the optimizer to choose a suitable execution plan, already stored in the cache memory of the DataBase Management System (DBMS), and reuse it to execute q n . For this task, we need to study the similarity of q n with “old” queries that were previously executed by the optimizer. If a similarity is detected between q n and an “old” query q o , then the execution plan P l a n o used by the optimizer to execute q o will be reused to process q n .
Our study relays on two main components: the first is the “Features Extractor”, the task of which is to capture features from query statements and execution plans. The second component is the “Similarity Evaluation” module that receives features as input and predicts similarity. The contributions of this paper can be summarized as follows:
  • We firstly propose a textual representation of our data and use it to build the Features Extractor module.
  • Secondly, we present a straightforward Similarity Evaluation module that relies only on the comparison of the SQL statements of the queries and studies the pitfalls associated with this method.
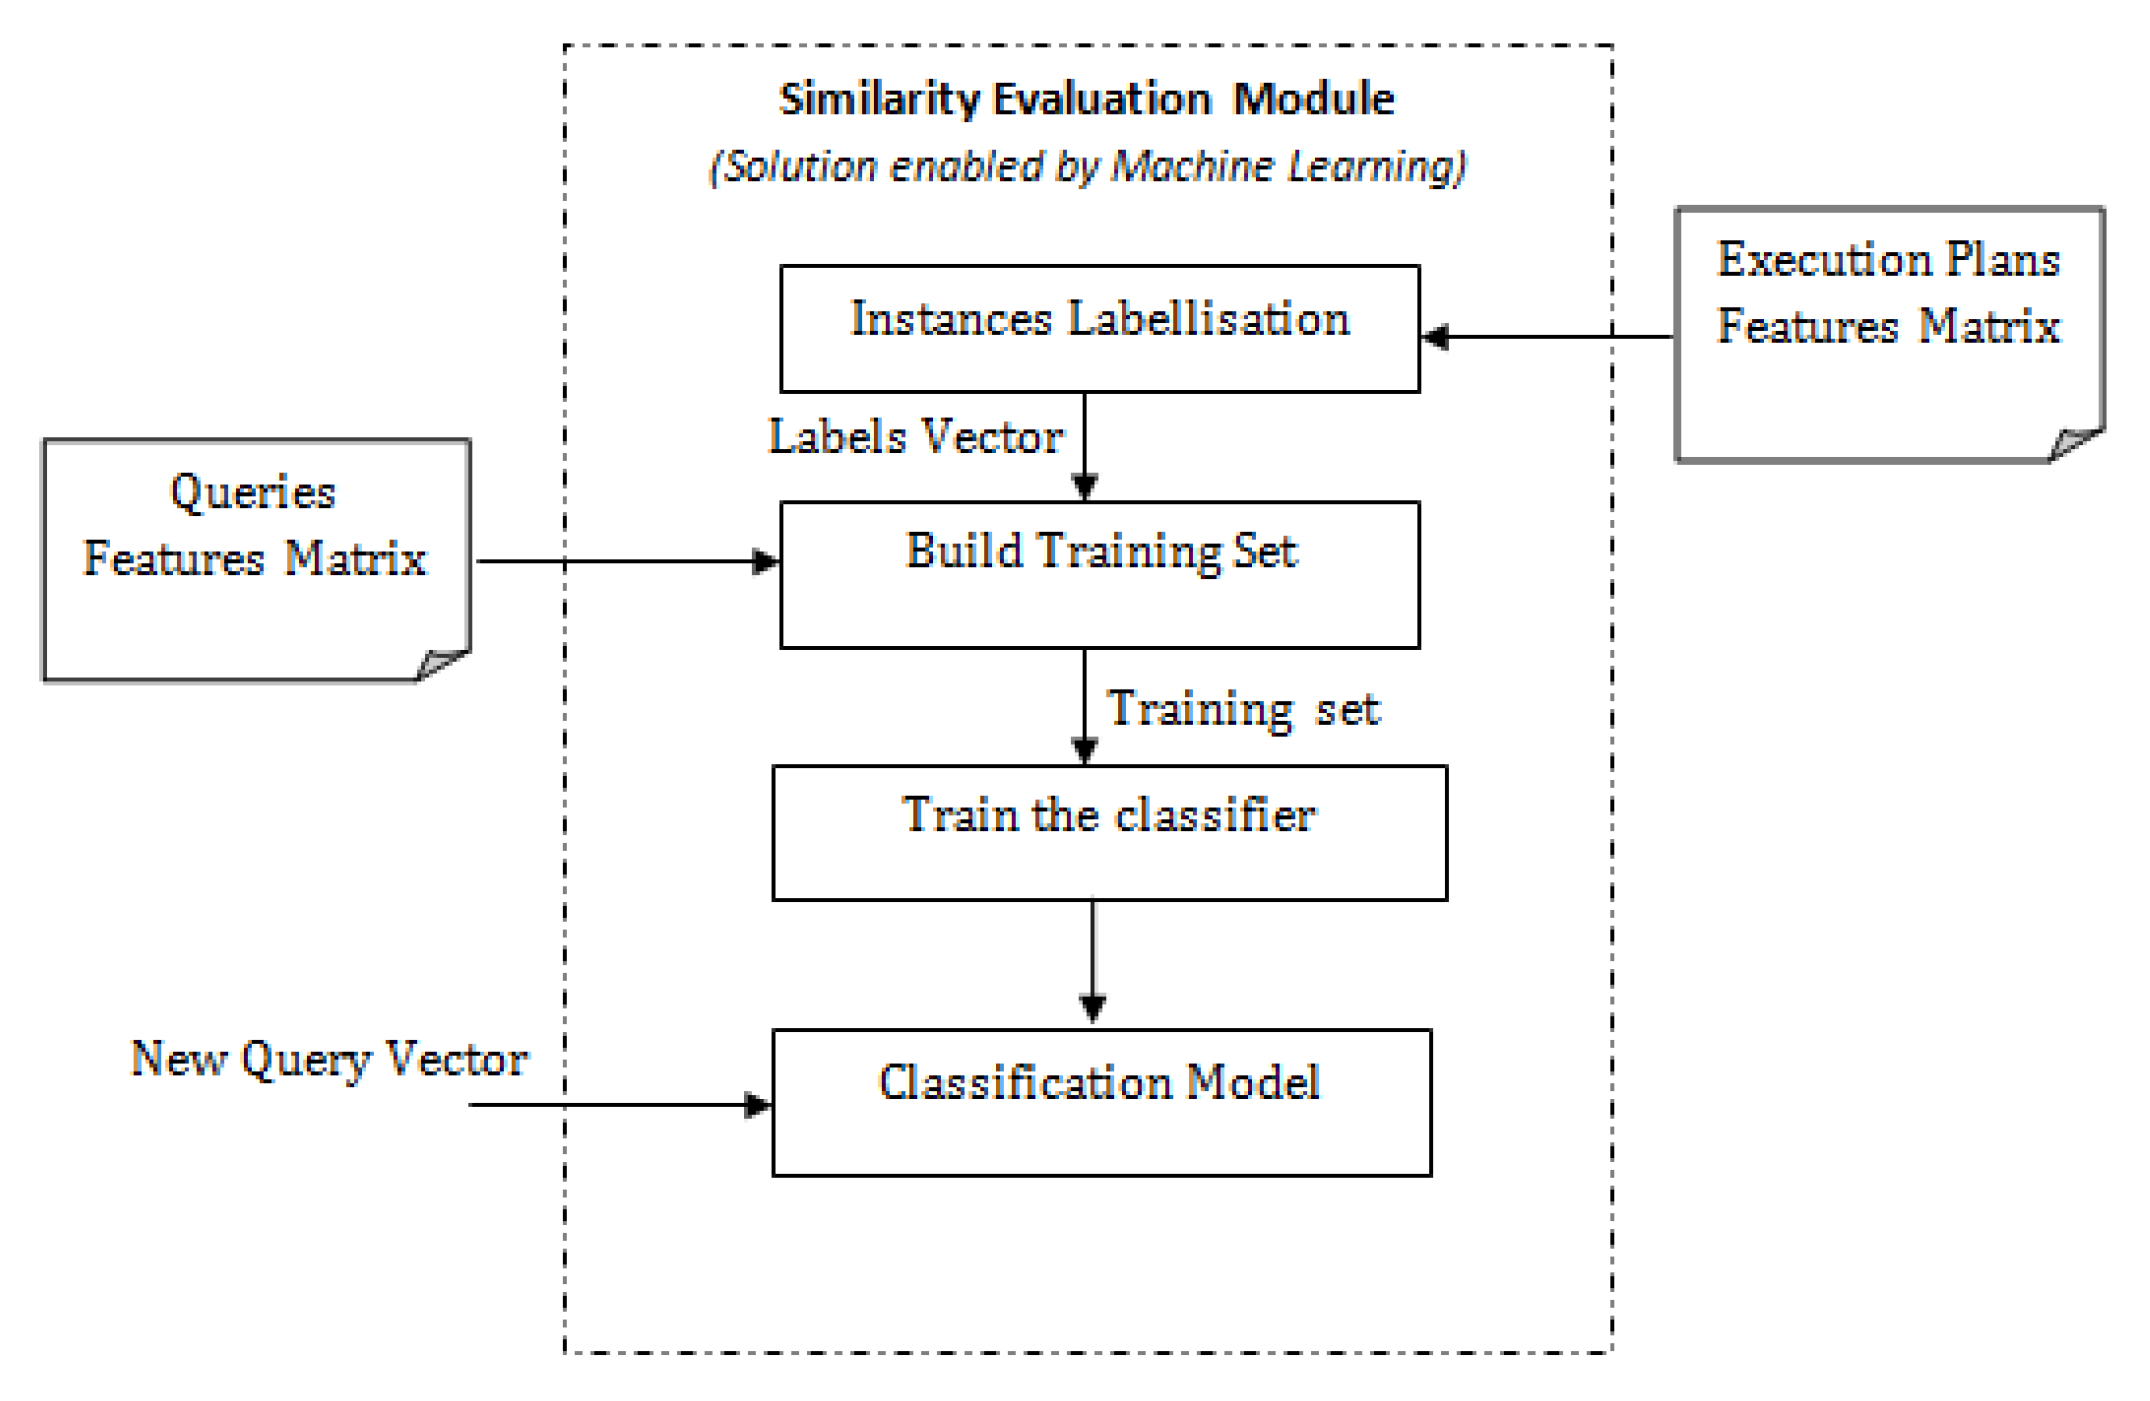
  • Next, we show how to build an improved Similarity Evaluation module enabled by machine learning techniques. The improved version of the module takes into account the features of the queries’ execution plans.
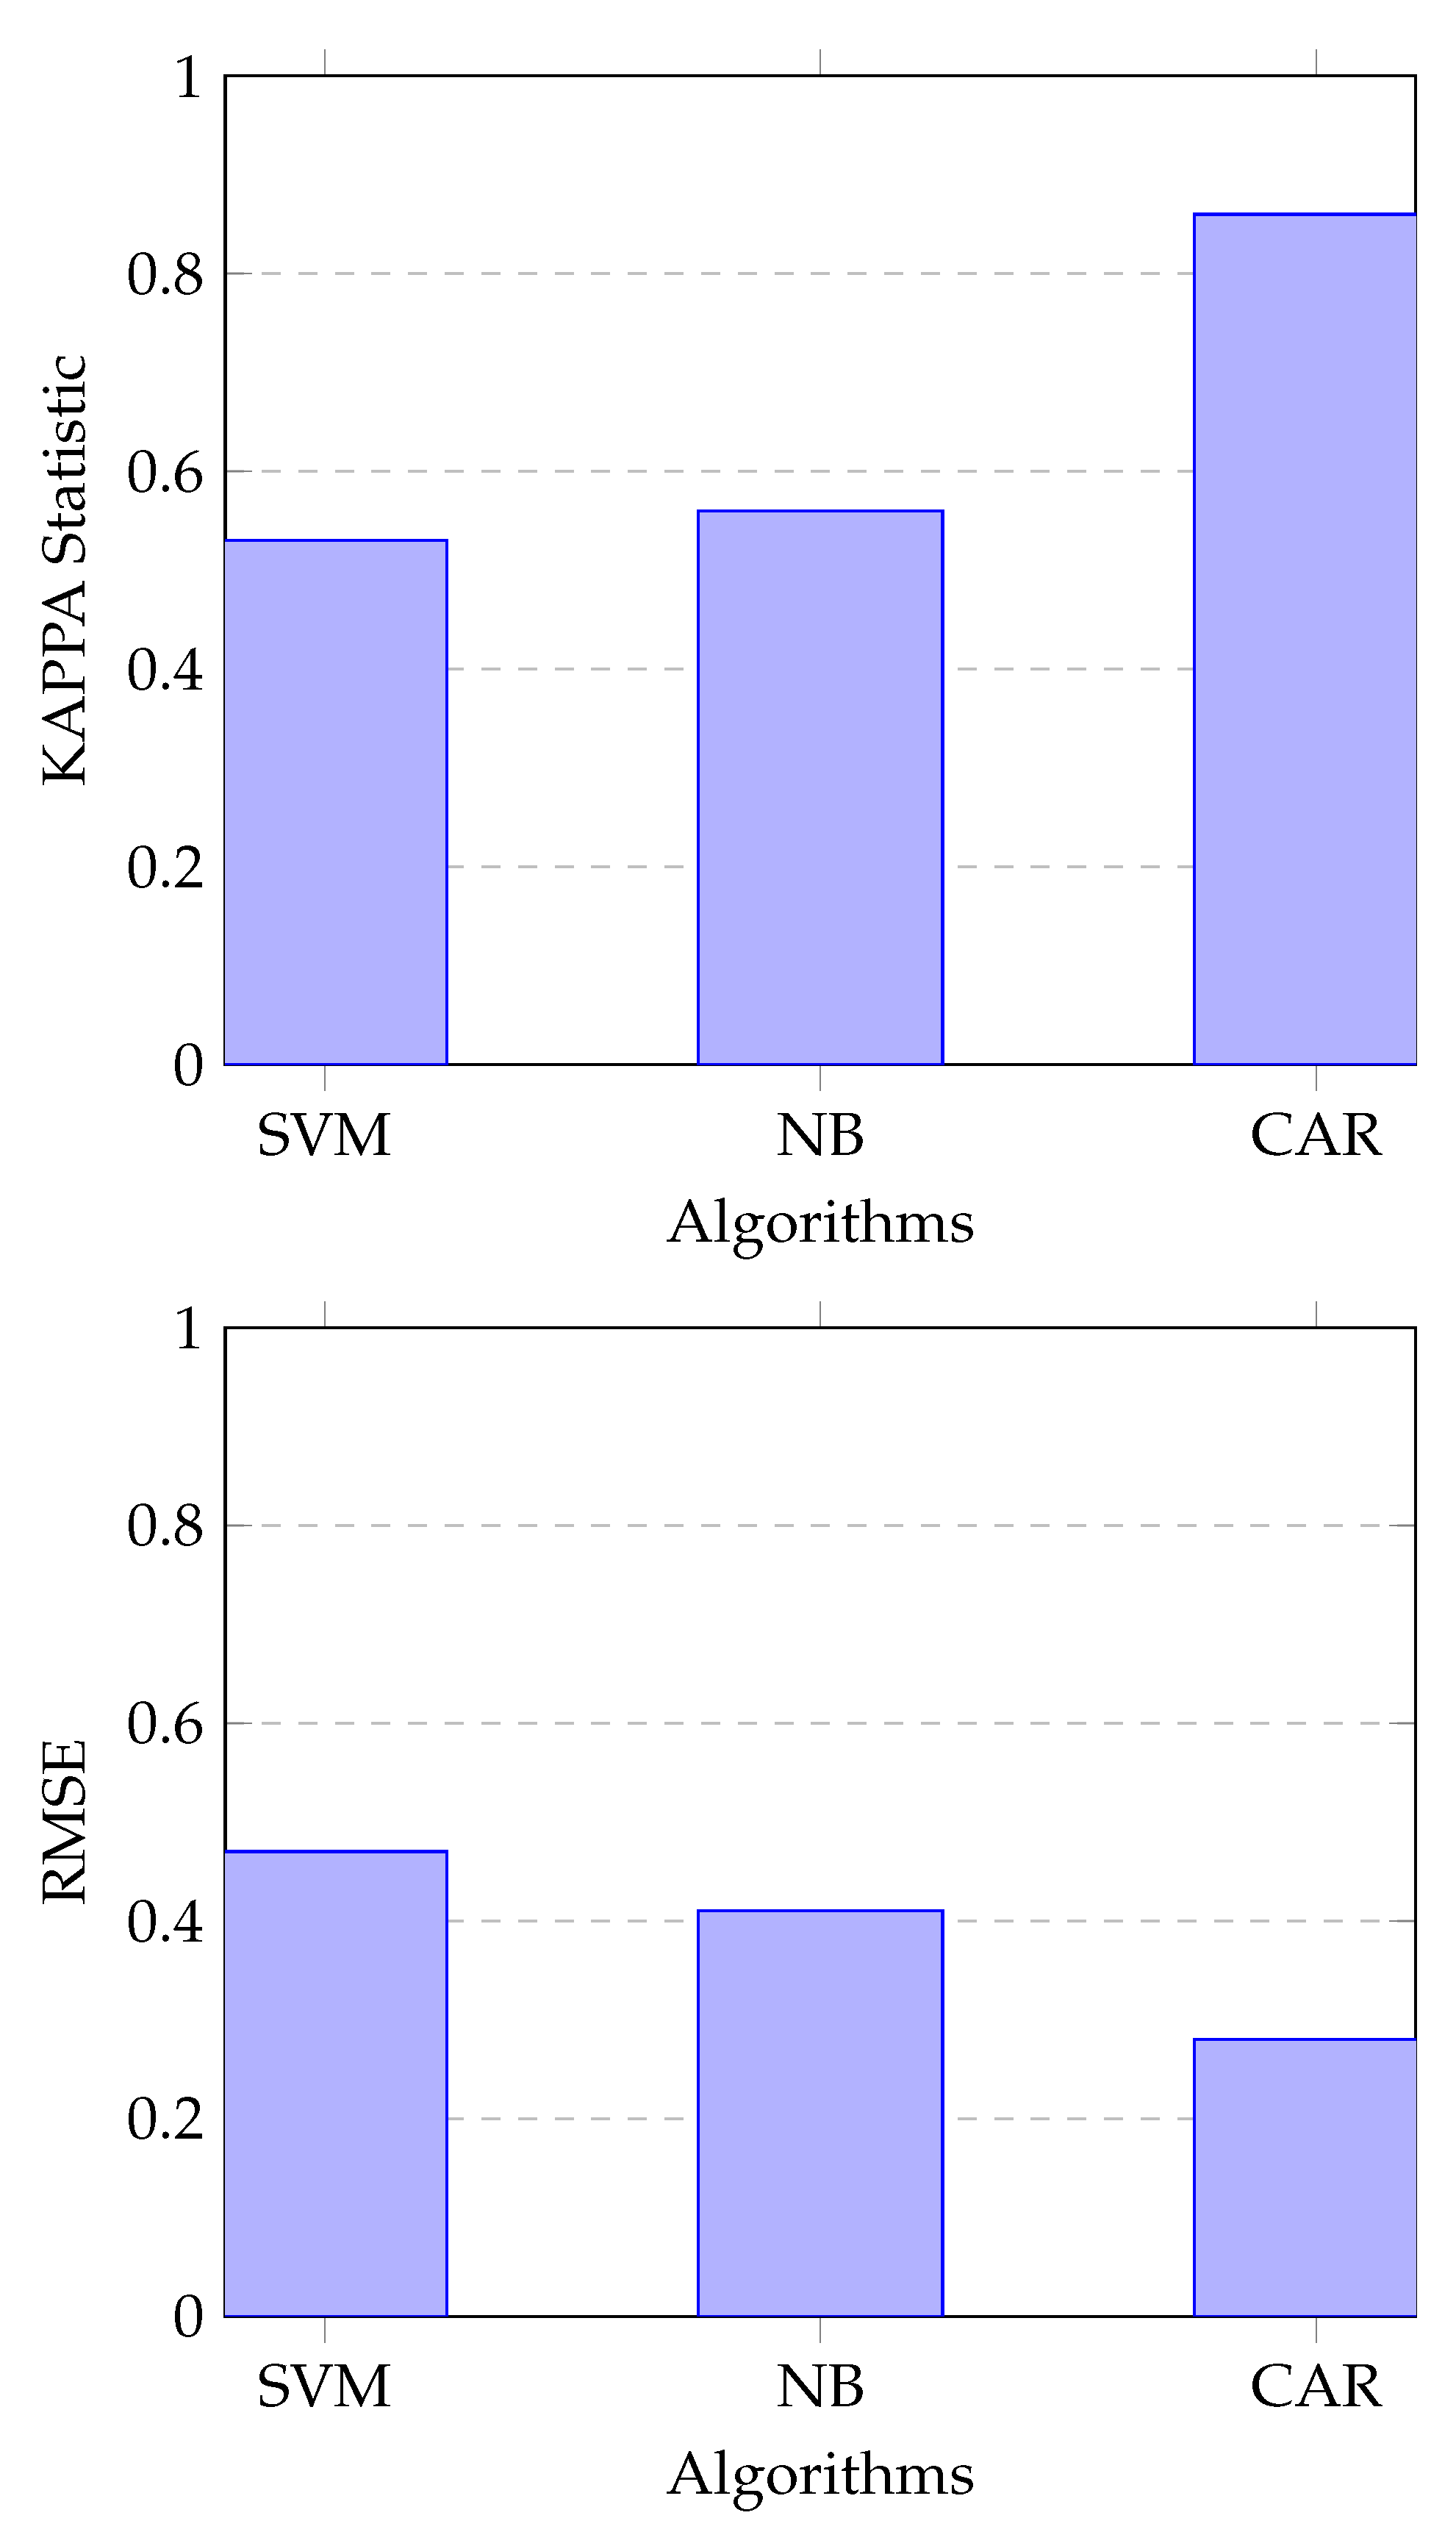
  • We compare three machine learning algorithms and study which one is more accurate in our context.

4. Feature Extraction

In order to build our Features Extractor module, we need to identify a representation model for our data. In the straighforward solution, queries representation ( Queries Features Matrix) is derived from their SQL statements, while in the improved solution, an additional representation in the execution plan space is used (Execution Plan Features Matrix). Both matrices are presented in this section.

4.1. Query Features Matrix

4.1.1. Features

As a crucial step in processing textual data, text representation converts the content of a given piece of text into a compact format so that it can be recognized and automatically classified. Consequently, the data (e.g., SQL query) is represented as a vector in the feature space, that is, a query Q would be represented as Q = ( F 1 , . . . , F k ) , where k is the feature set size. In our context, a features matrix is an n × k matrix, where n is the number of query vectors.
Features, more often referred to as terms, can be at various levels, such as words, phrases, or any other syntactic indexing units used to identify a SQL query. For our application and approach requirements, we propose a representation method that we call the Fragments Model. The fragments model, proposed here, has two main advantages over the classical term model. Firstly, it considerably reduces the dimensions of the feature space and therefore reduces resource consumption in the treatment of queries. This advantage is of crucial importance when we have to deal with query datasets of a large size. The second advantage is the capacity of the fragment model to offer an entity recognition capability. That is, while the classical model treats all tokens of a given query as equivalent terms with the same nature, the fragments model offers the possibility to identify entities in the query. Therefore, relations, attributes and predicates can be recognized that are decisive in identifying queries having similar execution plans.

Fragments Model

In this representation, we split the SQL queries into fragments rather than words. Each fragment is identified by a keyword at the beginning and another one to mark its end in the SQL statement. We have identified six types of fragments as shown in Table 1. Combined fragments of all queries represent the features set.
Example 1. 
The fragments’ models of queries Q 0 and Q 1 are presented in Table 2.
  • Q 0 : SELECT LINE_LEVEL FROM PRODLEVEL WHERE LINE_LEVEL =’RLI9AYC8YAQ4’
  • Q 1 : SELECT ACTVARS.DOLLARSALES FROM ACTVARS,PRODLEVEL
  • WHERE ACTVARS.PRODUCT_LEVEL= PRODLEVEL.CODE_LEVEL
  • AND PRODLEVEL.LINE_LEVEL =’RLI9AYC8YAQ4’

4.1.2. Weighting Method

Feature weighting [19] is another important step that assigns appropriate weights to features. The simplest weighting method is the binary representation that assigns 1 to a feature if it occurs in the data and 0 otherwise. In this solution, we prefer to use the ‘Term Frequency-Inverse Document Frequency’ (TF-IDF) method rather than the simple frequency weighting. The TF-IDF [20] technique provides a composite weight that is more discriminative compared to a simple term frequency weighting method, and therefore captures similarities in a more precise way. While simple frequency only provides information about presence or absence of a fragment in a given query, TF-IDF gives information on the ‘importance’ of that fragment in the set of queries. That is, the TF-IDF scheme assigns the highest weights to fragments that occur many times within a small number of queries and lowest weights to those occurring in the majority of queries. This property helps in obtaining quality discriminative features, which are not supported by classical term frequency representation.

TF-IDF

TF-IDF is an abbreviation for ‘Term Frequency-Inverse Document Frequency’. It is a statistical metric that is widely used in information retrieval field to measure the importance of a word in a given document. This measure is calculated using Equations (1) and (2).
t f . i d f ( f , q , Q ) = t f ( q , f ) . i d f ( f , Q ) ,
i d f ( f , Q ) = log N | q Q : f q | ,
where
  • N: Total Number of Queries in the Database;
  • t f ( q , f ) : Frequency of feature f in query q;
  • | q Q : f q | : Number of queries where the feature f appears.

4.2. Execution Plan Features Matrix

In order to build the execution plan features matrix, we need to choose some features from the execution plan of the SQL queries that were previously executed by the optimizer.
The EXPLAIN PLAN instruction in O r a c l e [21] stores execution plans in a table called PLAN_TABLE. This table contains the number of columns, among which we identify five parameters, namely: Cost, Plan Hash Value, Cardinality, Operation and Bytes. A brief description of the features is given in Table 3, as we use them to represent the SQL query in the execution plan space.

5. Straightforward Solution

In this solution, the Similarity Evaluation module receives as input a 1 × k features vector V n of a new query q n , and an n × k “old” queries features matrix M. Recall that, n is the number of old queries and k is the number of features. Then, it computes the similarity between V n and each row of M. This step produces an n × 1 similarity vector S. Each value s 0 i n of S represents the similarity of query q 0 i n with q n . The plan of the query with the highest measure s is then recommended.
Several similarity measures are discussed in the literature [22]. In this paper, we use the cosine similarity, which calculates the cosine of the angle betweens two feature vectors as defined in Equation (3), where x 1 k and x 2 k are values of feature k in query vectors x 1 and x 2 , respectively.
c o s ( θ ) = n k = 1 x 1 k x 2 k n k = 1 x 1 k 2 n k = 1 x 2 k 2 .

Limitation

As we show later in our experiments, this approach proved accurate to recognize queries that are almost identical, but it presents a significant risk to:
  • Judge two queries as not similar, by analyzing their SQL syntax, while their execution plans are actually similar.
  • Find that two queries have high similarity measure by comparing their statements, but still their plan are different. This is basically due to the fact that small differences in the SQL statements, that could be ignored in classical text categorization tasks, are very decisive in the process of defining an execution plan.
In the next session, we propose an improved solution enabled by machine learning techniques.

6. Solution Enabled by Machine Learning Techniques

6.1. Evaluating Classification Techniques

Classification is a basic task in data analysis that requires the construction of a classifier, that is, a function that is “trained” to assign a class label to unknown instances described by a set of features.
In Figure 3, we present the solution enabled by classification techniques. This approach begins with the class assigner module, the mission of which is to evaluate execution plan features of “old” queries and assign same class labels to queries that have equivalent execution plan features. This module’s output is a 1 × n vector C, where each value c 0 i n is the class label of query q 0 i n . The next step is building the training set, which consists of merging vector C to the query features matrix M. Recall that matrix M contains only features that are derived from the SQL statement. Finally, a classifier will “learn” from this training set how to identify similar queries. In this paper, we evaluate three classifiers, namely, Naive Bayes, Support Vectors Machines (SVM) and Classification based on Associative Rules (CAR).

6.1.1. Naive Bayes

Naive Bayes classifier [23] builds a model by learning, from a training set, the conditional probability of each attribute x i given the class label y. Next, classification is perfomed by applying Bayes rule to compute the probability of y given the particular instance of x 1 , . . . , x n , and then predicting the class with the highest posterior probability. The computation of the predictive model is based on a strong independence assumption that considers all the attributes x i are conditionally independent given the value of the class y. We evaluate the effect of the Naive Bayes classifier on our data, as it is one of the most effective classifiers with a high predictive performance.

6.1.2. Support Vector Machines (SVM)

Support Vector Machines [24,25] is basically a two-class classifier that estimates a decision rule f : R n { ± 1 } using training data ( x 1 , y 1 ) , . . . , ( x n , y n ) R n × { ± 1 } such that f will correctly classify new examples ( x , y ) . In the case of nonlinearly separable data, SVMs use a kernel function to make the data linearly separable. We could define a kernel K ( x , y ) as a real-valued function K : X × X R for which there exists a function φ : X F with the property:
K ( x , y ) = φ ( x ) , φ ( s y ) .
Generally, kernel functions must be positive semi-definite (PSD) to satisfy the theorem of Mercer [26]. Radial Basis Function (RBF) kernel is one of the most efficient and popular kernel functions cited in the litterature, thus we use it in our experimentations.

6.2. Evaluating Classification Based on Association Rules

Association rules which were introduced by [27] represent an automatic approach to discover relationships or possible correlations between objects. They were originally designed for finding multi-correlated items in transactions; however, they can be easily adapted for classification.
Thabtah, F. [28] gives a comprehensive review of associative classification methods. The main objective of CAR is to find a set of rules that satisfy some minimum support and minimum confidence constraints, and form an accurate classifier. Specifically, in this study, we are interested in finding a set of association rules between two SQL query representations and use them to build an efficient classifier. Recent studies have shown that using classifiers based on class association rules resulted in higher accuracy than those obtained by using other classification algorithms such as C4.5 and ILA [29], which strengthens our motivation to evaluate CAR in our improved solution.

7. Experimentations and Results

7.1. Experimental Set-Up

7.1.1. Data

Our experimentations were conducted on the Analytical Processing Benchmark (APB-1) [30], descrived in Table 4, that we used to build 2 different datasets:
  • Dataset D 1 : Contains 1000 simple queries having different execution plans;
  • Dataset D 2 : Contains 1000 queries containing subqueries.
The benchmark contains 55 query templates that we used to build D 1 while we formulated 10 templates to build D 2 .

7.1.2. Models’ Validation

We use k-fold cross validation method for model validation. The dataset is divided into k subsets, and the holdout method is repeated k times. Alternatively, each one of the k subsets is used as a test set and the other k - 1 subsets are put together to form a training set. Then, the average error across all k trials is computed, and the variance of the resulting estimate is reduced as k increased. We need to consider two aspects when defining the value of parameter k. A large value of k means less bias towards overestimating the true expected error of the model but implies higher variance and higher running time. Hence, we need to choose a value that minimizes the bias without penalizing running time. Generally, the value of k is defined empirically. In our experiments, k = 10 offers reasonable bias/variance tradeoff.

7.1.3. Evaluation Metrics

In this paper, we use three metrics in order to measure the prediction accuracy for machine learning techniques.
1–Prediction rate: The rate of correct predictions on the test set. Prediction rate represents the percentage of instances for which predicted class value equals the actual class value.
2–RMSE: Root Mean Square Error (RMSE) is one of the most widely used statistics that measures the differences between values predicted by a model and the actual values.
3–Kappa statistic: Kappa is used as a measure to assess model quality. It is always less than or equal to 1. A value of 1 implies perfect model and values less than 1 imply less than perfect models (0.01–0.2: Slight, 0.21–0.4: Fair, 0.41–0.60: Moderate, 0.61–0.80: Substantial 0.81–0.99: Almost perfect).

7.1.4. Tools

For preprocessing the data, generating and testing the models, we use WEKA [31], a software developped by the Machine Learning Group at the University of Waikato. We performed the SVM tests with the Sequential Minimal Optimization (SMO) algorithm, which is well-known for its simplicity. We use the Java implementation (JCBA) of the Classification Based on Associations algorithm (CBA) to evaluate the performance of CAR. In the straightforward solution, Matlab was used to calculate similarity.

7.2. Experimental Results

7.2.1. Experiment 1: Straightforward Solution

In this experiment, we are interested in evaluating the performance of textual models for detecting similarity between SQL queries. We evaluate this solution at two levels:
  • Firstly, we compare our fragments model to a word model (with simple frequency weighting) as we want to identify which one of these two models is more likely to identify queries having similar execution plans;
  • Secondly, we test the models with our two datasets: D 1 and D 2 .
For each dataset, we choose an arbitrary query to evaluate the solution. Accordingly, for D 1 we consider query Q n e w 1 while we take Q n e w 2 and Q n e w 3 from D 2 . Here, our goal is to see what are the queries that will be identified as similar to Q n e w 1 , Q n e w 2 and Q n e w 3 by this method, using the fragment model. We consider queries for which similarity is higher than 0.95 as similar.
Statements of test queries are as follows:
  • Q n e w 1 : SELECT ACTVARS.DOLLARSALES FROM ACTVARS,PRODLEVEL
  • WHERE ACTVARS.PRODUCT_LEVEL= PRODLEVEL.CODE_LEVEL
  • AND PRODLEVEL.LINE_LEVEL =’RLI9AYC8YAQ4’
  • Q n e w 2 : SELECT CHANNEL_LEVEL,TIME_LEVEL,DOLLARSALES
  • FROM ACTVARS,CHANLEVEL WHERE ACTVARS.CHANNEL_LEVEL=
  • (SELECT BASE_LEVEL FROM CHANLEVEL WHERE BASE_LEVEL =’C7W3GE3KN9GU’)
  • Q n e w 3 : SELECT * FROM ACTVARS WHERE TIME_LEVEL IN (SELECT MONTH_LEVEL
  • FROM TIMELEVEL WHERE MONTH_LEVEL = ’199607’)
Table 5 presents the top three queries (i.e., with the highest similarity values) associated to each test query as returned by the straightforward method. For the purpose of comparison, we additionally calculate, for each of these result queries, the similarities using word model representation. Table 6 reports the query features in the execution plan space.
  • Q R e c o m 1 : SELECT ACTVARS.DOLLARSALES FROM ACTVARS,PRODLEVEL
  • WHERE ACTVARS.PRODUCT_LEVEL= PRODLEVEL.CODE_LEVEL
  • AND PRODLEVEL.LINE_LEVEL = ’ITQS4CE29HQR’
  • Q R e c o m 2 : SELECT CHANNEL_LEVEL,TIME_LEVEL,DOLLARSALES
  • FROM ACTVARS,CHANLEVEL WHERE ACTVARS.CHANNEL_LEVEL=
  • (SELECT BASE_LEVEL FROM CHANLEVEL WHERE BASE_LEVEL =’SMYQ2W6NF5X8’)
  • Q 24 : SELECT CHANNEL_LEVEL,TIME_LEVEL,DOLLARSALES
  • FROM ACTVARS,CHANLEVEL WHERE CHANLEVEL.BASE_LEVEL=
  • (SELECT CHANNEL_LEVEL FROM ACTVARS WHERE CHANNEL_LEVEL =’SMYQ2W6NF5X8’)
  • Q R e c o m 3 : SELECT * FROM ACTVARS WHERE TIME_LEVEL IN
  • (SELECT MONTH_LEVEL FROM TIMELEVEL
  • WHERE MONTH_LEVEL = ’199511’)
  • Q 3 S i m : SELECT * FROM ACTVARS WHERE ACTVARS.TIME_LEVEL IN
  • (SELECT TIMELEVEL.MONTH_LEVEL FROM TIMELEVEL
  • WHERE TIMELEVEL.MONTH_LEVEL = ’199607’)
Queries identified as similar to Q n e w 1 , Q n e w 2 and Q n e w 3 , using the fragments model, are Q R e c o m 1 , Q R e c o m 2 and Q R e c o m 3 , respectively. By comparing features of queries in the execution plan space (Table 6), we observe that Q n e w 1 and Q R e c o m 1 are identical, in addition to Q n e w 2 and Q R e c o m 2 . On the contrary, Q R e c o m 3 does not seem to be similar to Q n e w 3 as its features are different in the space of execution plans. Moreover, we manually identified and recognized Q 3 S i m as the actual similar query to Q n e w 3 .
On the other hand, we can see that the fragment model is more “discriminant” compared to the word model. Actually, similarity values returned by the word model, for recommended queries, are equivalent to those of the fragments model. However, in the case of Q n e w 2 , the word model would have recommended query Q 24 (instead of query Q R e c o m 2 ) which is a suboptimal recommendation. In contrast, the fragments model is correctly identifying query Q 24 as a non similar query with a similarity value that equals 0 . 33 . This result is due to the fact that the fragments model is taking into account the position of the terms in the SQL statements, while the word model is only considering the frequency.
Besides the empirical evaluation, we randomly selected a sample of 100 queries from all datasets and counted the number of queries for which similar queries were identified correctly. Similarity was accurately identified only for the 30 % of queries when the word model was applied, while we obtained a rate of 40 % with the fragments model. According to the observations above, while our proposed model is more accurate compared to the simple word frequency model, it still represents a risk to recommend non similar queries.

7.2.2. Experiment 2: Solution Enabled by Machine Learning Techniques

The second experiment was conducted on D 2 dataset.
Table 7 reports the prediction rates of SVM, Naive Bayes and CAR algorithms. We observe that the highest rate is realized by the JCBA algorithm followed by Naive Bayes and SVM.
Figure 4 provides a comparison of the Kappa statistic and the RMSE of the classifiers. We can see that the minimal value of RMSE (0.28) is given by JCBA while Naive Bayes and SVM perform almost in the same way with values equal to 0.48 and 0.41, respectively. Furthermore, evaluation of the Kappa statistic reveals that JCBA algorithm is generating an “Excellent” model while Kappa values of Naive Bayes and SVM are in the same range and provide a “Fair” Model.
While the straighforward solution was not able to provide an accurate results for dataset D 2 , the improved solution using machine learning techniques performed much better with a prediction rate of 76 . 55 % . Consequently, better recommendation results are obtained, particularly when using Classification based on Association Rules.

8. Conclusions

In this paper, we presented an approach for execution plan recommendation based on similarity identification. Our goal was to build a model that recognizes similarity by using only the SQL statement of new queries. We used machine learning techniques to improve the similarity detection. Classification based on Association Rules has better potential to provide accurate prediction compared to SVM and Naive Bayes. Moreover, the proposed model was able to identify and associate similar queries having similar execution plans. Therefore, our approach is able to recommend relevant execution plans to new queries, based on similarity identification with historical queries that were previously executed by the optimizer. While execution time of models could be a constraint for using CAR, working with a parallelized version of the JCBA implementation, in future studies, can help resolve this issue. Another perspective is to use adaptive recommendations using the optimizers’ feedback to enhance the prediction accuracy.

Author Contributions

Jihad Zahir and Abderrahim El Qadi conceived and designed the experiments; Jihad Zahir performed the experiments; Jihad Zahir and Abderrahim El Qadi analyzed the data and Jihad Zahir wrote the paper.

Conflicts of Interest

The authors declare no conflict of interest.

References

  1. Wu, W.; Chi, Y.; Hacígümüş, H.; Naughton, J.F. Towards predicting query execution time for concurrent and dynamic database workloads. Proc. VLDB Endow. 2013, 6, 925–936. [Google Scholar] [CrossRef]
  2. Selinger, P.G.; Astrahan, M.M.; Chamberlin, D.D.; Lorie, R.A.; Price, T.G. Access path selection in a relational database management system. In Proceedings of the 1979 ACM SIGMOD International Conference on the Management of Data, Boston, MA, USA, 30 May–1 June 1979.
  3. Hasan, R.; Gandon, F. A machine learning approach to SPARQL query performance prediction. In Proceedings of the 2014 IEEE/WIC/ACM International Joint Conferences on Web Intelligence (WI) and Intelligent Agent Technologies (IAT), Warsaw, Poland, 11–14 August 2014; IEEE: Piscataway, NJ, USA, 2014; Volume 1, pp. 266–273. [Google Scholar]
  4. Gao, L.; Wang, M.; Wang, X.S.; Padmanabhan, S. A learning-based approach to estimate statistics of operators in continuous queries: A case study. In Proceedings of the 8th ACM SIGMOD Workshop on Research Issues in Data Mining and Knowledge Discovery, San Diego, CA, USA, 13 June 2003; ACM: New York, NY, USA, 2003; pp. 66–72. [Google Scholar]
  5. Gryz, J.; Liang, D. Query selectivity estimation via data mining. In Intelligent Information Processing and Web Mining; Springer: Berlin/Heidelberg, Germany, 2004; pp. 29–38. [Google Scholar]
  6. Chaudhuri, S.; Ganti, V.; Gravano, L. Selectivity estimation for string predicates: Overcoming the underestimation problem. In Proceedings of the 20th International Conference on Data Engineering, Boston, MA, USA, 30 March–2 April 2004; IEEE: Piscataway, NJ, USA, 2004; pp. 227–238. [Google Scholar]
  7. Ganapathi, A.; Kuno, H.; Dayal, U.; Wiener, J.L.; Fox, A.; Jordan, M.; Patterson, D. Predicting multiple metrics for queries: Better decisions enabled by machine learning. In Proceedings of the IEEE 25th International Conference on Data Engineering, ICDE’09, Shanghai, China, 29 March–2 April 2009; IEEE: Piscataway, NJ, USA, 2009; pp. 592–603. [Google Scholar]
  8. Akdere, M.; Çetintemel, U.; Riondato, M.; Upfal, E.; Zdonik, S.B. Learning-based query performance modeling and prediction. In Proceedings of the 2012 IEEE 28th International Conference on Data Engineering (ICDE), Washington, DC, USA, 1–5 April 2012; IEEE: Piscataway, NJ, USA, 2012; pp. 390–401. [Google Scholar]
  9. Sarda, P.; Haritsa, J.R. Green query optimization: Taming query optimization overheads through plan recycling. In Proceedings of the Thirtieth International Conference on Very Large Data Bases, Toronto, ON, Canada, 31 August–3 September 2004.
  10. Ghosh, A.; Parikh, J.; Sengar, V.S.; Haritsa, J.R. Plan selection based on query clustering. In Proceedings of the 28th International Conference on Very Large Data Bases, Hong Kong, China, 20–23 August 2002.
  11. Adomavicius, G.; Tuzhilin, A. Toward the next generation of recommender systems: A survey of the state-of-the-art and possible extensions. IEEE Trans. Knowl. Data Eng. 2005, 17, 734–749. [Google Scholar] [CrossRef]
  12. Marcel, P.; Negre, E. A Survey of Query Recommendation Techniques for Data Warehouse Exploration; Entrepôts de Données et l’Analyse en ligne—EDA: Clermont-Ferrand, France, 2011; pp. 119–134. [Google Scholar]
  13. Yao, Q.; An, A.; Huang, X. Finding and analyzing database user sessions. In Database Systems for Advanced Applications; Springer: Berlin/Heidelberg, Germany, 2005; pp. 851–862. [Google Scholar]
  14. Stefanidis, K.; Drosou, M.; Pitoura, E. You May Also Like results in relational databases. In Proceedings of the International Workshop on Personalized Access, Profile Management and Context Awareness: Databases, Lyon, France, 24–28 August 2009; Volume 9.
  15. Aligon, J.; Golfarelli, M.; Marcel, P.; Rizzi, S.; Turricchia, E. Mining preferences from OLAP query logs for proactive personalization. In Advances in Databases and Information Systems; Springer: Berlin/Heidelberg, Germany, 1998; pp. 84–79. [Google Scholar]
  16. Yang, X.; Procopiuc, C.M.; Srivastava, D. Recommending join queries via query log analysis. In Proceedings of the IEEE 25th International Conference on Data Engineering, ICDE’09, Shanghai, China, 29 March–2 April 2009; IEEE: Piscataway, NJ, USA, 2009; pp. 964–975. [Google Scholar]
  17. Gupta, A.; Mumick, I.S. Materialized Views: Techniques, Implementations, and Applications; MIT Press: Cambridge, MA, USA, 1999. [Google Scholar]
  18. Chatzopoulou, G.; Eirinaki, M.; Koshy, S.; Mittal, S.; Polyzotis, N.; Varman, J.S.V. The QueRIE system for Personalized Query Recommendations. IEEE Data Eng. Bull. 2011, 34, 55–60. [Google Scholar]
  19. Lan, M.; Tan, C.L.; Su, J.; Lu, Y. Supervised and traditional term weighting methods for automatic text categorization. IEEE Trans. Pattern Anal. Mach. Intell. 2009, 31, 721–735. [Google Scholar] [CrossRef] [PubMed]
  20. Aizawa, A. An information-theoretic perspective of tf-idf measures. Inf. Process. Manag. 2003, 39, 45–65. [Google Scholar] [CrossRef]
  21. Using Explain Plan. Available online: https://docs.oracle.com/cd/B1050101/server.920/a96533/explan.htm (accessed on 10 May 2016).
  22. Gomaa, W.H.; Fahmy, A.A. A survey of text similarity approaches. Int. J. Comput. Appl. 2013, 68, 13–18. [Google Scholar]
  23. Friedman, N.; Geiger, D.; Goldszmidt, M. Bayesian network classifiers. Mach. Learn. 1997, 29, 131–163. [Google Scholar] [CrossRef]
  24. Hastie, T.; Tibshirani, R.; Friedman, J. The Elements of Statistical Learning; Springer: Berlin/Heidelberg, Germany, 2009. [Google Scholar]
  25. Wu, X.; Kumar, V.; Quinlan, J.R.; Ghosh, J.; Yang, Q.; Motoda, H.; McLachlan, G.J.; Ng, A.; Liu, B.; Philip, S.Y.; et al. Top 10 algorithms in data mining. Knowl. Inf. Syst. 2008, 14, 1–37. [Google Scholar] [CrossRef]
  26. Minh, H.Q.; Niyogi, P.; Yao, Y. Mercers theorem, feature maps, and smoothing. In Learning Theory; Springer: Berlin/Heidelberg, Germany, 2006; pp. 154–168. [Google Scholar]
  27. Agrawal, R.; Srikant, R. Fast algorithms for mining association rules. In Proceedings of the 20th International Conference on Very Large Data Bases, VLDB, San Francisco, CA, USA, 12 September–15 September 1994; Volume 1215, pp. 487–499.
  28. Thabtah, F. A review of associative classification mining. Knowl. Eng. Rev. 2007, 22, 37–65. [Google Scholar] [CrossRef]
  29. Nguyen, L.T.; Nguyen, N.T. Updating mined class association rules for record insertion. Appl. Intell. 2015, 42, 707–721. [Google Scholar] [CrossRef]
  30. OLAP Council APB-1 OLAP Benchmark Release II. Available online: http://www.olapcouncil.org/research/bmarkly.htm (accessed on 10 May 2016).
  31. Hall, M.; Frank, E.; Holmes, G.; Pfahringer, B.; Reutemann, P.; Witten, I.H. The WEKA data mining software: An update. ACM SIGKDD Explor. Newsl. 2009, 11, 10–18. [Google Scholar] [CrossRef]
Figure 1. Using association rules to plan recommendation.
Mca 21 00023 g001
Figure 2. Our approach for plan recommendation.
Mca 21 00023 g002
Figure 3. Improved solution enabled by classification techniques.
Mca 21 00023 g003
Figure 4. Comparison of Kappa and RMSE.
Mca 21 00023 g004
Table 1. Fragments’ models.
FragmentBeginingEnd
Fragment 1SelectFrom
Fragment 2FromWhere, Group By, Order By
Fragment 3Wherelike, =, Group By, Order By
Fragment 4=AND, End of the query
Fragment 5AND=, End of the query
Fragment 6like, Group By, Order ByEnd of the query
Table 2. Fragments’ models of queries Q 0 and Q 1 .
Fragments Q 0 Model Q 1 Model
Fragment 1LINE_LEVELACTVARS.DOLLARSALES
Fragment 2PRODLEVELACTVARS,PRODLEVEL
Fragment 3LINE_LEVELACTVARS.PRODUCT_LEVEL
Fragment 4’RLI9AYC8YAQ4’PRODLEVEL.CODE_LEVEL
Fragment 5NULLPRODLEVEL.LINE_LEVEL
Fragment 6NULL’RLI9AYC8YAQ4’
Table 3. Description of the selected execution plan features.
FeatureDescription
PLAN_HASH_VALUEA metric that identifies execution plans.
COSTExecution cost as estimated by the optimizer. The value of this attribute has no measurement unit.
CARDINALITYNumber of rows returned by a query.
OPERATIONDefines the operation type (Select, Update, ...).
BYTESNumber of needed bytes per query.
Table 4. APB1 benchmark characteristics.
Table NameCardinalitySize (MB)
ACTVARS33,323,4002085
CHANLEVEL10 2.4 × 10 - 4
CUSTLEVEL990 2.4 × 10 - 2
PRODLEVEL9900 7.3 × 10 - 1
TIMELEVEL24 3.9 × 10 - 4
Table 5. Cosine similarity/query model.
DatasetNew QuerySuggested Similar QueryFragments ModelWords Model
D 1 Q n e w 1 Q R e c o m 1 0.980.93
Q 12 0.900.90
Q 13 0.900.89
D 2 Q n e w 2 Q R e c o m 2 0.970.92
Q 22 0.910.90
Q 23 0.870.92
Q 24 0.331
D 2 Q n e w 3 Q R e c o m 3 0.980.93
Q 32 0.850.95
Q 33 0.780.92
Table 6. Comparing queries in the execution plan space.
QueryCardinalityBytesPlan Hash Value
Q n e w 1 196,7149,638,9861,918,545,856
Q R e c o m 1 196,7149,638,9861,918,545,856
Q 12 688,50042,687,0001,918,545,856
Q 13 688,50042,687,0001,918,545,856
Q n e w 2 81,0002,187,0004,072,885,321
Q R e c o m 2 81,0002,187,0004,072,885,321
Q 22 81,0007,695,0004,072,885,321
Q 23 79,4421,906,6084,072,885,321
Q 24 65,5481,713,1524,072,885,321
Q n e w 3 4673387,8592,685,087,043
Q R e c o m 3 4490372,6702,685,087,043
Q 3 S i m 4490372,6702,685,087,043
Q 32 68,8503,167,1002,685,087,043
Q 33 68,8503,167,1002,685,087,043
Table 7. Comparison of prediction rate.
SVMNaive BayesCAR
76.55%77.95%91%

