Communication

In Situ Measurement of Polymer Layer Thickness in Porous Layer Open Tubular (PLOT) Columns Using Optical Absorbance in the Near-IR Range

1
National Centre for Sensor Research, Dublin City University, Collins Avenue, Glasnevin, Dublin 9, Ireland
2
School of Biotechnology, Dublin City University, Collins Avenue, Glasnevin, Dublin 9, Ireland
3
Australian Centre for Research on Separation Science, University of Tasmania, Hobart TAS 7001, Australia
*
Author to whom correspondence should be addressed.
Separations 2016, 3(4), 34; https://doi.org/10.3390/separations3040034
Submission received: 8 September 2016 / Revised: 16 November 2016 / Accepted: 6 December 2016 / Published: 12 December 2016
(This article belongs to the Special Issue Monolithic Columns in Separation Sciences)

Abstract

:
Highly reproducible fabrication of porous layer open tubular (PLOT) structures in fused silica capillaries is often challenging; thus, methods to measure layer thickness growth in real time represent a powerful tool for the production of such columns. The work presented herein demonstrates the application of optical absorbance in the near-infrared (near IR) range for the in-process measurement of polymer layer growth inside fused silica capillaries during the fabrication of PLOT columns. The proposed technique can be used for both on- and off-line measurements of layer thickness for thermal- and photo- initiated polymerisation methods, performed in either polytetrafluoroethylene (PTFE)- or polyimide-coated capillaries. Measurements of layer thickness were carried out at λ 700 nm, using 100 μm and 8 μm optical fibres, yielding relative standard deviation (%RSD) values of 27% and 22%, respectively.

1. Introduction

Porous layer open tubular (PLOT) columns (see Figure 1) are a type of open tubular column used in a variety of chromatography applications, and although they find some use in liquid chromatography (LC) [1,2,3,4,5,6,7,8,9], capillary electrochromatography [10,11,12,13,14], and micro solid phase extraction (μ-SPE) [15,16], their main area of application is in gas chromatography (GC) [17,18]. Typically, such columns are fabricated through the immobilisation of spherical particles onto the inner wall of the capillary. More recently, however, several works describing the fabrication of another more stable type of PLOT column—the monolithic porous layer open tubular (monoPLOT) column—have been published [16,17,18,19]. In this case, the layer is formed through the polymerisation of homo- or co-polymers in the presence of a porogen, giving the material a porous structure. Aside from the highly-tailored surface porosity, one of the main advantages of such columns is the fact that the layer is chemically bonded to the inner wall of the capillary, making the stationary phase much more resilient and less prone to column bleed [18]. This is of particular importance in gas chromatography (GC), where the column may be subjected to high temperatures (>400 °C).
Typically, monoPLOT columns can be produced through thermal- or photo-initiated polymerisation methods; however, in the majority of these techniques, it can be extremely difficult to precisely control layer thickness and morphology. The control of these parameters is crucial for these types of columns, as loading capacity and separation efficiency will depend on the volume and morphology of the stationary phase. Recently, a few works have been published describing fine control of both layer thickness and morphology [19,20,21,22]. However, these methods are based on empirical measurements; e.g., measuring the layer thickness by scanning electron microscopy (SEM) analysis during fabrication process to identify what experimental parameters (exposure time, temperature, flow rate, etc.) lead to the desired layer thicknesses. This approach has the potential for a degree of column-to-column variance. In more recent years, the same authors developed a method for an in-process layer growth measurement using capacitively-coupled contactless conductivity detection (C4D) [22]. The technique was used in conjunction with thermal polymerisation carried out in a heated air bath, and provided measurement of layer thickness with a relative standard deviation (%RSD) of less than 10%. The method requires that an electrolyte be added to the polymerisation mixture in order to increase its conductivity to a point that it can be measured by a C4D cell. As the layer grows, the effective diameter inside the capillary reduces, and so does the C4D signal. Since conductivity is highly dependent on ion mobility, trapped ions in the polymer contribute very little to the overall signal, and so the technique is highly accurate.
However, there are some downsides to this approach. Since the polymerisation mixture needs to be conductive, it often means adding an electrolyte to the solution of monomers and porogen, which can result in unwanted effects on the structure of the porous polymer, depending on the nature of monomers and other porogens being used [23]. Nonetheless, the concentration of ionic species in the mixture should be sufficient to give an adequate signal-to-noise ratio (SNR) in order to make an accurate measurement. Conversely, if the conductivity of the polymerisation mixture is too high (for example, in case of conductive polymers), then C4D may not be applicable. Often, the signal parameters on C4D cells are highly tunable; however, reducing the sensitivity of the cell often has a negative impact on the SNR. Furthermore, the successful application of this technique requires the process to be carried out in an air bath. Although some studies have been carried out by the authors on the use of C4D in water baths, it can be difficult to effectively implement the method, as it requires purpose-built C4D cells, and often results in a poor SNR. As such, the need for a robust in-process layer thickness growth monitoring method, suitable for different fabrication processes, remains unmet.

2. Theory

Optical Absorbance

Several methods exist for the measurement of thin film thickness, ranging from β- and X-ray techniques [24,25], electrical impedance and conductivity [26,27], to tactile methods such as atomic force microscopy (AFM) [28,29,30] and scanning acoustic microscopy techniques [31]. However, it is important to note that the vast majority of these methods are suitable for measurements on planar surfaces.
Various optical techniques can also be applied [25,28,32], including optical absorbance. Optical absorbance is a commonly used method, and finds application in a wide variety of detection and measurement techniques [33]. Using Lambert’s absorption law, it is possible to directly apply optical absorption to the measurement of the polymer layer thickness within a monoPLOT column. The fractional change in intensity of the incident beam, −dIO/IO, will be proportional to the thickness and density of the polymer layer. This relationship can be represented as:
d I O = μ I O   d x
where IO is intensity of incident light, µ is linear attenuation coefficient of the layer, and dx is layer thickness. The linear attenuation coefficient, µ, is related to the optical properties of the material.
Integrating Equation (1) gives:
ln ( I O / I ) = 0 d μ   d x
where I is the intensity of transmitted light beam through the entire system (e.g., polymer layer 1 → remaining polymerisation mixture → polymer layer 2).
The transmission of light through the entire system can also be expressed in terms of absorbance, A:
A = log 10 ( I / I O )
Since the intensity of the incident light drops due to absorption within the polymer layers and remaining polymerisation mixture in capillary, and the level of absorption is relative to the thickness, average density, and porosity of the layer formed, it is possible to relate absorption to the physical properties of the polymer layer. As cumulative absorption across the capillary is measured, if the nature or composition of the polymerisation mixture changes, an initial calibration must be carried out for the identification of the relation between absorbance and layer thickness, and for any subsequent columns produced using this type of polymer, only these calibration plots will be required to identify the desired layer thickness.
In some cases, the molar extinction coefficient of one or multiple components of the polymer system may be too high (at the given wavelength) to allow useful measurements to be made. This is a consideration that must be allowed for when developing both the polymer and the specific optical measurement set-up. For example, in a previous work by the authors [19], an IR photo-initiator was used for monoPLOT fabrication due to its high molar extinction coefficient. In this instance, the photo-initiator prevented incident IR light from entering the bore of the capillary, and thus resulted in a polymer layer growing inward from the capillary walls. Using a polymer system such as this would have made it impossible to employ the technique presented in this paper.

3. Experimental

3.1. Reagents and Materials

All chemicals were reagent or analytical grade purity. Ethylene dimethacrylate (EDMA), butyl methacrylate (BuMA), 1-decanol, benzophenone, UV-initiator dimethoxy-2-phenyacetophenone (DAP), and 3-methoxysilylpropyl methacrylate were purchased from Sigma-Aldrich (Gillingham, UK). The thermal initiator azobisisobutyronitrile (AIBN) was obtained from DuPont (Le Grand Sacconex, Switzerland). All solvents and chemicals used for the preparation of solutions used for capillary pre-treatment, synthesis, and washing of the resultant monoliths—namely, sodium hydroxide (NaOH), hydrochloric acid (HCl), acetonitrile (ACN), acetone, and methanol (MeOH)—were purchased from LabScan (Gliwice, Poland). Deionised water (18.2 MΩ) was utilised throughout the experiments and was obtained from a Milli-Q system (Millipore, Bedford, MA, USA). Polyimide- and polytetrafluoroethylene (PTFE)-coated (15 μm thickness coating) fused silica capillaries (100 μm ID and 0.375 mm OD) were purchased from Composite Metal Services Ltd., Charlestown, UK.

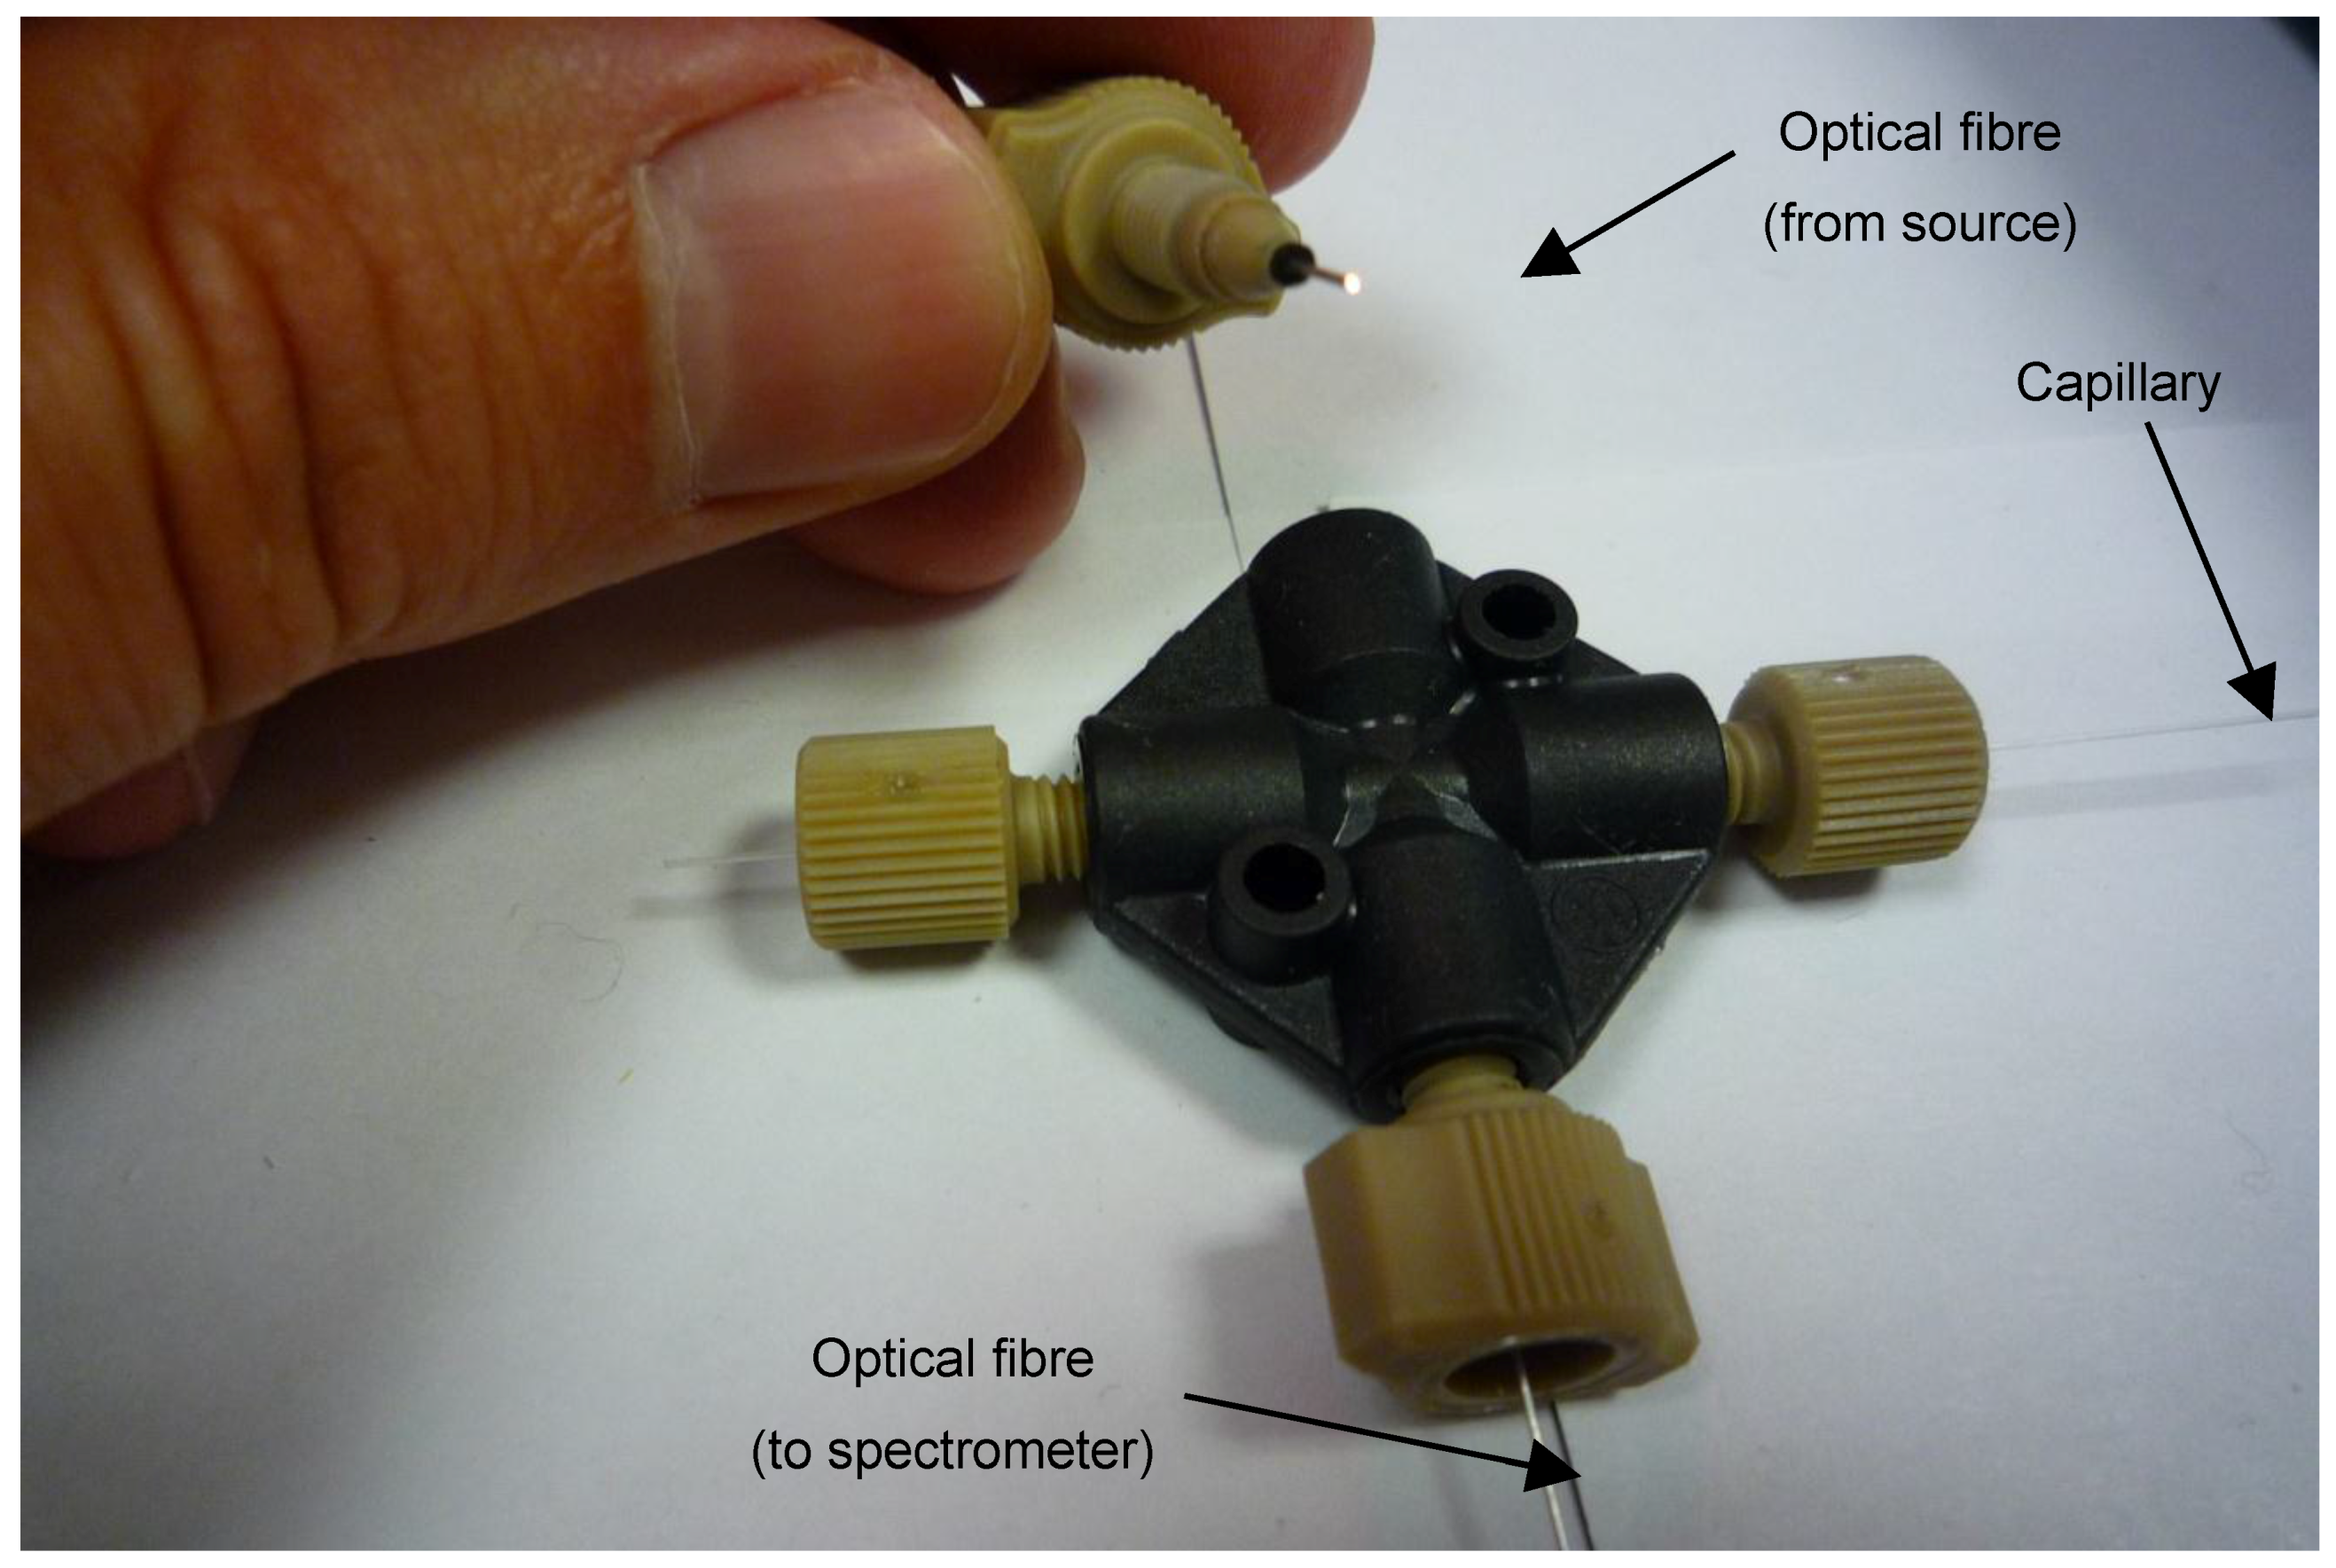
3.2. Instrumentation

Capillaries were filled with monomer mixture and washed post-synthesis using a KDS-100-CE syringe pump (KD Scientific, Inc., Holliston, MA, USA). Fabrication of photo-initiated monoPLOT columns in PTFE-coated capillaries was carried out using an in-house-designed purpose-built prototype UV column curing device described in the work by Collins et al. [21]. The device feeds capillary through a chamber, which contains several circular arrays of UV (365 nm) LEDs. Fabrication of thermally-initiated monoPLOT columns in polyimide capillaries was carried out in a water bath, using a Yellow Line MST Basic hotplate with TC1 temperature controller and glassware (VWR Ltd., Dublin, Ireland). A Rheodyne six-port switching valve (Rheodyne, Cotati, CA, USA) was used to switch between the polymerisation mixture and MeOH flows.
A SputterCoater S150B (BOC Edwards, Sussex, UK) was utilised for coating samples of prepared columns with a 20 nm gold layer prior to scanning electron microscopy (SEM) analysis. SEM analysis was carried out on a S-3400N instrument (Hitachi, Maidenhead, UK). Optical fibres for optical absorbance measurements were purchased from Thor Labs (Munich, Germany), fibre couplers were purchased from L-Com (North Andover, MA, USA), and the light sources and UV-IR spectrometer were purchased from Ocean Optics (Dunedin, FL, USA).

3.3. Procedures

Fused silica capillaries were initially pre-treated through activation of the surface silanol groups of the inner walls by sequential flushing with 1 M NaOH, deionised water, 0.1 M HCl, deionised water, and acetone. The pre-treated capillary was silanised using a 50 wt % solution of trimethoxysilylpropyl methacrylate in toluene at 60 °C for 24 h.

3.3.1. Fabrication of monoPLOT Columns

The monomer mixture used consisted of 24 wt % BuMA, 16 wt % EDMA, 60 wt % 1-decanol, and 0.4 wt % AIBN or 0.4 wt % DAP (with respect to monomers). Thermal initiator AIBN was used for laminar flow polymerisation (which was performed in polyimide-coated capillaries), and DAP was used for photo-initiated polymerisation, carried out in PTFE-coated capillaries in the UV chamber. The mixture was prepared by first weighing out the initiator into the mixture vessel, then adding the porogen, and last the monomers. The monomer mixture was prepared as per the procedure described by Collins et al. [20].
UV-initiated polymerisation: The desired length of 100 μm ID silanised PTFE-coated capillary was filled with the monomer mixture, and the ends of the capillary were sealed with rubber septa. The filled capillary was loaded into the flow-through UV reactor described in [21]. The capillary was aligned in the UV chamber, and the speed and intensity settings on the device were set to the desired values. The capillary was fed at a fixed rate through the UV chamber, the linear rate being chosen to give an exposure time of approximately 10 s. After each pass, the feed motor was reversed once the end of the capillary was reached, and the next exposure was started. This was repeated for the desired number of exposures. An absorbance measurement was recorded after each exposure, and the corresponding piece of capillary was removed and washed with MeOH at 1 μL/min for 1 h to remove residual porogen and unreacted monomers. Each section of capillary was then inspected by SEM, and the average layer thickness was recorded.
Thermally-initiated laminar flow polymerisation: Here, a desired length of silanised polyimide-coated capillary was coiled, and one end was connected to a port on the switching valve, which was mounted above a heated water bath, as described by Collins et al. [20]. The two inlet ports of the switching valve were connected to a syringe filled with polymerisation mixture, and another syringe filled with MeOH. Both syringes were placed in a syringe pump. The coiled capillary was immersed in the water bath, and the other end was left open so that the polymerisation mixture could flow through it. The polymerisation mixture was then pumped through the capillary at the desired flow velocities. After flow was established, the water bath was brought up to a polymerisation temperature of 60 °C. At various stages, samples of the capillary with polymerised layer were collected, washed with MeOH, and subjected to SEM analysis.

3.3.2. Determination of monoPLOT Layer Thickness by Optical Absorbance Measurement

To accurately measure the absorbance across the monoPLOT column, it was first necessary to align the optics precisely with the centreline of the capillary. A previous work by Florea et al. [34] successfully characterised a spiropyran coating inside fused silica capillaries using optical absorbance. In this work, the author used micro-fluidic connectors and couplings to align 100 µm fibre optic cables with 100 µm ID PTFE-coated capillaries.
A similar arrangement was initially employed for the measurements of the monoPLOT layer thickness. This was achieved by using a four-port coupling, which aided in the alignment of the optical fibres and capillary. Standard 1/16th OD microfluidic connectors were used to connect and hold the optical fibres in place, as shown in Figure 2. Although this set-up was sufficient for measuring layer thicknesses in wide bore capillary (>100 µm ID), it was not precise enough to provide the proper alignment for small diameter fibres or for capillary diameters <100 µm ID. To achieve adequate alignment of the fibre, a fibre-optic coupler (L-Com, North Andover, MA, USA) was modified to take a capillary. The capillary sleeve was mounted to the coupler centred on the perpendicular axis to the optical fibre, as shown in Figure 3. The centre of the sleeve was removed once the sleeve was in place, creating a capillary aperture across which the light from the fibres could pass through.
For online studies, this arrangement was mounted next to a feed-through UV curing oven, which allowed the capillary to be fed through the device, facilitating the in-process measurement of the layer growth. Optical power of the light source was approximately 1100 µW/cm2 at 700 nm. This wavelength was used for all optical absorbance studies. For the measurements of layer growth, a capillary filled with appropriate monomer mixture was used as a blank.

4. Results

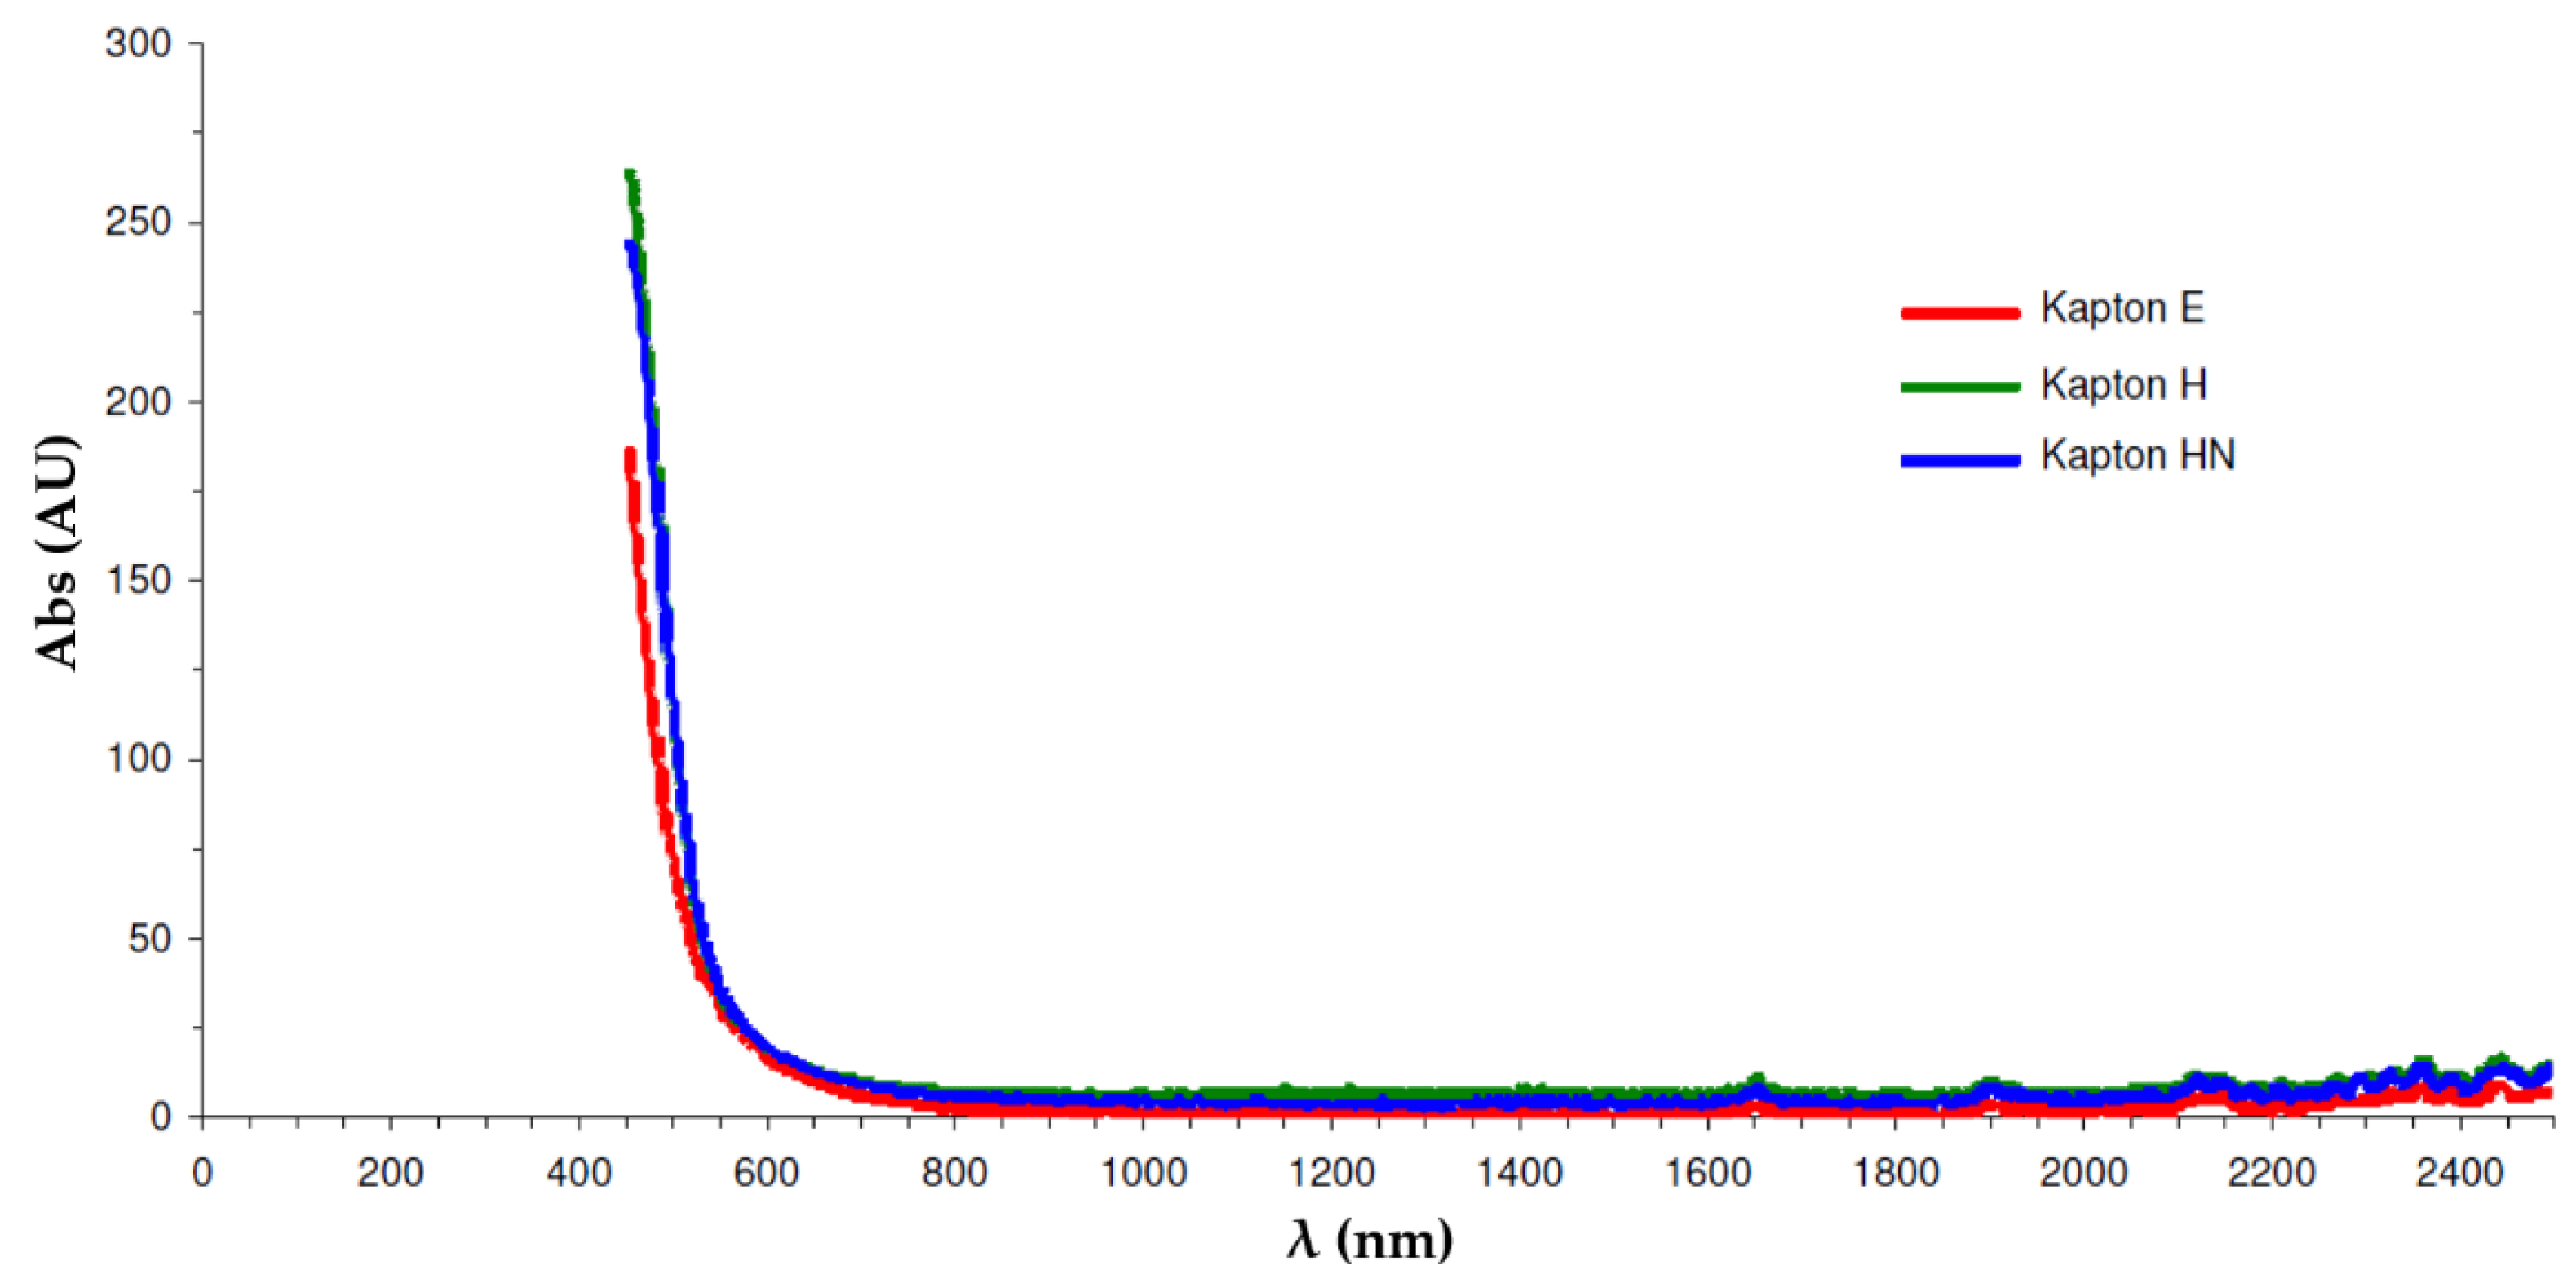
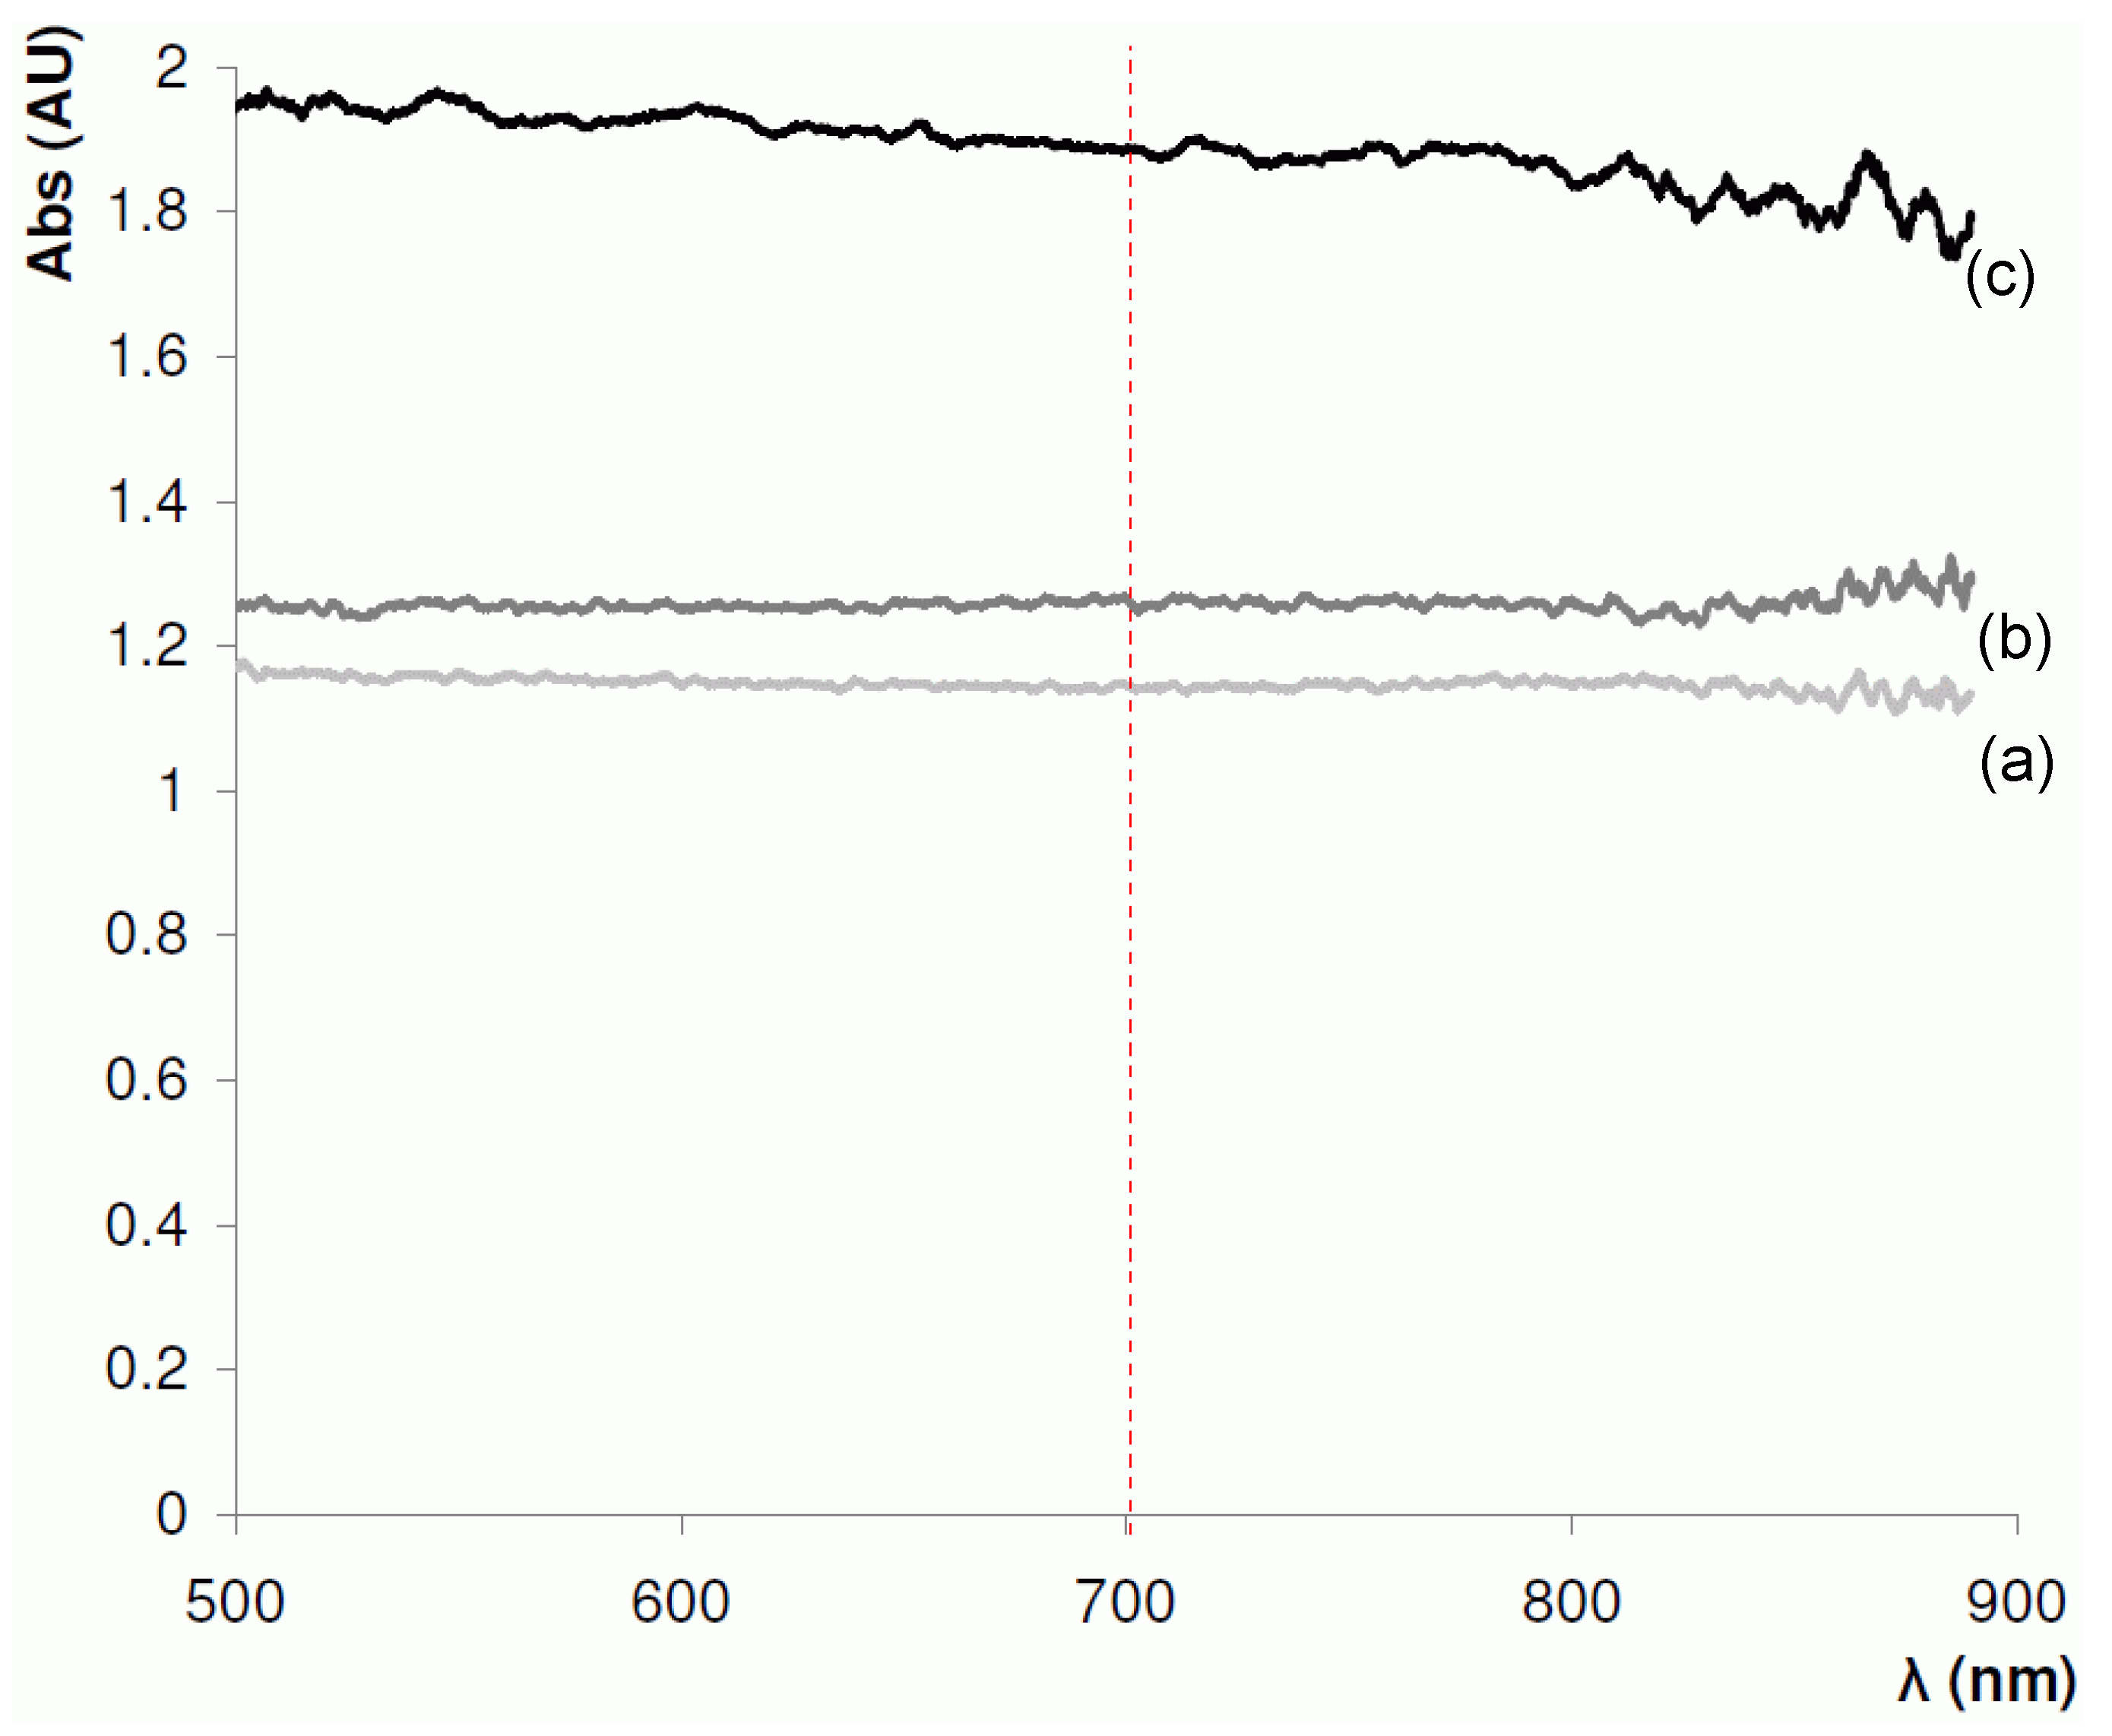
4.1. Selection of Optimal Wavelength

Prior to optical absorbance measurements, it was first necessary to choose a suitable wavelength that could be used for both PTFE- and polyimide-coated capillaries and a range of different polymers. From Figure 4, it can be seen that polyimide absorbs strongly up to approximately 600 nm.
At the next stage, a near-IR absorbance spectra of the BuMA-EDMA polymerisation mixture and a 4.2 µm BuMA-co-EDMA polymer layer, formed in PTFE-coated capillary were recorded (Figure 5). Based on these absorbance spectra, 700 nm was selected as the optimal wavelength for the measurement of optical absorbance, as above 750 nm, the absorbance signal-to-noise ratio diminished significantly. Furthermore, this wavelength is suitable for both PTFE- and polyimide-coated capillaries.

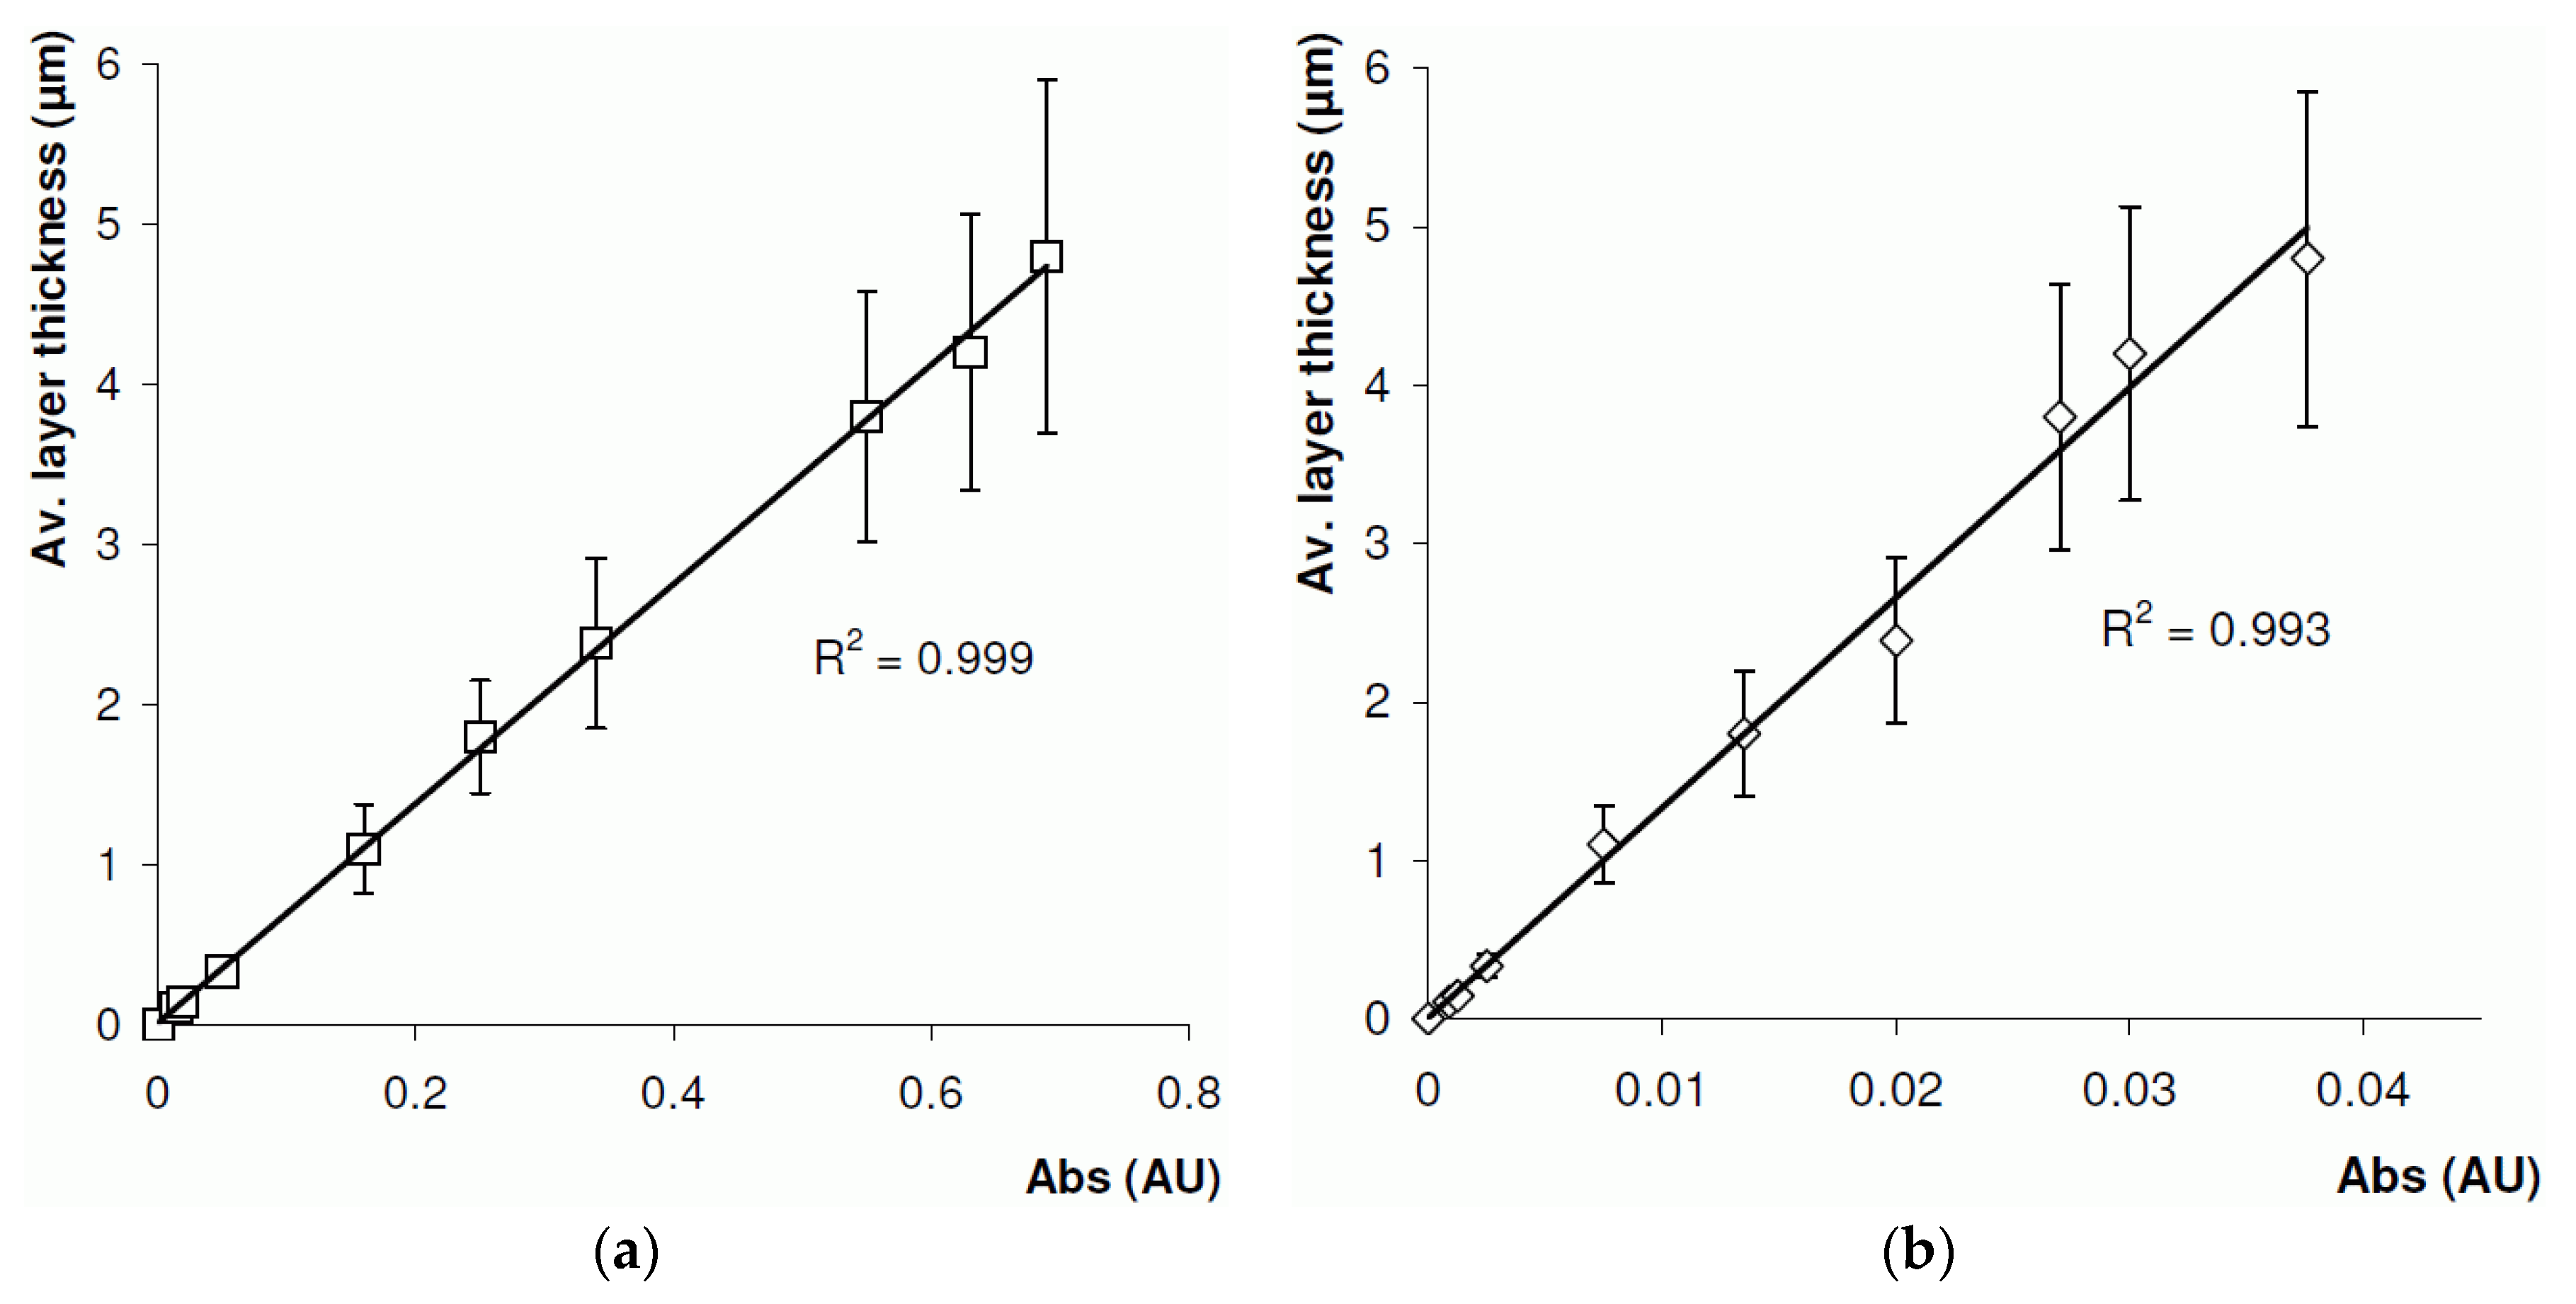
4.2. On-Line Layer Thickness Measurement

Studies of layer thickness were carried out for the BuMA-co-EDMA layer formed in PTFE-coated 100 μm ID capillary. As described above, this capillary was filled with monomer mixture and placed into UV feed-through chamber. One end of the capillary was then fed though the developed optical absorbance cell. Measurements were performed in triplicate, and %RSD values were found to be unacceptably high (>50%). These early results had a low SNR and repeatability due to poor alignment. To allow the capillary to pass freely through the optical detector, a small amount of clearance was required between the sleeve and the capillary, which had a negative impact by allowing the axis capillary to move relative to the axis of the optical fibres.

4.3. Off-Line Layer Thickness Measurement

A second study was carried out to measure the polymer layer thickness off-line. This was achieved by forming a BuMA-co-EDMA monoPLOT column using the laminar flow polymerisation technique described in Section 3.3.1, and removing samples at different periods during the process. A total of 10 samples were taken, with layer thicknesses ranging from 100 nm up to ~5 µm. The samples were immediately placed in the optical detector, and the level of absorbance recorded at 30 locations along the sample. The samples were then washed with MeOH, and a precise measurement of the layer thickness was made using SEM analysis. The results are presented in Figure 6a. The results show excellent linearity between the optical absorbance and layer thickness; however, %RSD was found to be up to approximately 27% for thicker layers.
Clearly, using a 100 µm optical fibre would have serious limitations in the measurement of layer thicknesses in capillaries with internal diameters smaller than 100 µm, since a large percentage of the light would be transmitted around the bore of the capillary. As such, the experiment was repeated with a modified optical cell (Figure 3) using an 8 µm optical fibre. The results for the 8 µm fibre are presented in Figure 6b. Again, excellent linearity was observed, and a %RSD was found to be 22% for thicker layers, which was slightly lower than that when 100 μm optical fibres were used. It is assumed that the relatively high %RSD values in both cases may be due to scatter from the complex interconnecting pore structure of the porous layer.
However, using an optical fibre with such a small diameter meant that the measured response was extremely low. A spectrometer integration time of approximately 10 s was required in order to improve the response. Since each measured thickness was made up of n = 30 samples, it took several minutes to record each data point. The rate of polymer growth is exponential during both photo- and thermally-initiated polymerisation, and the layer thickness can more than double over several minutes, making this technique difficult to employ—particularly for thicker layers, where the polymer growth is fast. The technique could, however, be improved upon in terms of speed and sensitivity by using a higher power light source. A further drawback of the technique is that optical absorbance will be sensitive to the morphology of the polymer layer, with denser, less porous layers absorbing more light than more porous structures. Thus, a high degree of empirical data is required in order for the technique to work effectively.

5. Conclusions

A simple method for the in-process measurement of polymer layer growth inside fused silica capillaries was presented, and showed a linear relationship between layer thickness and optical absorbance. Optical fibres were aligned with the target capillary, and optical absorbance of the polymer layer was measured in the near-IR range. Characterisation of BuMA-co-EDMA layers was carried out using this method, with similar results for both types of capillary. These characterisation studies were also performed on several polymer layer thicknesses up to 5 µm. In addition, a comparison was made between the use of a 100 µm and 8 µm optical fibre, with the latter showing slightly higher accuracy (%RSDs of 27% and 22%, respectively). In the case of the 8 µm optical fibre, however, the alignment of the source and signal fibre became problematic, and a more robust method of aligning the fibres was developed using a modified fibre-optic coupler. Using such a small diameter fibre also required a longer integration time (approximately 10 s), limiting the usefulness of applying the technique using small diameter fibres. One possible solution to this might be to use a more powerful source.
Unlike the previously-described C4D method for monitoring layer thickness, the presented approach is easily applied, and can be used for both photo- and thermally-initiated approaches. Furthermore, the method can be applied easily to both air and water bath polymerisations. However, unlike the C4D approach, the optical absorbance method has a higher %RSD (27% compared with <10%), which may limit its usefulness, depending on the application. Nevertheless, the technique is easy to apply, robust, and can be used with most common methods for PLOT and monoPLOT fabrication, as well as for measurement of non-porous solid or liquid films, depending on optical properties of the material.

Acknowledgments

The authors would like to acknowledge financial support from Enterprise Ireland for the Commercialisation Fund Award (CF/2015/0262).

Author Contributions

David Collins and Ekaterina Nesterenko conceived and designed the experiments; David Collins performed the experiments; David Collins, Ekaterina Nesterenko and Brett Paull analysed the data; Brett Paull contributed reagents/materials/analysis tools; David Collins and Ekaterina Nesterenko wrote the paper.

Conflicts of Interest

The authors declare no conflict of interest.

Abbreviations

The following abbreviations are used in this manuscript:
AFMAtomic force microscopy
BuMAbutyl methacrylate
C4DCapacitively coupled contactless conductivity detection
DVBdivinylbenzene
EDMAethylene glycol dimethacrylate
IRInfrared
monoPLOTmonolithic porous layer open tubular
PLOTporous layer open tubular
PSpolystyrene
RSDRelative standard deviation
SNRSignal to noise ratio
UVUltraviolet

References

  1. Niessen, W.M.A.; Poppe, H.J. Open-tubular liquid-chromatography mass-spectrometry using direct liquid introduction. J. Chromatogr. A 1985, 323, 37–46. [Google Scholar] [CrossRef]
  2. Escoffier, B.H.; Parker, C.E.; Mester, T.C.; Dewit, J.S.M.; Corbin, F.T.; Jorgensen, J.W.; Tomer, K.B. Comparison of open-tubular liquid-chromatography mass-spectrometry and direct liquid introduction liquid-chromatography mass-spectrometry for the analysis of metribuzin and its metabolites in plant-tissue and water samples. J. Chromatogr. A 1989, 474, 301–316. [Google Scholar] [CrossRef]
  3. Swart, R.; Kraak, J.C.; Poppe, H. Recent progress in open tubular liquid chromatography. TrAC Trends Anal. Chem. 1997, 16, 332–342. [Google Scholar] [CrossRef]
  4. Yue, G.; Luo, Q.; Zhang, J.; Wu, S.L.; Karger, B.L. Ultratrace LC/MS proteomic analysis using 10-µm-i.d. Porous layer open tubular poly(styrene-divinylbenzene) capillary columns. Anal. Chem. 2007, 79, 938–946. [Google Scholar] [CrossRef] [PubMed]
  5. Rogeberg, M.; Wilson, S.R.; Greibrokk, T.; Lundanes, E. Separation of intact proteins on porous layer open tubular (PLOT) columns. J. Chromatogr. A 2010, 1217, 2782–2786. [Google Scholar] [CrossRef] [PubMed]
  6. Wang, D.; Hincapie, M.; Rejtar, T.; Karger, B.L. Ultrasensitive characterization of site-specific glycosylation of affinity-purified haptoglobin from lung cancer patient plasma using 10 µm i.d. porous layer open tubular liquid chromatography-linear ion trap collision-induced dissociation/electron transfer dissociation mass spectrometry. Anal. Chem. 2011, 83, 2029–2037. [Google Scholar] [PubMed]
  7. Causon, T.J.; Shellie, R.A.; Hilder, E.F.; Desmet, G.; Eeltink, S. Kinetic optimisation of open-tubular liquid-chromatography capillaries coated with thick porous layers for increased loadability. J. Chromatogr. A 2011, 1218, 8388–8393. [Google Scholar] [CrossRef] [PubMed]
  8. Collins, D.; Nesterenko, E.; Paull, B. Porous layer open tubular columns in capillary liquid chromatography. Analyst 2014, 139, 1292–1302. [Google Scholar] [CrossRef] [PubMed]
  9. Knob, R.; Kulsing, C.; Boysend, R.I.; Macka, M.; Hearn, M.T.W. Surface-area expansion with monolithic open tubular columns. TrAC Trends Anal. Chem. 2015, 67, 16–25. [Google Scholar] [CrossRef]
  10. Eeltink, S.; Svec, F.; Frechet, J.M.J. Open-tubular capillary columns with a porous layer of monolithic polymer for highly efficient and fast separations in electrochromatography. Electrophoresis 2006, 27, 4249–4256. [Google Scholar] [CrossRef] [PubMed]
  11. Yu, C.; Svec, F.; Frechet, J.M.J. Towards stationary phases for chromatography on a microchip: Molded porous polymer monoliths prepared in capillaries by photoinitiated in situ polymerization as separation media for electrochromatography. Electrophoresis 2000, 21, 120–127. [Google Scholar] [CrossRef]
  12. Zaidi, A.; Cheong, W.J. Long open tubular molecule imprinted polymer capillary columns with excellent separation efficiencies in chiral and non-chiral separation by capillary electrochromatography. Electrophoresis 2009, 30, 1603–1607. [Google Scholar] [CrossRef] [PubMed]
  13. Chen, J.L.; Lin, Y.C. Succinyl methacrylate polymerized in porous-layered phases for open-tubular capillary electrochromatography: Comparison with silica hydride monolayered phases. J. Chromatogr. A 2010, 1217, 4328–4336. [Google Scholar] [CrossRef] [PubMed]
  14. Tarangoy, F.M., Jr.; Haddad, P.R.; Boysen, R.I.; Hearn, M.T.W.; Quirino, J. Open tubular-capillary electrochromatography: Developments and applications from 2013 to 2015. Electrophoresis 2016, 37, 66–85. [Google Scholar] [CrossRef] [PubMed]
  15. Bakry, R.; Gjerde, D.; Bonn, G.K. Derivatized nanoparticle coated capillaries for purification and micro-extraction of proteins and peptides. J. Proteome Res. 2006, 5, 1321–1331. [Google Scholar] [CrossRef] [PubMed]
  16. Hirayama, Y.; Ohmichi, M.; Tatsumoto, H. Simple and rapid determination of golf course pesticides by in-tube solid-phase microextraction coupled with liquid chromatography. J. Health Sci. 2005, 51, 526–532. [Google Scholar] [CrossRef]
  17. de Zeeuw, J. The Development and Applications of PLOT Columns in Gas-Solid Chromatography. LC-GC Eur. 2011, 24, 38–45. [Google Scholar]
  18. Nesterenko, E.; Burke, M.; de Bosset, C.; Pessutto, P.; Malafosse, C.; Collins, D. Monolithic porous layer open tubular (monoPLOT) capillary columns for gas chromatography. RSC Adv. 2015, 5, 7890–7896. [Google Scholar] [CrossRef]
  19. Collins, D.; Nesterenko, E.; Paull, B. Infrared photo-initiated fabrication of monolithic porous layer open tubular (monoPLOT) capillary columns for chromatographic applications. RSC Adv. 2014, 4, 28165–28170. [Google Scholar] [CrossRef]
  20. Collins, D.; Nesterenko, E.; Brabazon, D.; Paull, B. Fabrication of bonded monolithic porous layer open tubular (monoPLOT) columns in wide bore capillary by laminar flow thermal initiation. Chromatographia 2013, 76, 581–589. [Google Scholar] [CrossRef]
  21. Collins, D.; Nesterenko, E.; Brabazon, D.; Paull, B. Controlled ultraviolet (UV) photoinitiated fabrication of monolithic porous layer open tubular (monoPLOT) capillary columns for chromatographic applications. Anal. Chem. 2012, 84, 3465–3472. [Google Scholar] [CrossRef] [PubMed]
  22. Collins, D.; Nesterenko, E.; Brabazon, D.; Paull, B. In-process phase growth measurement technique in the fabrication of monolithic porous layer open tubular (monoPLOT) columns using capacitively coupled contactless conductivity. Analyst 2013, 138, 2540–2545. [Google Scholar] [CrossRef] [PubMed]
  23. Svec, F.; Tennikova, T.B.; Deyl, Z. Monolithic Materials: Preparation, Properties and Applications, 1st ed.; Elsevier Science: Amsterdam, The Netherlands, 2003. [Google Scholar]
  24. Veerkamp, T.H.; De Kock, R.J.; Veermans, A.; Lardinoye, M.H. Thickness measurement of polymer films for infrared spectrometry by beta-ray absorption analysis of ethane-propene copolymers. Anal. Chem. 1964, 36, 2277–2278. [Google Scholar] [CrossRef]
  25. Toney, M.; Mate, M.; Leach, A.; Pocker, D. Thichness measurements of thin perfluoropolyether polymer films on silicon and amorphous-hydrogenated carbon with X-ray reflectivity, ESCA and optical ellipsometry. J. Colloid Interface Sci. 2000, 225, 219–226. [Google Scholar] [CrossRef] [PubMed]
  26. Macomber, C.; Eastman, M.; Porter, T.L.; Manygoats, K.; Delinger, W. Chemical sensing through measurement of thickness/impedance characteristics of ion-conducting polymer films. J. Electrochem. Soc. 2003, 150, H172–H177. [Google Scholar] [CrossRef]
  27. Fitt, A.D.; Owen, J.R. Simultaneous measurements of conductivity and thickness for polymer electrolyte films: A simulation study. J. Electroanal. Chem. 2002, 538–539, 13–23. [Google Scholar] [CrossRef]
  28. Brand, U.; Beckert, E.; Beutler, A.; Dai, G.; Stelzer, C.; Hertwig, A.; Klapetek, P.; Koglin, J.; Thelen, R.; Tutsch, R. Comparison of optical and tactile layer thickness measurements of polymers and metals on silicon or SiO2. Meas. Sci. Technol. 2011, 22, 094021. [Google Scholar] [CrossRef]
  29. Hong, X.; Gan, Y.; Wang, Y. Facile measurement of polymer film thickness ranging from nanometer to micrometer scale using atomic force microscopy. Surf. Interface Anal. 2011, 43, 1299–1303. [Google Scholar] [CrossRef]
  30. Lobo, R.; Pereira-da-Silva, M.; Raposo, M.; Faria, R.; Oliveira, O. In situ thickness measurements of ultra-thin multilayer polymer films by atomic force microscopy. Nanotechnology 1999, 10, 389–393. [Google Scholar] [CrossRef]
  31. Maev, R.G. Acoustic Microscopy: Fundamentals and Applications; John Wiley & Sons: New York, NY, USA, 2008. [Google Scholar]
  32. Grunlan, J.; Mehrabi, A.; Ly, T. High-throughput measurement of polymer film thickness using optical dyes. Meas. Sci. Technol. 2005, 16, 153–161. [Google Scholar] [CrossRef]
  33. Harris, D. Quantitative Chemical Analysis, 6th ed.; W.H. Freeman & Company: New York, NY, USA, 2003. [Google Scholar]
  34. Florea, L.; Hennart, A.; Diamond, D.; Benito-Lopez, F. Synthesis and characterisation of spiropyran-polymer brushes in micro-capillaries: Towards an integrated optical sensor for continuous flow analysis. Sens. Actuators B 2012, 175, 92–99. [Google Scholar] [CrossRef]
Figure 1. Scanning electron microscopy (SEM) image of a low porosity 1 µm polymer (polystyrene-co-divinylbenzene) monolithic layer formed inside a 75 µm ID fused silica capillary. The structure itself (i.e., the porous layer within the capillary) is referred to as a “monoPLOT” column.
Separations 03 00034 g001
Figure 2. Arrangement of the initial fibre-optic and coupling assembly for the in-process measurement of polymer layer thickness. The black fitting is a 4-way 10/32″ microfluidic piece. The other connectors are 10/32″ microfluidic connectors with 400 and 100 µm ID sleeves (1/16″ OD) for the capillary and optical fibre, respectively.
Separations 03 00034 g002
Figure 3. Modified fibre coupler which provided a more precisely aligned assembly than that shown in Figure 2. The sleeve is 380 µm ID and 635 µm OD.
Separations 03 00034 g003
Figure 4. Optical absorbance of some common polyimide polymers.
Separations 03 00034 g004
Figure 5. Absorption spectra for a 100 µm ID PTFE-coated fused silica capillary in the near-IR range (500–1000 nm) using a 100 µm optical fibre. (a) empty capillary; (b) capillary filled with butyl methacrylate–ethylene dimethacrylate (BuMA-EDMA) monomer mixture; and (c) capillary with a 4.2 µm BuMA-co-EDMA polymer layer.
Separations 03 00034 g005
Figure 6. Relationship between monolithic porous layer open tubular column layer thickness and optical absorbance at 700 nm for BuMA-co-EDMA layer formed inside a 100 µm ID polyimide-coated fused silica capillary using (a) 100 µm and (b) 8 µm optical fibre.
Separations 03 00034 g006

