
Postmortem Internal Gas Reservoir Monitoring Using GC×GC-HRTOF-MS


 ,
,
Abstract
:
1. Introduction
2. Materials and Methods
2.1. Sampling
2.1.1. Internal Gas Sampling
2.1.2. VOC Sampling
2.2. Sample Analysis and Data Processing
3. Results and Discussion
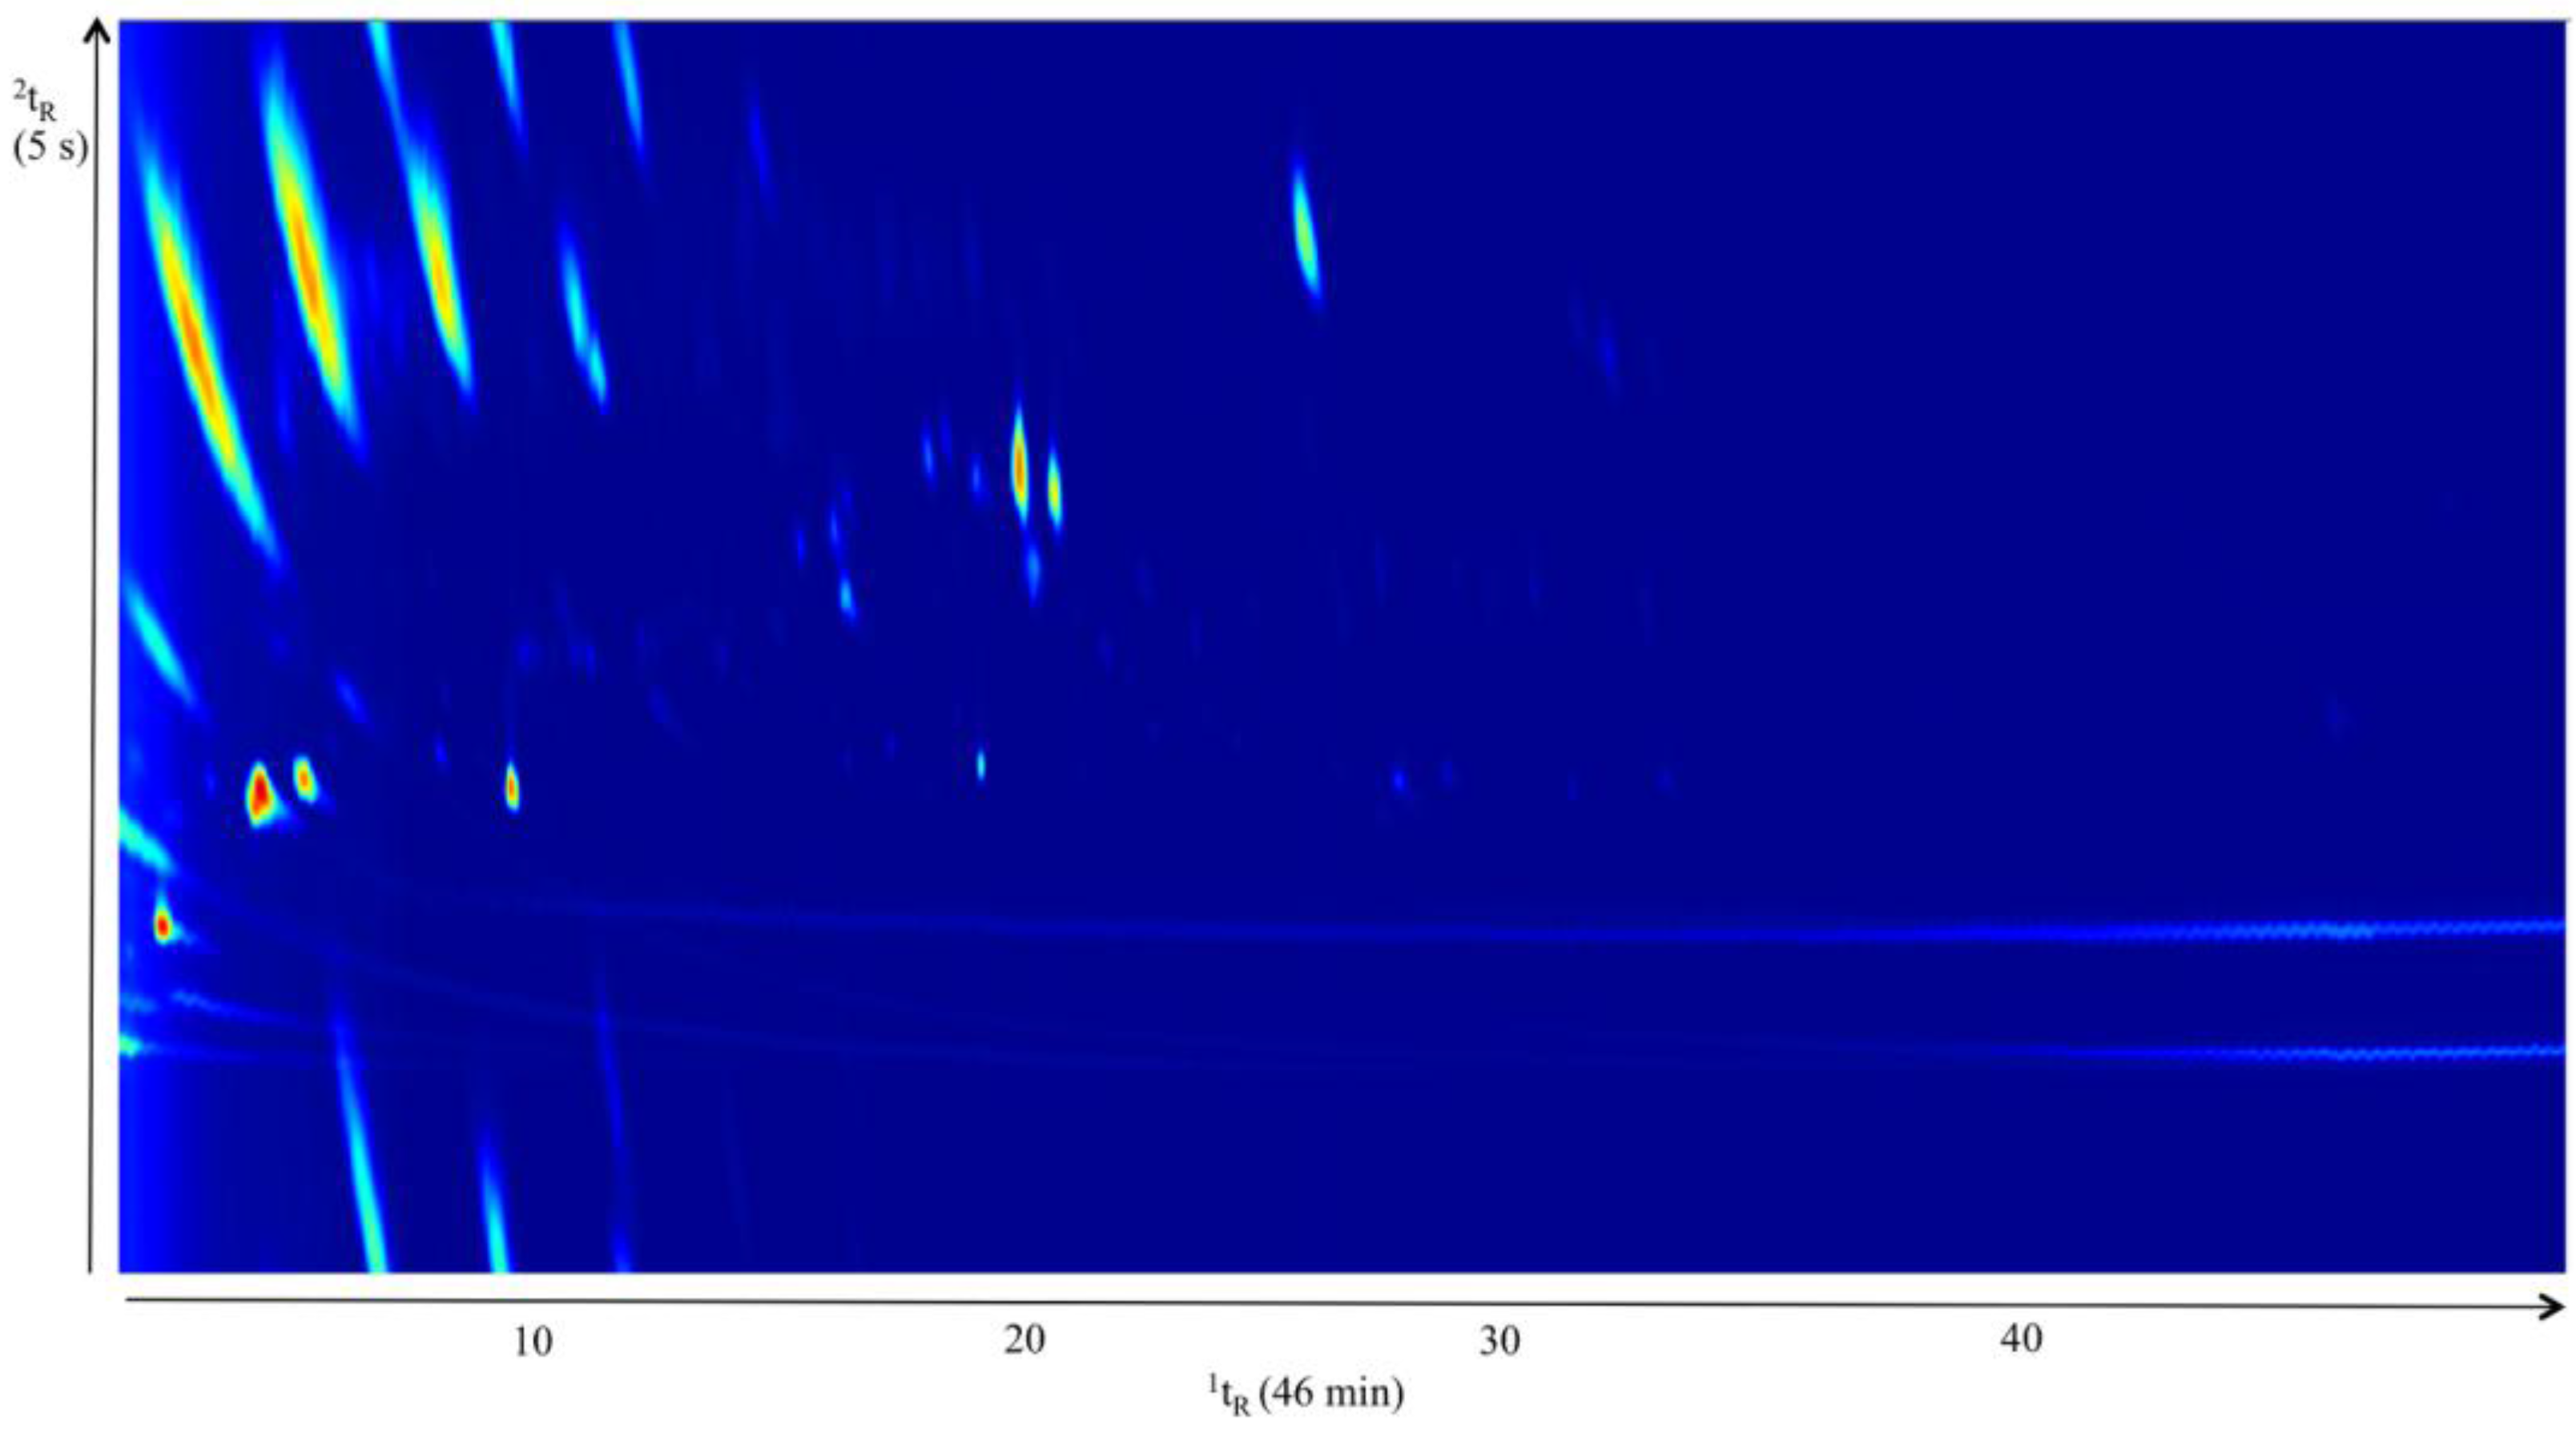
3.1. Chromatographic Considerations and Data Processing
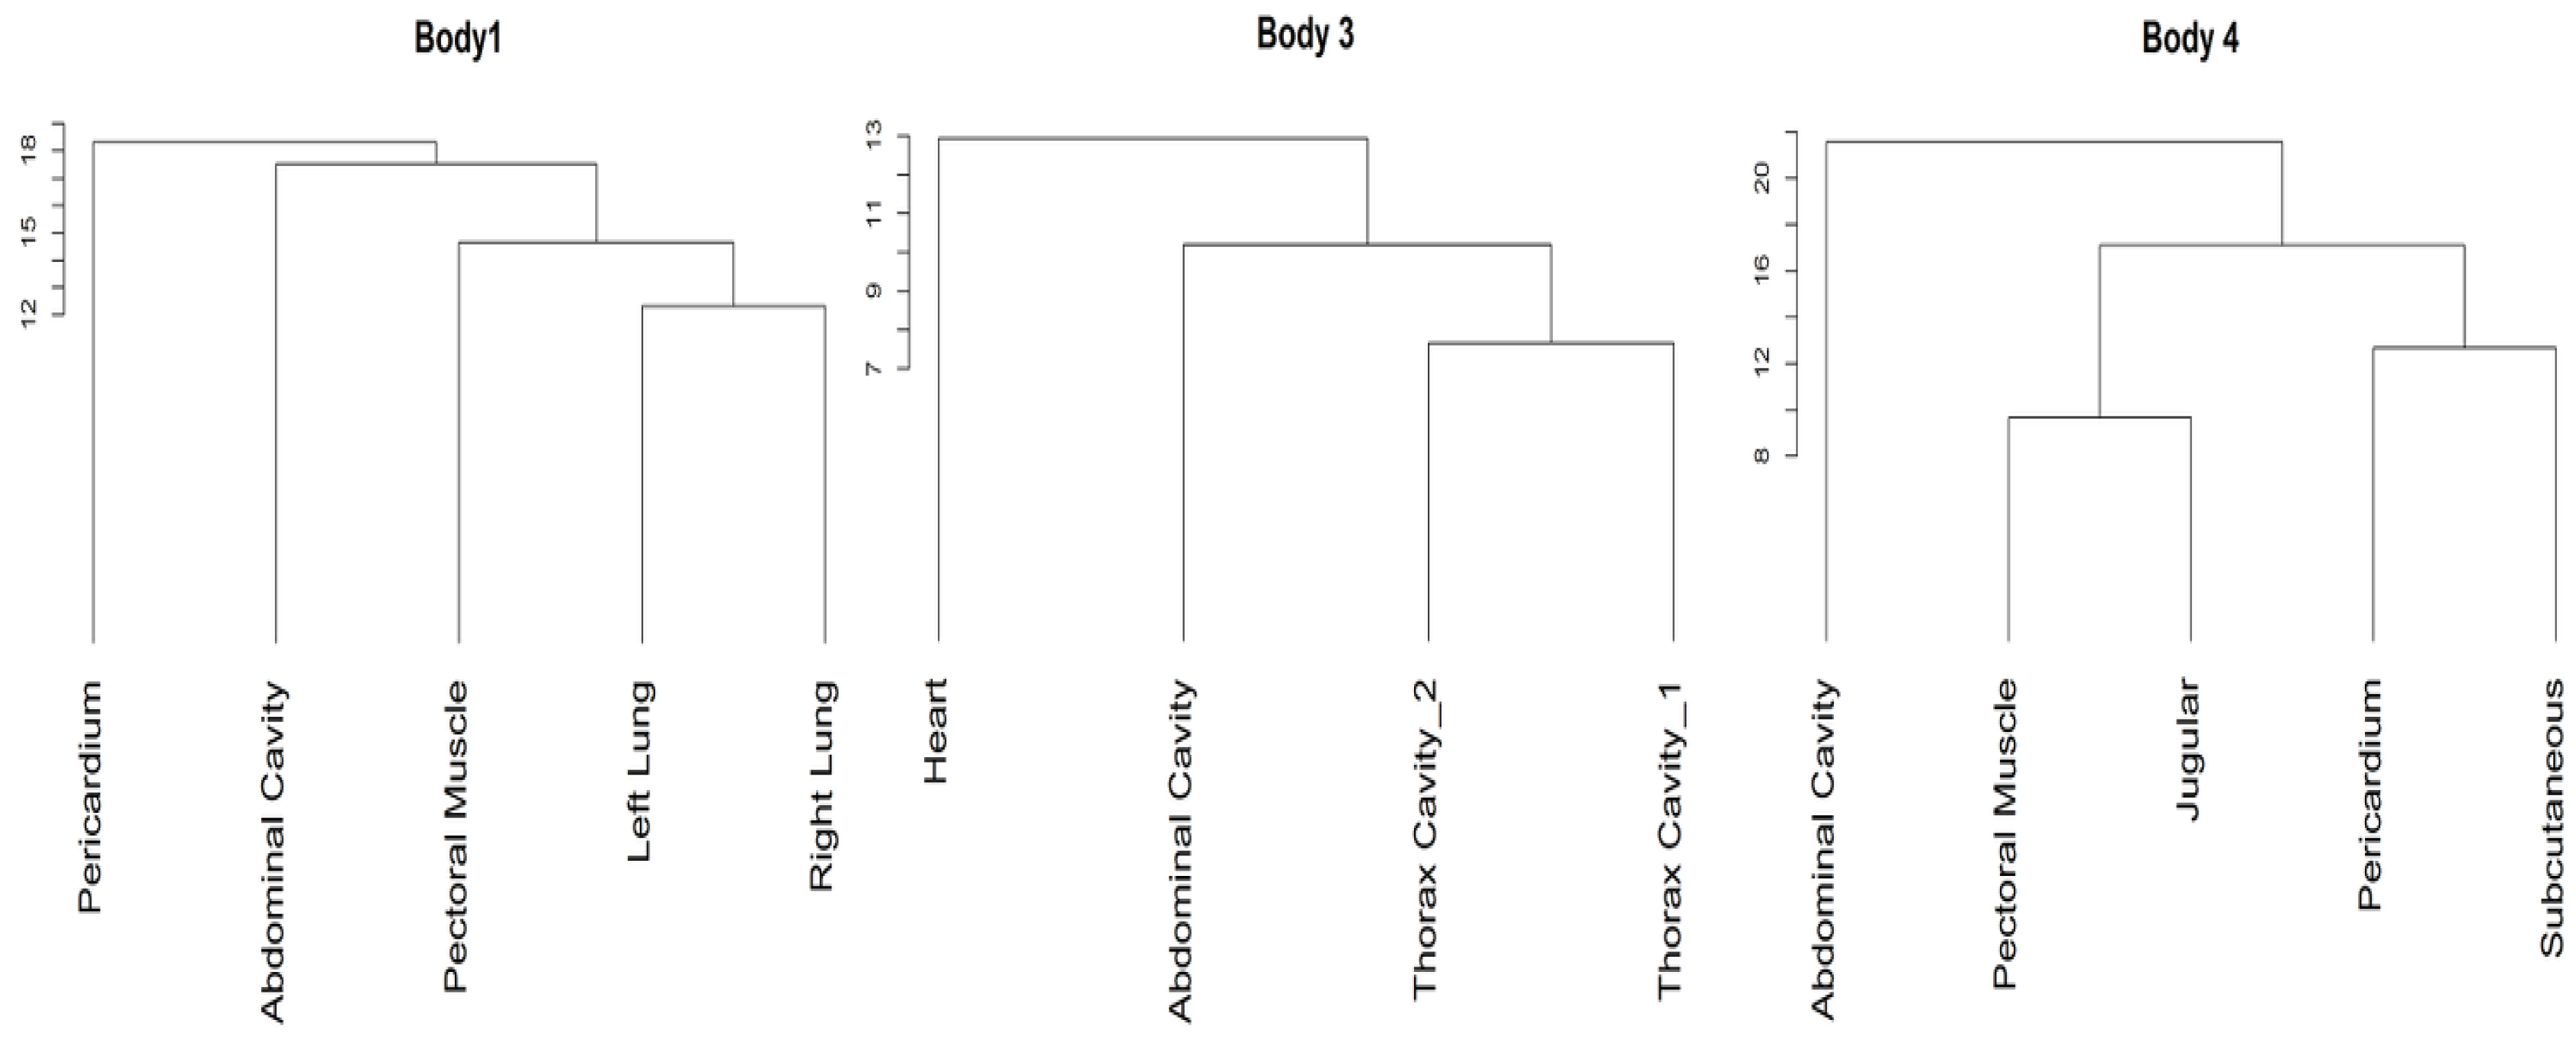
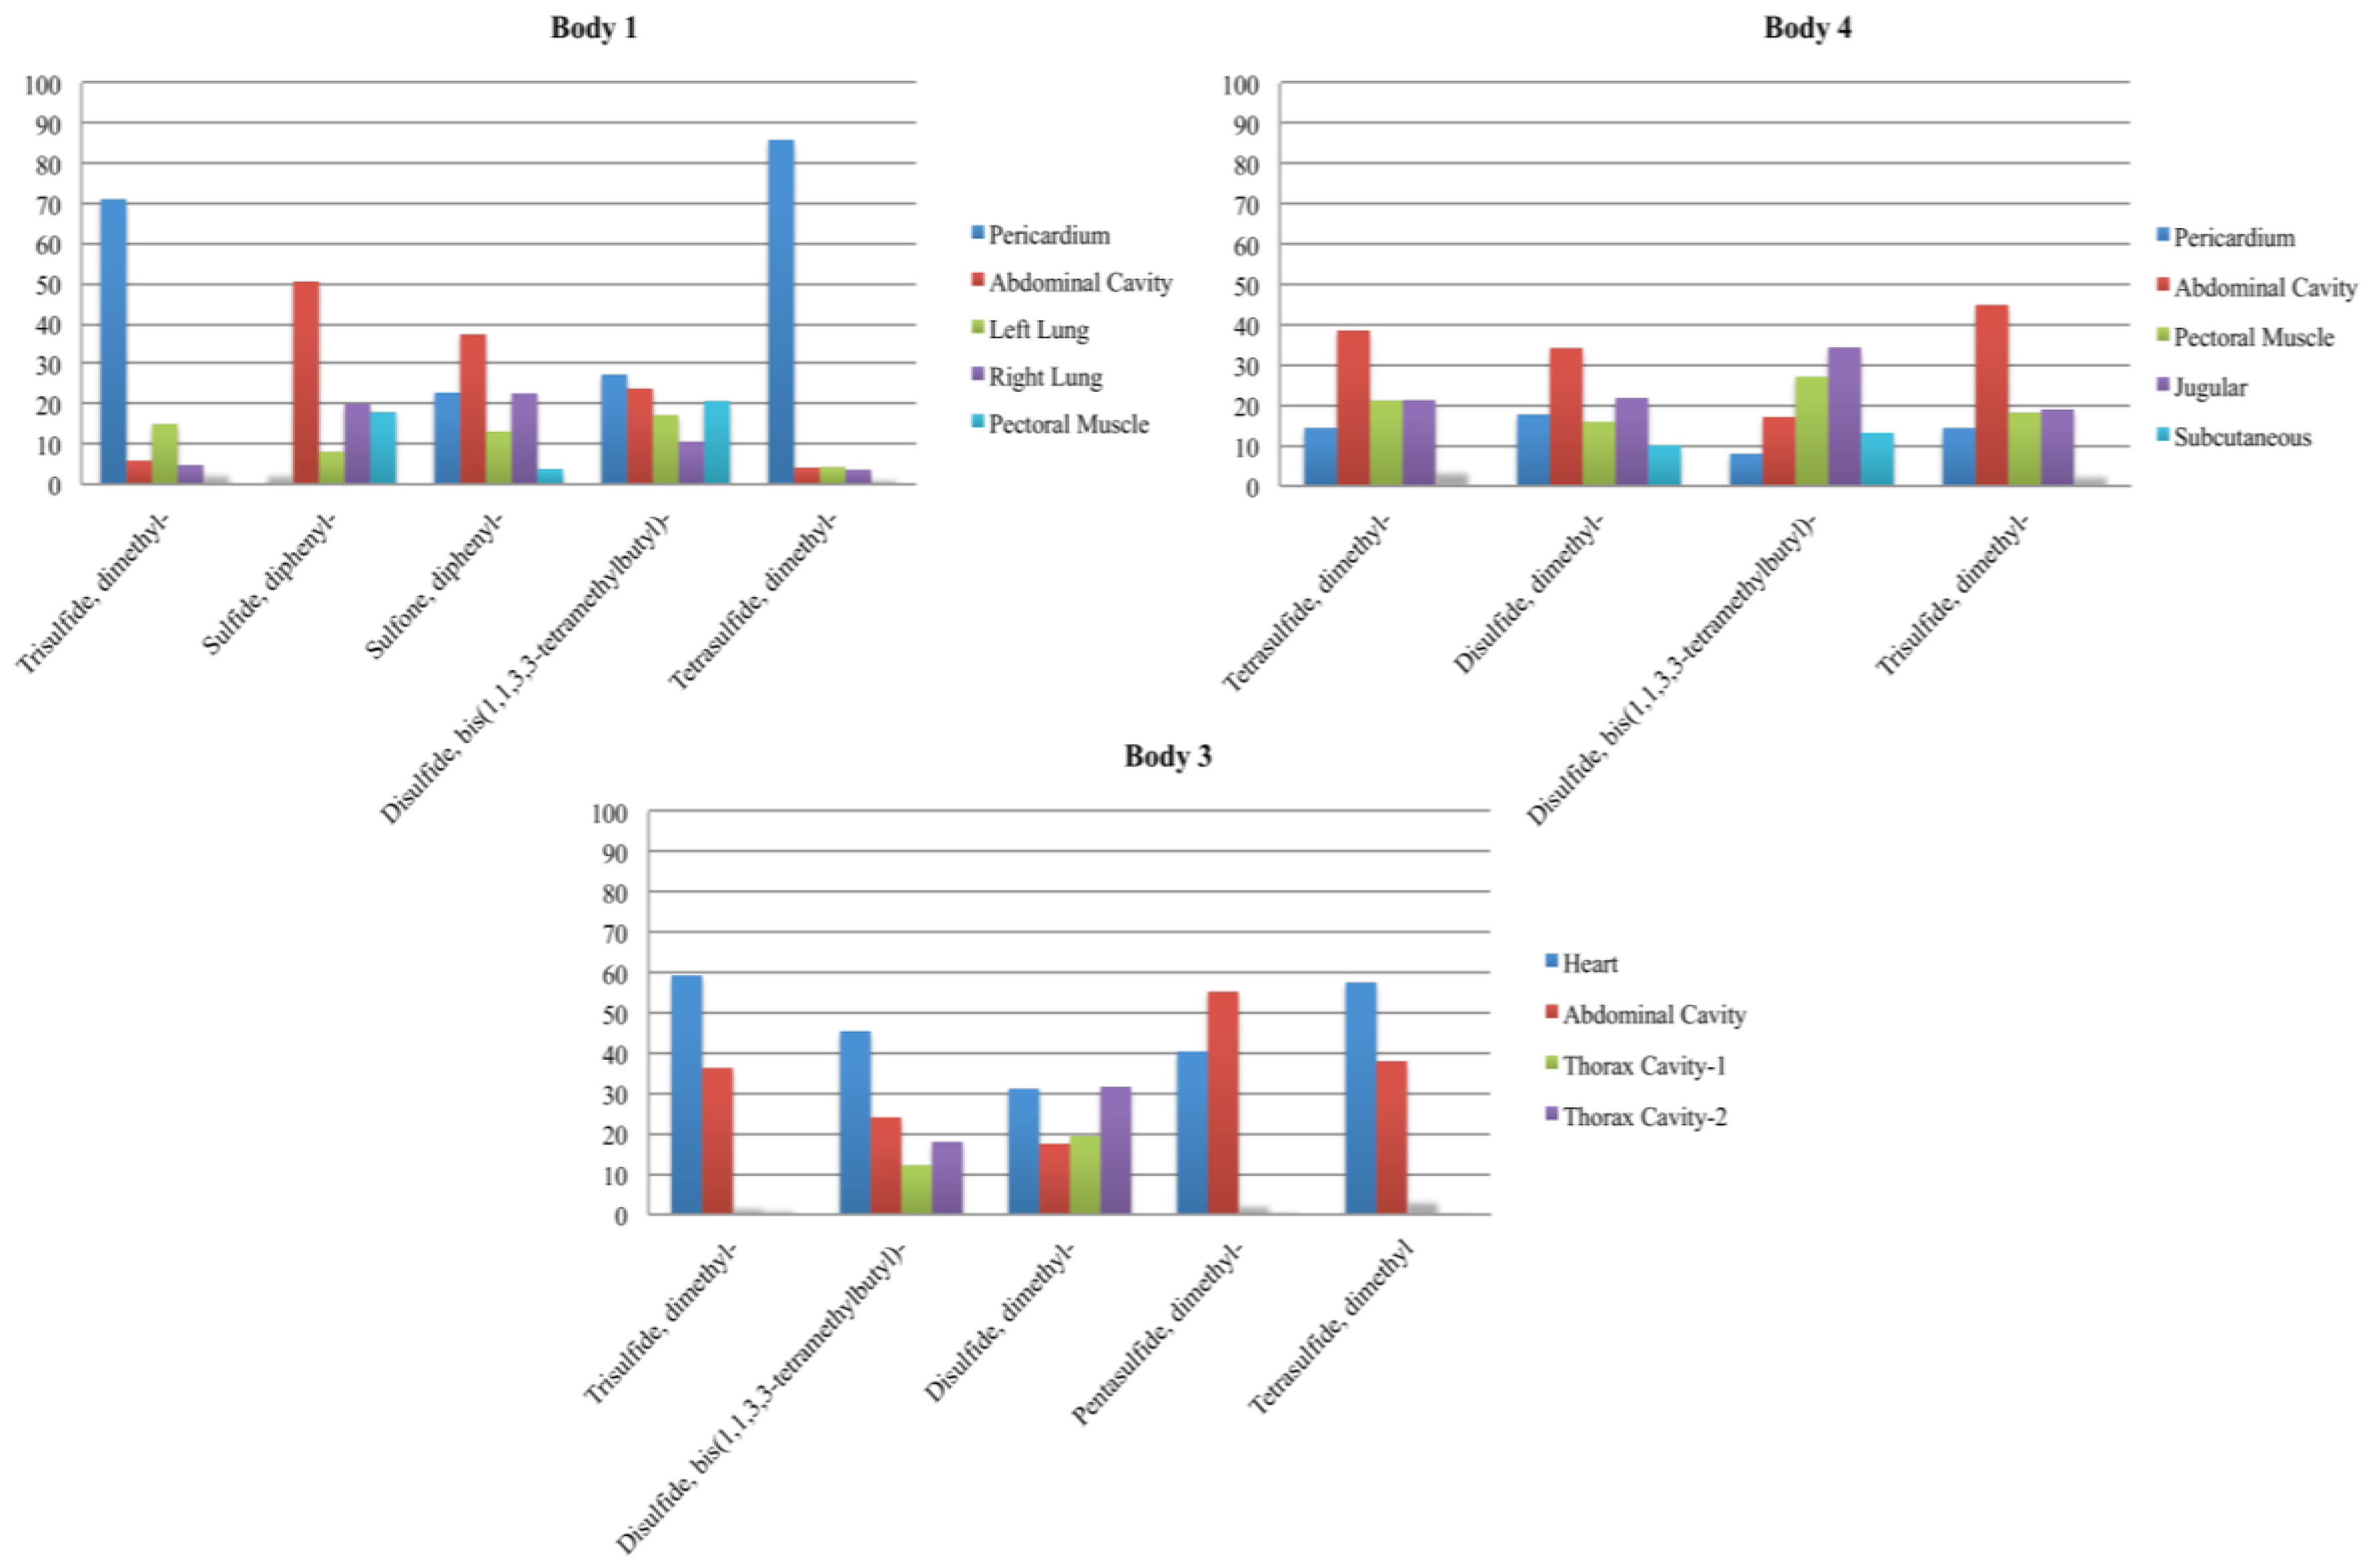
3.2. Intra-Body Analysis
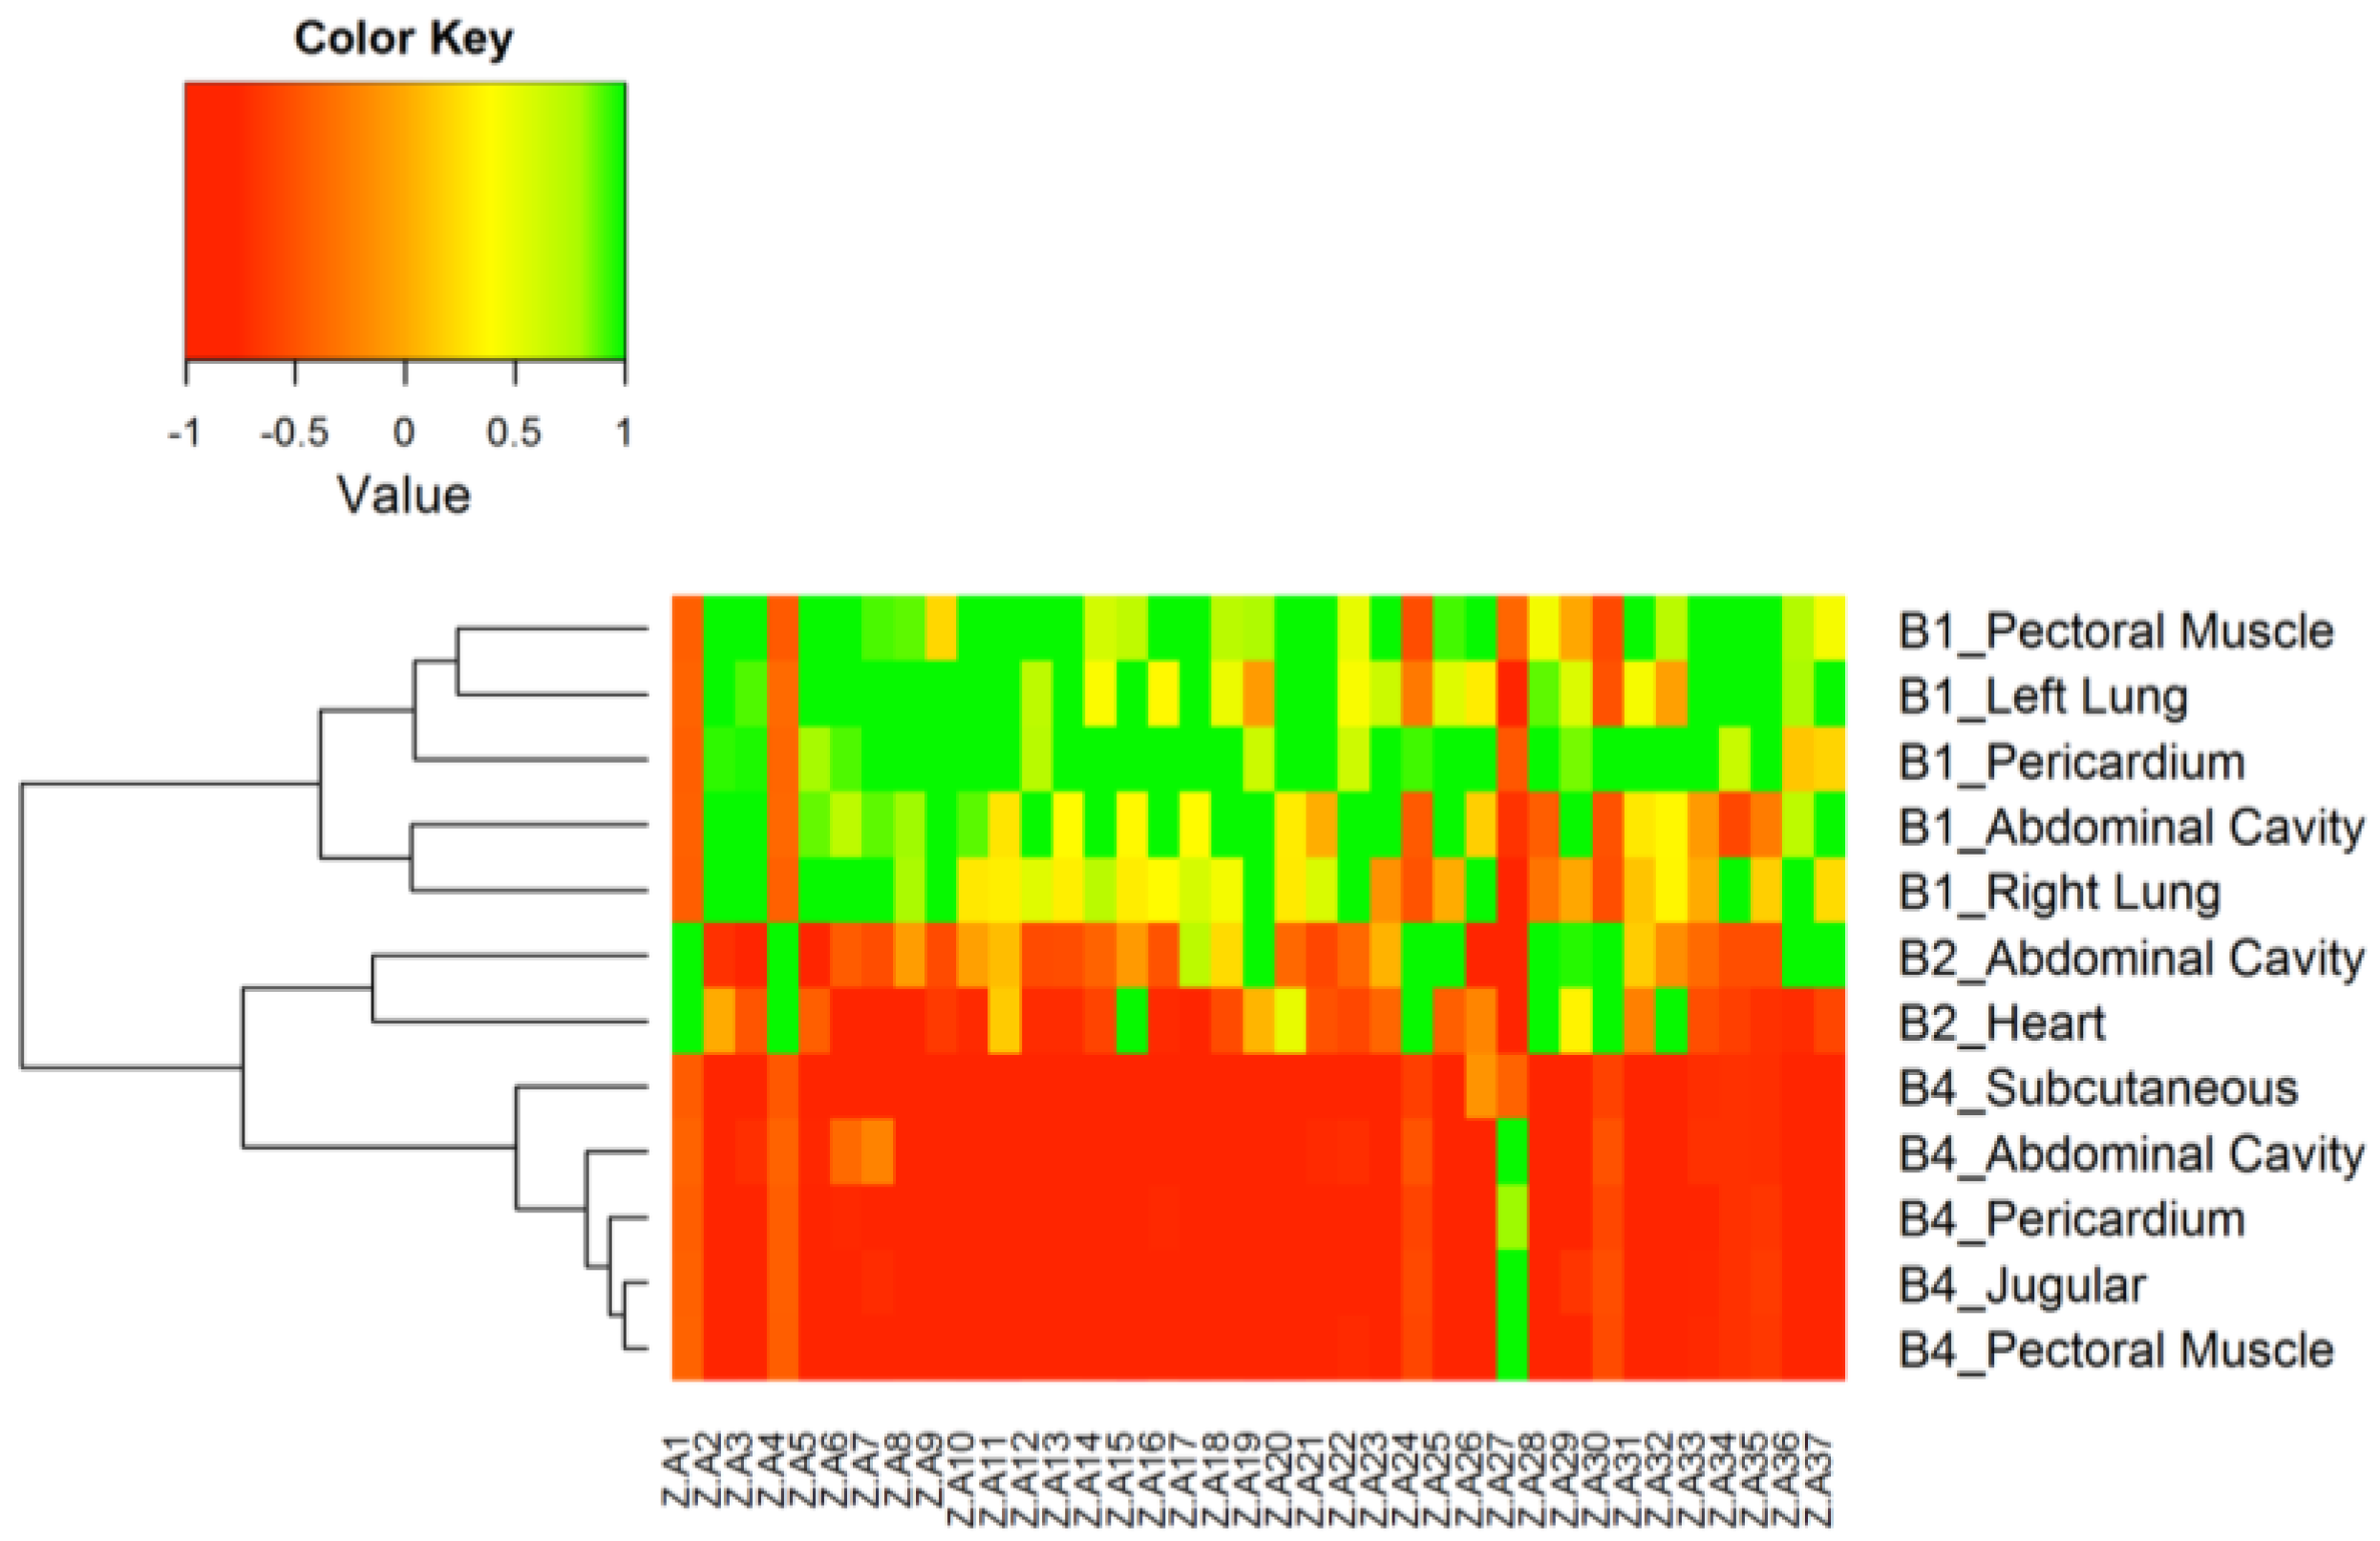
3.3. Inter-Body Analysis
4. Conclusions
Acknowledgments
Author Contributions
Conflicts of Interest
Abbreviations
| MDCP | multi-detector computed tomography |
| VOCs | volatile organic compounds |
| GC×GC | comprehensive two-dimensional gas chromatography |
| HRTOF-MS | time of flight high-resolution mass spectrometry |
| PMI | postmortem interval |
| SPME | solid phase microextraction |
| PDMS | polydimethylsiloxane |
| 1D | first dimension |
| 2D | second dimension |
| 1D GC | one-dimensional gas chromatography |
| PM | modulation period |
| EI | electron ionization |
| PFK | perfluorokerozene |
| HCA | hierarchical cluster analysis |
| TIC | total ion current |
| FR | Fisher ratio |
| Fcrit | F critical |
| 1tR | 1st dimension retention time |
| 2tR | 2nd dimension retention time |
References
- Jacobsen, C.; Lynnerup, N. Craniocerebral trauma—Congruence between post-mortem computed tomography diagnoses and autopsy results. Forensic Sci. Int. 2010, 194, 9–14. [Google Scholar] [CrossRef] [PubMed]
- Roberts, I.S.D.; Benamore, R.E.; Benbow, E.W.; Lee, S.H.; Harris, J.N.; Jackson, A.; Mallett, S.; Patankar, T.; Peebles, C.; Roobottom, C.; et al. Post-mortem imaging as an alternative to autopsy in the diagnosis of adult deaths: A validation study. Lancet 2012, 379, 136–142. [Google Scholar] [CrossRef]
- Kasahara, S.; Makino, Y.; Hayakawa, M.; Yajima, D.; Ito, H.; Iwase, H. Diagnosable and non-diagnosable causes of death by postmortem computed tomography: A review of 339 forensic cases. Legal Med. 2012, 14, 239–245. [Google Scholar] [CrossRef] [PubMed]
- Varlet, V.; De Croutte, E.L.; Augsburger, M.; Mangin, P. A new approach for the carbon monoxide (CO) exposure diagnosis: measurement of total CO in human blood versus carboxyhemoglobin (HbCO). J. Forensic Sci. 2013, 58, 1041–1046. [Google Scholar] [CrossRef] [PubMed]
- Varlet, V.; Giuliani, N.; Palmiere, C.; Maujean, G.; Augsburger, M. Hydrogen sulfide measurement by headspace-gas chromatography-mass spectrometry (HS-GC-MS): Application to gaseous samples and gas dissolved in muscle. J. Anal. Toxicol. 2015, 39, 52–57. [Google Scholar] [CrossRef] [PubMed]
- Banaschak, S.; Janßen, K.; Becker, K.; Friedrich, K.; Rothschild, M.A. Fatal postpartum air embolism due to uterine inversion and atonic hemorrhage. Int. J. Legal Med. 2013, 128, 147–150. [Google Scholar] [CrossRef] [PubMed]
- Brasseur, C.; Dekeirsschieter, J.; Schotsmans, E.M.J.; de Koning, S.; Wilson, A.S.; Haubruge, E.; Focant, J.-F. Comprehensive two-dimensional gas chromatography-time-of-flight mass spectrometry for the forensic study of cadaveric volatile organic compounds released in soil by buried decaying pig carcasses. J. Chromatogr. 2012, 1255, 163–170. [Google Scholar] [CrossRef] [PubMed]
- Perrault, K.; Stuart, B.; Forbes, S. A longitudinal study of decomposition odour in soil using sorbent tubes and solid phase microextraction. Chromatography 2014, 1, 120–140. [Google Scholar] [CrossRef]
- Forbes, S.L.; Perrault, K.A. Decomposition odour profiling in the air and soil surrounding vertebrate carrion. PLoS ONE 2014, 9. [Google Scholar] [CrossRef] [PubMed]
- Perrault, K.A.; Stefanuto, P.-H.; Stuart, B.H.; Rai, T.; Focant, J.-F.; Forbes, S.L. Reducing variation in decomposition odour profiling using comprehensive two-dimensional gas chromatography. J. Sep. Sci. 2014, 38, 73–80. [Google Scholar] [CrossRef] [PubMed]
- Stefanuto, P.-H.; Perrault, K.A.; Lloyd, R.M.; Stuart, B.; Rai, T.; Forbes, S.L.; Focant, J.-F. Exploring new dimensions in cadaveric decomposition odour analysis. Anal. Methods 2015, 7, 2287–2294. [Google Scholar] [CrossRef]
- Dekeirsschieter, J.; Stefanuto, P.-H.; Brasseur, C.; Haubruge, E.; Focant, J.-F. Enhanced characterization of the smell of death by comprehensive two-dimensional gas chromatography-time-of-flight mass spectrometry (GC×GC–TOFMS). PLoS ONE 2012, 7. [Google Scholar] [CrossRef] [PubMed]
- Stefanuto, P.-H.; Perrault, K.A.; Stadler, S.; Pesesse, R.; LeBlanc, H.N.; Forbes, S.L.; Focant, J.-F. GC×GC–TOFMS and supervised multivariate approaches to study human cadaveric decomposition olfactive signatures. Anal. Bioanal. Chem. 2015, 407, 4767–4778. [Google Scholar] [CrossRef] [PubMed]
- Stefanuto, P.-H.; Perrault, K.; Stadler, S.; Pesesse, R.; Brokl, M.; Forbes, S.; Focant, J.-F. Reading cadaveric decomposition chemistry with a new pair of glasses. Chem. Plus Chem. 2014, 79, 786–789. [Google Scholar] [CrossRef]
- Stadler, S.; Stefanuto, P.-H.; Brokl, M.; Forbes, S.L.; Focant, J.-F. Characterization of volatile organic compounds from human analogue decomposition using thermal desorption coupled to comprehensive two-dimensional gas chromatography-time-of-flight mass spectrometry. Anal. Chem. 2013, 85, 998–1005. [Google Scholar] [CrossRef] [PubMed]
- Focant, J.-F.; Stefanuto, P.-H.; Brasseur, C.; Dekeirsschieter, J.; Haubruge, E.; Schotsmans, E.; Wilson, A.; Stadler, S.; Forbes, S. Forensic cadaveric decomposition profiling by GC×GC–TOFMS analysis of VOCs. KazNU Bull. Chem. Ser. 2013, 72, 177–186. [Google Scholar] [CrossRef]
- Rosier, E.; Loix, S.; Develter, W.; Van de Voorde, W.; Tytgat, J.; Cuypers, E. The search for a volatile human specific marker in the decomposition process. PLoS ONE 2015, 10. [Google Scholar] [CrossRef] [PubMed]
- Vass, A.A.; Barshick, S.-A.; Sega, G.; Caton, J.; Skeen, J.T.; Love, J.C.; Synstelien, J.A. Decomposition chemistry of human remains: A new methodology for determining the postmortem interval. J. Forensic Sci. 2002, 47, 542–553. [Google Scholar] [PubMed]
- Statheropoulos, M.; Spiliopoulou, C.; Agapiou, A. A study of volatile organic compounds evolved from the decaying human body. Forensic Sci. Int. 2005, 153, 147–155. [Google Scholar] [CrossRef] [PubMed]
- Varlet, V.; Smith, F.; Giuliani, N.; Egger, C.; Rinaldi, A.; Dominguez, A.; Chevallier, C.; Bruguier, C.; Augsburger, M.; Mangin, P.; et al. When gas analysis assists with postmortem imaging to diagnose causes of death. Forensic Sci. Int. 2015, 251, 1–10. [Google Scholar] [CrossRef] [PubMed]
- Varlet, V.; Smith, F.; de Froidmont, S.; Dominguez, A.; Rinaldi, A.; Augsburger, M.; Mangin, P.; Grabherr, S. Innovative method for carbon dioxide determination in human postmortem cardiac gas samples using headspace-gas chromatography–mass spectrometry and stable labeled isotope as internal standard. Anal. Chim. Acta 2013, 784, 42–46. [Google Scholar] [CrossRef] [PubMed]
- Varlet, V.; Bruguier, C.; Grabherr, S.; Augsburger, M.; Mangin, P.; Uldin, T. Gas analysis of exhumed cadavers buried for 30 years: A case report about long time alteration. Int. J. Legal Med. 2014, 128, 719–724. [Google Scholar] [CrossRef] [PubMed]
- Hoffman, E.; Curran, A.; Dulgerian, N. Characterization of the volatile organic compounds present in the headspace of decomposing human remains. Forensic Sci. Int. 2009, 186, 6–13. [Google Scholar] [CrossRef] [PubMed]
- Dekeirsschieter, J.; Verheggen, F.J.; Gohy, M.; Hubrecht, F.; Bourguignon, L.; Lognay, G.; Haubruge, E. Cadaveric volatile organic compounds released by decaying pig carcasses (Sus domesticus L.) in different biotopes. Forensic Sci. Int. 2009, 189, 46–53. [Google Scholar] [CrossRef] [PubMed]
- Kasper, J.; Mumm, R.; Ruther, J. The composition of carcass volatile profiles in relation to storage time and climate conditions. Forensic Sci. Int. 2012, 223, 64–71. [Google Scholar] [CrossRef] [PubMed]
- Vass, A.A. Odor mortis. Forensic Sci. Int. 2012, 222, 234–241. [Google Scholar] [CrossRef] [PubMed]
- Perrault, K.A.; Rai, T.; Stuart, B.H.; Forbes, S.L. Seasonal comparison of carrion volatiles in decomposition soil using comprehensive two-dimensional gas chromatography—Time of flight mass spectrometry. Anal. Methods 2014, 7, 690–698. [Google Scholar] [CrossRef]
- Can, I.; Javan, G.T.; Pozhitkov, A.E.; Noble, P.A. Distinctive thanatomicrobiome signatures found in the blood and internal organs of humans. J. Microbiol. Methods 2010, 106, 1–7. [Google Scholar] [CrossRef] [PubMed]
- Perrault, K.A.; Nizio, K.D.; Forbes, S.L. A comparison of one-dimensional and comprehensive two-dimensional gas chromatography for decomposition odour profiling using inter-year replicate field trials. Chromatographia 2015, 78, 1057–1070. [Google Scholar] [CrossRef]
- Furne, J.; Majerus, G.; Lenton, P.; Springfield, J.; Levitt, D.G.; Levitt, M.D. Comparison of volatile sulfur compound concentrations measured with a sulfide detector vs. gas chromatography. J. Dent. Res. 2002, 81, 140–143. [Google Scholar] [CrossRef] [PubMed]
- Pierce, K.M.; Hoggard, J.C.; Hope, J.L.; Rainey, P.M.; Hoofnagle, A.N.; Jack, R.M.; Wright, B.W.; Synovec, R.E. Fisher ratio method applied to third-order separation data to identify significant chemical components of metabolite extracts. Anal. Chem. 2006, 78, 5068–5075. [Google Scholar] [CrossRef] [PubMed]
- Brokl, M.; Bishop, L.; Wright, C.G.; Liu, C.; McAdam, K.; Focant, J.-F. Multivariate analysis of mainstream tobacco smoke particulate phase by headspace solid-phase micro extraction coupled with comprehensive two-dimensional gas chromatography-time-of-flight mass spectrometry. J. Chromatogr. 2014, 1370, 216–229. [Google Scholar] [CrossRef] [PubMed]
- Armstrong, P.; Nizio, K.D.; Perrault, K.A.; Forbes, S.L. Establishing the volatile profile of pig carcasses as analogues for human decomposition during the early postmortem period. Heliyon 2016, 2. [Google Scholar] [CrossRef] [PubMed]
- Swann, L.M.; Forbes, S.L.; Lewis, S.W. Analytical separations of mammalian decomposition products for forensic science: A review. Anal. Chim. Acta 2010, 682, 9–22. [Google Scholar] [CrossRef] [PubMed]


| Body # | Gender | Age | Internal Gas Cavities Location | Cause of Death | Last Time Seen Alive |
|---|---|---|---|---|---|
| Body 1 | M | 32 | Pectoral muscle, Left lung, Right lung Pericardium, Abdominal cavity | Suicide by neuroleptics and solvent abuse | 2 weeks |
| Body 2 | M | 67 | Abdominal cavity, Heart | Undetermined | Minimum 1 week |
| Body 3 | F | 75 | Heart, Abdominal cavity, thorax cavity (2 times) | Undetermined (known cardiac pathologies) | N/A (minimum several weeks) |
| Body 4 | M | 68 | Subcutaneous, Abdominal cavity, Pericardium, Jugular, Pectoral muscle | Undetermined (known cardiac pathologies) | 10 days |
| (a) | ||||||||||||
|---|---|---|---|---|---|---|---|---|---|---|---|---|
| Label | Compound Name | 1tR (min) | 2tR (s) | FR | Match | Reverse | Probability | Formula | Exact Mass (amu) | Corrected Mass (amu) | Measured Mass (amu) | Accuracy (ppm) |
| A1 | Cyclic octaatomic sulfur | 35.6 | 1.7 | 294.1 | 548 | 552 | 90.66 | S8 | 223.8045 | 223.7791 | 223.7777 | 6.06 |
| A2 | Azulene | 16.5 | 2.1 | 143.8 | 932 | 932 | 53.88 | C10H8 | 128.0626 | 128.0432 | 128.0458 | −20.68 |
| A3 | Benzene, 1-methyl-3-(1-methylethyl)- | 11.0 | 2.4 | 127.1 | 899 | 899 | 14.34 | C10H14 | 134.1096 | 134.0901 | 134.0913 | −8.93 |
| A4 | Hexathiepane | 34.0 | 1.7 | 119.7 | 758 | 796 | 98.87 | CH2S6 | 205.8481 | 205.8226 | 205.8233 | −3.24 |
| A5 | Benzene, 1-ethyl-2,4-dimethyl- | 11.3 | 2.4 | 80.7 | 882 | 890 | 17.39 | C10H14 | 134.1096 | 134.0901 | 134.0919 | −13.41 |
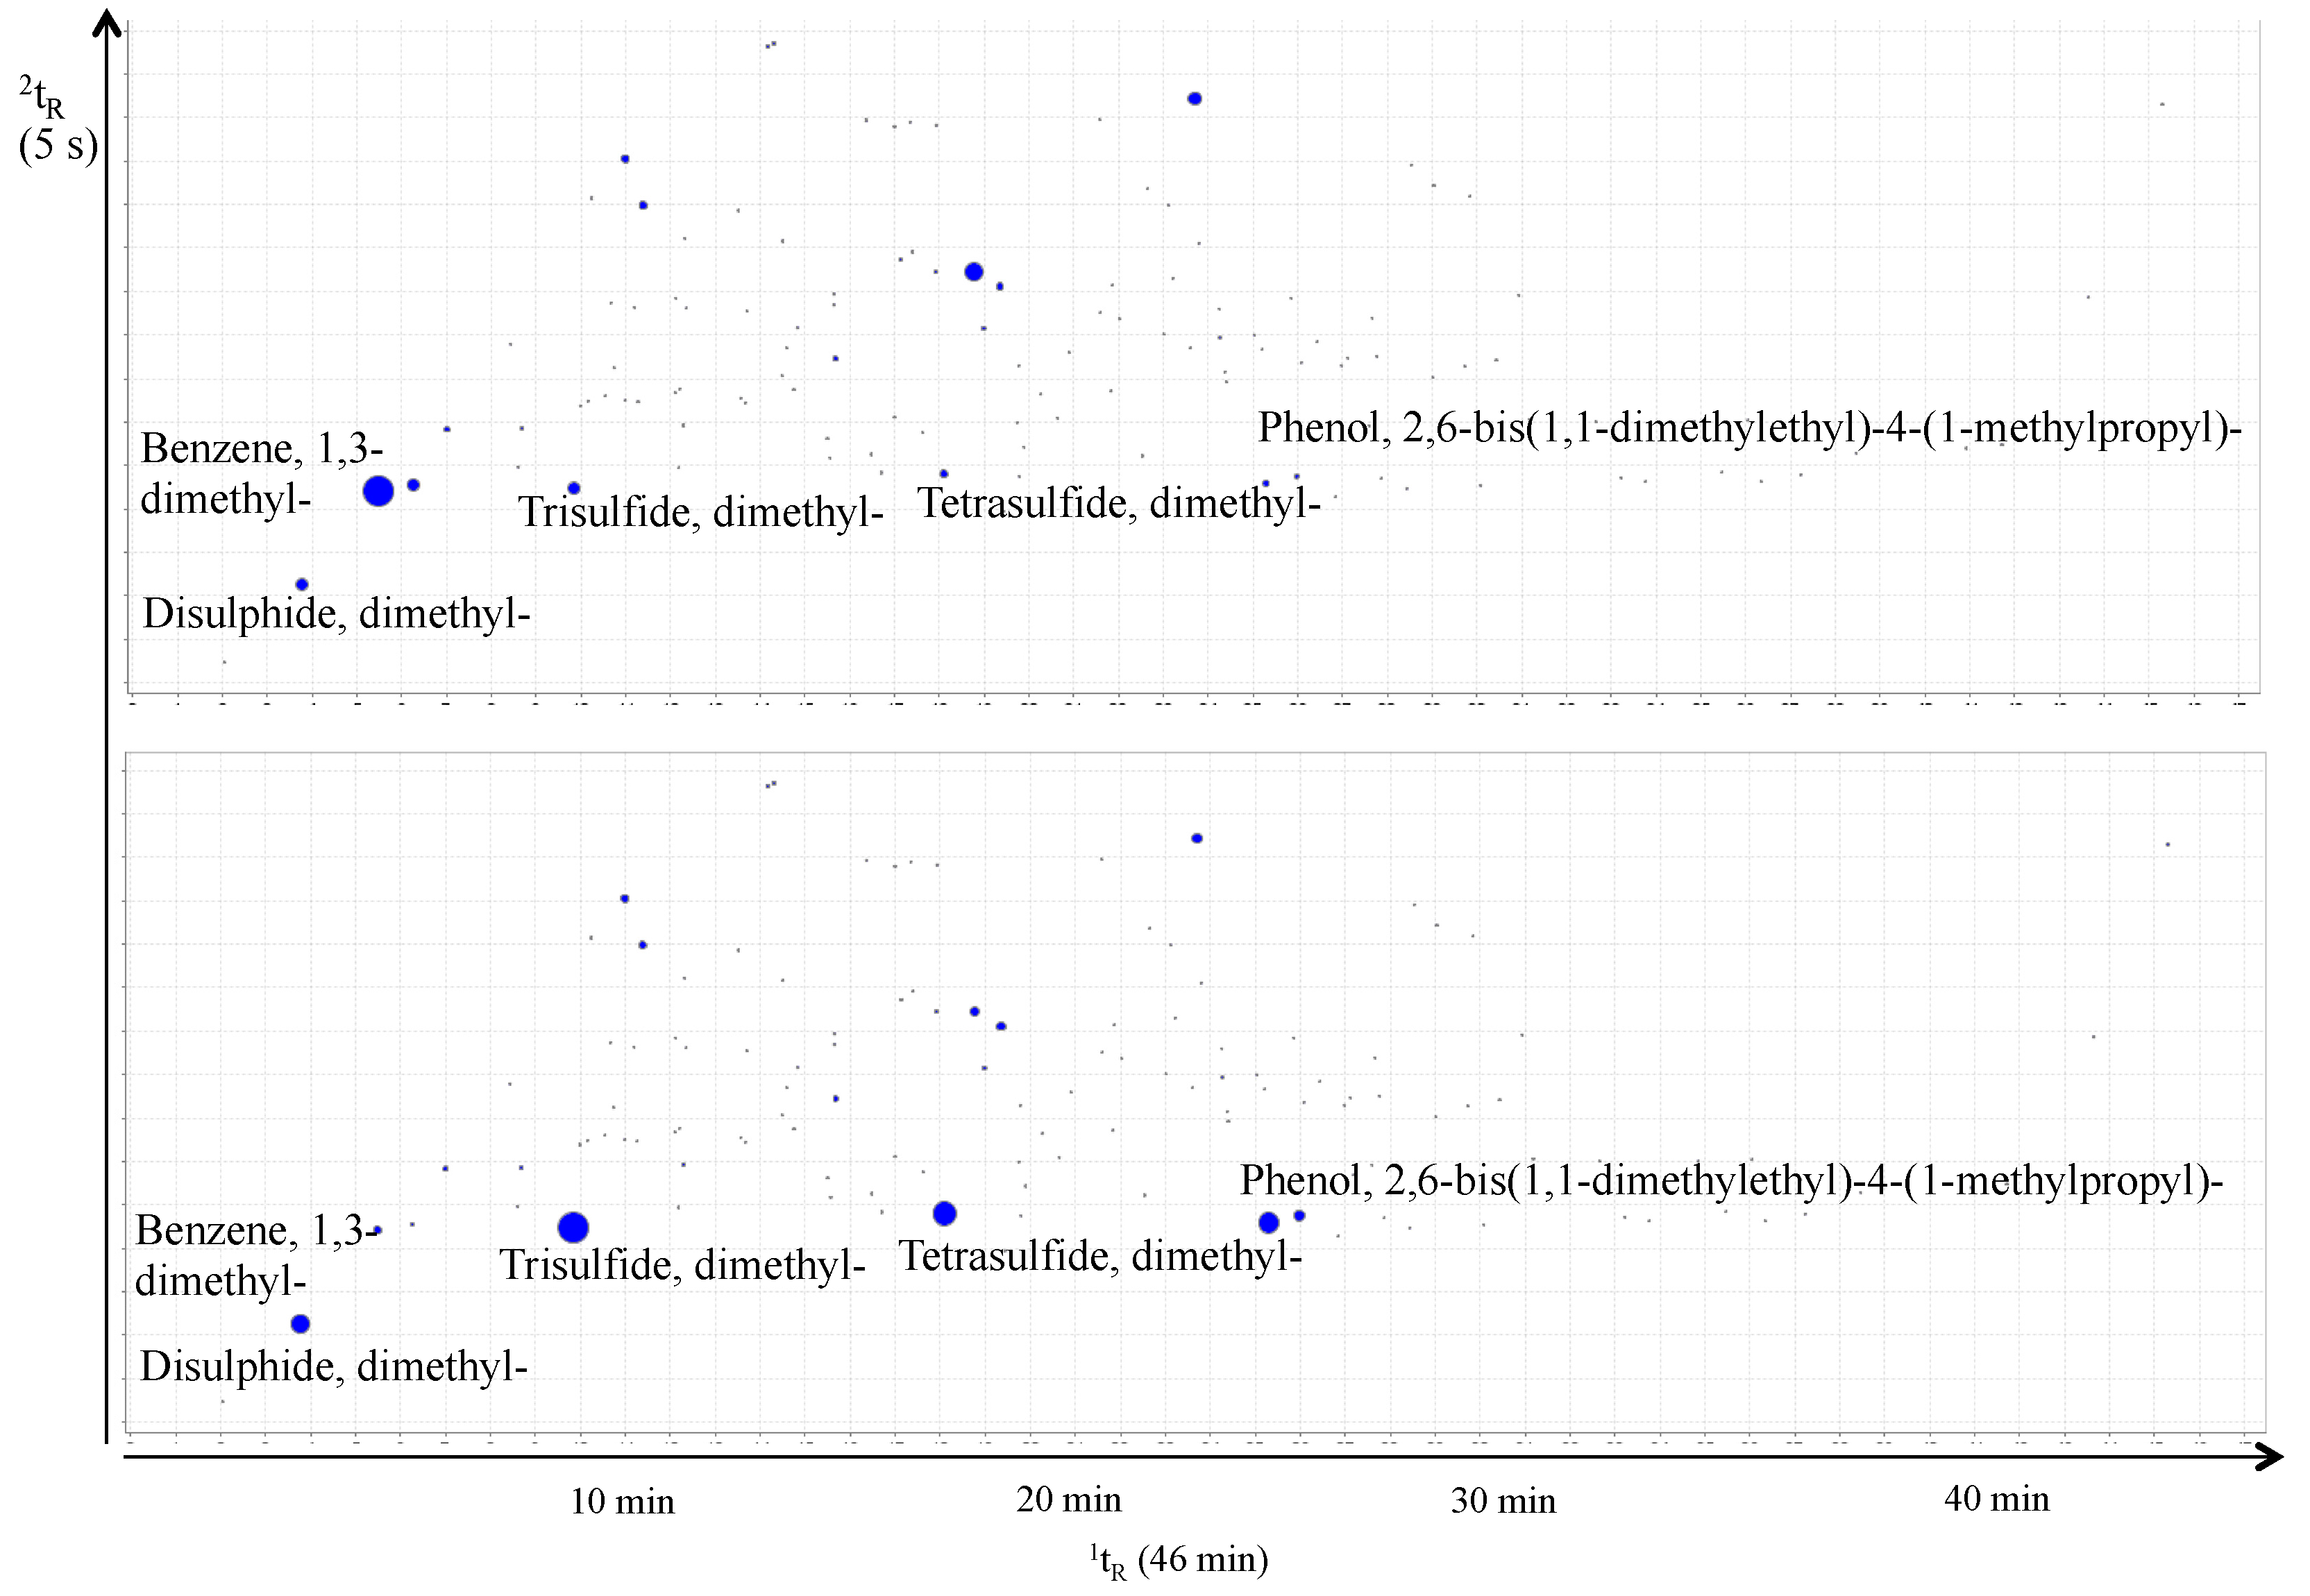
| A6 | Benzene, 1,3-dimethyl- | 5.5 | 1.9 | 55.0 | 832 | 862 | 23.85 | C8H10 | 106.0783 | 106.0650 | 106.0639 | 10.39 |
| A7 | Benzene, 1,4-dimethyl- | 6.3 | 1.9 | 54.2 | 877 | 881 | 25.07 | C8H10 | 106.0783 | 106.0750 | 106.0718 | 30.19 |
| A9 | Benzene, 1,2,3,5-tetramethyl- | 12.2 | 2.5 | 45.4 | 856 | 880 | 15.1 | C10H14 | 134.1096 | 134.0901 | 134.0927 | −19.38 |
| A13 | 1H-Indene, 2-butyl-5-hexyloctahydro- | 23.8 | 4.1 | 24.2 | 672 | 676 | 7.27 | C19H36 | 249.2582 | 249.2328 | 249.2282 | 18.36 |
| A14 | Phenol, 2,6-bis(1,1-dimethylethyl)-4-(1-methylpropyl)- | 25.0 | 2.8 | 24.0 | 787 | 794 | 7.53 | C18H30O | 262.2297 | 262.2042 | 262.2002 | 15.32 |
| A18 | p-Cymene | 13.5 | 2.5 | 21.0 | 581 | 634 | 10.41 | C10H14 | 134.1096 | 134.0901 | 134.0915 | −10.43 |
| A19 | p-Isopropenylphenol | 19.8 | 2.0 | 20.8 | 892 | 905 | 60.64 | C9H10O | 134.0732 | 134.0537 | 134.0551 | −10.32 |
| A22 | Phenol, 4,4′-(1-methylethylidene)bis- | 41.7 | 2.2 | 16.9 | 884 | 964 | 82.47 | C15H16O2 | 228.1150 | 228.0956 | 228.0940 | 6.94 |
| A24 | Trisulfide, dimethyl- | 9.8 | 1.9 | 16.8 | 725 | 741 | 88.51 | C2H6S3 | 125.9632 | 125.9377 | 125.9341 | 28.73 |
| A28 | Benzene, 1,3-bis(1,1-dimethylethyl)- | 14.9 | 2.9 | 12.2 | 914 | 917 | 76.52 | C14H22 | 190.1722 | 190.1527 | 190.1496 | 16.31 |
| A30 | Tetrasulfide, dimethyl- | 18.1 | 2.0 | 10.5 | 742 | 742 | 55.43 | C2H6S4 | 157.9352 | 157.9320 | 157.9306 | 8.80 |
| A32 | Phenol, 2-(1,1-dimethylethyl)-5-methyl- | 19.8 | 2.3 | 9.6 | 885 | 885 | 26.9 | C11H16O | 164.1201 | 164.1007 | 164.1000 | 4.06 |
| (b) | ||||||||
|---|---|---|---|---|---|---|---|---|
| Label | Compound Name | 1tR (min) | 2tR (s) | FR | Match | Reverse | Probability | Formula |
| A8 | Sulfurous acid, cyclohexylmethyl isobutyl ester | 28.4 | 3.8 | 46.6 | 630 | 803 | 16.3 | C11H22O3S |
| A10 | 2-Bromobenzothiazole | 27.8 | 2.7 | 36.1 | 812 | 892 | 70.5 | C7H4BrNS |
| A11 | 1,2,3-Trimethyl-cyclopent-2-enecarboxaldehyde | 17.1 | 3.2 | 27.2 | 619 | 724 | 10.3 | C9H14O |
| A12 | Stiripentol | 29.8 | 2.6 | 26.1 | 661 | 673 | 39.91 | C14H18O3 |
| A15 | 1,2-Diazaspiro[4.4]nonen-3-carboxylic acid, 6,6,9,9-tetramethyl-, methyl ester | 17.4 | 3.3 | 22.1 | 605 | 690 | 9.55 | C13H22 |
| A16 | Phthalic acid, methyl phenyl ester | 27.0 | 2.6 | 22.0 | 748 | 836 | 5.57 | C10H10 |
| A17 | 2-Dodecen-1-yl(-)succinic anhydride | 18.8 | 3.2 | 21.3 | 576 | 671 | 17.82 | C16H26O3 |
| A20 | Neophytadiene | 16.9 | 4.1 | 20.7 | 676 | 715 | 7.4 | C20H38 |
| A21 | 3-Tetradecyn-1-ol | 20.9 | 2.7 | 20.5 | 687 | 692 | 24.49 | C14H26O |
| A23 | Vinyl caprylate | 23.9 | 3.3 | 16.9 | 601 | 623 | 8.39 | C10H18O2 |
| A25 | Disulfide, bis(1,1,3,3-tetramethylbutyl) | 16.4 | 4.0 | 15.5 | 760 | 766 | 46.1 | C16H34S2 |
| A26 | Benzoic acid, 3,5-dimethyl-, (2,4-dimethylphenyl)methyl ester | 15.5 | 2.2 | 13.7 | 761 | 761 | 27.59 | C18H20O2 |
| A27 | Cyclohexane, 2,4-diisopropyl-1,1-dimethyl- | 18.5 | 3.3 | 12.4 | 530 | 678 | 8.35 | C12H24 |
| A29 | Vinyl caprylate | 15.7 | 3.0 | 11.2 | 714 | 725 | 25.61 | C10H18O2 |
| A31 | Neophytadiene | 11.4 | 3.5 | 10.2 | 717 | 774 | 4.96 | C20H38 |
| A33 | 4-imidazolidinone, 3-ethyl-5-[2-(3-ethyl-2(3H)-benzoxazolylidene)ethylidene]-1-phenyl-2-thioxo- | 14.2 | 4.4 | 9.6 | 492 | 770 | 41.69 | C22H21N3O2S |
| A34 | 4-Hepten-3-one, 5-methyl-. (E)- | 19.3 | 3.1 | 9.3 | 599 | 665 | 5.96 | C8H14O |
| A35 | Sulfurous acid, cyclohexylmethyl isobutyl ester | 29.8 | 3.6 | 9.3 | 630 | 801 | 16.6 | C11H22O3S |
| A36 | Succinic acid, 2-(2-chlorophenoxy)ethyl ethyl ester | 31.0 | 1.9 | 8.9 | 612 | 626 | 34.43 | C14H17ClO5 |
| A37 | 2,4,6-Tris(1,1-dimethylethyl)-4-methylcyclohexa-2,5-dien-1-one | 22.8 | 2.6 | 8.7 | 803 | 857 | 31.2 | C19H32O |
© 2016 by the authors; licensee MDPI, Basel, Switzerland. This article is an open access article distributed under the terms and conditions of the Creative Commons Attribution (CC-BY) license (http://creativecommons.org/licenses/by/4.0/).
Share and Cite
Stefanuto, P.-H.; Perrault, K.A.; Grabherr, S.; Varlet, V.; Focant, J.-F. Postmortem Internal Gas Reservoir Monitoring Using GC×GC-HRTOF-MS. Separations 2016, 3, 24. https://doi.org/10.3390/separations3030024
Stefanuto P-H, Perrault KA, Grabherr S, Varlet V, Focant J-F. Postmortem Internal Gas Reservoir Monitoring Using GC×GC-HRTOF-MS. Separations. 2016; 3(3):24. https://doi.org/10.3390/separations3030024
Chicago/Turabian StyleStefanuto, Pierre-Hugues, Katelynn A. Perrault, Silke Grabherr, Vincent Varlet, and Jean-François Focant. 2016. "Postmortem Internal Gas Reservoir Monitoring Using GC×GC-HRTOF-MS" Separations 3, no. 3: 24. https://doi.org/10.3390/separations3030024