Optimization of Post Combustion CO2 Capture from a Combined-Cycle Gas Turbine Power Plant via Taguchi Design of Experiment


1
Department of Mechanical and Aerospace Engineering, Brunel University London, Uxbridge UB8 3PH, UK
2
Department of Chemical Engineering, Brunel University London, Uxbridge UB8 3PH, UK
*
Author to whom correspondence should be addressed.
Processes 2019, 7(6), 364; https://doi.org/10.3390/pr7060364
Submission received: 20 May 2019
/
Revised: 5 June 2019
/
Accepted: 6 June 2019
/
Published: 12 June 2019
(This article belongs to the Special Issue Gas Capture Processes)
Abstract
:The potential of carbon capture and storage to provide a low carbon fossil-fueled power generation sector that complements the continuously growing renewable sector is becoming ever more apparent. An optimization of a post combustion capture unit employing the solvent monoethanolamine (MEA) was carried out using a Taguchi design of experiment to mitigate the parasitic energy demands of the system. An equilibrium-based approach was employed in Aspen Plus to simulate 90% capture of the CO2 emitted from a 600 MW natural gas combined-cycle gas turbine power plant. The effects of varying the inlet flue gas temperature, absorber column operating pressure, amount of exhaust gas recycle, and amine concentration were evaluated using signal to noise ratios and analysis of variance. The optimum levels that minimized the specific energy requirements were a: flue gas temperature = 50 °C; absorber pressure = 1 bar; exhaust gas recirculation = 20% and; amine concentration = 35 wt%, with a relative importance of: amine concentration > absorber column pressure > exhaust gas recirculation > flue gas temperature. This configuration gave a total capture unit energy requirement of 5.05 GJ/tonneCO2, with an energy requirement in the reboiler of 3.94 GJ/tonneCO2. All the studied factors except the flue gas temperature, demonstrated a statistically significant association to the response.
1. Introduction
Anthropogenic greenhouse gas (GHG) emissions in 2010 reached 49 ± 4.5 GtCO2-eq/year, emissions of CO2 from fossil fuel combustion and industrial processes contributed approximately 80% of the total GHG emissions increase from 1970–2010 [1]. The mitigation of climate change and increasing global temperatures requires a combination of new, renewable technology and an improvement of the existing infrastructure to move towards a low and ideally zero-carbon society; in line with the Climate Change Act requirements of an 80% reduction in total emissions by 2050 [2]. The use of fossil-fueled power stations continues to grow due to their ability to respond to changes in demand [3] and offset the intermittency of current renewable technology. Coal and gas are the predominant fuels used in power generation; however, since the UK’s 2016 consultation to end the use of unabated coal, its usage in power generation has declined from 22% in 2015 to 1.6% in the second quarter of 2018 [4]. Natural gas sees its share of generation at 42% and although often perceived as a much cleaner fuel at the point of use than coal [5], producing around 350 kgCO2/MWh [6], reducing the carbon intensity of this growing sector is vital for stabilizing global temperature increase to below 2 °C. Amine-based carbon capture and storage (CCS) is seen as one of the best CO2 abatement approaches [7]; the solvent monoethanolamine (MEA) is most commonly used due to its low material costs [8]; however, due to the energy requirements of solvent regeneration, there is a large energy penalty incurred on the power plant. To make post combustion CCS a viable option in mitigating the GHG emissions from power generation, optimization of such a plant is paramount.
The techno-economic analysis of a post combustion capture (PCC) and compression plant using MEA coupled to a 400 MW NG-CCGT conducted by Alhaja et al. [9] found that by studying the effect of the PCC unit’s key operating parameters on the power plant’s key performance indicators, an optimum lean loading of 0.31 molCO2/molMEA, which minimized the specific reboiler duty (SRD), could be found. This represents a balance between the sensible heat required to raise the temperature of the solvent to that of the reboiler and the latent heat to vaporize water and provide the stripping steam. By increasing the pressure within the stripping column within the limits of solvent degradation, a reduction in SRD was also seen. The inclusion of packing volume as a studied parameter illustrates the importance of studying the capture process as a whole system, especially due to the capital costs associated with such plants. An optimum lean loading of the solvent that minimized the SRD was also found by Masoudi Soltani et al. [10]; the MEA-based unit demonstrated that the SRD was dependent on the concentration of MEA within the solution. The 3.98 GJ/tonneCO2 SRD occurred with a 30 wt% MEA solution and a lean loading in the range of 0.19–0.21 molCO2/molMEA. The SRD was also seen to vary secondly as a function of EGR, owing to the change in CO2 partial pressure within the flue gas stream; employing a greater percentage EGR reduced SRD further. Another optimization of an MEA-based PCC system [11] determined strong links between the L/G ratio, lean loading, and reboiler duty. The lean solvent flow rate was determined by varying the lean CO2 loading to achieve 90% capture; with a lower L/G ratio, the requirement in the reboiler is primarily for stripping steam, whereas with a higher L/G ratio, there is a larger requirement for heat to increase the temperature of the rich stream; once more corroborating the balance of sensible and latent heats in the reboiler [9,10]. A 30 wt% MEA-employing model validated against the UK CCS research centre pilot plant was used to evaluate and optimize the performance of a PCC unit [12]; a lean loading of 0.23 gave a 15% reduction in SRD from 7.1 Mj/kgCO2 to 5.13 MJ/kgCO2. An increase in stripper pressure from 1.25–2.50 bar added a further 17% reduction in SRD, but in order to avoid thermal degradation of the solvent, a pressure of 1.80 bar was found to be most suitable, a similar phenomenon to that found by Lindqvist et al. [13]. With an optimum lean loading of 0.21 in line with the findings of Masoudi Soltani et al. [10], the SRD was 4.4 MJ/kgCO2. Packing material and heat exchanger logarithmic mean temperature difference (LMTD) were also studied, optimization of which could give SRD reductions of 40% and 5%, respectively. Xiaobo Luo [14] investigated the optimal operation of an MEA-based capture unit and found that for a 90% capture rate, a 9.58% net power efficiency decrease was seen in the NGCC using an optimum lean loading of 0.26–0.28, slightly higher than in the previous studies. The reason for this is that in the other studies, column sizing is minimized to reduce capital expenditure by reducing the L/G ratio, thus requiring a lower lean loading, whereas with this study [14], column sizing is fixed and the optimal operation is to reduce the operating expenditure, hence a higher lean loading can be exploited. The comparison between MEA and CESAR-1 (an aqueous solution of 2-amino-2-methyl-propanal and piperazine) [15] found that using MEA reduced the NGCC plant efficiency by 8.4%, with an energy requirement in the PCC unit of 3.36 GJ/tonneCO2. A parametric evaluation carried out by Kothandaraman et al. [16] on a 30 wt% MEA PCC system identified that for a DOC above 95%, there was a disproportionate increase in SRD. The temperature of the solvent was shown to have little effect on the system’s performance; decreasing absorption temperature increases the driving force for reaction but the rate of reaction and diffusivity decreased, effectively cancelling each other out. For the lean loading used (0.22), the SRD was 4.5 GJ/tCO2 with a flue gas CO2 content of 4 vol%, i.e., without the use of EGR. An MEA-based PCC unit modelled by Arachchige et al. [17] concluded that the removal efficiency was proportional to the solvent concentration and temperature whilst being inversely effected by lean loading thanks to the reduction in MEA capacity; a similar phenomenon to that found by Kothandaraman et al. [16] was observed with respect to solvent temperature. Variation of absorber pressure saw a decrease in SRD due to the increased partial pressure of the CO2; 4.56 GJ/tCO2 to 4.38 GJ/tCO2 with an increase in absorber pressure of 0.9 to 1.2 bar. The effect of implementing EGR on the integrated MEA-based CO2 capture plant when coupled to an 800 MW NGCC was studied exclusively by Ali et al. [18], something not considered comprehensively in other studies [12,13,15]. The use of EGR resulted in a 57% increase in CO2 molar composition in the flue gas stream (4.16–6.53 mol%), resulting in a 2.3% reduction in SRD; they also identified that the NGCC case with EGR is the most attractive for use with CCS due to its lowest reduction in plant net efficiency. Lars Erik Øi [19] simulated the operation of a simplified MEA-based PCC coupled to a 400 MW CCGT; he found that for a removal of 85% of the emitted CO2, the heat consumption was 3.7 GJ/tCO2. He identified that an increased solvent circulation rate would increase the removal grade of the CO2; an increase in the temperatures of the inlet streams to the absorber would improve CO2 absorption due to an increase in reaction rates and; operating the stripper close to the degradation limits of the solvent would give better removal efficiency and thus lower CO2 loading in the lean stream. Afkhamipour and Mofarahi [20] employed the methods of Taguchi to maximize the CO2 removal efficiency using a sophisticated multilayer-perceptual-neural-network model. Focusing on the controllable inlet conditions to the absorber, they identified that CO2 loading, amine flow rate, and amine concentration were the major factors in increasing the capture efficiency. The degree of capture (DOC), however, was not kept constant; this is dependent on amine flow rate. Instead, the response value used in the Taguchi analysis was the CO2 removal efficiency; the optimization of removal efficiency does not inherently mean a less intensive energy requirement for the system.
It is clear that there are myriad KOPs that impact the energy intensity of a PCC unit; the importance of solvent concentration, solvent type, and CO2 concentration were shown to be extremely influential on the energy requirements in a PCC unit; the sizing and packing of the columns were also important, but played a greater role in the economic analysis. Few studies have looked at the effect of varying absorber column pressure and its effect on the reaction kinetics within the column. Although solvent type can be seen as an optimization variable, to assess the influence of the other KOPs, this would need to be kept constant; the industry baseline solvent is MEA which has a number of advantages over other commercial solvents [21], its availability and relatively low cost also continue to make it one of the more viable options. The L/G ratio was shown to be dependent on the DOC; therefore, maintaining a DOC would require a variation of L/G ratio. It is also clear that the stripping column operates optimally near the degradation limits of the solvent, leaving little requirement for optimization; the inlet streams and conditions within the absorber were shown to be more influential in the energy demands of a PCC unit. The importance of operating the systems at near optimal configuration to mitigate the cost of capturing CO2 and improve the viability of CCS is obvious.
A description of the chemical absorption that takes place in a PCC system can be achieved by modelling, using either an equilibrium or rate-based mass-transfer, with a number of studies being validated against pilot plant data [9,12,22,23,24]. Rate-based simulations can provide a greater accuracy and allow a more informed evaluation of the process [12,14,17,23,24,25,26] but equilibrium approaches can still be employed for process assessment [11,19,27,28]. The relative simplicity of an equilibrium approach and the ability to improve the accuracy of such a model with stage efficiencies [16,19,29,30,31] is the justification for employing such a strategy here.
In this work, the optimization of an MEA-based PCC system is carried out using a Taguchi design of experiment. The PCC system is modelled in Aspen Plus to process the flue gas from a 600 MW CCGT power plant and capture 90% of the emitted CO2. The optimization parameters were: the inlet temperature of the flue gas to the absorber (FGT); the operating pressure of the absorber column (ACP); the amount of exhaust gas recirculation (EGR) so as to model the capture process using different molar CO2 concentrations in the flue gas; and the concentration of the amine (CONC) in the lean stream inlet to the absorber.
2. Model Development
The modelling framework for this study employs a combination of the electrolyte-nonrandom-two-liquid (e-NRTL) [32] description of activity coefficients for the equilibrium ionic species in solution with the Soave–Redlich–Kwong (SRK) [33] cubic equation of state for the fugacities of the species in the vapor phase, a well-demonstrated combination [10,34,35]. The following sections describe briefly the thermodynamic framework that Aspen Plus uses for the calculations of chemical equilibrium, vapor-liquid equilibrium, liquid phase constitution, and regeneration energy [36].
The absorption and reaction mechanisms that occur in the MEA-CO2-H2O system are detailed in Equations (1)–(7) [10,21].
The absorption process begins with the dissolution of the gaseous carbon dioxide molecules into the liquid MEA-H2O-CO2 where the dissolved CO2 undergoes a series of reactions described in Equations (2)–(6), resulting in the formation of a number of ionic species [10]. Reaction (2) describes the water hydrolysis resulting in the production of two ions, reaction (3) shows the formation of a bicarbonate in water, and reaction (4) demonstrates the dissociation of the bicarbonate salt into carbonate ions in the presence of liquid water. Reactions (5) and (6) describe the reactions between molecular MEA with CO2 in the aqueous solution, specifically the dissociation of MEAH + (pronated MEA) in (5) and the carbamate reversion to bicarbonate of MEACOO-. The equilibrium constants () for reactions (2)–(6) are defined on a molar basis as [10,35]:
where is the activity of species; the above equation can be rewritten in terms of mole fractions, and activity coefficients , to give:
where is the stoichiometric constant of species . It is worth noting that in the presence of oxygen, solvents such as MEA will react irreversibly to produce a number of oxidation products, and prediction of the accumulation of such products is limited by the incomplete knowledge of the interactions between oxygen and MEA [37]. The implication of these reactions on the energy requirements of the capture unit are insignificant but they do tend to influence the economics of the system. An economic analysis is not executed here and so the inclusion of these reactions in the model has been dismissed. The e-NRTL model is itself an excess Gibbs energy (gex*) expression comprised of three contributions [21]: (1) The long-range interactions due to the electrostatic forces between ions represented by the Pitzer–Debye–Hückel expression; (2) the ion-reference-state-transfer contribution represented by the Born expression; and (3) the short range forces between all species. The equation is given below [10,21,35]:
The activity coefficient, for an ionic or molecular species, solute, or solvent is derived from the partial derivative of the excess Gibbs free energy with respect to the species mole number, [10,21]:
where , = molecule, cation, anionspecies. Finally, Equation (11) leads to:
The e-NRTL property method includes the temperature-dependent reaction equilibrium constants () listed in Equations (2)–(6) and are calculated using the Aspen Plus built-in equation [10,17,21,35]:
The vapor–liquid thermodynamic system can be described using an extended Henry’s law to represent the behavior of solutes such as CO2 [10,21,35,38]:
Similarly for the solvent species, an extended Raoult’s law is employed [10,21,35,38]:
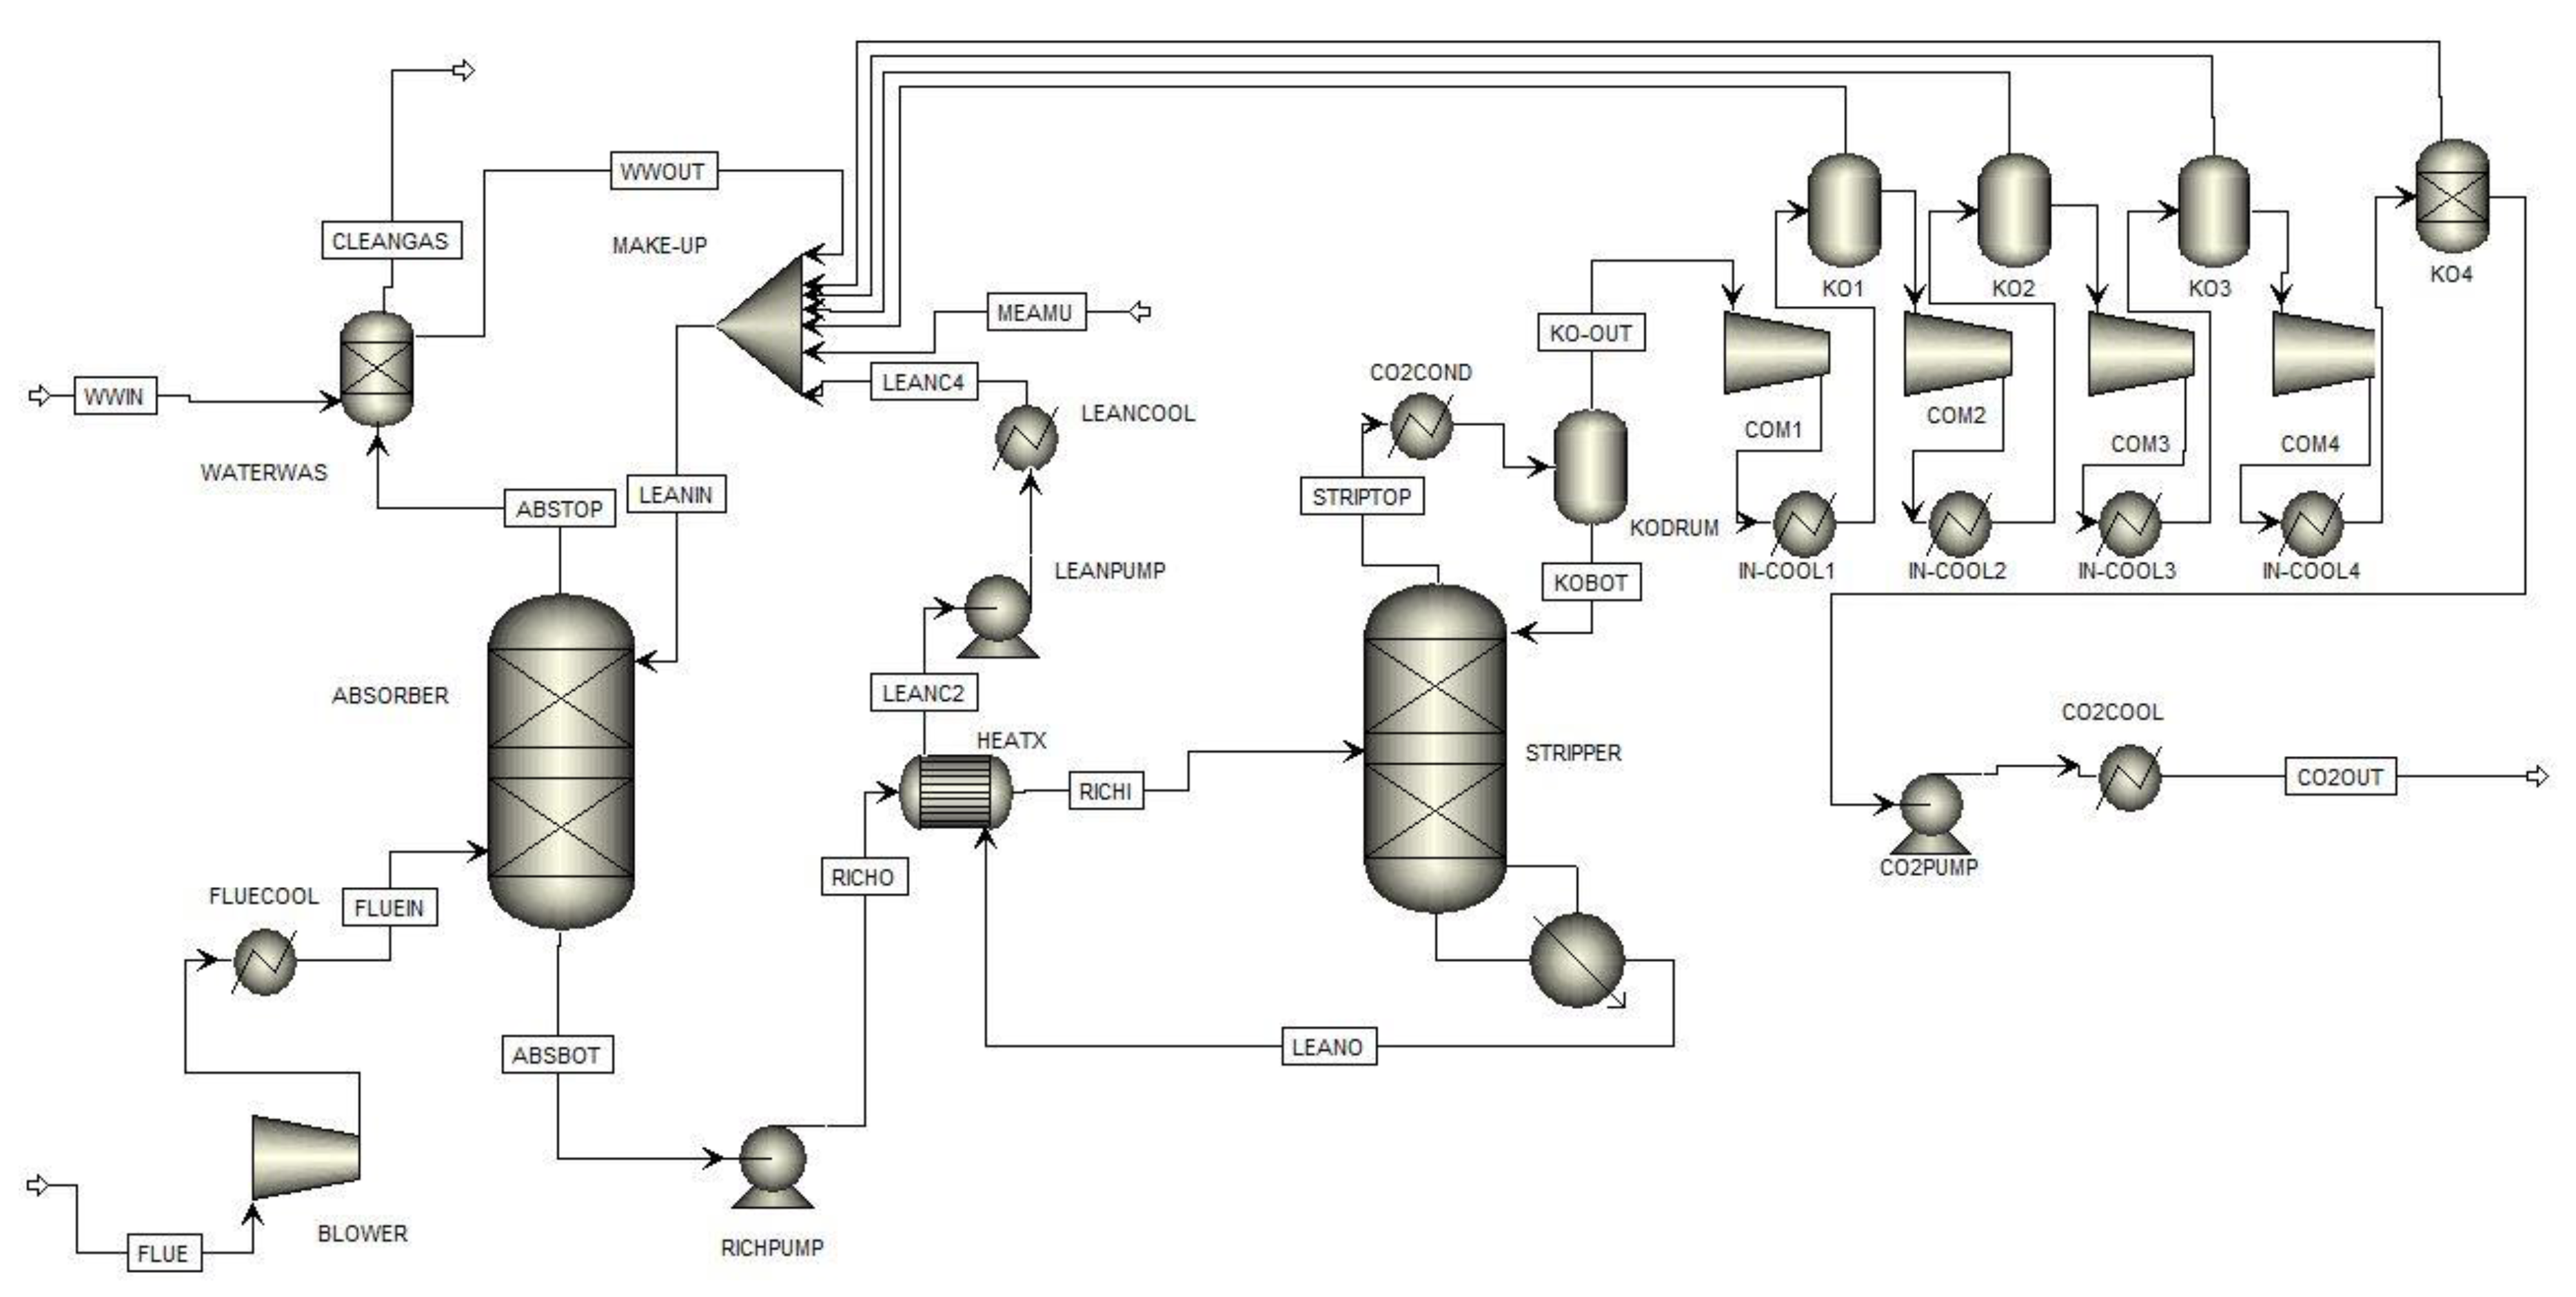
where, and are the vapor phase mole fractions of species and ; and are the fugacity coefficients for species and as estimated by the SRK equation of state; is the total pressure; and are the liquid phase mole fractions of and ; and are the liquid phase activity coefficients for an; is the Henry’s Law constant of in the solution at saturation pressure and is the saturation pressure of ; is the fugacity coefficient of under saturation pressure condition; is the partial molar volume of solute at infinite dilution; and is the molar volume of solvent . In Equations (14) and (15), the exponential terms are the Poynting factors of corrections for moderate pressure and are derived from integration forms by assuming and to be constant over the pressure range [10]. Figure 1 depicts the process flow sheet developed for this work and is detailed in the following section; block names are given in capitals and the Aspen Plus model names are given in parentheses. The model includes two columns: the ABSORBER and the STRIPPER (RadFrac); a water wash section, WATERWAS (SEP) where any residual solvent is removed from the clean flue gas; a make-up section, MAKE-UP (MIXER) which allows the addition of both H2O and MEA to ensure the lean amine stream inlet to the absorber is of the correct composition. The five-stage intercooled compression train [9,15,24] used to process the captured CO2 for storage is comprised of a series of four compressors, COM1-4 (COMPR), knock out drums, KO1-4 (FLASH) to remove residual water and intercoolers, IN-COOL1-4 (HEATER) to reduce the temperature of the CO2; this puts the CO2 into the supercritical fluid state where the 5th stage, a pump, CO2PUMP (PUMP) increases the pressure of the CO2 to 140 bar. The cross-heat exchanger, HEATX (HEATX) is used to heat the rich amine stream using the waste heat in the lean stream and the BLOWER (COMPR) is used to increase the flue gases pressure to overcome the pressure drop in the column. Table 1 Outlines the operating conditions for the individual units in the flow sheet.
The flue gas stream flow rate inlet to the absorber is maintained at 825.31 kg/s, representing a NG-fired CCGT operating in a 1 × 1 configuration with a rated capacity of 592 MW and an efficiency of 56% on an LHV basis, modelled by Dutta et al. [27] using GT-PRO® operating at an ambient condition of 15 °C.
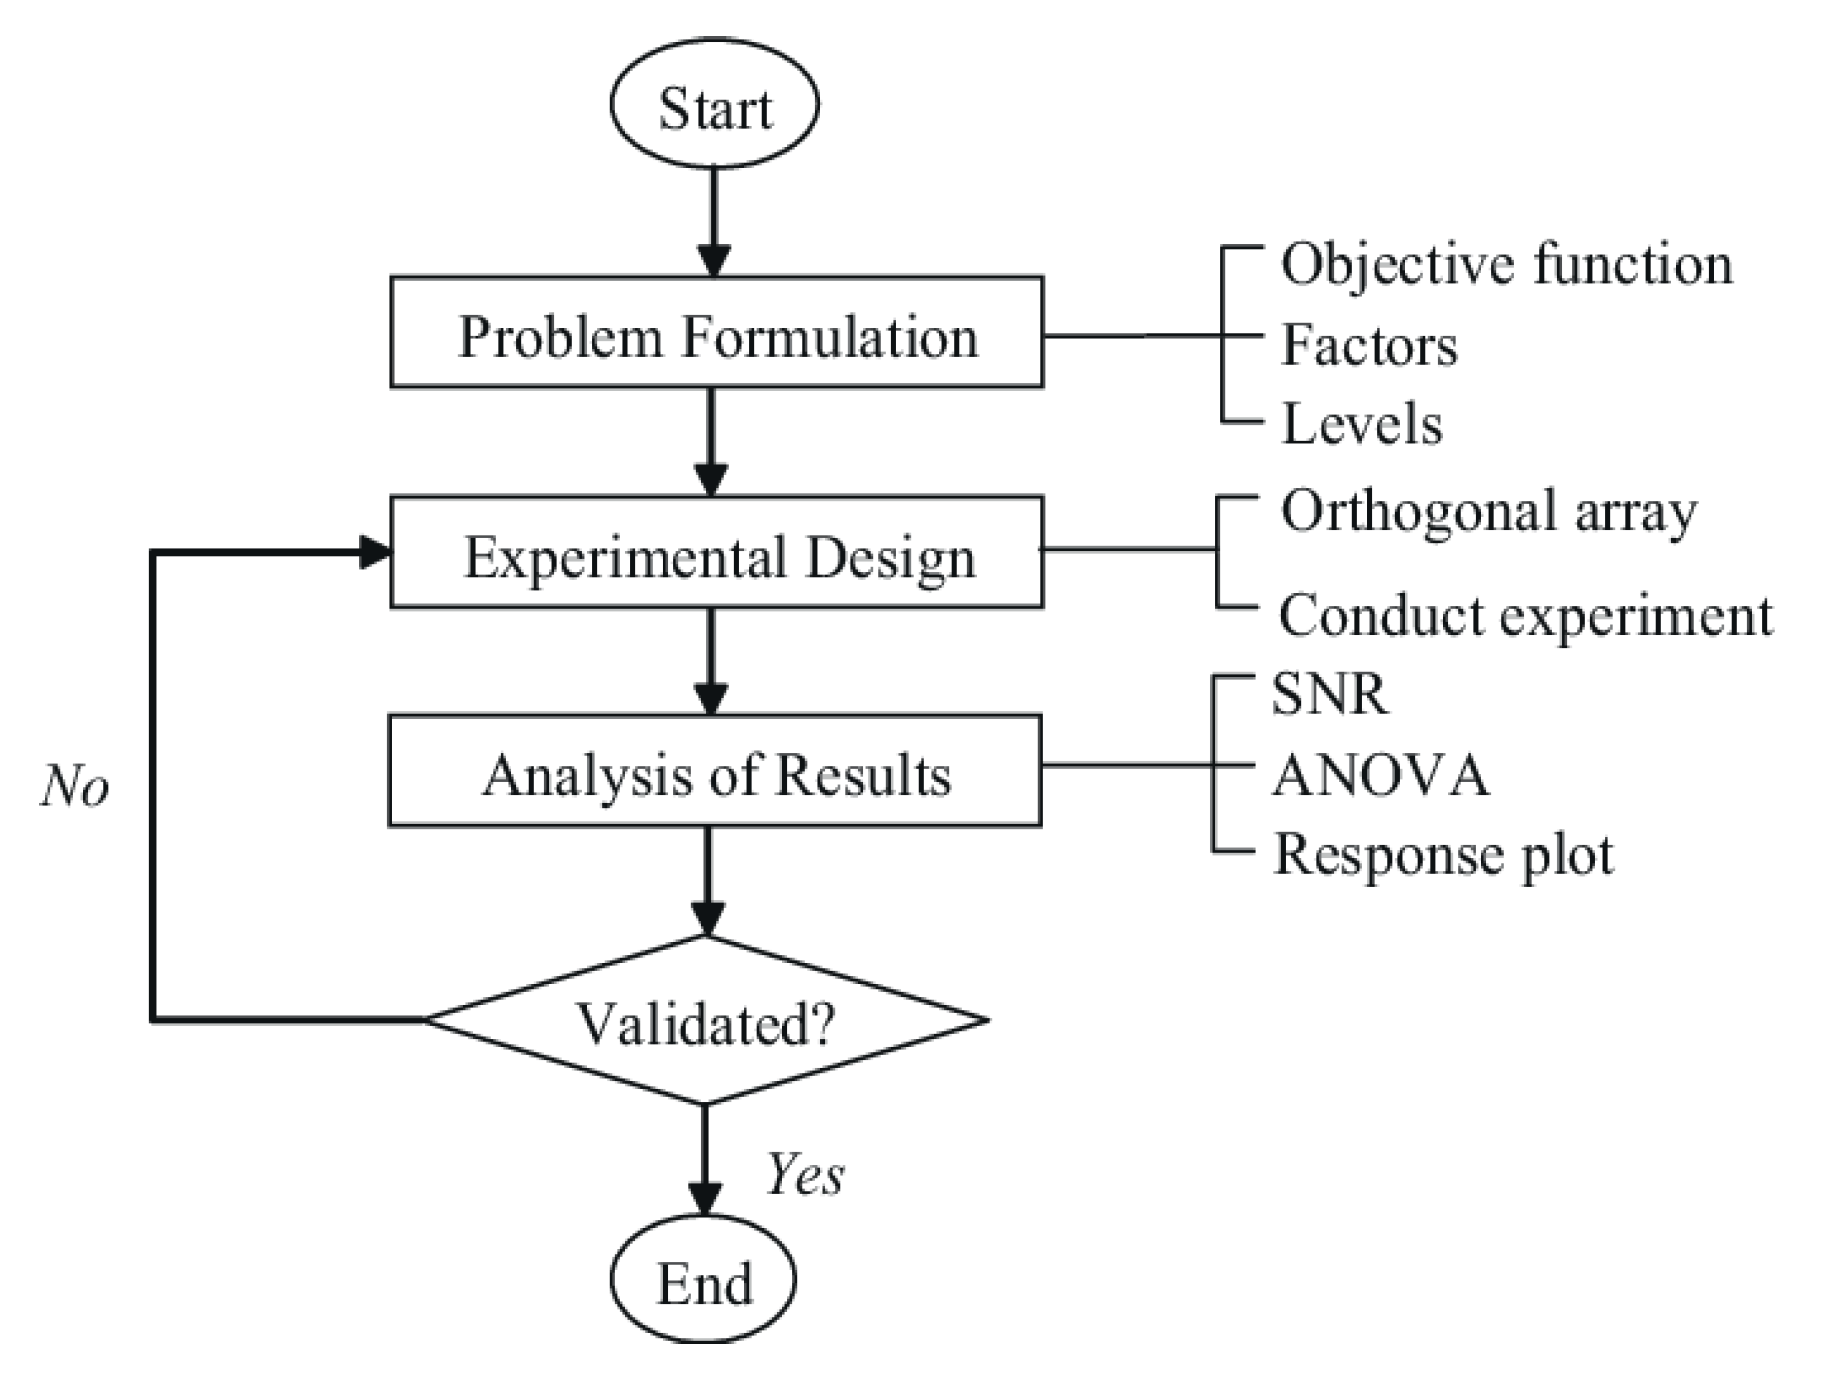
The Taguchi method is a statistical technique in the design of experiments (DOE), sensitivity analysis, and optimization [20]. Developed to overcome the limitations in a full factorial experiment design the method necessitates that all parameters be split into either control or noise factors which can take on a variety of preset levels; through the use of orthogonal arrays (OA) [39] a fractional-factorial sequence of experiments can be devised, upon which statistical analysis of the results can be carried out to find the optimum configuration of factors and their respective levels in order to maximize or minimize the objective function. An OA is abbreviated as LN; the subscript N refers to the number of required trials for a given experiment; the number of levels of factors are included in parentheses next to the abbreviation. For example, L4 (23) refers to a four-trial experiment to investigate the influence of three factors at two levels each on a given process [40]. The Taguchi methods serve as an offline tool for designing quality into products in a three-stage process [40,41]. The first being system design, where the factors and their appropriate levels are determined, which requires a thorough understanding of the system, the second is parametric design, where the optimum condition is determined at specific factor levels, and the third is tolerance design, where fine tuning of the optimum factor levels found in the second stage takes place. The method employed here is similar to that employed by Yusoff et al. [40] and is shown in Figure 2.
The problem formulation step involves defining the objective function, factors, and levels. The four factors assessed in this work are: the temperature of the flue gas stream inlet to the absorber column (FGT); the operating pressure of the absorber column (ACP); the percentage exhaust gas recirculation (EGR); and the concentration of the lean amine stream inlet to the absorber (CONC). The values of which take one of five levels detailed in Table 2.
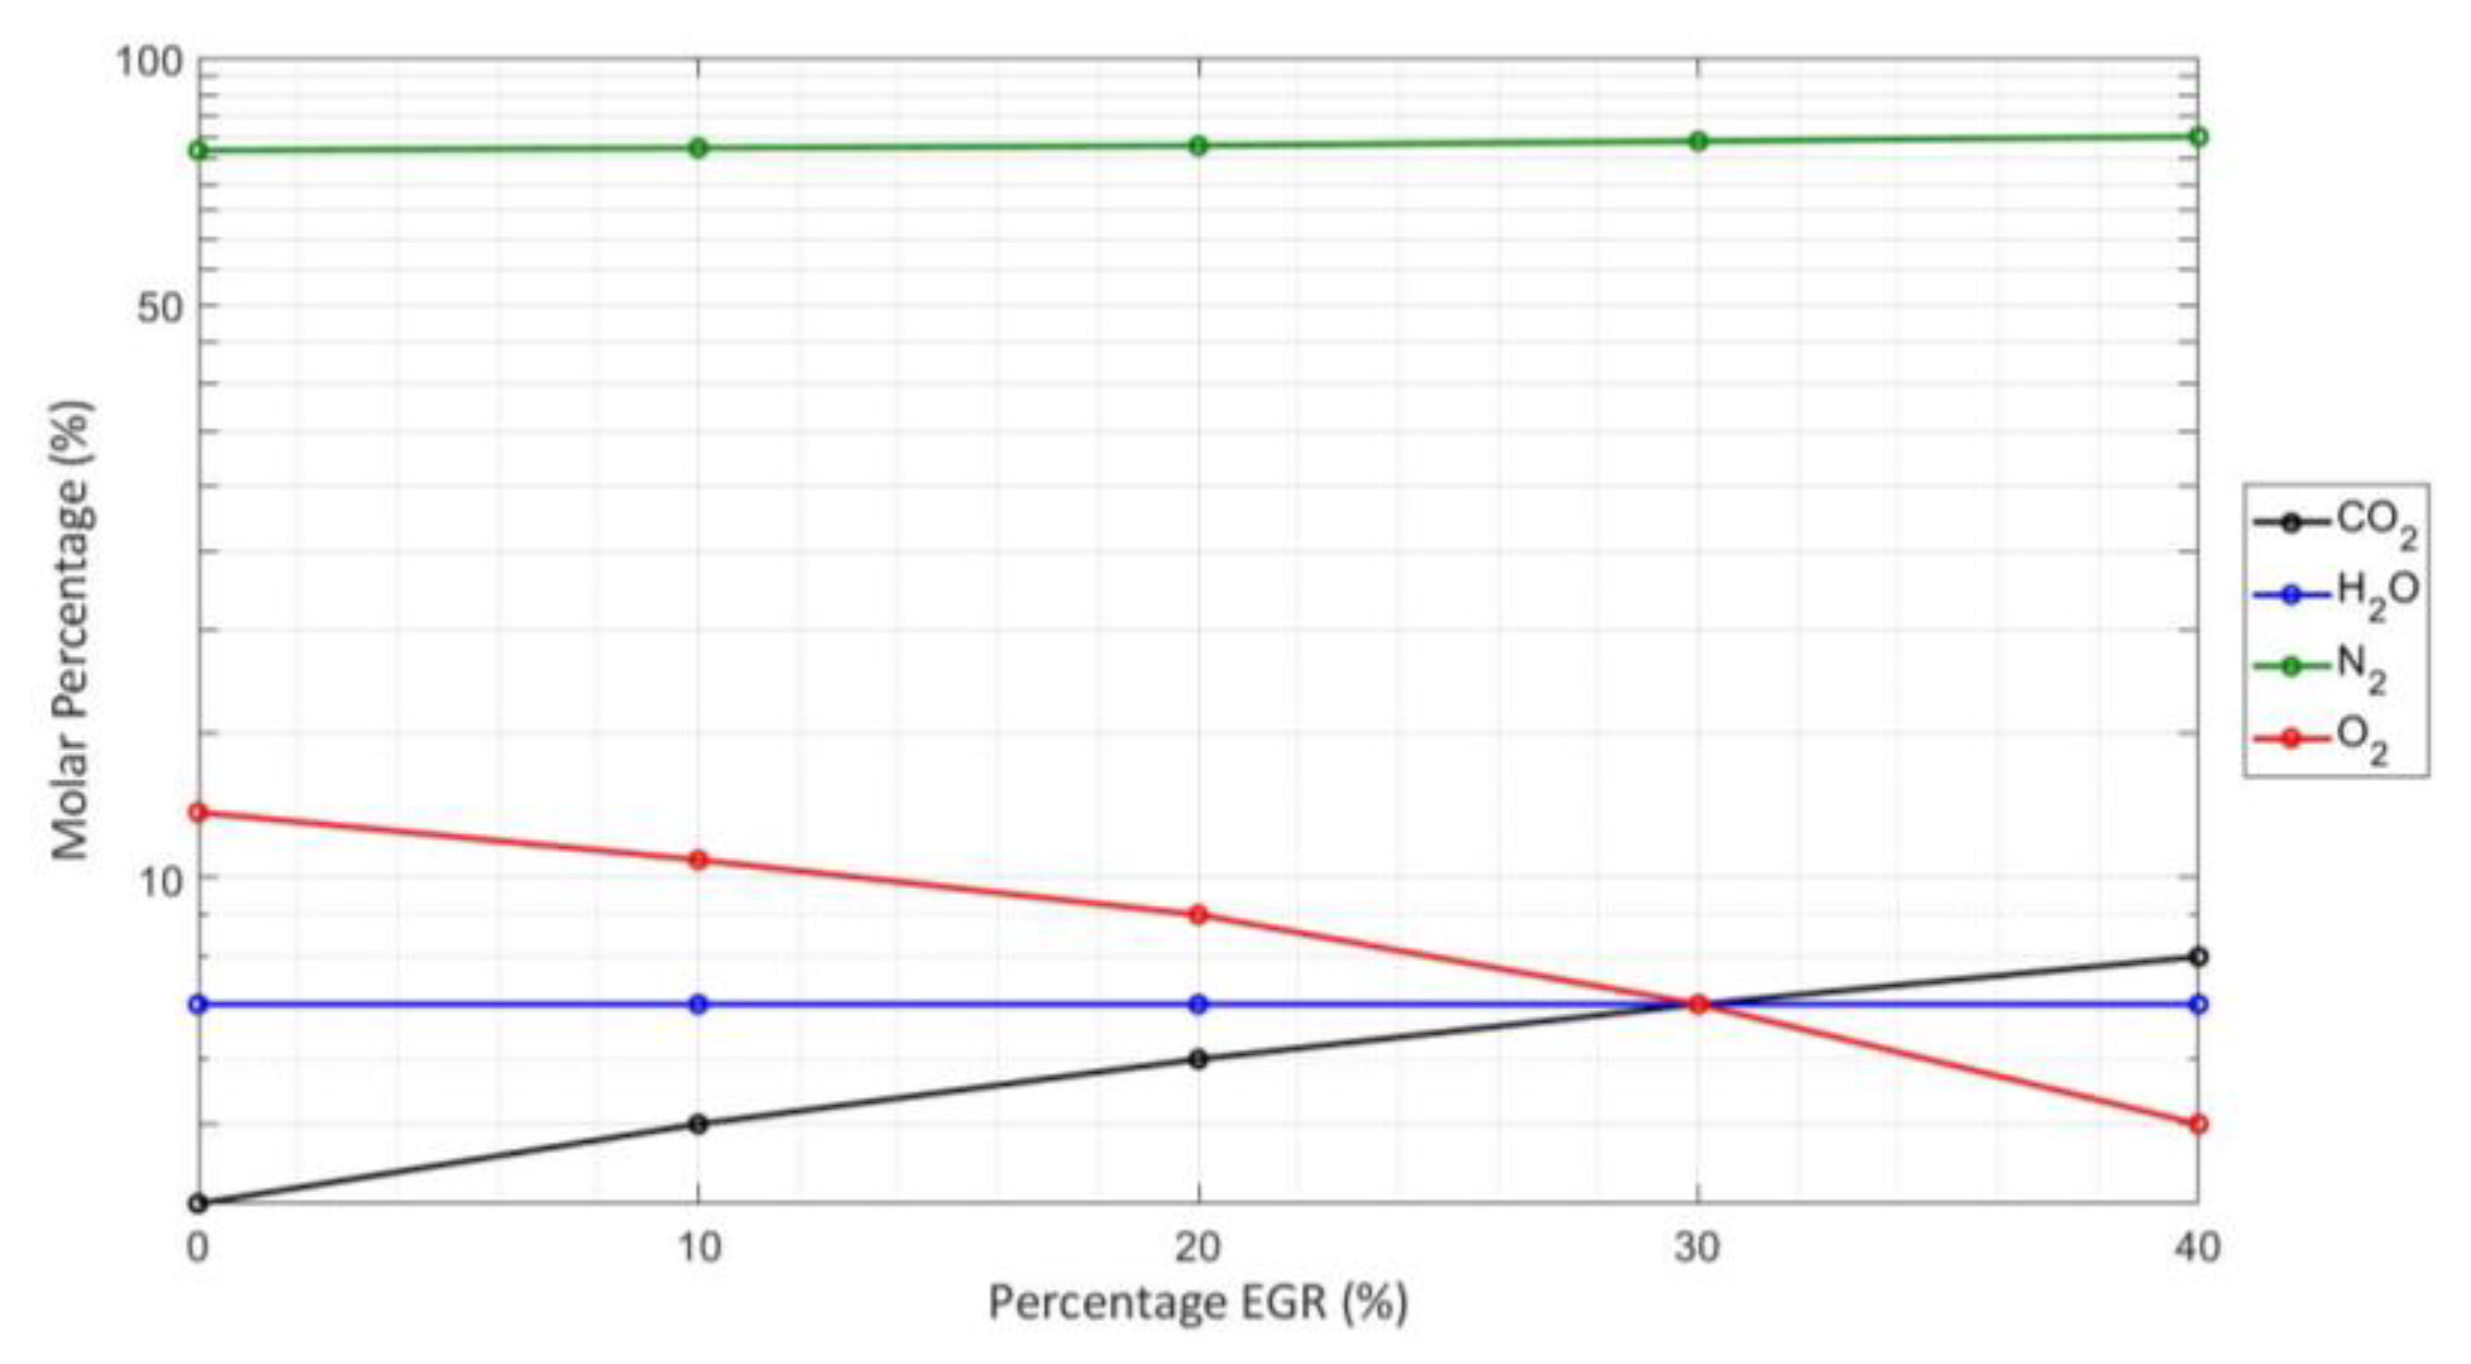
The composition of the flue gas stream is modelled so as to represent the various EGR ratios [42] and is illustrated in Figure 3.
The objective function for optimization is the minimization of the parasitic energy demand of the capture unit, given as a function of captured CO2, A; calculated using Equation (16).
where R is the reboiler duty, C is the condenser duty, P is the total pumping duty for the unit including the compression train, and F is the mass flow rate of captured CO2 from the stripper column.
The second step involves designing and conducting the experiment employing Minitab, a complete statistical software package that provides a comprehensive set of methods for data analysis. For four factors at five levels, an appropriate L25 OA was selected and is given Table 3.
The third step looks at the analysis of the results; two statistical tools are used in this work both of which are commonly applied in the Taguchi method: signal-to-noise ratios (SNR) and analysis of variance (ANOVA). The SNR can take three forms that are characteristic of the objective function i.e., smaller the better, nominal is best or larger the better; in this case the smaller the better SNR is used and is defined for each run, n as [20]:
where is the number of runs and is the response value in the experiment. The SNR is a single response which makes a trade-off between setting the mean to a desirable level while minimizing variance; the intention is to maximize the SNR regardless of its characteristic. The SNR values can be used to determine the relative importance of each factor on the objective function and can be plotted to identify the optimum levels for each factor. The mathematical technique of variance analysis (ANOVA) dissects the total variation into accounted sources and delivers a way to interpret the results from the simulations [43]. The ANOVA is conducted using the SNR values to assess the percentage contribution of each factor in minimizing the variation of the capture unit’s energy demand. Both analyses are conducted using Minitab.
3. Results
The duties of each unit taken as outputs from Aspen Plus were manipulated to give specific energy requirements within the capture unit as a function of captured CO2 and are presented in Table 4.
The primary contributor to the energy requirements is the reboiler duty which demonstrated the greatest variation throughout the simulations, with a standard deviation of 0.301 when compared to 0.216 and 0.008 for the condenser and pumping duties, respectively. From the 25 simulations, the minimum total energy requirement for the unit as a whole was 5.14 GJ/tCO2 with a reboiler requirement of 3.97 GJ/tCO2. These requirements were found in run 11 using the following factor configuration: FGT = 60°C; ACP = 1 bar; EGR = 30% and; CONC = 35 wt%.
3.1. Signal-to-Noise Ratio (SNR) Analysis
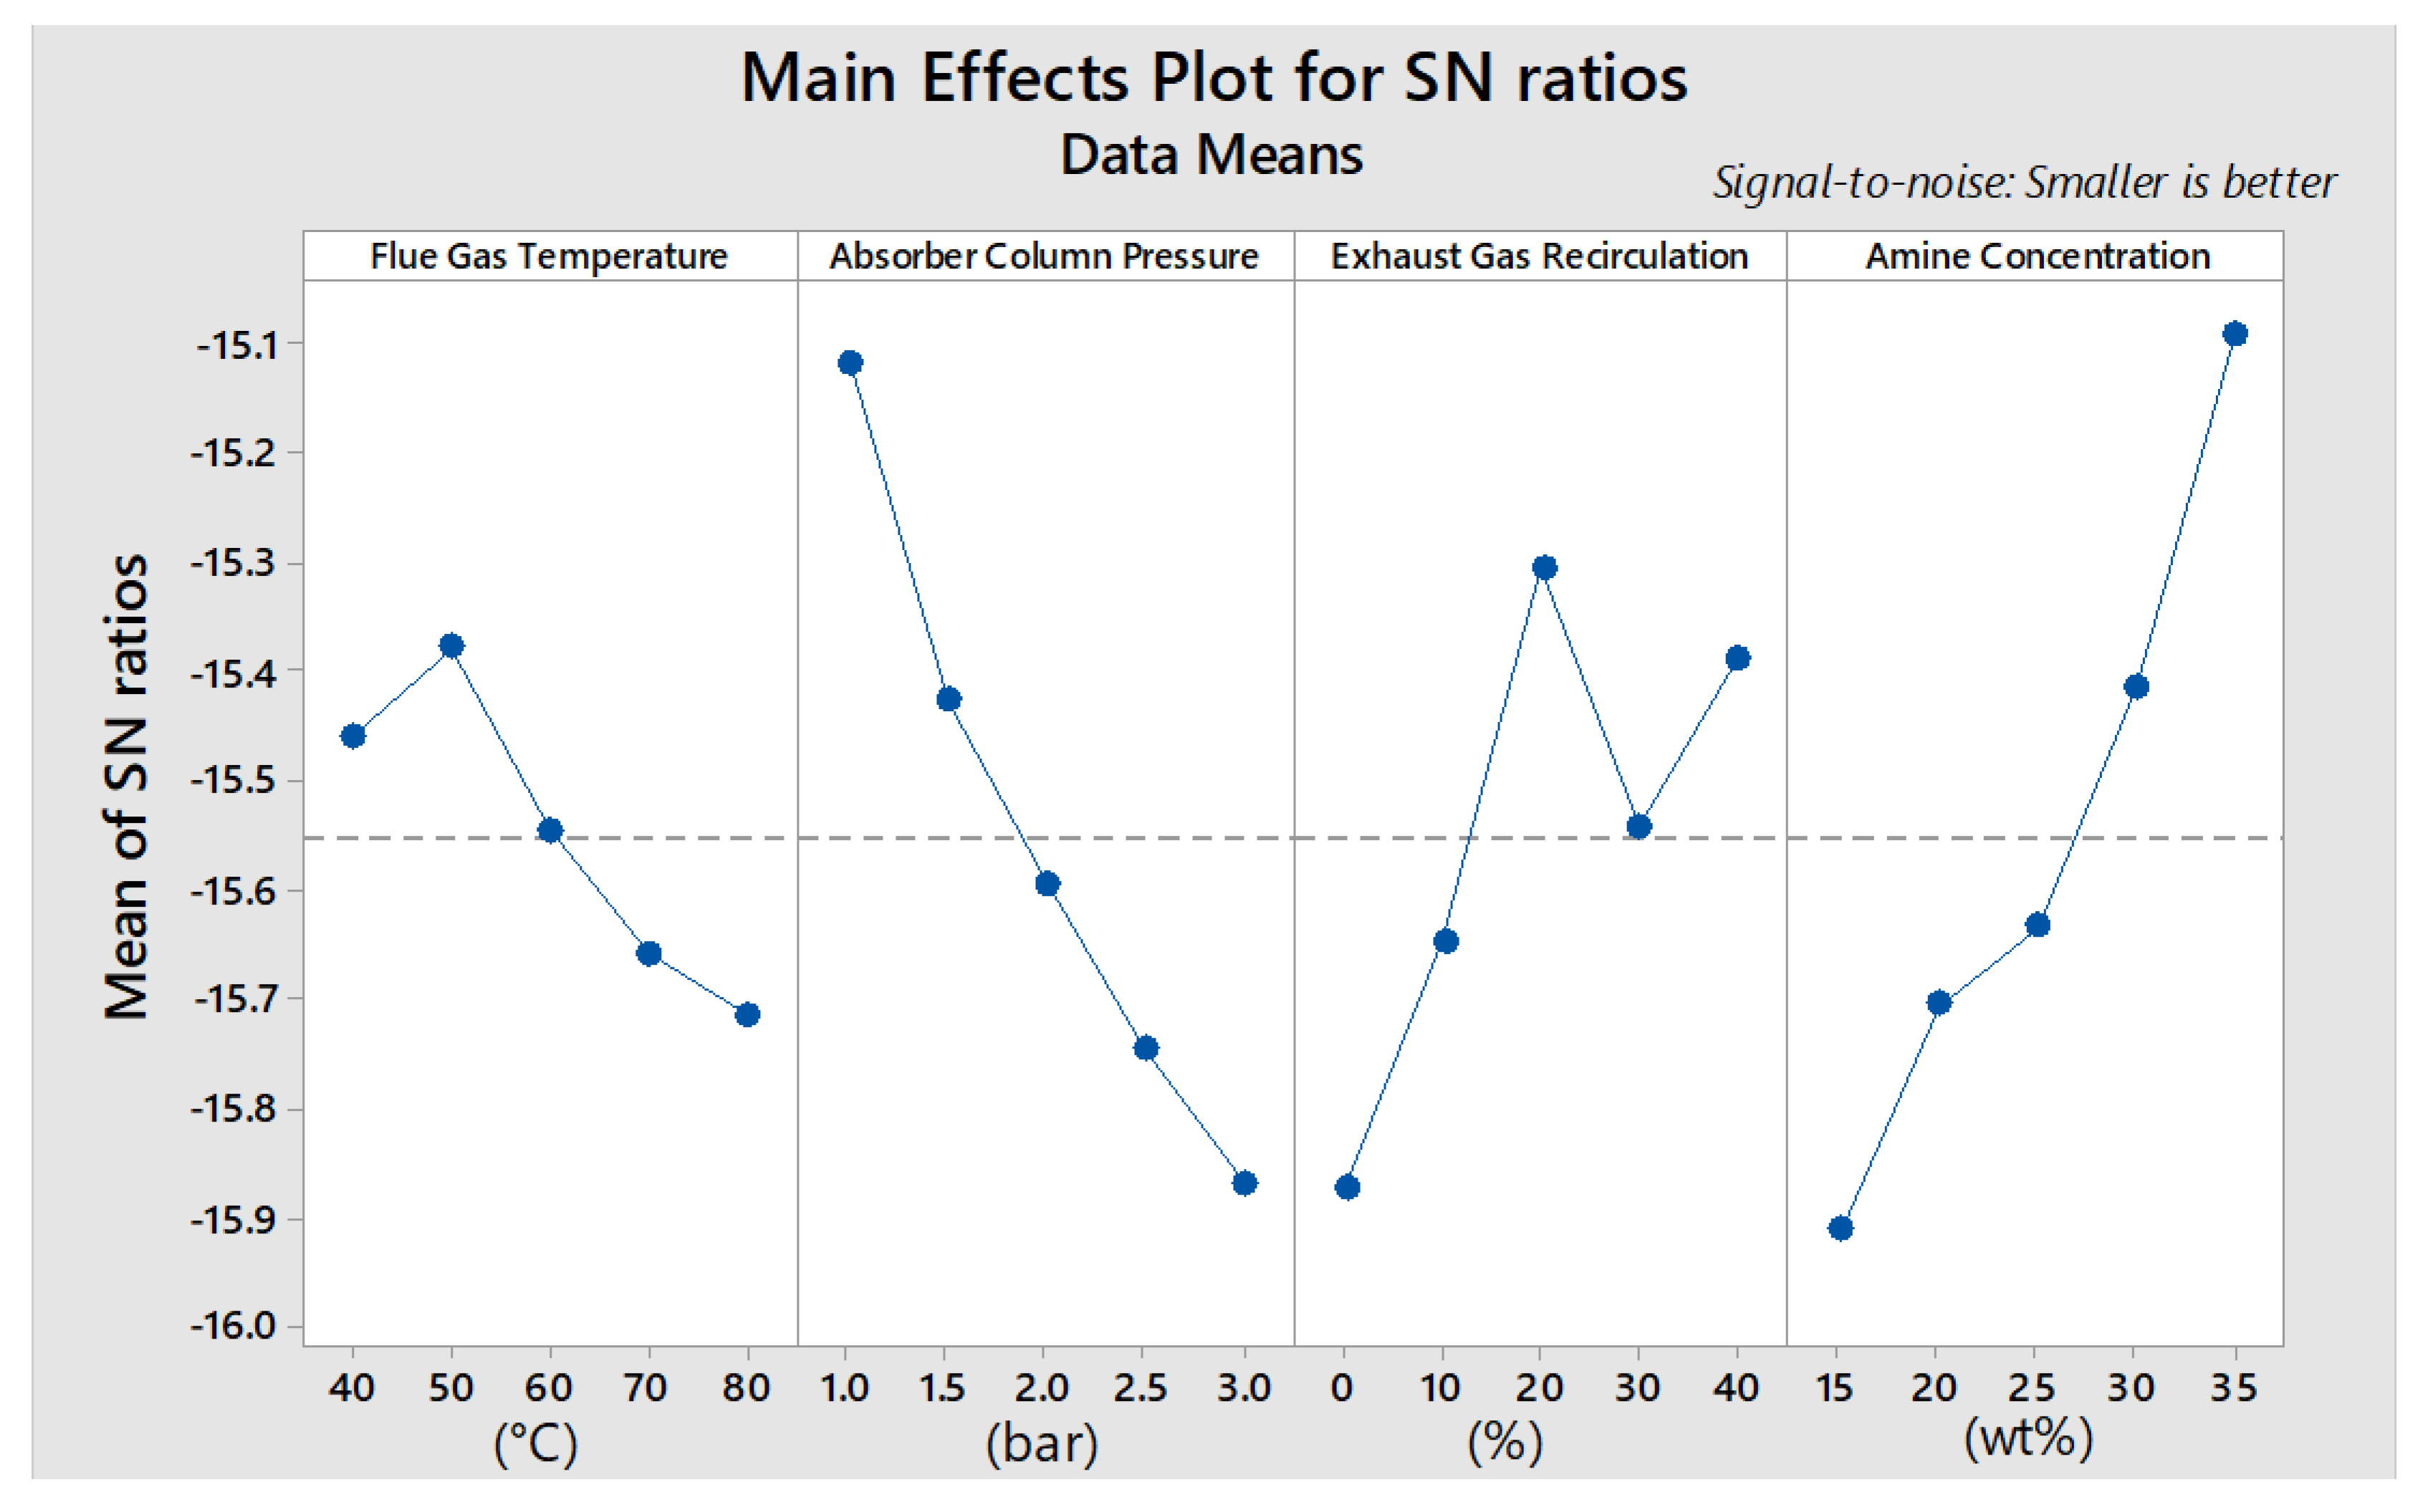
The SNR values can be used to identify the factor levels that minimize the variability in the capture unit’s energy requirements. Minitab was used to calculate the SNR for each configuration of the factors, the average of which is shown in the response Table 5. With the smaller-the-better SNR the target value is 0; as such, the values given in red/bold are the levels that minimized the energy requirement. The optimum values being: FGT = 50 °C; ACP = 1 bar; EGR = 20% and; CONC = 35 wt%.
The delta values represent the variation in the mean SNR values and permit a ranking of the factor’s relative importance on the energy requirements when varied in the specified range. The sequence follows CONC > ACP > EGR > FGT. The importance of each factor can be seen graphically by plotting the SNR values for each factor as shown in Figure 4. The line connecting each SNR value exemplifies whether a main effect exists for that factor; a line that demonstrates a larger difference in vertical position such as in CONC shows that the magnitude of the main effect for that factor is greater. From Figure 4 it is clear that ACP and CONC had the greatest influence with FGT and EGR showing a smaller but still notable influence.
3.2. Confirmation Experiment
After determining the optimum configuration of the factors, a confirmation experiment is required to validate the employed method for experimental design. The optimum factor levels were:
- Flue Gas Temperature = 50 °C
- Absorber Column = 1 bar
- Exhaust Gas Recirculation = 20%
- Amine Concentration = 35 wt%
The energy requirements for the individual units within the capture unit are given in Table 6. A total requirement of 5.05 GJ/tCO2 was seen, 1.8% less than the value seen from simulation 11 and thus validating the results of the Taguchi analysis.
4. Discussion
4.1. Analysis of Variance (ANOVA)
Using a significance level of 5%, Table 7 exhibits the results of ANOVA using the SNR values from Table 5 The p-values can be used to evaluate the statistical significance of the factors influence on the capture unit’s energy requirement; a p-value of less than 0.05 demonstrates a significant association of the factor to the mean of the quality characteristic value [44]. ANOVA also permits the identification of the percentage contribution of each factor. As in Figure 4 the greatest contributors to the variation in the capture unit’s energy requirement are ACP and CONC, 31.07% and 35.24%, respectively. FGT and EGR demonstrated 6.92% and 18.14% contributions, respectively; the p-value for FGT, however, is 0.263, thus indicating that the flue gas temperature inlet to the absorber demonstrated no statistically significant influence on the energy requirements of the capture system. The other three factors did however show a statistically significant relationship, highlighting their importance in minimizing the parasitic energy demand of a capture unit.
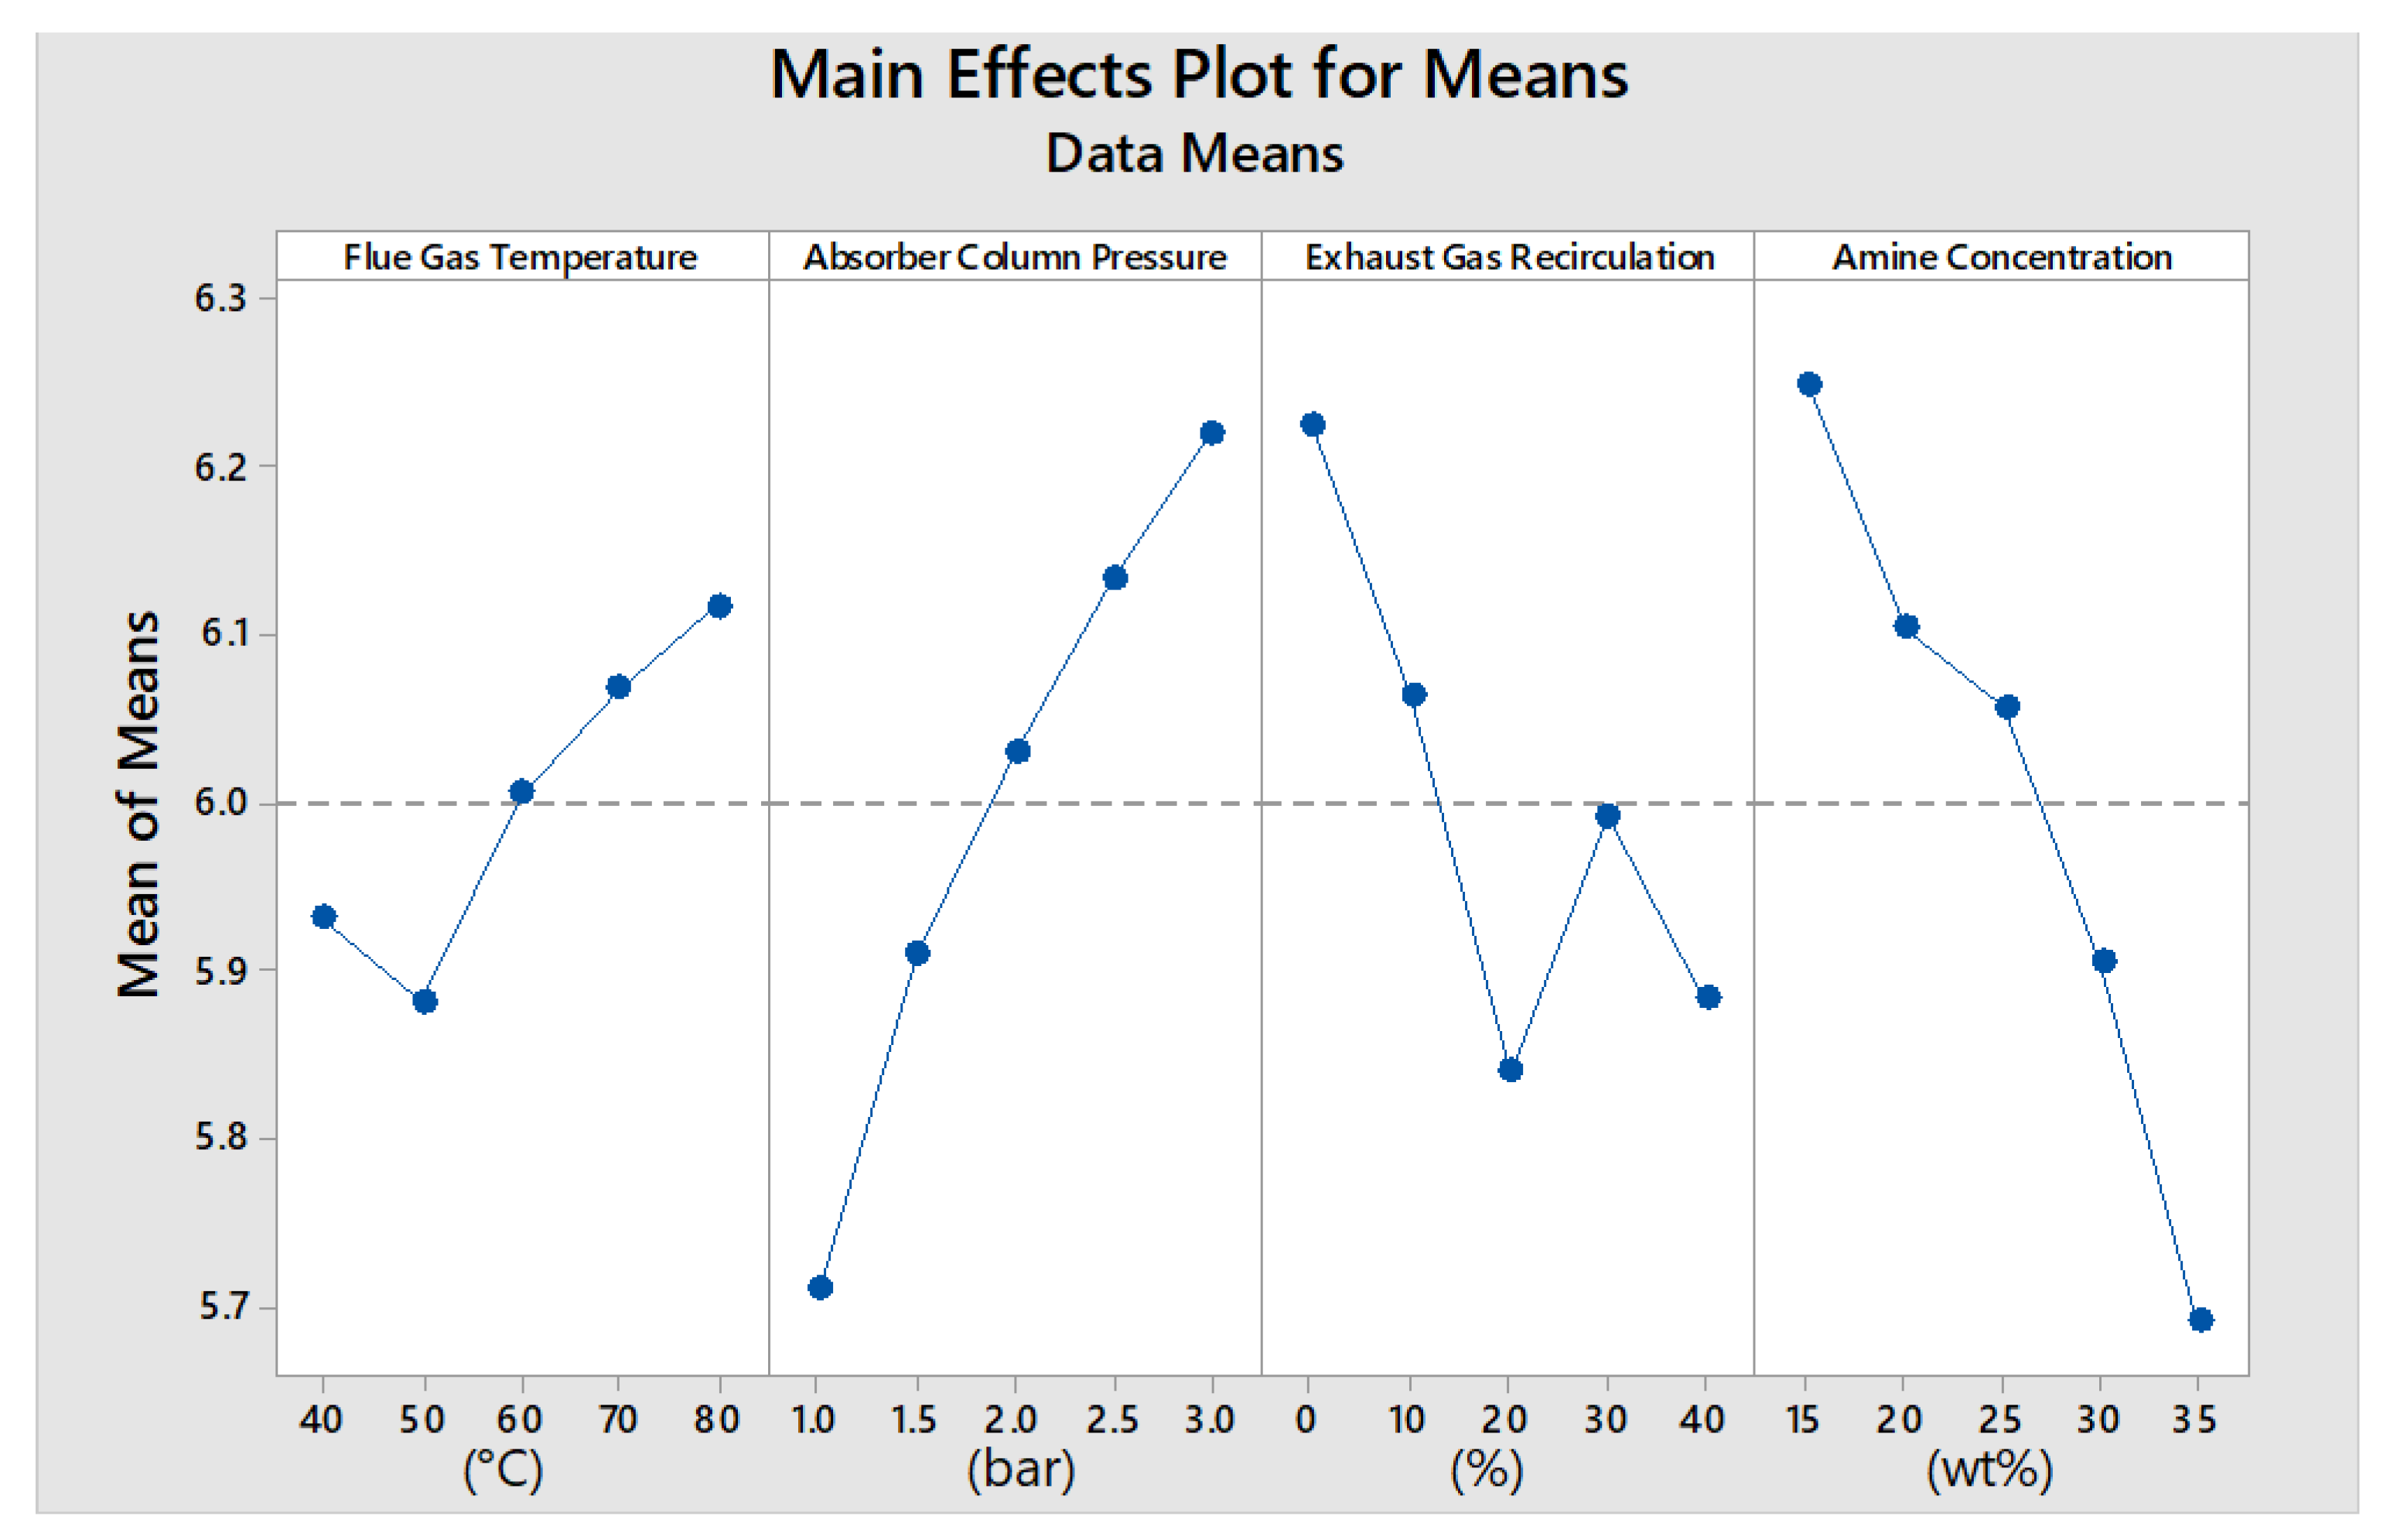
4.2. Main Effect of the Factors on the Mean Energy Requirement in the Capture Unit
The influence of each factor on the energy requirement can be seen in Figure 5. An increase in ACP was seen to increase the energy requirements, potentially due to the increased energy demand to raise the pressure of the inlet streams to that of the absorber. Contradictory to this, however, the solubility of CO2 increases in aqueous solutions at higher pressures [45] which should act to reduce the reboiler duty as found in [17] owing to an increase in CO2 partial pressure. The equilibrium-based strategy used here may not have been able to quantify the effects of a greatly increased ACP. It is worth noting that in the aforementioned study, the variation in pressure was between 0.9 and 1.2 bar. When increasing EGR, the general trend is for SRD to decrease, owing to the increase in molar CO2 concentration in the gas phase in the absorber column; the higher the mole fraction the feed has, the easier the MEA reaches the required rich loading for 90% capture [46]. In the literature, the optimal EGR is often around 40%; the discrepancy in this project is likely due to the fact that the mass flow rate of the flue gas was kept constant. If employing EGR in a NG-CCGT, the recycled flue gas would act to reduce the total mass flow processed by the PCC unit and as such, a smaller solvent flow rate and energy requirement would be seen [47].
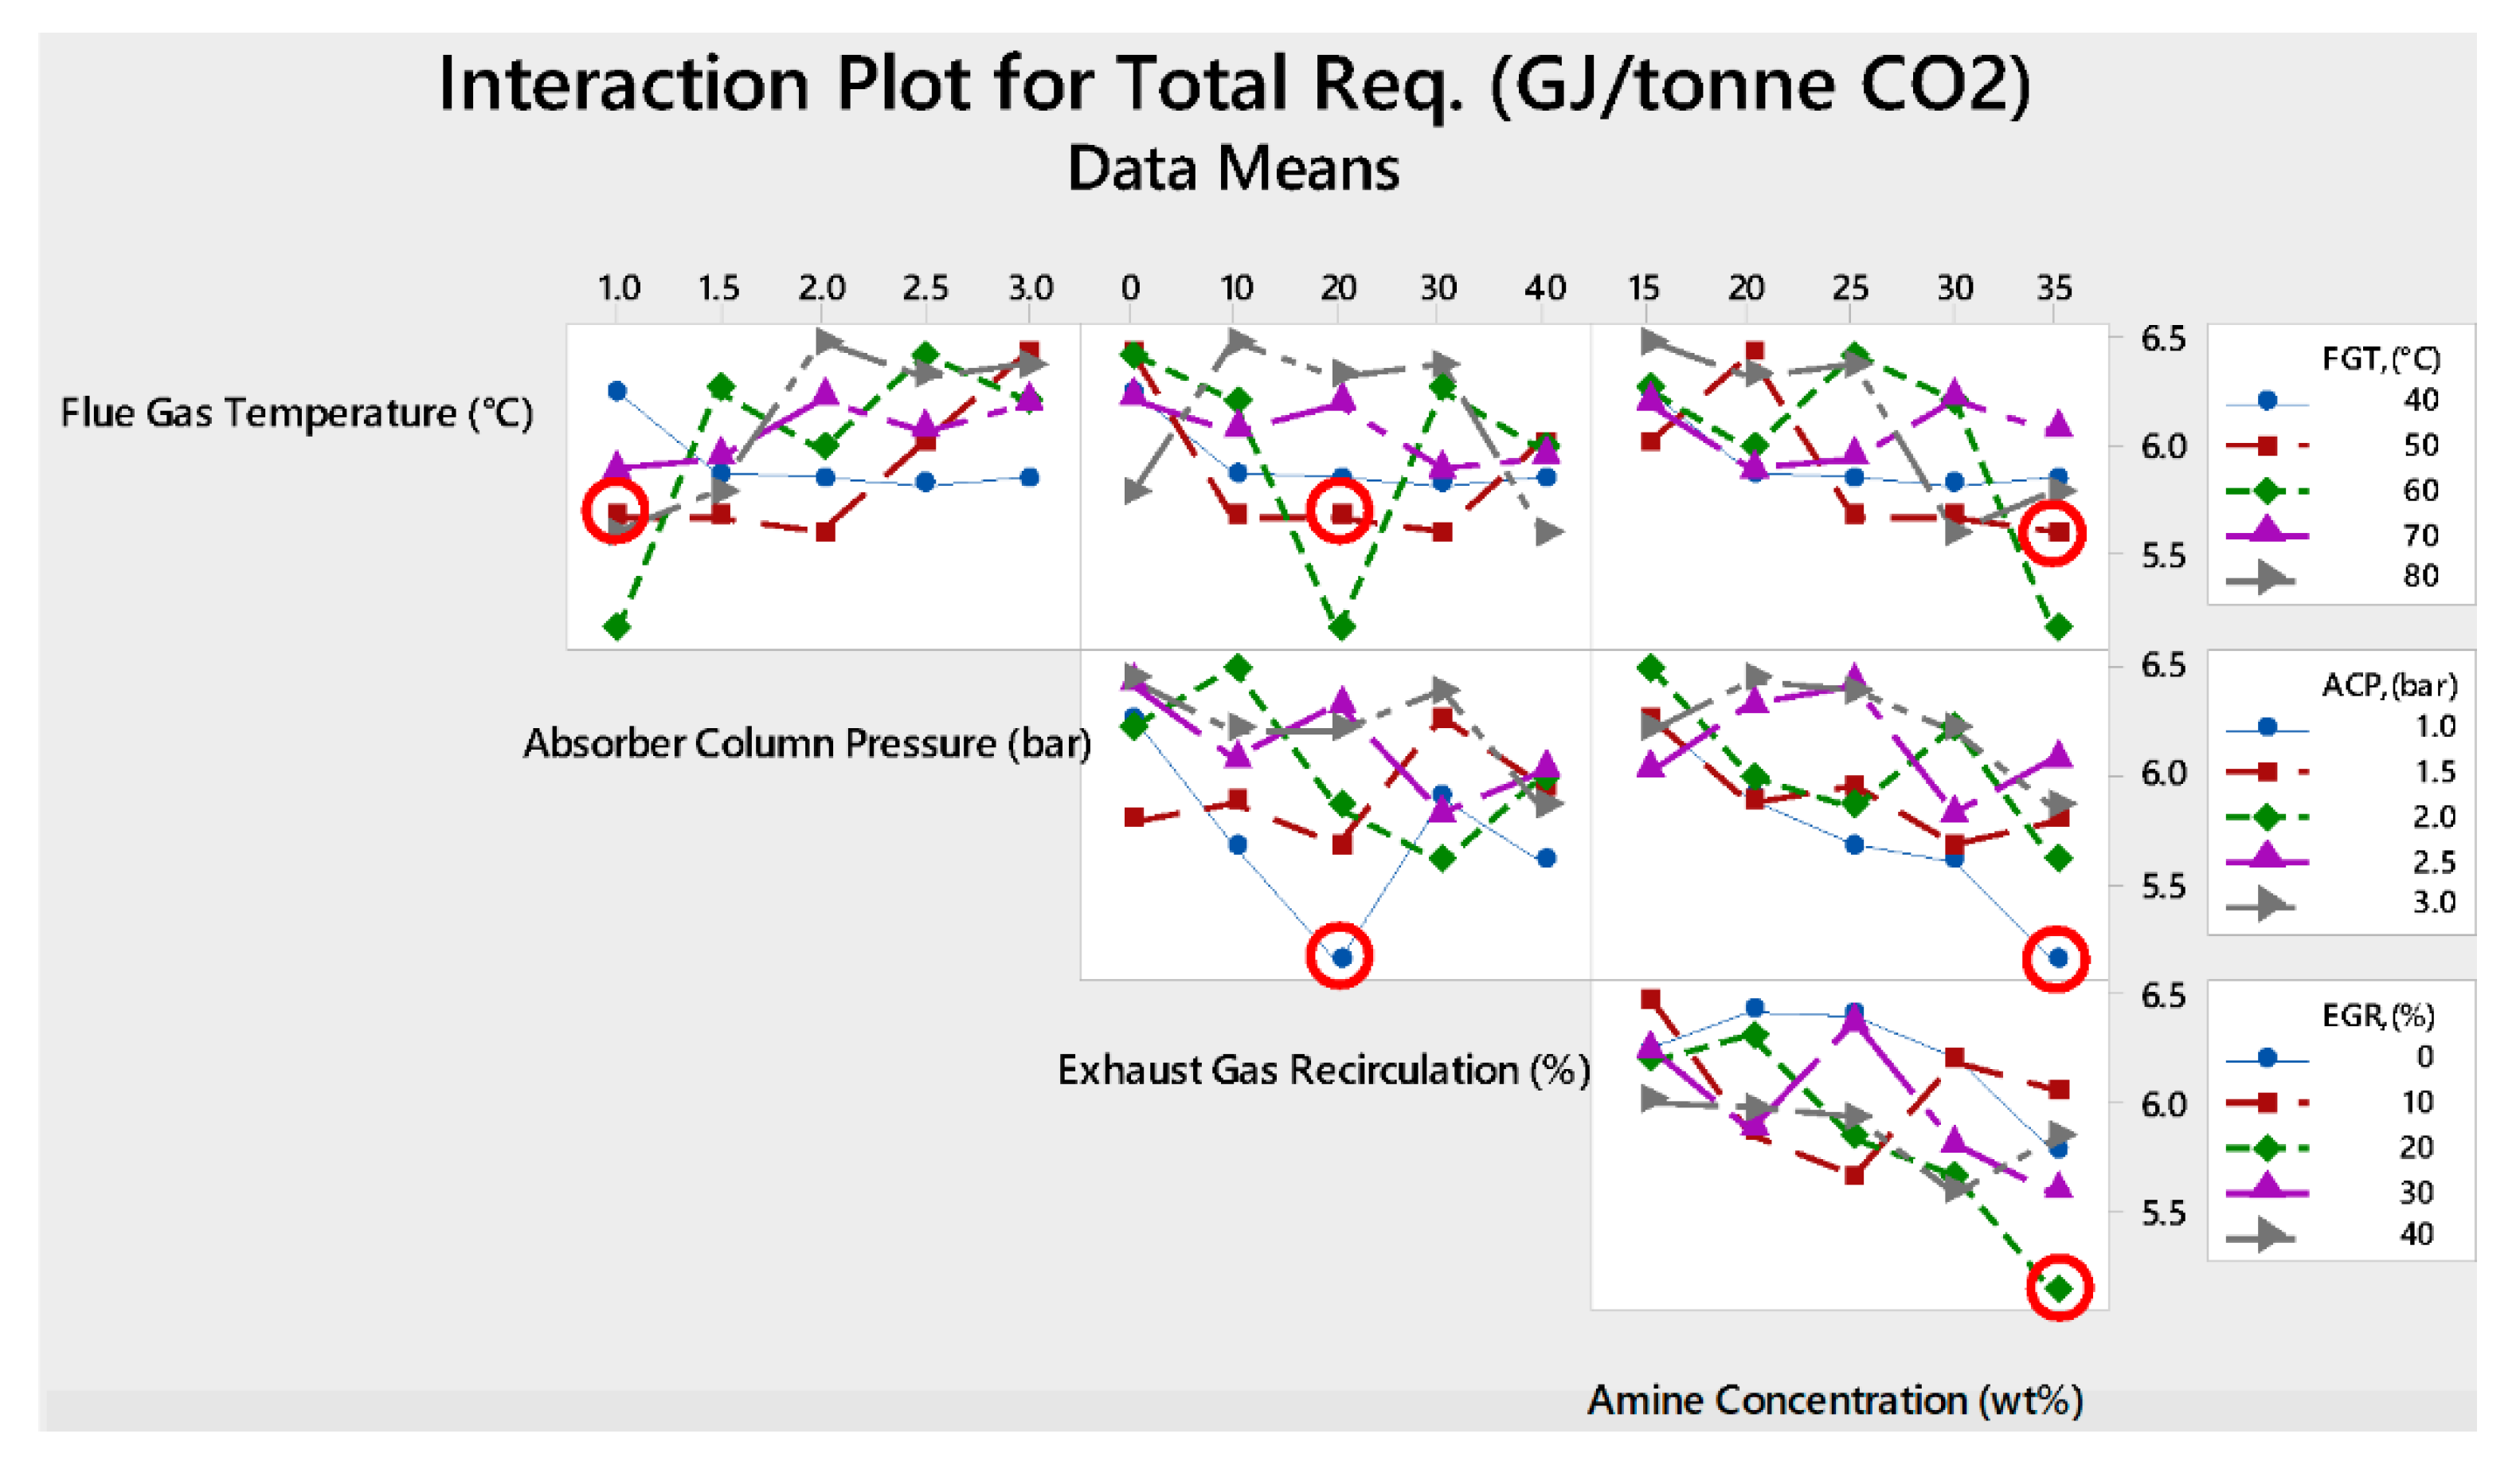
4.3. Interaction Analysis
Figure 4 illustrates the effect of each factor on the response; but, given that four variables were evaluated concurrently, an assessment of the interactions between the variables must be made so that the interpretation of the main effects is accurate. Figure 6 is the interaction plot for the four factors on the mean energy requirement in the capture unit; the optimum process parameters are illustrated by red circles. When the connecting lines are parallel, the interaction is small; the more nonparallel the lines are, the greater the level of interaction. All factors can be seen to show some level of influence on one another. It is worth noting that Figure 6 illustrates a minimum energy requirement at a FGT of 60 °C and not the 50 °C defined by the SNR analysis; but, due to the statistical insignificance of FGT, this can be disregarded and the initial interpretation can be upheld. When considering the other three factors (ACP, EGR, and CONC), the interaction plot corroborates the findings from the SNR analysis in that the minimum energy requirement was found with an ACP = 1 bar, EGR = 20%, and CONC = 35 wt%. The plot also makes evident a significant interaction between all four factors on the total energy requirement, highlighting the importance of conducting an optimization with all factors in concert.
5. Conclusions
The use of the Taguchi method allowed an accurate assessment of the effect of four control variables in the operation of an MEA-based post combustion CO2 capture plant. The analysis of the results from the 25 simulations outlined by the Taguchi DOE demonstrated the importance of considering the capture unit as an entirety; the variation in energy demand when operating suboptimally clarifies the importance of deducing the optimal configuration to minimize the parasitic energy penalty incurred. Using the signal to noise ratios and analysis of variance for the four evaluated factors, the concentration of the amine was shown to be the greatest impetus in minimizing the energy demands; the operating pressure in the absorber and amount of exhaust gas recirculation also exhibit a significant influence on the total energy requirement, whereas the temperature of the flue gas was shown to have an insignificant effect on the specific energy requirements. The accuracy of designing experiments in this way allowed a more efficient assessment of the four factors and permitted the determination of a minimum energy requirement in the capture unit. The confirmation experiment, as outlined by the statistical analysis, further strengthens the rationale of employing a robust design of experiment. The minimum specific energy requirement for the PCC unit found with the defined optimum factor levels was 5.05 GJ/tonneCO2, corresponding to a 3.94 GJ/tonneCO2 requirement in the reboiler.
Author Contributions
Dr Masoudi Soltani was the project lead and the principal investigator on this research project. Mr Ben Petrovic was the active researcher in this work, responsible for the successful implementation of the research project, interpretation and analysis of the results from the start to the end.
Funding
This research received no external funding.
Acknowledgments
The authors would like to acknowledge the Chemical Engineering as well as the Mechanical and Aerospace Engineering Departments at Brunel University London, UK, to support conducting this research.
Conflicts of Interest
The authors declare no conflict of interest.
Nomenclature
| Acronyms | |||
| Acp | Absorber column pressure, Bar | GHG | Greenhouse gas |
| ANOVA | Analysis of variance | L/G | Liquid/gas |
| CCS | Carbon capture and storage | MEA | Monoethanolamine |
| CONC | Amine concentration, wt% | NGCC | Natural gas combined-cycle |
| DOC | Degree of capture | OA | Orthogonal array |
| DOE | Design of experiment | PCC | Post combustion capture |
| EGR | Exhaust gas recirculation, % | SNR | Signal-to-noise ratio |
| FGT | Flue gas temperature, °C | SRD | Specific reboiler duty |
| Symbols | |||
| Liquid phase activity coefficient of species | Vapor phase mole fractions of species i,s | ||
| Henry’s constant of in the amine solution at saturation pressure | Activity of species | ||
| Saturation pressure of component | stoichiometric constant of species | ||
| Partial molar volume of solute at infinite dilution | Fugacity coefficient of species i,s | ||
| Molar volume of solvent | Fugacity coefficient of under saturation condition | ||
| Molar excess Gibbs free energy | P | Pressure, Bar | |
| Mole number of species | R | Gas constant | |
| Liquid phase mole fraction of species | T | Temperature, °C | |
| Equilibrium constant | |||
References
- Intergovernmental Panel on Climate Change, (IPCC). Climate Change 2014: Synthesis Report. Contribution of Working Groups I, II and III to the Fifth Assessment Report of the Intergovernmental Panel on Climate Change; IPCC: Geneva, Switzerland, 2014. [Google Scholar]
- The UK Government. Climate Change Act 2008; The UK Government: London, UK, 2008.
- Boot-Handford, M.E.; Abanades, J.C.; Anthony, E.J.; Blunt, M.J.; Brandani, S.; Mac Dowell, N.; Fernández, J.R.; Ferrari, M.-C.; Gross, R.; Hallett, J.P.; et al. Carbon capture and storage update. Energy Environ. Sci. 2014, 7, 130–189. [Google Scholar] [CrossRef]
- Department for Business Energy & Industrial Strategy. Energy Trends September 2018; Department for Business Energy & Industrial Strategy: London, UK, 2018. [Google Scholar]
- National Energy Technology Laboratory (NETL). Bituminous Coal (PC) and Natural Gas to Electricity. Cost and Performance Baseline for Fossil Energy Plants 2015; National Energy Technology Laboratory (NETL): Pittsburgh, PA, USA, 2015. [Google Scholar]
- Popa, A.; Edwards, R.; Aandi, I. Carbon capture considerations for combined cycle gas turbine. Energy Procedia 2011, 4, 2315–2323. [Google Scholar] [CrossRef] [Green Version]
- Wang, M.; Lawal, A.; Stephenson, P.; Sidders, J.; Ramshaw, C. Post-combustion CO2 capture with chemical absorption: A state-of-the-art review. Chem. Eng. Res. Des. 2011, 89, 1609–1624. [Google Scholar] [CrossRef]
- Chen, P.; Luo, Y.X.; Cai, P.W. CO2 Capture Using Monoethanolamine in a Bubble-Column Scrubber. Chem. Eng. Technol. 2015, 38, 274–282. [Google Scholar] [CrossRef]
- Alhajaj, A.; Mac Dowell, N.; Shah, N. A techno-economic analysis of post-combustion CO2 capture and compression applied to a combined cycle gas turbine: Part I. A parametric study of the key technical performance indicators. Int. J. Greenh. Gas Control 2016, 44, 26–41. [Google Scholar] [CrossRef]
- Masoudi Soltani, S.; Fennell, P.S.; Mac Dowell, N. A parametric study of CO2 capture from gas-fired power plants using monoethanolamine (MEA). Int. J. Greenh. Gas Control 2017, 63, 321–328. [Google Scholar] [CrossRef]
- Oh, S.; Kim, J. Operational optimization for part-load performance of amine-based post-combustion CO2 capture processes. Energy 2018, 146, 57–66. [Google Scholar] [CrossRef]
- Rezazadeh, F.; Gale, W.F.; Akram, M.; Hughes, K.J.; Pourkashanian, M. Performance evaluation and optimisation of post combustion CO2 capture processes for natural gas applications at pilot scale via a verified rate-based model. Int. J. Greenh. Gas Control 2016, 53, 243–253. [Google Scholar] [CrossRef]
- Lindqvist, K.; Jordal, K.; Haugen, G.; Hoff, K.A.; Anantharaman, R. Integration aspects of reactive absorption for post-combustion CO2 capture from NGCC (natural gas combined cycle) power plants. Energy 2014, 78, 758–767. [Google Scholar] [CrossRef]
- Luo, X.; Wang, M. Optimal operation of MEA-based post-combustion carbon capture for natural gas combined cycle power plants under different market conditions. Int. J. Greenh. Gas Control 2016, 48, 312–320. [Google Scholar] [CrossRef]
- Sanchez Fernandez, E.; Goetheer, E.L.V.; Manzolini, G.; Macchi, E.; Rezvani, S.; Vlugt, T.J.H. Thermodynamic assessment of amine based CO2 capture technologies in power plants based on European Benchmarking Task Force methodology. Fuel 2014, 129, 318–329. [Google Scholar] [CrossRef]
- Kothandaraman, A.; Nord, L.; Bolland, O.; Herzog, H.J.; McRae, G.J. Comparison of solvents for post-combustion capture of CO2 by chemical absorption. Energy Procedia 2009, 1, 1373–1380. [Google Scholar] [CrossRef]
- Arachchige, U.S.P.; Melaaen, M.C. Aspen Plus Simulation of CO2 Removal from Coal and Gas Fired Power Plants. Energy Procedia 2012, 23, 391–399. [Google Scholar] [CrossRef]
- Ali, U.; Font-Palma, C.; Akram, M.; Agbonghae, E.O.; Ingham, D.B.; Pourkashanian, M. Comparative potential of natural gas, coal and biomass fired power plant with post-combustion CO2 capture and compression. Int. J. Greenh. Gas Control 2017, 63, 184–193. [Google Scholar] [CrossRef]
- Aspen HYSYS simulation of CO2 removal by amine absorption from a gas based power plant. In Proceedings of the 48th Scandinavian Conference on Simulation and Modeling (SIMS 2007), Göteborg, Sweden, 30–31 October 2007; Linköping University Electronic Press: Linköping, Sweden, 2007.
- Afkhamipour, M.; Mofarahi, M. Modeling and optimization of CO2 capture using 4-diethylamino-2-butanol (DEAB) solution. Int. J. Greenh. Gas Control 2016, 49, 24–33. [Google Scholar] [CrossRef]
- Liu, Y.; Zhang, L.; Watanasiri, S. Representing vapor-liquid equilibrium for an aqueous MEA-CO2 system using the electrolyte nonrandom-two-liquid model. Ind. Eng. Chem. Res. 1999, 38, 2080–2090. [Google Scholar] [CrossRef]
- Mores, P.; Scenna, N.; Mussati, S. CO2 capture using monoethanolamine (MEA) aqueous solution: Modeling and optimization of the solvent regeneration and CO2 desorption process. Energy 2012, 45, 1042–1058. [Google Scholar] [CrossRef]
- Sharifzadeh, M.; Shah, N. Carbon capture from natural gas combined cycle power plants: Solvent performance comparison at an industrial scale. AIChE J. 2016, 62, 166–179. [Google Scholar] [CrossRef]
- Osagie, E.; Biliyok, C.; Di Lorenzo, G.; Hanak, D.P.; Manovic, V. Techno-economic evaluation of the 2-amino-2-methyl-1-propanol (AMP) process for CO2 capture from natural gas combined cycle power plant. Int. J. Greenh. Gas Control 2018, 70, 45–56. [Google Scholar] [CrossRef]
- Rezazadeh, F.; Gale, W.F.; Rochelle, G.T.; Sachde, D. Effectiveness of absorber intercooling for CO2 absorption from natural gas fired flue gases using monoethanolamine solvent. Int. J. Greenh. Gas Control 2017, 58, 246–255. [Google Scholar] [CrossRef]
- Mores, P.L.; Manassaldi, J.I.; Scenna, N.J.; Caballero, J.A.; Mussati, M.C.; Mussati, S.F. Optimization of the design, operating conditions, and coupling configuration of combined cycle power plants and CO2 capture processes by minimizing the mitigation cost. Chem. Eng. J. 2018, 331, 870–894. [Google Scholar] [CrossRef]
- Dutta, R.; Nord, L.O.; Bolland, O. Selection and design of post-combustion CO2 capture process for 600 MW natural gas fueled thermal power plant based on operability. Energy 2017, 121, 643–656. [Google Scholar] [CrossRef]
- Mores, P.; Scenna, N.; Mussati, S. Post-combustion CO2 capture process: Equilibrium stage mathematical model of the chemical absorption of CO2 into monoethanolamine (MEA) aqueous solution. Chem. Eng. Res. Des. 2011, 89, 1587–1599. [Google Scholar] [CrossRef]
- Dutta, R.; Nord, L.O.; Bolland, O. Prospects of using equilibrium-based column models in dynamic process simulation of post-combustion CO2 capture for coal-fired power plant. Fuel 2017, 202, 85–97. [Google Scholar] [CrossRef]
- He, Z.; Ricardez-Sandoval, L.A. Dynamic modelling of a commercial-scale CO2 capture plant integrated with a natural gas combined cycle (NGCC) power plant. Int. J. Greenh. Gas Control 2016, 55, 23–35. [Google Scholar] [CrossRef]
- Birkelund, E.S. CO2 Absorption and Desorption Simulation with Aspen HYSYS. Master’s Thesis, Universitetet i Tromsø, Tromsø, Norway, 2013. [Google Scholar]
- Chen, C.; Evans, L.B. A local composition model for the excess Gibbs energy of aqueous electrolyte systems. AIChE J. 1986, 32, 444–454. [Google Scholar] [CrossRef]
- Soave, G. Equilibrium constants from a modified Redlich-Kwong equation of state. Chem. Eng. Sci. 1972, 27, 1197–1203. [Google Scholar] [CrossRef]
- Freguia, S.; Rochelle, G.T. Modeling of CO2 capture by aqueous monoethanolamine. AIChE J. 2003, 49, 1676–1686. [Google Scholar] [CrossRef]
- Austgen, D.M.; Rochelle, G.T.; Peng, X.; Chen, C.C. Model of vapor-liquid equilibria for aqueous acid gas-alkanolamine systems using the electrolyte-NRTL equation. Ind. Eng. Chem. Res. 1989, 28, 1060–1073. [Google Scholar] [CrossRef]
- Koronaki, I.P.; Prentza, L.; Papaefthimiou, V. Modeling of CO2 capture via chemical absorption processes-An extensive literature review. Renew. Sustain. Energy Rev. 2015, 50, 547–566. [Google Scholar] [CrossRef]
- Dickinson, J.; Percy, A.; Puxty, G.; Verheyen, T.V. Oxidative degradation of amine absorbents in carbon capture systems—A dynamic modelling approach. Int. J. Greenh. Gas Control 2016, 53, 391–400. [Google Scholar] [CrossRef]
- Mondal, B.K.; Bandyopadhyay, S.S.; Samanta, A.N. Vapor–liquid equilibrium measurement and ENRTL modeling of CO2 absorption in aqueous hexamethylenediamine. Fluid Phase Equilib. 2015, 402, 102–112. [Google Scholar] [CrossRef]
- Ross, P.J. Taguchi Techniques for Quality Engineering: Loss Function, Orthogonal Experiments, Parameter and Tolerance Design, 2nd ed.; McGraw-Hill: New York, NY, USA, 1996. [Google Scholar]
- Yusoff, N.; Ramasamy, M.; Yusup, S. Taguchi’s parametric design approach for the selection of optimization variables in a refrigerated gas plant. Chem. Eng. Res. Des. 2011, 89, 665–675. [Google Scholar] [CrossRef]
- Karna, S.K.; Sahai, R. An Overview on Taguchi Method. Int. J. Eng. Math. Sci. 2012, 1, 1–7. [Google Scholar]
- Adams, T.; Mac Dowell, N. Off-design point modelling of a 420 MW CCGT power plant integrated with an amine-based post-combustion CO2 capture and compression process. Appl. Energy 2016, 178, 681–702. [Google Scholar] [CrossRef]
- Roy, R. A Primer on Taguchi Method; Van Noshtrand Reinhold Int Co. Ltd.: New York, NY, USA, 1990. [Google Scholar]
- Liang, D.; Meng, W. The Application of the Taguchi Method in the Optimal Combination of the Parameters Design of the Spindle System. In MATEC Web of Conference; EDP Sciences: Julius, France, 2016; Volume 63. [Google Scholar]
- Wilcox, J. Carbon Capture; Springer Science & Business Media: Berlin, Germany, 2012. [Google Scholar]
- Hu, Y.; Xu, G.; Xu, C.; Yang, Y. Thermodynamic analysis and techno-economic evaluation of an integrated natural gas combined cycle (NGCC) power plant with post-combustion CO2 capture. Appl. Therm. Eng. 2017, 111, 308–316. [Google Scholar] [CrossRef]
- Canepa, R.; Wang, M.; Biliyok, C.; Satta, A. Thermodynamic analysis of combined cycle gas turbine power plant with post-combustion CO2 capture and exhaust gas recirculation. Proc. Inst. Mech. Eng. Part E J. Process Mech. Eng. 2013, 227, 89–105. [Google Scholar] [CrossRef]
Figure 1.
Post combustion CO2 capture process flow sheet.

Figure 2.
Flow diagram of the Taguchi method.
Figure 3.
Molar composition of the flue gas stream at various exhaust gas recirculation (EGR) ratios.
Figure 3.
Molar composition of the flue gas stream at various exhaust gas recirculation (EGR) ratios.
Figure 4.
The main effects plot for the SNR.
Figure 5.
Main effects plot for the mean total energy requirement.
Figure 6.
Interaction plot for all factors on the specific energy requirement in the capture unit.

Table 1.
The operating conditions of the main units in the simulated flowsheet.
| Design Specification | Specified Value |
|---|---|
| CO2 capture (%) | 90 |
| CO2 loading in the inlet lean solvent (molCO2/molMEA) | 0.2 |
| Inlet lean solvent temperature (°C) | 40 |
| Absorber no. of ideal stages | 15 |
| Absorber Murphree efficiency [19] | 0.25 |
| Absorber column pressure drop (bara) | 0.1 |
| Stripper’s operating pressure (bara) | 2 (isobaric) |
| Stripper’s no. of ideal stages | 10 |
| Condenser outlet temperature (°C) | 31 |
| Knock-out drum pressure (bara) | 2 |
| Knock-out drum temperature (°C) | 30 |
| Blower ΔP (bara) | 0.1 |
| Assumption for pressure drop in pipes and equipment (bara) | 0 |
| CO2 compression train no. of stages | 5 |
| CO2 compression train intercooler temperature (°C) | 31 |
| CO2 compression train outlet pressure (bara) | 140 |
Table 2.
Description of factors and levels for the post combustion capture (PCC) plant.
| Level | FGT (°C) | ACP (bar) | EGR (%) | CONC (wt%) |
|---|---|---|---|---|
| 1 | 40 | 1 | 0 | 15 |
| 2 | 50 | 1.5 | 10 | 20 |
| 3 | 60 | 2 | 20 | 25 |
| 4 | 70 | 2.5 | 30 | 30 |
| 5 | 80 | 3 | 40 | 35 |
Table 3.
Orthogonal array illustrating the configuration of the simulations.
| Run | FGT (°C) | ACP (bar) | EGR (%) | CONC (wt%) |
|---|---|---|---|---|
| 1 | 1 | 1 | 1 | 1 |
| 2 | 1 | 2 | 2 | 2 |
| 3 | 1 | 3 | 3 | 3 |
| 4 | 1 | 4 | 4 | 4 |
| 5 | 1 | 5 | 5 | 5 |
| 6 | 2 | 1 | 2 | 3 |
| 7 | 2 | 2 | 3 | 4 |
| 8 | 2 | 3 | 4 | 5 |
| 9 | 2 | 4 | 5 | 1 |
| 10 | 2 | 5 | 1 | 2 |
| 11 | 3 | 1 | 3 | 5 |
| 12 | 3 | 2 | 4 | 1 |
| 13 | 3 | 3 | 5 | 2 |
| 14 | 3 | 4 | 1 | 3 |
| 15 | 3 | 5 | 2 | 4 |
| 16 | 4 | 1 | 4 | 2 |
| 17 | 4 | 2 | 5 | 3 |
| 18 | 4 | 3 | 1 | 4 |
| 19 | 4 | 4 | 2 | 5 |
| 20 | 4 | 5 | 3 | 1 |
| 21 | 5 | 1 | 5 | 4 |
| 22 | 5 | 2 | 1 | 5 |
| 23 | 5 | 3 | 2 | 1 |
| 24 | 5 | 4 | 3 | 2 |
| 25 | 5 | 5 | 4 | 3 |
Table 4.
Energy duty per tonne of captured CO2 for each individual unit of the capture plant.
| Run | Energy Duties (GJ/tCO2) | |||
|---|---|---|---|---|
| Reboiler | Condenser | Pumping | Total | |
| 1 | 5.06 | 0.92 | 0.28 | 6.26 |
| 2 | 4.53 | 1.07 | 0.28 | 5.88 |
| 3 | 4.34 | 1.24 | 0.28 | 5.85 |
| 4 | 4.21 | 1.33 | 0.28 | 5.82 |
| 5 | 4.16 | 1.41 | 0.28 | 5.85 |
| 6 | 4.32 | 1.07 | 0.28 | 5.67 |
| 7 | 4.19 | 1.21 | 0.28 | 5.67 |
| 8 | 4.08 | 1.25 | 0.28 | 5.60 |
| 9 | 4.79 | 0.96 | 0.28 | 6.02 |
| 10 | 4.72 | 1.47 | 0.24 | 6.44 |
| 11 | 3.97 | 0.90 | 0.28 | 5.14 |
| 12 | 5.00 | 0.98 | 0.28 | 6.26 |
| 13 | 4.55 | 1.16 | 0.28 | 5.99 |
| 14 | 4.58 | 1.56 | 0.28 | 6.42 |
| 15 | 4.37 | 1.56 | 0.28 | 6.21 |
| 16 | 4.60 | 1.01 | 0.28 | 5.89 |
| 17 | 4.41 | 1.26 | 0.28 | 5.95 |
| 18 | 4.42 | 1.52 | 0.27 | 6.22 |
| 19 | 4.28 | 1.51 | 0.28 | 6.07 |
| 20 | 4.81 | 1.11 | 0.28 | 6.21 |
| 21 | 4.18 | 1.13 | 0.28 | 5.60 |
| 22 | 4.24 | 1.27 | 0.28 | 5.79 |
| 23 | 5.02 | 1.18 | 0.28 | 6.49 |
| 24 | 4.66 | 1.39 | 0.28 | 6.32 |
| 25 | 4.53 | 1.58 | 0.28 | 6.39 |
Table 5.
Response table of the signal-to-noise ratio (SNR) taken from Minitab.
| Level | FGT | ACP | EGR | CONC |
|---|---|---|---|---|
| 1 | −15.46 | −15.12 | −15.87 | −15.91 |
| 2 | −15.38 | −15.43 | −15.65 | −15.71 |
| 3 | −15.54 | −15.59 | −15.30 | −15.63 |
| 4 | −15.66 | −15.75 | −15.54 | −15.41 |
| 5 | −15.71 | −15.87 | −15.39 | −15.09 |
| Delta | 0.34 | 0.75 | 0.57 | 0.82 |
| Rank | 4 | 2 | 3 | 1 |
Table 6.
Energy requirements within the capture unit during the confirmation experiment.
| Energy Duties (GJ/tCO2) | Percentage Contribution (%) | |||||
|---|---|---|---|---|---|---|
| Reboiler | Condenser | Pumping | Total | Reboiler | Condenser | Pumping |
| 3.93722 | 0.83507 | 0.27812 | 5.05042 | 77.959 | 16.535 | 5.507 |
Table 7.
ANOVA table for the mean SNR.
| Factor | Degree of Freedom (DF) | Sum of Squares (SS) | Percentage Contribution (%) | Mean of Squares (MS) | F-Value | p-Value |
|---|---|---|---|---|---|---|
| FGT | 4 | 0.3845 | 6.92 | 0.09612 | 1.61 | 0.263 |
| ACP | 4 | 1.7254 | 31.07 | 0.43135 | 7.21 | 0.009 |
| EGR | 4 | 1.0076 | 18.15 | 0.25189 | 4.21 | 0.04 |
| CONC | 4 | 1.9569 | 35.24 | 0.48923 | 8.17 | 0.006 |
| Error | 8 | 0.4789 | 8.62 | 0.05986 | ||
| Total | 24 | 5.5532 | 100 |
© 2019 by the authors. Licensee MDPI, Basel, Switzerland. This article is an open access article distributed under the terms and conditions of the Creative Commons Attribution (CC BY) license (http://creativecommons.org/licenses/by/4.0/).
Share and Cite
MDPI and ACS Style
Alexanda Petrovic, B.; Masoudi Soltani, S. Optimization of Post Combustion CO2 Capture from a Combined-Cycle Gas Turbine Power Plant via Taguchi Design of Experiment. Processes 2019, 7, 364. https://doi.org/10.3390/pr7060364
AMA Style
Alexanda Petrovic B, Masoudi Soltani S. Optimization of Post Combustion CO2 Capture from a Combined-Cycle Gas Turbine Power Plant via Taguchi Design of Experiment. Processes. 2019; 7(6):364. https://doi.org/10.3390/pr7060364
Chicago/Turabian StyleAlexanda Petrovic, Ben, and Salman Masoudi Soltani. 2019. "Optimization of Post Combustion CO2 Capture from a Combined-Cycle Gas Turbine Power Plant via Taguchi Design of Experiment" Processes 7, no. 6: 364. https://doi.org/10.3390/pr7060364
Note that from the first issue of 2016, this journal uses article numbers instead of page numbers. See further details here.